Embed Size (px)
Citation preview

AHSANULLAH UNIVERSITY OF SCIENCE
AND TECHNOLOGY (AUST)
Paper Title
“Investigation of axial capacity of RC columns made of steel fiber reinforced concrete (SFRC)”
1
Presented byRomana AkhterDepartment of Civil EngineeringAhsanullah University of Science and Technology (AUST), Dhaka 1208, Bangladesh
Co-Partners:Kazi Shahriar Islam
Rufaka Tabasum

Presentation Outline
I n t r o d u c t i o nO b j e c t i v eE x p e r i m e n t a l P r o g r a m
a n d S t r a t e g yE x p e r i m e n t a l D a t a
A n a l y s i sF i n i t e E l e m e n t M o d e l i n g
a n d A n a l y s i sV a l i d a t i o n o f F E r e s u l t sE v a l u a t i o n o f F a i l u r e
P a t t e r n sC o n c l u s i o n
2

SFRC
Steel
Fiber
Reinforced
Concrete
???? WHAT IS SFRC ????
3

Different shapes of steel fiber
Introduction
4
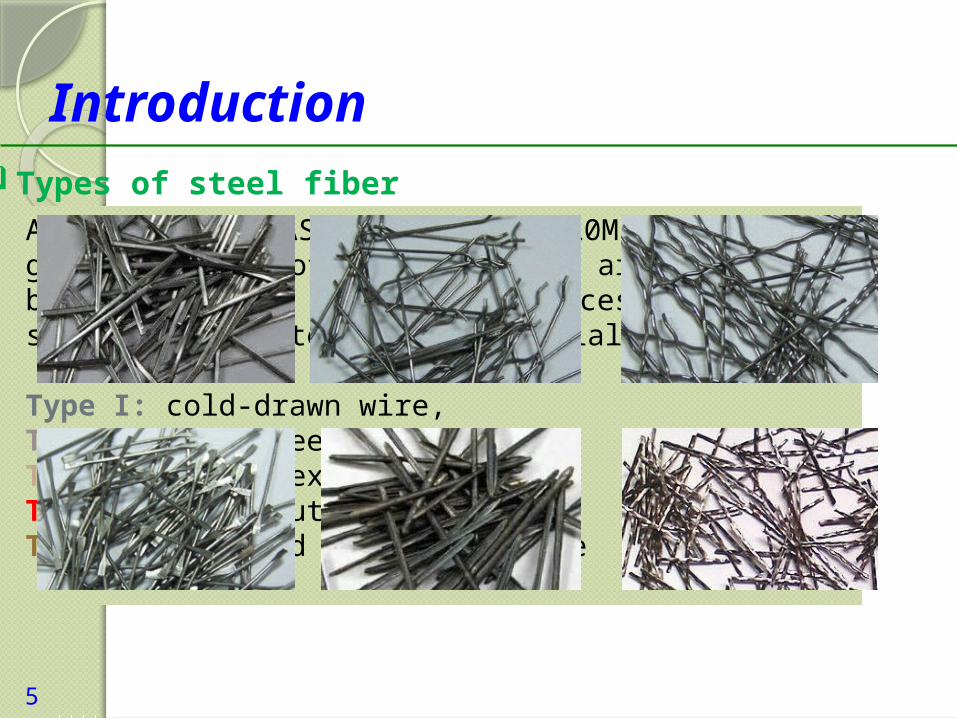
Types of steel fiber
Introduction
According to ASTM A 820/A 820M – 06, five general types of steel fibers are identified based upon the product or process used as a source of the steel fiber material, these are,
Type I: cold-drawn wire, Type II: cut sheet, Type III: melt-extracted, Type IV: mill cut, Type V: modified cold-drawn wire
5

6
SFRC ADVANTAGE
S
Enhancement of
ductility and energy
absorption capacity Improve
internal tensile
strength of the concrete
due to bonding force.
Increase the flexural
strength , direct tensile
strength and fatigue
strength.
Enhance shear and torsional strength
Shock resistance as well as toughness of concrete
Introduction

7
Fibers distribute
randomly and act as crack arrestors.
changing concrete from a brittle material to a
ductile one, in addition to improving
toughness and rigidity
Increases the ductility by
arresting crack and prevents
the propagation of cracks by
bridging fibers.
zone a: Free area of stresszone b: Fiber bridging area zone c: Micro-crack area zone d: Undamaged area
Introduction
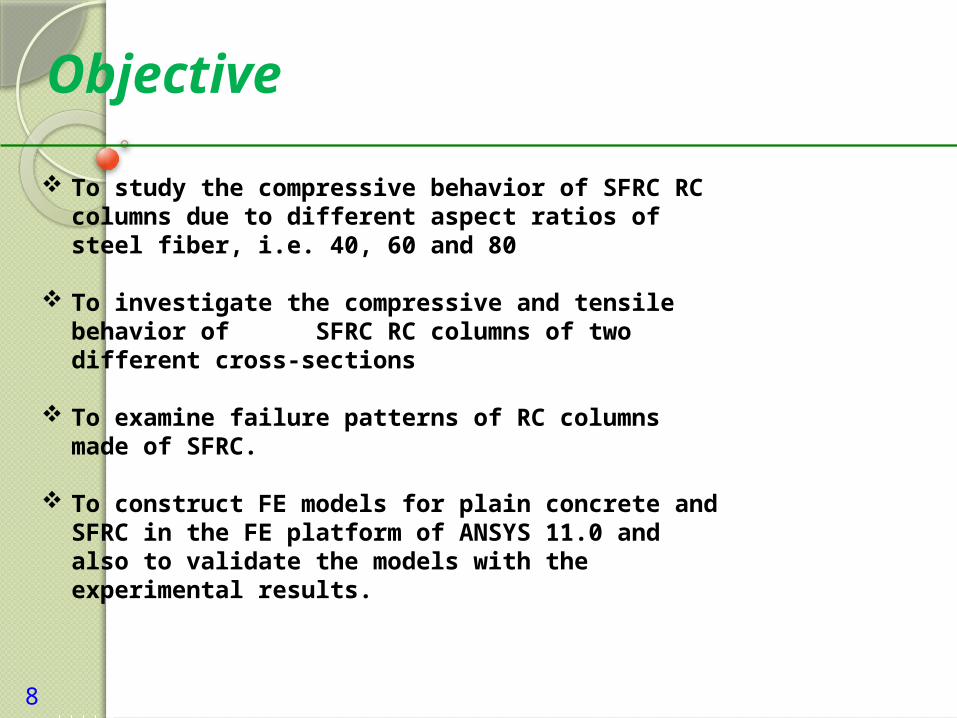
Objective
8
To study the compressive behavior of SFRC RC columns due to different aspect ratios of steel fiber, i.e. 40, 60 and 80
To investigate the compressive and tensile behavior of SFRC RC columns of two different cross-sections
To examine failure patterns of RC columns made of SFRC.
To construct FE models for plain concrete and SFRC in the FE platform of ANSYS 11.0 and also to validate the models with the experimental results.

9
Important properties of steel fibers for fiber selection
Type of fiber Shape of fiber Aspect ratio (ratio of length to diameter, l/d) Quantity of steel fiber (volume ratio in %) Orientation of fiber
Experimental program and strategy

10
Selection of shape
Stress-strain curves for steel fiber reinforced mortars in tension (ACI 544.4R-88)
Experimental program and strategy

11
Materials
Sand Stone Cement Water Steel fiber
Experimental program and strategy
Cement type OPC (Ordinary Portland Cement)
Coarse Aggregate Size 1 in passing and 3/4 in retain (50%)3/4 in passing and 1/2 in retain (50%)
C:FA:CA 1:1.5:3
W/C 0.5
Slump 1in (25mm)
Fiber Volume 1.5%
Fiber Aspect ratio 40, 60 and 80
Fiber type End enlarged
Fiber Tensile strength 160000 psi (1100 MPa)
Fiber cross section Circular
Fiber diameter 1.18 mm
Concrete comp. strength 3700 psi (25.5 MPa)
Type of coarse aggregate Stone

12
Testing and Data Acquisition A digital universal testing machine (UTM) of capacity 1000
kN is used in this experiment. This is a displacement controlled machine. Load and displacement value can be measured from this UTM.
In this experiment displacement rate of 0.5mm per minute is applied.
Lateral displacements/strain are measured by analyzing the image histories obtained from high definition video camera and employing an image analysis technique which is called Digital Image Correlation Technique (DICT).
Experimental program and strategy

13
Experimental program and strategy
4-8mm
6in
6in 6in dia
4-8mm
15in 15in
Experimental strategy and reinforcement layout

14
Images of Experimental Testing and Data Acquisition
Experimental program and strategy

15
Effects on compressive strength
Experimental data analysis
Compressive strength test mechanism

16
Experimental data analysis
Effects on compressive strength
0
1000
2000
3000
4000
5000
0 0.005 0.01 0.015
CSCCONCSC40
Co
mp
ress
ive
str
ess
(p
si)
Compressive strain
0
7
14
21
28
35
Co
mp
ress
ive
str
ess
(M
Pa)
0
1000
2000
3000
4000
5000
0 0.005 0.01 0.015
CSCCONCSC60
Co
mp
ress
ive
str
ess
(psi
)
Compressive strain
0
7
14
21
28
35
Co
mp
ress
ive
str
ess
(MP
a)
0
1000
2000
3000
4000
5000
0 0.005 0.01 0.015
CSCCON
CSC80
Co
mp
ress
ive
str
ess
(p
si)
Compressive strain
0
7
14
21
28
35
Co
mp
ress
ive
str
ess
(M
Pa)
17
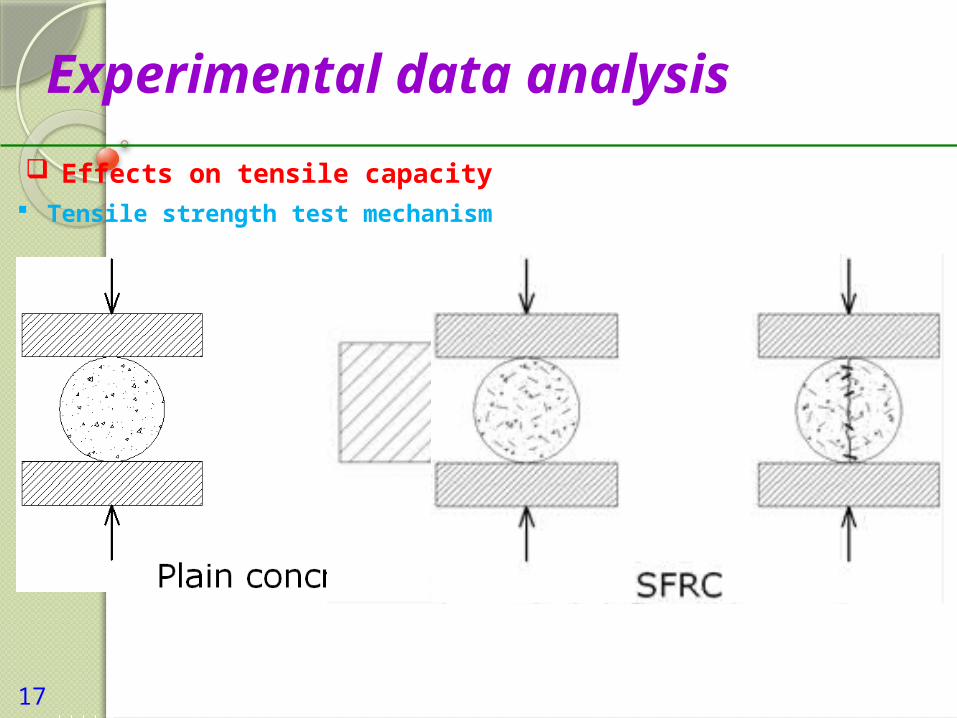
Experimental data analysis
Effects on tensile capacity Tensile strength test mechanism

18
Experimental data analysis
Effects on tensile capacity
0
200
400
600
800
1000
1200
1400
0 0.01 0.02 0.03 0.04 0.05 0.06 0.07 0.08
CSTCONCST40
Ten
sile
str
ess
(ps
i)
Tensile strain
0
1.4
2.8
4.2
5.6
7.0
8.4
9.8
Ten
sile
str
ess
(M
Pa
)
0
200
400
600
800
1000
1200
1400
0 0.01 0.02 0.03 0.04 0.05 0.06 0.07 0.08
CSTCONCST60
Ten
sile
str
ess
(ps
i)
Tensile strain
0
1.4
2.8
4.2
5.6
7.0
8.4
9.8
Ten
sile
str
ess
(M
Pa
)
0
200
400
600
800
1000
1200
1400
0 0.01 0.02 0.03 0.04 0.05 0.06 0.07 0.08
CSTCONCST80
Ten
sile
str
ess
(ps
i)
Tensile strain
0
1.4
2.8
4.2
5.6
7.0
8.4
9.8
Ten
sile
str
ess
(M
Pa
)

19
Experimental data analysis
0
1000
2000
3000
4000
5000
6000
0 0.005 0.01 0.015 0.02 0.025
CSSCCONCSSC40
Co
mp
ress
ive
str
ess
(psi
)
Compressive strain
0
7
14
21
28
35
Co
mp
ress
ive
str
ess
(MP
a)
42
48mm127X127X380mm
0
1000
2000
3000
4000
5000
6000
0 0.005 0.01 0.015 0.02 0.025
CSSCCONCSSC60
Co
mp
ress
ive
str
ess
(psi
)
Compressive strain
0
7
14
21
28
35
Co
mp
ress
ive
str
ess
(MP
a)
42
48mm127X127X380mm
0
1000
2000
3000
4000
5000
6000
0 0.005 0.01 0.015 0.02 0.025
CSSCCONCSSC80
Co
mp
ress
ive
str
ess
(psi
)
Compressive strain
0
7
14
21
28
35
Co
mp
ress
ive
str
ess
(MP
a)
42
48mm127X127X380mm
Effects on axial capacity

20
Experimental data analysis
Effects on axial capacity
0
1000
2000
3000
4000
5000
6000
0 0.001 0.002 0.003 0.004 0.005 0.006
CSCCCONCSCC40
Co
mp
ress
ive
str
ess
(psi
)
Compressive strain
0
7
14
21
28
35
Co
mp
ress
ive
str
ess
(MP
a)
42
48mm
150X380mm
0
1000
2000
3000
4000
5000
6000
0 0.001 0.002 0.003 0.004 0.005 0.006
CSCCCONCSCC60
Co
mp
ress
ive
str
ess
(psi
)
Compressive strain
0
7
14
21
28
35
Co
mp
ress
ive
str
ess
(MP
a)
42
48mm
150X380mm
0
1000
2000
3000
4000
5000
6000
0 0.001 0.002 0.003 0.004 0.005 0.006
CSCCCONCSCC80
Co
mp
ress
ive
str
ess
(psi
)
Compressive strain
0
7
14
21
28
35
Co
mp
ress
ive
str
ess
(MP
a)
42
48mm
150X380mm

Finite Element modeling and analysis
21
FE elementSOLID65 is used to model the concrete and also SFRC. The solid is capable of cracking in tension and crushing in compression. The element is defined by eight nodes having three degrees of freedom at each node; translations in the nodal x, y, and z directions. The element is capable of plastic deformation, cracking in three orthogonal directions and crushing. In concrete applications, the element is also applicable for reinforced composites, such as, fiberglass and in this case fiber reinforced concrete (FRC). The geometry and node locations for this type of element are as follows:
FE element
LINK8 is a spar. The 3-D spar element is a uniaxial tension-compression
element with three degrees of freedom at each node: translations in the
nodal x, y, and z directions. As in a pin-jointed structure, no bending of the
element is considered. Plasticity, creep, swelling, stress stiffening, and large
deflection capabilities are included. The geometry and node locations for this
type of element has shown below:

Finite Element modeling and analysis
22
Properties for FE model
SpecimenUnitCSSCCON CSSC40 CSSC60 CSSC80
Elastic Modulus 2200000 1936000 1936000 1936000 psi
Density 0.083 0.094 0.094 0.094 lb/in 3
Ultimate uniaxial tensile strength 558 884 1215 918 psi
Poisson’s Ratio 0.3 0.3 0.3 0.3 -
Displacement boundary condition (-y direction)
1.0 1.0 1.0 1.0 mm
Shear TransferCo-efficient for Closed crack
0.5 0.5 0.5 0.5 -
Shear TransferCo-efficient for Open crack
0.3 0.3 0.3 0.3 -
FE input data
Properties for FE model
SpecimenUnit
CSCCCON CSCC40 CSCC60 CSCC80
Elastic modulus 2200000 2200000 2200000 2200000 psi
Density 0.083 0.094 0.094 0.094 lb/in 3
Ultimate uniaxial tensile strength 558 884 1215 918 psi
Poisson’s ratio 0.3 0.3 0.3 0.3 -
Displacement boundary condition (-y direction)
1.0 1.0 1.0 1.0 mm
Shear TransferCo-efficient for Closed crack
0.5 0.5 0.5 0.5 -
Shear TransferCo-efficient for Open crack
0.3 0.3 0.3 0.3 -
Properties for FE model Reinforcement Unit
Density 0.283 lb/in 3
Yield stress 72,500 psi
Teng. Modulus 3,000 psi
Poisson’s ratio 0.3
Elastic modulus 30000000 psi

Finite Element modeling and analysis
23
Finite Element modeling requires optimum mesh size for better analysis. A suitable mesh size helps to achieve sufficient accuracy and also saves time.
FE mesh analysis

Finite Element modeling and analysis
24
Geometry of FE models
Volume With Reinforcement Boundary Condition
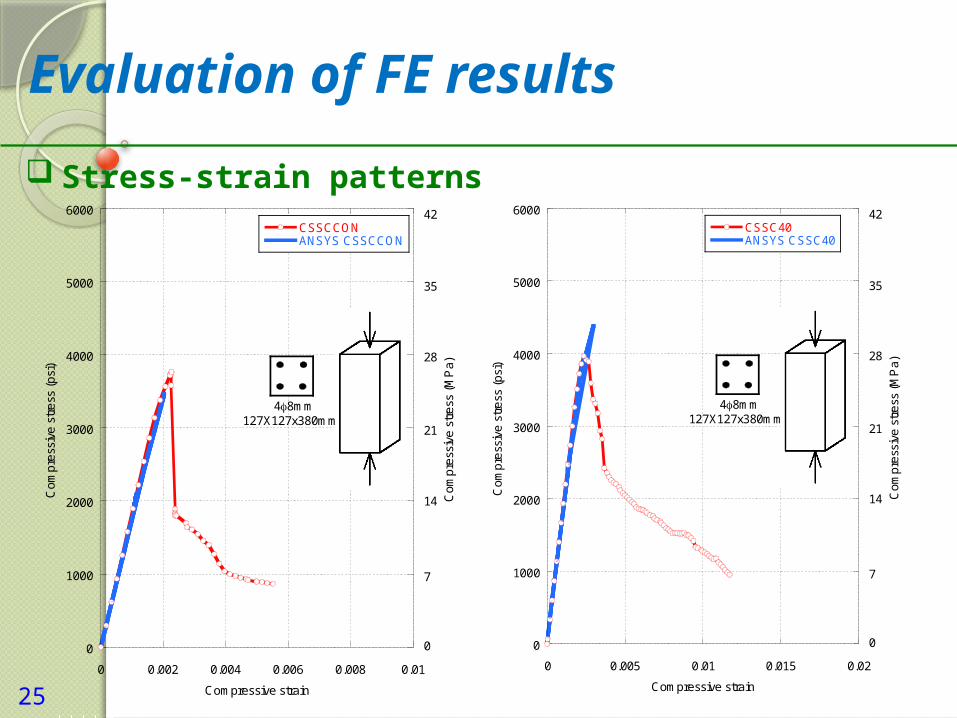
Evaluation of FE results
25
Stress-strain patterns
0
1000
2000
3000
4000
5000
6000
0 0.002 0.004 0.006 0.008 0.01
CSSCCONANSYS CSSCCON
Co
mp
ress
ive
stre
ss (
psi)
Compressive strain
0
7
14
21
28
35
Co
mp
ress
ive
stre
ss (
MP
a)
42
48mm127X127x380mm
0
1000
2000
3000
4000
5000
6000
0 0.005 0.01 0.015 0.02
CSSC40ANSYS CSSC40
Co
mp
ress
ive
stre
ss (
psi)
Compressive strain
0
7
14
21
28
35
Co
mp
ress
ive
stre
ss (
MP
a)
42
48mm127X127x380mm

Evaluation of FE results
26
Stress-strain patterns
0
1000
2000
3000
4000
5000
6000
0 0.005 0.01 0.015 0.02 0.025 0.03
CSSC60ANSYS CSSC60
Co
mp
ress
ive
stre
ss (
psi)
Compressive strain
0
7
14
21
28
35
Co
mp
ress
ive
stre
ss (
MP
a)
42
48mm127X127x380mm
0
1000
2000
3000
4000
5000
6000
0 0.005 0.01 0.015 0.02
CSSC80ANSYS CSSC80
Co
mp
ress
ive
stre
ss (
psi)
Compressive strain
0
7
14
21
28
35
Co
mp
ress
ive
stre
ss (
MP
a)
42
48mm127X127x380mm

Evaluation of FE results
27
Stress-strain patterns
0
1000
2000
3000
4000
5000
6000
0 0.0005 0.001 0.0015 0.002
CSCCCONANSYS CSCCCON
Co
mp
ress
ive
stre
ss (
psi)
Compressive strain
0
7
14
21
28
35
Co
mp
ress
ive
stre
ss (
MP
a)
42
48mm
150X380mm
0
1000
2000
3000
4000
5000
6000
0 0.001 0.002 0.003 0.004 0.005
CSCC40ANSYS CSCC40
Co
mp
ress
ive
stre
ss (
psi)
Compressive strain
0
7
14
21
28
35
Co
mp
ress
ive
stre
ss (
MP
a)
42
48mm
150X380mm

Evaluation of FE results
28
Stress-strain patterns
0
1000
2000
3000
4000
5000
6000
0 0.001 0.002 0.003 0.004 0.005 0.006
CSCC60ANSYS CSCC60
Co
mp
ress
ive
stre
ss (
psi)
Compressive strain
0
7
14
21
28
35
Co
mp
ress
ive
stre
ss (
MP
a)
42
48mm
150X380mm
0
1000
2000
3000
4000
5000
6000
0 0.0005 0.001 0.0015 0.002 0.0025 0.003 0.0035 0.004
CSCC80ANSYS CSCC80
Co
mp
ress
ive
stre
ss (
psi)
Compressive strain
0
7
14
21
28
35
Co
mp
ress
ive
stre
ss (
MP
a)
42
48mm
150X380mm

29
Evaluation of failure patterns& failure location

30
Evaluation of failure patterns& failure location

Evaluation of failure patterns& failure location
31

Conclusion
32
It was observed that steel fibers, up to approximately 1.5% by volume, can partially substitute for the transverse reinforcement in RC columns and hence could result in improved constructability.
It was also observed that fibers transform the cover spalling from a sudden mechanism to a gradual mechanism. The addition of fibers, however, did not prevent bar buckling from occurring.
The FE models showed similar analyses result compared to experimental outcomes which ensures good agreements
The failure patterns are also similar which validated the FE models.
The addition of steel fibers in reinforced concrete columns can lead to improvements, including an increase in peak load-carrying capacity of the column and a significant improvement in the post-peak response of the column. FE analyses have shown conservative results in most of the cases compared to experimental result which indicate sufficient factor of safety and also ensure a reliable FE model.

33
THANK YOU