KAUNAS UNIVERSITY OF TECHNOLOGY
MECHANICAL ENGINEERING AND DESIGN FACULTY
Prasanth Manickkavachagam
Supply Chain Optimization in Manufacturing Enterprise
Final project for Master degree
Supervisor
Assoc. Prof. Dr. Rasa Mankute
Reviewer
Prof. Habil. Dr. Algirdas Bargelis
Project made by
Prasanth Manickkavachagam
(MEM-3/9)
29-05-2015
KAUNAS, 2015

KAUNAS UNIVERSITY OF TECHNOLOGY
Mechanical Engineering and Design (Faculty)
Prasanth Manickkavachagam (Student's name, surname)
Industrial Engineering and Management (code 621H77003) (Title and code of study programme)
SUPPLY CHAIN OPTIMIZATION IN MANUFACTURING ENTERPRISE
DECLARATION OF ACADEMIC HONESTY
29 May 2015
Kaunas
I confirm that a final project by me, Prasanth Manickkavachagam, on the subject
"Supply Chain Optimization in Manufacturing Enterprise" is written completely by myself; all
provided data and research results are correct and obtained honestly. None of the parts of this
thesis have been plagiarized from any printed or Internet sources, all direct and indirect
quotations from other resources are indicated in literature references. No monetary amounts not
provided for by law have been paid to anyone for this thesis.
I understand that in case of a resurfaced fact of dishonesty penalties will be applied to
me according to the procedure effective at Kaunas University of Technology.
(name and surname filled in by hand) (signature)

KAUNAS UNIVERSITY OF TECHNOLOGY
FACULTY OF MECHANICAL ENGINEERING AND DESIGN
Approved:
Head of
Production
engineering
Department
(Signature, date)
(Name, Surname)
MASTER STUDIES FINAL PROJECT TASK ASSIGNMENT
Study programme INDUSTRIAL ENGINEERING AND MANAGEMENT
The final project of Master studies to gain the master qualification degree, is research or
applied type project, for completion and defence of which 30 credits are assigned. The final
project of the student must demonstrate the deepened and enlarged knowledge acquired in the
main studies, also gained skills to formulate and solve an actual problem having limited and
(or) contradictory information, independently conduct scientific or applied analysis and
properly interpret data. By completing and defending the final project Master studies student
must demonstrate the creativity, ability to apply fundamental knowledge, understanding of
social and commercial environment, Legal Acts and financial possibilities, show the
information search skills, ability to carry out the qualified analysis, use numerical methods,
applied software, common information technologies and correct language, ability to formulate
proper conclusions.
1. Title of the Project
Approved by the Dean on 15th of May, 2015, Order No. Nr. ST17-F-11-2
2. Aim of the project
3. Structure of the project
4. Requirements and conditions
5. This task assignment is an integral part of the final project
6. Project submission deadline: 2015 June 1st.
Given to the student Prasanth Manickkavachagam _________________________
Task Assignment received Prasanth Manickkavachagam_____________________ (Name, Surname of the Student) (Signature, date)
Supervisor Assoc. Prof. Dr. Rasa Mankutė _____________________ (Position, Name, Surname) (Signature, date)
Supply Chain Optimization in Manufacturing Enterprise
To analyse supply chain optimization peculiarities in manufacturing enterprise and enhance
the performance of an existing supply chain.
Summary, Introduction, 1. Supply chain management aspects in manufacturing enterprise, 2.
Investigation of supply chain in company x 3. Supply chain optimization of company Y,
Conclusions, References, and Appendixes
To prepare final project according to KTU regulations and requirements.

4
Prasanth Manickkavachagam. Supply Chain Optimization in Manufacturing Enterprise.
Master of Industrial Engineering final project/ supervisor Assoc. Prof. Dr. Rasa Mankutė,
Kaunas University of Technology, Faculty of Mechanical Engineering and Design, Department
of Production Engineering.
Kaunas, 2015. 68 pages.
SUMMARY
The main objective of this work is to analyse supply chain optimization peculiarities in
Manufacturing Enterprise and enhance the performance of an existing supply chain.
Supply Chain Management, it is a concept that all organizations are keen about
improvising in the modern trends. It is almost impossible for a company to survive in the market
without a strong foundation earthed to Supply Chain. Companies have the urge to dwell in
knowledge of how to operate sustainably with a given Supply Chain.
A thorough knowledge about what a Bull-Whip effect is and how it can curbed by a
company, is inevitably a knowledge that companies have to acquire. Companies that have been
well established have an effective method to curb the Bull-Whip effect.
Management in highly organized companies, such as Company X, need to have the
cutting edge of strategy and on the field training for over 20-30 years. Knowledge and financial
domains have to be strong in order to establish the company over long period of time.
In the case of Company Y, the company software integrates a software that is used by
all types of companies. The possibility of integrating this software to the entire Supply Chain
is easy ,cost effective and highly efficient . All companies which have the caliber and interest
to grow can integrate a Software that Company Y integrates to optimize their supply and curb
the Bull-Whip effect.
Key words:
Supply chain management, Bull-Whip effect, inventory management, logistics.

5
Prasanth Manickkavachagam. Tiekimo srautų optimizavimas gamybos įmonėje.
Pramonės inžinerijos magistro baigiamasis projektas / vadovas doc. dr. Rasa Mankutė; Kauno
technologijos universitetas, Mechanikos inžinerijos ir dizaino fakultetas, Gamybos inžinerijos
katedra.
Kaunas, 2015. 68 psl.
SANTRAUKA
Pagrindinis tikslas – išanalizuoti tiekimo grandinės valdymo optimizavimo ypatumus
gamybos įmonėje ir pagerinti tiekimo srautų valdymą įmonėje.
Pirmame skyriuje “Tiekimo grandinės valdymo aspektai gamybos įmonėje”
analizuojamos tiekimo grandinės valdymo problemos, neapibrėžtumo efektas, apžvelgiamos
kompiuterinės sistemos, skirtos tiekimo procesams valdyti.
Antrame skyriuje “Tiekimo srautų tyrimas įmonėje X” pateikiama informacija apie
įmonę, analizuojami tiekimo grandinės valdymo aspektai, kompiuterinės sistemos taikymo
įmonėje problemos.
Trečiame skyriuje “Tiekimo srautų optimizavimas įmonėje Y” aprašoma ir analizuojama
naujai kuriama kompiuterinė sistema, skirta gamybos srautų valdymui, pateikiami jos
privalumai.
Reikšminiai žodžiai
Tiekimo grandinės valdymas, neapibrėžtumo efektas, atsargų valdymas, logistika.

6
CONTENTS
INTRODUCTION ...................................................................................................................... 9
1.SUPPLY CHAIN MANAGEMENT ASPECTS IN MANUFACTURING ENTERPRISE . 10
1.1. Characteristics of Supply Chain Management ............................................................... 10
1.2. Supply Chain Optimization by Computerization of its components ............................. 13
1.3. Problems in the Supply Chain by the Impact of Bull-Whip Effect ............................... 18
1.4. Quantifying the Bull-Whip Effect ................................................................................. 25
1.5. Analysis of Software for Supply Chain Management ................................................... 27
2. INVESTIGATION OF SUPPLY CHAIN IN COMPANY X ............................................. 29
2.1. Supply Chain Optimization strategies used to curb the Bull-Whip Effect ................... 31
2.2. Advantages of the Supply Chain in Company X ........................................................... 39
2.3. Challenges of Supply Chain Computerisation ............................................................... 41
2.4. Market Need for a Software to Contribute to Supply Chain Optimization ................... 41
3. SUPPLY CHAIN OPTIMIZATION IN COMPANY Y ...................................................... 42
3.1. Computerisation of Supply Chain Management of Company Y ................................... 42
3.2. About existing software ................................................................................................. 43
3.3. Necessary upgrade needed on the new software in the Supply Chain ........................... 45
3.4. Product Development of the new software .................................................................... 48
3.5. New Software for` Sustainable Supply Chain Management ......................................... 50
3.4. Disadvantages of 360report in company Y .................................................................... 56
4. COMPARISON OF SOFTWARE’S APPLICATION PECULARITIES ............................ 57
CONCLUSIONS ...................................................................................................................... 61
REFERENCES ......................................................................................................................... 62
APPENDIXES .......................................................................................................................... 64

7
List of Figures
Figure 1.1 Components of Supply Chain...................................................................... 10
Figure 1.2 Logistics Management Scheme ................................................................... 14
Figure 1.3 Information Integration ............................................................................... 15
Figure 1.4 System of inventory management ............................................................... 17
Figure 1.5 Reasons of Bull-Whip effect ....................................................................... 18
Figure 1.6 Effects of Distortion of Information in the Beer Game ............................... 23
Figure 2.1 Manufacturing department in company X .................................................. 28
Figure 2.2 Supply Chain of Company X .................................................................... 210
Figure 2.3 Strategies for supply chain optimization in company X ............................. 30
Figure 2.4 Functionality of Software that is being used in company X ....................... 34
Figure 2.5 Production strategy of Company X using SAP ........................................... 38
Figure 2.6 Information Management System of Company X using SAP .................... 39
Figure 3.1 Automatic CO2 emission calculation ......................................................... 43
Figure 3.2 Single User Entry ........................................................................................ 45
Figure 3.3 Researcher’s suggestion for Inventory Management of Company Y ......... 46
Figure 3.4 Sugested Inventory Management for Company Y ...................................... 47
Figure 3.5 Advanced Product Quality Planning of software integration ...................... 48
Figure 3.6 Schematic diagram of the latest software ................................................... 49
Figure 3.7 Integration to the entire supply chain .......................................................... 50
Figure 3.8 Selection option for each unit ...................................................................... 51
Figure 3.9 Interface for input of information ................................................................ 52
Figure 3.10 Inventory data (fragment) .......................................................................... 53
Figure 3.11 Charts and graphs in the new software ...................................................... 54
Figure A.1 Latest advancements in the software .......................................................... 63
Figure A.2 Integrating it for the entire Supply Chain ................................................... 64
Figure A.3 Input Text ................................................................................................... 65
Figure A.4 Output text .................................................................................................. 66
Figure A.5 Output texts 2 ............................................................................................. 67

8
List of Tables
Table 1.1 Comparison of Different Software’s ........................................................... 27
Table 2.1 Number of days in inventory ........................................................................ 33
Table 4.1 Comparison of software application peculiaritites ....................................... 57

9
INTRODUCTION
Supply chain encompasses the companies business activities needed to design, make,
deliver, and use of product or service. Majority of the businesses survive and thrive because of
supply chain. Supply chain is an art of bringing products to the market. It consists of all the
stages involved in fulfilling the customer’s requirements. Supply chain is a network of facilities
and a distribution of procurement of materials, conversion into intermediate and final
component, distribution to the customers.
The systemic, strategic coordination of the traditional business functions and the tactics
across these business functions within a particular company and across business within the
supply chain, for the purposes of improving the long-term performance of the individual
companies and the supply chain as a whole [1]. Supply chain management is the coordination
of production, inventory, location, and transportation among the participants in a supply chain
to achieve the best mix of responsiveness and efficiency for the market being served. A supply
chain is the global network of organizations and activities involved in [1] designing a set of
goods and services and their related processes [2], transforming inputs into goods and services
[3], consuming these goods and services [4] and disposing of these goods and services [2].
Objectives: To analyse supply chain optimization peculiarities in manufacturing
enterprise and enhance the performance of an existing supply chain.
Tasks:
1. To understand the basics of Supply Chain management, the constituents, the critical
components for optimization and to be familiar with the latest software for supply chain
management and other software that are used in individual constituents of supply chain.
2. To investigate the Bull-Whip effect in the supply chain of manufacturing industries and
to derive an effective solution to curb it.
3. To analyse the market need for technological software in the area of Supply Chain.
4. To integrate the ideas into a software that can create a sustainable supply chain, to
analyse the implementation possibilities and integrate it for a Sustainable Supply Chain.
5. To investigate on the necessary advancements that are required in the advancements of
a supply chain.

10
1. SUPPLY CHAIN MANAGEMENT ASPECTS IN
MANUFACTURING ENTERPRISE
1.1. Characteristics of Supply Chain Management
There are Six main components that focus in Supply chain process. Depending on the
type of Supply Chain, they may be explained as follows.
InventoryProduction
LogisticsLocation
Information
Management
Fig 1.1 Components of Supply Chain
1.1.1. Inventory
Inventories are spread in every area of the supply chain. It includes any product from
raw material to work in progress until the finished goods. They may be in the manufacturer or
in the distributor or the retailers. No matter which part they may be in, they constitute as
inventory of a supply chain.

11
The reason why inventory is considered to be one of the essential factors of the supply
chain is because, it is considered to be one the least resale value. Stagnation in any area of the
supply chain can be highly volatile for the company.
Managers, must have a strong control and knowledge of how effectively the inventory
has to be managed. The technical paper revolves strongly on the essentiality of inventory
management in companies. The computerization of inventory management is one of the
effective tools to calibrate and reduce errors as much as possible.
1.1.2. Production
A supply chain that is good is a one that involves analysing, the type of product the
company wants. It is also about the quantity in which it is needed, the procedure in which it has
to be produced and at what time the produce has to be produced. This activity is the key for the
creation of master production schedules. The master production schedules in turn are the base
to account the capacity of the plant, the balancing of the workload, the maintenance and also
the quality control.
The key activity in the whole process of supply chain, is to prioritize and plan with the
concern of time. The process involves developing a production schedule for a short term and to
keep the work the work in progress in control. The marketing side allows the production plan
to plan according to the requirements. The reason behind the market to be the initial step is
because, the company can meet the customer order due dates, process the order, plan the
production and operations. The effectiveness can be achieved only if the company is closely
knit [3].
Inventory is spread throughout the supply chain and includes everything from raw
material to work in process to finished goods that are held by the manufacturers, distributors,
and retailers in a supply chain. Again, managers must decide where they want to position
themselves in the trade-off between responsiveness and efficiency. Holding large amounts of
inventory allows a company or an entire supply chain to be very responsive to fluctuations in
customer demand. However, the creation and storage of inventory is a cost and to achieve high
levels of efficiency, the cost of inventory should be kept as low as possible. In the forth coming
chapters the Inventory Management as a form and how the effects of it will be given in the form
of Bull-Whip Effect.

12
1.1.3. Purchasing
Purchasing is an area of the supply chain where raw materials and auxiliary goods are
bought for manufacturing. However efficient the purchasing sector of the supply chain
management company is, is the profit level. Purchasing is a functional group (i.e., a formal
entity on the organizational chart) as well as a functional activity (i.e., buying goods and
services). The purchasing group performs many activities to ensure it delivers maximum value
to the organization. Examples include supplier identification and selection, buying, negotiation
and contracting, supply market research, supplier measurement and improvement, and
purchasing systems development. Purchasing has been referred to as doing “the five rights”:
getting the right quality, in the right quantity, at the right time, for the right price, from the right
source [3].
The clear definition of purchasing is given by Elliott-Shircore and Steele [6]who stated
that purchasing is the process by which a company (or other organisation) contracts with third
parties to obtain goods and services required to fulfil its business objectives in the most timely
and cost-effective manner.[4].
1.1.4. Transportation
Transportation refers to the movement of everything from raw material to finished
goods between different facilities in a supply chain. In transportation the trade-off between
responsiveness and efficiency is manifested in the choice of transport mode. Fast modes of
transport such as airplanes are very responsive but also more costly. Slower modes such as ship
and rail are very cost efficient but not as responsive. Since transportation costs can be as much
as a third of the operating cost of a supply chain, decisions. It majorly involves two types of
transportation (It is explained in section 2.1.4):
1. Inbound Transportation.
2. Outbound Transportation.
1.1.5. Location
Location refers to the geographical siting of supply chain facilities. It also includes the
decisions related to which activities should be performed in each facility. The responsiveness
versus efficiency trade-off here is the decision whether to centralize activities in fewer locations
to gain economies of scale and efficiency, or to decentralize activities in many locations close
to customers and suppliers in order for operations to be more responsive.

13
When making location decisions, managers need to consider a range of factors that
relate to a given location including the cost of facilities, the cost of labour, skills available in
the workforce, infrastructure conditions, taxes and tariffs, and proximity to suppliers and
customers. Location decisions tend to be very strategic decisions because they commit large
amounts of money to long-term plans.
Location decisions have strong impacts on the cost and performance characteristics of
a supply chain. Once the size, number, and location of facilities is determined, that also defines
the number of possible paths through which products can flow on the way to the final customer.
Location decisions reflect a company’s basic strategy for building and delivering its products
to market.
1.1.6. Information
Information is the basis upon which to make decisions regarding the other four supply
chain drivers. It is the connection between all of the activities and operations in a supply chain.
To the extent that this connection is a strong one, (i.e., the data is accurate, timely, and
complete), the companies in a supply chain will each be able to make good decisions for their
own operations. This will also tend to maximize the profitability of the supply chain as a whole.
That is the way that stock markets or other free markets work and supply chains have many of
the same dynamics as markets.
Information is used for two purposes in any supply chain:
1. Coordinating daily activities related to the functioning of the other four supply chain
drivers: production; inventory; location; and transportation. The companies in a supply chain
use available data on product supply and demand to decide on weekly production schedules,
inventory levels, transportation routes, and stocking locations.
2. Forecasting and planning to anticipate and meet future demands. Available
information is used to make tactical forecasts to guide the setting of monthly and quarterly
production schedules and timetables. Information is also used for strategic forecasts to guide
decisions about whether to build new facilities, enter a new market, or exit an existing market.
1.2. Supply Chain Optimization by Computerization of its components
Supply Chain management simply means that effective management of all the six
component of supply chain. It involves how effectively we are able to utilize the resources and
manufacture components with highest profit margin. In this paper we will be discussing about
14
the five main management systems and how to computerize them. Computerizing a component
is one of the best way to optimize a process.
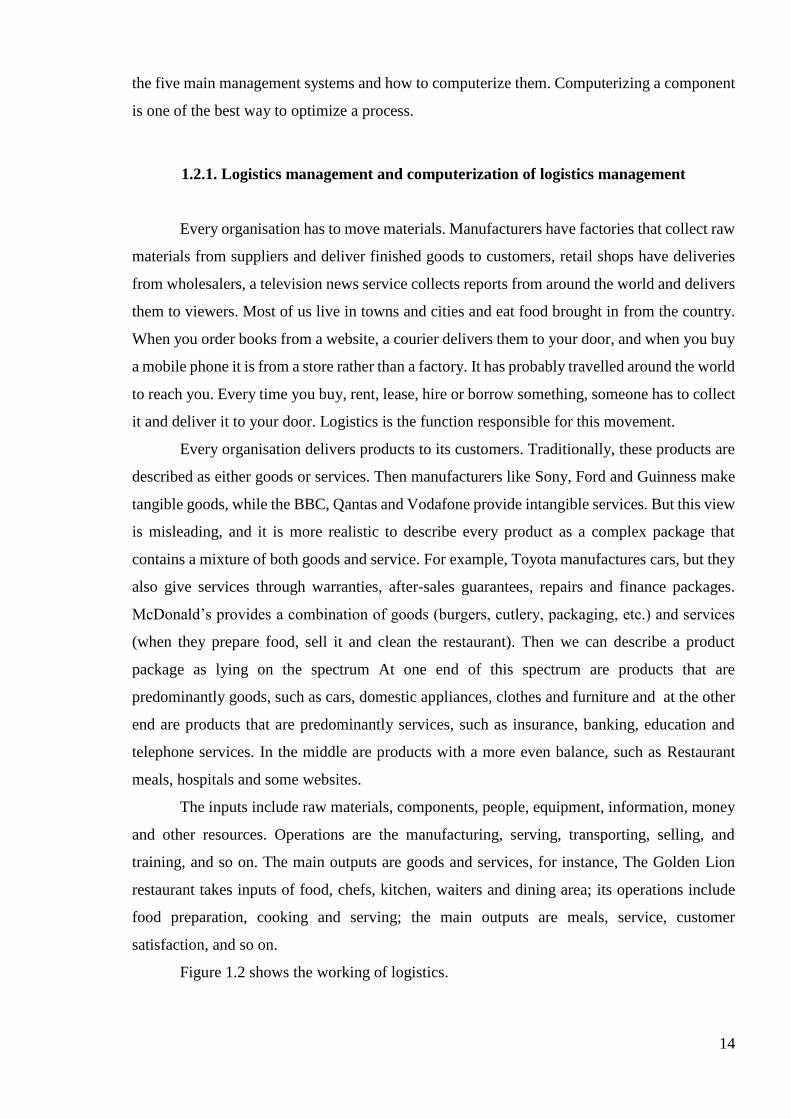
1.2.1. Logistics management and computerization of logistics management
Every organisation has to move materials. Manufacturers have factories that collect raw
materials from suppliers and deliver finished goods to customers, retail shops have deliveries
from wholesalers, a television news service collects reports from around the world and delivers
them to viewers. Most of us live in towns and cities and eat food brought in from the country.
When you order books from a website, a courier delivers them to your door, and when you buy
a mobile phone it is from a store rather than a factory. It has probably travelled around the world
to reach you. Every time you buy, rent, lease, hire or borrow something, someone has to collect
it and deliver it to your door. Logistics is the function responsible for this movement.
Every organisation delivers products to its customers. Traditionally, these products are
described as either goods or services. Then manufacturers like Sony, Ford and Guinness make
tangible goods, while the BBC, Qantas and Vodafone provide intangible services. But this view
is misleading, and it is more realistic to describe every product as a complex package that
contains a mixture of both goods and service. For example, Toyota manufactures cars, but they
also give services through warranties, after-sales guarantees, repairs and finance packages.
McDonald’s provides a combination of goods (burgers, cutlery, packaging, etc.) and services
(when they prepare food, sell it and clean the restaurant). Then we can describe a product
package as lying on the spectrum At one end of this spectrum are products that are
predominantly goods, such as cars, domestic appliances, clothes and furniture and at the other
end are products that are predominantly services, such as insurance, banking, education and
telephone services. In the middle are products with a more even balance, such as Restaurant
meals, hospitals and some websites.
The inputs include raw materials, components, people, equipment, information, money
and other resources. Operations are the manufacturing, serving, transporting, selling, and
training, and so on. The main outputs are goods and services, for instance, The Golden Lion
restaurant takes inputs of food, chefs, kitchen, waiters and dining area; its operations include
food preparation, cooking and serving; the main outputs are meals, service, customer
satisfaction, and so on.
Figure 1.2 shows the working of logistics.

15
Customer
Customer
Feedback team
Manufacturer
Warehouse
SupplierOutsourced products
Logistics Schematic
diagram
Fig 1.2. Logistics Management Scheme
1.2.2. Computerization of Information
An integrated supply chain is an association of customers and suppliers who work
together to optimize their collective performance in the creation, distribution, and support of an
end product. All supply chains are integrated to some extent by focusing and coordinating the
relevant resources of each participant to optimize the overall performance of the chain.
Therefore, supply chain integration is a continuous process that can be optimized when supply
chain members work together to improve their relationships and when all participants are aware
of key activities at all levels in the chain.
Information Technology (IT) is playing an increasingly critical role in the success or
failure of the supply chain. IT ranks highly as the essential ingredient and backbone for the
success of supply chain integration [23]. IT has become one of the keys to operating success. It
is impossible to achieve an effective supply chain without IT. Since suppliers are located all
over the world, it is essential to integrate the activities both inside and outside of an
organization. This requires an integrated information system for sharing information on various
value-adding activities along the supply chain [22]. As the concept of competing between
supply chains grows more intense and widespread because of inevitable global competition, IT
utilization has changed its role from back office and operational support to strategic imperative.

16
Firms have started to utilize IT to directly influence the processes of comprising the value chain
[5]. Increasingly, IT is used to facilitate internal coordination within a firm and enhance external
integration with external constituencies (e.g., customers and suppliers) and also to enhance
decision making among supply chain members. This phenomenon is evident by the increased
usage of information systems for integration purposes; for instance, information systems
infrastructure (e.g., data communication tools, network connection, standard data structure, and
unified coding standards), information systems software (e.g., enterprise-wide information
system such as SAP), and information systems applications (e.g., centralized database
management systems, Electronic data interchange (EDI), web-based or internet-based
information systems).Although the advances in formation technologies are considered a key
driver of supply chain integration; what is the best way to deploy these technologies and to
coordinate supply chain-wide activities is still under research [6]. The information flow is
shown in the Figure 1.3
Customer
Stores
Distribution CenterWarehouse
Planning team
Flow of information
Flow of merchandise
Fig 1.3 Information Integration
1.2.3. Computerization of Manufacturing process
The secular price decline in the real cost of computing has created vast economic
incentives for employers to substitute labour for computer capital. Yet the tasks computers are
able to perform ultimately depend upon the ability of a programmer to write a set of procedures
or rules that appropriately direct the technology in each possible contingency. Computers will
therefore be relatively productive to human labour when a problem can be specified – in the
sense that the criteria for success are quantifiable and can readily be evaluated [2].

17
The extent of job computerisation will thus be determined by technological advances
that allow engineering problems to be sufficiently specified, which sets the boundaries for the
scope of computerisation.
1.2.4. General Aspects of Inventory Management
Inventory management is a component that spreads over an entire enterprise. They are
generally given an identification system and are tracked by using the Information Services (IS).
The three areas if the Information Services, which help track the supply chain are:
Acquisition are the areas, where the personnel are assisted in purchasing the software
and hardware of the produces. The main purpose of acquisition is to ensure that the
company follows correct needs and guidelines for finance are followed.
Redeployment are procedures that are involved in ensuring the assets are assessed, and
kept track of when they are moved from one location to another. The product when
moved by its original owner it automatically updates in the new location, where it is
being moved. The redeployment is a process, when a product is moved from one place
to another, the data base at the old system is deleted and is updated automatically in the
new system. There are many software which do this essential process. The major players
in the market are SAP and Oracle DataBase Management. In this work the researcher
has also presented a case of Inventory management in a software called as 360report.
Termination it is the process that is responsible for deleting the component, when the
product is being destroyed or replaced. The money shown in the inventory column is
automatically erased.
The inventory system that is kept as a record in the data base of the owner and is defined
in the location where the asset is placed. The importance of the existence is mentioned in the
inventory record. Depending on the criteria like time frame of the existence of the produce or
so the criteria is set. The planning of the companies’ strategy revolves around this. The logistics
department works on this plan that the inventory system provides.
The inventory management system is a database. The important element of a database
is how well it is update and how often it is updated. This determines the strength of the inventory
management. No matter what the inventory management is set, it is highly vital that the
operating system is manned by educated professionals. Above which it would be high
optimization is it is computerized. With this idea in mind dawned the inventory management
system [3, 4] The Integration of inventory management is shown in Figure 1.4.

18
System for Inventory
Management
Finance Department
Data from Ware House
Data from Supplier
Customer Demand
Logistics Department
Human Resource
Department
Figure 1.4 System of inventory management
Benefits of Computerization of Inventory
The benefits of Computerization of Inventory are [8,9]:
1. Up-to-date information about data processing resources through the creation and
archiving of records in a centralized repository.
2. Financial records specific to a single component, or groups of components.
3. Service records for all components in the inventory.
4. Data used to support configuration diagrams of the hardware and software components
contained within specific locations, or the entire data processing environment.
1.3. Problems in the Supply Chain by the Impact of Bull-Whip Effect
1.3.1. Bull-Whip effect in a manufacturing enterprise
The literature analysis was majorly done from the technical presentations [21, 22, 23,
and 24] Bull-Whip effect is the variation in the order of the company’s requirements over time.
The reasons for Bull-Whip effect are given below in Figure 1.5.

19
Reasons for
Bull-Whip
Effect
Batch Type
Ordering
Demand Forecast
Updating
Fluctuation in PriceRationing and
Short Gaming Inventory
Fig 1.5 Reasons of Bull-Whip effect
Supply Chain has a numerous explanations amongst various authors. The term Supply
Chain is been predominantly in various organizations at various levels. One of the Authors, La
Londe and Masters proposed that a supply chain is a set of firms that pass materials forward.
Normally, several independent firms are involved in manufacturing a product and placing it in
the hands of the end user in a supply chain – raw material and component producers, product
assemblers, wholesalers, retailer merchants and transportation companies are all members of a
supply chain [22]. In this the author does not mention about customers as a component in the
Supply Chain. But in this another definition notes; a supply chain is the network of
organizations that are involved, through upstream and downstream linkages, in the different
processes and activities that produce value in the form of products and services delivered to the
ultimate consumer [21]. Here it clearly mentions the involvement of the customer.
In this technical paper, it focusses more on how the customer plays a major role in
organizational Supply Chains and how they have a dramatic effect on the whole supply chain
majorly the suppliers of the company. This effect of customers is called as the “Bull-Whip
Effect”. One of the authors mentions that the Bull-Whip effect refers to the tendency of orders
to increase in variation as one moves up a supply chain [22] The effect of the customer can also
be when one moves down the supply chain as well. In the case a customer orders go down for
a particular point of time it is clear that the demand on the market of the producers and the
suppliers of the producers are influenced greatly.
In an inventory management organizational context text performed by [24]. It a “Beer
Distribution Game”. This was where each player was asked to vary his inventory level and to

20
order as their only form of communication. Under the linear the cost structure the experiment
shows the variances of orders amplify as one moves up in the supply chain confirming the Bull-
Whip effect.
In the survey that was conducted by a company which manufactures and sells fast
moving products for consumers. It was clear that the shipment of the product was the most
fluctuating one in the company.
1.3.2. Reasons of Bull-Whip effect
The reasons for Bull-Whip effect as shown in figure 1.5 is divided into four different
categories
Demand forecast updating
Distortion in the information arises between the manufacturer and supplier. When there
is a particular demand from the consumer, automatically the supplier updates the demands. This
is not an issue when the supplier initiates this to the manufacturer in advance but when it is not
made so, the manufacturer makes products in surplus or lesser than what is required. This could
lead to heavy losses from the manufacturer. When the manufacturer is a start-up firm, which
just has one customer at the moment, the loss becomes drastic. If the firm manufactures lesser
than required, it could also lead to problems.
Procter and Gamble had a similar issue in the year 1990 with problem of extreme
demand variation in the famous product- Pampers Diapers.
Order batching
In the case of manufacturing system, it is more evident that suppliers and manufacturers.
It is hard for suppliers to manufacture a product for supplier’s products individually. The
logistics and operational cost become a hindrance for it. They are more into manufacturing a
product as a batch. Instead of ordering frequently customers order in bulk for each month or
week. This results in stacking up orders, if the batch is not sold. It could lead to disruption in
the whole supply chain.
Price Fluctuation
It is stated that nearly 80% of the operations the organizations buy the products in
advance and in bulk. In case the price of the product that the supplier gives when buying a
product in advance the manufacturer provides a fair amount of discount for its customers. When
there is a price fluctuation and it becomes harder to give the discount. The discounts and special

21
offers have to be met by the manufacturer. The typical example was Motorola was not able to
supply their customer during Christmas of 1992 and 1993. This gave them a big setback in their
career. Their stocks dropped down by 10%. In the case of Hewlett and Packard, they could not
supply for their printer laser jet printer.
Rationing and Shortage gaming
In a company they ration their products and have safety stocks to avoid problems when
there is a shortage. The problem arises when the rationing and shortage of stocks are not done
as per the requirement. The typical example is when a company producing nearly 100 products
every day and they store a safety stock of 1%. This becomes a problem for the company in case
of calamity; for instance there is a problem somewhere in the line, then it becomes difficult to
compensate for that product loss. Typical example is during the Tsunami in Japan. They had a
shortage of automobile in Indonesia and China. The problem was that ships were not able to
reach Japan. When product demand exceeds supply, a supplier needs to ration its product to
customers. Knowing that, customers may order more than they really need. Later, when there
are no shortages, orders disappear. Introducing rationing methods based on past sales rather
than on orders placed takes away the incentive for customers to inflate order sizes [13, 14].
1.3.3. Theoretical Solution for Bull-Whip effect
Different authors have depicted the solution in different ways and the way to curb the
Bull-Whip effect. Main solutions are [25, 26, and 27]:
Avoid Multiple Demand Forecast Updates
In the paper by Lee, H. L., Padmanabhan, V., & Whang, S.[25] the authors have
mentioned that Ordinarily, every member of a supply chain conducts some sort of forecasting
in connection with its planning (e.g., the manufacturer does the production planning, the
wholesaler, the logistics planning, and so on). Bull-Whip effects are created when supply chain
members process the demand input from their immediate downstream member in producing
their own forecasts. Demand input from the immediate downstream member, of course, results
from that member's forecasting, with input from its own downstream member.

22
Breaking Order Batches
In the case of breaking order batches, generally when orders are placed in small and
frequent orders, it can be cut down into minimum. In the case of P & G they have introduced a
standard ordering terms across all the units. This simplifies a lot of processes and General
Electric is electronically matching buyers and suppliers throughout the company.
Stabilize Prices
The best way a prize may be stabilized, would be to reduce the Supplier discount, the
simplest way to control the Bull-Whip effect caused by forward buying and diversions is to
reduce both the frequency and the level of wholesale price discounting. The manufacturer can
reduce the incentives for retail forward buying by establishing a uniform wholesale pricing
policy. In the grocery industry, major manufacturers such as P&G, Kraft, and Pillsbury have
moved to an everyday low price (EDLP) or value pricing strategy. During the past three years,
P&G has reduced its list prices by 12 percent to 24 percent and aggressively slashed the
promotions it offers to trade customers. In 1994, P&G reported its highest profit margins in
twenty-one years and showed increases in market share. Similarly, retailers and distributors can
aggressively negotiate with their suppliers to give them everyday low cost (EDLC). From 1991
to 1994, the percentage of trade deals in the total promotion budget of grocery products dropped
from 50 percent to 47 percent [21] .
Eliminate Gaming in Shortage
Situations when a supplier faces a shortage, instead of allocating products based on
orders, it can allocate in proportion to past sales records. Customers then have no incentive to
exaggerate their orders. General Motors has long used this method of allocation in cases of
short supply, and other companies, such as Texas Instruments and Hewlett-Packard, are
switching to it. "Gaming" during shortages peaks when customers have little information on the
manufacturers' supply situation. The sharing of capacity and inventory information helps to
alleviate customers' anxiety and, consequently, lessen their need to engage in gaming. But
sharing capacity information is insufficient when there is a genuine shortage. Some
manufacturers work with customers to place orders well in advance of the sales season. Thus
they can adjust production capacity or scheduling with better knowledge of product demand.
Finally, the generous return policies that manufacturers offer retailers aggravate gaming.
Without a penalty, retailers will continue to exaggerate their needs and cancel orders. Not

23
surprisingly, some computer manufacturers are beginning to enforce more stringent
cancellation policies.
We contend that the Bull-Whip effect results from rational decision making by members
in the supply chain. Companies can effectively counteract the effect by thoroughly
understanding its underlying causes. Industry leaders like Procter & Gamble are implementing
innovative strategies that pose new challenges: integrating new information systems, defining
new organizational relationships, and implementing new incentive and measurement
systems[26].
1.3.4. Effects of Information distortion
The entire solution of Bull-Whip can be summarized as distortion of information
system. The major reason for Bull-Whip effect is the information that is not completely being
passed either moving upstream or downstream. In the technical presentation of Rachel Croson,
[28,29], in the beer game conducted by the survey the results showed up without the information
being shared amongst the participants. This is shown in the Figure 1.6.

24
Fig 1.6 Effects of Distortion of Information in the Beer Game [29]

25
1.4. Quantifying the Bull-Whip Effect
The literature analysis was majorly done from the technical presentations [27, 29, 30,
and 32]
Supply Chain has a numerous explanations amongst various authors. The term Supply
Chain is been predominantly in various organizations at various levels. One of the Authors, La
Londe and Masters proposed that a supply chain is a set of firms that pass materials forward.
Normally, several independent firms are involved in manufacturing a product and placing it in
the hands of the end user in a supply chain – raw material and component producers, product
assemblers, wholesalers, retailer merchants and transportation companies are all members of a
supply chain [21]. In this the author does not mention about customers as a component in the
Supply Chain. But in this another definition notes a supply chain is the network of
organizations that are involved, through upstream and downstream linkages, in the different
processes and activities that produce value in the form of products and services delivered to the
ultimate consumer [29] ,Here it clearly mentions the involvement of the customer.
In this technical paper, it focusses more on how the customer plays a major role in
organizational Supply Chains and how they have a dramatic effect on the whole supply chain
majorly the suppliers of the company. This effect of customers is called as the “Bull-Whip
Effect”. One of the authors mentions that the Bull-Whip effect refers to the tendency of orders
to increase in variation as one moves up a supply chain [31]. The effect of the customer can
also be when one moves down the supply chain as well. In the case a customer orders go down
for a particular point of time it is clear that the demand on the market of the producers and the
suppliers of the producers are influenced greatly.
In an inventory management organizational context text performed by [37] it a “Beer
Distribution Game”. This was where each player was asked to vary his inventory level and to
order as their only form of communication. Under the linear the cost structure the experiment
shows the variances of orders amplify as one moves up in the supply chain confirming the Bull-
Whip effect.
In the survey that was conducted by a company which manufactures and sells fast
moving products for consumers. It was clear that the shipment of the product was the most
fluctuating one in the company.

26
Calculation of Inventory to curb the Bullwhip effect,
𝑀t = 𝑑
1−𝜌{(𝐿 + 1) −
𝜌(1−𝜌𝐿+1)
1+𝜌} +
𝜌(1−𝜌𝐿+1)
1+𝜌 𝑌𝑡 ,
𝑉 = 1
(1 − 𝜌)2 {(1 + 𝜌𝑙+2)2 + ∑(1 − 𝜌𝐿+𝑙+3−𝑖
𝐿
𝐼=1
)2
+ 𝜌2 (1 − 𝜌𝐿+1)2(1 − 𝜌𝑙+1)2
(1 − 𝜌)2}
(1.1)
(1.2)
(2.1)
Mt- Mean time
d- Mean
𝜌- Sensitivity of Fluctuation.
L- Lead time
Yt- Retailers Order Quantity
V- Variance in the market

27
1.5. Analysis of Software for Supply Chain Management
There are many software that are just for specific Supply Chain functions and sometimes that
can be integrated to the entire Supply Chain. The list below shows the list of companies in the
market.
Comparison of Different Software’s Table 1.1
No
Software
Cost
References
(customers)
Languages
Input
Style
1.
Seram
8500€/Year/ user
Novartis,
Swissotel,
Raffles,
Fairmont,
FHRI hotels
English,
Deutsch,
Italian
Webbased
2.
SAP
3000€/Year/ user/
Module
Southern California
Edison
MMG
Taminco
Woongjin Group
All languages
Text
3.
Credit360
2000€ for the first
year
and beyond
25000€
and more
Phillips,
Nestle,
Heineken,
London Stock
Exchange
English,
German,
Spanish,
Brazilian,
Chinese
Webbased
4.
Enviance
Alliant Energy
AECOM,
American Electic
Power
English
Text

28
5.
Clarity
Systems
Depending on the
number of users
Enigma,
Positive,
Octink,
Orchard,
Red Dog Imaging,
Samurai Signs and
Graphics
English
Text
6.
Oracle
Depends on the
type of module
DOW,
Lenovo,
Saint Gobain.
Customer
designed
Webbased
7.
BroadVanta
ge.inc
22488€/Year
basic
Canada Post,
Del Monte,
TVA,
Hyatt Hotels,
International Paper,
Qwest,
Duke Foundation,
Northwest Airlines,
Suncor Energy,
TransCanada.
English,
Chinese,
Japanese,
German and
language as
required by
the customer.
Database,
Keyboard,
Questtion
8.
Tofuture
25000€ for all
Functionality
Wartsila,
Ahlstorm,
Tamro
English,
German.
Finish
9.
360report
2000€ per user
Etventure,
FAI,
E-On,
Greenpeace Energy
English,
German,
Dutch
Webbased

29
2. INVESTIGATION OF SUPPLY CHAIN
IN COMPANY X
Company X has approximately over 128 000 employees in 315 manufacturing units and
82 product development sectors.
In the year 2012 they were the largest automobile parts manufacturing unit in North
America. They have been the largest company in Canada. This unit that the candidate has
analysed was one of its branches in Chennai, India.
They are located in over 29 countries and they are potential suppliers for leading car
manufacturers like Lamborgini, Benz, Toyota, Nissan and similar companies. They also supply
raw materials to many other companies like Hyundai.
The strategy in which they operate are based on the equality to all. They treat all their
customers irrespective of the type of order the place. They have a very strong Supply Chain and
they are aware of the Bull-Whip effect.
The general view of manufacturing department is presented in Figure 2.1, schematic
diagram of supply chain in company – in Figure 2.2.
Fig. 2.1 manufacturing department in company X [29]

30
Distribution Center
Receives the order
Sends the Signal To the
Manufacturing unit
Manufacturing
Unit Confirms
the order
and Distribution
center delivers it
to the customer
Company X headquarters Raw Material Supplier
Order for the raw
material supplier
Raw material
supplier
confirms the
order and
company x
approves it
Logistics company
Raw material supplier
sends signal to the logistics
company and the company
confirms the order
Manufacturing Unit
Company X
Head quarters
plans and
delivers the
production
schedule to
manufacturing
unit
Delivers the raw
material
Logistics companyManufacturing
Unit send signal
to logistics
company and
logistics company
approves it
Logistics company
picks up the raw
material
Logistics company delivers the
finished good
Signal for time of
delivering the
product and
quantity of
delivering the
product Movement of material
InformationFig 2.2. Supply Chain of Company X

31
2.1. Supply Chain Optimization strategies
used to curb the Bull-Whip Effect
The supply chain of Company X is very strong and they use a large variety of unique
strategies for curbing the Bull-Whip effect. Investigation of Supply Chain situation in company
X reveals the four main strategies, necessary to apply to curb the Bull-Whip effect (Figure 2.3).
The safety of the working personnel is the top priority in Company X. All working personal
have to wear necessary protective equipment like goggles, safety shoes and helmets when they
are entering the production area.
This knowledge of the company X automotive private limited, clearly was tuned
towards the problem. The problem was that the inventory was available throughout the Supply
Chain. The entire Supply Chain was clearly aware of what they were having in stock. The
supply chain had the knowledge and whereabouts of their inventories.
When there was a procurement order early in the morning, the company was able to
deliver the product in time and inventory did not store in the company for more than 7 days.
Strategies for Supply Chain Optimization in Company X
Follow breaking
order batches
Reduce inventory
and stabilize prizes
Labelling and
storing of the parts
Purchasing an
inventory
Incoming goods
received
Eliminate gaming
in shortage
Avoid multiple
demand forecast
updates
Number of days
stored in Inventory
Optimization of
Work Space Area
Optimization of the
working process
Tracking of the
production
Checklists
Application of
software
Inventory Storage
Effective
Gangways
Logistics Design
Fig. 2.3. Strategies for supply chain optimization in company X

32
2.1.1. Strategy to follow Breaking Order Batches
Labelling and storing of the parts
The first technique Company X follows is the labelling of parts and storing them
appropriately at the right place. This technique gives the order to be stored and used.
An automatic weighing machine has been implemented in the system. The product when
it reaches the warehouse is checked if the right part and right quantity is available and is put on
a weighing machine which automatically provides a label which is stuck on the part. This avoids
complications while numbering or weighing and labelling the part. This is one of the effective
measures that also helps in keeping track of the parts even after 3-4 years.
This is vital not just for the storing ease but also to know exactly the type of product
that is available and also the type of product is available where.
2.1.2. Strategy to Reduce Inventory and Stabilize Prizes
The idea of Purchasing an Inventory
If the inventory is being purchased with three parts A, B, C where A is the highest
pricing inventory B is the second and C third.
The items when they are stored in the inventory they always are stored in the ratio of
A- 10%
B- 60%
C- 30%
This is reduce the cost of the product. However this system is changing from company
to another company.
𝑆𝑎𝑓𝑒𝑡𝑦 𝑆𝑡𝑜𝑐𝑘 𝑆𝑡𝑜𝑟𝑎𝑔𝑒 = 𝑅𝑒𝑞𝑢𝑖𝑟𝑒𝑑 𝑀𝑎𝑡𝑒𝑟𝑖𝑎𝑙 𝐶𝑜𝑠𝑡 +
𝑃𝑟𝑜𝑑𝑢𝑐𝑡𝑖𝑜𝑛 𝑐𝑜𝑠𝑡𝑦 +
𝑂𝑣𝑒𝑟ℎ𝑒𝑎𝑑 𝑃𝑟𝑜𝑑𝑢𝑐𝑡𝑖𝑜𝑛 𝑐𝑜𝑠𝑡
(2.2)
They consistently reduced the inventory cost by the use of long term agreements. When
the long term agreements were used, it is called as bargaining.

33
Incoming Goods Received
The incoming goods may sometime arrive during odd timings especially goods which
are imported. To avoid any complications when the goods arrive and there is one person present
in the plant, all working personal in the inventory plant and production unit are trained with
data entry and specification measurement techniques. This improves the time in which the
goods can reach the factory giving them more time to reach the goods.
2.1.3. Strategy to Eliminate Gaming in Shortage
Number of days it is stored in the Inventory
The number of days that a part is placed in the inventory after the part has been
completed in it is presented in Table 2.1.
Table 2.1
Number of days in inventory
Location Number of days in inventory Reasons
Local 3 Depletion in storage space
within the country 5 Depletion of product
International 7 Freight rate problems
The average storage of inventory is also informed to the suppliers and the customers.
This gives a clear picture about the amount of product that is being produced.
Companies that would want to buy products from them can be sure about the current
inventory hold of the company.
Optimization of Work Space Area
In Company X they follow a particular system where there are specialized section for
each operations. In order to avoid unnecessary disturbances in the work place, the people who
are working in the particular section are displayed with their photos. This helps in organizing
the work in the work place. A person is appointed to check if the process is happening in order
and the work place is in place.

34
Optimization of the working process
In order to avoid irregular or bad working processes the working processes are displayed
in the work area. All working personal follow a particular process of reading and checking what
work has to be done and how to operate it. They follow this procedure during two times one
during the start of the shift and other during any breakdown is happening.
Tracking of the production
A display systems are being used in Company X to display the number of parts that are
being produced in each shift and each line. This helps keeping track of the number of materials
that are being sent out. If there are any form of lag in the required and the current running rate,
the person in charge has to give a written note stating the reason.
Checklists
They maintain particular check list for all the safety items. They have a set of checklist
for cleaning, removing, lubrication and information. There is also a checklist for environment
checking.
2.1.4. Strategy to Avoid Multiple Demand Forecast Updates
The company follows many steps to avoid multiple demand forecast and few are
described below.
Application of software in their supply chain
The process of using a software to manage orders from one component with the help of
an integrated software. It helps in:
1. General Management
2. Inventory Management
3. Logistics Management.
4. Reporting System.
Inventory is managed efficiently with the usage of the SAP software, it helps in
warehouse management. It is also an effective software that can be easily updated and changed.
It is used in order to store data and retain them even after years. The SAP software functions is
given in figure 2.4.

35
SA
P E
RP
(9.0
)
Banking
Business partner
Administrative
Sales A/R
Purchasing- A/P
Financials
Inventory
Production
MRP
Service
Human Resource
Reports
SAP- Management
SAP – Inventory Management
SAP – Logistics Management
SAP-Reporting System
Fig. 2.4 Functionality of Software that is being used in company X

36
The modularity of SAP can be divided into four main categories
1. SAP- Management
The management system consists of administration, production and materials
requirements planning. In the module of administration, drop downs like, choose company,
Set up, Approval Procedures, License and Add On is present
In the case of production unit, Bill of material, Production Reports, Bill of material
reports, MMOG, RM coverage full, FG coverage, FG old coverage, RM coverage minimum
days coverage days is present.
In the material, the drop down are as follows, Forecasts, MRP wizard, Order
Recommendation
2. SAP – Inventory Management
The SAP system has a specific storage space for managing ware house. In the SAP
system each storage facility is part of an organizational structure created in the system. For
inventory management there are two organizational levels which are required to be created; the
plant, and the storage location [8].
There are a lot of moment of goods in the SAP system, they can be broadly divided as
Inbound and Outbound. The procedures of inbound logistics, received goods, goods issues and
internal movement are:
Inbound Logistics: They are the products that come from the customer. Depending on
the type of the logistics, they can be further segregated into smaller fields such as
Internal Inbound Logistics and External Inbound logistics.
Received Goods: This process can be either in the form of an inbound supplier or it can
also be from the production process of the company. A goods receipt can be created
such that the materials that arrive can be used immediately, or if a quality inspection is
required they can be performed some form of tests to ensure that they are in stipulated
quality. They may also be placed in a blocked stock state where the company cannot
accept financial liability for the materials as they were not ordered, or incorrect. This
refers to the unavailability of the material for use.

37
Goods Issue: The ware house can be either uses or the production process or it can be
sold to a customer as well. In either case the process that are issued to an order
production or sales order which causes the stock level at the plant to be reduced. In some
cases the material is also used to scrap and it can be deemed as a usable product by the
quality department, even if it’s after the shelf time.
Internal Movements: Material in the plant may be changed from once place to another,
this process is called as an Internal Movement. There is a movement of goods, so that
the material is moved from the main storage area to a production area or a quality
inspection area. There may arise times when the material is moved to another plant, in
the case the material requirement is close. In such cases the plant is used to transfer
material from one point to another. One other internal movement is the transfer posting,
where a material is logically changed within the system. For example, a material that
has been received as material requiring quality inspection can be changed to material
that is available for use, by performing a transfer posting.
The SAP system is used to manage the inventory of the company. All goods, either
finished or processed ones are stored in the company by using SAP system. The inventory
system that is being used is the First in First out system (FIFO). It is much efficient and works
well with the company. They use this system for 209 materials that are currently the different
types of inventory that are available. Its can effectively manage all the functions of 22 suppliers
and contractors.
In the case of the inventory management system the company follows the centralized
inventory management system
3. SAP – Logistics Management
A logistics management information system is a system of records and reports – whether
paper based or electronic – used to aggregate, analyse, validate, and display data (from all levels
of the logistics system) that can be used to make logistics decisions and manage the supply
chain. A well-functioning Logistic Management information system (LMIS) provides decision-
makers throughout a supply chain with accurate, timely, and appropriate data, such as stock on
hand, losses and adjustments, consumption, demand, issues, shipment status, and information
about the cost of commodities managed in the system [4, 5].
38
4. SAP – Reporting System
The reporting software of the Company was consistently reporting they type of
inventory, the amount of inventory, the quality of inventory, throughout the Supply Chain. This
gave access for companies to modify, edit and change their requirements as per the varying
demand from the market. This gave the company a strong hold of managing inventory and
developing a software.
Inventory Storage
The inventory of the company raised since new contracts had implemented. The storage
of finished goods was optimized efficiently by “Vertical Stacking of the Inventory Products”
Now they are accommodating 2 more stacks in the row to have more items in the inventory.
Effective Gangways
Effective gangway system has been implemented in the premises to allow free moment
of people and load carrying machineries. This helps in easy transportation of parts within the
assembly.
Logistics Design
Company X is a company that basically follows Exworks idea. It is a company that
manufactures and is responsible for the product only till the time it is in its premises. The
company which offers the contract is the one that supplies and takes back the material. This is
a process that is effective and does not allow any unwanted responsibilities.

39
2.2. Advantages of the Supply Chain in Company X
The advantages of the Supply Chain of Company X are many, discussed below are the
advantages of Company X.
1. Software Functionality: The software they used was SAP, this is one of the leading
software in the field of managing the functionalities of the company. SAP had
nearly 12 modules that were used in the company. These functional modularity was
used from receiving inventory to the completed product sent to the storage unit after
completion. The management of the Supply chain using SAP is given in figure 2.6.
2. Computerized Production Planning: They had a very effective production
planning strategy by using SAP. Their operations had a strong back up and they
were well experienced in their field. People who worked in the company were
experienced for at least 3-5 years. It was almost impossible for them to hire someone
who was not a professional. This gives them an effective calibre of human force to
operate. Their production planning strategy using SAP is shown in Figure 2.5.
Planning
Master Production
Material Requirement
Planning
Shop floor
Aggregate UnitDemand End
Item
End Item Demand
Manufacturing and
Procurement
Part Procurement
Plan
Capacity and Aggregate
Production Planning
Level Production Plans
Fig. 2.5 Production strategy of Company X using SAP
3. Customer Relationship: They had good relations with their customers. The
customers they had were well versed in their field. Their customers were Hyundai
Nissan and many other big players in the market they expect a particular calibre for
operation. These companies were already well established and have been under
operation for the past 20 years in India. This gives them a vast source of experience.

40
Organization X
Head Quarters
Raw Material
supplier
Manufacturing
UnitOutsourcing
Assembly, quality,
Distribution center
Receiving
confirmation
Placing the order
Material Supplied
Order for manufacturing
requirement
Confirmation on
preparedness
Raw material for
manufacturing
Request for process outsourcing
Confirmation of process acceptance
Raw materials supply
Customer Demand
Finished goods from
manufacturing unit
Finished goods from
outsourcing unit
Signal for confirmation of received items
Assembled goods ready for shipping
Flow of information
Flow of material
Fig. 2.6 Information Management system of company X using SAP

41
2.3. Challenges of Supply Chain Computerisation
Challenges implementing software for the supply chain management of company X are:
1. They are very expensive, it becomes almost impossible for a company that is just begun or
for a company that is being established just for the past 5 years to have such an expensive
software.
2. Not all functions of SAP are required by all the companies. Some companies might not
require some functionality. Example a tyre manufacturing company in a small scale might
not require the software for administration.
3. Some companies already have existing software, this software cannot be changed
immediately. The software that are being integrated might require data base management.
The data base management cannot be set immediately. This will take time to set it up.
4. Major companies that are in the area of Small and medium enterprises might not have the
knowledge force to handle complex software such as Oracle database management. Cloud
computing software have to be simple for them. The functionalities are so wide, that it
requires a special person to handle the software.
5. They cannot have reporting directly from a software. They also need to have an auditor and
someone who has to check the issues externally before they could produce a report to the
stakeholders.
Considering the disadvantages in advance, the next company that the research candidate
analysed was a company, which integrated a sustainability software into a system.
2.4. Market Need for a Software to Contribute to Supply Chain
Optimization
1. A market requirements for a software that can be used to optimize a supply chain.
2. Should have a few functions similar to that SAP.
3. Should be as efficient as SAP, some functions should be better.
4. The product should be cost effective.
5. The product should contribute to curbing the Bull-Whip effect by eliminating gaming
in shortage.
6. The functions should be easy to use.
7. Majority of the customers should benefit from it.

42
3. SUPPLY CHAIN OPTIMIZATION IN COMPANY Y
3.1. Computerisation of Supply Chain Management of Company Y
Company Y is a leading packaging company, they manufacture carton packaging
worldwide. They develop software that are for reporting in the Supply Chain. They are located
in over 6 different countries like France, Germany, Austria, Warsaw Lithuania and Russia.
Their major area of customers were food service, Tobacco, Confectionery and similar
industries. They offer packaging such as airbox, cups, multipacks, tobacco packaging and
similar functions. They also do premium packaging, food service packaging and similar
functions. They are certified with ISO 9001: 2008.
They used a software called as 360report, which specialized in sustainability reporting,
energy auditing and carbon discharge emission. The software was specialized in delivering
optimal reports within stipulated time. The reports could be directly certified by GRI standards.
There were no prior knowledge were needed by the company to implement this software. The
software was from a company from Berlin. Delivering professional reports with just a key
stroke, were their disadvantage. The software was used to provide reports for stake-holders,
employees and other companies. The software costs about 2000 Euros per user. It is affordable
and the customers were satisfied with it functionality. The software was used by each unit in
the component of the Supply Chain. That is a production unit had this software, a distribution
centre had this software and the main office had this software. Each unit was connected
individually to the software and hence the data were not able to transmit from one part to
another.
One of the key functions of Supply Chain is Reporting (information to customers and
suppliers) to Stake Holders, Company Y developing a software that specifies in these functions.
The software had a single user interface. Only one computer could access the software at a
particular time. In the later stages, this software was able to be integrated into the entire Supply
Chain.
The company was ready for updating into its latest software. The software is designed
for Sustainability reporting and Energy Audits. Companies that generally use them are Small
and Medium Organization.
43
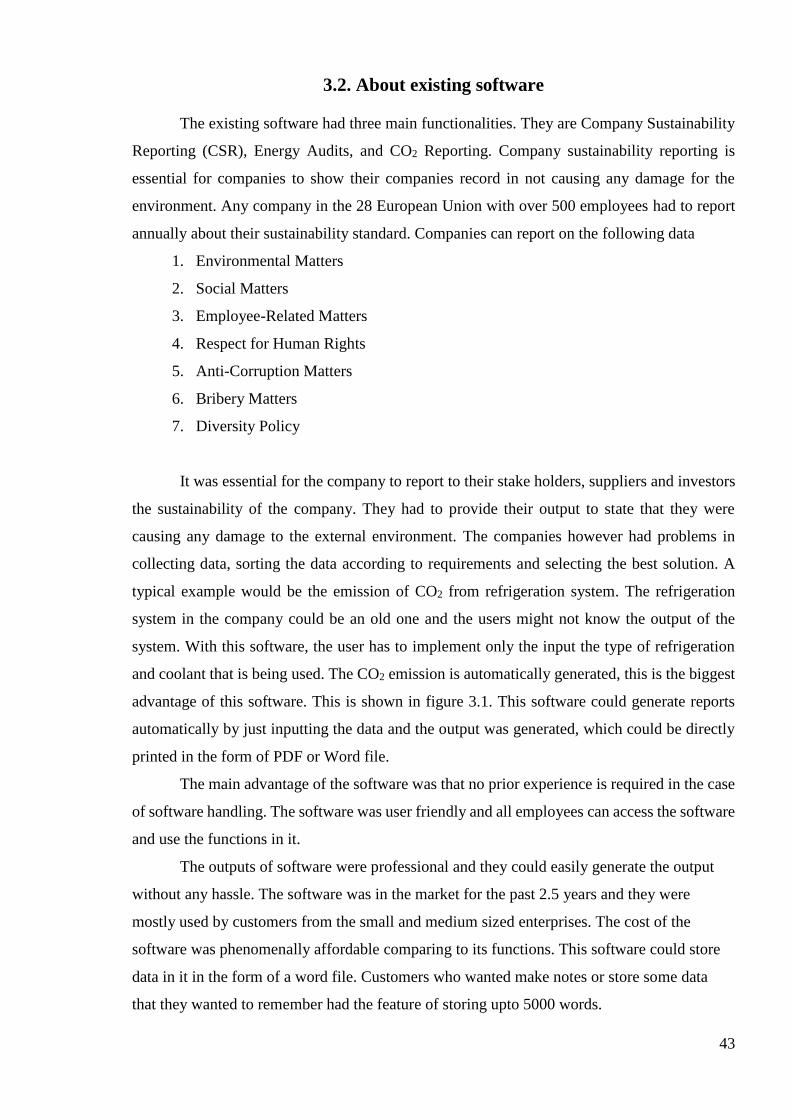
3.2. About existing software
The existing software had three main functionalities. They are Company Sustainability
Reporting (CSR), Energy Audits, and CO2 Reporting. Company sustainability reporting is
essential for companies to show their companies record in not causing any damage for the
environment. Any company in the 28 European Union with over 500 employees had to report
annually about their sustainability standard. Companies can report on the following data
1. Environmental Matters
2. Social Matters
3. Employee-Related Matters
4. Respect for Human Rights
5. Anti-Corruption Matters
6. Bribery Matters
7. Diversity Policy
It was essential for the company to report to their stake holders, suppliers and investors
the sustainability of the company. They had to provide their output to state that they were
causing any damage to the external environment. The companies however had problems in
collecting data, sorting the data according to requirements and selecting the best solution. A
typical example would be the emission of CO2 from refrigeration system. The refrigeration
system in the company could be an old one and the users might not know the output of the
system. With this software, the user has to implement only the input the type of refrigeration
and coolant that is being used. The CO2 emission is automatically generated, this is the biggest
advantage of this software. This is shown in figure 3.1. This software could generate reports
automatically by just inputting the data and the output was generated, which could be directly
printed in the form of PDF or Word file.
The main advantage of the software was that no prior experience is required in the case
of software handling. The software was user friendly and all employees can access the software
and use the functions in it.
The outputs of software were professional and they could easily generate the output
without any hassle. The software was in the market for the past 2.5 years and they were
mostly used by customers from the small and medium sized enterprises. The cost of the
software was phenomenally affordable comparing to its functions. This software could store
data in it in the form of a word file. Customers who wanted make notes or store some data
that they wanted to remember had the feature of storing upto 5000 words.

44
Fig 3.1. Automatic CO2 emission calculation

45
3.3. Necessary upgrade needed on the new software in the Supply Chain
The company needed a software that could be integrated into the entire Supply Chain. The
functions of the software had to be somehow similar to the old style. The system of operating
had to be consistent, but one software for the entire unit. The functions of the new software
needed to be constituted were as follows:
1. Integration of the software into the Supply chain: the requirement of
company Y was that the software had to be used throughout the supply chain.
All the areas had to be accessible. The software had to be made into all the
supply chain components.
2. User friendly: If the software was integrated into the system, the entire
Supply Chain cannot have complex functions. The example of it would be,
the production unit cannot handle complex software such as the design unit.
Practical problems occurred previously, especially with the Warehouse
department. The data were not updated as it should be, this lead to the
inventory of warehouse as sometimes not up to date.
3. Software upgrade had to be simple: This software was a cloud based
software, the company wanted the system to upgraded and ready to go within
a few days. It was impossible for the company to wait for the upgrade and for
days together, without the system running.
4. Cloud computing reliability: This software was a cloud based software, the
data that is stored had to be reliable. It would be a problem, if this data is
leaked or is misused. So the database of the system had to be upgraded as
well. The upgrade of database had to be changed from 3000 words- 7000
word. The users needed more space to operate their system.
5. Integrated for entire supply chain: All units, like the productions, the
warehouse, and the head office had to be connected virtually by this system.
No loss of data and it automatically had to calibrate the output.
6. Pricing: The software had to have almost the similar pricing the company
was paying at the moment. There should not much of improvisation of pricing
of the system. They had to also experience some form of a profit from the new
software.
7. Smart application: The new software had to have a facility to input tables
and charts into the system. The tables and charts had to be clear, concise and
also needed to be easy to be made.
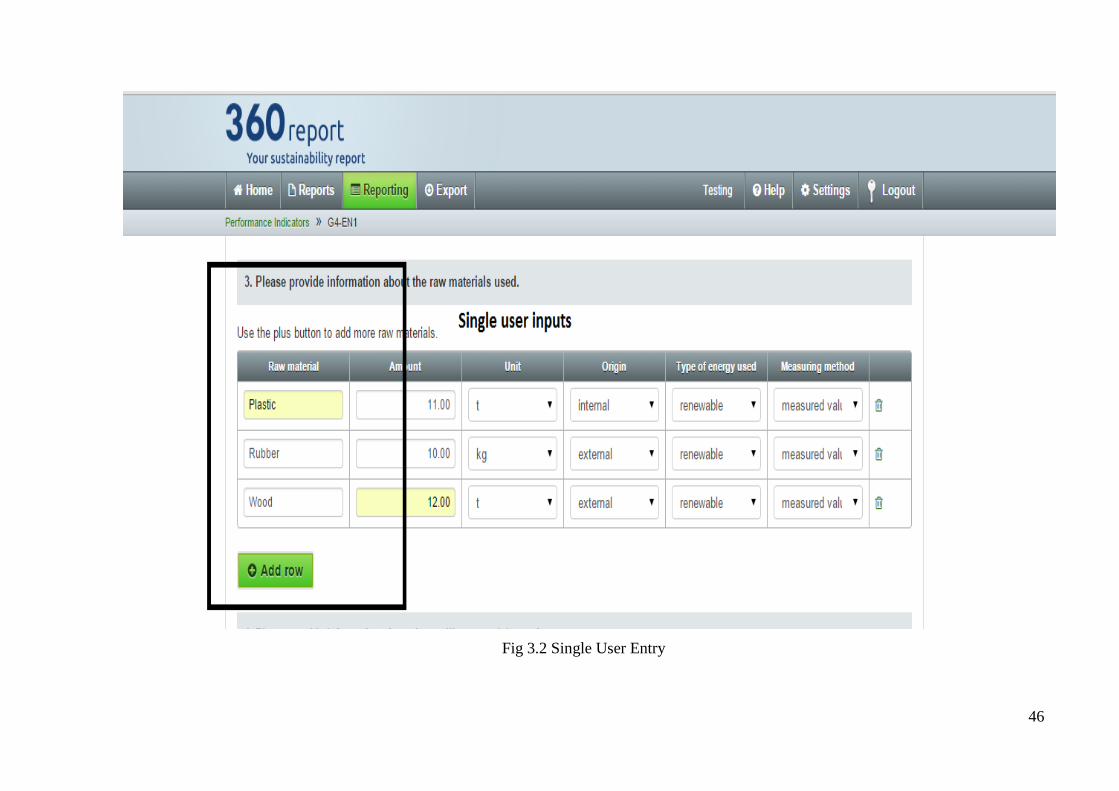
46
Fig 3.2 Single User Entry

47
Input from the researcher
1. Curbing the Bull-Whip effect: The system needed an inventory management
system where the inventory was automatically generated. The automatic generation
and addition of the numbers, could help in getting a clear picture of the available
inventory in all the units.
Head office
Supplier Production Unit Distribution Center Warehouse1
360report
Data
Fig 3.3 Researcher’s suggestion for Inventory Management system of company Y
2. Similarities to SAP: The warehouse management of SAP as investigated in section
2.1.4 was one of the biggest advantages of Company X. If this system is existing
and run by Company Y, then companies would experience a difference in their
Supply Chain.
3. Data allocation: Each area of the Supply Chain can manually be selected by head
organization to avoid hassles while uploading data. All functions are not necessarily
needed by all areas of the Supply Chain. Example the organizational data is not
needed for Warehouse. The existing system had the trouble where people had to
manually change every time. In the new system, the head organizations can just
select a few functions to edit the data and store it for one side of the Supply Chain.

48
3.4. Product Development of the new software
The steps for the product development of the new software are shown in the Figure 3.4.
Market Research Planning Development
Quality AssuranceDebugging
DepartmentSecurity
Enhancement
User
Customer Feedback
Competitor Analysis
Development plans
Product development and
Security enhancement
Testing and bug fixing
Enhancing the quality of the
product
User testing
Fig 3.4 Suggested Inventory Management system for company Y
Customer Feedback: The Company Y gave 360 report the functionality and what they
wanted out of the new software. A strong communication was established between them to
facilitate details to be shared amongst them.
Market research: The market research was performed by the researcher and the data was
clearly presented to the company regarding the functionality of the big players such as SAP,
Oracle and similar companies. This provided the outline of how the product should look like.
In the case of the company, the company was also able to analyse what segment of competitor
they had to face and what type of market they had to reach.

49
Development plans: a proper instruction had to be given and the bigger tasks had to be
broken down into smaller tasks. This facilitates the company to develop plans about the front
end designing, back end designing, contao arrangements, translations, platform help texts and
similar arrangements for Dutch platform had to be done in advance.
Security enhancement: the software was not just used to single unit but to the entire Supply
Chain. This relates to the data storage being enhanced in the system. The security was
enhanced by using customized servers and similarly the data could now be secured. This
means that each company has its own server base in Berlin.
Debugging department: Debugging department had to be vigorous in checking for errors
and fixing it. From the company side we also did user based bug fixing. This gives us the idea
of how this software runs and how it has to be updated.
Quality Assurance: The Company followed an advanced product quality planning to check
the company the steps for quality assurance are shown in figure 3.5.
Plan Do Act Check
Establish
Baseline
Identify priorities
Set improvement
Plans
Implement
ActionsMeasure and
monitor
Find and Fix
Evaluate
Apply results
Modify as
necessary
Fig. 3.5 Advanced Product Quality Planning of software integration
User testing: the final testing is done by company Y and the researcher was able to be
a part of the user testing. The main aspects of the user testing are as follows,
1. To test the language that is being used in the software.
2. To test the operation of the software, the usability,
3. To report errors to the company in case of defaults.

50
3.5. New Software for Sustainable Supply Chain Management
The new software was upgraded on 16.04.2015. The functionality of the new software
is shown in the form of a figure 3.6.
Company Y
Supplier Production
Unit
Distribution
Center
Whole
Saler
Supplier
1
Supplier
2
Production
Unit 1
Production
Unit 2
Production
Unit 3
Production
Unit 3
Fig. 3.6 Schematic diagram of the latest software
The upgrades of the software are given below
1. Integrating it with the entire Supply Chain: The new software has the
functionality of integrating the software into the supply chain. All areas of the supply
chain are now available with the facility to use this software. Now the users can
automatically update data in any area of their supply chain. Throughout the company
the data can be changed, edited and modified according to the requirements of the
user.
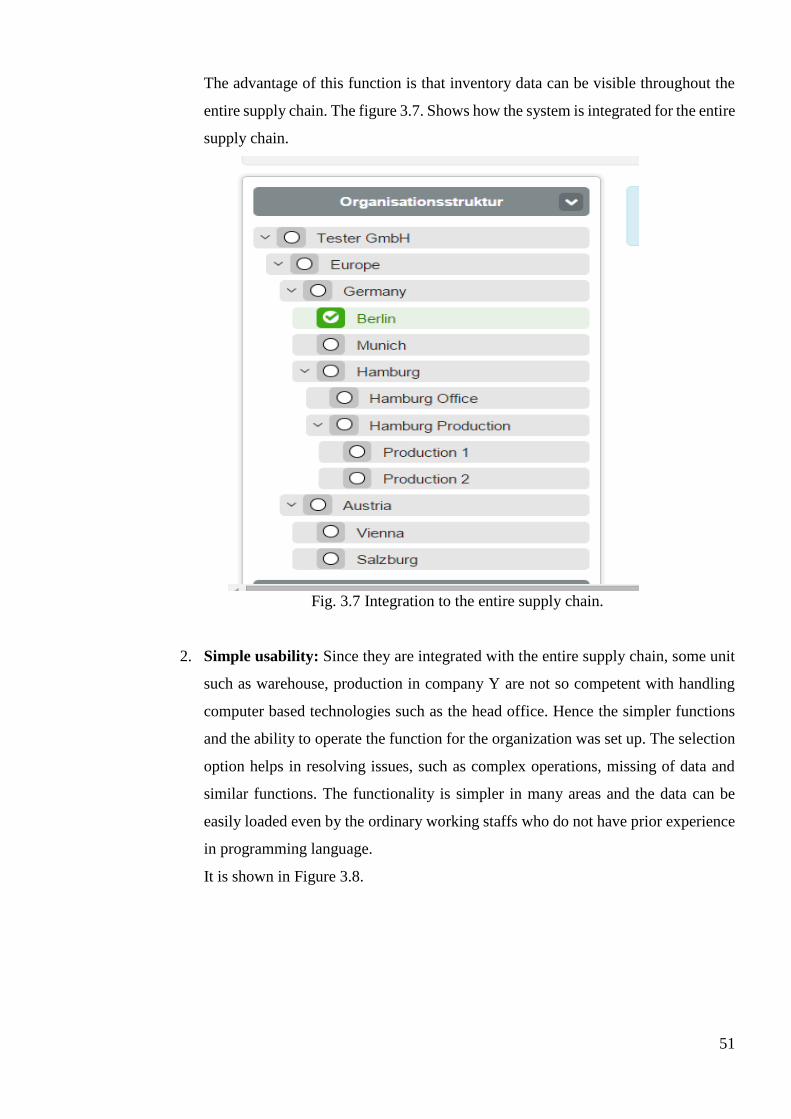
51
The advantage of this function is that inventory data can be visible throughout the
entire supply chain. The figure 3.7. Shows how the system is integrated for the entire
supply chain.
Fig. 3.7 Integration to the entire supply chain.
2. Simple usability: Since they are integrated with the entire supply chain, some unit
such as warehouse, production in company Y are not so competent with handling
computer based technologies such as the head office. Hence the simpler functions
and the ability to operate the function for the organization was set up. The selection
option helps in resolving issues, such as complex operations, missing of data and
similar functions. The functionality is simpler in many areas and the data can be
easily loaded even by the ordinary working staffs who do not have prior experience
in programming language.
It is shown in Figure 3.8.

52
Fig 3.8. Selection option for each unit
3. Reliability: 360 report set up a special server for company Y, to host their data.
Since they could not compensate on loss of data or any form of leakage in data they
had to set up a reliable means to store and process data.
4. Curbing the Bull-Whip effect by the latest software: the added advantage in the
software is the ability to curb Bull-Whip effect. It is made possible by elimination
gaming in shortage as discussed in section 1.3.3. One of the ways to eliminate the
Bull-Whip effect would be to make the inventory visible to the entire unit. When
the inventory is clearly visible to entire unit, it becomes clear about how much
stock is there in store and how much is needed. This gives the company a clear
idea about the inventory management system and curbing the Bull-Whip effect,
Demand forecasting is possible as the inventory is available throughout the
Supply Chain, this gives access for the different segments to forecast the demand.
Eliminating Gaming in shortage is created by the inventory system available.
Customers had experienced the advantage in the system by reducing their
inventory levels, since the company displayed the inventory system. The working
of it is shown in figure 3.9. and 3.10.

53
Fig. 3.9 Interface for input of information

54
Fig. 3.10 Inventory data (fragment)

55
5. Graphs and Charts: Users can also include graphs and charts to their current software .Figure 3.11 shows how they are included in the
software.
Fig 3.11. Charts and graphs in the new software

56
3.4. Disadvantages of 360report in company Y
The disadvantages of 360report in Company Y are as follows,
1. Cloud based software reliability: The software is a cloud based software and reliable
information is not suggestible to be stored in it by Company Y. The company cannot use
this to store large data. If the internet is down then the warehouse data of the entire supply
chain is lost.
2. Not so efficient: Software does not curb effects such as breaking order batching, the
software does not functions like SAP to automatically plan and evaluate the system for MRP
and MRP-II. They cannot process many functions that are there in the SAP. In the case of
reporting software they have an added advantage of automated generation of the software.
3. Lacks Predictability: The software does not have the ability to stabilize prices, to analyse
the price level and make changes if there is a necessity. The software cannot have a data
base for storing anything. In the case of 360report they cannot anticipate or make changes
in the pricing levels.
4. Not customized for Bull-Whip: The Company cannot use this software just for the use to
curbing the Bull-Whip effect. This software is used primarily for reporting. It may be used
to make the inventory visible to the entire supply chain. It is not a software that is meant
only for curbing the Bull-Whip effect.
5. Customer service: This Company is located in Berlin and it becomes almost impossible to
provide customer service directly to a sector which located somewhere else. It could also
be a problem if the customer is not in Europe.
6. Feedbacks acceptance: This Company is a start-up and the preference of the company at
the moment is the increase their customers and increase their business. However, if they
have feedbacks from existing customers to improvise the product on certain areas which are
not critical but an added advantage, this company does not accept it immediately.

57
4. COMPARISON OF SOFTWARE’S APPLICATION
PECULIARITIES
Table 4.1
Comparison of software application peculiarities
Description Software in
company X
Software in
company Y
Functions
Does it cover all the standards functionality? + -
Does it have functions according to requirements of
customer?
+ -
Does it cover standards like GRI, EMAS? + -
Is it a cloud based software? - +
Does it have administrative functionality + -
Does it have production functionality + -
Does it have materials requirement planning
functionality?
+ -
Does it have acceptance and rejects order functionality? + -
Does it have financial functionality? + +
Does it have inventory functionality? + +
Can it be uploaded to another system with similar
software?
+ -
Curbing Bull-Whip effect
Does it avoid multiple demand forecasting? + +
Breaking order batches + -
Does it stabilize prizes + -
Eliminate shortage of gaming + +
Are there functionality to just for Bull-Whip + -
Usability
Can a person without prior knowledge about software use
it?
- +
Is there special guidelines for operating? + +
Is it updated for easier use often + -
Do all employees use it? + -

58
Are the functions simple to use? - +
Customer Satisfaction
Are all the customers satisfied with price? - +
Does customer demands over time fulfilled always? + -
Do they conduct user training functions often? + -
Is the customer feedback effective? + -
Do they have repeated customers? + +
Are the feedbacks of customers valued the most? + -
Does it fulfil all types of customer? + -
Does they interact with customers face to face to know
what they really want?
+ -
Safety
Are they prone to malicious viruses? + -
Do they have effective system to stop them? + +
Are there effective data storage systems? + -
Do they provide a virus free guarantee from the software? + -
Do they provide security affirmation to their data? + -
Output
Do they guarantee reports professionally? - +
Do they need a professional for using it to generate the
outputs effectively?
+ -
Do they stake holders always have access to the outputs? + +
Can they generate a report by a key stroke? - +
Do they need a setup a database for outputs? + -
Professionalism
Can this software be used to develop professional
financial reports?
+ +
Can this software be used to develop professional
sustainability reports?
+ +
Can this software be used to develop professional CO2
emission reports?
+ +
Can this software be used to develop reports based on
standards such GRI, ISO etc.?
+ +
Can this software be displayed to the customer? + -

59
Functions: 360report unlike SAP does not have 12 functionalities, they just have three
different functionalities. SAP has more functional advantage over 360report. The software
360report cannot cover all the functional requirements of the customer. Both the software cover
standards like GRI, EMAS and so on. Only 360report is a cloud based software. The data base
of SAP is within the company only. SAP has got additional functionalities such as
administrative, production, material requirements planning, acceptance and rejection of order.
Both the software can be used to derive financial statements. All though only SAP can manage
financial functions. Inventory can be managed by both the software. 360report unlike SAP
cannot be loaded into another system with similar software.
Curbing the Bull-Whip effect: Both the software can be used to solve multiple demand
forecasting. Breaking order batching can only be done by SAP. This is because it requires
database and storage management. 360report does not have the ability to stabilize prices. Both
the companies have the inventory visible throughout the supply chain. This gives the company
to act on eliminating gaming shortage. However, 360report does not have any functional
modularity for just curbing the Bull-Whip effect.
Usability: SAP requires prior knowledge about the functional module of the software
before one can operate it. Customer demands over time are always fulfilled in SAP because
they are aligned only according to the requirements of the customer. It is also updating very
often. This gives the latest software for customers to use. Not all employees use 360report in
the company Y. In the case of company X all employees use SAP. All the functions are not
simple to use in SAP unlike 360report.
Customer satisfaction: Many of customer initially think that SAP is not worth the price
the pay. However the top management and people who use the product on a regular basis tend
to have a positive opinion about the product. In the case of 360report customers are always
happy to buy the product for its pricing. Customer demands are always not fulfilled by
360report. In the case of SAP they always try to fulfil the demands of customer. The feedback
is effective in the case of SAP and hence they have repeated customers buying more of module.
SAP fulfils all its customers but in the case 360report, they focus on fulfilling customers of
small and medium sized organizations.

60
Safety: Unlike 360report SAP have effective protection system for their data. They have
virus guarantee for free in their system. They provide confirmation that no data would be lost
from their end even in case of a computer crash.
Output: SAP promises a professional output to their customers. 360 report does not
promise this to the customers. 360report do not need a professional to generate the report, but
in SAP they need one. SAP cannot generate a report by just a key stroke, it needs authorization,
validation but 360report it is possible. They both have their stake holders always in the loop for
their data. In the case SAP they need to have a data base for outputs, in the case of 360report
they automatically provide the output.
Professionalism: Both the software can develop reports, which can be used as financial
reports. The two software develop professional sustainability reports. There are a lot similarities
in the CO2 reporting and both the reports are professional. Both SAP and 360report follow
standards such as GRI, EMAS, ISO and such standards. However 360report cannot be displayed
to customers as the software might not have a professional approach as that of SAP.
Results of comparisons
Company X has a well-organized and a stabilized Supply Chain. They have a wide
knowledge domain and many people who are long term customers. This system of SAP is useful
for them and enhances their Supply Chain as a whole. It gives them a platform of standard and
operating system for uniform results. SAP is a domain, which is preferred by companies which
are in terms big sized enterprises. It is not advisable for a company to invest so much of money
into a management software when it comes to small or some medium sized enterprises.
Company Y is a medium sized enterprise, the software they use is not expensive. They
do not use the best software in the market but they have a frugal innovation. This is one of the
best moves in Company Y. Investing in a system that is used to manage their entire operations
is a good investment but not at the moment. They have to learn how to optimize their existing
system, make slight modification, see how it could be used and later maybe shift to another
system with bigger functions. It is better to ration the resources and know how to use them,
master the current resources and see what best can come out of it. If everything works out
well, it is undoubtedly the best for the company to shift a bigger and major producer.

61
CONCLUSIONS
Supply Chain is one of a vast and an expanding topic in a company. Any company that
is prone to exist to market for more than 5 years need to have a strong Supply Chain. A
company ceases to exist if the Supply Chain has some form of loop holes in it. However
effective the Supply Chain, so effective is the productivity of the company.
1. Analysis of Supply Chain Management constituents enclosed the critical factors such as
location, inventory, production, logistics and information. Possible ways of optimizing
them – effective management of the components using particular software.
2. Investigation of the working strategy of company X revealed the common problem that all
companies experience – the Bull-Whip effect. Theoretical solutions, derived to curb the
problem – breaking order batches, stabilizing prices, eliminating gaming in shortage and
avoiding multiple demand forecasting.
3. Analysis of the need for computer aided systems for supply chain management and the
software that is being used by particular companies’ revealed urgent need for efficient
software for managing the operations and various components of the company supply chain.
Main requirements for the software – inexpensive, simple, user friendly and efficient to
prepare the reports for auditing and internal uses.
4. After comprehensive analysis of the application peculiarities of existing software in the
company X, the advantages and disadvantages, the suggestions for improvement was
implemented in the software used in company Y. The developed software, implemented in
company Y, will increase sustainability of supply chain by reducing of inventory and
effective information management.

62
REFERENCES
1. McGraw Hill Publications, 2012 The Handbook of Technology Management: Supply Chain
Management, Marketing and Advertising and Global management
2. Giunipero, Patterson, Monczka, Handfield, 2009 South Western Centage Learning
Publishing, Purchasing and Supply Chain Management
3. Swink, Melink, Cooper, Hardley, MCGraw Hill Publication, 2014, Managing Operations
Across the Supply Chain.
4. Michael Quayle, Gwens Publishing House, 2012, Purchasing and Supply Chain.
5. Basic of Supply Chain Management, McGraw Hill Publications 2011. Rajesekhar.H.S
6. Carl Benedikt Frey and Michael A. Osborne, Linkoiuyugu Publishing, 2007,The Future OF
Employment: How Susceptible Are Jobs To Computerization
7. Robart Bronak, TMH Publications, 2012, Inventory Management System
8. Levy Witz. US AID Publications, 2012, Information Systems and Supply Chains
Management, Information Management
9. Michael Ansrekan,, David Launching Publications, 2010, Logistics and Supply Chain.
10. H.Donald Radcliff, EBook Ten Rules of Supply Chain& Logistics Optimization
https://www.scl.gatech.edu/research/supply-chain/10rules.pdf
11. Adolfo Crespo, Springer Publications, 2010, Dynamic modelling for Supply Chain
Management-
12. Oracle Logistics Inventory. www.oracle.com
13. Oracle- Supply Chain Management. Manual. www.oracle/supplychain.com
14. Sap Inventory Management by Martin Murray:
http://logistics.about.com/od/supplychainsoftware/a/Sap-Inventory-Management By
Martin Murray. [checked 4-06-2014]
15. Introduction to SAP by Martin Murray
http://logistics.about.com/od/supplychainsoftware/a/SAP.htm {checked 4-06-2014}
16. [15 ] SAP Business One http://en.wikipedia.org/wiki/SAP_Business_One{checked 4-06-
2014}
17. [16] NUIT Erp Projects.http://nuitprojects.in/erp-projects/ {checked 4-06-2014}
18. Mentzer, J. T., DeWitt, W., Keebler, J. S., Min, S., Nix, N. W., Smith, C. D., & Zacharia,
Z. G. (2001). Defining supply chain management. Journal of Business logistics, 22(2), 1-
25.
19. Croson, R., & Donohue, K. (2006). Behavioral causes of the bull-whip effect and the
observed value of inventory information. Management Science, 52(3), 323-336.

63
20. Lee, H. L., Padmanabhan, V., & Whang, S. (2004). Information distortion in a supply chain:
the bullwhip effect. Management science, 50(12_supplement), 1875-1886.
21. Dejonckheere, J., Disney, S. M., Lambrecht, M. R., & Towill, D. R. (2003). Measuring and
avoiding the bullwhip effect: A control theoretic approach.European Journal of
Operational Research, 147(3), 567-590.
22. Zhou, H., & Benton Jr, W. C. (2007). Supply chain practice and information
sharing. Journal of Operations Management, 25(6), 1348-1365.
23. Li, S., & Lin, B. (2006). Accessing information sharing and information quality in supply
chain management. Decision support systems, 42(3), 1641-1656.
24. Lee, H. L., So, K. C., & Tang, C. S. (2000). The value of information sharing in a two-level
supply chain. Management science, 46(5), 626-643.
25. Lee, H. L., & Whang, S. (2000). Information sharing in a supply chain.International
Journal of Manufacturing Technology and Management, 1(1), 79-93.
26. Whang, S. (2000). Information sharing in a supply chain. International Journal of
Technology Management, 20(3/4), 373-387.
27. UUSIPAAVALNIEMI, S., JUGA, J., & SANDHU, M. Information Sharing in Service
Supply Chain.
28. Magna Closures http://www.theglobeandmail.com/report-on-business/economy/canada-
competes/how-magnas-door-latch-is-teaching-canadas-manufacturers-to-compete-with-
china/article9235011/?page=all [Checked 28.05.2015]
29. www.magna.com /financial update [Checked 28.05.2015]

64
APPENDIXES
Fig A.1 Latest advancements in the software

65
Fig A.2 Integrating it for the entire Supply Chain

66
Fig A.3 Input text

67
Fig A.4 Output Texts

68
Fig A.5 Output texts 2
Recommended