Embed Size (px)
Citation preview
8/14/2014
VELCO Board of Directors
Meeting August 7, 2014
VT Transco – RNS Revenue
8/14/2014 2
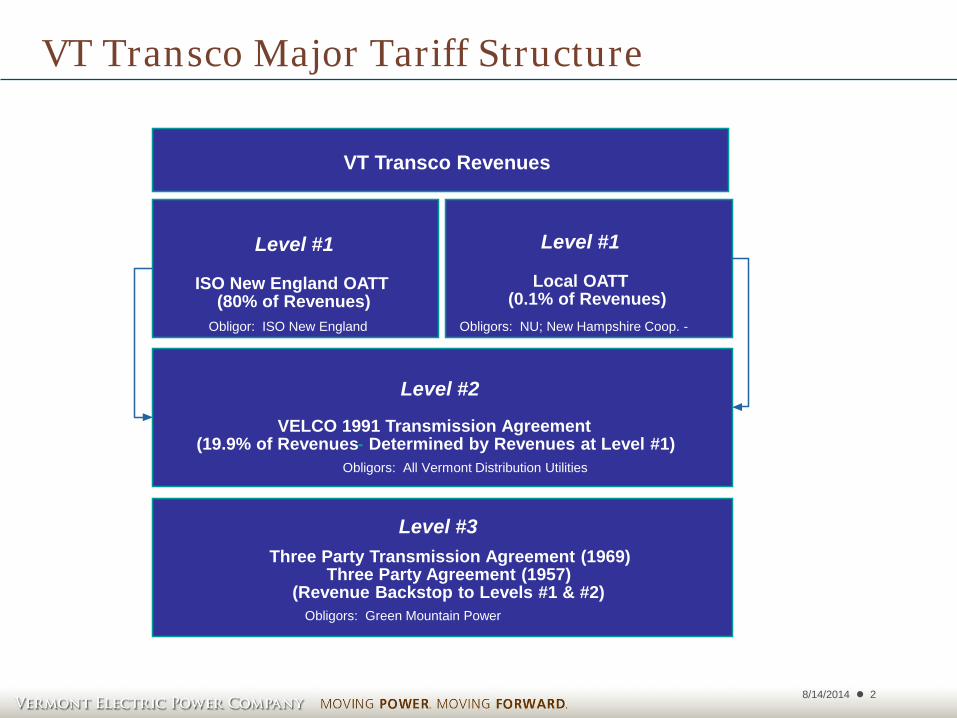
VT Transco Major Tariff Structure
VT Transco Revenues
Level #1
ISO New England OATT (80% of Revenues)
Level #1
Local OATT (0.1% of Revenues)
Level #2
VELCO 1991 Transmission Agreement (19.9% of Revenues - Determined by Revenues at Level #1)
Level #3 Three Party Transmission Agreement (1969)
Three Party Agreement (1957) (Revenue Backstop to Levels #1 & #2)
Obligor: ISO New England Obligors: NU; New Hampshire Coop. -
Obligors: All Vermont Distribution Utilities
Obligors: Green Mountain Power
8/14/2014 3
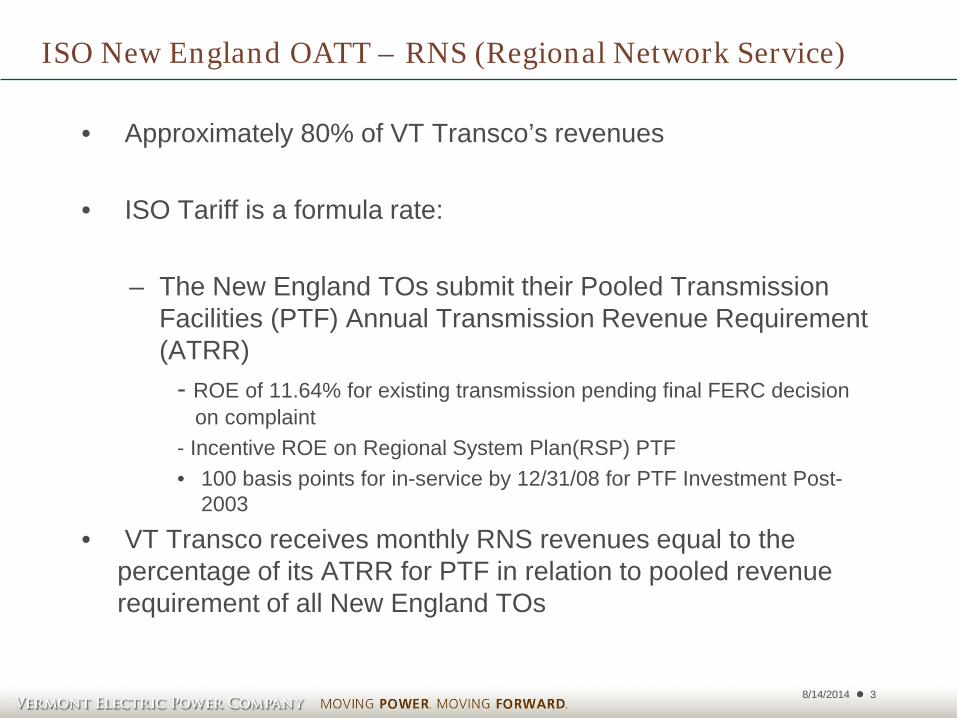
ISO New England OATT – RNS (Regional Network Service)
• Approximately 80% of VT Transco’s revenues
• ISO Tariff is a formula rate:
– The New England TOs submit their Pooled Transmission Facilities (PTF) Annual Transmission Revenue Requirement (ATRR)
- ROE of 11.64% for existing transmission pending final FERC decision on complaint
- Incentive ROE on Regional System Plan(RSP) PTF • 100 basis points for in-service by 12/31/08 for PTF Investment Post-
2003
• VT Transco receives monthly RNS revenues equal to the percentage of its ATRR for PTF in relation to pooled revenue requirement of all New England TOs
8/14/2014 4
ISO New England OATT (continue)
• Updated Annually • Effective June 1 • Reflects
– Previous Calendar year data – source FERC Form 1
– Forecasted RNS revenue requirement
• Product of expected PTF additions and the PTO’s carrying charge
– Annual true-up
• Difference between prior year’s RNS revenue requirements (including forecast) and current year RNS revenue requirements reflecting actual costs
• Annual true-up & interest reflected in the RNS revenue requirements effective for the next rate year
8/14/2014 5
ISO New England OATT (Previous Calendar Year, Forecast and Annual True-up)
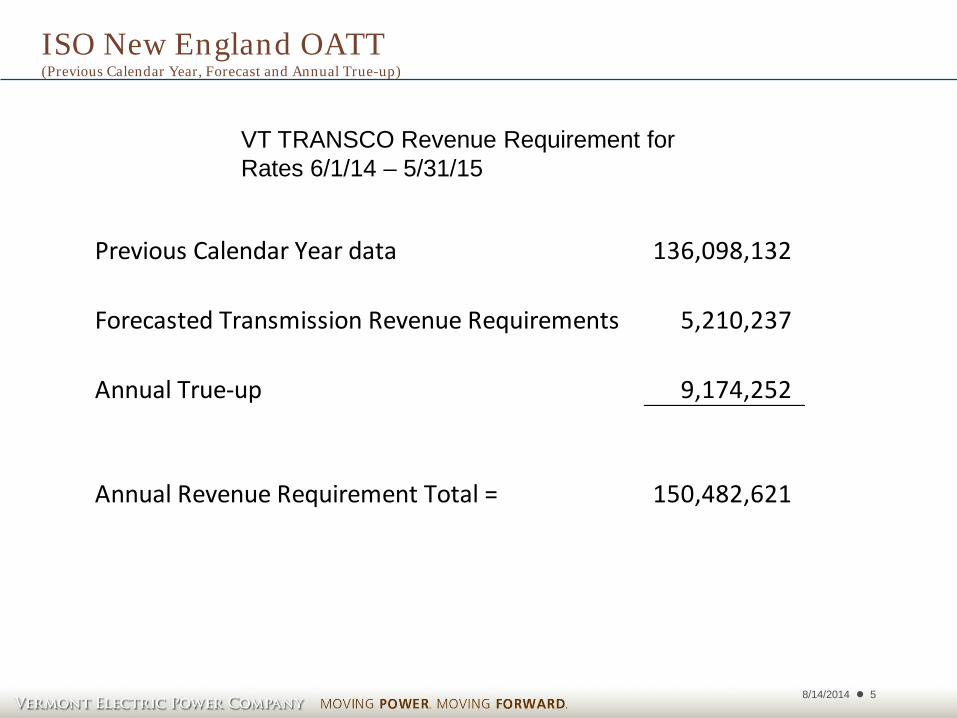
VT TRANSCO Revenue Requirement for Rates 6/1/14 – 5/31/15
Previous Calendar Year data 136,098,132
Forecasted Transmission Revenue Requirements 5,210,237
Annual True-up 9,174,252
Annual Revenue Requirement Total = 150,482,621
8/14/2014 6
ISO New England OATT – Influences on RNS Revenue
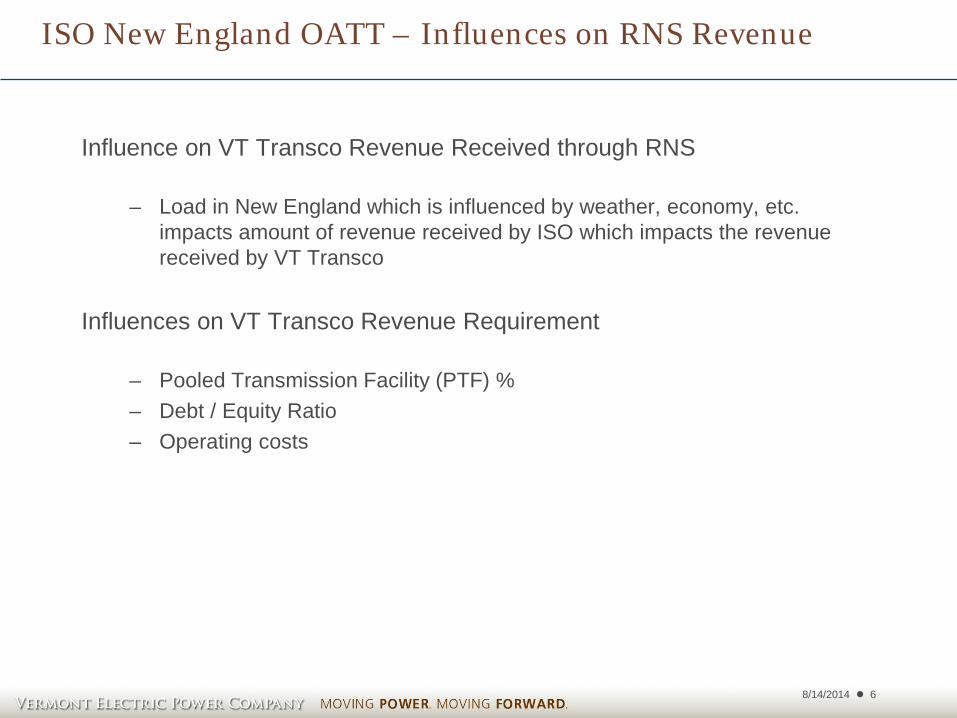
Influence on VT Transco Revenue Received through RNS – Load in New England which is influenced by weather, economy, etc.
impacts amount of revenue received by ISO which impacts the revenue received by VT Transco
Influences on VT Transco Revenue Requirement
– Pooled Transmission Facility (PTF) % – Debt / Equity Ratio – Operating costs
8/14/2014 7
Summary of RNS Rate Change
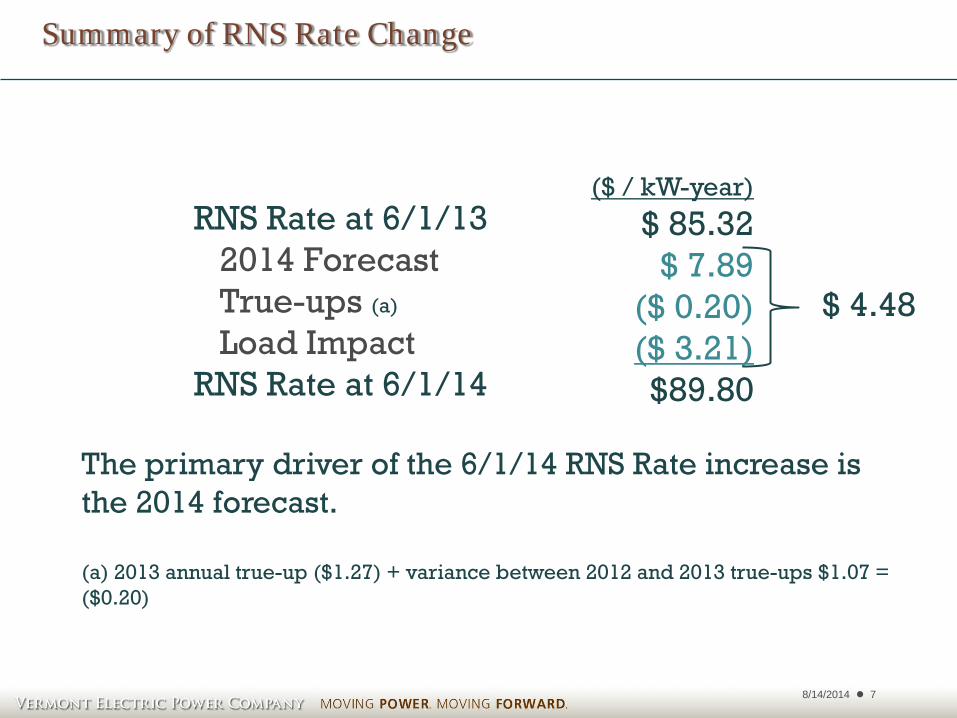
($ / kW-year)
$ 85.32 $ 7.89
($ 0.20) ($ 3.21) $89.80
RNS Rate at 6/1/13 2014 Forecast True-ups (a)
Load Impact RNS Rate at 6/1/14
$ 4.48
The primary driver of the 6/1/14 RNS Rate increase is the 2014 forecast. (a) 2013 annual true-up ($1.27) + variance between 2012 and 2013 true-ups $1.07 = ($0.20)
8/14/2014 8
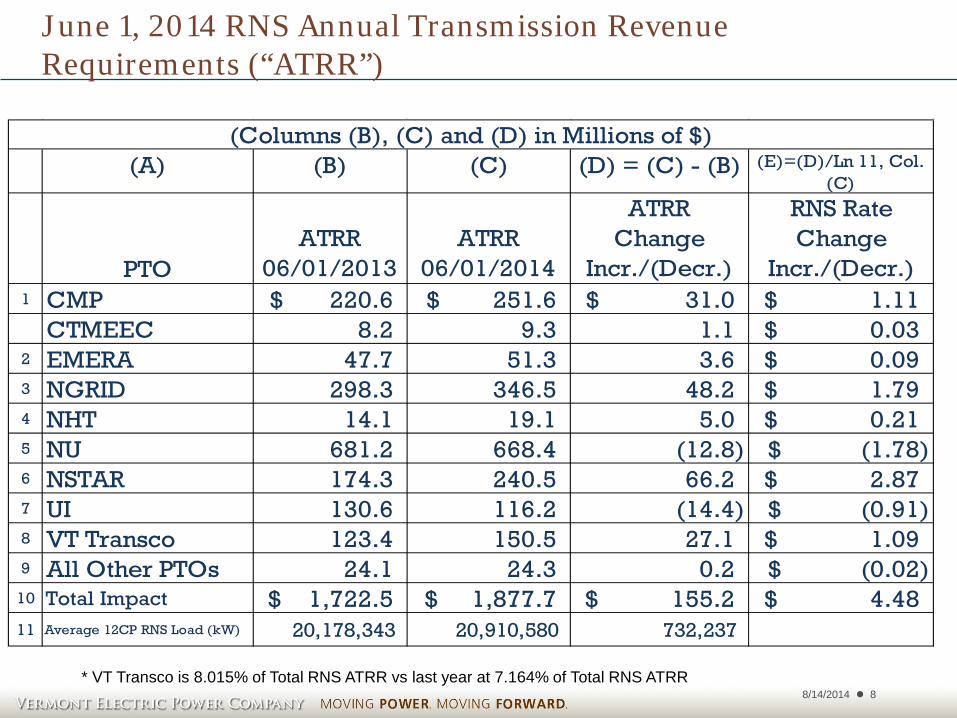
June 1, 2014 RNS Annual Transmission Revenue Requirements (“ATRR”)
* VT Transco is 8.015% of Total RNS ATRR vs last year at 7.164% of Total RNS ATRR
(A) (B) (C) (D) = (C) - (B) (E)=(D)/Ln 11, Col. (C)
PTOATRR
06/01/2013ATRR
06/01/2014
ATRRChange
Incr./(Decr.)
RNS Rate Change
Incr./(Decr.)1 CMP 220.6$ 251.6$ 31.0$ 1.11$
CTMEEC 8.2 9.3 1.1 0.03$ 2 EMERA 47.7 51.3 3.6 0.09$ 3 NGRID 298.3 346.5 48.2 1.79$ 4 NHT 14.1 19.1 5.0 0.21$ 5 NU 681.2 668.4 (12.8) (1.78)$ 6 NSTAR 174.3 240.5 66.2 2.87$ 7 UI 130.6 116.2 (14.4) (0.91)$ 8 VT Transco 123.4 150.5 27.1 1.09$ 9 All Other PTOs 24.1 24.3 0.2 (0.02)$
10 Total Impact 1,722.5$ 1,877.7$ 155.2$ 4.48$ 11 Average 12CP RNS Load (kW) 20,178,343 20,910,580 732,237
(Columns (B), (C) and (D) in Millions of $)

8/14/2014 9
June 1, 2014 RNS Rates Regional Forecast Summary
8/14/2014 10
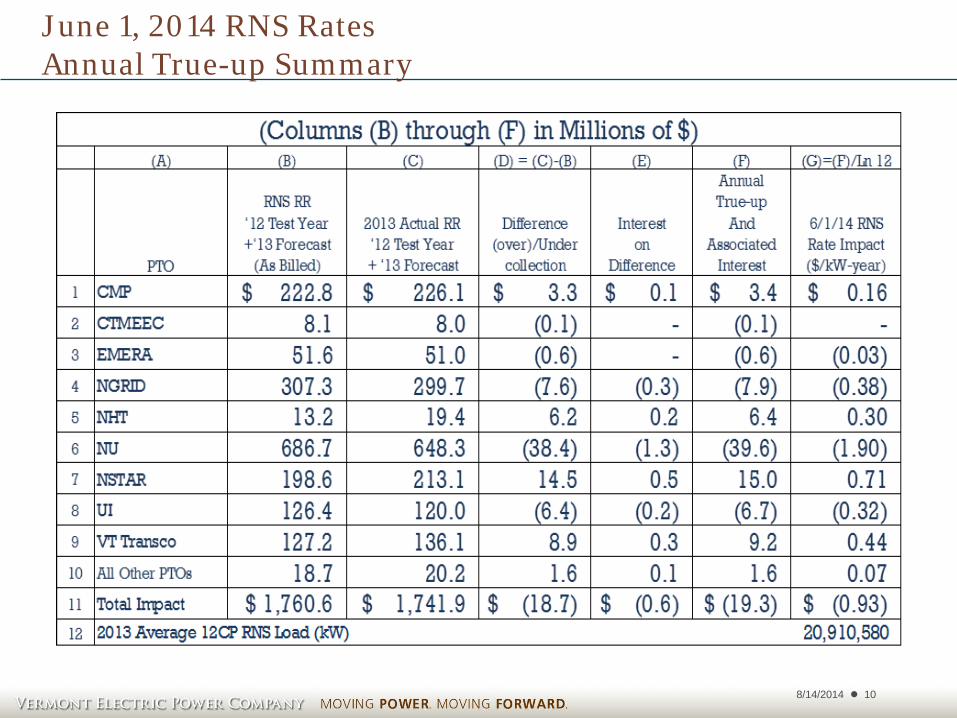
June 1, 2014 RNS Rates Annual True-up Summary
8/14/2014 11
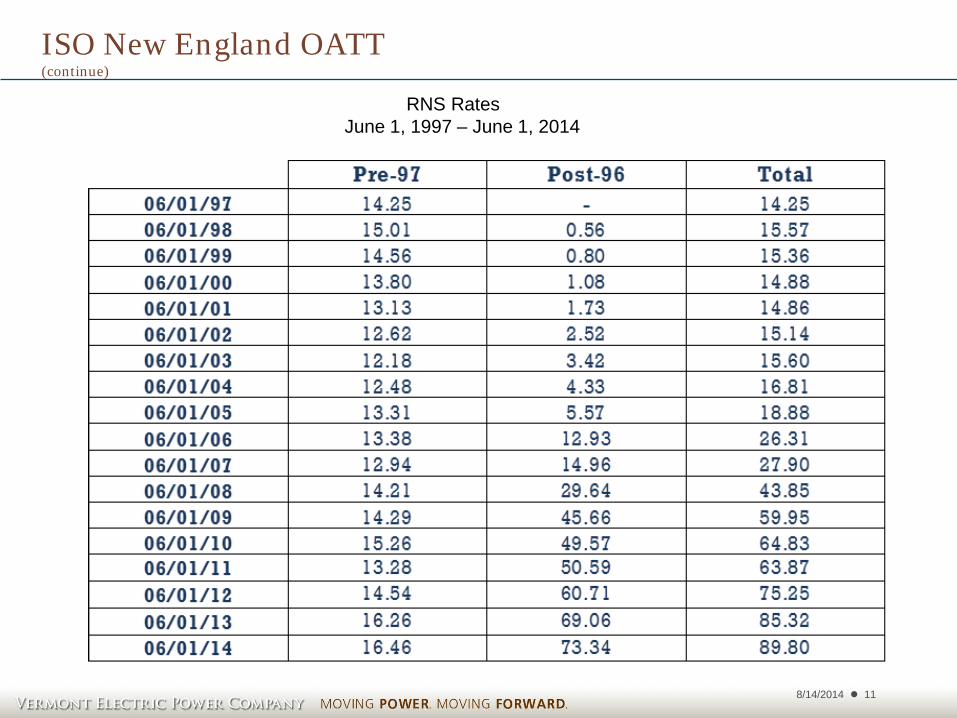
ISO New England OATT (continue)
RNS Rates June 1, 1997 – June 1, 2014
8/14/2014 12
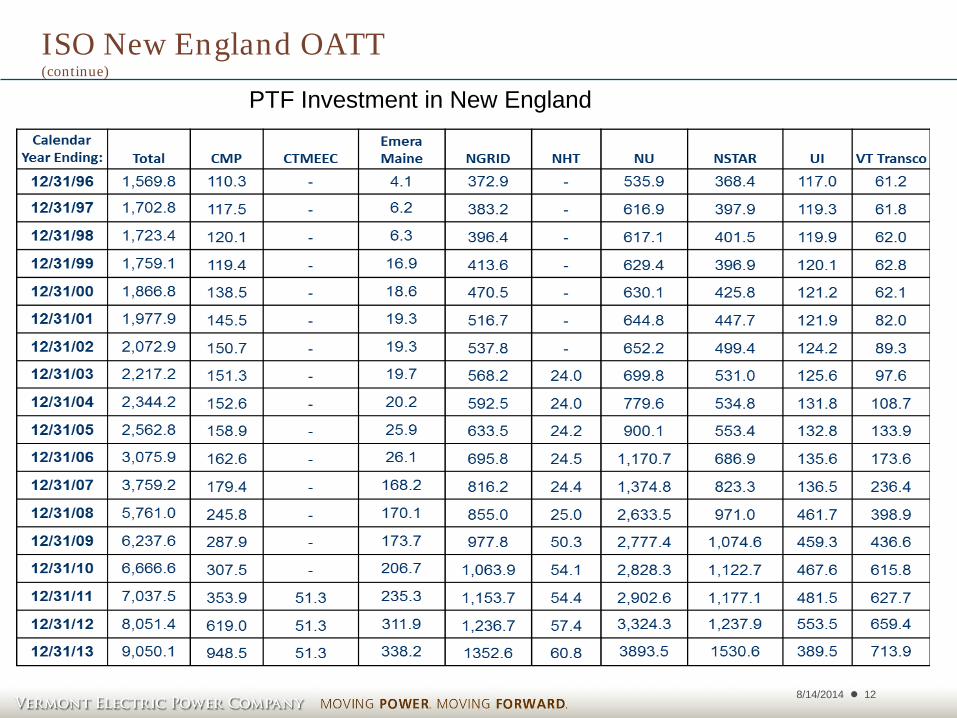
ISO New England OATT (continue)
PTF Investment in New England
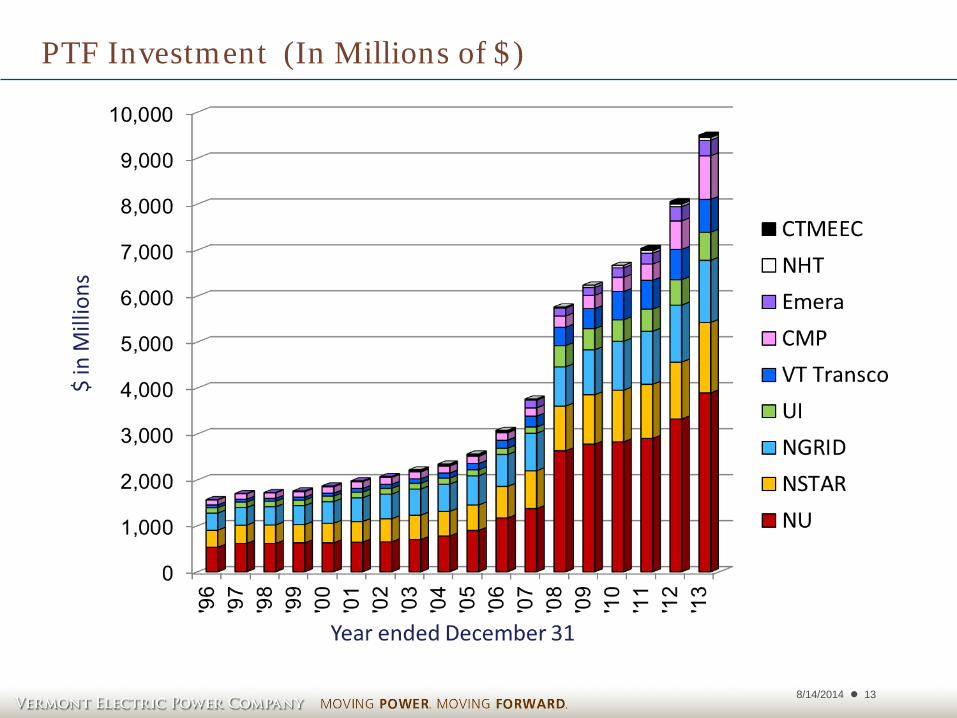
8/14/2014 13
PTF Investment (In Millions of $)
8/14/2014 14
RNS RATES – FIVE YEAR FORECAST
8/14/2014 15
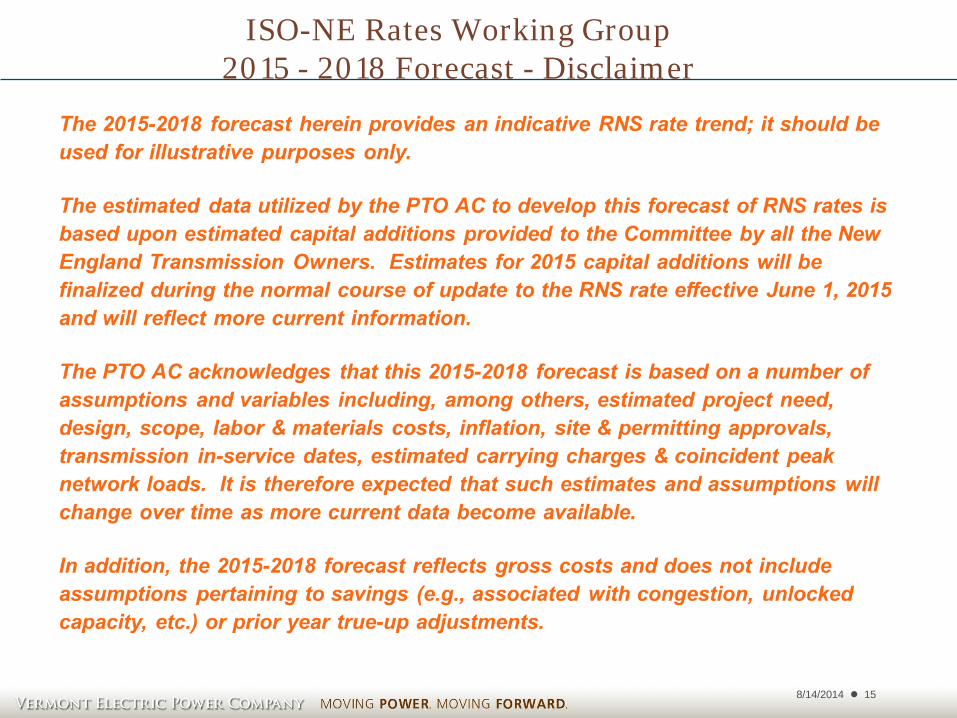
ISO-NE Rates Working Group 2015 - 2018 Forecast - Disclaimer

8/14/2014 16
2015 - 2018 Forecast - Summary
Forecast is preliminary and for illustrative purposes only. Estimates are consistent with the April 2014 RSP and do not reflect revised ISO forecasts. Figures may be off slightly due to rounding.
8/14/2014 17
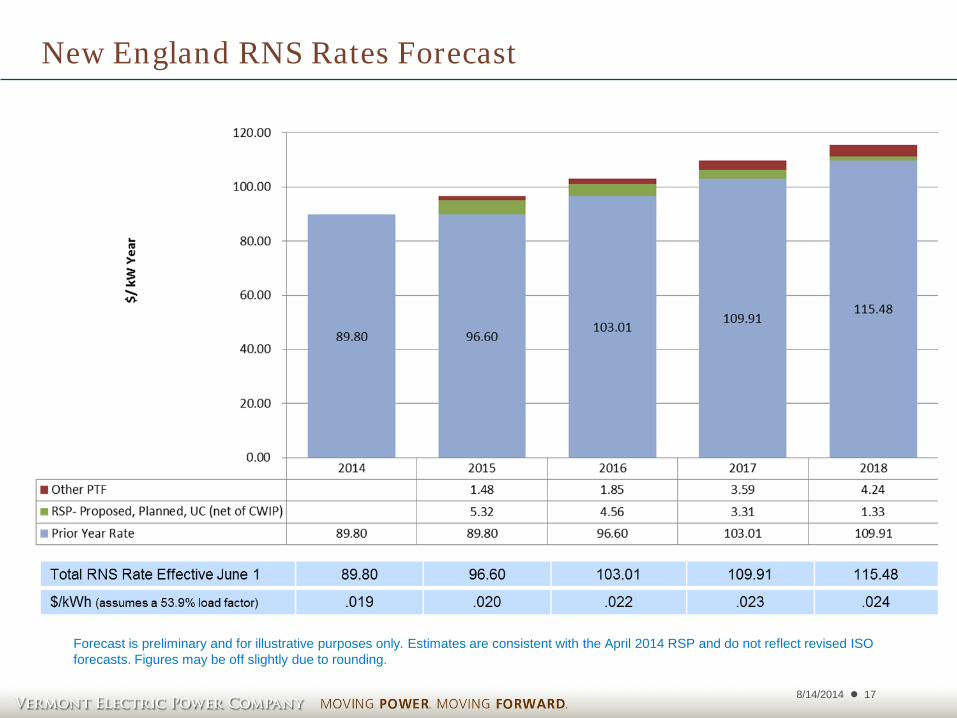
New England RNS Rates Forecast
Forecast is preliminary and for illustrative purposes only. Estimates are consistent with the April 2014 RSP and do not reflect revised ISO forecasts. Figures may be off slightly due to rounding.


![The VELCO STATCOM-Based Transmission System … Statcom Based...The VELCO STATCOM-Based Transmission System Project ... in the states of Vermont [16], Texas and California ... power](https://img.dokumen.tips/doc/110x75/5ae039447f8b9af05b8d62b1/the-velco-statcom-based-transmission-system-statcom-basedthe-velco-statcom-based.jpg)