Embed Size (px)
Citation preview

2018 Vermont Long-Range
Transmission Plan
June 29, 2018
2018 VERMONT LONG-RANGE TRANSMISSION PLAN PAGE 2
Message from VELCO CEO Tom Dunn
Rapid changes in the electric grid, and its regulatory environment, which formed the context for the 2015 Vermont Long-Range Transmission Plan—particularly lower loads and increases in distributed generation—have only accel-erated in the past three years. Where there was once a debate about whether change was really coming, today there’s broad consensus that a reformation—if not a revolution—is well underway in the way we produce, store, manage and use electricity. These changes present vast opportunities for the environment, economy and society. But the very nature of the changes demands a collaborative and thoughtful approach to anticipating challenges and planning in new ways. That’s why the 2018 Vermont Long-Range Transmission Plan is so important.
Vermont Electric Power Company (VELCO) constructs, owns and operates our state’s electric transmission system and must maintain the integrity of this critical infrastructure. State law and Public Utility Commission Order require VELCO to plan for Vermont’s 20-year transmission reliability needs and update this plan every three years. The legal requirements for the plan focus on our central mission: planning for electric system reliability as measured by man-datory standards set by the North American Electric Reliability Corporation (NERC).
The central obligation of this plan remains unchanged: identify where load growth or other changes may result in the need for system reliability investments, and share that information in sufficient time to consider alternatives to building poles and wires. But while that task seemed relatively straightforward in 2006, when our reliability plan-ning system was written into Vermont law, today it is far more complex. ISO New England has fully assumed its fed-erally designated responsibility for bulk transmission system planning as our Regional Transmission Organization. Vermont loads have declined, and energy efficiency and distributed generation have increased. Thus, it is increas-ingly vital that this plan go beyond a load-growth focused scope to address the implications of the trends that are reshaping our grid.
At its most basic level, this plan and related public engagement process were enacted to provide early, reliable analysis to utilities, policy makers and other stakeholders to ensure the full range of options remains open to Ver-mont to solve challenges to grid reliability at the least cost. In the past, the process achieved collaborative success in deferring over $150 million in transmission projects. Today’s issues are more complex, which makes credible analysis even more critical to inform decisions that have limited precedent in the traditional utility world.
This year’s plan has a new component: analysis of possible future scenarios based on current trends, such as in-creasing distributed generation, and state policies, like carbon reduction goals. We adopted this approach, with the input of the VSPC’s Forecasting Subcommittee, to anticipate possible futures that are not yet statistically evident, but are grounded in policy and practice. The high-solar scenario, in particular, reveals emerging reliability and eco-nomic challenges to grid operation.
The scenario discussion in this plan is not meant to question the underlying policy drivers; it is meant to inform deci-sions about how Vermont achieves its goals and the adaptive work that possible paths will demand of utilities and other stakeholders. At its essence, this is what planning is meant to do.
Thank you for taking the time to read and consider the 2018 Vermont Long-Range Transmission Plan and what it portends for our state and region. Many have worked hard on this document to make it as informative, readable, and up-to-date as possible. Above and beyond regulatory requirements, our intent is to foster dialogue as one im-portant contribution to Vermont’s public engagement on energy issues and policy.
Tom Dunn VELCO CEO

2018 VERMONT LONG-RANGE TRANSMISSION PLAN PAGE 3
Table of Contents Message from VELCO CEO Tom Dunn .......................................................................................................... 2
Table of Contents .......................................................................................................................................... 3
Introduction .................................................................................................................................................. 4
Issues addressed since the 2015 plan ........................................................................................................... 6
Analyzing the transmission system ............................................................................................................... 7
Mandatory reliability standards ................................................................................................................ 7
Funding for bulk system reliability solutions ............................................................................................ 8
A note about the planning horizon: 10 years vs 20 years ......................................................................... 8
Limitations in the scope of the plan.......................................................................................................... 9
Substation condition assessments ........................................................................................................ 9
Line condition assessments .................................................................................................................. 9
Study assumptions .................................................................................................................................. 10
Network topology ............................................................................................................................... 10
Generation .......................................................................................................................................... 11
Forecasting demand ........................................................................................................................... 15
Peak demand trends ........................................................................................................................... 18
Inherent uncertainties in the timing of need for reliability solutions ................................................ 20
Discussion of peak demand results ............................................................................................................. 27
Bulk system issues ................................................................................................................................... 27
Loss of load exposure ......................................................................................................................... 27
Effect of the high load scenario .......................................................................................................... 28
System issues classified as “predominantly bulk” .................................................................................. 29
Subsystem results ................................................................................................................................... 30
Discussion of solar PV results...................................................................................................................... 32
Analysis of the base solar PV scenario .................................................................................................... 32
Analysis of the high solar PV scenario .................................................................................................... 33
Summary of results ............................................................................................................................. 33
Analysis of 1000 MW PV under different system conditions ............................................................. 39
Optimized solar PV Distribution.......................................................................................................... 40
Observations from the results of the solar PV analysis .......................................................................... 46
Public input on the 2018 plan update......................................................................................................... 47
Glossary & Abbreviations ............................................................................................................................ 58
Glossary ................................................................................................................................................... 58
Abbreviations .......................................................................................................................................... 61

2018 VERMONT LONG-RANGE TRANSMISSION PLAN PAGE 4
Introduction Vermont law and Public Utility Commission (PUC) order require VELCO to plan for Vermont’s long-term electric transmission reliability, share our plan with Vermonters, and update that plan every three years. The plan’s purpose is to ensure Vermonters can see where Vermont’s electric transmission system may need future upgrades, and how those needs may be met through transmission projects or other alterna-tives. Ideally, the plan enables all manner of interested people—local planners, homeowners, busi-nesses, energy committees, potential developers of generation, energy efficiency service providers, land conservation organizations and others—to learn what transmission projects might be required, and how and where non-transmission alternatives, such as generation and load management, may contribute to meeting electric system needs at the lowest possible cost.
VELCO’s planning process is extensive and collaborative. The Vermont system is part of New England’s regional electric grid operated by ISO-New England (ISO-NE). ISO-NE is responsible for conducting plan-ning for the region’s high-voltage transmission system, under authority conferred on it by the Federal Energy Regulatory Commission (FERC). VELCO, along with the region’s other transmission owners and according to es-tablished processes, participates with ISO-NE in its planning and system operations to meet mandatory reliability standards set by the North American Electric Reliability Corporation (NERC), the Northeast Power Coordinating Council (NPCC), and ISO-NE.
The 2018 Vermont Long-Range Transmission Plan is the fourth three-year update of the Vermont 20-year transmission plan, originally published in 2006 and updated in 2009, 2012 and 2015. Much has changed since 2006. ISO-NE began operating as FERC’s designated Regional Transmission Organization for New England in 2005. Since then, ISO-NE has continually re-fined its regional planning process, and added staff, as it has assumed the planning authority it was granted by FERC. Also during this period, more rigorous, binding performance stand-ards for the high-voltage electric transmission system, and penalties for non-compliance, were authorized by Congress in response to the blackout of 2003, and adopted by NERC, NPCC and ISO-NE in 2007. These changes required that Vermont’s planning process coordinate closely with the regional planning work managed by ISO-NE.
In 2016, ISO-NE added tariff requirements to ensure fair com-petition among all qualified transmission project sponsors throughout the regional planning process to implement new procedures established by the FERC through its Order 1000, which introduced competition in the electric transmission sector. Today, VELCO receives system study information and is invited to provide comments at the same time as other mem-bers of the ISO-NE planning Advisory Committee.
ISO-NE and VELCO completed a NERC planning assessment in 2016 as required by the recently approved
VELCO TRANSMISSION LINES AND TIES TO NEIGHBORING STATES AND CANADA
VELCO Facts 732 miles of trans-
mission lines 13,000 acres of
rights-of-way 53 substations Equipment that en-
ables intercon-nected operations with Hydro-Québec

2018 VERMONT LONG-RANGE TRANSMISSION PLAN PAGE 5
NERC TPL-001-41 planning standard. The ISO-NE NERC planning assessment utilized the results of the 10-year needs and solutions studies of the Vermont and New Hampshire systems completed in 2014. ISO-NE supplemented these results with stability and short-circuit studies completed in 2016 to meet the requirements of the NERC planning standard. The VELCO NERC planning assessment included a new steady state analysis as well as more extensive stability and short-circuit studies required by the newly revised TPL-001-4 standard. The VELCO and ISO-NE studies indicated a need for system protection im-provements that, for the sake of efficiency, will be achieved concurrent with already planned VELCO substation asset condition projects. System protection deficiencies are not related to load growth, and do not increase capacity. In most cases, they do not require a Section 248 permit2, and cannot be ad-dressed by non-transmission alternatives.
This plan is based on ISO-NE’s and VELCO’s 2016 NERC TPL-001-4 planning assessment, which has a 10-year horizon consistent with the NERC TPL-001-4 standard. VELCO supplemented these 10-year studies in several ways to meet Vermont-specific planning requirements and to ensure the regional results were effectively translated to Vermont’s small share—approximately four percent—of the region’s electric demand.3 VELCO’s supplementary analyses frame Vermont’s reliability issues in a manner that facilitates development of alternatives to transmission solutions, consistent with Vermont legal and regulatory re-quirements. VELCO also conducted analysis beyond NERC planning standard’s 10-year horizon, analyzed the sub-transmission system4, included the effects of renewable energy programs and budgeted energy efficiency, and considered non-transmission alternatives as appropriate, all consistent with applicable Vermont policy.
The 2018 plan acknowledges a profound transformation happening on the electric grid. Many changes that are underway or on the horizon will challenge reliable operation of the system as traditionally de-signed and operated, and provide promising opportunities for new utility models and a more diverse grid. Key factors in the current transformation include retirement of traditional, base load generation, a significant increase in distributed renewable resources, investment in demand-side resources such as energy efficiency and demand response, and the impact of technological trends, such as heat pumps and electric vehicles. These trends have been reflected in the underlying load forecast for the 2018 plan. The plan includes narrative discussion of those trends that cannot yet be quantified with confidence.
Beginning on page 27, this plan shows the reliability needs on Vermont’s high-voltage, bulk electric sys-tem5. Predominantly bulk system issues begin on page 29 and sub-system issues follow, on page 30. The plan discusses the potential to address each issue with non-wires solutions. The plan also reflects the
1 TPL-001-4 establishes transmission system planning performance requirements for the bulk electric system (BES).
http://www.nerc.com/files/tpl-001-4.pdf
2 Title 30 subsection 248 establishes the requirements, criteria and process for obtaining approval to build or modify utility infrastructure. Ap-proval granted under this subsection is called a Certificate of Public Good or CPG.
3 Each New England utility funds a percentage of regional transmission projects based on its share of the total New England load.
4 Sub-transmission includes those portions of the grid that are not considered “bulk system,” i.e., they are above the distribution system level but at voltages below 115 kV, and their costs are not shared across the New England region. Generally, VELCO owns and operates the bulk system and some distribution utilities own and operate sub-transmission.
5 The bulk electric system, in the context of the plan, is the portion of the grid that is at 115 kV and above.

2018 VERMONT LONG-RANGE TRANSMISSION PLAN PAGE 6
considerable uncertainties in today’s environment due to the effects of changing energy policy and pro-duction trends. Finally, the plan discusses the review of a base solar PV forecast and a high solar PV sce-nario that will hopefully facilitate the statewide coordination of solar PV development.
Issues addressed since the 2015 plan The 2015 plan identified one major bulk system reliability concern and seven predominantly bulk relia-bility concerns requiring mitigation. A potential thermal concern projected to occur in 2028, based on the 2014 load forecast, did not require mitigation because the timing was so far in the future. The plan also identified several subsystem issues to be further investigated by the distribution utilities. Some pre-viously noted issues have been resolved by planned upgrades. Other concerns have been postponed by lower-than-anticipated load levels.
The 2017 load forecast now projects lower peak demand than was forecast in 2014, particularly during the first ten years of the 20-year planning horizon. Reasons include the lingering effects of the recession, load reductions due to ongoing energy efficiency programs, demand response, and the net effect of small-scale renewable generation.
The table below shows how the reliability concerns identified in the 2015 plan have been addressed or deferred. (For 2015 bulk system concerns, please refer to pages 23 to 26 of the 2015 plan. For predomi-nantly bulk system concerns see pages 27 and 28, and for subsystem issues see pages 29 and 30.)
DISPOSITION OF BULK AND PREDOMINANTLY BULK RELIABILITY ISSUES IDENTIFIED IN THE 2015 PLAN Item identified Page #s refer to 2015 plan
Identified deficiency Resolution or deferral of concern
Connecticut River Valley Pages 24-25
Overloads and voltage concerns for N-1 and N-1-1 conditions
Resolved by the Connecticut River Valley pro-ject
Rutland area Page 27
Overloads and loss of load for N-1 conditions
Resolved by the projects identified in the Rut-land Area Reliability plan and lower load levels
Northern area Page 28
Low voltage for N-1 conditions Resolved by lower load levels
Other reliability issues were predicted to occur near the 15-year timeframe based on the 2014 load fore-cast. No mitigation was required for those issues due to long horizon, and they are not listed in the above table. They will continue to be monitored in every planning cycle, including this current plan.

2018 VERMONT LONG-RANGE TRANSMISSION PLAN PAGE 7
Analyzing the transmission system The power system has been called the most complex machine in the world. In every second of every day the power supply must match power demanded by customers, or load. In areas where demand is greater than locally available supply, the electrical network must be robust enough to accommodate power imports from outside sources. Where supply is greater than local demand, the system accommo-dates the export of power only up to its capacity, referred to as an export limit, and grid operators main-tain export flows below system limits through various means including curtailment of generation. Since upgrades of electrical infrastructure generally require significant time and money, and modern society relies heavily on reliable power supply, planners must identify and address reliability concerns early without imposing unnecessary cost.
ISO-NE, VELCO, and other transmission system owners and operators are bound by federal and regional reliability standards to maintain the reliability of the high-voltage electric system. System planners use computer simulation software6 that mathematically models the behaviors of electrical system compo-nents to determine where violations of standards may occur under various scenarios or cases.
Establishing what scenarios to study—like all planning—involves making assumptions about the future. Some of these assumptions are dictated by federal, regional and state reliability criteria. Others reflect specialized professional skill, such as forecasting electric usage. Still others rely on understanding evolv-ing trends in the industry and society. Some of these factors involve greater uncertainty than others and involve longer or shorter time frames. The following section discusses some major assumptions or pa-rameters reflected in this transmission plan.
Mandatory reliability standards The criteria used to plan the electric system are set by the federal and regional reliability organizations, NERC7, NPCC8, and ISO-NE. These standards are the basis for the tests conducted in planning studies. Failure to comply with NERC standards may result in significant fines, and more importantly, unresolved deficiencies can lead to blackouts affecting areas in and outside Vermont.
As required by the standards, planners measure system performance under three increasingly stressed conditions to determine whether the system will remain within mandatory performance criteria under various operating scenarios. Planners analyze the system under three kinds of conditions.
1. All facilities in service (no contingencies; expressed as N-0 or N minus zero). 2. A single element out of service (single contingency; expressed as N-1 or N minus one). 3. Multiple elements removed from service (due to a single contingency or a sequence of contin-
gencies; expressed as N-1-1 or N minus one minus one).
In the N-1-1 scenario, planners assume one element is out of service followed by another event that oc-curs after a certain period. After the first event, operators make adjustments to the system in prepara-tion for the next potential event, such as switching in or out certain elements, resetting inter-regional tie
6 VELCO uses Siemens PTI Power System Simulator for Engineering (PSS/E).
7 NERC is the North American Electric Reliability Corporation, which is designated by the Federal Energy Regulatory Commission and Canadian authorities as the electric reliability organization for North America.
8 NPCC is the Northeast Power Coordinating Council, which is delegated authority by NERC to set regional reliability standards, and conduct monitoring and enforcement of compliance.
2018 VERMONT LONG-RANGE TRANSMISSION PLAN PAGE 8
flows where that ability exists, and turning on peaking generators in importing areas or backing down generators in exporting areas. In each scenario, if the software used to simulate the electric grid shows the system cannot maintain acceptable levels of power flow or voltage, a solution is required to resolve the reliability concern.
Funding for bulk system reliability solutions Because Vermont is part of the interconnected New England grid, bulk system transmission solutions in Vermont that are deemed by ISO-NE to provide regional reliability benefit are generally funded by all of New England’s grid-connected customers, with Vermont paying approximately four percent of the cost based on its share of New England load. Likewise, Vermont pays four percent of reliability upgrades else-where in New England. Facilities subject to regional cost sharing are called Pool Transmission Facilities or PTF. Most of the transmission reinforcement needs discussed in Vermont’s plans would likely be eligi-ble for PTF treatment.
Regional sharing of funding for transmission projects has been present in New England for more than a decade. Since 2008, through the creation of a regional energy market called the Forward Capacity Mar-ket (FCM), providers of generation and demand resources (energy efficiency and demand response) are compensated through regional funding for their capacity to contribute to meeting the region’s future electric demand. These capacity supplies may reduce the need for building transmission if properly lo-cated with respect to transmission system capacity and local load levels. Capacity and energy resources are part of a competitive market, and transmission upgrades necessary to connect new resources are funded by project developers, consistent with the requirements of ISO-NE’s transmission tariff. In con-trast, transmission upgrades needed to maintain reliable service to load are funded by all distribution utility customers pursuant to ISO-NE’s transmission tariff. Separation between markets and transmission is a basic principle in current FERC rules, which creates a barrier to regional cost sharing of non-transmis-sion alternatives, even when they are more cost-effective than a transmission upgrade. Vermont contin-ues to advocate regionally for funding parity between transmission and non-transmission options to en-sure the most cost-effective alternatives can be chosen to resolve a system constraint.
A note about the planning horizon: 10 years vs 20 years Vermont regulations require VELCO to plan using a 20-year horizon. Federal NERC standards and long-term studies performed in New England use a 10-year horizon. The longer the horizon of a planning analysis, the more uncertain its conclusions due to uncertainties regarding load level predictions, gener-ation, system topology, technological developments, changes to planning standards, and changes to public policy that impact how the transmission system will be utilized. This report reflects VELCO’s 20-year analysis; however, the main focus is on the 10-year period through 2028. Results beyond 10 years were used to examine system performance trends, evolving system needs, the effects of increased de-mand, and longer-term solution options. This approach was reviewed with the Vermont System plan-ning Committee (VSPC).9
9 The Vermont System planning Committee is a collaborative process, established in Public Service Board Docket 7081, for addressing electric
grid reliability planning. It includes public representatives, utilities, and energy efficiency and generation representatives. Its goal is to ensure full, fair and timely consideration of cost-effective “non-wires” solutions to resolve grid reliability issues. For more information see https://www.vermontspc.com .
2018 VERMONT LONG-RANGE TRANSMISSION PLAN PAGE 9
Limitations in the scope of the plan The projects covered in this plan include transmission system reinforcements that address transmission system reliability deficiencies as required by Vermont law and regulation as articulated in Title 30, sub-section 218c of Vermont Statutes and the PUC Docket 708110. As such, the plan may not include all transmission concerns that must be addressed in the coming period. VELCO sought input in multiple phases during its analysis to identify all load-serving concerns that may require system upgrades; how-ever, some concerns may not have been identified due to insufficient information, unforeseen events, new requirements, or the emergence of new information.
In addition, from time to time, VELCO must make improvements to its system to replace obsolete equip-ment, make repairs, relocate a piece of equipment, or otherwise carry out its obligations to maintain a reliable grid. While VELCO has in place a process for identifying degraded equipment before failures oc-cur, equipment degradation sometimes happens unexpectedly, and VELCO addresses these concerns quickly. The transmission plan requirements are not meant to include those asset condition or routine projects that are proposed to maintain existing infrastructure in acceptable working condition. Some-times these activities require significant projects, such as the refurbishment of substation equipment and the replacement of a relatively large number of transmission structures to replace aging equipment or maintain acceptable ground clearances. Although the plan requirements do not apply to these types of projects, VELCO is listing these projects for the sake of information. These projects are needed to maintain the existing system, not to address system issues resulting from load growth, and VELCO rou-tinely shares plans for many of these projects with the VSPC as part of its non-transmission alternatives (NTA) project screening process. The formal NTA screening tool employed in this process11 “screens out” projects that are deemed “impracticable” for non-transmission alternatives because they are specifically focused on resolving asset condition concerns. Below are currently known VELCO asset condition assess-ments that may or may not lead to asset condition projects.
SUBSTATION CONDITION ASSESSMENTS
St Albans—VELCO conducted an assessment of this substation, and determined that its degraded condi-tion required mitigation. The project screened out of a detailed NTA analysis, and a Certificate of Public Good was received in April 2018.
Barre—VELCO conducted an assessment of this substation, and determined that its degraded condition required mitigation. The project screened out of a detailed NTA analysis, and a section 248 permit appli-cation has been filed with the PUC.
VELCO is assessing the Sand Bar, Berlin, Florence and Windsor substations, and the scope of potential refurbishments is unclear at this time.
LINE CONDITION ASSESSMENTS
VELCO’s assessment of its transmission line structures revealed a large number of structures in various stages of degradation. Due to the number of structures affected, VELCO determined that it would be necessary to accelerate its maintenance activities by replacing 300 structures per year beginning in 2014
10 Links to these documents are provided on the VSPC website at https://www.vermontspc.com/about/key-documents
11 The two non-wires alternatives screening tools used by Vermont utilities are available on the VSPC website at https://www.ver-montspc.com/about/key-documents

2018 VERMONT LONG-RANGE TRANSMISSION PLAN PAGE 10
and returning to a normal rate of structure replacement of 100 structures per year in 2019. At the end of 2017, approximately 1500 structures had been replaced under this accelerated effort.
VELCO has assessed the 17-mile K42 line, between the Highgate and Georgia substations. VELCO has not been able to take the line out service for repair in quite some time. The assessment indicated that ap-proximately 50 percent of the poles need to be replaced in the near future, and nearly all poles need to be replaced from three to 15 years from now. Further analysis will be conducted to determine whether to rebuild the line entirely or piecemeal. It may be necessary to rebuild the line alongside the existing line to minimize reliability impacts and outages of generators and imports.
Study assumptions When performing a study, system planners pay attention to three main parameters: (1) the electrical network topology, (2) generation, and (3) the electrical demand or load. Assumptions regarding these parameters serve as the foundation for the analysis underlying this plan.
NETWORK TOPOLOGY
The analysis models the electrical network in its expected configuration during the study horizon. Plan-ners model new facilities and future system changes only if they have received ISO-NE approval, which provides a level of certainty that the facility will be in service as planned.
Assumptions regarding Plattsburgh-Sand Bar imports along existing facilities
The flow of power from New York to Vermont over the Plattsburgh-Sand Bar transmission tie was mod-eled at or near zero megawatts (0 MW) pre-contingency. System constraints in New York have led New York to request that studies assume 0 MW will flow over the tie, and that, under certain conditions, Ver-mont will export to New York. This assumption is more conservative in cases where insufficient capacity exists to serve Vermont load, but is also conservative from the New York perspective during heavy wind generation and lower load levels. The recently completed ISO-NE 10-year study found no system con-straints aggravated by the tie flow at 0 MW.
No “elective” transmission, or market-related projects in the plan
ISO-NE’s tariff includes a process for considering transmission projects needed to connect generation to markets and to increase the capacity of a transmission corridor that otherwise limits the ability to move electrical power from one part of the system to another. Such projects, needed for purposes other than ensuring reliability, are categorized as elective transmission, and are financed by the project developer, not end-use customers.
Regarding the class of transmission projects called Elective Transmission Upgrades (ETU) that were pro-posed as a means to import energy from New York or Canada to and through Vermont, VELCO modeled these ETUs and their associated upgrades out of service, because although some of them have been ap-proved by ISO-NE, they are quite uncertain due to the complex economic constraints involved. The price of energy at the receiving end of the proposed transmission projects would include both the cost of en-ergy at the sending end and the cost of the transmission facilities, which tend to handicap these projects when compared to most generation projects. Therefore, the financial viability of these projects is greatly improved if a buyer is willing to pay a premium for other benefits, such as renewable energy, capacity value, and the ability to address system concerns, such as high short-circuit levels, unacceptable system voltages and transmission constraints.

2018 VERMONT LONG-RANGE TRANSMISSION PLAN PAGE 11
In addition, the ETU projects were not modeled in service because the long-range plan analysis would not provide any more information than the projects’ ISO-NE system impact studies, which were compre-hensive by evaluating both import and export conditions. The system impact studies identified the need for several system upgrades to address system concerns that would arise if the ETUs were constructed.
GENERATION
All Vermont generators are modeled in service unless a basis exists to model them out of service. Until recently, New England studies began by assuming two significant generation resources in the study area were out of service. This assumption was based on the sufficiently high and historically demonstrated expectation that any two resources can be unavailable due to planned outages or unforeseen events. While significant for some New England states, this assumption is not as significant for Vermont because of our limited generation portfolio. Vermont generators are small and the vast majority of them are not base load generators, which are expected to run at or near full capacity nearly every day for hours at a time. The largest Vermont generator is a 65 MW wind plant that would be characterized as an intermit-tent resource since its output varies as wind speed varies. The next largest generator is a 50 MW wood-burning plant whose operation approaches that of a base load generator. Other base load plants are rated 20 MW or less and total approximately 30 MW. Therefore, this 50 MW generator was the only re-source considered significant and modeled out of service in this analysis.
ISO-NE has recently developed a new process for determining the amount of generation that should be assumed out of service prior to testing outage events. The new process is the result of a careful evalua-tion of overlapping probabilities of generation outages and load levels, and it has been adopted and de-ployed in the ten-year studies that have recently started. During the development of this process, ISO-NE predicted this probabilistically based dispatch can be skewed depending on the number and type of generation resources in the study area. ISO-NE’s first attempts at utilizing probabilistic dispatch yielded more severe generation outages pre-contingency, and ISO-NE had to modify the probabilistic approach by applying a two-generator outage limit to generators at an individual substation in order to prevent these dispatches from being unreasonable.
The Highgate Converter
The Highgate Converter is the point at which energy flows from Hydro-Québec (HQ) to Vermont’s elec-tric grid. The converter can carry the full amount contracted between HQ and Vermont distribution utili-ties during all hours of the year except periods of high demand that can affect the HQ system. Recent upgrades on the HQ system allow the converter to operate at its full 225 MW capacity12, but the con-verter currently operates slightly below this amount because the current 225 MW contract is located at the US border, not at the converter.
As described above, transmission planners begin testing the system by assuming that one or more signif-icant resources are out of service, simulating conditions that are not unusual in system operation. Alt-hough Highgate is a significant resource supplying Vermont load, Vermont stakeholders proposed, and ISO-NE agreed, not to include Highgate as a significant resource assumed unavailable in long-term needs
12 Accounting for losses, a slightly higher import amount, say 226 MW or 227 MW, needs to cross the US border to achieve 225 MW at the con-
verter without undue negative system effects on the HQ and Vermont systems.

2018 VERMONT LONG-RANGE TRANSMISSION PLAN PAGE 12
assessments prior to testing the impact of additional events or contingencies. While this assumption al-lowed the avoidance of potentially costly transmission reinforcements, it also increases exposure to cus-tomer-impacting events or the need to run costly generation in the event of a failure.
Vermont peaking generation
ISO-NE’s 10-year analysis counted 80 percent of peaking power capacity; however, historical data shows actual performance below this level. Thirteen Vermont generators with a nameplate capacity of approxi-mately 130 MW count as peaking resources—generators that are expected to run only during peak load conditions, or when demand is near system capacity, or during some form of system emergency. The ISO-NE system analysis considered 130 MW suitable for providing 10-minute reserves—resources able to get to full output within 10 minutes—and assumed 80 percent of those 130 MW would be turned on following an event or contingency meaning that 20 percent would fail to start or run when needed. The Vermont peaking units for the past ten years have performed well below the 80 percent assumption during emergency conditions. ISO-NE recently received FERC approval for a new market mechanism called “pay-for-performance,” which rewards generators that perform consistent with their market obli-gations and penalize those that do not. Pay-for-performance, which will start in 2018, may improve peaking generation, or some of these units may leave the market if they see the penalty risks as too high. For these reasons, VELCO modeled 70 percent of peaking power capacity for purposes of this long-range plan.
Hydro and wind generation
Consistent with ISO-NE study methodology, hydro generation was modeled at 10 percent of audited ca-pacity, and wind generation was modeled at 5 percent of nameplate capacity to represent expected summer conditions. The corresponding values for winter conditions were 25 percent for both hydro and wind generation.
Small-scale renewable generation
State policy, grant funding, federal tax incentives, and robust organizing and advocacy have greatly in-creased the amount of small-scale generation on Vermont’s distribution system. The legislature in 2012 and 2014 adopted proposals that further expanded state incentives for small-scale renewables. Two programs—net metering13 and standard offer program14—are assuring a market for the output of small scale renewables. New net metering rules that became effective on July 1, 201715, eliminate any annual cap on net metering expansion, and provide positive and negative adjusters to the price paid for excess generation depending on siting and the ownership of renewable energy credits. As of October 2017, the PUC has permitted approximately 160 MW of net metering capacity.
In 2013, the PUC modified the standard offer program to establish an annual solicitation at a pace dic-tated by statute, gradually increasing from the initial 50 MW amount to 127.5 MW. As of December 2017, approximately 63 MW of standard offer resources were in service, 81 percent of which were solar
13 Net-metering is an electricity policy for consumers who own small sources of power, such as wind or solar. Net metering gives the consumer
credit for some or all of the electricity they generate through the use of a meter that can record flow in both directions. The program is es-tablished under 30 V.S.A. § 219a.
14 For more information about the standard offer program see http://www.vermontstandardoffer.com/.
15 Rules are available on the PUC’s website at http://puc.vermont.gov/about-us/statutes-and-rules/proposed-changes-rule-5100-net-metering

2018 VERMONT LONG-RANGE TRANSMISSION PLAN PAGE 13
photovoltaic (PV) generation. Since January 2014, new standard offer installations include 0.6 MW of farm methane, 2.2 MW of hydro, and 33 MW of solar PV accounting for 92 percent of the total amount added since 2014. In this analysis, it was assumed that all future standard offer projects would be solar PV.
ISO-NE assumes that solar PV generators will contribute approximately 26 percent of their installed ca-pacity at the summer peak hour because of the timing of the New England-wide summer peak. Since so-lar PV effects have shifted the Vermont summer demand peak to after sundown, this analysis assumed that incremental solar PV would contribute approximately 2.5 percent of installed capacity, which coin-cides with the 7 PM peak hour noted in the 20-year load forecast. This assumption is somewhat optimis-tic because the summer peaks for years 2015, 2016 and 2017 have occurred at 8 PM, 9 PM, and 8 PM, respectively, times when solar PV generation is 0 MW. In addition, since winter peaks occur after dark, solar PV also contributes 0 MW in winter.
Lastly, in 2015 the Vermont legislature enacted a renewable energy standard (RES) and electric transfor-mation (ET) requirement16. The highlights are as follows.
• Total renewable requirement (55 percent by 2017 increasing to 75 percent in 2032), known as Tier 1—includes any vintage and large hydro.
• Distributed generation carve-out (1 percent of sales in 2017 increasing to 10 percent in 2032), known as Tier 2.
• Energy Transformation Projects (2 percent of sales in 2017 increasing to 12 percent in 2032), known as Tier 3—reduce fossil fuel use, which may be achieved through electrification of the thermal and transportation sectors through measures such as cold-climate heat pumps, weath-erization, and electric vehicles.
All of the above programs put Vermont on a path to meet the renewable energy goals set in the 2016 Vermont Comprehensive Energy Plan (CEP). These goals expand upon the statutory goal of 25 percent renewable energy by 2025, and they are noted briefly below.
• Reduce total energy consumption per capita by 15 percent by 2025, and by more than one third by 2050.
• Meet 25 percent of the remaining energy need from renewable sources by 2025, 40 percent by 2035, and 90 percent by 2050.
• Three end-use sector goals for 2025: 10 percent renewable transportation, 30 percent renewa-ble buildings, and 67 percent renewable electric power.
These renewable energy goals serve as an important backdrop for the 2018 plan.
Proposed generation projects in the ISO-NE interconnection queue
The 2018 analysis takes into account any new generators that have a capacity supply obligation, either through the ISO-NE FCM or through bilateral contracts. Conceptual or proposed projects were not con-sidered. Historically, many proposed generation projects ultimately withdraw their interconnection re-
16 Enacted as Act 56 of the 2015 Vermont General Assembly, codified in Title 30 Subsections 8002-8005 of the Vermont Statutes.

2018 VERMONT LONG-RANGE TRANSMISSION PLAN PAGE 14
quests due to financial difficulties, permitting, local opposition, inability to find customers and other fac-tors. Since the 2015 plan, several generation projects have withdrawn from the ISO-NE generation inter-connection queue, most of which consists of solar PV generation. The Deerfield 30 MW wind plant be-came commercial at the end of December 2017, and the Coolidge 20 MW solar PV plant is scheduled to be commercial by the end of 2018.
Vermont as a net importer
Vermont has roughly 850 MW of installed generation, which accounts for approximately 85 percent of the summer peak load; however, due to the performance characteristics of in-state generation, Ver-mont has relied heavily on its transmission network to import power from neighboring states. Following the shutdown of Vermont Yankee in 2014, Vermont has become a net importer of power at all hours from New York, New Hampshire, Massachusetts, and Canada in order to meet the state’s load require-ments. Without significantly new in-state generation, this situation will be a long-term operating condi-tion. The following graph shows how internal resources have contributed to serving Vermont load dur-ing the New England peak hour. While energy efficiency is not explicitly plotted, it is a resource that ISO-NE has acquired to reduce electrical demand during peak load periods.
VERMONT GENERATION DURING THE NEW ENGLAND PEAK HOUR
NG THE ELECTRIC DEMAND FORECAST Energy efficiency, demand response, standard offer and net metering are behind-the-meter resources that have reduced the demand that needs to be served, although energy efficiency and demand re-sponse that have a capacity obligation through the ISO-NE forward capacity market are treated like a transmission connected generator. Standard offer and net metering resources have reduced demand at the time of the ISO-NE peak from about 2 MW in 2012 to about 60 MW in 2016. Historical data from the

2018 VERMONT LONG-RANGE TRANSMISSION PLAN PAGE 15
past three peak summer and winter hours indicate that the transmission system is used to serve any-where from 80 to 95 percent of the peak load depending on the production of intermittent generation resources at the Vermont non-coincident peak hour. As will be discussed on page 19, the contribution of solar PV resources is lower at the Vermont peak hour because solar PV has moved the Vermont peak hour to after sundown.
FORECASTING DEMAND
The analysis models future electric demand consistent with the results of a load forecast completed in October 2017 by Itron, an energy firm that offers highly specialized expertise in load forecasting, under contract with VELCO. Planning studies for this long-range plan assume peak load conditions that occur during extreme weather conditions also called a “90/10” forecast, meaning there is a 10 percent chance that the actual load will exceed the forecast. This long-range plan analyzed summer and winter peak loads, as well as a lower load level, net of solar PV generation, which the transmission system would serve on a normal sunny day in spring.
The forecast of future demand for electricity is a critical input in electric system planning. The forecast determines where and when system upgrades may be needed due to inadequate capacity. Predicting future demand relies on assumptions about economic growth, technology, regulation, weather, and many other factors. In addition, forecasting demand requires projecting the demand-reducing effects of investments in energy efficiency and small-scale renewable energy. The following section summarizes the forecast underlying this plan. More detailed information about the forecast can be viewed at www.vermontspc.com/2017LoadForecast.
The following graphs depict the 20-year extreme weather, or 90/10, forecast adjusted for the effects of energy efficiency, demand response, the standard offer and net metering programs, and future load in-creases due to heat pumps and electric vehicles. The load forecast reflects long-term weather effects that do not vary significantly from year to year, and the forecast curve is smoother than actual peaks, which vary from year to year depending on weather conditions. The load forecast projects net summer peak load levels in 2018, 2028, and 2037 of 991 MW, 1000 MW, and 1092 MW, respectively. The corre-sponding net winter peak load levels are 960 MW, 977 MW, and 1054 MW, respectively. The net fore-casts take into account not only predicted energy efficiency effects, but also demand response that has qualified in the ISO-NE forward capacity auctions. This explains why the winter peak forecasts are lower than recent peaks. In fact, Vermont has been winter peaking in recent years.
The forecast not only projects that load reduction measures will decrease the summer peak load for at least ten years, it also projects that future heat pump and electric vehicle loads will start to increase the load to the point where the summer peak load will exceed the 1000 MW load level after 11 years. The highest summer peak in recent years was 1040 MW, which occurred in 2013, and the summer peak has been lower than 1000 MW for the last three years. The load forecast shows that the summer peak load will return to the 1040 MW load level after 16 years, and the 20-year summer peak forecast will not reach the historical all-time peak load level of 1120 MW set in 2006. This forecast was used to deter-mine the timing of reliability deficiencies in this 2018 plan update.
In developing the forecast, Itron incorporated the latest energy efficiency projection in collaboration with the Vermont Public Service Department (PSD), the Vermont Energy Investment Corporation (VEIC) and the VSPC, which includes representatives of the distribution utilities and the public. Itron employs an end-use model that essentially forecasts each consumption type—e.g., lighting, heating, cooling, and so on—that contributes to the overall load forecast. Regression analyses are then performed to capture economic growth effects, weather, and other factors affecting energy consumption and peak demand.

2018 VERMONT LONG-RANGE TRANSMISSION PLAN PAGE 16
Incorporating future energy efficiency
Despite the complexity of the current forecast, Vermont’s collaborative approach contributes to a ro-bust forecast that is understood and supported by a wide array of Vermont stakeholders. Similar to the previous forecast, the load forecast model captured a portion of the ongoing energy efficiency. The most recent analysis determined that the load model captured 90 percent of residential sector effi-ciency, compared to 80 percent in the 2015 analysis, so the 2018 plan applies 10 percent of the fore-casted energy efficiency to future loads to avoid double counting of energy efficiency effects. As more time passes, a greater proportion of ongoing energy efficiency will be captured by the model. Energy ef-ficiency is embedded in the load, and therefore is not plotted separately in the graphs below.
This approach is different from ISO-NE’s approach in which energy efficiency is forecast separately from the load and the amount is based on the energy efficiency that has cleared the ISO-NE forward capacity auctions plus future energy efficiency as estimated by the ISO-NE Energy Efficiency Forecast Working Group. Further, ISO-NE’s 10-year analysis included the effects of demand response that cleared the last forward capacity auction; however, there is no mechanism to forecast demand response beyond the last forward capacity auction, as demand response varies based on market forces, and can easily leave the market at any time. Demand response was modeled at 41 MW in the 2012 plan, 28 MW in the 2015 plan, and is now modeled at 26 MW in this plan based on the latest auction results.
PROJECTED VERMONT SUMMER PEAK LOAD AND ITS COMPONENT FORECASTS
NG THE ELECTRIC DEMAND FORECAST

2018 VERMONT LONG-RANGE TRANSMISSION PLAN PAGE 17
PROJECTED VERMONT WINTER PEAK LOAD AND ITS COMPONENT FORECASTS
NG THE ELECTRIC DEMAND FORECAST The vertical axis on the left of each graph (0 to 1200 MW) applies to the base load forecast (top blue line) and the net load forecast (red line), which is the load the transmission system will be designed to serve. The net load forecast is the sum of the base forecast and the component forecasts that would either increase or decrease the load depending on the technology. The vertical axis on the right of each graph (-50 to 130 MW) applies to the component forecasts affecting the net load forecast that the transmission system will serve. These component forecasts representing the projected impact of electric vehicles (EV, purple line), heat pumps (HP, green line), standard offer generation assumed to be primarily solar PV (light blue line), net metering solar PV generation (dark red line), and dispatchable demand response (DR) that qualified in the ISO-NE forward capacity auctions (orange line). The major differences between the two peak load graphs are the higher winter heat pump load, and the 0 MW forecast for solar PV’s contribution due to the winter peak occurring at night.
Electric vehicle forecast
The demand associated with EVs is predicted to become a noticeable element of the load in the mid- to long-term. The electric vehicle forecast was developed by VEIC, which provided the number of electric vehicles and associated energy consumption. As of February 2016, there were 1,200 EVs registered in Vermont. The forecast projects that this number will increase to approximately 125,000 EVs by 2037, but most of the growth will occur during the second 10 years of the planning horizon. Summer peak EV electric demand is projected to grow from 0.1 MW to 9 MW in 2027 and 68 MW in 2037. The winter peak EV load is projected to be approximately 10 MW in 2027 and 69 MW 2037. These EV forecasts assume no load management in order to help identify the system concerns that would indicate a need for these measures.

2018 VERMONT LONG-RANGE TRANSMISSION PLAN PAGE 18
Heat pump forecast
High-efficiency heat pumps, also called cold-climate heat pumps, can provide heating at temperatures below 0o F at greater efficiency than several other heating sources. Heat pump capabilities decrease as temperatures approach -15 o F, and a supplemental heat source is needed during the coldest days of the winter season.
High-efficiency heat pumps are a more efficient heat source than other alternatives, but they will shift some heating load back to electricity after a long-term trend away from electric heat, although supplemental heating will continue to be required at times of extreme cold. The ability to cool with the same high-efficiency equipment will tend to be additive to the existing cooling load, and it is this heat pump cooling load that is projected to contribute to higher summer peak loads after 10 years. VEIC, with input from the VSPC Load Forecast Subcommittee, projects sales of 3,000 heat pumps per year. Itron subtracted 700 heat pumps per year to avoid double counting naturally occuring adoption as projected by the Energy Information Administration. The heat pump summer load projection is consistent with the forecast used by Green Mountain Power (GMP) in its Integrated Resource Plan, and is projected to be 7 MW in 2027 and 15 MW in 2037, while the corresponding winter figures are 39 MW and 78 MW. In order to identify the system concerns that would indicate a need for load mangement these HP forecasts assumed no load management is incorporated with the projected adoption of heat pumps.
Net metering forecast and incorporation of standard offer and utility solar PV
Starting in 2012, net metering and standard offer installed capacity have increased rapidly, driven by Vermont policies encouraging renewable energy development, to the point of changing the behavior of the daily system load. As a result of these policies, Vermont has seen an explosion of solar PV generation, the predominant technology since 2012, with lesser contributions from wind, hydro, biomass, and methane. Itron utilized a payback model to forecast net metering. The model indicated fairly aggressive growth until 2022, when growth slows down due to phase-out of the investment tax credit and projected slower declines in equipment costs. The forecast projects net metering to grow from 233 MW in 2017 to 408 MW in 2037. Standard offer is projected to grow as scheduled from 64.5 MW in 2017 to 127.5 MW in 2024, and remaining constant until 2037. Future standard offer is assumed to be almost exclusively solar PV. Further, the Itron forecast does not capture utility-installed solar PV, which is projected to be about 40 MW by the end of 2018. The utility installed solar was increased at the same rate as other solar PV, and this yielded a total solar PV forecast of approximately 510 MW in 2025 and 550 MW in 2037.
The Itron load forecast indicated that the summer and winter peak net load will occur at 7 PM. At that time of day, the production of solar PV is expected to be 2.5 percent of the installed capacity in the summer and 0 percent in the winter. As noted earlier in the plan, the summer peak has occurred at 8 PM or later in the last three summers, past sunset when solar PV is no longer producing energy. In any case, VELCO modeled 2.5 percent of the installed capacity for solar PV production at the summer peak.
PEAK DEMAND TRENDS
The increasing adoption of small-scale renewable energy has begun to affect the seasonal peak loads. Vermont is no longer a summer peaking state. Since the 2013/14 winter period, the winter peak load has been higher than the summer peak load. The winter peak load has been relatively constant at roughly 1000 MW while the summer peak load has decreased from 1040 MW in 2013 to approximately 950 MW in 2016 and 905 MW in 2017. We suspect that the 2017 summer peak load was significantly lower than expected primarily due to the cooler than usual summer season.

2018 VERMONT LONG-RANGE TRANSMISSION PLAN PAGE 19
Small-scale renewable energy has also affected the timing of the peak during the summer months, June to September. The following graph shows the progression of monthly peaks for the summer period. Un-til recently, peak loads from June to August occurred consistently in the afternoon (2 PM plus or minus two hours). The graph shows that the timing of the monthly peaks has transitioned to later in the day from 2012 to 2014. In 2014, for the first time, May’s peak occurred at 9 PM, June’s peak at 7 PM, and August’s peak at 7 PM. Only July, typically the month in which the annual peak occurs, did not peak later than 4 PM in 2014, but the July peak has clearly moved to the evening since then. As solar PV continues to increase, the timing of the summer peak will continue to get later to the point where incremental so-lar PV will no longer have any effect on the summer peak timing or load level. As noted earlier, the load forecast has determined that the peak hour will move to 7 PM. As the peak hour occurs later in the day, the contribution of solar generation during the peak hour is also reduced, from 25 percent in the previ-ous forecast to approximately 2.5 percent consistent with the 7 PM peak timing noted in this 20-year forecast. VELCO will continue to monitor the impact of solar generation on the peak day, and future load forecasts will continue to take these effects into consideration.
SUMMER PEAK LOADS ARE OCCURRING IN THE EVENING
NG THE ELECTRIC DEMAND FORECAST System planning analyses take the timing of the peak into account. The shape of the Vermont load curve on a summer peak day has traditionally been quite flat. Small-scale renewable generation is making the curve more concave in the middle of the day. This transformation is relevant to the development of NTAs, such as energy efficiency and generation. An NTA that is proposed to address a summer peak problem potentially will need to be in service in the morning and the evening hours. Renewable energy

2018 VERMONT LONG-RANGE TRANSMISSION PLAN PAGE 20
is not only affecting system planning, it is likely affecting the efficacy, i.e., the coincident factor, of en-ergy efficiency measures at the time of the peak. For instance, if the current measures were designed to reduce a type of load from noon to 4 PM, additional measures may be needed to also reduce the load after 4 PM. Renewable energy and energy efficiency may very well work together, where renewable en-ergy reduces daytime loads and energy efficiency nighttime loads.
INHERENT UNCERTAINTIES IN THE TIMING OF NEED FOR RELIABILITY SOLUTIONS
System analysis determines at what level of electric demand a reliability problem occurs, and load fore-casting predicts when that load level will be reached by using mathematical methods to predict demand based on the expected influence of factors such as economic activity, price elasticity, population growth, new technology, efficiency, long-term weather trends, and public policy effects on customer behavior. The complexity and uncertainty of these factors means the timing of load level predictions is inherently uncertain. Although load forecasters use various methods to minimize uncertainties, the longer the hori-zon the more uncertain are the drivers of customer demand, the resulting load forecast and, conse-quently, the year at which reliability concerns will arise. The following factors contribute to forecast un-certainty.
• Itron’s load forecast is based on known information, including input provided by the VSPC as part of the forecast process. Some substation loads may or may not be present in the future, and their status can affect system performance. For example, the winter peak load in the New-port load zone can be higher than the Itron forecast, depending on the amount of load at the Jay ski resort and whether currently absent load from one industrial customer is reinstated. Simi-larly, a load increase at a manufacturer’s facility can affect system performance in the St. Albans load zone. The status of that one customer’s load can trigger the need for a system upgrade.
• Energy efficiency may be more difficult or expensive to obtain over the long run as easier and less costly load reductions have already been achieved. Because small-scale renewable energy is having an impact on the timing of the peak, energy efficiency measures that target specific load hours may become less effective if the measures are not modified to match the later peak load timing, or their coincident factors may become less predictable due to the variability of peak load timing.
• New FERC and ISO-NE requirements for treating and paying demand response programs on par with generation introduce uncertainty regarding future participation rates and effectiveness of demand response for large customers who in the future will be called upon to curtail load based on the energy market rather than system events and conditions as in the past.
• New technology may increase or decrease electric demand in the long run. For instance the bat-teries in electric vehicles may become a distributed energy resource through the use of smart grid, or they may increase electric demand if they are charged during peak demand periods. The current load forecast includes an explicit forecast of electric vehicle load, which increases state load by approximately 68 MW over 20 years. The forecast also includes a projection of high-effi-ciency heat pump load. This reinforces the belief that 20-year forecasts are likely too uncertain to be the primary basis for the long-range plan.
• Regional uncertainties may affect Vermont as a part of the interconnected grid. Environmental regulations will likely impact New England’s generation mix, and ISO-NE has previously pro-jected the retirement of a large amount of New England generation due to market forces and environmental concerns. In fact, the ISO-NE 2017 Regional System plan reported that roughly

2018 VERMONT LONG-RANGE TRANSMISSION PLAN PAGE 21
2550 MW retired from 2010 to 2015, 1570 MW retired since 2015, and another 700 MW will retire by 2020. During that same period, a similar amount of generation was added. In addition, the ISO-NE Distributed Generation Forecast Working Group projects that over 5830 MW of solar PV generation capacity will be installed by 2027. New sources of energy, including imports and elective transmission, albeit regional resources, may affect the performance of the Vermont sys-tem, particularly for the period beyond 10 years. As many as six import projects have been pro-posed to connect to various locations in Vermont. These import projects vary in size from 400 MW to 1200 MW. The changing generation mix in the US has raised concerns about grid resili-ence. For example, ISO-NE recently issued its Operational Fuel-Security Analysis17, a study as-sessing whether possible future resource combinations would have enough fuel to ensure bulk power system reliability throughout an entire winter. The results indicate that maintaining relia-bility is likely to become more challenging, especially if current power system trends continue.
• Recently, renewable energy and small-scale distributed generation have expanded dramatically. Amendments to Vermont statutes enacted in 2012 and 2014 will greatly increase generation de-veloped through Vermont’s standard offer and net metering programs over the next decade. The forecast maintains standard offer constant at 127.5 MW beyond 2023, as it is unknown whether and how the program will be expanded.
• Reliability standards set by NERC continue to evolve in a more prescriptive direction that will further reduce discretion about how to analyze the system and what solutions are compliant with regional and federal regulations. A new planning standard that replaced several previous standards went into effect in January 2016. Stability assessments, dynamic load modeling, and sensitivity testing are just a few of the requirements added. This standard is expected to continue to evolve and others will be developed in an effort to improve system reliability. For instance, it is reasonable to expect that a new standard or planning process will be developed nationwide and regionally to address grid resilience concerns associated with low likelihood, high consequence natural or man-made events. It has been suggested that climate change is increasing the likelihood of catastrophic events to a point where grid hardening measures should be considered. The FERC has opened a grid resilience proceeding (Docket No. AD-18-7) directing Regional Transmission Organizations and Independent System Operators to submit information on resilience issues and concerns, and allowing interested entities to provide comments. In the New England area, the grid resilience discussion is focusing primarily on winter fuel security concerns. In addition, ISO-NE recently provided guidance with respect to resilience concerns at transmission substations and on lines. VELCO has not identified a specific need to upgrade its transmission facilities to address resilience concerns at this time. However, resilience is one of the considerations in the design of transmission facilities, which can include the location of facilities in relation to FEMA flood levels, equipment height, equipment design specifications, and redundancy.
• The best available information was used to determine the zonal distribution of technologies that affect loads. Solar PV is allocated to zones based on currently installed solar PV distribution; EVs are allocated based on the zonal share of registered EVs; heat pumps are allocated based on zonal distribution of electric energy consumption; and demand response is allocated based on
17 https://www.iso-ne.com/static-assets/documents/2018/01/20180117_operational_fuel-security_analysis.pdf

2018 VERMONT LONG-RANGE TRANSMISSION PLAN PAGE 22
ISO-NE bus-level load distribution. These methods while appropriate may not be an accurate de-piction of future deployment. Alternative zonal distributions will affect system performance.
• Federal and state policies have a significant impact on loads. The Vermont renewable energy standard and energy transformation requirements include provisions that both increase and de-crease loads. Depending on how these requirements are met and managed, loads can be higher or lower than the load forecast. Further, it is impossible to predict the timing and the specifics of new policies. The PSD prepared a comprehensive report on the deployment of storage on the Vermont grid18 that may help guide future policymaking; however, VT may or may not establish storage requirements that affect grid performance. Storage was not modeled in the load fore-cast since it would be premature to do so without knowing what requirements may be imposed, however, storage is likely to be among the solutions considered to address emerging system concerns.
Some uncertainties can be quantified because they are known and well understood based on historical data. For example, we can determine the expected contribution of hydro generation to be roughly 10 percent at the time of the summer peak hour, the likelihood that a generator or type of generator will be unavailable, the probability that the summer peak load forecast will be exceeded, and so on. Other uncertainties are unknown and even unknowable, such as generation expansion, natural disasters or terrorist attacks, and public policies whose timing, specific requirements and corresponding impacts on future loads can have a significant impact on system performance. Planning under conditions of uncer-tainty involves making decisions that minimize or hedge against risks, and several approaches are used, such as what-if analyses and minimax regret optimization. Faced with significant unknowns, a high-load scenario and a high-solar PV scenario were developed to represent two potentially impactful energy fu-turesrecognizing that they are not necessarily the only possible futuresin an effort to understand these impacts and wisely guide investment decision that will support Vermont’s overall goals and main-tain electric system reliability.
High load forecast scenario
Planners have addressed load forecast uncertainties by preparing a high forecast and a low forecast in order to bound uncertainties. In this case, we do not believe a low forecast would provide much value because the base load forecast is already quite low, and previous studies have shown that the transmis-sion system should be able to serve the base load forecast for more than ten years. Therefore, only a high load forecast was evaluated.
The high load scenario is meant to quantify the amount of load that the transmission system would need to serve if the state’s goal of 90 percent renewable energy by 2050 is on track. The 2016 CEP sets energy reduction milestones to reduce energy consumption by 15 percent in 2025 and 33.33 percent in 2050. Goals for the remainder are to serve 25 percent from renewable sources by 2025, 40 percent by 2035 and 90 percent by 2050. The VSPC and particularly the PSD helped Itron determine how to in-crease electric vehicles and heat pump loads to equal the levels contemplated as part of the total energy study. To achieve the 2035 target, cold climate heat pump saturation increases to 40 percent versus 23 percent in the reference forecast, and the number of EVs increases to 171,000 registered vehicles (the
18 http://publicservice.vermont.gov/sites/dps/files/documents/Pubs_plans_Reports/Energy_Storage_Report/Storage_Report_Final.pdf

2018 VERMONT LONG-RANGE TRANSMISSION PLAN PAGE 23
VEIC medium case) from 107,000 vehicles in the reference forecast (the VEIC low case). The result of that analysis is shown in the graph below.
HIGH LOAD FORECAST SCENARIO
THE ELECTRIC DEMAND FORECAST The graph shows that the summer high load forecast (red line) is almost the same as the summer base load forecast (orange line) during the first ten years of the planning horizon, and begins to exceed the base load forecast after that point. The summer high load forecast is higher than the base load forecast by 12 MW in 2027, 36 MW in 2032, and 79 MW in 2037. The high load scenario advances the timing of base peak load by roughly three years. For example, the 1100 MW or the 1050 MW load level occurs three years earlier in the high load scenario as compared to the base forecast.
The load differences are more significant for the winter forecast primarily because of higher heat pump loads in the high load scenario. The winter high load forecast (blue line) is higher than the base load forecast (purple line) by 23 MW in 2027, 68 MW in 2032, and 130 MW in 2037. Interestingly, the sum-mer and winter high load forecasts are almost equal, also because of higher heat pump loads in winter.
High solar PV forecast scenario
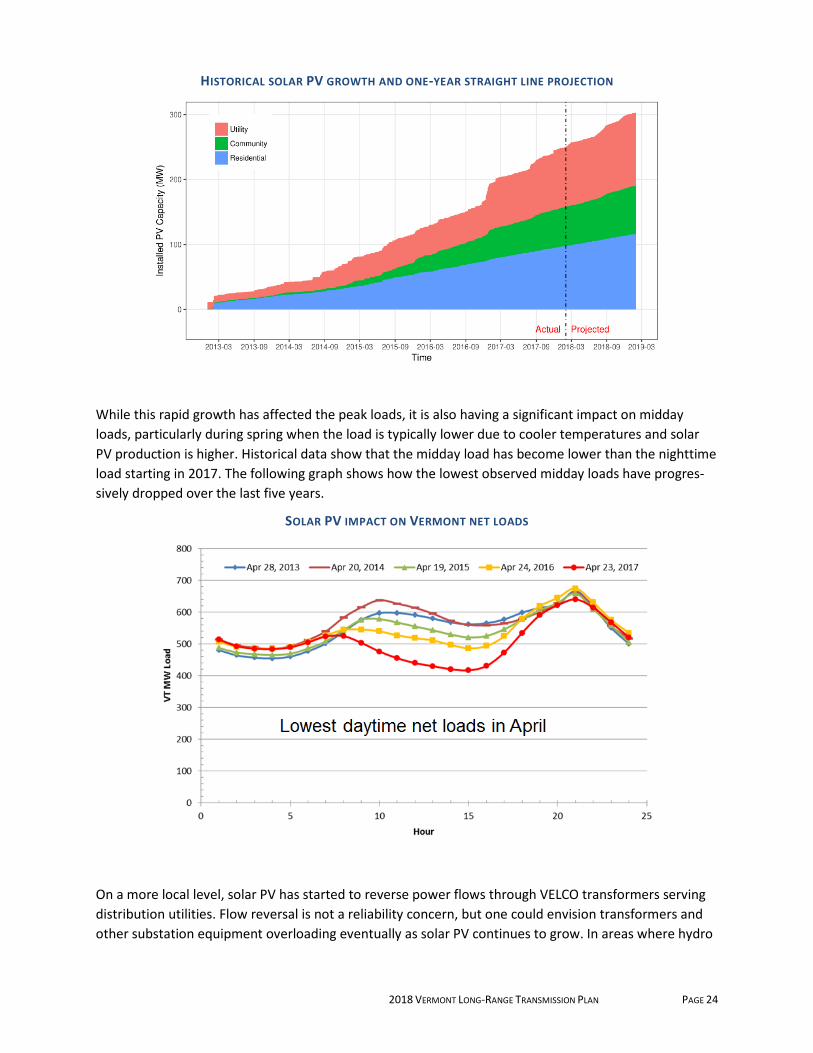
Solar PV has grown to nearly 280 MW as of December 2017. The following graph shows the installed ca-pacity as provided by Utopus Insights19. Roughly 35 MW should be added to the total amount shown on this graph to account for solar PV data that have not been provided yet.
19 Utopus Insights (http://www.utopusinsights.com/) is a grid analytics company that was spun off in 2017 from IBM, with VELCO as a strategic
partner holding a financial stake in the venture, which was subsequently acquired by Vestas. The new company is building on collaborative work done previously to develop the Vermont Weather Analytics Center, among other former IBM projects.
2018 VERMONT LONG-RANGE TRANSMISSION PLAN PAGE 24
HISTORICAL SOLAR PV GROWTH AND ONE-YEAR STRAIGHT LINE PROJECTION
NG THE ELECTRIC DEMAND FORECAST While this rapid growth has affected the peak loads, it is also having a significant impact on midday loads, particularly during spring when the load is typically lower due to cooler temperatures and solar PV production is higher. Historical data show that the midday load has become lower than the nighttime load starting in 2017. The following graph shows how the lowest observed midday loads have progres-sively dropped over the last five years.
SOLAR PV IMPACT ON VERMONT NET LOADS
NG THE ELECTRIC DEMAND FORECAST On a more local level, solar PV has started to reverse power flows through VELCO transformers serving distribution utilities. Flow reversal is not a reliability concern, but one could envision transformers and other substation equipment overloading eventually as solar PV continues to grow. In areas where hydro

2018 VERMONT LONG-RANGE TRANSMISSION PLAN PAGE 25
and wind generation is high compared to native load, these generators can be curtailed to prevent sys-tem concerns.
To understand how the system might be affected by a very large amount of statewide solar PV, Itron prepared a high solar PV scenario modeling a hypothetical 1000 MW of total nameplate total solar PV level that corresponds to the amount analyzed as part of the Solar Pathways study performed by VEIC under a Department of Energy (DOE) contract20. The Solar Pathways study, assumed that solar PV would meet at least 20 percent of total electric generation needs by 2025. The study concluded that 1000 MW of solar PV is achievable and the electric grid can handle this amount of solar PV with careful planning, upgrades to operations and planning systems, including the use of smart grids, demand management and storage. This current plan will attempt to put a finer point on the upgrades that might be needed to support such a large amount of solar PV. Below is a graph showing a comparison between the base solar PV forecast and the high solar PV scenario. All solar PV amounts discussed in this plan refer to name-plate capacity.
HIGH SOLAR PV SCENARIO
NG THE ELECIC DEMAND FORECAST Below is a table showing how the solar PV was distributed across the state under the base solar PV fore-cast and the 1000 MW solar PV forecast. As noted previously, these solar PV forecasts were distributed based on the current distribution of solar PV, and were applied to loads that would occur during a sunny spring day. Additionally, the solar PV was tested under two other potential distributions based on the
20 https://www.veic.org/vermont-solar-pathways

2018 VERMONT LONG-RANGE TRANSMISSION PLAN PAGE 26
load (MW) ratio share or the energy (MWh) ratio share at each system bus21. The gross loads are with-out solar PV effects; the net loads take solar PV into consideration.
SOLAR PV (MW) DISTRIBUTIONS DURING SPRING 2025
ZONE NAMES GROSS LOADS
(MW)
INSTALLED SOLAR
PV AS OF 2018 (MW)
BASE SOLAR PV MW
FORECAST USING
2018 DISTRIBUTION
(A) 1000 MW SO-
LAR PV USING
2018 DISTRIBUTION
(B) 1000 MW SOLAR
PV USING MW RATIO
SHARE DISTRIBUTION
(C) 1000 MW SOLAR
PV USING MWH RATIO
SHARE DISTRIBUTION
NEWPORT 19.8 10.3 14.5 27.1 36.9 40.0
HIGHGATE 23.8 15.5 20.3 34.9 39.1 38.0
ST ALBANS 39.7 20.9 30.1 58.0 68.2 63.6
JOHNSON 6.6 5.4 8.3 17.0 11.5 12.0
MORRISVILLE 24.3 5.7 8.8 18.2 35.1 36.7
MONTPELIER 48.6 29.9 45.1 91.2 86.0 91.3
ST JOHNSBURY 14.7 5.1 7.2 13.3 26.2 28.9
BED 39.8 5.6 9.2 20.4 61.9 61.8
IBM 60.6 0.0 0.0 0.0 62.4 70.5
BURLINGTON 94.1 74.4 106.5 203.8 164.5 142.4
MIDDLEBURY 19.7 29.7 45.4 93.0 36.1 30.5
CENTRAL 37.6 50.2 74.3 147.1 67.5 67.2
FLORENCE 22.6 0.2 0.4 0.9 25.6 34.1
RUTLAND 61.7 40.6 58.4 112.7 93.0 92.8
ASCUTNEY 39.5 14.8 22.4 45.7 71.7 69.7
SOUTHERN 65.6 42.9 61.3 117.0 114.4 120.4
TOTAL 619 MW 351.2 MW 512.2 MW 1000.3 MW 1000 MW 1000 MW
HE ELECTRIC DEMAND FORECAST For each of the three solar PV distributions (2018, MW ratio share, and MWh ratio share) in the above table, the amount noted within each zone is consistent with (A) the zone’s solar PV share of the state’s total solar PV installed in 2018, (B) the zone’s MW load ratio share of the state’s peak MW load, or (C) the zone’s MWh energy ratio share of the state’s MWh annual energy consumption, respectively. The MW ratio share distribution is the type of distribution that would be achieved with limited existing dis-tribution substation capacity and without the use of storage or other measures.
21 In power engineering, a "bus" is any graph node of the single-line diagram at which voltage, current, power flow, or other quantities are to be
evaluated. This may or may not correspond to the physical busbars in substation. (Source: Wikipedia.)

2018 VERMONT LONG-RANGE TRANSMISSION PLAN PAGE 27
Discussion of peak demand results The following section presents the findings of the ISO-NE and the VELCO 2016 TPL-001-4 assessments, supplemented with other analyses to satisfy Vermont statutory and regulatory planning requirements.
Bulk system issues This section describes reliability issues on the bulk transmission system, which includes Pool Transmis-sion Facilities or PTF, for which costs are shared across the New England region through ISO-NE, as well as non-PTF facilities at voltages of 115 kV and above. The 10-year study performed by ISO-NE in 2014 identified bulk system reliability issues in the Connecticut River area. These concerns have been ad-dressed by the recently completed Connecticut River project. This 2018 plan confirms that there are no bulk system reliability concerns within the first ten years of the planning horizon. In fact, it has been de-termined that reliability concerns would only occur beyond fifteen years, and therefore would not re-quire any grid reinforcements to be further evaluated in the current planning cycle. This result came about as the result of lower load levels as well as our ability to rely on our tie lines with New York and New Hampshire.
LOSS OF LOAD EXPOSURE
While the analysis determined that no reinforcements are necessary, the Vermont system is exposed to loss of load that has been determined to be acceptable based on the ISO-NE guideline for pool funding of transmission projects. In essence, ISO-NE ensures that no adverse impacts to PTF facilities arise under such circumstance. The ISO-NE guideline states that up to 100 MW of load loss is potentially acceptable for single outage events, and up to 300 MW of load loss is potentially acceptable for N-1-1 outage events. Following the completion of the Connecticut River projects, none of the load loss exposures ex-ceeds these thresholds.
LOSS OF LOAD EXPOSURE

2018 VERMONT LONG-RANGE TRANSMISSION PLAN PAGE 28
HE ELECTRIC DEMAND FORECAST In the above graph, the vertical axis shows the number outage events that would cause loss of load. The green bars represent the amount of load that would be disconnected following an N-1 event as noted in the horizontal axis, and the red bars represent the amount of load that would be disconnected following an N-1-1 event. For example, there are three N-1 outage events and one N-1-1 event that would cause approximately 15 MW to be disconnected; there are two N-1 outage events that would cause approxi-mately 40 MW to be disconnected; and two N-1-1 outage events that would cause approximately 145 MW to be disconnected.
EFFECT OF THE HIGH LOAD SCENARIO
A high load scenario, as described earlier, was also prepared to determine the amount of electric de-mand that would be associated with achieving the renewable energy targets outlined in the 2016 Ver-mont CEP. A review of the high load forecast showed no major load increase within the first ten years of the study. Beyond the ten-year period, the higher load forecast would only advance the timing of poten-tial transmission concerns by three years. The conclusions of the bulk system assessment are un-changed, since the timing of future transmission concerns would continue to be beyond the ten-year horizon.

2018 VERMONT LONG-RANGE TRANSMISSION PLAN PAGE 29
System issues classified as “predominantly bulk” The following section describes reliability issues classified as “predominantly bulk system,” meaning they do not meet the definition of bulk system, but at least 50 percent of their cost elements are part of the bulk system. Projects that are proposed to address these issues involve a combination of grid ele-ments owned by distribution utilities and elements owned by VELCO.
VELCO’s identification of issues on the subsystem requires the assistance of local distribution utilities. VELCO coordinates closely with local distribution utilities during the preparation of the plan to identify relevant issues and share information about study findings. In cases where information about a subsys-tem issue is not available to VELCO in time for a three-year update of the plan, some reliability concerns may not be included in the plan. Additionally, distribution utilities make changes to their systems from time to time to better serve customers. These changes may be made quickly, and it is difficult to predict and model all of those changes during the performance of these studies. In such cases, reliability con-cerns on the subsystem may not be identified as part of the plan. Below is a description of predomi-nantly bulk issues identified in the 2015 plan, but have since been eliminated or postponed beyond the ten-year time frame.
• The Rutland area concerns previously identified in the 2015 long range plan have been resolved by lower loads and by connecting the Florence system to the Rutland system as described in the GMP Rutland Area Reliability Plan, which may be viewed at http://www.vermontspc.com/gmp-rrp. The North Rutland transformer overload is postponed to 2031 at a 1028 MW VT load level.
• The Northern area concerns previously identified in the 2015 long range plan were dependent on a large customer reconnecting to the system. At this time, there is no indication that this cus-tomer plans to reconnect anytime soon. Therefore, it has been determined that the Northern area concerns have been resolved by lower load levels. The Barton area low voltage is post-poned to 2028 at a 977 MW VT winter load level. System performance will be reevaluated in the event this customer indicates the desire to reconnect.

2018 VERMONT LONG-RANGE TRANSMISSION PLAN PAGE 30
Subsystem issues The following section describes reliability issues classified as “subsystem” meaning they do not meet the definition of bulk transmission system, and they are not intended to serve radial distribution loads. If the affected distribution utilities determine that these issues require resolution, these projects would in-volve grid elements owned by distribution utilities.
Several of the reliability issues identified in the 2015 plan have been resolved as they are pushed beyond the 10-year horizon due to lower load levels based on the most recent load forecast. The problems are categorized as to whether each causes high or low voltage, or is a thermal issue in which equipment ex-ceeds its rated temperature. Because the load forecast is flat for 10 years, the study results for year 10 were applied to the first 10 years of the planning horizon, and the timing of potential concerns is deter-mined to be year 2017 if they are severe or 2025 if they are marginal. These subsystem findings are based on VELCO’s statewide analysis. System analysis by the affected utilities using different reliability criteria and a more granular focus specifically on subsystem performance may produce different results.
The following table identifies sub-transmission areas with potential reliability issues. Flexibility is permit-ted at the subsystem level concerning the reliability criteria the system must meet because the sub-transmission system is not currently subject to mandatory federal reliability standards. For example, a utility may accept the impacts of an infrequent power outage rather than invest in infrastructure to eliminate the power outage risk based on its analysis of costs, benefits and risks. The affected utilities will determine what, if any, projects are required to address the potential reliability issues on the sub-transmission system.

2018 VERMONT LONG-RANGE TRANSMISSION PLAN PAGE 31
SUB-TRANSMISSION POTENTIAL RELIABILITY ISSUES GROUPED BY LOCATION
Location
Year Needed (Projects
needed in past listed as 2017 in
this table)
90/10 Load
Forecast for Year
(MW)
Contingency Reliability Concern N-1 Criteria Violation Affected
DUs Lead DU
Ascutney 2017 < 987 Subtransmission Thermal Low Voltage
Maple Ave – River Rd – Charlestown GMP / PSNH GMP
Ascutney 2025 992 Transformer Subtransmission Low Voltage Lafayette – Bridge St. –
Bellows Falls GMP / PSNH GMP
Ascutney 2025 992 Transformer Subtransmission Thermal Highbridge – Ascutney GMP / PSNH GMP
Blissville 2025 992 Transformer Low Voltage Blissville area GMP GMP
Blissville 2030 1023 Transformer Thermal Blissville – Hydeville GMP GMP
Rutland 2017 < 970 Winter
Subtransmission End open Low voltage Snowshed (winter) GMP GMP
Montpelier 2031 1028 Transmission Thermal Marshfield – Danville GMP – Danville WEC GMP / WEC GMP
Montpelier 2017 < 987 Subtransmission End open Low Voltage Ryegate / Newbury GMP GMP
Montpelier 2017 < 970 Winter
Subtransmission End open Low Voltage Moretown – Irasville –
Madbush (winter) GMP / WEC GMP
Burlington 2017 < 987 Transformer Subtransmission Thermal Gorge – McNeil GMP / BED GMP
St. Albans 2017 < 987 Subtransmission End open Thermal Welden St. – East St.
Albans GMP / VEC GMP
St. Albans 2025 992 Transformer Transmission Low voltage Sheldon GMP / VEC GMP
The St. Albans thermal and low voltage concerns will be eliminated by line reconductoring planned for 2018 and capacitor bank additions planned for 2019. These improvements screened out of a full NTA analysis, and will be reviewed more fully as part of the VSPC 2018 annual geographic targeting process22. Load growth has been reduced in the St Albans area by geo-targeting efforts over several years. Without this geo-targeting effort, the St Albans area load would have been higher, and the required upgrades could have been more extensive.
The subsystem near the Stowe substation is served from the south by a transmission line and a sub-transmission line located on the same set of poles as required by the Section 248 permit for the Lamoille County project. A common mode outage that disconnects both supplies results in low voltage on the Stowe system in 2025. Since the Lamoille County project was permitted with the preferred double cir-cuit design, this low voltage is not considered a concern that needs mitigation.
22 For more information about this process, see the Geographic Targeting of Non-Transmission Alternatives section at https://www.ver-
montspc.com/about/key-documents.
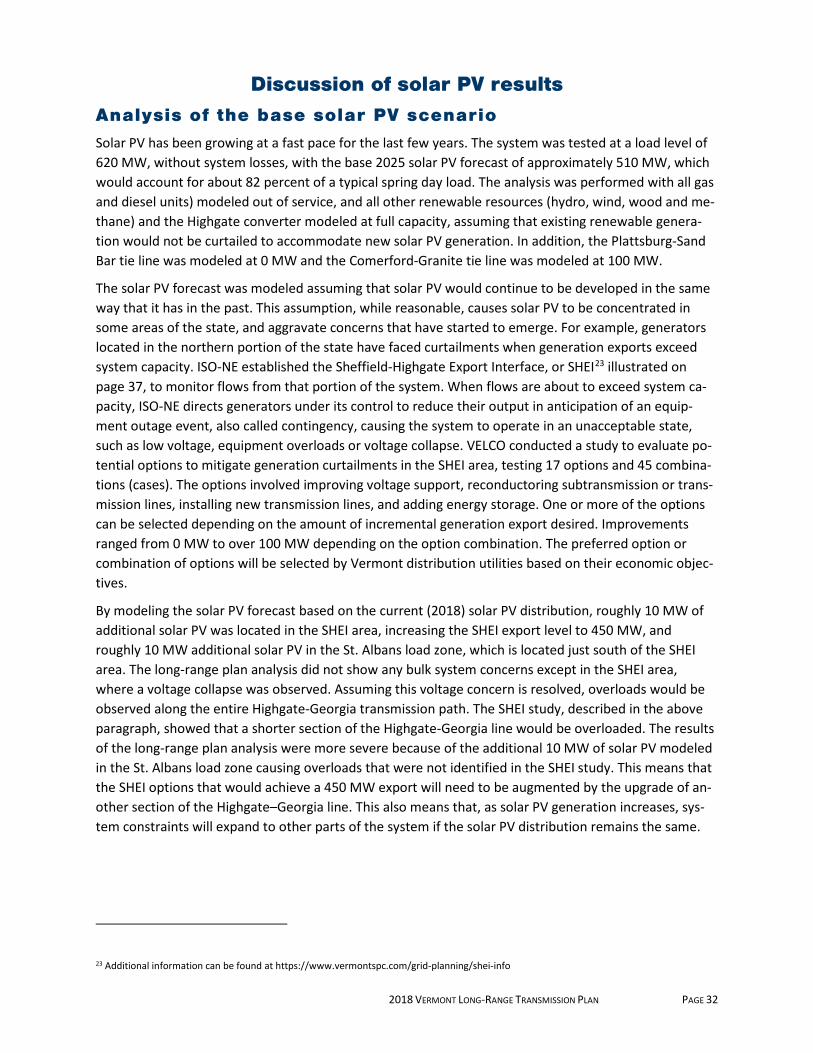
2018 VERMONT LONG-RANGE TRANSMISSION PLAN PAGE 32
Discussion of solar PV results Analysis of the base solar PV scenario Solar PV has been growing at a fast pace for the last few years. The system was tested at a load level of 620 MW, without system losses, with the base 2025 solar PV forecast of approximately 510 MW, which would account for about 82 percent of a typical spring day load. The analysis was performed with all gas and diesel units) modeled out of service, and all other renewable resources (hydro, wind, wood and me-thane) and the Highgate converter modeled at full capacity, assuming that existing renewable genera-tion would not be curtailed to accommodate new solar PV generation. In addition, the Plattsburg-Sand Bar tie line was modeled at 0 MW and the Comerford-Granite tie line was modeled at 100 MW.
The solar PV forecast was modeled assuming that solar PV would continue to be developed in the same way that it has in the past. This assumption, while reasonable, causes solar PV to be concentrated in some areas of the state, and aggravate concerns that have started to emerge. For example, generators located in the northern portion of the state have faced curtailments when generation exports exceed system capacity. ISO-NE established the Sheffield-Highgate Export Interface, or SHEI23 illustrated on page 37, to monitor flows from that portion of the system. When flows are about to exceed system ca-pacity, ISO-NE directs generators under its control to reduce their output in anticipation of an equip-ment outage event, also called contingency, causing the system to operate in an unacceptable state, such as low voltage, equipment overloads or voltage collapse. VELCO conducted a study to evaluate po-tential options to mitigate generation curtailments in the SHEI area, testing 17 options and 45 combina-tions (cases). The options involved improving voltage support, reconductoring subtransmission or trans-mission lines, installing new transmission lines, and adding energy storage. One or more of the options can be selected depending on the amount of incremental generation export desired. Improvements ranged from 0 MW to over 100 MW depending on the option combination. The preferred option or combination of options will be selected by Vermont distribution utilities based on their economic objec-tives.
By modeling the solar PV forecast based on the current (2018) solar PV distribution, roughly 10 MW of additional solar PV was located in the SHEI area, increasing the SHEI export level to 450 MW, and roughly 10 MW additional solar PV in the St. Albans load zone, which is located just south of the SHEI area. The long-range plan analysis did not show any bulk system concerns except in the SHEI area, where a voltage collapse was observed. Assuming this voltage concern is resolved, overloads would be observed along the entire Highgate-Georgia transmission path. The SHEI study, described in the above paragraph, showed that a shorter section of the Highgate-Georgia line would be overloaded. The results of the long-range plan analysis were more severe because of the additional 10 MW of solar PV modeled in the St. Albans load zone causing overloads that were not identified in the SHEI study. This means that the SHEI options that would achieve a 450 MW export will need to be augmented by the upgrade of an-other section of the Highgate–Georgia line. This also means that, as solar PV generation increases, sys-tem constraints will expand to other parts of the system if the solar PV distribution remains the same.
23 Additional information can be found at https://www.vermontspc.com/grid-planning/shei-info
2018 VERMONT LONG-RANGE TRANSMISSION PLAN PAGE 33
Analysis of the high solar PV scenario A high solar PV scenario was prepared to identify system concerns assuming total installed solar capacity reaches 1000 MW in 2025. This corresponds to the amount of solar PV generation that would supply 20 percent of Vermont’s electricity demand, as specified in the Vermont Solar Pathways study, conducted by VEIC under a Department of Energy contract. Analysis of this scenario shows four notable areas of concern:
• System losses • Voltage regulation pre- and post-contingency • Power flows pre- and post-contingency • Limitations on tie flows from neighboring systems
The system was modeled in the same way as the base solar PV forecast discussed above, except that so-lar PV was increased from 512 MW to 1000 MW using the same solar PV distribution as in 2018 and the base solar PV forecast. See the table on page 26 for the zonal distribution. For the purpose of this analy-sis, current system limits, such as the SHEI limits, were allowed to be exceeded to represent the effects of a high level of solar PV penetration running in conjunction with other existing renewable generation without any curtailment. This analysis assumed that the inverters have no voltage control capability and no low-voltage-ride-through capability, which would expose solar PV to disconnection during system events.
SUMMARY OF RESULTS
Low voltage ride through
To thoroughly evaluate consequences of the lack of ride through capability exceeds the scope of this plan; however, preliminary testing was performed to determine any adverse system impact from a rep-resentative equipment outage or contingency that would cause solar PV to trip. The total amount of so-lar PV was disconnected in response to a contingency (N-1 or N-1-1) in each of the Burlington, Central, and Southern load zones. Voltage was monitored at relevant substations in and around the zone, pre-contingency, post-contingency, and after the PV had been tripped offline.
The results were fairly consistent across the three zones tested, and showed that when a pocket of the subtransmission network has several connections to the rest of the grid, the loss of PV does not have a drastic effect on system performance; however, contingencies that trip large amounts of solar PV on a radial subtransmission path, with only one connection to the rest of the grid, can have considerable im-pact. Low voltage ride through capability of inverters, as required by the recently approved IEEE 1547 interconnection standard24, will help system performance under outage conditions.
Voltage performance
The large amount of solar PV used in this study was observed to reduce flows in some areas, and to ac-tually reverse flows on the subtransmission system, which resulted in voltages above acceptable levels. Many subtransmission capacitor banks needed to be switched off to reduce voltages at the subtransmis-sion level; however, high voltages were still observed. The high solar PV penetration also increases flow on the transmission system, which lowers voltages. As a result, many transmission capacitor banks 24 For more information see: https://standards.ieee.org/findstds/standard/1547-2018.html

2018 VERMONT LONG-RANGE TRANSMISSION PLAN PAGE 34
needed to be switched on to raise voltages to within acceptable levels, though there were no observed voltage violations on the transmission system. Normally, few capacitor banks are placed in service on the transmission and subtransmission systems during lower load levels. These voltage results are differ-ent from current system behavior, and they indicate a need to install dynamic voltage support at the subtransmission or distribution level. Dynamic reactive power devices can provide such support by re-sponding to system needs almost immediately, and in some cases in a continuous fashion. Generators, synchronous condensers and power electronics devices, such as static VAR compensators or inverters, can provide dynamic support, which is different from the stepwise and slow support that a shunt capaci-tor bank or shunt reactor would provide.
Thermal performance
High solar PV changes the flow pattern at all system levels—distribution, subtransmission, and transmis-sion. Beyond the violations related to SHEI that are described above, the high solar PV analysis identified several overloads on the transmission and subtransmission networks, including some of the transform-ers serving the subtransmission system and transformers serving distribution loads. On the transmission level, several lines overload with all lines in; that is to say, without any system outage. For instance, some lines along the Essex–to–Williston transmission path experienced thermal overload, which oc-cured even with the Plattsburg-Sand Bar tie line modeled at 0 MW instead of the 150 MW flow that can occur during the spring season. Under contingency conditions, the overloads can be particularly severe along the Essex–to–Williston path, and may also occur along the Highgate–to–Essex path and the New Haven–to–West Rutland path. In addition, several VELCO transformers were observed to overload, mostly along the western side of the state in the vicinity of the noted transmission line overloads.
These high flows have two effects, which are not reliability concerns, but should be characterized as negative. The first is that system losses are higher with the high amount of solar PV together with the high amount of other renewable generation. With 1000 MW of solar PV contributing to higher flows on the transmission system, losses increased to more than twice the amount that would be expected dur-ing low loads on a spring day. Generally, losses would be on the order of 30 MW on the Vermont sys-tem, but under the high solar PV scenario, losses increased to approximately 80 MW.
The second negative effect relates to the capability of the Vermont transmission system to import power from New York along the Plattsburgh‒Sand Bar path, and from New Hampshire along the Comer-ford‒Granite path. With the amount of solar PV modeled in this study, Vermont will not be able to im-port as much from these areas, which could cause negative impacts in New York, New Hampshire and other parts of the system that have been designed with the assumption that Vermont can absorb or in-ject power depending on system needs. Wind generation in New York that is typically exported to Ver-mont may be curtailed in order to prevent overloads on the Vermont transmission system. However, under certain system conditions, it may not be possible to completely stop flow from New York to Ver-mont. In this case, it would become necessary to curtail dispatchable generation in Vermont in order to bring the system back into a reliable operating state.
On page 36 below is a listing of system concerns and their proposed mitigation measures. These issues may be postponed or eliminated by a non-transmission alternative to the extent they are caused exclu-sively by the amount of solar PV generation connected to the grid.
The transmission cost estimates noted in the table are high-level conceptual estimates, which tend to be much higher than actual costs because they include a large amount of contingency, a dollar amount set aside to account for uncertainties at this early stage of planning. As uncertainties are removed in latter

2018 VERMONT LONG-RANGE TRANSMISSION PLAN PAGE 35
stages of project development, cost estimates can generally be reduced. Further, alternative system up-grades, such as energy storage, may be able to achieve acceptable performance at a lower cost. A more detailed analysis will be necessary to refine the system upgrade design. The above information is pro-vided to indicate how the system would be affected by a large amount of solar PV generation, which should allow us to develop a mitigation plan. The plan does not address distribution level concerns nor the cost of potential distribution upgrades.
Page 37 features a diagram illustrating the thermal impacts of the high solar PV scenario on the trans-mission system. The blue circles show the location of overloaded 115/34.5 kV and 115/46 kV transform-ers. The blue solid lines indicate overloaded 115 kV lines. The solid red line is the current SHEI area, within which generation has been curtailed under certain system conditions to prevent system concerns associated with transmission outages. The dotted red lines illustrate the progression of the transmission constraints for this high solar PV scenario. As solar PV generation is increased, the SHEI area will extend further south and encompass dispatchable renewable generation that is not currently exposed to cur-tailments. For example, as the export constrained area expands to SHEI-2 and SHEI-3, the 10 MW Geor-gia Mountain Wind plant will be exposed to curtailments. Within SHEI-4 and SHEI-5, the 50 MW McNeil biomass plant will be exposed to curtailments. It is difficult to estimate the timing of the expansion of constraints because the timing would depend on how quickly solar PV grows in individual zones, and how the system is operated in the future. For example, export constraints could jump from the current boundaries of SHEI to SHEI-3 if solar PV grows significantly in Colchester or at Global Foundries and flows along the Plattsburg–Sand Bar tie line cannot be reduced sufficiently. These findings suggest that re-strictions on solar growth in a particularly area may not be an effective strategy to prevent further sys-tem constraints, and that a more effective approach that also facilitates achievement of Vermont’s re-newable energy goals may be to attract development to areas that will not aggravate system concerns, rather than prohibit it in areas that will do so. Such solutions should be considered, together with other measures under study.

2018 VERMONT LONG-RANGE TRANSMISSION PLAN PAGE 36
THERMAL IMPACTS OF HIGH SOLAR PV SCENARIO
No. Location Upgrade Need Category Length (Miles)
Estimated Cost
Affected DUs
Lead DU
1 SHEI Install a 2nd 115 kV line between Highgate and
Georgia substations Voltage collapse Bulk 17 $70M All Vermont
DUs GMP
2 SHEI Replace Irasburg transformer
Transformer overload at Irasburg substation
Predom-inantly Bulk N/A $5M All Vermont
DUs GMP
3 Essex-Tafts Cor-
ner-Williston 115 kV lines
Install a 2nd 115 kV line between Limekiln and Williston substations
115 kV and 34.5 kV line overloads between Essex
and Queen City substations. Transformer overload at
Queen City and Tafts Corner substations.
Bulk 11 $60M All Vermont DUs GMP
4 Williston-New Ha-ven 115 kV line
Rebuild 115 kV line be-tween Williston and New Haven substa-
tions
115 kV line overload be-tween Williston and New
Haven substations. Bulk 21 $90M All Vermont
DUs GMP
5 Middlebury-Flor-ence 115 kV line
Remove terminal limi-tation at Middlebury
substation
115 kV line overload be-tween Middlebury substa-
tion & Florence Tap. Bulk N/A $1M All Vermont
DUs GMP
6 New Haven Replace New Haven transformer
Transformer overload at New Haven substation
Predom-inantly Bulk N/A $5M All Vermont
DUs GMP
7 Middlebury Replace Middlebury transformer
Transformer overload at Middlebury substation
Predom-inantly Bulk N/A $5M All Vermont
DUs GMP
8 Hartford Replace Hartford transformer
Transformer overload at Hartford substation
Predom-inantly Bulk N/A $5M All Vermont
DUs GMP
9 Windsor Replace Windsor transformer
Transformer overload at Windsor substation
Predom-inantly Bulk N/A $5M All Vermont
DUs GMP
10 Gorge-McNeil 34.5 kV
Rebuild Gorge-McNeil 34.5 kV line 34.5 kV Line overloaded Subsystem 2.3 $1M GMP and
BED GMP
11 Ryegate-McIndoes 34.5 kV
Rebuild Ryegate-McIn-does 34.5 kV line 34.5 kV Line overloaded Subsystem 2.0 $1M GMP and
NGRID GMP
12 Ryegate Replace Ryegate trans-former
Transformer overload at Ryegate substation Subsystem N/A $5M GMP GMP
13 Fairfax Falls-E Fair-fax 34.5 kV
Rebuild Fairfax Falls-E Fairfax 34.5 kV line 34.5 kV Line overloaded Subsystem 3.3 $2M GMP and
VEC GMP
14 N Troy-Mosher’s 46 kV
Rebuild North Troy-Mosher’s tap 46 kV
line 46 kV Line overloaded Subsystem 1.8 $7M VEC VEC
15 Bethel-Woodstock 46 kV
Rebuild Bethel-Wood-stock 46 kV line 46 kV Line overloaded Subsystem 16.3 $9M GMP GMP
16 Smead Rd-E Pitts-ford 46 kV
Rebuild Smead Rd-E Pittsford 46 kV line 46 kV Line overloaded Subsystem 20 $9M GMP GMP
17 Quechee-Wind-sor#4 46 kV
Rebuild Quechee-Windsor #4 46 kV line 46 kV Line overloaded Subsystem 14 $11M GMP GMP
18 Windsor-High-bridge 46 kV
Rebuild Windsor-High-bridge 46 kV line 46 kV Line overloaded Subsystem 6 $3M GMP GMP
19 Seminary St-Mid-dlebry Hy 46 kV
Rebuild Seminary St-Middlebury Hy 46 kV
line 46 kV Line overloaded Subsystem 2.6 $2M GMP GMP
20 Weybridge-New Haven 46 kV
Rebuild Weybridge-New Haven 46 kV line 46 kV Line overloaded Subsystem 5.1 $3M GMP GMP
21 Bradford-Wells River 46 kV
Rebuild Bradford-Wells River 46 kV line 46 kV Line overloaded Subsystem 13 $7M GMP GMP
22 Hartford-Norwich 46 kV
Rebuild Hartford-Nor-wich 46 kV line 46 kV Line overloaded Subsystem 0.2 $0.1M GMP GMP

2018 VERMONT LONG-RANGE TRANSMISSION PLAN PAGE 37
LOCATION OF TRANSMISSION CONSTRAINTS AS A RESULT OF HIGH SOLAR PV
See the right-most column in the table on page 43 to get a sense of the amount of the solar PV that could be hosted in certain load zones based on transmission capacity alone, and certain study assump-tions that may be optimistic. These amounts can be interpreted as total solar zonal PV limits beyond which a constraint will emerge. The timing of a particular constraint will depend on various factors de-scribed in the bulleted list of assumptions on pages 41 and 42. In theory, constraints can be identified as part of generator interconnection studies to the extent these studies evaluate transmission system im-pacts. Otherwise, constraints will be identified and managed in real-time by the system operator.

2018 VERMONT LONG-RANGE TRANSMISSION PLAN PAGE 38
Additional concerns at the subtransmission and distribution levels
The software utilized for this analysis does not model the distribution system, and therefore cannot speak to distribution system limitations; however, transformer overloads identified as part of this analy-sis may indicate where distribution concerns are likely to occur. In addition to the thermal overloads dis-cussed above on page 36, high voltage was observed at many substations serving distribution loads, and in several pockets of the subtransmission network. This indicates a need to install or modify equipment capable of providing voltage control, which could include: adjusting transformer tap changers; installing transformers with automatic tap changer voltage control; requiring that all generators (including small-scale generators) regulate voltage; and installing dynamic voltage control equipment.
Non-transmission alternative solutions
In addition to the solutions discussed above, a solution set was created using NTAs. Battery storage sys-tems and dynamic reactive devices were simulated to resolve system concerns without complete reli-ance on new or upgraded transmission or subtransmission lines. Batteries were assumed to operate for four hours continuously, but the charging duration may be shorter depending on the economics of indi-vidual projects and the duration of potential system constraints.
It was assumed that voltage control would be implemented where necessary at the distribution level, which would reduce high voltages on the subtransmission network. The analysis found that over 100 MVAr of dynamic reactive support would be needed at the distribution and subtransmission levels to ensure that voltages remain within acceptable range. In order to address thermal violations on the sub-transmission, batteries were sited at the stations noted in the following table. To reduce the flow of power on the overloaded lines, both the real and reactive power output of the battery were utilized.
In exception to the NTA concept, the 46 kV line from Taftsville to the VELCO Windsor station was as-sumed to be reconductored at a cost of approximately $8 million. This was to prevent the need for ap-proximately 50 MW more battery storage in the area, which would create an inoperable condition.
A battery sized at 150 MW was placed at the Essex 115 kV substation to resolve an overload of the 34.5 kV path from Essex to Tafts Corner caused by the outage of the parallel 115 kV transmission path. In the traditional “wires” solution set, this overload is addressed by the installation of a new 115 kV line be-tween the Lime Kiln and Williston substations.
SUBTRANSMISSION AND TRANSMISSION BATTERIES IN SUPPORT OF NTA SOLUTIONS
Location MW MVAr Cost Location MW MVAr Cost Essex 115 150 - $360M
Smead Road 46 40 30 $96M
Lowell 46 15 12 $36M Agrimark Tap 46 1.5 0 $4M Crossroads 46 35 25 $84M Fairfax Falls 34 8.5 6 $20M Pleasant St 46 5 4 $12M Johnson 34 6 4 $14M Bethel 46 40 30 $96M Websterville 34 3 2 $7M Hartford VT 46 8 6 $19M Ryegate 34 12 10 $29M Ryegate 46 1.5 1 $4M McNeil Tap 34 20 15 $48M White River Jct 46 30 25 $72M Tafts Corner 34 15 12 $36M Windsor V4 46 16 12 $38M Queen City 34 10 8 $24M

2018 VERMONT LONG-RANGE TRANSMISSION PLAN PAGE 39
ANALYSIS OF 1000 MW PV UNDER DIFFERENT SYSTEM CONDITIONS
Additional analysis was performed under a MW ratio share distribution, where 1000 MW of PV was placed on load buses proportionately to the load on those buses, as shown on page 26. Load and gener-ation duration curves were reviewed to determine which combination of load and generation levels to test. The 620 MW load level tested so far can be exceeded for 80 percent of the day time (7 AM to 7 PM) hours. In this sensitivity analysis, a 745 MW load level was also tested to represent the load level that can be exceeded for 20 percent of the day time hours. The maximum generation dispatch scenario tested so far represents less than 1 percent of the day time hours. Two other dispatches were tested, one that can be exceeded for 20 percent of the day time hours and another that can be exceeded for 80 percent of the day time hours. The following table shows the matrix of cases tested, with the probability of the load or generation level being exceeded noted between the parentheses. The generation levels represent the output of northern generators from Vergennes northward, in addition to Highgate im-ports. In cases 1 and 4, the generation reduction was achieved by reducing the total output of Kingdom Community Wind, Georgia Mountain Wind, and Sheffield Wind by 70 MW. In cases 2 and 5, generation was further reduced by turning off the Swanton Hydro, Lamoille Hydro, and McNeil generators.
MATRIX OF CASES TESTED
Case # VT Load Level Generation Dispatch 0 620 MW (80%) 191.4 MW (less than 1%) 1 620 MW (80%) 121.4 MW (20%) 2 620 MW (80%) 45.5 MW (80%) 3 745 MW (20%) 191.4 MW (less than 1%) 4 745 MW (20%) 121.4 MW (20%) 5 745 MW (20%) 45.5 MW (80%)
Below is a table comparing system impacts.
SYSTEM IMPACTS UNDER VARIOUS SYSTEM CONDITIONS

2018 VERMONT LONG-RANGE TRANSMISSION PLAN PAGE 40
A large difference between these six cases and the original analysis, which was based on the 2018 solar PV distribution, is the number of transformers requiring upgrade. This is because the MW ratio distribu-tion of solar PV is more evenly spread out and thus eliminates large PV clusters connected behind indi-vidual transformers. As can be expected, as either generation decreases or state load increases fewer system issues emerge, particularly on subtransmission lines; however, until Case 5 no drastic reduction appears in required upgrades and costs.
OPTIMIZED SOLAR PV DISTRIBUTION
In light of the system concerns identified in the initial solar PV analysis and with feedback from the VSPC, VELCO performed additional analysis to determine the amount of solar PV that could be con-nected to the Vermont electric grid while minimizing the amount of transmission or subtransmission up-grades. First, in order to improve voltage performance, we assumed that solar PV installed after 2018 would be required to control voltage in accordance with the new IEEE 1547 standard. When paired with less stringent post-contingency voltage limits on the subtransmission system than used in the first analy-sis, system voltage performance could be improved to reduce or eliminate the number of reactive power devices needed. Second, additional solar PV was allocated on a load zone by load zone basis until a transmission or subtransmission limiting element was allowed to reach just below 105% of its rating after a system event. This flexibility is to account for any future distributed storage or automatic load or generation management solution that may be implemented from time to time. In some cases, increas-ing solar PV in one zone increased the loading on a limiting element in an adjacent zone. When this oc-curred, solar PV was reduced in that second zone to allow more solar PV to be added in total.
Pre-existing overloads were observed on the subtransmission system. The 46 kV line from Taftsville to Windsor, the 34.5 kV line from Comerford to Monroe, and the 34.5 kV line from the McNeil tap to the 46Y1 tap were all found to overload under the system conditions tested, prior to the addition of new solar PV. These violations were not considered to limit the amount of solar PV in any zone.
Though the amount of solar PV in each zone was set individually, the distribution of solar PV among load-serving substations within that zone was assumed to be the same as in 2018. This determination was made for ease of implementation considering the quantity of system adjustments necessary to test increasing levels of solar PV penetration; however, within individual zones, the differences between the 2018 distribution and the more homogeneous MW ratio distribution were not considered substantial in terms of system performance.
Summary of results
In order to better utilize available transmission capacity, solar PV was modeled in the IBM zone, now the site of the Global Foundries plant in Essex. The natural limit for PV in that zone given rooftop and park-ing lot area is unknown, but it was assumed that 20 MW could be added at the Global Foundries site.
The Sheffield-Highgate Export Interface limit was modeled slightly higher than its present value, in line with contemplated system upgrades. Even with that increase, it was necessary to reduce KCW to 38 MW, and no new solar PV was allocated to load zones within the boundaries of the SHEI area. Further, allocation of solar PV to zones adjacent to the SHEI area was limited to prevent reverse power flow on to the transmission system, which could create exposure to an expansion of the SHEI area. The flows on the St. Johnsbury, Lyndonville, and St. Albans transformers were limited to 0 MW, at which point alloca-tion of solar PV to that zone was ceased.

2018 VERMONT LONG-RANGE TRANSMISSION PLAN PAGE 41
By allocating solar PV to each load zone until constrained by a limiting element, it was found that the Vermont electric grid can accommodate 1058 MW of solar PV under the system conditions tested. Power flow testing did not reveal any unacceptable violations of system criteria. Consequently, no trans-mission or subtransmission line upgrades were necessary except in the SHEI area as discussed above. However, the assumptions made in this study are substantial, and only by closely adhering to them in practice would the level of renewables penetration studied be possible without the need for significant system upgrades.
Overloads were observed for five distribution transformers located at the Moore 69 kV substation, the East Arlington 46 kV substation, and the E Johnson, Pratt & Reid and Sharon 34.5 kV substations. The transformers would need to be upgraded, or these overloads may be avoided by reallocating solar PV to other distribution substations. None of the limiting elements identified were transmission lines, though several transmission transformers were identified. The following table shows the transmission trans-former or subtransmission element that limits the amount of solar PV in each zone. Any increase in these zones incremental to the 1058 MW modeled in this scenario would require upgrade of the corre-sponding equipment. In addition, a significant departure from the optimized distribution could require transmission line upgrades.
ELEMENTS LIMITING TOTAL SOLAR PV IN EACH ZONE
Element Name Voltage Level planning Zones Limited
Irasburg Transformer 115/46 kV Johnson, Morrisville
Middlebury Transformer 115/46 kV Middlebury
North Rutland Transformer 115/46 kV Rutland
Little River – Duxbury Switch 34.5 kV Morrisville, Johnson
Gorge – 46Y1 Tap 34.5 kV Burlington, BED
Ryegate – McIndoe Falls 34.5 kV Montpelier
Windsor – Highbridge 46 kV Central, Ascutney
Joy Manufacturing – Charlestown 46 kV Ascutney
Hydeville – Blissville 46 kV Florence, Rutland
West Dummerston – Newfane 46 kV Southern
In the tables and figure below, the distribution of solar PV is optimized based on transmission capacity alone, and is presented by load zone, distribution utility, and Regional Planning Commission. The system was able to host 1058 MW only by making certain assumptions that may not be entirely realistic. Solar PV will need to be installed exactly as laid out in this optimized distribution. This is unlikely to occur be-cause of several objectives or constraints including project economics, aesthetic impacts, regional ac-ceptance of solar PV levels significantly higher than regional loads, and so on. As the maximum amount of solar PV in any zone deviates from the theoretical optimized distribution, other zones will be affected because maximum zonal solar PV levels are interdependent. Below are some of the assumptions that can affect the amount of solar PV that can be hosted.
• Imports from external AC ties were reduced to 0 MW. During the periods where solar PV is max-imized, other renewable resources in Vermont, New Hampshire and New York will likely be at maximum as well. Some of the Vermont ties can be adjusted, but they may not be able to be

2018 VERMONT LONG-RANGE TRANSMISSION PLAN PAGE 42
adjusted all the way down to 0 MW during times of high renewable energy production, and cur-tailments may be necessary at those times.
• Solar PV projects were assumed to provide voltage support, which is necessary to increase host-ing capacity.
• Daytime gross load, without solar PV, was not reduced below current levels. Ongoing energy ef-ficiency measures may make this assumption unworkable, and every MW of load reduction will make it more difficult to host additional solar PV.
• Equipment thermal capacity was allowed to be exceeded by 5 percent to account for occasional curtailments, future storage, load management, and other network management measures.
• Existing system concerns, not related to solar PV additions, were assumed to be addressed. Oth-erwise, the hosting capacity of the system will be reduced.
• Future solar PV was not modeled in the SHEI area. In reality, limiting PV in this area would keep local customers from benefiting from a state program, and is not consistent with current efforts to mitigate at least some of the current system constraints. This solar PV analysis is not an en-dorsement of any prohibitions on adding generation in the SHEI area.
• Distribution system concerns were assumed to be addressed. System concerns will likely emerge on the distribution system before the transmission system is affected. The amount of solar PV may be lower if distribution constraints are not resolved.
• Larger scale ISO-NE interconnected generation or elective transmission projects were not added to the system. In reality, several larger scale projects will likely interconnect to the system be-cause of project economics and FERC open access requirements.

2018 VERMONT LONG-RANGE TRANSMISSION PLAN PAGE 43
OPTIMIZED SOLAR PV DISTRIBUTION BY LOAD ZONE
ZONE NAMES GROSS LOADS
(MW)
INSTALLED SOLAR PV AS
OF 2018 (MW)
OPTIMIZED SOLAR PV
DISTRIBUTION (MW)
NEWPORT 19.8 10.3 10.3
HIGHGATE 23.8 15.5 15.5
ST ALBANS 39.7 20.9 42.9
JOHNSON 6.6 5.4 16.4
MORRISVILLE 24.3 5.7 50.7
MONTPELIER 48.6 29.9 104.9
ST JOHNSBURY 14.7 5.1 12.1
BED 39.8 5.6 5.6
IBM 60.6 0.0 20.0
BURLINGTON 94.1 74.4 107.4
MIDDLEBURY 19.7 29.7 57.7
CENTRAL 37.6 50.2 91.2
FLORENCE 22.6 0.2 21.2
RUTLAND 61.7 40.6 164.6
ASCUTNEY 39.5 14.8 112.8
SOUTHERN 65.6 42.9 224.9
TOTAL 619 351.2 1058.3

2018 VERMONT LONG-RANGE TRANSMISSION PLAN PAGE 44
SOLAR PV DISTRIBUTION OPTIMIZED BASED ON EXISTING TRANSMISSION CAPACITY
ACRPC Addison County Regional Planning Commission NRPC Northwest Regional Planning Commission BCRC Bennington County Regional Commission RRPC Rutland Regional Planning Commission
CVRPC Central Vermont Regional Planning Commission SWCRPC Southern Windsor County Regional Planning Com-mission
CCRPC Chittenden County Regional Planning Commission TRORC Two Rivers-Ottauquechee Regional Planning Com-mission
LCPC Lamoille County Planning Commission WRPC Windham Regional Planning Commission NVDA Northeastern Vermont Development Association

2018 VERMONT LONG-RANGE TRANSMISSION PLAN PAGE 45
OPTIMIZED SOLAR PV DISTRIBUTION BY UTILITY
ZONE NAMES INSTALLED SOLAR
PV AS OF 2018
(MW)
ADDITIONAL SOLAR
PV (MW)
OPTIMIZED SOLAR
PV DISTRIBUTION (MW)
BED 5.6 0 5.6
GMP 303.2 593.7 896.9
IBM 0 20.0 20.0
OMYA 0 18.7 18.7
VEC 26.2 12.3 38.5
VPPSA 8.1 38.6 46.7
STOWE 2.1 10.5 12.6
WEC 6.1 13.2 19.3
TOTALS 351.2 707.1 1058.3
OPTIMIZED SOLAR PV DISTRIBUTION BY REGIONAL PLANNING COMMISSION
ZONE NAMES
INSTALLED
SOLAR PV AS
OF 2018 (MW)
ADDITIONAL
SOLAR PV (MW)
OPTIMIZED
SOLAR PV
DISTRIBUTION (MW)
REGIONAL TARGETS
(EXISTING SOLAR + ALL
NEW RENEWABLES) 2050 (MW)
REGIONAL TARGETS
(EXISTING SOLAR + ALL
NEW RENEWABLES) 2035 (MW)
REGIONAL TARGETS
(EXISTING SOLAR + ALL
NEW RENEWABLES) 2025 (MW) NOTES
ADDISON (ACRPC) 40.3 29.9 70.2 143.6 109.8 71.8
BENNINGTON (BCRC) 17.1 83.2 100.3 121.9 85.9 48.9 1
CENTRAL VERMONT (CVRPC) 27.8 71.3 99.1 342.5 151.4 103.6 2
CHITTENDEN (CCRPC) 74.4 59 133.4 393.6 275.7 157.9 3
LAMOILLE (LCPC) 9.8 44.6 54.4 135.0 91.9 48.7 4
NORTHEASTERN (NVDA) 16.9 14.9 31.8 27.4 22.6 17.9 5
NORTHWEST (NRPC) 31.8 14.7 46.5 247.0 166.2 87.9
RUTLAND (RRPC) 38.7 130.5 169.2 304.4 113.4 50.4
SOUTHERN WINDSOR (SWCRPC) 15.2 91.4 106.6 154.7 80.7 43.6 2
TWO RIVER OTQ (TRORC) 50.4 46 96.4 190.5 125.5 66.5 6
WINDHAM (WRC) 28.8 121.5 150.3 60.7 45.7 30.7 4
TOTALS 351.2 707.1 1058.3 2121.2 1268.8 728.0
Notes:
1 2025 and 2035 targets estimated from a target range 2 Estimated from energy targets. Assumed all new renewables are solar PV at 15% capacity factor 3 2050 target estimated from a target range. 2025 and 2035 targets estimated by dividing the 2050 target into three
parts 4 2025 and 2035 targets estimated by dividing the 2050 target into three parts 5 2050 target estimated from the energy target. 2025 and 2035 targets estimated by dividing the 2050 target into three
parts 6 From a TRORC presentation at a September 28, 2015 public meeting

2018 VERMONT LONG-RANGE TRANSMISSION PLAN PAGE 46
Observations from the results of the solar PV analysis The solar PV analysis is not intended to lay out a precise prediction of system impacts because several factors can affect system performance. Beyond the bulleted list of assumptions on pages 41 and 42, so-lar PV distribution is affected by environmental, aesthetic, and land use objectives among others. As en-ergy storage becomes increasingly feasible, storage deployment will facilitate solar PV hosting capacity, provided that storage is properly located and designed with sufficient charging capacity.
The main message is that location of load and generation matters with respect to the performance of the electric grid. A small amount of additional renewable generation can cause system concerns in cer-tain regions and aggravate generation curtailment. Our study results indicated that the SHEI system con-cerns may be expanded to other parts of Vermont depending on not only the amount of additional re-newable generation, but also its location. This solar PV analysis shows that the integration of 1000 MW of solar PV into the Vermont electric grid is not trivial. If solar PV continues to be developed in the same way as it has in the past, the analysis suggests that solar PV growth will introduce system operating con-cerns that may require load and generation management, energy storage, as well as reinforcements to Vermont’s transmission, subtransmission, and distribution systems. The impacts may be mitigated by careful planning of solar PV deployment on a statewide basis. Inverters should be required to follow the requirements of the recently approved IEEE 1547 standard. Utilities should be able to actively control generation and load, including small-scale generation. An incentive/penalty system could be put in place to encourage generation in areas where sufficient grid capacity exists, while continuing to provide equal access to renewable energy to every customer. The results of this study are a call to renewed focus on careful consideration in planning, technology deployment and siting of distributed generation.
2018 VERMONT LONG-RANGE TRANSMISSION PLAN PAGE 47
Public input on the 2018 plan update VELCO conducted an extensive public engagement process to meet the requirements of 30 V.S.A. 218c and to actively solicit input on the 2018 Vermont Long-Range Transmission Plan—Public Review Draft. Opportunities for public input included public meetings hosted by VELCO, presentations at regional planning commissions, a webinar for interested members of Renewable Energy Vermont, an online com-ment form, and an invitation for comments by mail or phone. Prior to the Public Review Draft, the VSPC reviewed and provided input to a VSPC draft through the process established in Docket 7081.25
In March, VELCO announced two public forums on the draft plan: in Brattleboro on May 2 and in Mont-pelier May 9. The forums were promoted with an email invitation, followed by a postcard mailing sent to over 1000 contacts. VELCO also advertised the public forums with two days of display ad in the Addi-son Independent, Bennington Banner, Burlington Free Press, Brattleboro Reformer, Caledonia Record, St. Albans Messenger, Rutland Herald, Stowe Reporter, Times Argus, and Valley News, and a run of online advertising in Vermont Digger. These and other media also received media releases. In addition to the two public forums, VELCO offered to attend and make a presentation of the draft plan to each of the 11 regional planning commissions (RPC). Six RPCs requested and scheduled presentations.
As required by law, VELCO created a verbatim record of the public questions and comments from the public forums. The transcribed comments are available at http://www.velco.com/2018-plan-input.
Although the plan does not identify any transmission upgrade needed during the 10-year horizon, the interest in energy issues is higher than in past years and was focused in particular on the solar PV analy-sis that is a new feature of the 2018 plan.
The vast majority of discussion at the public forums consisted of questions from the audience and re-sponses from VELCO. Many issues raised at the forums were either already covered within the body of the plan or fall outside its scope.26 The following list reflects the areas of interest discussed in the public forums and comments. Where specific feedback was given on the plan, items are followed by a brief de-scription of how the issue was addressed in this final version of the plan (shown in italics).
• A number of participants expressed appreciation for the work reflected in the plan.
• A few participants asked for clarification or greater clarity in the plan regarding the distinction between nameplate capacity of distributed generation versus its effective capacity to serve load or capacity factor. Clarification was added on page 25.
• One participant expressed concern that more people did not attend the Brattleboro meeting, questioning how the meeting was promoted. As noted above, VELCO conducted extensive adver-tising and direct mail to promote the meetings.
• With regard to grid resilience and climate change, participants asked how these issues were taken into account in the long-range transmission plan and whether any hardening of the sys-tem or new solutions such as microgrids will be needed as we experience increased extreme
25 For more information about this process see https://www.vermontspc.com/about/key-documents
26 For issues beyond the scope of the plan, we urge readers to consult the Vermont Comprehensive Energy Plan, for which a public engagement process associated with a 2015 update was underway at the time of publication. The 2011 CEP, as well as the 2015 update process, can be accessed at http://www.vtenergyplan.vermont.gov/

2018 VERMONT LONG-RANGE TRANSMISSION PLAN PAGE 48
weather. Grid resilience was noted in the first bullet on page 21. The third bullet was revised to further describe how grid resilience is being addressed at this time.
• Participants expressed the need to consider demand response or other means to shift load to midday to address issues raised in the solar PV analysis. Load management was mentioned in several locations in the plan as one of the means to address solar PV integration issues including page 1 (introduction) and page 17. As stated in several places in the report, various tools exist that have the potential to mitigate system challenges identified in the solar PV analysis. The analysis assumes these measures are not in place so as to identify the scope of the issues that will need to be addressed at the level of solar deployment studied in the Solar Pathways project.
• Many participants addressed various factors related to forecast assumptions in the plan related to electric vehicle adoption.
o Some asked about the source of EV projections. The source of EV projections was noted in the paragraph on page 17.
o Several people felt the projections for EV adoption were too low. As stated above, the EV projections used in the forecast are based on the best available information, drawing on the expertise of Drive Electric Vermont (VEIC). Because this plan is required to be up-dated every three years, there will be an opportunity in 2021 to adjust the forecast up-ward if the adoption curve gets steeper.
• A number of questions and issues were raised with regard to the role of Hydro-Québec in Ver-mont’s energy supply and its influence on the ability to host distributed generation within the state.
o With regard to energy supply, several participants observed that the plan talks about imports from New York, but not from Canada. They suggested making the role of the tie with Canada clearer. The use of the Highgate converter was described at the bottom of page 11.
o Several people sought greater clarity regarding the role the Hydro-Québec contract plays in the solar PV analysis, and related assumptions. Greater clarity was requested on how utility contracts with Hydro-Québec affect the ability to host PV and other renewa-bles in Vermont. The Hydro Québec contracts flow over the Highgate converter, which is a resource that has the same effect as generation resources. The assumption regarding how generation and the Highgate converter were modeled was described in the first par-agraph on page 32, and the effect of generation and the Highgate Converter on the abil-ity to host solar PV was covered on page 39.
o Participants asked whether Hydro-Québec can provide more electricity to Vermont than it does today and whether this would be a means to reach Vermont’s renewable energy goals. VELCO was also asked whether this strategy would result in a greater use of our ties with Canada to serve Vermont load, rather than as a means to transmit power to southern New England. Hydro-Québec can provide more electricity provided that the transmission system is reinforced to accommodate additional imports, which would in-crease tie flows.
o Participants asked whether the Hydro-Québec contract is limiting local generation. The Hydro-Québec contract is not limiting local generation any more than other Vermont generation resources.
• A number of issues and questions were raised with regard to the load forecast underlying the plan.

2018 VERMONT LONG-RANGE TRANSMISSION PLAN PAGE 49
o A participant asked whether Itron’s load forecasting for the plan was strictly based on regression analysis, which assumes linearity, or whether the plan considered the possi-bility of nonlinear behavior of peak load. The models can be found in the load forecast report provided via a link on page 15. The exponents are not 1, which would indicate non-linearity.
o A participant observed that past peaks have consistently fallen short of the forecast and asked how this was taken into consideration in the present forecast. The forecast model (available through the link on page 15) is complex and includes long-term weather trends as well as multiple other variables. Historical peaks are taken into account, but they are weather normalized to remove the effects of yearly weather variability. Fore-casts cannot be directly compared against historical peaks without normalizing the data. Forecasts necessarily include uncertainties; the three-year update cycle provides a means to make timely adjustments and adapt to emerging trends.
• A number of participants raised issues and questions regarding tools for addressing the trans-mission constraints identified in the plan.
o A few participants noted VELCO’s identification of new IEEE 1547 smart inverter stand-ards as a helpful tool for addressing grid issues, and asked for clarity about whether these standards would apply retroactively to existing intermittent distributed genera-tion. The standard is not retroactive.
o VELCO was asked whether advanced metering could be better leveraged to help solve the curtailment problems. Smart meters have already been deployed across the state, and they can help as a part of a load management system where load can be increased remotely at the right time through communication and control.
o VELCO was asked whether the high solar analysis took into account the potential value of storage and Static Var Compensator equipment to address the constraints. The an-swer is yes.
• Specific suggestions for edits to the plan included the following.
o The difference between 0 and 25 MW on the legend is confusing: for instance, does Global Foundries have 0 capacity to add PV in Essex Junction? The actual amount can be found in the table on page 43.
o The report is too technical and needs a summary for the average citizen. The report was meant to be easily understood by the general public despite its purpose to present a technical study of Vermont’s grid. We will continue to work to write in plain language, spell out acronyms and provide a glossary. However, a certain level of detail is necessary to allow stakeholders to evaluate solutions.
o Please provide the voltage overload impact table as compared to the thermal overload for the high-solar analysis. We have not made this change because we concluded that the thermal overload data are sufficient to convey the concerns associated with integrat-ing 1000 MW of solar PV.
• In some areas, participants suggested information that would be helpful to add to the plan.
o Depict how loss of load exposure compares to the planning zones. This analysis was not essential to the report and was not added.
o One participant expressed appreciation for the chart showing capacity by regional plan-ning commission, and suggested an overlay on the zonal map of what is needed to meet Vermont load. The optimized distribution map was revised accordingly.

2018 VERMONT LONG-RANGE TRANSMISSION PLAN PAGE 50
o VELCO was asked to clarify whether the picture presented in the report was representa-tive of what would happen only in a 90 percent solar scenario, or would it be valid for some other mix of distributed generation. The system concerns are due to the amount and location of generation, not the source of the generation. A different mix of genera-tion would not affect the results significantly.
o With the results showing transmission constraints expanding beyond SHEI, but timing unknown, are there estimates on the locations and amounts of new renewable genera-tion that can be shared by county or region to give a sense of scale and timing of the constraint expansion? This information is provided by region on page 45.
o One participant suggested that VELCO provide further detail on the other pathways that could help address curtailment and hosting capacity issues. The specific suggestion was made to expand on the discussion on page 46 of the draft plan. In 2017, VELCO commis-sioned an evaluation of 46 different “cases” or potential solutions to current curtailment issues in the SHEI area.27 Following that study, the Vermont utilities began collaborating on moving from the evaluation to solution selection, including the consideration on non-wires alternatives. That work was underway at the time of this publication and will be available as work products are finalized.
• With regard to the issue of increased line losses identified in the plan, a participant asked to what degree loss savings on the distribution system associated with distributed generation might offset some of the increased transmission system losses. In some cases, distribution losses will be reduced to the extent the difference between generation and load is less than the load. In cases where that difference exceeds the load, distribution losses will also increase.
• Participants expressed concern about potential unintended consequences of VELCO’s high-solar scenario analysis. One participant expressed the concern that the map of optimized distribution will encourage developers to build in Vermont to serve needs in southern New England to use the grid capacity VELCO has identified. VELCO recognizes this downside risk, but conclude that the benefit of providing information that is essential to effective planning to meet Vermont en-ergy goals outweighs the risk. The risk can be addressed through open dialogue and transpar-ency.
• With regard to merchant transmission, participants asked for greater clarity regarding the im-pact if a large project, such as TDI’s Clean Power Link does get built. Until such a large proposed project becomes sufficiently certain, its system impact studies are completed, and its specific de-tails and associated upgrades are known, it is not possible to answer this question.
• As in 2015, the issue was raised of what Vermont utilities are doing to protect the grid from damage from geomagnetic disturbance associated with solar flares. In 2012, FERC and NERC ini-tiated a two-phase approach to address the threat to the grid of geomagnetic storms. As that process has unfolded VELCO and other transmission utilities have participated in regional activi-ties related to monitoring and protective action, and are following NERC standards requiring evaluation and mitigation of system impacts.
• A great deal of discussion focused on the high-solar scenario and the associated transmission constraints discussed in the plan.
27 Study results are available at https://www.vermontspc.com/library/document/download/5995/VELCO_SHEI_Study_FinalReport.pdf

2018 VERMONT LONG-RANGE TRANSMISSION PLAN PAGE 51
o Participants asked whether the issue of export constraints in the SHEI area was identi-fied in the 2015 plan. The 2015 plan did not describe these constraints in detail, but dis-cussed on page 8 of the plan the emerging difficulties requiring significant attention from system operators. The 2012 plan specifically stated, and depicted in a map, that generation in the northern tier of Vermont had reached the export capacity of the trans-mission system.28
o Some questioned why Vermont would continue to add renewable generation if there are constraints on the existing system. This is a policy question concerning alternatives to meet state policy goals and is outside the scope of this plan.
o Some suggested regional planning commissions could be seeking to increase load to re-solve the constraint issues. Coordinated planning that considers generation location, tar-geted load growth and load management can be an effective tool for mitigating grid constraints that emerge with increased distributed generation. Given the energy plan-ning responsibilities of regional planning commissions under Act 174, RPCs can play sev-eral important roles, including economic development that fosters load growth.
o VELCO was asked for clarity about whether transmission upgrades would allow new so-lar PV and existing renewable generators to export the power out of Vermont. The an-swer to this question is yes.
o Participants sought clarity about whether the high solar scenario took into account only approved and existing projects, or also included projects presently under review. The high solar PV scenario was developed without regard to the status of projects. The sce-nario is a possible future, which may or may not happen as modeled.
o Participants asked for clarification of the status of solutions to the SHEI constraints. Sev-eral questions were posed regarding the cost of upgrades to resolve the SHEI constraints and to accommodate solar growth to 1,000 MW PV growth. As indicated above, the Ver-mont utilities are collaborating on evaluating, costing and selecting solutions. That work was underway at the time of this publication and will be available as work products are finalized.
o One participant asked whether shutting generation off when it can’t be accommodated on the grid may be the least expensive option. The relative cost of curtailments com-pared to other solutions will be evaluated in the context of solution selection for the SHEI constraints.
o Participants asked for more information on the solutions to SHEI that VELCO tested and the cost estimates for those solutions. VELCO continues to post all its SHEI-related mate-rials on a publicly available website at https://www.vermontspc.com/grid-planning/shei-info .
Many questions and comments arose regarding storage as a means of addressing export con-straints.
o VELCO was asked whether a megawatt of storage is equivalent to a megawatt reduction in generation. They are equivalent at an instant in time when a storage device is being charged by 1 MW. Storage is different in that generation can be reduced indefinitely,
28 The 2012 plan is posted at https://www.velco.com/uploads/documents/2012LRTP_final_to_PSB.pdf

2018 VERMONT LONG-RANGE TRANSMISSION PLAN PAGE 52
whereas a storage device can be charged or discharged only consistent with its ability to store energy.
o Some participants suggested that the report should make very clear that solar can be better optimized and accommodated than the report implies by pairing with storage, time of use, and other technologies. The report indicates in multiple places (see pages 32, 35, 38, and particularly the concluding observations on page 46) that storage and other measures can and should be considered to mitigate the identified concerns.
o Several participants discussed the various barriers that will need to be overcome to fully implement storage solutions, including changes in the markets, and improving technol-ogy and economy of large scale batteries.
o Some suggested pumped storage as an option for complementing intermittent renewa-bles with storage.
o Participants asked if the assumptions, analysis, and findings regarding storage can be shared. Storage was modeled from a system performance perspective without account-ing for market considerations. All information is included in the plan.
A number of participants expressed concerns about the assumptions in the high solar scenario analyzed in the plan.
o It is not sensible to assume the worst case with regard to solar or the impact of flexible loads. VELCO did not model the worst case. For example, the load level could have been lower and the tie flows could have been higher. VELCO also tested several system condi-tions to show how system performance may be affected as the assumptions change.
o The 1000 MW PV curve does not seem consistent with the current reality. Consider a more realistic curve to get us to the same place, less steep now, increasing more stead-ily. The 1000 MW amount is the key assumption. The steepness of the curve does not matter to the analysis. The purpose of the analysis is to reveal what system constraints arise under various geographic distributions of 1000 MW of solar.
o Some suggested that VELCO should analyze intermediate levels of PV penetration be-tween the base case and the 1,000 MW. Testing intermediate levels of PV penetration may be a useful future exercise. For the purpose of the current report, VELCO focused on 1000 MW as a specific stretch goal that allows us to understand the limitations of the system with regard to the integration of solar PV. The 1000 MW level was selected be-cause of its consistency with another existing study that had wide stakeholder engage-ment, the Solar Pathways project.
• Many people expressed concern about the shortcomings of existing planning processes to deal with emergent issues regarding increased distributed generation.
o The current approach to planning does not produce the result of siting projects near load and in the most electrically advantageous places. In most instances, the developer locates a site and then looks for a customer. The current system is developer driven, and developers are not choosing good sites.
o Some regional planning commission representatives expressed frustration that they are not getting the information they need from the utilities to answer all the questions aris-ing in the context of Act 174.
o Participants asked how are RPCs in northern Vermont, which are counting on solar for their energy plans, going to meet their plans if they have limited additional capacity in
2018 VERMONT LONG-RANGE TRANSMISSION PLAN PAGE 53
their areas. Several options were mentioned in the plan, including but not limited to stor-age, load management, curtailment, and system upgrades.
o Some participants observed that the grid capacity issues in the analysis point out the need for integrated or coordinated planning. The transmission piece of the puzzle is less helpful than it would be to see all the components on one map, including fiber capacity, transmission, subtransmission and distribution.
o Several participants noted that the Vermont System Planning Committee could serve as an effective venue for coordinated planning to address the issues identified in the solar analysis.
o Some asked why the system is not being upgraded to accommodate the renewable en-ergy needed to meet the 90 percent renewable by 2050 state goal. Utilities, regulators and other stakeholders may ultimately determine that various system upgrades are needed to accommodate sufficient renewables to meet state policy goals.
o VELCO was asked whether VELCO or the Vermont distribution utilities would be produc-ing a similar plan for distribution systems. Distribution utilities are required to prepare and regularly update integrated resource plans. VELCO is not aware of the degree to which IRPs address or could address distribution constraints for distributed generation. No statewide requirement for planning transmission and distribution-level impacts of distributed generation currently exists. The VSPC process reviews constraints at all sys-tem levels — transmission, subtransmission, and distribution — but only addresses those issues arising due to load growth.
o It was observed that renewable projects sited in the region are selling renewable energy credits out of state, meaning that they won’t count toward state goals, but they do count in the context of Act 174 planning. This sends conflicting signals.
Renewable Energy Vermont submitted written comments on the plan. The comments are reproduced below along with an indication of how the feedback was incorporated into the plan, or why it was not.
While REV’s members find the base case assumptions of 50 MW a year for the next two years and then 30 MW a year for the following three years to be optimistic based on current state law, renewable energy siting and permitting burdens, and deficiencies in the distribution system, the general volume is not unreasonable. We recommend that the plan make clear that for the base case of PV adoption, no transmission deficiencies are forecasted to exist.
Transmission deficiencies were found assuming generation continues to grow in areas with limited transmission capacity. See the last paragraph on page 32.
REV notes that VELCO did not model potential thermal constraints resulting from the base case scenario, although it informed participants at the last VSPC meeting that no bulk system defi-ciencies would be expected as a result of the base case deployment. The plan should include model thermal overloads on the base case or explain why that was not modeled.
Transmission deficiencies were found assuming generation continues to grow in areas with limited transmission capacity. See the last paragraph on page 32.
The plan should incorporate additional mitigation or management strategies such as energy storage or demand response as a way to remedy grid constraints and incorporate higher levels of in-state renewable energy generation. The solar PV analysis appears to primarily focus on

2018 VERMONT LONG-RANGE TRANSMISSION PLAN PAGE 54
identifying areas where new renewable energy generation would be constrained due to trans-mission limitations of a hypothetical solar scenario without simultaneously including other non-transmission options.
The plan noted in several locations that storage and other measures can be utilized to mitigate some of the concerns identified.
Recognition that when an interconnecting generation project is evaluated by a utility and deter-mined to potentially cause impacts to electric system stability or reliability, currently the project is required to pay for necessary upgrades which also benefit the utility would be appreciated.
Project funding is discussed on page 8.
It should be clearly stated that current and future constraints exist due to the location of histori-cal and existing large generation, utility siting decisions, and design of the transmission based on historic and not current economic development and generation sources.
The plan should incorporate at least a qualitative discussion regarding grid resiliency due to in-creased extreme weather events and other impacts of climate change.
Grid resilience was noted in the first bullet on page 21. The third bullet was revised to further describe how grid resilience is being addressed at this time.
The draft plan does not appear to consider natural resource constraints impacting renewable energy deployment and location siting, nor constraints of regional planning commission compre-hensive energy plans.
From an economic perspective, the draft plan assumes no curtailment of existing generators. Curtailment is an economic method of increasing generation capacity and reliability in the sys-tem. This is why ISO-NE includes wind and hydro in the market-based generator dispatch system (and may add solar in the future). At times of high load additional system capacity can run at full output to meet peak demand. Conversely when load is low, some curtailment may be necessary to prevent system reliability issues. A modest amount of economic curtailment can be a low cost non-wires solution for higher penetration of renewable energy on the transmission system.
The last sentence on page 48 of the draft plan should be removed. “The results may also help inform the discussion of alternative ways to meet Vermont’s carbon reduction goals, such as in-creased imports of renewable power through Canadian HVDC import projects, development of solar PV outside of VT, ensuring that in-state solar PV follows the IEEE 1547 standard, and the addition of storage in conjunction with solar PV projects.” It does not add value nor is it appro-priate to be included in the plan. REV interprets this sentence as VELCO advocating for meeting Vermont’s total renewable energy commitment and by exacerbating our state’s genera-tion/transmission/importation issues and importing more power from outside the state and country. First, to import more power would potentially increase system loading and the need for more transmission capabilities which is counter to the reasoning for the plan in the first place. Additionally, this goes against the idea that Vermont should be more self-reliant for its energy needs and keeping Vermont’s energy dollars in-state to the greatest extent possible should be a priority.
This comment is referring to the VSPC review version of the plan. The public review ver-sion does not include this statement.

2018 VERMONT LONG-RANGE TRANSMISSION PLAN PAGE 55
REV appreciates VELCO’s attempt to highlight the importance of a robust electric grid, as this is a necessary building block to achieving Vermont’s Comprehensive Energy Plan commitment of 90 percent renewable energy by 2050 and the statutory goal for Vermont to generate 25 percent of the electricity consumed within the State through the use of renewable energy sources, par-ticularly from Vermont's farms and forests.
The draft plan reports that significant grid reinforcements would be necessary to meet the high solar PV scenario, and creates the misimpression that Vermonters are currently faced with bear-ing these enormous costs. If policy-makers and regulators believe solar PV deployment is caus-ing new transmission cost increases, the reaction may be to slow down solar generation even further, just the opposite of what Vermont needs to do at this critical juncture. Without more explanation, this portion of the draft report and the complicated nature of the presentation of this information will cause significant confusion to communities, policy-makers and the public generally.
While REV appreciates VELCO’s support for the 2016 Comprehensive Energy Plan and its consid-eration of incorporating that Plan into its long range transmission plan, we strongly recommend that the high solar PV scenario of 1,000 MW by 2025 be removed from the long range transmis-sion plan.
Page 46 includes some additional language further clarifying the intent of the analysis
There is general consensus that while the high solar PV scenario is technically feasible based on existing technology, given the existing distribution system limitations, state law and policies, and permitting and siting burdens, it is far from current reality. No state law or utility Integrated Re-source Plan proposes solar deployment anywhere near the pace of the high solar PV scenario and ISO-NE’s planning document, the CELT report, shows less than 500MW of in-state PV by 2025.
The 1000 MW amount is the key assumption. The steepness of the curve does not mat-ter. The purpose of the analysis is to reveal what system constraints arise under various geographic distributions of 1000 MW of solar.
The SHEI map on page 37 warrants additional context and labeling. It is not clear the threshold conditions, volume or location of new renewable generation which is implied to create new or expanded SHEI areas. It is also note clear what entity will determine if and when those thresh-olds are exceeded, and SHEI could be expanded. That information will be helpful for planning purposes. Additionally, it may be helpful to juxtapose this figure with the modified scenario showing where the transmission system can most easily handle additional PV. The relationship between grid constraints (SHEI map) and the “optimized solar distribution” scenario is not clear.
A paragraph was added below the map.
The “optimized solar distribution” figure on page 44 should be clearly labeled as existing trans-mission optimized new solar distribution, as to not be taken out of context. It would be helpful to understand how these projections compare to each regional planning commission’s solar generation capacity and then their comprehensive energy plan.
The title was revised. RPC targets were added.

2018 VERMONT LONG-RANGE TRANSMISSION PLAN PAGE 56
REV is concerned that while VELCO aims to provide information, that this figure (page 46) could be interpreted that it is VELCO’s position that no or limited solar be located in certain jurisdic-tions. There are significant equity issues of concern associated with this figure and its implica-tions. For example the figure implies that many Vermont electric customers should not be able to generate their own renewable electricity; and that many landowners should not be able to host renewable energy projects (which is of particular concern given the critical economic bene-fits to both the landowner and local municipalities which would be forgone). Some of these ar-eas identified for no to little new solar deployment also suffer from the highest energy burden (see Efficiency Vermont study) and low economic development opportunities. Additionally, the “optimized” distribution appears to conflict with existing utility IRPs and programs.
Page 46 includes some additional language further clarifying the intent of the analysis
It is likely that the current SHEI issues will result in transmission upgrades to be constructed in northern Vermont as well as potential other solutions before 2025. These grid improvements should be incorporated into the plan and the discussion of the high PV scenario. Given that they do not appear to be accounted for, it leads to calculation results for reliability concerns and sys-tem losses which are higher than a more realistic scenario.
The analysis assumed that one or more of the options would be implemented, and this contributed to system concerns south of the current SHEI area. However, in the opti-mized distribution analysis, it was assumed that no additional generation will be added inside the SHEI area.
The draft plan acknowledges that battery energy storage systems (BESS) can alleviate back feed power concerns and reduce transformer overloads, but the upgrades necessary for the least re-alistic high solar scenario do not include BESS solutions. There are $30M in transformer replace-ments proposed instead.
The plan included a non-transmission alternative, which included a large amount of stor-age that could address most of the concerns. The storage alternative is described in a table at the bottom of page 38.
Similarly, ensuring that new solar meet IEEE 1547 (2018) standard will allow for low-voltage ride-through and alleviate a major concern related to distribution voltage ranges, which this study admits: “In the NTA solution set, distribution bus voltage was held within a reasonable range, so as to not affect the sub-transmission voltage performance; as a result, far less new equipment was needed to maintain adequate voltage on the sub-transmission system. This volt-age control capability can be provided by the inverters of the distributed PV units themselves.” (page 47). Both BESS and IEEE 1547 measures can significantly mitigate the concerns identified in the high PV scenario, but they are not included.
See page 38 for a discussion of storage. See the first bullet on page 42.
Overall, the high solar PV scenario and the unrealistic or waived assumptions of this modeling exercise are too hypothetical to include in the plan or to be used to develop policy or guide en-ergy infrastructure investments. Further, given some of the assumptions (particularly that distri-bution constraints are resolved) the best data reasonably available was not fully utilized. The draft plan itself states that in many instances the assumptions used are not realistic. If this is the case then this scenario should be removed and furthermore one questions the reality or validity of the transmission upgrades list.

2018 VERMONT LONG-RANGE TRANSMISSION PLAN PAGE 57
Due to the need for a more robust examination of the assumptions and potential outcomes in-volved in this important analytical exercise, REV recommends that VELCO continue its work, but as a stand-alone and ongoing exercise and not within this plan.
The 1000 MW amount is a specific stretch goal that allows us to understand the limita-tions of the system with regard to the integration of solar PV. The optimized solar PV dis-tribution shows that there is a path to reduce the system impacts, but also shows that the total amount that could be hosted is also optimistic because many of the assump-tions are optimistic. This information is important to understand the limitations of the system and the factors that contribute to system limitations. While imprecise, we believe this information is valuable.
2018 VERMONT LONG-RANGE TRANSMISSION PLAN PAGE 58
Glossary & Abbreviations Glossary 90/10 load—An annual forecast of the state’s peak electric demand (load) where there is a 10-percent chance that the actual system peak load will exceed the forecasted value in any given year or, stated another way, it is ex-pected that on the average the forecast will be exceeded once every ten years.
affected utility—Affected utilities are those whose systems cause, contribute to or would experience an impact from a reliability issue.
base load—A base load power plant is an electric generation plant that is expected to operate in most hours of the year.
blackout—A total loss of power over an area; usually caused by the failure of electrical equipment on the power system.
bulk system—The bulk electric system, in the context of this plan is the portion of the grid that is at 115 kV and above.
bus— In power engineering, a "bus" is any graph node of the single-line diagram at which voltage, cur-rent, power flow, or other quantities are to be evaluated. This may or may not correspond to the physical busbars in substation. (Source: Wikipedia.)
capacitor—A device that stores an electrical charge and is typically used to address low voltage issues on a power system.
conductor—Part of a transmission or distribution line that actually carries the electricity; in other words, the wire itself. The wire or conductor is just one part of a transmission line; other parts include the poles and the insulators from which the conductor is hung. A conductor must have enough capacity to carry the highest demand that it will experience, or it could overheat and fail.
contingency—An unplanned event creating an outage of a critical system component such as a transmission line, transformer, or generator.
demand—The amount of electricity being used at any given moment by a single customer, or by a group of cus-tomers. The total demand on a given system is the sum of all of the individual demands on that system occurring at the same moment. The peak demand is the highest demand occurring within a given span of time, usually a sea-son or a year. The peak demand that a transmission or distribution system must carry sets the minimum require-ment for its capacity.
demand‐side management (DSM)—A set of measures utilized to reduce energy consumption. Energy conser-vation is one kind of DSM.
dispatch—As a verb: turning on or off, or setting the value or output of a generator, a capacitor bank, reactor or transformer setting.
distributed generation (DG)—Power generation at or near the point of consumption in contrast to centralized generation that relies on transmission and distribution over longer distances to reach the load. Generally DG is smaller in scale and centralized, base load power.
distribution—Distribution lines and distribution substations operate at lower voltage than the transmission sys-tems that feed them. They carry electricity from the transmission system to local customers. When compared to transmission, distribution lines generally use shorter poles, have shorter wire spans between poles and are usually found alongside streets and roads, or buried beneath them. A typical distribution voltage would be 13.8-kV.
distribution utility—A utility in the state of Vermont that is responsible for owning, operating, and maintain the distribution part of the electric system within an area.
docket—A court case. As used in this plan, the term refers to a case before the Vermont Public Service Board.

2018 VERMONT LONG-RANGE TRANSMISSION PLAN PAGE 59
Docket 7081—The Public Service Board case that established Vermont’s current process for transmission plan-ning. The formal title of the case is “Investigation into least-cost integrated resource planning for Vermont Electric Power Company, Inc.'s transmission system.”
elective transmission—Projects needed to connect generation to markets and to increase the capacity of a transmission corridor that otherwise limits the ability to sell power from one part of the system to another. Such projects, needed for purposes other than reliability, are categorized as elective transmission, and are financed by the project developer, not the end-us customer.
easement—A right to use another’s land for a specific purpose, such as to cross the land with transmission lines.
economic transmission—Transmission projects needed to achieve economic benefits, such as reducing system losses, improving market efficiency, or reducing the cost of serving customer demand.
forward capacity market—A marketplace operated by ISO-NE using an auction system with a goal of purchas-ing sufficient power capacity for reliable system operation for a future year at competitive prices where all re-sources, both new and existing, can participate.
generation or generator—A device that converts other forms of energy into electrical energy. For example, so-lar energy from a photovoltaic panel or mechanical energy from an engine, a water wheel, a windmill, or other source, can be converted into electrical energy.
kilowatt‐hour (kWh)—One thousand watt-hours. A watt-hour is a measure of the amount of electric energy gen-erated or consumed in a given period of time.
kilovolt (kV)—One thousand volts. Volts and kilovolts are measures of voltage.
lead distribution utility -A utility selected by the affected utilities to facilitate decision-making and to lead the effort to conduct the NTA analysis
load—see demand.
megawatt (MW)—One million watts. Watts and megawatts are measures of power. To put this in perspective, the peak power demand for the New England region is approaching 30,000 MW or 30,000,000,000 (thirty billion) watts.
net metering—An electric policy that allows consumers who own small sources of power, such as wind and solar, to get credit for some or all of the electricity they generate through the use of a meter that can record flow in both directions. The program is established under Title 30 Vermont Statutes section 219a.
N‐0 or N‐1 or N‐1‐1—The term N minus zero (or one or two) refers to the failure of important equipment. Alt-hough these terms sound complex, they are actually quite simple. “N” is the total number of components that the system relies on to operate properly. The number subtracted from N is the number of components that fail in a given scenario. Therefore, N-0 means that no components have failed and the system is in a normal condition. N-1 means that only one component has failed. N-1-1 means that two components have failed, which is generally worse than having only one fail (see also the definition of contingency above).
non‐transmission alternative (NTA)—The use of a solutions other than transmission, such as generation or energy efficiency, to resolve a transmission reliability deficiency.
peaking resources—Generators that are expected to run only during peak load conditions, or when demand is near system capacity, or during some form of emergency.
power—The amount of electricity that is consumed (demand) or supplied at any given time.
pool transmission facility or facilities (PTF)—Generally speaking, any transmission facility operating at 69 kV or higher and connected to other transmission lines or transmission systems is considered PTF. PTF falls under the authority of ISO-New England and the construction of new PTF facilities is generally funded through ISO on a
2018 VERMONT LONG-RANGE TRANSMISSION PLAN PAGE 60
“load ratio share” basis among its member utilities, meaning funding is proportional to the amount of load served by each entity.
reconductoring—Replacing the conductor that carries the electricity. May also include poles and insulators from which the conductor is hung. Also referred to as rebuilding when a significant number of the poles need replacing.
reliability deficiency—An existing or projected future violation, before or after a contingency, of the applicable planning, design and/or operating criteria, with consideration given to the reliability and availability of the individ-ual system elements.
renewable power source—Any power source that does not run on a finite fuel which will eventually run out, such as coal, oil, or natural gas. Renewable power sources include solar, wind and hydro generators, because sun-light, wind and running water will not run out. Generators that burn replaceable fuels also commonly qualify as renewable power sources. Examples include bio-diesel generators that run on crop-derived fuels and wood-burn-ing generators.
right-of-way (ROW)—The long strip of property on which a transmission line is built. It may be owned by the utility or it may be an easement.
substation—A substation is a fenced-in area where several generators, transmission and/or distribution lines come together and are connected by various other equipment for purposes of switching, metering, or adjusting voltage by using transformers.
Sub-transmission—Sub-transmission lines are power lines that typically operate at a voltage of 34,000 to 70,000 volts and are generally below 100 kV.
transformer—A device that typically adjusts high-voltage to a lower voltage. Different voltages are used because higher voltages are better for moving power over a long distance, but lower voltages are better for using electricity in machinery and appliances. Transformers are commonly described by the two (or more) voltages that they con-nect, such as “115/13.8-kV,” signifying a connection between 115-kV and 13.8-kV equipment or lines.
transmission—Transmission lines and transmission substations operate at high voltage and carry large amounts of electricity from centralized generation plants to lower voltage distribution lines and substations that supply local areas. Transmission lines use poles or structures, have long wire spans between poles and usually traverse fairly straight paths across large distances. Typical transmission voltages include 345-kV and 115 kV and generally all are above 100 kV.
transmission system reinforcements—Also referred to as Transmission system upgrades that are needed to address a reliability deficiency as defined in this plan and in the Docket 7081 MOU. Transmission line or substation equipment added to existing transmission infrastructure.
voltage—Voltage is much like water pressure in a system of pipes. If the pressure is too low, the pipes cannot carry enough water to satisfy the needs of those connected to them. If the voltage is too low, the electric system cannot carry enough electricity to satisfy the needs of those connected to it.
voltage collapse—A phenomenon whereby a series of events ultimately results in a blackout after a certain amount of time ranging from seconds to minutes.
voltage instability—A phenomenon whereby system operators cannot maintain acceptable system voltage given the tools at their disposal for a specific combination of load, generation and transmission. Voltage collapse may ensue.

2018 VERMONT LONG-RANGE TRANSMISSION PLAN PAGE 61
Abbreviations AC Alternating current BED Burlington Electric Department CEP Comprehensive Energy Plan CPG Certificate of Public Good DC Direct current DG Distributed generation DOE US Department of Energy DR Demand Response EV Electric Vehicle FERC Federal Energy Regulatory Commission FCM Forward Capacity Market GMP Green Mountain Power HQ Hydro-Québec HVDC High voltage direct current ISO-NE ISO New England MVAr Megavar, mega-volt-ampere reactive MW Megawatts MWh Megawatt hours NTA Non-Transmission Alternative NERC North American Electric Reliability Corporation NPCC Northeast Power Coordinating Council NYISO New York Independent System Operator OATT Open-Access Transmission Tariff PTF Pool Transmission Facility PSD Vermont Public Service Department PSNH Public Service of New Hampshire PUC Vermont Public Utility Commission (formerly the Public Service Board PV Photovoltaic generation (solar) RES Renewable Energy Standard SPEED Sustainably Priced Energy Enterprise Development VEC Vermont Electric Cooperative VEIC Vermont Energy Investment Corporation VELCO Vermont Electric Power Company VJO Highgate Vermont Joint Owners VPPSA Vermont Public Power Supply Authority VY Vermont Yankee VSPC Vermont System Planning Committee WEC Washington Electric Cooperative


![The VELCO STATCOM-Based Transmission System … Statcom Based...The VELCO STATCOM-Based Transmission System Project ... in the states of Vermont [16], Texas and California ... power](https://img.dokumen.tips/doc/110x75/5ae039447f8b9af05b8d62b1/the-velco-statcom-based-transmission-system-statcom-basedthe-velco-statcom-based.jpg)