Embed Size (px)
Citation preview

VIENNA INSTITUTE
Working Papers
Vienna Institute of DemographyAustrian Academy of Sciences
A-1040 Vienna · Austria
E-Mail: [email protected]: www.oeaw.ac.at/vid
Wohllebengasse 12-14
OF DEMOGRAPHY
4 / 2015
Jeroen Spijker
Alternative Indicators ofPopulation Ageing:An Inventory

Abstract
The extent, speed and impact of population ageing have often been exaggerated because
standard indicators such as the Old-Age Dependency Ratio or Support Ratio do not take
proper account of falling mortality, the changing relationship between age and employment,
or (usually) both. Neither do such ratios consider the changing composition in terms of
educational attainment, human capital or other population characteristics. Not surprisingly,
over the last decade or so demographers have developed alternatives. This paper provides an
overview of such alternatives and briefly discusses their utility.
Keywords
Ageing, dependency ratio, support ratio, alternative indicators of ageing, life expectancy,
employment.
Authors
Jeroen Spijker, "Ramon y Cajal" Research Fellow, Center for Demographic Studies,
Barcelona, Spain. Email: [email protected].
Acknowledgements
This research was financed by the Vienna Institute of Demography, where the author spent
four months from September to December 2014, and the Spanish Ministry of Economy and
Competitiveness under the “Ramón y Cajal” programme (RYC-2013-14851) and “I+D+i-
Retos” project (CSO2014-60113-R) and conducted in the framework of the European
Research Council grant agreement no ERC2013-AdG 323947-Re-Ageing (PI: Sergei
Scherbov). The author also would like to thank Miguel Sánchez and Elisenda Rentería for
their help with section 2.6.

2
Alternative Indicators of Population Ageing: An Inventory
Jeroen Spijker
1. Background
Population ageing is the process whereby low fertility and decreasing mortality gives rise to
changes in the age structure of the population within which older people form an ever
increasing proportion of the total. It is considered to be of economic importance because of a
fundamental feature of the economic life-cycle, namely that working-age adults produce
more through their labour than they consume, contrary to elderly and children who they
directly or indirectly sustain. This economic pattern is only possible because resources flow
over time and across generations through a complex system of social, economic, and political
institutions (Fürnkranz-Prskawetz et al. 2011). As a population’s age structure shifts from
having a very young population to one that is dominated by people of working age (initially
mainly through the reduction of fertility) this so-called first demographic dividend can be
potentially beneficial for its living standards and economic growth. However, as more people
survive to old age and older ages within old age, as is the case in all low mortality countries
today, for every worker paying income tax and national insurance there are more older
citizens who have a higher propensity to be disabled and ill than younger people, leading to
greater demands on health and welfare systems. Given that population ageing is only
projected to intensify during the coming decades, concern among policy makers has been
raised (Burnside 2012; Doyle et al. 2009; Polder et al. 2002; The Select Committee on Public
Service and Demographic Change 2013; Wolf & Amirkhanyan 2010). However, the extent,
speed and impact of population ageing have often been exaggerated as standard measures of
population ageing such as the Old Age Dependency Ratio (OADR) or its inverse, the Support
Ratio (in its simplest form), are based solely on fixed chronological ages. This can be
misleading because they implicitly assume that there will be no progress in important factors
such as remaining life expectancies, disability rates (Lutz et al. 2008d) or changes in labour
force participation (Spijker & MacInnes 2013b).
Counting the dependent older population
In an era of increasing life expectancy, especially at higher ages, a number of demographers
have been advocating that age should be thought of in terms of years left until death or in
proportion to expanding lifespan rather than a fixed chronological age boundary. Defining
old age by using life expectancy instead of chronological age was first suggested by Ryder
(1975) but over the last decade especially expanded upon by Sanderson and Scherbov (2005,
2007b, a, 2010), Lutz et al. (2008c, d) as well as Baltes and Smith (2003). Measures that
adjust for changes in longevity show a much slower pace of population ageing over the last
half a century (and in some instances even in the opposite than the expected direction) than
those based on the traditional definition of age.

3
Counting the working population
Another point of criticism of the OADR is that it assumes that everyone of working age
actually works despite the fact that the knowledge-based service economy keeps young
people in education for longer and many older workers voluntarily, or otherwise, retire early
(Spijker & MacInnes 2013b). On top of that, the unemployed also usually depend on the state
for their welfare, while homemakers are one of the biggest groups of the non-working
population. Conversely, greater sex equality and dual career families have added millions of
women workers to the labour market over the past 50 years. These are all reasons why using
age to define the working population makes little sense. Indeed, in all high income countries
there are more people aged under 65 who are not economically active than people above that
age (http://laborsta.ilo.org; own calculations). Given the economic and labour market
fluctuations it would thus appear logical to include or correct for the population in paid
employement in the denominator of elderly dependency ratios (EDRs)1: any increase in
labour force participation (LFP) could potentially reduce per capita costs associated with a
growing elderly population while high unemployment would do the opposite. Indeed, a
complimentary approach to raising the normal pension age to support ageing populations is to
raise the average LFP rate (Scherbov et al. 2014).
Human capital
As mentioned earlier, the prolongation of education beyond the usual minimum age of 16 is
one factor why many young adults are not in employment. However, when higher educated
persons do enter the workforce they quickly earn more money than lower educated workers
of the same age. Therefore, as more human capital leads to higher productivity (as measured
by GDP) this implies that fewer workers are necessary to provide the financial resources
needed to care for the ‘dependent’ elderly. Countries where human capital increases rapidly
can therefore be considered an important factor for alleviating the negative effects of
population ageing by potentially offsetting declines in the number of people in paid
employment. Yet, Philipov et al (2014) argue that higher human capital shaped by earlier
schooling, training and work experience also has a downside for government expenditure,
namely that human capital utilized during working lives is decisive for the level of income
obtained during retirement, i.e. it tends to be higher for individuals who earned more during
their working life. The authors therefore came up with an EDRs that takes this into
consideration, as will be shown later.
Changing age profiles of income, consumption and wealth
While standard support and dependency ratios are widely used as indicators for measuring
the effects of population ageing on economic development, both use fixed age limits to
distinguish between the working and the dependent populations (Prskawetz & Sambt 2014).
Unfortunately, the use of inflexible age categories (even if they are adjusted for changing life
1 In the paper I use Elderly Dependency Ratio as a generic term which may refer to any type of ‘old age’
dependency ratio, including the conventional OADR.

4
expectancy) prevents taking into account the changing age profiles of consumption and
income across time as a result of demographic shifts. In the past, these changes have been
summarised in different types of economic support ratios. For instance, Cuttler (1990) did so
by relating a weighted share of the working-age population in the numerator to the weighted
sum of all consumers in the denominator. Taking only the retired people in the latter would of
course yield an elderly support ratio. By considering the age profiles of consumption and
income levels a new set of economic support ratios can be produced, indicators which would,
assuming a continuation of the current country-specific social security systems and economic
activities, provide better estimates of the consequences of demographic change for the
reallocation of resources across ages. For instance, analyses have shown that population
ageing can yield a second demographic dividend if younger generations reduce their
consumption as a way to increase their wealth and achieve higher consumption in future
periods (Prskawetz & Sambt 2014; Mason & Lee 2007).
The following, and main, part of the paper provides an overview of studies that
propose alternatives to the standard indicator of population ageing – the OADR – by taking
into consideration one or more of the aforementioned aspects, i.e. changes in survival, the
labour force/productivity, human capital or age-specific income and consumption2. The
utility or limitations of each are also discussed. Table 5 at the end of the section provides an
overview of the discussed ageing indicators and includes, if available, whether short-term
projections or forecasts (until about 2020), generally predict an increase or decrease in the
indicator3.
2. Towards more Objective Elderly Dependency Ratios
The level of past, current or future levels in population ageing depend much on how it is
measured, but as there is no consensus as to what indicator is best to use it is not clear as to
how aged our (or any) society really is. This is in part because the different driving forces
behind population ageing in a society, i.e. a decline in fertility, mortality or net migration
loss, affect specific ages more than other ages. If, for instance, a population ageing indicator
considers the whole population in its calculations, as is the case with the Total Dependency
Ratio (TDR), changing fertility levels will have a more immediate effect on the level of
population ageing than if the non-adult population is excluded (as in for example the OADR).
In case of the latter, there will not be an effect of declining fertility on the ratio until the
smaller birth cohorts reach working age, which will then gradually slow down the growth rate
of the work force. This is illustrated in Table 1 for Spain, a country that observed one of the
2 As the OADR is a ratio, for comparison purposes the ageing indicators discussed in detail in the paper
excludes those that are medians or averages like Sanderson and Scherbov’s (2007b) prospective median age (a
life-expectancy adjusted median age that shows a much lower increase in median age over the last three decades
than the standard median age). 3 Long-term projections are not provided because they do not exist in the literature for several indicators.
Moreover in the case of the indicators developed by the author, too many assumptions would be required e.g. on
future age-specific labour force participation rates, making them too speculative.

5
fastest declines in fertility during the late 1970s and 1980s. As a result, the TDR actually
declined faster during the 1980s than the OADR increased. Conversely, the addition of about
five million migrants to the Spanish population during the first decade of the 21st century
virtually neutralized the ageing of the population, while the abrupt halt of immigration (in
fact there has been a net-outmigration of about half a million people, mainly of working age,
since 2010) and a stabilized low fertility rate has led to an annual increase of 2.4 % in the
OADR and of 1.8% in the TDR over the 2009-14 period.
Table 1. Annual inter-period % decline in the Total Fertility Rate (TFR), TDR and
OADR, Spain, 1976-2014.
Observed Average annual change (%)
Indicator 1979 1989 1999 2009 2014 1979-89 1989-99 1999-09 2009-14
TFR 2.37 1.40 1.19 1.38 1.27 -5.3 -1.6 1.5 -2.0
OADR 17.80 19.81 23.73 24.12 27.22 1.1 1.8 0.2 2.4
TDR 60.35 51.68 45.69 45.65 50.01 -1.6 -1.2 0.0 1.8
Source: Calculations based on data from the Spanish National Institute of Statistics (www.ine.es). The ageing
indicator that changes (positive or negative) relatively the most between two periods is highlighted in bold.
Secondly, the level of population ageing also depends on how the old-age and
working-age populations are defined. Traditionally, fixed age boundaries linked to the
statutory pension age and the minimum school-leaving age are used to separate the old-age
from the working-age population. With regard to the OADR, the most common of EDRs,
which is obtained by dividing the elderly population by the population of working age, the
elderly population is usually defined as those aged 65 or older (or sometimes 60+) and the
working age population as 15-64, 16-64, 20-64, 20-59 or similar. One important reason
population ageing measurements are based on static age boundaries is because of the age of
eligibility that is set by public policy for social arrangements related to ageing, particularly
public pension plans. The question that can be raised, however, is how useful such a
definition really is. Lutz et al. (2008d) even labelled measures of population ageing based
solely on fixed chronological ages as ‘misleading’ because they implicitly assume that there
will be no progress in important factors such as remaining life expectancies and disability
rates.
2.1. Years Left vs. Years Lived
Rather than a fixed age boundary it would be more appropriate to think of age in terms of
years left until death or in proportion to the expanding lifespan (Sanderson & Scherbov
2005). This concept of looking at years of life left rather than years lived is not new. Hersch
(1944) introduced the concept of Potential Years of Life (PYL). The idea was quite simple.
The “average” person of a given age 𝑥 still has a potential number of years of life ahead,
equalling the average remaining life expectation (𝑒𝑥) of members of a population. As Panush
and Peritz (1996) noted, this measure has some useful applications, including the calculation
of the number of potential years in the labour force or retirement. Since then, others have
made modifications based on Hersch’s idea of potential life years, including Sanderson and
Scherbov (2005, 2007b, 2008) and Lutz et al. (2008c) who introduced the concept of

6
prospective age (initially called standardised age). This is the age of a person in the standard
life table who has the same remaining life expectancy as the person of interest4. For instance,
an Austrian male aged 50 today has the same life expectancy (30 years) as a likewise person
aged 41 in 1950 (www.mortality.org). Given their identical life expectancy, one could argue
that 41 is the new 50 if 1950 is used as the standard. If applied to a population’s median age,
one obtains the so called prospective median age or PMA (Lutz et al. 2008c). The same
authors also came up with an alternative for the average age of a population, i.e., an
‘adjusted’ average age that takes age-specific life expectancies into consideration, the
Population Average Remaining Years of Life expectancies (PARYL). Here the age-specific
remaining life expectancies are weighted by the proportions of the population at each age
whose average is then taken to obtain the average remaining years of life of population
members. PARYL goes down as population ages.
Another contribution, which anticipated the concept of prospective age, can be found in
Ryder (1975, p.16; cited in Sanderson & Scherbov 2013) who wrote that:
“To the extent that our concern with age is what it signifies about the degree of
deterioration and dependence, it would seem sensible to consider the measurement of age
not in terms of years elapsed since birth but rather in terms of the number of years
remaining until death…
We propose that some arbitrary length of time, such as 10 years, be selected and that we
determine at what age the expectation of life is 10 years, that age to be considered the
point of entry into old age”.
Siegel and Davidson (1984) were the first to apply Ryder’s proposal with actual data,
while others came (sometimes independently) to similar ideas (see Sanderson & Scherbov
2013 for an overview). One of such alternative approaches to the conventional way of
measuring the proportion of the population considered elderly, usually 60+ or 65+, was by
Lutz et al. (2008c) who did not make it depend on a fixed age boundary but, rather, on a fixed
remaining life expectancy, i.e.:
Proportion of the population in age groups that have a remaining life expectancy
(RLE) of 15 years or less (Prop. RLE15-). Again, the life table is used to derive the age
at which RLE equals 15. As the age at which RLE15- tends to fall between two completed
years of age, linear interpolation is applied to obtain the exact age. Subsequently, using
population data by single age and sex the total population equal to and above this age is
obtained (also through interpolation) and divided by the total population to arrive at the
proportion. If longevity increases, the minimum age of people included in Prop. RLE 15-
increases; “but if the proportion of the total population above the age with an expectancy
of 10 [or 15] years falls than this might [also] result from a rapid rise in life expectancy
rather than [only due to] the actual ageing of the population” (Siegel & Davidson 1984;
brackets added by author).
4 See the Annex for how prospective age is calculated.

7
Although PMA and PARYL could be considered indicators of population ageing, they are of
little policy value because they concern, respectively, the expected years to live of a middle-
aged person and of the whole population.
Sanderson and Scherbov (2010) and others (Lutz et al. 2008c; Lutz 2009; Ryder
1975) considered the age at which RLE equals 15 years as the threshold of elderly
dependency (with the population equal to or above this threshold considered old age) rather
than age 65 because it takes into account falling old-age mortality. If we obtain the
population total for the numerator for each sex 𝑠 separately5 as men and women have
disparate life expectancies (even at higher ages) Prop. RLE15- is calculated as:
Prop. RLE15- = ∑ 𝑝𝑜𝑝𝑢𝑙𝑎𝑡𝑖𝑜𝑛 𝑅𝐿𝐸15−𝑠
𝑡𝑜𝑡𝑎𝑙 𝑝𝑜𝑝𝑢𝑙𝑎𝑡𝑖𝑜𝑛∗ 100 (1)
The fact that this age has been rising in most low-mortality countries since half-way
last century (a bit earlier for women, a bit later for men) render these elderly ‘younger’,
healthier and fitter than their peers in earlier cohorts.
Likewise, while the OADR defines all people above the statutory pension age as
‘dependent’, regardless of their economic, social or medical circumstances, it overlooks the
fact that many elderly have accumulated substantial assets, may still be working and many
have valuable experience or expert knowledge, while others do volunteer work vital to the
‘third sector’ or look after grandchildren. Sanderson and Scherbov (2007b) thus came up with
an alternative to the OADR:
Prospective Old Age Dependency Ratio (POADR). Here the population with RLE15-6
is divided by the population below this age threshold but is at least 20 years old7. The age
range of the working age population is thus slightly shifted upwards to exclude a large
student population most of whom are not (fully) active in the workforce, but include
young-old people who could potentially work when the age at old-age threshold is higher
than 65 (in most high income countries since around the 1980s):
POADR = ∑ 𝑝𝑜𝑝𝑢𝑙𝑎𝑡𝑖𝑜𝑛 𝑅𝐿𝐸15−𝑠
𝑝𝑜𝑝𝑢𝑙𝑎𝑡𝑖𝑜𝑛 20+𝑢𝑝 𝑡𝑜 𝑎𝑔𝑒 𝑎𝑡 𝑤ℎ𝑖𝑐ℎ ∑ 𝑝𝑜𝑝𝑢𝑙𝑎𝑡𝑖𝑜𝑛 𝑅𝐿𝐸15−𝑠∗ 100 (2)
When comparing the POADR with the standard OADR we can observe that once the
age threshold at which RLE is 15 years or less is above 65, the ratio becomes higher than the
OADR (if we use 20 as the lower boundary of working age in both indicators) as the size of
the numerator is reduced and that of the denominator enlarged (Figure 1), but that over the
next decades dependency as measured by the POADR is expected to decrease much less in
5 This slight adjustment was first proposed in Spijker & MacInnes 2013b).
6 There are also other possible types of prospective old age dependency ratios. For instance, one can take a
prospective age, an index year (year of interest) and a standard year and by varying the prospective age and the
standard year, one can compute POADRs for different comparative purposes. One example is to assume that
remaining life expectancy is kept constant at its observed value for 65 year olds in 2000 as a way to compare
with the conventional OADR that divides the 65+ by the working-age population. The POADR is then the ratio
of the number of people at equal to or older than the age threshold (i.e. prospective age 65+) to the number of
people between 20 and that prospective age (Sanderson & Scherbov 2007b). 7 Rather than 15 or 16 as many older teenagers and young adults still attend secondary or higher education,
meaning that most are not yet (fully) active in the workforce.

8
most countries of the world and in the case of the least developing countries, not at all (Table
2 and Sanderson & Scherbov 2008).
Figure 1. The OADR, POADR and age at which remaining life expectancy (RLE) equals
15 years. US. 1950-2010.
Source: Human Mortality Database (www.mmortality.org)
Table 2. Conventional and prospective measures of population ageing for major world
regions, 2005 and 2045
Prop. 65+
(x100)
Prop. RLE15-
x100
Prop. 65+
(x100)
Prop. RLE15-
x100 POADR
2005 2045 2005 2045 2005 2045 2005 2045 2005 2045
WORLD 7.4 15.2 7.4 15.2 66.3 69.8 66.3 69.8 11.9 17.7
More developed regions 15.3 25.3 15.3 25.3 68.7 72.8 68.7 72.8 18.2 25.7
Less developed regions a 5.9 15.6 5.9 15.6 65.0 69.2 65.0 69.2 10.7 18.6
Least developed countries 3.2 5.8 3.2 5.8 61.9 65.6 61.9 65.6 10.0 10.1
a Excluding least developed countries
Source: Sanderson & Scherbov 2008
Even though using RLE15- is an improvement to using a fixed age like 60+ or 65+,
the age at which RLE equals 15 years is also arbitrary (e.g. why not 2, 5 or 10 years?).
Moreover, the literature tells us that especially health care expenses occur during the last
year(s) of life, with little impact from the age at which these deaths occur (Miller 2001;
Sanderson & Scherbov 2010; Seshamani & Gray 2004; Wong et al. 2011; Zweifel et al.
1999). This perspective of remaining-years has also been applied in the fields of psychology
and economics (Bíró 2010; Carstensen 2006; Carstensen et al. 1999; Cocco & Gomes 2012;
Hamermesh 1985; Van Solinge & Henkens 2010) as such information is essential to good
predictions of likely health, social care, pension, housing and other age-related expenditures.
62
63
64
65
66
67
68
69
70
71
72
10
13
16
19
22
25
28
31
34
37
40
1950 1960 1970 1980 1990 2000 2010
Ag
e a
t w
hic
h R
LE
= 1
5 y
ea
rs
Ra
tio
*10
0
OADR (65+/20-64) POADR Age RLE = 15 yrs

9
In Riffe et al (2014), building on Brouard (1986), population age structures were therefore
presented in terms of remaining years of life rather than chronological age8. This is an even
clearer way to show that in times of falling mortality, chronological age becomes an
unreliable and insufficient metric of ageing. The reason is because declines in mortality not
only change the distribution of age within a population, it also shifts the distribution of
remaining lifetimes at each age of that population and attenuates the effect of fertility on
population ageing. The authors illustrated this by estimating the remaining lifespans of the 78
million US babyboomers alive in 2011, i.e. at a time when the oldest of this cohort reached
the retirement age. Results showed that the dreaded mortality burden of the US boomers is in
fact expected to be dampened and stretched over a wider range of years9 than were the boom-
like onsets of other life transitions experienced earlier by this cohort (e.g. when many of this
cohort had children they caused the so-called echo-boom).
While the importance of considering both time already lived as time left to live of the
members of a population is propagated in both Sanderson and Scherbov (2007b) and Riffe et
al (2014), the former uses remaining life expectancy (RLE) that equates to a population
average at a particular age while the latter considers remaining years of life (also labelled as
Time-to-Death – TTD) at any age. So while adjusting for changes in life expectancy in
determining the old-age threshold ─as the indicator RLE15- does─, is better than using a
fixed age such as 65, it could still be criticized for including many elderly who consider
themselves healthy. Moreover, it remains a population average measurement as many
persons in the corresponding age group may still live another 30 years, while others will die
within a few years. Depending on the purpose of the population ageing indicator, using
RLE15- may not always be appropriate, such as with regard to elderly health care needs and
expenditure given that the literature clearly shows that TTD is a better indicator for health
care expenditure than age (Miller 2001). On the other hand, RLE15- does provide a way to
define the general elderly population in an era of ever improving old-age survival. Therefore,
in Spijker et al (2014) it was proposed to combine time to death (TTD) of up to 5 years with
Sanderson and Scherbov’s RLE15-10
to create an indicator of acute health needs among the
elderly population. Using the same denominator as Sanderson and Scherbov we calculate the
following:
POADR5TTD =# 𝑚𝑒𝑛 𝑎𝑛𝑑 𝑤𝑜𝑚𝑒𝑛 𝑖𝑛 𝑎𝑔𝑒 𝑔𝑟𝑜𝑢𝑝𝑠 𝑤𝑖𝑡ℎ 𝑅𝐿𝐸15− & 𝑇𝑇𝐷<5
𝑝𝑜𝑝𝑢𝑙𝑎𝑡𝑖𝑜𝑛 20+𝑢𝑝 𝑡𝑜 𝑎𝑔𝑒 𝑎𝑡 𝑤ℎ𝑖𝑐ℎ ∑ 𝑝𝑜𝑝𝑢𝑙𝑎𝑡𝑖𝑜𝑛 𝑅𝐿𝐸15−𝑠∗ 100 (3)
Results for the US showed that the burden has been stable since 1980 at under three
elderly with acute health needs for every adults of working age (according to the Sanderson
and Scherbov definition), a rate which is not expected to rise above three until 2028 (Figure
2). Again this suggests that population ageing is not fuelling the demand for health care
8 See both publications for the method employed to decompose and restructure a population by remaining years
of life based on information contained in the period life table. 9 For instance, if we assume that mortality rates starts declining by 2% per year at each age for this cohort but
tapers off to constant mortality by around 2075 according to a logistic pattern, 50% of boomer deaths will fall
between 2032 and 2049 and 10% will still be alive after 2058. 10
Fuchs (1984) had first proposed to combine it with the population aged 65+.

10
services but other factors such as progress in medical knowledge and technology, costs of
hospitalization and the increasing use of long-term care facilities.
Figure 2. Proportion of the population aged 65+, with a remaining life expectancy of 15
years or less (RLE15-) and with both RLE15- and a time to death (TTD) of less than 5
years, US, 1950-2050.
Data source: Sex-specific population and mortality data until 2011 come from the Human Mortality Database
(www.mortality.org) and the projected data from the US Census Bureau (www.census.gov).
2.2. Non-Working to Working Population Ratios
Key drivers of economic growth include labour supply, productivity, consumption and
savings. These tend to vary depending on the position of people in the life cycle (Bloom et al.
2010). Labour supply and productivity and their relationship to population ageing is
discussed, while consumption and savings is treated in subsection 2.6.
Changes in population age structure exert a significant influence on economic growth
(Bloom et al. 2010). For instance, on the one hand, declining infant and child mortality
followed by lower fertility and larger cohorts entering working age results in the first
demographic dividend as the labour force grows faster than the (still relatively small) older
and younger population who depend on it. Even if nothing else changes, per capita income
will increase, but investments in the development of human capital, technological progress,
institutions and governance, can boost economic productivity enormously. For instance, it has
been suggested that these factors in combination with the demographic dividend were behind
the economic miracle of East Asia between 1965 and 1990 (Bloom & Canning 2008; Bloom
et al. 2010). Conversely, one concern regarding the consequences of population ageing is that
there will be a rising number of older dependent citizens for every productive worker in
employment. However, the size of the employed workforce is driven by many factors other
than age as its relationship to the population age structure is rather dynamic, as was detailed
0
5
10
15
20
25
1950 1960 1970 1980 1990 2000 2010 2020 2030 2040 2050
% /
Rat
io*1
00
Prop 65+ Prop RLE15- Prop RLE15-&TTD<5

11
by Spijker and MacInnes (2013a): The employment rate of women and especially mothers
increased dramatically over the last 50 years as systematic gender discrimination was
dismantled at school and in the workplace and the ‘male breadwinner’ employment system
weakened. While the ratio of productive workers to dependent citizens was moved upwards
by the reduction in the number of young people in the population as fertility declined after the
baby boom, it was also driven down by the shortening of careers due to the increase in the
labour force level of educational attainment. Moreover, in many western countries less than
one half wait until the state retirement age to leave the labour market, either because they can
afford to do so or have been made redundant and no longer see any realistic prospect of
obtaining employment (ibid. pp. 66-67). On top of that, a substantial proportion of the
population of working age does not participate in the workforce, such as students and
homemakers, or they do but are unemployed. As the aforementioned factors also fluctuate
strongly as a result of economic booms and busts and changes in pension eligibility, the
working-age population has become a flawed indicator of the population that is supposed to
support the elderly. The same applies to the numerator of the conventional OADR as in high-
income countries the number of pensioners exceeds the population aged 65 and older (i.e. the
pensioner ratio is greater than one) as public pensions are available at younger ages, either
because the statutory retirement age is less than 65 (as e.g. in France and Japan) or it becomes
available at a reduced rate at younger ages (Bongaarts 2004). Conversely, in other settings
there are fewer people retired than there are people aged 65 or more, especially in settings
where there is no or a negligible system of state-financed retirement pensions, forcing many
elderly to remain active in the workforce, as is the case in most low-income and even many
middle-income countries. For instance, in China there are large rural-urban differences in
pension levels and the unemployed and self-employed are still not even covered (Wu 2013),
while in Latin America pension coverage was 60% or less among the 65+ population in
thirteen countries (Rofman & Oliveri 2012).
For these reason, alternative indicators of the demographic burden of supporting the
elderly have been constructed over the last decade or so. For instance, according to Bongaarts
(2004) a more accurate indicator of the demographic burden of supporting the elderly11
is the
ratio of pensioners to workers:
PWR = 𝑃𝑒𝑛𝑠𝑖𝑜𝑛𝑒𝑟𝑠
𝑃𝑜𝑝𝑢𝑙𝑎𝑡𝑖𝑜𝑛 𝑖𝑛 𝑝𝑎𝑖𝑑 𝑒𝑚𝑝𝑙𝑜𝑦𝑚𝑒𝑛𝑡 (4)
This ratio is much larger than the conventional OADR in high income countries and
particularly in France and Italy12
.
More akin to the TDR, Vaupel and Loichinger (2006) simply considered the ratio of
non-workers to workers irrespective of their age13
:
11
Only indicators based on demographic and employment data and not to the actual cost of public retirement
pensions such as Bongaarts’ (2004) public pension expenditure ratio are treated here. 12
As illustrated by Bongaarts (2004) the PWR and the OADR are related, namely PWR= OADR x PR/ER,
where PR is the pensioner ratio (the population aged 65 and older plus anyone under age 65 who is retired and
over the minimum age of eligibility for a public pension) and ER the employment ratio (proportion of the
population aged 15-64 that is employed).

12
𝑅 =𝑛𝑜𝑛−𝑤𝑜𝑟𝑘𝑒𝑟𝑠
# 𝑤𝑜𝑟𝑘𝑒𝑟𝑠 𝑤ℎ𝑜 𝑝𝑒𝑟𝑓𝑜𝑟𝑚 𝑟𝑒𝑚𝑢𝑛𝑒𝑟𝑎𝑡𝑒𝑑 𝑤𝑜𝑟𝑘 𝑓𝑜𝑟 1+ℎ𝑜𝑢𝑟𝑠 𝑎 𝑤𝑒𝑒𝑘 (5)
The authors argued for a better redistribution of work across all adult ages of life so
individuals could combine work with education, leisure and childrearing as currently work is
concentrated in the ages of life relevant for child-bearing and child rearing. Then, around the
age of 60, people retire with decades left to live, which are paid for by younger working
adults, many of whom are also taking care of children.
The 20th century also saw the rise of the eight-hour working day and five-day
working week and a substantial reduction in the number of working days per year (through
increased holiday entitlement), meaning that per capita yearly hours worked dropped by half
(The Conference Board 2011; own calculation). One way to be more precise in capturing the
impact of population ageing on the labour force size is to estimate full-time equivalent
workers as the numerator. This is what Tyers and Shi (2007) did who constructed a ‘Non-
Working-aged’ Dependency Ratio, which is the number of non-working persons over 60 per
full-time equivalent worker, i.e.:
𝑁𝑊𝐷𝑅 = 𝑛𝑜𝑛 𝑤𝑜𝑟𝑘𝑒𝑟𝑠 𝑎𝑔𝑒𝑑 60+
𝑓𝑢𝑙𝑙−𝑡𝑖𝑚𝑒 𝑒𝑞𝑢𝑖𝑣𝑎𝑙𝑒𝑛𝑡 𝑤𝑜𝑟𝑘𝑒𝑟𝑠 (6)
2.3. Years Left-Based Elderly Dependency Ratios with Alternative Denominators
In Spijker and MacInnes (2013b) it was also argued that only those in paid employment
rather than everyone of ‘working age’ (however defined) should be considered as the
population who is supposed to pay for elderly health and wellbeing. However, the authors
then took Sanderson and Scherbov’s (2007b) methodology for the numerator, i.e. by
adjusting the age-threshold of the population considered ‘old’ for changing life expectancy at
older ages, to obtain the so-called Real Elderly Dependency Ratio (REDR):
REDR = # 𝑚𝑒𝑛 𝑎𝑛𝑑 𝑤𝑜𝑚𝑒𝑛 𝑖𝑛 𝑎𝑔𝑒𝑠 𝑤𝑖𝑡ℎ 𝑅𝐿𝐸15−
# 𝑚𝑒𝑛 𝑎𝑛𝑑 𝑤𝑜𝑚𝑒𝑛 𝑖𝑛 𝑝𝑎𝑖𝑑 𝑒𝑚𝑝𝑙𝑜𝑦𝑚𝑒𝑛𝑡∗ 100 (7)
In the example shown for the US in Figure 3, over the last 3-4 decades there was a
decline in the population ageing burden, a trend which is expected to continue until the end of
this decade after which the REDR is likely to increase, but slower than the POADR if we
apply a 1% increase in LFP rates to ages 16-64 to attain rates similar to the recorded
maximum for men in the year 2000 and well as for ages 65-69, 70-74 and 75+ in the
anticipation of better health and incentives to work beyond retirement age.
13
This ratio is one of two, what the authors called, ‘Rostock indicators’ of Demographic Change. Their second
indicator, abbreviated as H, equals the number of hours worked per week per capita.

13
Figure 3. POADR vs. REDR, including adjustments for changing LFP rates. US. 1950-
2010.
Data source: Sex-specific population and mortality data until 2011 come from the Human Mortality Database
(www.mortality.org), the projected data from the US Census Bureau (www.census.gov) and the sex-specific
employment data till 2013 form the Labour Force Statistics (www.bls.gov).
While the contribution of the REDR indicator in the discussion on alternatives to the
OADR was to only consider people in paid employment instead of everyone of working age
in the denominator, it considers everyone in paid employment as equally productive despite
large time and country differences in terms of, for instance, hours worked. A potentially
useful ratio would be therefore to divide the elderly population, defined as those in ages with
RLE15-, by GDP, as recently illustrated in Spijker et al. (2014), i.e.
𝑅𝐿𝐸15/𝑔𝑑𝑝 =# 𝑚𝑒𝑛 𝑎𝑛𝑑 𝑤𝑜𝑚𝑒𝑛 𝑖𝑛 𝑎𝑔𝑒𝑠 𝑤𝑖𝑡ℎ 𝑅𝐿𝐸15−
𝐺𝐷𝑃 𝑖𝑛 𝐺𝐾 $∗ 1,000,000 (8)
As a note, from a government policy perspective it makes no sense to use per capita GDP as
we are interested in the total economic output, irrespective of the number of workers. If one
wishes to analyse different countries at the same time it is best to use internationally
comparative data on GDP such as the 1990 US$ converted at Geary Khamis (GK) Purchasing
Power Parities that can be obtained from The Conference Board (2014) Total Economy
Database. To avoid very small numbers the ratio was multiplied by one million.
As the results showed in Spijker et al. (2014), again for the US, costs per elderly declined
slowly but steadily between 1970 and around 2005, have been stable since then, and are
expected to remain stable over the coming decades. As any government expenditure on the
elderly has to come from taxes, we constructed a similar indicator to the previous one by
dividing by government tax revenue:
𝑅𝐿𝐸15/𝑡𝑎𝑥 =# 𝑚𝑒𝑛 𝑎𝑛𝑑 𝑤𝑜𝑚𝑒𝑛 𝑖𝑛 𝑎𝑔𝑒𝑠 𝑤𝑖𝑡ℎ 𝑅𝐿𝐸15−
𝑡𝑎𝑥 𝑟𝑒𝑣𝑒𝑛𝑢𝑒 𝑖𝑛 𝐺𝐾 $∗ 1,000,000 (9)
10
13
16
19
22
25
28
31
34
37
40
1950 1960 1970 1980 1990 2000 2010 2020 2030 2040 2050
Ra
tio
*10
0
POADR REDR REDR emp+

14
Here results showed that in the US the number of elderly per 1 million tax dollars declined
from about 25 in the early 1970s to between 10 and 13 during the 2000s. Projecting this for
the next 15 years the elderly/tax revenue ratio would be stable at around 10 elderly per 1
million tax dollars.
2.4. Old Age vs. Ill-Health
Another alternative used in population ageing indicators is not to consider life expectancy or
TTD but disability (Sanderson & Scherbov 2010). In a context of increasing proportions of
elderly in high income/low mortality countries over the next decades, improvements in the
functional status of elderly people could help mitigate the rise in the demand for, and hence
expenditure on, long-term care. Lafortune and Balestat (2007) therefore analysed the trends
in severe disability among the population aged 65 and over in 12 OECD countries. The
authors defined severe disability as having one or more limitations in basic activities of daily
living (ADLs)14
and considered it as an indicator of dependency because severe limitations
tend to be closely related to demands for long-term care. They only found clear evidence of a
decline in age-standardised and non-age-standardised disability rates among elderly people in
five of the countries studied (Denmark, Finland, Italy, the Netherlands and the United States).
Even in those countries, it was not expected that the declining trend would completely offset
the rising demand for long-term care as a result of further population ageing that leads to
increasing numbers of people at older ages with a severe disability. However, the authors did
not contemplate comparing the trend in severe disability with, for instance, that of the
employed population who indirectly finances the public health care of the elderly through
taxation. This would have led to a ‘severe’ disability support ratio.
Manton et al. (2006) used a less stringent definition of disability15
to estimate the
(change in the) proportion of active (i.e. disability-free) life expectancy (ALE) out of the total
life expectancy (LE) at ages 65 and 85 between 1935 and 2080 in the US16
:
ALE/LE ratio = 𝑎𝑐𝑡𝑖𝑣𝑒 𝑙𝑖𝑓𝑒 𝑒𝑥𝑝𝑒𝑐𝑡𝑎𝑛𝑐𝑦 𝑎𝑡 𝑎𝑔𝑒 𝑥
𝑡𝑜𝑡𝑎𝑙 𝑙𝑖𝑓𝑒 𝑒𝑥𝑝𝑒𝑐𝑡𝑎𝑛𝑐𝑦 𝑎𝑡 𝑎𝑔𝑒 𝑥∗ 100 (10)
Results showed that until the early 1980s total LE at age 65 grew faster or at the same
pace as ALE, but since then (and at age 85 and older throughout the whole period) there has
been an accelerated decline in disability, a trend that is expected to continue over the course
of this century. This information was used by the authors to assess the long-term stability of
the social security long-term liability. For instance, the growth in the latter could be slowed
down by taking advantage of the increase in ALE by increasing the normal retirement age to
14
Such as eating, washing/bathing, dressing, and getting in and out of bed. 15
Any health-related difficulty performing at least one instrumental activity of daily living (IADL) of activity of
daily living (ADL) for 90 or more consecutive days, or currently residing in an institution providing medical
services. 16
The authors used the Sullivan method of ALE estimation based on period life tables and survey-based period-
specific estimates of disability prevalence (Sullivan 1971).
15
72 years by 2022 as this would give the same number of years of Social Security Old-Age
Benefit (SSA) to the non-disabled retiree as in 1935 (SSA inception).
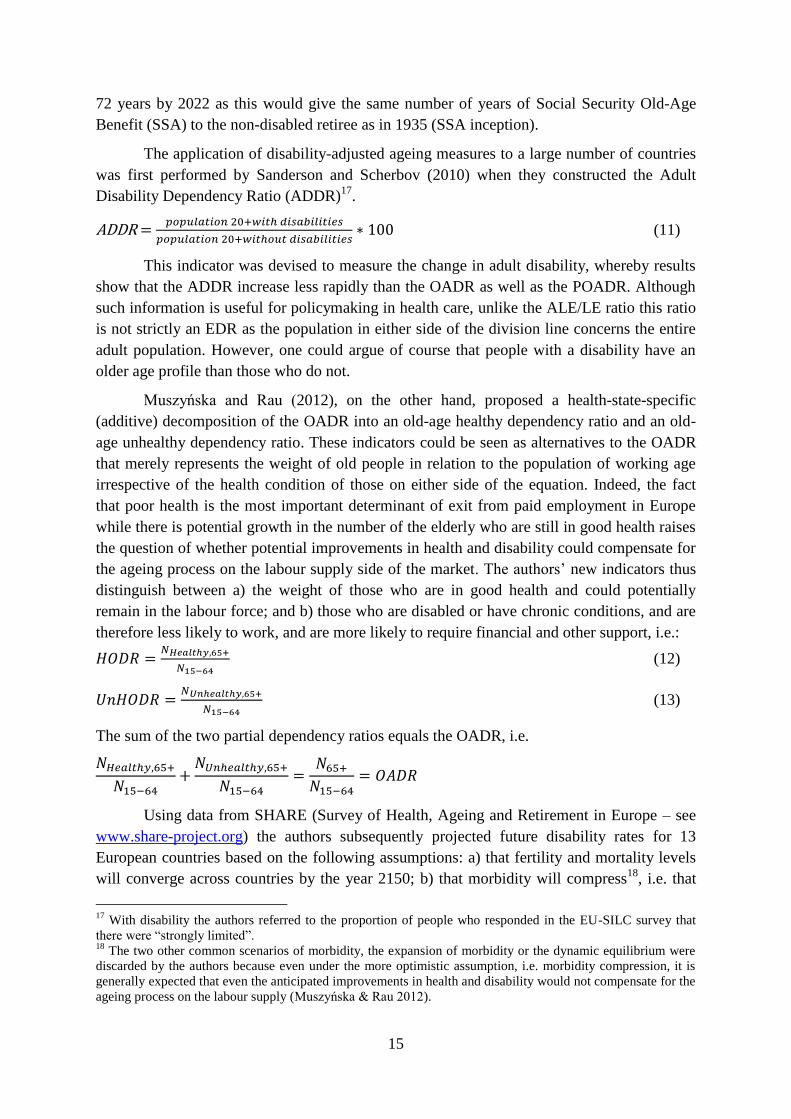
The application of disability-adjusted ageing measures to a large number of countries
was first performed by Sanderson and Scherbov (2010) when they constructed the Adult
Disability Dependency Ratio (ADDR)17
.
ADDR = 𝑝𝑜𝑝𝑢𝑙𝑎𝑡𝑖𝑜𝑛 20+𝑤𝑖𝑡ℎ 𝑑𝑖𝑠𝑎𝑏𝑖𝑙𝑖𝑡𝑖𝑒𝑠
𝑝𝑜𝑝𝑢𝑙𝑎𝑡𝑖𝑜𝑛 20+𝑤𝑖𝑡ℎ𝑜𝑢𝑡 𝑑𝑖𝑠𝑎𝑏𝑖𝑙𝑖𝑡𝑖𝑒𝑠∗ 100 (11)
This indicator was devised to measure the change in adult disability, whereby results
show that the ADDR increase less rapidly than the OADR as well as the POADR. Although
such information is useful for policymaking in health care, unlike the ALE/LE ratio this ratio
is not strictly an EDR as the population in either side of the division line concerns the entire
adult population. However, one could argue of course that people with a disability have an
older age profile than those who do not.
Muszyńska and Rau (2012), on the other hand, proposed a health-state-specific
(additive) decomposition of the OADR into an old-age healthy dependency ratio and an old-
age unhealthy dependency ratio. These indicators could be seen as alternatives to the OADR
that merely represents the weight of old people in relation to the population of working age
irrespective of the health condition of those on either side of the equation. Indeed, the fact
that poor health is the most important determinant of exit from paid employment in Europe
while there is potential growth in the number of the elderly who are still in good health raises
the question of whether potential improvements in health and disability could compensate for
the ageing process on the labour supply side of the market. The authors’ new indicators thus
distinguish between a) the weight of those who are in good health and could potentially
remain in the labour force; and b) those who are disabled or have chronic conditions, and are
therefore less likely to work, and are more likely to require financial and other support, i.e.:
𝐻𝑂𝐷𝑅 =𝑁𝐻𝑒𝑎𝑙𝑡ℎ𝑦,65+
𝑁15−64 (12)
𝑈𝑛𝐻𝑂𝐷𝑅 =𝑁𝑈𝑛ℎ𝑒𝑎𝑙𝑡ℎ𝑦,65+
𝑁15−64 (13)
The sum of the two partial dependency ratios equals the OADR, i.e.
𝑁𝐻𝑒𝑎𝑙𝑡ℎ𝑦,65+
𝑁15−64+
𝑁𝑈𝑛ℎ𝑒𝑎𝑙𝑡ℎ𝑦,65+
𝑁15−64=
𝑁65+
𝑁15−64= 𝑂𝐴𝐷𝑅
Using data from SHARE (Survey of Health, Ageing and Retirement in Europe – see
www.share-project.org) the authors subsequently projected future disability rates for 13
European countries based on the following assumptions: a) that fertility and mortality levels
will converge across countries by the year 2150; b) that morbidity will compress18
, i.e. that
17
With disability the authors referred to the proportion of people who responded in the EU-SILC survey that
there were “strongly limited”. 18
The two other common scenarios of morbidity, the expansion of morbidity or the dynamic equilibrium were
discarded by the authors because even under the more optimistic assumption, i.e. morbidity compression, it is
generally expected that even the anticipated improvements in health and disability would not compensate for the
ageing process on the labour supply (Muszyńska & Rau 2012).

16
the proportion of life spent in poor health will be smaller, but in contrast to Fries (1989), not
by assuming fewer years of poor health and constant life expectancy but that unhealthy life
expectancy does not change combined with increasing life expectancy at age 65; and that the
age pattern of activity limitations will not change over the projection period.
Results showed that the growth in the number of elderly people in Europe is expected
to cause a rise in both healthy and unhealthy dependency ratios but in which the healthy
dependency ratio is projected to make up a larger part of the OADR (50% in 2030 compared
to 57% in 2006) due to the anticipated future improvements in population health and positive
migration balance19
. While from a policy perspective, especially with regard to future health
care costs, it makes sense to split the elderly up into those who are considered healthy and
those who are not, the authors used a fixed age threshold linked to retirement age to separate
the working age (15-64) from the retired (65+), yet they acknowledge in discussion that many
retire early (some, though not all, for health reasons). Neither did the authors adjust for
proposed and implemented increasing pension ages in the respective European countries. So
why not just perform the analysis on the retired population instead of using, what is
increasingly becoming an arbitrary age, i.e. 65+? Using the working age population, defined
as anyone aged 15-64, as population who is supposed to finance the wellbeing of the elderly
is also flawed. Firstly, using age 15 as the lower working age limit is no longer applicable,
not only because education is compulsory until at least age 16 in all of the studied countries
but many students continue several years beyond that to complete upper-secondary and
tertiary qualifications. Secondly, and yet more significant, only about 66% of people in
working age in the EU28 are actually in paid employment, whereby the rate for women at
each age group is less than that of men and in most countries even less than half of men who
are close to retirement age still do work. Neither does their second assumption regarding their
optimistic scenario seem realistic, i.e. assuming that only those with activity limitations at
older ages will be out of the labour market. How many healthy 80+ would really want to
continue to work? My suggestion would be to use those in paid employment as the
denominator irrespective of age akin to the REDR indicator (formula 7) and make some
simple assumptions as to future age-specific LFP rates based on current changes in pension
systems. When considering the adult population as a whole as in the ADDR (formula 11), an
alternative disability dependency ratio would be:
𝑅𝐴𝐷𝐷𝑅 =𝑝𝑜𝑝𝑢𝑙𝑎𝑡𝑖𝑜𝑛 20+𝑤𝑖𝑡ℎ 𝑑𝑖𝑠𝑎𝑏𝑖𝑙𝑖𝑡𝑖𝑒𝑠
𝑝𝑜𝑝𝑢𝑙𝑎𝑡𝑖𝑜𝑛 𝑖𝑛 𝑝𝑎𝑖𝑑 𝑒𝑚𝑝𝑙𝑜𝑦𝑚𝑒𝑛𝑡∗ 100 (14)
If we are instead only interested in elderly (whose age range corresponds to RLE15-) the
formula equals:
𝑅𝐸𝐷𝐷𝑅 =∑ 𝑝𝑜𝑝𝑢𝑙𝑎𝑡𝑖𝑜𝑛 𝑤𝑖𝑡ℎ 𝑑𝑖𝑠𝑎𝑏𝑖𝑙𝑖𝑡𝑖𝑒𝑠 𝑎𝑛𝑑 𝑅𝐿𝐸15−𝑠
𝑝𝑜𝑝𝑢𝑙𝑎𝑡𝑖𝑜𝑛 𝑖𝑛 𝑝𝑎𝑖𝑑 𝑒𝑚𝑝𝑙𝑜𝑦𝑚𝑒𝑛𝑡∗ 100 (15)
19
More precisely, compared to an OADR of 25 in 2006 in the 13 European countries where 11 elderly per 100
people of working age (15–64) were healthy and 14 unhealthy, the authors estimated that in 2030 the OADR
would increase to 40 with exactly half of them in poor health and half in good health (Tables 1 and 3 in
Muszyńska & Rau 2012).

17
In the event of a lack of internationally- or time-comparable data on disability, an
alternative estimate of potential health care needs and expenditure is to use TTD of up to 5
years (i.e. using mortality rather than morbidity data as shown earlier in section 2.1). If we
are then again interested in elderly, the dependent population equals that of POADR5TTD
(formula 3), i.e.:
𝑅𝐸𝐷𝑅5𝑇𝑇𝐷 =# 𝑚𝑒𝑛 𝑎𝑛𝑑 𝑤𝑜𝑚𝑒𝑛 𝑖𝑛 𝑎𝑔𝑒𝑠 𝑤𝑖𝑡ℎ 𝑅𝐿𝐸15− & 𝑇𝑇𝐷<5
# 𝑚𝑒𝑛 𝑎𝑛𝑑 𝑤𝑜𝑚𝑒𝑛 𝑖𝑛 𝑝𝑎𝑖𝑑 𝑒𝑚𝑝𝑙𝑜𝑦𝑚𝑒𝑛𝑡∗ 100 (16)
This indicator ―named the Health care need adjusted Real Elderly Dependency Ratio―
was proposed in Spijker et al. (2014) where results for the US showed that like Prop RLE15-
&TTD the health care burden has been very stable since around 1980 and will only slowly
start to increase in a few years’ time.
2.5. Human Capital
In order to alleviate the burden of increasing numbers of elderly in a population more
productivity (as measured by GDP) is required. Up until now, some of the alternative
dependency ratios took the actual working population into consideration in the denominator
rather than the population of working age (formulas 4, 5, 7, 14-16) or the amount of hours
worked (formula 6). Formula 8 did not consider the employed population at all but just took
GDP, as from a government policy perspective total economic output is more relevant than
the number of workers. On similar lines, as government expenditure is only possible through
taxes, government tax revenue was used as the denominator in formula 9.
However, while productivity can be increased by getting more people to work, it can
also be obtained through investing in human capital. Human capital not only improves the
productivity of the labour force, it also stimulates long-term economic growth and can
therefore facilitate the allocation of the resources required for the retired population (Kemnitz
& Wigger 2000). One way society can invest in human capital is through education20
; but
while the prolongation of education beyond the current usual minimum age of 16 years has
resulted in few young adults participating in the labour force, when higher educated persons
do enter the workforce they quickly earn more money than lower educated workers of the
same age. Hence, as more human capital leads to higher productivity, fewer workers are
necessary to provide the financial resources that help to care for the ‘dependent’ elderly. In
addition, it can alleviate some of the negative effects of population ageing as the most
educated tend to work longer and retire at later ages and can therefore at least partially offset
the shrinking working-age population (Lutz et al. 2008a; 2008b).
Yet, as Philipov et al (2014) argue, higher human capital also has a downside for
government expenditure. This is because human capital that is utilized during working lives
is decisive for the level of income obtained during retirement, i.e. it tends to be higher for
20
Other ways include training and healthcare (Becker 2009) and, in the context of economic production, once
employed further human capital is accumulated through experience.

18
individuals who earned more during their working life. They therefore constructed an EDR
that takes into account the increasing human capital in both the working and retired-age
population. Specifically, and building on Striessnig and Lutz (2014) who applied education-
weighted dependency ratios with the purpose to determine the optimal fertility needed to
achieve the lowest total dependency ratio, the authors weighted the working-age population
by earning functions and the elderly population by human-capital-specific public pension
levels. To arrive at their dependency ratio, in the first step the authors projected the age, sex
and education composition of the population, whereby each individual contributed exactly
one unit to the overall distribution. Subsequently, they differentiated the units according to
the achieved level of human capital, applying education- and sex-specific earning functions
to the working-age population (ages 20-64). Under the assumption that labour income is
positively correlated with schooling and work experience, this was done by linking each level
of education with an average number of years spent in school; and linking work experience
with age: the higher the age, the longer the work experience. However, as according to the
authors human capital accumulation could decline at the end of working life, the (full-time
gross) income function levels off towards old working ages or takes the form of an inverse U-
shape:
𝑌 = 𝛼. 𝐸𝑑𝑢𝑐𝑎𝑡𝑖𝑜𝑛 + 𝛽1. 𝐴𝑔𝑒 + 𝛽2.𝐴𝑔𝑒 ∗ 𝐴𝑔𝑒 + 𝜀,
The resulting income functions were then used to construct a population aged 20-64
that is adjusted for its human-capital and age-specific composition. This was one by pivoting
all values to the lowest income, which was that of a female aged 20 having a low education.
If she contributed 1 unit to the age composition, a man aged 50 contributed 2.2, 2.87 or 4.72
units if his level of education was low, middle or high, respectively.
The human-capital composition of the population aged 65 and above was constructed
differently as Philipov et al (2014) assumed that this population is retired, so the retired
human capital was examined. To this end, they made use of the median of education-specific
gross public pensions over the whole age span 65 and above. The person-units assigned to a
person aged 65 or older with a specific sex and education were once more related to the
income of a female aged 20 having an education equal to or lower than secondary level. The
resulting ratio they called the human capital-specific OADR or HC-OADR:
HC-OADR = 𝑝𝑜𝑝𝑢𝑙𝑎𝑡𝑖𝑜𝑛 65+ 𝑎𝑑𝑗𝑢𝑠𝑡𝑒𝑑 𝑓𝑜𝑟 𝑒𝑑𝑢𝑐𝑎𝑡𝑖𝑜𝑛−𝑠𝑝𝑒𝑐𝑖𝑓𝑖𝑐 𝑚𝑒𝑑𝑖𝑎𝑛 𝑔𝑟𝑜𝑠𝑠 𝑝𝑢𝑏𝑙𝑖𝑐 𝑝𝑒𝑛𝑠𝑖𝑜𝑛𝑠
𝑝𝑜𝑝𝑢𝑙𝑎𝑡𝑖𝑜𝑛 20−64 𝑎𝑑𝑗𝑢𝑠𝑡𝑒𝑑 𝑓𝑜𝑟 𝑎𝑔𝑒,𝑒𝑑𝑢𝑐𝑎𝑡𝑖𝑜𝑛 𝑎𝑛𝑑 𝑔𝑟𝑜𝑠𝑠 𝑖𝑛𝑐𝑜𝑚𝑒 (17)
Based on the results the authors concluded that while education has a positive impact on
an economy’s productivity, in the long run a constant or moderately growing human capital
may actually aggravate the consequences of population ageing rather than alleviate them as a
better educated labour force will have higher pensions once it has retired because they
contributed more during their working life. The authors therefore advocated integrating
human capital into the calculation of the conventional population age composition and
dependency ratio as an increase in education accelerates population ageing. However, while
their robustness checks (e.g. excluding the unemployed, different fixed or increasing ages at
retirement) did not alter the results, the authors did not contemplate adjusting the

19
denominator for employment (e.g. by taking full-time equivalent workers), as participation
rates continuously change in the wake of economic booms and busts. Likewise, as
educational expansion has led to an increase in female LFP and participation rates of the
young-old have begun to increase over the last decades, there are likely to be proportionally
more older workers in future. The authors’ rationale for deriving their income functions for
full-time employment but assigning them to the entire working-age population rather than
only the employed was because such estimates present the full productive capacity of
employment and health/disability status. However, this raises the question as to how
applicable or useful their indicator really is, especially for international and time comparison,
given that such an assumption does not reflect reality. For instance, the proportion of the
working-age population in western countries that does not work fluctuates between about
20% (Japan 2012) and 55% (Spain 1985) (www.oecd.org). Moreover, educational attainment
is not a guarantee for employment as has been evident in Spain for decades. Youth
unemployment in 2014 was still above 50% while the proportion of 20-34 year olds with
tertiary educational attainment in 2013 was well above the EU28 average
(http://ec.europa.eu/eurostat/data/database).
2.6. Capturing Changes in Age-Specific Production, Consumption and Wealth
Proponents of the doom scenario that population ageing will bring a decline or stagnation in
future economic productivity tend to forget that the ratio of productive workers to dependent
citizens has been driven down, particularly over the last half a century or so, by the
shortening of workers’ labour market careers due to the need for a higher educated labour
force and, especially during the 1980s and 1990s, through early retirement schemes (Spijker
& MacInnes 2013a). Although baby boomers did of course dominate the workforce, and were
an important factor in the first demographic dividend, as explained in more detail below, the
economy also grew in western countries because it became orientated towards more
productive industries and high-value services. Less well known (at least for non-economists),
however, is that economic growth is also driven by consumption and savings, that together
with aggregate labour supply and productivity, tend to vary depending on where most people
fall in the life cycle.
Not surprisingly, labour supply is higher among working-age adults than among the
young and old. Conversely, the ratio of consumption to production tends to be greater than 1
for the economically dependent youth and elderly and less than 1 for the working age as the
overwhelming majority of the former are not in paid employment while money is spent on,
respectively, education and healthcare (Figure 4). As a consequence, and other things equal, a
country with large age-groups of youth and elderly is likely to experience slower growth than
one with a high proportion of working-age people (Coale & Hoover 1958). At the same time,
as the older population becomes larger and politically stronger, adopting certain policies such
as cutting health and pension benefits will prove difficult. This worries policymakers and
economists who argue that without reforms the sustainability of public pensions and health
care is threatened. However, if policymakers initiate action early, a country will be better able
to deal with the social, economic, and political effects of an impending altered population
structure. A good moment would be during the intermediate phase of the demographic

20
transition when population ageing is barely noticeable and the first demographic dividend is
being materialised as the working-age population outgrows the number of consumers and
income per effective consumer grows faster than productivity (Bloom et al. 2010).
Under these circumstances population ageing can actually have potentially positive
economic outcomes in the form of a so-called second demographic dividend, i.e. that
consumption outgrows the growth in the economic support ratio. But as with the first
demographic dividend, capturing this potential depends on whether consumers and policy
makers are forward-looking and respond effectively to the demographic changes that are
coming, as reflected by the quality of governmental institutions, labour legislation,
macroeconomic management, openness to trade, and education policy (Mason & Lee 2006;
Bloom & Canning 2008)21
. Some of the additional resources that are freed during the first
demographic dividend can be used to increase consumption, raising current standards of
living, and some can be invested in human or physical capital or in stronger institutions that
will lead to permanently higher economic growth.
Figure 4. Consumption and labour income age profiles for the United States, 2003.
Source: National Transfer Accounts project (www.ntaccounts.org).
In a sense, the two dividends are opposite sides of the same coin. The first dividend
arises because parents of working-age have fewer (dependent) children and the second
dividend because one generation later, the older, mostly retired, parents will have fewer
working-age children. The share of elderly in the total population therefore increases,
exacerbated by improved old-age survival chances. Importantly, however, is that while the
second dividend is a consequence of population ageing, the accumulation of wealth occurs in
21
An example where such conditions were often absent and therefore the economic performance lagged well
behind that of East and South East Asia, despite having similar demographics, is Latin America during the
period 1965-1990 (Bloom & Canning 2008).
$0
$10,000
$20,000
$30,000
$40,000
$50,000
$60,000
$70,000
0 5 10 15 20 25 30 35 40 45 50 55 60 65 70 75 80 85 90+
Age
Consumption
Income

21
anticipation of ageing. The first and second dividends may therefore also overlap as early
policy response is essential to realizing the second dividend (Mason & Lee 2006).
Specifically, during the first demographic dividend the growth in the effective labour
force (L) is greater than the effective number of consumers (N), i.e. a positive support ratio
(SR). Depending on data availability different support ratios (𝐿/𝑁) can be calculated, but
most methods can be traced back to the publication by Cuttler et al. (1990). For instance
Prskawetz and Sambt (2014) applied so-called National Transfer Account22
(NTA) age
profiles for labour income and consumption to obtain L and N and the resulting NTA support
ratio. In the simplest form the same weights are given to all consumers (of all ages) and all
producers (fixed at ages 20-64) (i.e. SR1 = 𝐿1/𝑁1, which thus equals the inverse of the
TDR). However, it is more realistic that age groups differ in labour productivity given the age
differences in human capital, income, LFP and hours worked, and in consumption needs,
such as in relation to private non-medical expenses, public education expenses and medical
expenses. This leads to the following adjusted support ratio:
𝑆𝑅2(𝑡) =𝐿2(𝑡)
𝑁2(𝑡)=
∑ 𝛾(𝑎)𝑁(𝑎,𝑡)𝜔𝑎=0
∑ 𝛼(𝑎)𝑁(𝑎,𝑡)𝜔𝑎=0
(a)
where 𝑁(𝑎, 𝑡) represents the number of people aged 𝑎 in year 𝑡; 𝛾(𝑎) represents an age-
specific, time-invariant vector of productivity that is based on the NTA age profile of labour
income scaled by the unweighted average of labour income between 30-49 years of age23
.
Similarly, 𝛼(𝑎) represents an age-specific, time-invariant vector of consumption that is based
on the NTA profile of consumption, scaled again by the unweighted average of labour
income between ages 30 and 49. Finally, 𝜔 denotes the maximum length of life (Prskawetz &
Sambt 2014).
The first demographic dividend is then represented by the growth rate (denoted by
‘ ̂’) of the SR. If positive, i.e. when the effective number of producers is growing faster than
the effective number of consumers, a dividend is obtained24
:
𝑆𝑅2(𝑡)̂ = 𝐿2(𝑡)̂ − 𝑁2(𝑡)̂ = 𝐿�̂� (18)
22
Motivated by the economic life cycle, National Transfer Accounts provides a systematic and comprehensive
approach to measuring the economic flows from a generational perspective. Given that at the beginning and end
of our lives we consume more than we produce through our labour and during the mid-part of our lives it is the
other way around, in the context of population ageing, changes in population age structure influence saving and
the demand for wealth and capital, such as the demand for old-age support. Specifically, NTA provide an
accounting of economic flows to and from residents of a country classified by their age. The accounts are
comprehensive in that all economic flows that arise as a consequence of the production of goods and services
during the year are incorporated into the accounts as well as age reallocations realized by relying on
intergenerational transfers and assets. It is therefore a new tool that can be used to gain greater insights about
how standard of living, generational equity, financial conditions and other important features of our economies
are likely to be influenced by these demographic changes (UN 2013a). 23
Normalising on the per capita labour income of persons aged 30-49 is a standard approach in NTA analyses
for comparing the results across countries (see Prskawetz & Sambt (2014) and Mason & Lee (2011)). 24
However, Crespo Cuaresma (2014b) found that not the higher proportion of workers but improvements in
educational attainment are key to explaining productivity and income growth, i.e. a substantial portion of the
demographic dividend is an education dividend. It is also important to note that changes in the SR ignore
changes in unemployment and labour force participation rates, which are kept constant in the NTA profile as
they are computed per person for the base year only (Patxot et al. 2011).

22
According to a study by Mason and Lee (2006) the world as a whole and most major
regions experienced a favourable first demographic dividend between 1960 and 2000 (an
exception being the least developed countries located primarily in Africa). Particularly some
of the high performing countries of East Asia enjoyed a very favourable dividend as the
effective labour growth outgrew the rate of increase in effective consumers. However, both
there as in Europe (though not Northern America) population ageing is likely to cause a
negative first dividend over the coming decades (Table 3). In the world’s most aged countries
such as Spain this is already taking place (Figure 5).
Table 3. First demographic dividend, 1960-2050. Major regions of the world.
Annual growth rate (%)
1960-2000
First
divided
(%)
1960-
2000
Annual growth rate (%)
2000-2050
First
dividend
(%)
2000-
2050
Cumulated first divi-
dend since 1960 (%)
Effective
labour force
Effective
consumers
Effective
labour force
Effective
consumers 2000 2050
WORLD 1.99 1.80 0.19 0.89 0.71 0.18 7.7 16.0
More developed regions 0.90 0.71 0.18 -0.56 -0.27 -0.29 7.6 -4.3
Less developed regions 2.42 2.17 0.25 1.19 0.91 0.29 10.3 23.7
Least developed countries 2.42 2.51 -0.09 2.95 2.27 0.67 -3.5 26.2
Northern America 1.40 1.14 0.25 0.36 0.55 -0.19 10.6 2.5
Europe 0.65 0.51 0.14 -1.00 -0.69 -0.32 5.8 -6.9
Oceania 1.90 1.72 0.18 0.89 0.86 0.03 7.4 8.5
Asia 2.30 2.01 0.29 0.77 0.58 0.19 12.3 21.2
Latin America 2.62 2.27 0.35 0.91 0.65 0.26 15.0 27.5
Africa 2.60 2.66 -0.06 2.74 2.03 0.71 -2.2 29.8
China 2.27 1.78 0.49 -0.23 -0.06 -0.18 21.5 13.2
Republic of Korea 2.49 1.74 0.74 -0.49 -0.04 -0.45 34.7 12.5
Source: Mason and Lee (2006).
Figure 5. First demographic dividend, 1950-2050. Spain.
Source: adapted from Patxot et al. (2011).
-1.0
-0.5
0.0
0.5
1.0
1.5
1950 1960 1970 1980 1990 2000 2010 2020 2030 2040 2050
1st
Div
iden
d (
% a
nn
ual g
row
th r
ate
)
23
On the other hand, longer life and changes in the population age structure can lead to more
rapid accumulation of assets and thereby produce a second demographic divided. However,
for this to take place current per capita consumption needs to rise by less than the support
ratio as saving rates as well as assets will increase. This then leads to an increase in labour
productivity and wages and in the long run a sustained higher level of consumption.
Specifically, the second demographic dividend can be formally derived starting from the
following decomposition of consumption per capita (Mason & Lee 2007):
𝐶(𝑡)
𝑁(𝑡)=
𝐶(𝑡)
𝑌(𝑡)∙
𝑌(𝑡)
𝐿(𝑡)∙
𝐿(𝑡)
𝑁(𝑡) (b)
where 𝐶(𝑡) denotes total consumption and 𝑌(𝑡) is total labour income. Note that 𝐿(𝑡) = 𝐿2
and 𝑁(𝑡) = 𝑁2 from equation (a) with 𝐿(𝑡)/𝑁(𝑡) equalling the SR. The term 𝐶(𝑡)/𝑁(𝑡) is
denoted as consumption index 𝑐̅(𝑡), while 𝑌(𝑡)/𝐿(𝑡) is considered the labour market index
�̅�(𝑡). If the first two product terms on the right hand side of (18) were not affected by
demographic change, a change in the support ratio would translate into a proportional change
of consumption per capita. However, as was argued in Mason and Lee (2007), a change in the
age structure of a population will also affect the consumption per output level (𝐶/𝑌). If 𝐶/𝑌
decreases when the SR increases, savings will increase. Following Prskawetz and Sambt
(2014) by rearranging equation (b), writing it in growth terms and using subscripts to denote
the numerator of the variable under consideration, one obtains the rate of growth of
consumption relative to income �̂�𝑌, i.e. the second demographic dividend:
�̂�𝑌 = (�̂�𝑁 − �̂�𝐿) − �̂�𝑁 (19)
The growth rate of 𝐿𝑁 equals the first demographic dividend, while the term in brackets gives
the “extent to which consumption per consumer 𝐶𝑁 rises relative to productivity changes 𝑌𝐿
induced by technological innovation” (Mason & Lee 2007). However, the second dividend is
more complex to estimate than the first. This is partly because the accumulation of wealth is
intrinsically forward looking as individuals accumulate wealth in anticipation of future needs
to support consumption, to finance bequests, and to respond to other uncertain events. In
other words, current generations must first reduce their consumption in order to increase their
wealth and achieve higher consumption in future periods. This therefore means that
projections of the equivalent number of consumers and producers for each cohort and
complete life cycle wealth estimates for many decades in advance are required; and while
population projections are often uncertain, life cycle wealth data are often not available.
Fortunately, the nature of the economic lifecycle provides assistance with this problem as for
the most part, capital accumulation is concentrated among older working-age adults who are
approaching their peak earnings and have completed their childrearing responsibilities,
reason why it is recommended to use wealth held by those age 50 and older to measure the
effect of demography on aggregate lifecycle wealth and the second demographic dividend
(Mason 2005). Given this age-profile, each can be considered as ageing indicators.
Specifically, aggregate lifecycle wealth, 𝑊(𝑡) is the wealth that adults must hold, as a
group in year 𝑡 in order to achieve a given path of consumption and labour over the
remainder of their collective existence. 𝑊(𝑡) is equal to the present value, 𝑃𝑉, of the
consumption less the 𝑃𝑉 of the labour income of those over the remainder of their lives, i.e.

24
𝑊(𝑡) = ∑ 𝑊(𝑎, 𝑡) = ∑(𝑃𝑉[𝐶(𝑎, 𝑡)] − 𝑃𝑉[𝑌(𝑎, 𝑡)]) (20)
where 𝐶(𝑎, 𝑡) and 𝑌(𝑎, 𝑡) are vectors of current and future consumption and current and
future labour income, respectively, for the cohort of age 𝑎 and year 𝑡. Summing 𝑊(𝑎, 𝑡)
across all adult ages in year 𝑡 yields aggregate lifecycle wealth, 𝑊(𝑡) (Mason & Lee 2007).
This wealth can take different forms. One possibility is that retirees will rely on
transfers from public pension and welfare programmes 𝑇𝑝(𝑡) or from adult children 𝑇𝑘(𝑡)
and other family members. In this case, individuals are accumulating transfer wealth as a
method of financing consumption during their retirement years. A second possibility is that
individuals will accumulate assets and capital 𝐴(𝑡) such as private savings and funded
pensions during their working years and that this capital will serve as the source of support
during the retirement period. Both of these forms of wealth can be used to deal with the life
cycle deficit at older ages. The second demographic dividend thus depends on (a) the share of
family transfers to children 𝜏𝑘(𝑡) = 𝑇𝑘(𝑡)/𝑊(𝑡) and (b) on how much of the old age
consumption is supported by transfers as opposed to assets 𝜏(𝑡) =𝑇𝑃(𝑡)
𝐴(𝑡)+𝑇𝑃(𝑡) (where 𝐴(𝑡) +
𝑇𝑃(𝑡) is denoted as pension wealth). The higher the share of family transfers to children (as
opposed to public transfers) the more wealth is required from people for financing
consumption of their children. Analogously, if elderly finance a large share of their
consumption through asset based reallocation, people need to accumulate more wealth during
their active life for the time of retirement (Prskawetz & Sambt 2014). Likewise, for the
macroeconomy it is important whether that wealth is created by expanding transfer programs
or accumulating assets because only in the latter case will savings and capital deepening
increase (Mason & Lee 2007).
Mason (2005) estimated first and second dividends over the last three decades of last
century and compared it with the growth in GDP per capita (Table 4). He found that the
second demographic dividend was already larger than the first in all major world regions, but
that only in industrial countries, East Asia & Southeast Asia and South Asia the two
dividends combined were less than the total growth in GDP per capita. However, while
changes in the age composition accounted for an important part of the rapid growth in East
and Southeast Asia, other regions such as Latin America did not successfully exploit their
demographic dividends as actual growth fell well short of that opportunity, although in Africa
the dividend period is just beginning.
It is, however, important for ageing societies to know that the way a society supports
its elderly determines how much of the second demographic dividend is realised, while
combining the two demographic dividends could be used as an indicator of ageing. For
instance, a positive total dividend is not anticipated in most European countries over the
coming decades because the consumption of the elderly is predominantly financed through
familial and public transfers rather than assets. If transfer wealth dominates the age
reallocation system for supporting the elderly it would mean that no second demographic
dividend is yielded (Mason & Lee 2006). This is because an increase in transfer wealth will
crowd out the stock of capital and hence future economic growth and per capita income will
decline.

25
Table 4. Estimates of the first and second dividends and the actual growth in Gross
Domestic Product per effective consumer (GDP/N). 1970-2000.
Demographic Dividends Actual
growth in
GDP/N
GDP growth-
Dividend
First Second Total
Industrial 0.34 0.69 1.03 2.25 1.22
East Asia & Southeast Asia 0.59 1.31 1.90 4.32 2.42
South Asia 0.10 0.69 0.80 1.88 1.08
Latin America 0.62 1.08 1.70 0.94 -0.76
Sub-Saharan Africa -0.09 0.17 0.08 0.06 -0.02
Middle East and North Africa 0.51 0.70 1.21 1.10 -0.11
Transitional 0.24 0.57 0.81 0.61 0.20
Pacific Islands 0.58 1.15 1.73 0.93 -0.79
Source: Mason (2005)
To conclude, Table 5 provides an overview of the alternative ageing indicators that have been
discussed in the paper, including the direction of estimated short-term future trends.

26
Table 5. Inventory of indicators of population ageing as alternative to the Old Age Dependency Ratio (OADR)
# Abbrev. Full name of indicator Measured as Short-term Main reference
Prediction*
The standard
0 OADR Old Age Dependency Ratio 𝑝𝑜𝑝𝑢𝑙𝑎𝑡𝑖𝑜𝑛 20+𝑤𝑖𝑡ℎ 𝑑𝑖𝑠𝑎𝑏𝑖𝑙𝑖𝑡𝑖𝑒𝑠
𝑝𝑜𝑝𝑢𝑙𝑎𝑡𝑖𝑜𝑛 𝑖𝑛 𝑝𝑎𝑖𝑑 𝑒𝑚𝑝𝑙𝑜𝑦𝑚𝑒𝑛𝑡∗ 100 ↑ e.g. UN 2013b
Years left vs. years lived
1. Prop RLE15- Proportion of pop in age groups with RLE15- ∑ 𝑝𝑜𝑝𝑢𝑙𝑎𝑡𝑖𝑜𝑛 𝑅𝐿𝐸15−𝑠
𝑡𝑜𝑡𝑎𝑙 𝑝𝑜𝑝𝑢𝑙𝑎𝑡𝑖𝑜𝑛∗ 100 ↑ but < OADR Sanderson & Scherbov 2007b
2. POADR Prospective Old Age Dependency Ratio ∑ 𝑝𝑜𝑝𝑢𝑙𝑎𝑡𝑖𝑜𝑛 𝑅𝐿𝐸15−𝑠
𝑝𝑜𝑝𝑢𝑙𝑎𝑡𝑖𝑜𝑛 20+𝑢𝑝 𝑡𝑜 𝑎𝑔𝑒 𝑎𝑡 𝑤ℎ𝑖𝑐ℎ ∑ 𝑝𝑜𝑝𝑢𝑙𝑎𝑡𝑖𝑜𝑛 𝑅𝐿𝐸15−𝑠∗ 100 ↑ but < OADR Sanderson & Scherbov 2007b
3. POADR5TTD Health care need adjusted POADR # 𝑚𝑒𝑛 𝑎𝑛𝑑 𝑤𝑜𝑚𝑒𝑛 𝑖𝑛 𝑎𝑔𝑒 𝑔𝑟𝑜𝑢𝑝𝑠 𝑤𝑖𝑡ℎ 𝑅𝐿𝐸15− & 𝑇𝑇𝐷<5
𝑝𝑜𝑝𝑢𝑙𝑎𝑡𝑖𝑜𝑛 20+𝑢𝑝 𝑡𝑜 𝑎𝑔𝑒 𝑎𝑡 𝑤ℎ𝑖𝑐ℎ ∑ 𝑝𝑜𝑝𝑢𝑙𝑎𝑡𝑖𝑜𝑛 𝑅𝐿𝐸15−𝑠∗ 100 Slight ↑ Spijker et al. 2014
Non-working to working population ratios
4. PWR Pensioner/Worker Ratio 𝑃𝑒𝑛𝑠𝑖𝑜𝑛𝑒𝑟𝑠
𝑝𝑜𝑝𝑢𝑙𝑎𝑡𝑖𝑜𝑛 𝑖𝑛 𝑝𝑎𝑖𝑑 𝑒𝑚𝑝𝑙𝑜𝑦𝑚𝑒𝑛𝑡 ↑ ≈ OADR Bongaarts 2004
5. R Ratio Nonworkers to Workers 𝑁𝑜𝑛−𝑤𝑜𝑟𝑘𝑒𝑟𝑠
𝑊𝑜𝑟𝑘𝑒𝑟𝑠 𝑟𝑒𝑚𝑢𝑛𝑒𝑟𝑎𝑡𝑒𝑑 𝑓𝑜𝑟 1+ ℎ𝑜𝑢𝑟 𝑝𝑒𝑟 𝑤𝑒𝑒𝑘 ↑ 2005-25 Vaupel & Loichinger 2006
6. NWDR Non-Working Aged Dependency Ratio 𝑛𝑜𝑛−𝑤𝑜𝑟𝑘𝑒𝑟𝑠 𝑎𝑔𝑒𝑑 60+
𝑓𝑢𝑙𝑙−𝑡𝑖𝑚𝑒 𝑒𝑞𝑢𝑖𝑣𝑎𝑙𝑒𝑛𝑡 𝑤𝑜𝑟𝑘𝑒𝑟𝑠 ↑ ≈ OADR Tyers & Shi 2007
Years left-based elderly dependency ratios with alternative denominators
7. REDR Real Elderly Dependency Ratio # 𝑚𝑒𝑛 𝑎𝑛𝑑 𝑤𝑜𝑚𝑒𝑛 𝑖𝑛 𝑎𝑔𝑒𝑠 𝑤𝑖𝑡ℎ 𝑅𝐿𝐸15−
# 𝑚𝑒𝑛 𝑎𝑛𝑑 𝑤𝑜𝑚𝑒𝑛 𝑖𝑛 𝑝𝑎𝑖𝑑 𝑒𝑚𝑝𝑙𝑜𝑦𝑚𝑒𝑛𝑡∗ 100 Slight ↓ Spijker & MacInnes 2013b
8. RLE15/gdp Elderly to GDP Ratio # 𝑚𝑒𝑛 𝑎𝑛𝑑 𝑤𝑜𝑚𝑒𝑛 𝑖𝑛 𝑎𝑔𝑒𝑠 𝑤𝑖𝑡ℎ 𝑅𝐿𝐸15−
𝐺𝐷𝑃 𝑖𝑛 𝐺𝐾 $ ∗ 1,000,000 Constant Spijker et al. 2014
9. RLE15/tax Elderly to Tax Ratio # 𝑚𝑒𝑛 𝑎𝑛𝑑 𝑤𝑜𝑚𝑒𝑛 𝑖𝑛 𝑎𝑔𝑒𝑠 𝑤𝑖𝑡ℎ 𝑅𝐿𝐸15−
𝑡𝑎𝑥 𝑟𝑒𝑣𝑒𝑛𝑢𝑒 𝑖𝑛 𝐺𝐾 $∗ 1,000,000 Constant Spijker et al. 2014

27
Old age vs. ill-health dependency ratios
10. ALE/LE Ratio Active (disability free) LE to total LE 𝑎𝑐𝑡𝑖𝑣𝑒 𝑙𝑖𝑓𝑒 𝑒𝑥𝑝𝑒𝑐𝑡𝑎𝑛𝑐𝑦 𝑎𝑡 𝑎𝑔𝑒 𝑥
𝑡𝑜𝑡𝑎𝑙 𝑙𝑖𝑓𝑒 𝑒𝑥𝑝𝑒𝑐𝑡𝑎𝑛𝑐𝑦 𝑎𝑡 𝑎𝑔𝑒 𝑥∗ 100 ↑ Manton et al. 2006
11. ADDR Adult Disability Dependency Ratio 𝑝𝑜𝑝𝑢𝑙𝑎𝑡𝑖𝑜𝑛 20+𝑤𝑖𝑡ℎ 𝑑𝑖𝑠𝑎𝑏𝑖𝑙𝑖𝑡𝑖𝑒𝑠
𝑝𝑜𝑝𝑢𝑙𝑎𝑡𝑖𝑜𝑛 20+𝑤𝑖𝑡ℎ𝑜𝑢𝑡 𝑑𝑖𝑠𝑎𝑏𝑖𝑙𝑖𝑡𝑖𝑒𝑠∗ 100 Constant Sanderson & Scherbov 2010
12. HODR Healthy Old-age Dependency Ratio 𝑁𝐻𝑒𝑎𝑙𝑡ℎ𝑦,65+
𝑁15−64 ↑ Muszyńska & Rau 2012
13. UnHODR Unhealthy Old-age Dependency Ratio 𝑁𝑈𝑛ℎ𝑒𝑎𝑙𝑡ℎ𝑦,65+
𝑁15−64 Slight ↑ Muszyńska & Rau 2012
14. RADDR Real Adult Disability Dependency Ratio 𝑝𝑜𝑝𝑢𝑙𝑎𝑡𝑖𝑜𝑛 20+𝑤𝑖𝑡ℎ 𝑑𝑖𝑠𝑎𝑏𝑖𝑙𝑖𝑡𝑖𝑒𝑠
𝑝𝑜𝑝𝑢𝑙𝑎𝑡𝑖𝑜𝑛 𝑖𝑛 𝑝𝑎𝑖𝑑 𝑒𝑚𝑝𝑙𝑜𝑦𝑚𝑒𝑛𝑡∗ 100 N/A New
15. REDDR Real Elderly Disability Dependency Ratio ∑ 𝑝𝑜𝑝𝑢𝑙𝑎𝑡𝑖𝑜𝑛 𝑤𝑖𝑡ℎ 𝑑𝑖𝑠𝑎𝑏𝑖𝑙𝑖𝑡𝑖𝑒𝑠 𝑎𝑛𝑑 𝑅𝐿𝐸15−𝑠
𝑝𝑜𝑝𝑢𝑙𝑎𝑡𝑖𝑜𝑛 𝑖𝑛 𝑝𝑎𝑖𝑑 𝑒𝑚𝑝𝑙𝑜𝑦𝑚𝑒𝑛𝑡∗ 100 N/A New
16. REDR5TTD Health care need adjusted REDR # 𝑚𝑒𝑛 𝑎𝑛𝑑 𝑤𝑜𝑚𝑒𝑛 𝑖𝑛 𝑎𝑔𝑒𝑠 𝑤𝑖𝑡ℎ 𝑅𝐿𝐸15− & 𝑇𝑇𝐷<5
# 𝑚𝑒𝑛 𝑎𝑛𝑑 𝑤𝑜𝑚𝑒𝑛 𝑖𝑛 𝑝𝑎𝑖𝑑 𝑒𝑚𝑝𝑙𝑜𝑦𝑚𝑒𝑛𝑡∗ 100 Slight ↑ Spijker et al. 2014
Human capital-based elderly dependency ratio
17. HC-OADR Human capital OADR 𝑝𝑜𝑝.65+ 𝑎𝑑𝑗.𝑓𝑜𝑟 𝑒𝑑𝑢𝑐𝑎𝑡𝑖𝑜𝑛−𝑠𝑝𝑒𝑐𝑖𝑓𝑖𝑐 𝑚𝑒𝑑𝑖𝑎𝑛 𝑔𝑟𝑜𝑠𝑠 𝑝𝑢𝑏𝑙𝑖𝑐 𝑝𝑒𝑛𝑠𝑖𝑜𝑛𝑠
𝑝𝑜𝑝𝑢𝑙𝑎𝑡𝑖𝑜𝑛 20−64 𝑎𝑑𝑗𝑢𝑠𝑡𝑒𝑑 𝑓𝑜𝑟 𝑎𝑔𝑒,𝑒𝑑𝑢𝑐𝑎𝑡𝑖𝑜𝑛 𝑎𝑛𝑑 𝑔𝑟𝑜𝑠𝑠 𝑖𝑛𝑐𝑜𝑚𝑒 ↑ Philipov et al. 2014
Consumption vs. production ratios and lifetime wealth
18 �̂�𝑁 First Demographic Dividend = 𝑐𝑜𝑛𝑠𝑢𝑚𝑝𝑡𝑖𝑜𝑛̂ − 𝑝𝑟𝑜𝑑𝑢𝑐𝑒𝑟𝑠̂ ↓ Mason & Lee 2007
19 �̂�𝑌 Second Demographic Dividend (𝑐𝑜𝑛𝑠𝑢𝑚𝑝𝑡𝑖𝑜𝑛̂
𝑐𝑜𝑛𝑠𝑢𝑚𝑒𝑟𝑠̂−
𝑖𝑛𝑐𝑜𝑚𝑒̂
𝑝𝑟𝑜𝑑𝑢𝑐𝑒𝑟𝑠̂ ) −
𝑐𝑜𝑛𝑠𝑢𝑚𝑝𝑡𝑖𝑜𝑛̂
𝑝𝑟𝑜𝑑𝑢𝑐𝑒𝑟𝑠̂ ↑ Mason & Lee 2007
20 𝑊(𝑡) Aggregate Lifecycle Wealth ∑ 𝐶𝑜𝑛𝑠𝑢𝑚𝑝𝑡𝑖𝑜𝑛𝑤−𝑎0(𝑡)𝑥=0 − ∑ 𝐼𝑛𝑐𝑜𝑚𝑒
𝑤−𝑎0(𝑡)𝑥=0 ** ↑ Mason & Lee 2007
* For most low-mortality countries. If possible, comparison in projected trend with other indicator.
** The formula is here simplified. For a full account of how life cycle wealth can be estimated, see Mason and Lee (2007).

28
3. Discussion
Old-age survival has been improving virtually without interruption over the last half century
in high income countries. Yet we continue to measure elderly in the same static manner today
as 50 years ago, despite the diverse employment histories, social responsibilities, financial
circumstances and health statuses. Sixty-five is often taken as the demarcation line between
mature adulthood and old age, largely due to the fact that for many years it has been, or was
until recently, the statutory retirement age. However, a contested conjecture is if 65-year-olds
today are really as old as 65-year olds in 1965, or even in 2000, even if they lived the same
number of years (Lutz et al. 2008c). This conjecture is fundamental because we live in an era
where most people in low-mortality countries are expected to survive beyond 80 years of age
while concomitantly current retirees stop working (well) before the pension eligibility age.
Over the last few decades this has raised issues regarding the affordability of old-age social
security benefits and medical, health and personal care. Today, this concern is becoming even
more urgent as baby boomers are starting to retire and smaller birth cohorts are making up a
larger part of the current, and more importantly, future workforce as fertility rates have been
just or well below replacement in most Western countries for 3-4 decades. On the other hand,
there are with regard to the workforce also two counter-trends: in many countries
proportionally more women are in paid employment today than ever before while there are
also signs that the LFP rate of older workers is increasing.
Not surprisingly, while some concerns regarding the impact that population ageing
will have on society are justified, much of the rhetoric is based on the use of elderly
dependency ratios such as the OADR that do not consider changing old-age survival rates,
labour force participation rates or consumption and savings patterns. As a result, over the last
10 years or so, particularly demographers have looked at developing alternative indicators of
population ageing. Perhaps the most important conclusion deriving from this inventory is that
the indicator to use depends on the purpose of the exercise.
While this may appear to be obvious, the OADR or the proportion of the total
population aged 60+ or 65+ is still used as the basis for arguments concerning the supposed
negative effects of population ageing and even for policy changes. I have therefore grouped
the alternative indicators that were discussed in this paper into five types:
1. Purely demographic
2. Purely economic
3. Demographic and economic related
4. Health and disability related
5. Based on human capital
This paper has shown that the best way to investigate the possible effects of
population ageing on economic variables such as consumption, savings and productivity or
the affordability of the public pension system types 2, 3 or 5 indicators should be used. If, on
the other hand, one aims to study changes in elderly health and disability in the context of the

29
sustainability of the public health care system then types 1 and 4 are the most obvious ones to
choose from.
What population ageing means for future economic growth and public finances have
been of particular interest for academics. Recent literature has developed theoretical
arguments that focus on the different channels through which demography may influence
economic growth, as well as empirical evidence on the potential effects of such demographic
changes on several macroeconomic variables (Crespo Cuaresma et al. 2014a). This has been
aided by the creation of the National Transfer Accounts that has enabled a more precise
construction of population ageing indicators by taking into consideration the effect of changes
in the population age structure on income and consumption flows. One result of NTA is for
instance that population ageing also depresses the support ratio after adjusting for age-specific
consumption and labour income profiles and is likely to produce a negative first demographic
dividend in most industrialised countries over the coming decades (Prskawetz & Sambt
2014). The resulting increasing proportion of non-working elderly in the population is, as we
know, a common political and economic worry because it is thought that the burden for
working adults of financing the consumption of non-working adults through public transfers
will increase to unsustainable levels (e.g. European Commission 2010). However, detailed
age accounting for individuals and households using NTA data has also shown that basing
policy solely on expected changes in the support ratio is ignoring an array of other factors
that, under the right circumstances, may actually produce a second demographic dividend in
ageing populations. This is for several reasons. First, because retirees do not, as popular
discourse may suggest, rely exclusively on the labour of others (through public and familial
transfer systems) to fund their pensions but also on their own pension funds, personal savings,
homes acquired during their working years, and other assets to finance some part of their
retirement (Mason & Lee 2007). Secondly, during the process of population ageing the labour
force increasingly concentrates in higher age groups. As they are generally aware of their own
mortality risk (Hamermesh 1985; Post & Hanewald 2012) they know that they will spend
more years in retirement than earlier cohorts. This can be a strong incentive for people to
accumulate assets for their retirement, which then leads to an upward shift in the age profile
of wealth, an important source of the second demographic dividend.
However, when consumption of the elderly is mainly financed by the state through public
transfers (e.g. state pensions), as in many European countries, a positive second demographic
dividend may be harder to achieve. Economic and policy responses to population ageing and
population decline therefore holds the key to continued economic growth for many countries,
but this will not be an easy task as many issues will need to be considered. According to Clark
et al. (2007) such include whether:
governments should be concerned about economic growth or only focus on per capita
income and consumption;
taxes will need to be raised, benefits cut, retirement ages raised for the financing of
national retirement systems and if governments can make the transition from current pay-
as-you-go plans to funded plans;
policies should be adopted to curtail rapid growth in health care spending;

30
there was a first demographic dividend (due to declines in child dependency) and if a
country can produce a second demographic dividend (save now to increase production in
the future);
LFP rates can be increased to maintain the size of the labour force (e.g. by facilitating
women to enter the workforce, relaxing immigration standards, keeping older workers in
the workforce).
These issues make it clear that elderly dependency or support ratios are required that don’t
merely compare a supposed dependent population defined by a fixed age (usually aged 65+)
with everyone of working age as such are misleading because they do not take other
important factors into consideration. Depending on the context, the picture of population
ageing may be quite different than that is often suggested on the basis of the OADR. For
instance, the population ageing that many populations will experience over the coming
decades shifts the demand for wealth and capital to the right, leading to increased capital per
worker, and therefore higher, not lower productivity, while consumption is also higher in the
long term. Likewise, focussing on public pensions also gives a mistaken sense of the
consequences of rising old-age dependency as they only cost a small fraction of national
output. Support ratios that take into consideration age-specific consumption and production
patterns are therefore much more realistic than the standard OADR (Lee & Mason 2010).
Moreover, the supposed “dependency burden” of the elderly is a function of the
institutional welfare system that is in place rather than an elderly to worker ratio. For instance,
if the only reason to raise the pension age are budgetary considerations that cannot cover an
increasing proportion of elderly it is unclear why alternative expenditure reductions or
revenue increases are not equally satisfactory. As Scherbov et al. (2014) state, a better
rationale for raising pension ages is that pensioners are living longer so it would be unfair for
younger generations to have to pay for the older generations’ longevity gains. Older
generations enjoying those gains should therefore help to keep public pensions affordable by
increasing their LFP during their working life and/or retiring later25
.
Although dealing with the issues raised by Clark et al. (2007) is obviously beyond scope of
this paper, the use of adequate population ageing measures would absolutely facilitate
estimating the supposed “dependency burdens” for different types of population ageing
issues. For instance, in terms of health care this paper introduced several indicators that
approximated the dependent population by according to a particular characteristic other than
simply taking the entire 65+ population. One was to consider the proportion of the population
with an average life expectancy of 15 years or less (RLE15-) as the numerator with the
argument that elderly of a particular age generally have higher remaining life expectancies
and are healthier than their counterparts in earlier generations (Sanderson & Scherbov 2013)
and with similar differences between low and high mortality countries. This way, a more
comparable elderly population in terms of health needs is obtained. It formed the basis for
25
According to estimates made by Scherbov et al. (2014), in most European countries an increase in normal
pension age to 68 by 2050 would not be enough to keep the burden on the working population from ballooning
and may require the pension age to be increased to 70 years, unless LFP increases by several percentage points.

31
Sanderson and Scherbov’s (2007b) Prospective Old Age Dependency Ratio, while Spijker
and MacInnes (2013b) subsequently adjusted the denominator with the argument that the bulk
of health care is paid by those in paid employment. However, further refinements can still be
made because health care costs are more related to factors such as progress in medical
knowledge and technology, hospitalization costs and more use of long-term care facilities
rather than population ageing, costs that are particularly high during the last few years rather
than the last 15 years of a person’s life (see section 2.1 for references). Sanderson and
Scherbov’s RLE15- definition of elderly is a good way to define the older population, but
those who form part of the population who actually require health care is only a subset of this
population. The “Health care need adjusted Real Elderly Dependency Ratio” (i.e. considering
within this population those elderly who are expected to die within 5 years) was one attempt
to adjust this further.
To conclude, population ageing is the result of changes in the age distribution that has led
to proportionally more elderly in the population. Due to the widespread use of inadequate
population ageing indicators such as the OADR this phenomenon is often seen as a threat to
economic growth and government budgets spending even though many other factors are
involved in the observed and projected increases in health care and social benefit spending or
economic production. Indeed, an ageing population even has the potential for economic
growth with the right policies in place. However, a more widespread use of more precise
population ageing indicators is still required in order to get the general public, policy makers
and even some academics to also understand this.

32
4. References
Baltes PB, Smith J (2003) New Frontiers in the Future of Aging: From Successful Aging of
the Young Old to the Dilemmas of the Fourth Age. Gerontology 49:123-135.
Becker GS (2009) Human capital: A theoretical and empirical analysis, with special
reference to education. University of Chicago Press, Chicago
Bíró A (2010) Subjective mortality hazard shocks and the adjustment of consumption
expenditures. Journal of Population Economics:1-30.
Bloom DE, Canning D (2008) Global Demographic Change: Dimensions and Economic
Significance. Population and Development Review 34:17-51.
Bloom DE, Canning D, Fink G (2010) Implications of population ageing for economic
growth. Oxford Review of Economic Policy 26 (4):583-612.
Bongaarts J (2004) Population aging and the rising cost of public pensions. Population and
Development Review 30 (1):1-23.
Brouard N (1986) Structure et dynamique des populations. La pyramide des années à vivre,
aspects nationaux et exemples régionaux. Espace, populations, sociétés 4 (2):157-168.
Burnside R (2012) Demographic Change (Financial Scrutiny Unit Briefing 12/57). Scottish
Parliament Information Centre (SPICe), Edinburgh.
Carstensen LL (2006) The influence of a sense of time on human development. Science 312
(5782):1913-1915.
Carstensen LL, Isaacowitz DM, Charles ST (1999) Taking time seriously: A theory of
socioemotional selectivity. American Psychologist 54 (3):165.
Clark R, Ogawa N, Mason A (2007) Economic and policy implications of population aging.
In: Clark R, Ogawa N, Mason A (eds) Population aging, intergenerational transfers and the
macroeconomy. Edward Elgar Publishing Limited, Cheltenham, UK, pp 3-14
Coale AJ, Hoover EM (1958) Population growth and economic development in low-income
countries. Princeton University Press, Princeton
Cocco JF, Gomes FJ (2012) Longevity risk, retirement savings, and financial innovation.
Journal of Financial Economics 103 (3):507-529.
Crespo Cuaresma J, Lábaj M, Pružinský P (2014a) Prospective Ageing and Economic Growth
in Europe. The Journal of the Economics of Ageing 3 (4):50–57.
Crespo Cuaresma J, Lutz W, Sanderson W (2014b) Is the demographic dividend an education
dividend? Demography 51 (1):299-315.
Cutler DM, Poterba JM, Sheiner LM, Summers LH, Akerlof GA (1990) An aging society:
opportunity or challenge? Brookings papers on economic activity:1-73.
Doyle Y, McKee M, Rechel B, Grundy E (2009) Meeting the challenge of population ageing.
BMJ 339 (b3926).
European Commission (2010) Towards adequate, sustainable and safe European pension
systems. Green Paper COM(2010)365 final. European Commission, Brussels.
Fries JF (1989) The Compression of Morbidity: Near or Far? The Milbank Quarterly 67
(2):208-232.
Fuchs VR (1984) "Though much is taken": Reflections on aging, health, and medical care.
Milbank Memorial Fund Quarterly Health and Society 62 (2):142-166.
Fürnkranz-Prskawetz A, Ronald D, Lee S-HL, Lindh T, Mason A, Miller T, Mwabu G,
Ogawa N, Soyibo A (2011) The economic consequences of population aging. NTA Bulletin
No. 3.
Hamermesh DS (1985) Expectations, life expectancy, and economic behavior. The Quarterly
Journal of Economics 100 (2):389-408.

33
Hersch L (1944) De la démographie actuelle à la démographie potentielle. In: Melange des
Études Economiques Offertes à William Rappard. Georg, Geneva,
Kemnitz A, Wigger BU (2000) Growth and social security: the role of human capital.
European Journal of Political Economy 16 (4):673-683.
Lafortune G, Balestat G (2007) Trends in Severe Disability Among Elderly People: Assessing
the Evidence in 12 OECD Countries and the Future Implications. OECD Health Working
Papers 26. OECD Publishing. doi:10.1787/217072070078.
Lee R, Mason A (2010) Some macroeconomic aspects of global population aging.
Demography 47 (1):S151-S172.
Lutz W (2009) The demography of future global population aging: Indicators, uncertainty,
and educational composition. Population and Development Review 35 (2):357-365.
Lutz W, Crespo Cuaresma J, Sanderson W (2008a) The demography of educational
attainment and economic growth. Science 319 (5866):1047-1048.
Lutz W, Goujon A, Wils A (2008b) The population dynamics of human capital accumulation.
Population and Development Review 34 (Supp):149-187.
Lutz W, Sanderson W, Scherbov S (2008c) The coming acceleration of global population
ageing. Nature 451 (7179):716-719.
Lutz W, Sanderson W, Scherbov S (2008d) Global and Regional Population Ageing: How
Certain Are We of its Dimensions? Journal of Population Ageing 1 (1):75-97.
Manton KG, Gu X, Lamb VL (2006) Long‐Term Trends in Life Expectancy and Active Life
Expectancy in the United States. Population and Development Review 32 (1):81-105.
Mason A (2005) Demographic transition and demographic dividends in developed and
developing countries. United Nations expert group meeting on social and economic
implications of changing population age structures. United Nations, New York, pp 81-102.
Mason A, Lee R (2006) Reform and support systems for the elderly in developing countries:
capturing the second demographic dividend. Genus:11-35.
Mason A, Lee R (2007) Transfers, capital, and consumption over the demographic transition.
In: Clark R, Ogawa N, Mason A (eds) Population aging, intergenerational transfers and the
macroeconomy. Edward Elgar Publishing Limited, Cheltenham, UK, pp 128-162
Mason A, Lee R (2011) Population aging and the generational economy: key findings. In:
Lee R, Mason A (eds) Population Aging and the Generational Economy: Global
Perspectives. Edward Elgar Publishing Limited, Cheltenham, UK, pp 3-31
Miller T (2001) Increasing longevity and Medicare expenditures. Demography 38 (2):215-
226.
Muszyńska MM, Rau R (2012) The Old-Age Healthy Dependency Ratio in Europe. Journal
of population ageing 5 (3):151-162.
Panush N, Peritz E (1996) Potential demography: A second look. European Journal of
Population 12 (1):27-39.
Patxot C, Rentería E, Sánchez-Romero M, Souto G (2011) Integrated results for GA and NTA
for Spain: some implications for the sustainability of welfare state. Moneda y Crédito
231:7-51.
Philipov D, Goujon A, Di Giulio P (2014) Ageing dynamics of a human-capital-specific
population. Demographic Research 31 (44):1311-1336.
Polder JJ, Bonneux L, Meerding WJ, Van Der Maas PJ (2002) Age‐specific increases in
health care costs. The European Journal of Public Health 12 (1):57-62.
Post T, Hanewald K (2012) Longevity risk, subjective survival expectations, and individual
saving behavior. Journal of Economic Behavior & Organization 86:200-220.
Prskawetz A, Sambt J (2014) Economic support ratios and the demographic dividend in
Europe. Demographic Research 30 (34):963-1010.

34
Riffe TLM, Spijker J, MacInnes J (2014) Decomposing and Recomposing the Population
Pyramid by Remaining Years of Life. Presented at the Population Association of America
Annual Meeting, Boston, USA, 1-3 May.
Rofman R, Oliveri ML (2012) Pension coverage in Latin America: Trends and determinants.
Social Protection Discussion Papers 1217. World Bank.
Ryder NB (1975) Notes on Stationary Populations. Population Index 41 (1):3-28.
Sanderson WC, Scherbov S (2005) Average remaining lifetimes can increase as human
populations age. Nature 435 (7043):811-813.
Sanderson WC, Scherbov S (2007a) A Near Electoral Majority of Pensioners: Prospects and
Policies. Population and Development Review 33 (3):543-554.
Sanderson WC, Scherbov S (2007b) A new perspective on population aging. Demographic
Research 16 (2):27-58.
Sanderson WC, Scherbov S (2008) Rethinking Age and Aging. Population Bulletin 63 (4).
Sanderson WC, Scherbov S (2010) Remeasuring Aging. Science 329 (5997):1287-1288.
Sanderson WC, Scherbov S (2013) The characteristics approach to the measurement of
population aging. Population and Development Review 39 (4):673-685.
Scherbov S, Sanderson WC, Mamolo M (2014) Quantifying policy tradeoffs to support aging
populations. Demographic Research 30 (20):579-608.
Seshamani M, Gray AM (2004) A longitudinal study of the effects of age and time to death
on hospital costs. Journal of Health Economics 23 (2):217-235.
Siegel JS, Davidson M (1984) Demographic and Socioeconomic Aspects of Aging in the
United States. Current population reports.
Spijker J, MacInnes J (2013a) Population ageing in Scotland: Time for a re-think? Scottish
Affairs 85:53-74.
Spijker J, MacInnes J (2013b) Population ageing: the timebomb that isn’t? British Medical
Journal 347:f6598.
Spijker J, Riffe TLM, MacInnes J (2014) Incorporating time-to-death (TTD) in health-based
population ageing measurements. Presented at the New Measures of Age and Ageing,
Vienna, 3-5 December.
Striessnig E, Lutz W (2014) How does education change the relationship between fertility and
age-dependency under environmental constraints? A long-term simulation exercise.
Demographic Research 30:465-492.
Sullivan DF (1971) A single index of mortality and morbidity. HSMHA health reports 86
(4):347.
The Conference Board (2011) The Conference Board Total Economy Database, September
2011 http://www.conference-board.org/data/economydatabase/.
The Select Committee on Public Service and Demographic Change (2013) Report of Session
2012–13: Ready for Ageing? HL Paper 140. The Stationery Office Limited, London.
Tyers R, Shi Q (2007) Demographic change and policy responses: Implications for the global
economy. The World Economy 30 (4):537-566.
UN (2013a) National Transfer Accounts Manual: Measuring and Analysing the Generational
Economy United Nations Department of Economic and Social Affairs.
http://esa.un.org/wpp.
UN (2013b) World Population Prospects: The 2012 Revision. United Nations Department of
Economic and Social Affairs. http://esa.un.org/wpp.
Van Solinge H, Henkens K (2010) Living longer, working longer? The impact of subjective
life expectancy on retirement intentions and behaviour. The European Journal of Public
Health 20 (1):47-51.
Vaupel JW, Loichinger E (2006) Redistributing Work in Aging Europe. Science 312
(5782):1911-1913.

35
Wolf DA, Amirkhanyan AA (2010) Demographic Change and Its Public Sector
Consequences. Public Administration Review 70:s12-s23.
Wong A, van Baal PHM, Boshuizen HC, Polder JJ (2011) Exploring the influence of
proximity to death on disease-specific hospital expenditures: a carpaccio of red herrings.
Health Economics 20 (4):379-400.
Wu L (2013) Inequality of Pension Arrangements Among Different Segments of the Labor
Force in China. Journal of Aging & Social Policy 25 (2):181-196.
Zweifel P, Felder S, Meiers M (1999) Ageing of population and health care expenditure: a red
herring? Health Economics 8 (6):485-496.

VIENNA INSTITUTE OF DEMOGRAPHY
Working Papers Kuhn, Michael and Klaus Prettner, Population Structure and Consumption Growth: Evidence from National Transfer Accounts, VID Working Paper 3/2015. Sobotka, Tomáš, Low Fertility in Austria and the Czech Republic: Gradual Policy Adjustments, VID Working Paper 2/2015. Buber-Ennser, Isabella, Aspects of Gender Mainstreaming of Family and Work in Austria, VID Working Paper 1/2015. Buber-Ennser, Isabella and Ralina Panova, Attitudes towards Parental Employment across Europe, in Australia and in Japan, VID Working Paper 5/201. Kumar, Abhishek, Valeria Bordone and Raya Muttarak, Influence of Older Generation’s Fertility Behaviours on Daughter’s Desired Family Size in Bihar, India, VID Working Paper 4/2014. Sobotka, Tomáš and Éva Beaujouan, Two is Best? The Persistence of a Two-child Family Ideal in Europe, VID Working Paper 3/2014. Sander, Nikola, Guy J. Abel, Ramon Bauer and Johannes Schmidt, Visualising Migration Flow Data with Circular Plots, VID Working Paper 2/2014. Barakat, Bilal, Revisiting the History of Fertility Concentration and its Measurement, VID Working Paper 1/2014. Buber-Ennser, Isabella, Attrition in the Austrian Generations and Gender Survey, VID Working Paper 10/2013. De Rose, Alessandra and Maria Rita Testa, Climate Change and Reproductive Intentions in Europe, VID Working Paper 09/2013. Di Giulio, Paola, Thomas Fent, Dimiter Philipov, Jana Vobecká and Maria Winkler-Dworak, State of the Art: A Family-Related Foresight Approach, VID Working Paper 08/2013. Sander, Nikola, Guy J. Abel and Fernando Riosmena, The Future of International Migration: Developing Expert-Based Assumptions for Global Population Projections, VID Working Paper 07/2013. Caselli, Graziella, Sven Drefahl, Marc Luy and Christian Wegner-Siegmundt, Future Mortality in Low-Mortality Countries, VID Working Paper 06/2013. The Vienna Institute of Demography Working Paper Series receives only limited review. Views or opinions expressed herein are entirely those of the authors.