Embed Size (px)
Citation preview

1
Using the LASSI to Predict First Year College Achievement: Is a Gender-specific Approach Necessary?
David S. Bender
and
Joanna K. Garner
Pennsylvania State University
Please address all correspondence to: David S. Bender Penn State University P. O. Box 7009 Reading, PA 19610-6009 Tele: 610-396-6090 Fax: 619-396-6026 E-mail: [email protected]
Paper presented at the Annual Meeting of the American Educational Research Association
Denver, Colorado, April 30– May 4, 2010

2
Using the LASSI to Predict First Year College Achievement: Is a Gender-specific Approach Necessary?
David S. Bender
and Joanna K. Garner
Pennsylvania State University LASSI responses were combined with SAT and GPA information from 342 first year college students to examine relationships between study habits, motivation, gender and achievement. Gender pervasively influenced the results. Despite lower SAT scores, females attained higher first year college GPAs. LASSI responses differed by gender with females scoring higher on five sub-scales. Male students were disproportionately represented in the lowest quartile group for three LASSI sub-scales. Predictors of first year GPA also differed by gender, explaining 27% and 19% variance for female and male students respectively. Overall, students scoring in the lowest quartile on Time Management or Attitude earned GPAs which were significantly poorer than their peers’ GPAs. SATs correlated with LASSI subscales but with gender differences. Results point to the use of LASSI sub-scale scores and a gender-specific approach to identify students at risk of academic failure.
The route to appropriate academic intervention begins with identification of those at risk
of failure. A commonly used diagnostic tool at the college level is the Learning and Study Skills
Inventory (LASSI; Weinstein & Palmer, 2002; Melancon, 2002; Olaussen & Braten, 1998). The
LASSI purports to assess students’ self-regulated learning skills and achievement motivation.
Assessments of this nature are useful since these constructs have been linked with academic
achievement (Alexander & Murphy, 1998; Pintrich & DeGroot, 1990). Therefore the LASSI has
the potential to identify students whose weak study skills and habits could put them at risk of
failure. In fact, Proctor, et al., (2007) used the LASSI to differentiate high- from low-achieving
students. In their study, college students with a GPA of 2.5 or lower scored significantly lower
than students with a GPA of 2.5 or higher on eight of the ten sub-scales.
An important question that follows is whether LASSI scores predict short- and longer-
term achievement. Prus, et al. (1995) examined the relationship between the LASSI and SAT

3
scores, grade point average, and retention in first year college students including an analysis by
gender and ethnicity. They found some weak relationships among the variables and concluded
that the LASSI was limited in its ability to predict achievement. More recently, Cano (2006)
investigated the relationship between LASSI scores and first and final year college student
achievement. He found that two groupings of sub-scales explained approximately 11% and 18%
of the total variance in first and final year grades respectively. These two groups were labeled
affective strategies (Time Management, Motivation, Concentration, and Attitude) and goal
strategies (Anxiety, Test Strategies, and Selecting Main Ideas). A third group, Comprehension
Monitoring (Information Processing, Self-Testing, and Study Aids), was not predictive at either
year of enrollment. The study focused on the latent composition of the LASSI, meaning that
aggregate latent constructs instead of sub-scale scores were used as predictor variables. The
contribution of specific sub-scale scores to achievement was left in question.
Several studies have found gender differences in GPA favoring female students (Chee,
Pino & Smith, 2005; Clifton, et al., 2008; Sheard et al, 2009). LASSI norm data is not reported
by gender (Weinstein & Palmer, 2002) and Prus, et al. (1995) found only slight differences
among males and females. Little research has been done to investigate gender differences in
LASSI scores and the role that such differences may play in predicting achievement outcomes.
Our initial goal was to identify individuals with weak learning skills and maladaptive
motivation patterns upon entrance to college to see if these students’ GPA outcomes were
significantly different from higher-skilled and more suitably motivated peers. Second, we were
interested in the direct contribution of sub-scale total scores to academic outcomes, since this
information is more typically available to the average college adviser or counselor, and since the
factor structure of the LASSI has been called into question (Melancon, 2002; Murphy &

4
Alexander, 1998). Moreover, since the skills and habits captured in the sub-scales are supposedly
responsive to intervention (Haught, 1998; Proctor, et al., 2007), understanding which areas
constrain or promote achievement is of interest to both students and counselors. Finally, we were
interested in examining gender differences in sub-scale scores, first year GPA, SAT scores, and
in the relationships among the variables.
METHOD
Participants
Participants were recruited through first year seminar sections at a branch campus of a
land grant university. The total sample included 392 first year college students (n = 206 males, n
= 186 females), of traditional age (M= 18.44 years, SD = 0.98 years). However, data analysis
pertaining to achievement was conducted on scores from the 342 first year college students
(n=205 males, n=137 females), of traditional age (M= 18.40 years, SD = 0.81 years), who gave
permission to the researchers to access their academic records on an on-going basis. This
included retrieving SAT scores along with current and future GPA information. Due to attrition
from fall to spring semester, 327 complete academic records were retrieved when examining first
year GPA. Minorities comprised 23% of the sample, comparable to the proportion of minorities
in the entering class of students at the college. In this sample, female first year students entered
college with significantly lower SAT Verbal (M = 454.99, SD = 75.26 for females, M = 499.30,
SD = 73.49 for males, t(360)=-7.44, p<0.001) and SAT Math scores (M = 465.1, SD =76.25 for
females, M= 527.6, SD = 83.36 for males, t(360)=-5.67, p<0.001).
Materials and Procedure
Following informed consent procedures, participants completed the 80-item, Likert scale
LASSI on the Internet (Weinstein & Palmer, 2002). Groups of sub-scales and sample items are
5
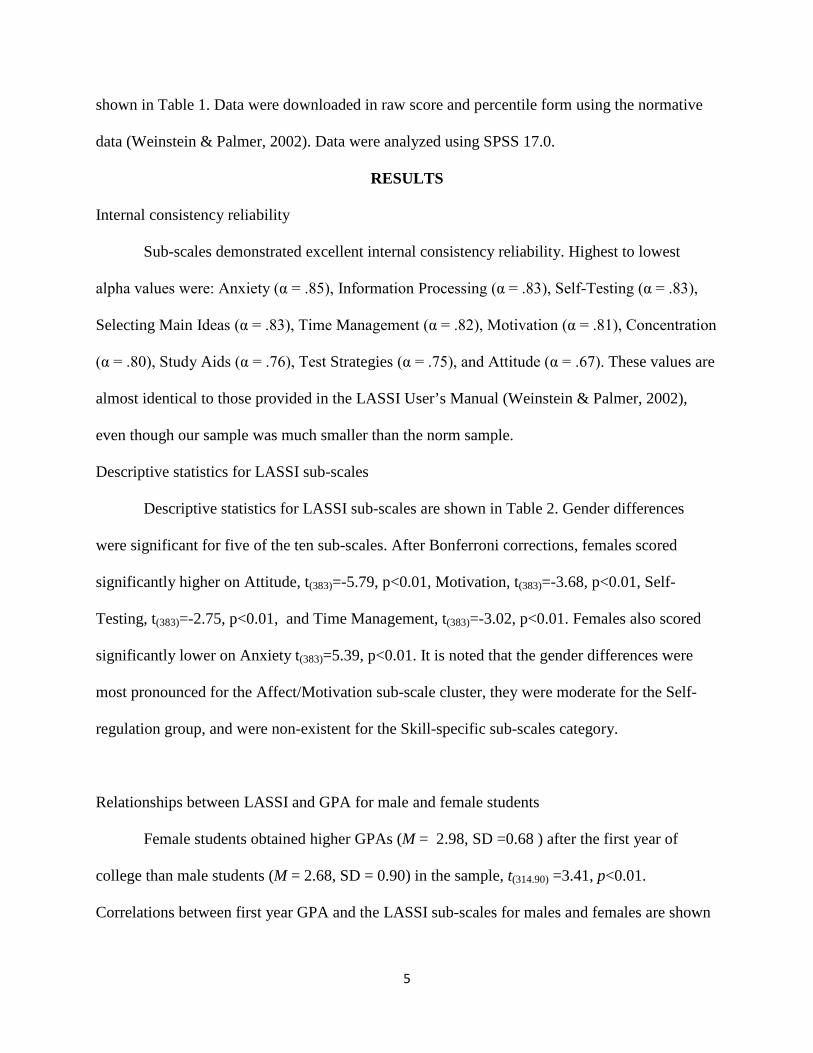
shown in Table 1. Data were downloaded in raw score and percentile form using the normative
data (Weinstein & Palmer, 2002). Data were analyzed using SPSS 17.0.
RESULTS
Internal consistency reliability
Sub-scales demonstrated excellent internal consistency reliability. Highest to lowest
alpha values were: Anxiety (α = .85), Information Processing (α = .83), Self-Testing (α = .83),
Selecting Main Ideas (α = .83), Time Management (α = .82), Motivation (α = .81), Concentration
(α = .80), Study Aids (α = .76), Test Strategies (α = .75), and Attitude (α = .67). These values are
almost identical to those provided in the LASSI User’s Manual (Weinstein & Palmer, 2002),
even though our sample was much smaller than the norm sample.
Descriptive statistics for LASSI sub-scales
Descriptive statistics for LASSI sub-scales are shown in Table 2. Gender differences
were significant for five of the ten sub-scales. After Bonferroni corrections, females scored
significantly higher on Attitude, t(383)=-5.79, p<0.01, Motivation, t(383)=-3.68, p<0.01, Self-
Testing, t(383)=-2.75, p<0.01, and Time Management, t(383)=-3.02, p<0.01. Females also scored
significantly lower on Anxiety t(383)=5.39, p<0.01. It is noted that the gender differences were
most pronounced for the Affect/Motivation sub-scale cluster, they were moderate for the Self-
regulation group, and were non-existent for the Skill-specific sub-scales category.
Relationships between LASSI and GPA for male and female students
Female students obtained higher GPAs (M = 2.98, SD =0.68 ) after the first year of
college than male students (M = 2.68, SD = 0.90) in the sample, t(314.90) =3.41, p<0.01.
Correlations between first year GPA and the LASSI sub-scales for males and females are shown

6
in Table 3. Overall, the LASSI was significantly related to GPA for the total sample for five sub-
scales: Concentration, Time Management, Study Aids, Attitude, and Motivation. The pattern
was very different, however, when examined by gender. Motivation remained significantly
related to academic achievement for both females and males but the other sub-scales indicated
gender differences. Test Strategies was the only other sub-scale related to academic achievement
for females but this was not true for males. In contrast, Concentration, Time Management, and
Attitude were significantly correlated with GPA for males but not females.
Relationships between SAT and LASSI scores, and GPA
As expected, SAT scores were significantly related to first year GPA for the total sample
as well as the gender based sub-samples (Table 4). Table 4 also reveals the relationships between
the LASSI and SATs for females and males. For the total sample, six of the ten LASSI sub-
scales were related to both SAT Math (SATM) and SAT Verbal (SATV) scores. In addition,
Concentration correlated with SATV and Attitude was related to SATM. However, when
analyzed by gender, only the Anxiety and Information Processing sub-scales show a pattern
similar to the whole sample. Concentration was related to SATM and SATV for females but not
males while Time Management was related to both SAT tests for males but not females. Self-
testing was related to SATM for females and SATV for males. Study Aids was related to both
SATM and SATV for males but only SATM for the females. Selecting Main Ideas and Test
Strategies were related to both SATM and SATV for males but not to SATM for females.
Finally, the Attitude and Motivation sub-scales were related to SATV for females but not for
males.

7
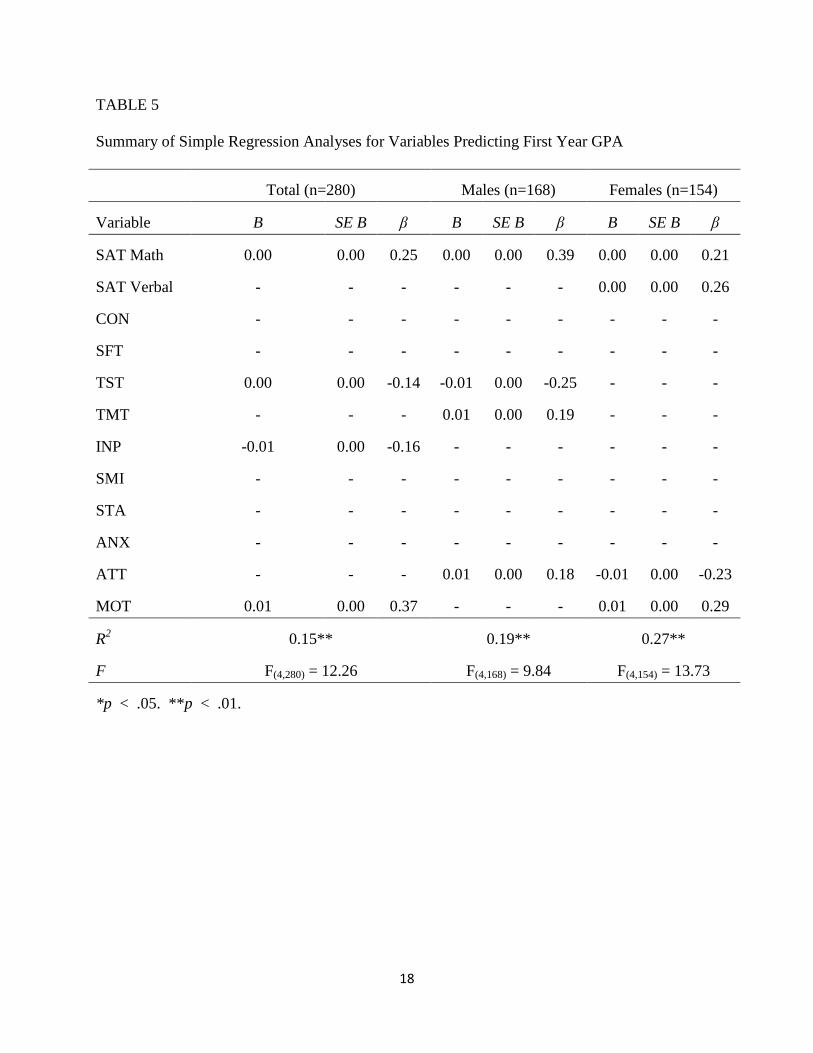
For female students, a regression analysis using SAT scores and LASSI sub-scales
explained almost one third of the total variance (R2 = .27), which was highly significant F(4,154) =
13.76, p<0.001 (Table 5). SAT Verbal (β = 0.26, p<0.01) and SAT Math scores (β = 0.21,
p<0.05) predicted 21% of the total variance (cumulative R2 = .21), and the sub-scales Motivation
(β = 0.29, p<0.001) and Attitude (β = -0.23, p<0.01) explained the additional variance. For male
students, approximately one fifth of the total variance was explained (R2 = .19), which was
statistically significant, F(4,168) = 9.84, p<0.001. SAT Math (β = 0.39, p<0.001) accounted for one
tenth of the total variance (R2 = .10), but also important were Attitude (β = 0.18, p<0.05), Test
strategies (β = -0.25, p<0.001) and Time Management (β = 0.19, p<0.05). For males, SAT
Verbal scores did not enter significantly into the regression equation.
Groups of low versus high performing students
Using high and low GPA, sub-samples of students were identified; those with a GPA of
below a C average or 2.0 (not meeting minimum graduation requirements) (n = 52) and those
with a GPA average above 3.5 (qualifying for dean’s list) on a 4.0 scale (n = 69). Descriptive
statistics for the groups are presented in Table 6. Overall, after Bonferroni corrections were
applied, low-performing students differed significantly from their high-performing peers on the
Motivation sub-scale only, t(119) = -3.50, p<0.005. Once again gender emerged as an important
mediating variable. There were 18 female students in the low GPA group, compared with 34
male students. By contrast, genders were more equitably represented in the high GPA group.
There were 35 females in the high GPA group, compared with 34 males. Because females had
scored significantly higher than males on five of the LASSI sub-scales, we hypothesized that

8
males may be over-represented in the low GPA group. A chi-square test revealed statistically
significant differences in frequency counts by gender, χ2 (1, N=121) = 2.96, p<0.05 (one-tailed).
Groups of students with weak versus strong skills and motivation.
To examine GPA differences between students in the low and high sub-scale LASSI
groups, independent samples t-tests were conducted using first year GPA as the dependent
variable with students grouped by LASSI sub-scale scores to represent the lowest and highest
quartiles based on LASSI normative data (Weinstein &Palmer, 2002) (Table 7). After
Bonferroni corrections, enduring differences were indicated by weak versus strong
Concentration, t(28) = -2.50, p<0.01 and weak versus strong Time management, t(32.28) = -4.34,
p<0.001. Poor scores on these sub-scales contributed to substantial discrepancies in GPA at the
end of the year; 2.65 versus 3.24 for Concentration and 2.49 versus 3.69 for Time Management
(Table 7).
Table 8 expands on this analysis using gender grouping. Gender differences were again
apparent when Male students were over-represented in the weak skills groups for the areas of
Time Management, Study Aids and Motivation (Table 8).
DISCUSSION
This study furthers our understanding of factors that influence academic success during
the first year in college, and reveals a pervasive role for gender in describing entry qualifications,
study habits, motivation, and subsequent achievement. In addition to finding that females
achieved a higher GPA, females also had more adaptive responses on five of ten LASSI sub-
scales. These differences were focused in the Affect/Motivation and Self-regulatory groups of
sub-scales. No substantial gender differences in skill-specific (i.e. cognitive) strategies were

9
found. The results also showed that males were over-represented in the lowest achieving group
at the end of the first year, and over-represented in the lowest quartile for Time Management,
Study Aids, and Motivation. This finding echoes that of Downing et al., (2008), who found that
female college students reported more positive attitudes and more sophisticated use of self-
regulation strategies, but augments previous work in that the differential responses are now
examined with respect to achievement. In this regard, mixed and gender-specific results were
found. Prus, et al. (1995) reported that nine out of ten sub-scales significantly related to GPA for
males but this figure was reduced to six for females. Specifically, sub-scales in the skill-specific
(cognitive strategy) group did not correlate with female students’ GPA. Our data, on the other
hand, found only four significant correlations for males (all in the self-regulatory and
affect/motivation clusters) and just two for females. Test- taking was significantly related to
GPA for the female group but not the male group, and only the Motivation sub-scale was
significantly correlated with GPA for both genders. This could be due to a difference in the
samples of college students or perhaps the approximately ten year difference between the studies
has resulted in different behaviors among today’s first year college students. Taken together,
these findings suggest that incoming male students who score poorly on the self-regulatory and
motivational components of the LASSI may be at risk of poor academic outcomes. Since most
college attrition occurs from year one to year two of enrollment and since first year GPA can
contribute to eligibility for entrance to competitive majors in the sophomore year, we believe this
finding is important and needs to be studied further.
That several LASSI sub-scales were significantly related to both the SATM and SATV
scores was an unexpected finding. Why a test of scholastic aptitude with the purpose of
predicting achievement during the first year of college is correlated to so many of the study skills

10
and motivational measures warrants further examination. Furthermore, the gender differences
revealed in the correlations of LASSI and SATs may give us clues as to the differing impact of
the interaction of affect, skills, and aptitude variables among male and female college students.
It is not clear why different self-regulatory variables were related to GPA for female students
than for males. It is also unclear why for female students, LASSI scores should be more highly
and more equitably correlated with SAT scores than for male students.
The addition of LASSI to SAT scores for the regression analysis resulted in an additional
six-to-nine percent of the variance in GPA being explained. This contribution is slightly less than
the 10% reported by Cano (2006). However, in our analysis once again gender featured
prominently. For females, sub-scales in the Affective strategies group were significant when
looking at first year GPA. For males, Time Management, Attitude and Test Strategies were
significantly related to college GPA after one year. These findings, plus the disproportionate
representation of males in the low skills group for the sub-scales of Time Management, Study
Aids, and Motivation, suggest that markers of academic success and the potential for academic
failure differ for male and female students. Put simply, early indicators of future academic
distress differ by gender. These data also suggest that it may be useful to further develop separate
norms for the LASSI for males and females, and on a practical level to be mindful of the
potential for gender-specific profiles of strength and weakness when planning intervention and
skill acquisition programs.
Further research is needed to replicate these findings and to establish whether they can be
generalized to other populations, whether specific interventions do in fact ameliorate academic
problems over the long-term, and whether it is feasible to appropriate college resources towards
the identification of individuals with specific versus general difficulties. However, the data do

11
suggest that plans for screening and intervention should not make the assumption that early
indicators of academic distress and academic achievement are the same for male and female
students. Instead, they may benefit from explicitly considering gender as a mediating variable
when seeking to answer the question, “What predicts a successful outcome to the first year of
college?”

12
REFERENCE LIST Alexander, P. & Murphy, P. K. (1998). Using the Learning and Study Strategies Inventory –
High School version with Singaporean females: Examining psychometric properties.
Educational and Psychological Measurement, 58, 493-510.
Cano, F. (2006). An in-depth analysis of the Learning And Study Strategies Inventory (LASSI).
Educational and Psychological Measurement, 66, 1023-1038.
Chee,K.H., Pino, N.W., & Smith, W.L., (2005). Gender differences in the academic ethic and
academic achievement. College Student Journal, 39, 604-618.
Clifton, R.A., Perry, R.P., Roberts, L.W., & Peter, T. (2008). Gender, psychosocial dispositions,
and the academic achievement of college students. Research in Higher Education, 27, 676-
687.
Downing, K., Chan, S-W., Downing, W-K., Kwong, T., & Lam, T-F. (2008). Measuring gender
differences in cognitive functioning. Multicultural Education and Technology Journal, 2, 4-
18.
Haught, P., (1998). Improved Learning and Study Strategies Inventory (LASSI) and academic
performance: The impact of feedback on first year college students. Journal of the Freshman
Year Experience, 10, 25-40.
Lawlor, S., Richman, S., & Richman, C.L., (1997). The validity of using the SAT as a criterion
for black and white students’ admission to college. College Student Journal, 31, 507-514.
Melancon, J.G. (2002). Reliability, structure and correlates of learning and study strategies
inventory scores. Educational and Psychological Measurement, 62, 1020-1027.

13
Murphy, P.K. & Alexander, P.A. (1998). Using the Learning and Study Strategies Inventory –
High School version with Singaporean females: Examining psychometric properties.
Educational and Psychological Measurement, 58, 493-510.
Olaussen, B., & Braten, I. (1998). Identifying Latent Variables Measured by the Learning and
Study Strategies Inventory (LASSI) in Norwegian College Students. Journal of
Experimental Education, 67, 82-97.
Pintrich & DeGroot, (1990). Motivational and self-regulated learning components of classroom
academic performance. Journal of Educational Psychology, 82, 33-50.
Proctor, B.E., Prevatt, F., Adams, K., Hurst, A., Petscher, Y., (2007). Study skills profiles of
normal-achieving and academically-struggling college students. Journal of College Student
Development, 47, 37-51.
Prus, J. , Hatcher, L., Martin, H. , Grabiel, C. (1995). The learning and study strategies inventory
(LASSI) as a predictor of first-year college academic success. Journal of the Freshman Year
Experience, 7, 7-26.
Sheard, M. (2009). Hardiness commitment, gender, and age differentiate university academic
performance. British Journal of Educational Psychology , 79, 189-204.
Weinstein, C.E., & Palmer, D.R., (2002). LASSI User’s Manual: Learning and Study Skills
Inventory (2nd Edition). Clearwater, FL.: H&H Publishing, Inc.

14
TABLE 1 Sub-scales and sample items from the Learning and Study Skills Inventory Sub-scale Name Sample item
Self-regulation component
Concentration (CON) I concentrate fully when studying
Self-testing (SFT) When preparing for an exam, I create questions that I think might be included
Test Strategies (TST) I am unable to summarize what I have just heard in a lecture or read in a textbook*
Time Management (TMT) I find it hard to stick to a study schedule*
Skill-specific component
Information Processing (INP)
I try to find relationships between what I am learning and what I already know
Selecting Main Ideas (SMI)
I have difficulty identifying the important points in my reading*
Study Aids (STA) My underlining is helpful when I review text material
Affect and motivation component
Anxiety (ANX) I feel very panicky when taking an important test
Attitude (ATT) I am able to study subjects I do not find interesting
Motivation (MOT) I set high standards for myself in school
* Item is reverse scored

15
TABLE 2 Summary of percentile scores on the LASSI (n=342) Sub-scale Males Females Total sample Mean SD Mean SD Mean SD Self-regulation component
CON 44.21 26.80 43.00 25.32 43.83 26.18
SFT 37.74* 28.49 45.96 28.51 41.64 28.77
TST 51.07 27.54 47.82 27.11 48.47 27.43
TMT 35.70* 27.17 44.24 27.90 40.16 27.71
Skill-specific component
INP 46.08 28.65 45.19 27.95 45.38 27.75
SMI 50.58 24.97 45.83 26.70 46.86 26.05
STA 30.20 26.78 48.25 28.22 38.31 28.90
Affect and motivation component
ANX 53.80* 29.19 38.08 25.65 45.27 28.13
ATT 24.31* 25.42 37.63 24.82 30.77 26.04
MOT 40.27* 27.87 50.46 27.86 45.00 28.21
*p<0.005 for means by gender .

16
TABLE 3 Correlations of first year GPA and LASSI sub-scales for female and male students. ______________________________________________________________________________
GPA GPA GPA
Total (n = 326) Females ( n = 157) Males (n = 169)
r r r
Self-regulation component
CON .11* .08 .14*
SFT .06 -.06 .09
TST .04 .20** -.06
TMT .13** .03 .16*
Skill-specific component
INP -.01 -.10 .04
SMI .02 .11 -.01
STA .10* .01 .07
Affect and motivation component
ANX -.01 .08 .01
ATT .15** -.07 .20**
MOT .23** .21** .20**
_____________________________________________________________________________
* p<0.05, **p<0.01

17
TABLE 4 Correlations of grade point average with SATs and LASSI sub-scales by gender. ___________________________________________________________________________
Total (n = 358) Females (n = 176) Males (n = 182)
SATM SATV SATM SATV SATM SATV
r r r r r r
Grade Point Average† .25*** .20*** .40*** .40*** .31*** .19***
Self-regulation component
CON .09 .21** .18* .39*** .05 .08
SFT -.14** -.15** -.13* -.07 -.04 -.14*
TST -.14** .30** .06 .36* .20** .23**
TMT -.19** -.16** -.08 .00 -.16* -.23**
Skill-specific component
INP .07 .09 -.08 .09 .16 .11
SMI .21** .32** .11 .35*** .27*** 26***
STA -.24** -.23** -.14* -.10 -.13* -.20**
Affect and motivation component
ANX .25* .28* .16* .16* .18* .27***
ATT -.13* -.04 -.11 .15* .07 .02
MOT .00 -.02 .06 .16* .10 -.05
______________________________________________________________________________
* p<0.05, **p<0.01 ***p<.001 † N=327, (n=155 females, n=173 males)
18
TABLE 5
Summary of Simple Regression Analyses for Variables Predicting First Year GPA
Total (n=280) Males (n=168) Females (n=154)
Variable B SE B β B SE B β B SE B β
SAT Math 0.00 0.00 0.25 0.00 0.00 0.39 0.00 0.00 0.21
SAT Verbal - - - - - - 0.00 0.00 0.26
CON - - - - - - - - -
SFT - - - - - - - - -
TST 0.00 0.00 -0.14 -0.01 0.00 -0.25 - - -
TMT - - - 0.01 0.00 0.19 - - -
INP -0.01 0.00 -0.16 - - - - - -
SMI - - - - - - - - -
STA - - - - - - - - -
ANX - - - - - - - - -
ATT - - - 0.01 0.00 0.18 -0.01 0.00 -0.23
MOT 0.01 0.00 0.37 - - - 0.01 0.00 0.29
R2 0.15**
F(4,280) = 12.26
0.19**
F(4,168) = 9.84
0.27**
F(4,154) = 13.73 F
*p < .05. **p < .01.

19
TABLE 6 Mean and standard deviations for low and high achievement groups (n=123) Sub-scale Low GPA (<2.0)
n=52 High GPA (>3.5)
n=69
Mean Percentile
score
SD
Mean Percentile
score
SD Self-regulation component
CON 42.11 23.52 53.80 24.99
SFT 40.29 30.31 43.62 30.28
TST 53.50 27.66 55.87 22.29
TMT 36.27 28.01 45.97 29.41
Skill-specific component
INP 47.15 27.45 44.59 29.54
SMI 49.83 27.06 54.16 24.06
STA 35.21 30.71 40.64 27.29
Affect and motivation component
ANX 54.19 29.31 52.00 27.39
ATT 25.69 24.40 35.13 25.00
MOT 35.04* 26.52 52.38 27.29
* p<0.005.

20
TABLE 7 Descriptive statistics for first year GPA in weak and strong LASSI groups Sub-scale Weak skills group
(<25th percentile) Strong skills group (>75th percentile)
Mean
GPA SD n Mean
GPA SD n
Self-regulation component
CON 2.72* 0.78 104 3.05 0.71 61
SFT 2.79 0.85 130 2.94 0.78 61
TST 2.77 0.65 91 2.81 0.91 79
TMT 2.70 0.88 127 2.96 0.77 52
Skill-specific component
INP 2.91 0.76 89 2.86 0.80 73
SMI 2.80 0.71 87 2.73 0.91 71
STA 2.74 0.83 142 2.92 0.75 59
Affect and motivation component
ANX 2.82 0.73 100 2.73 0.93 68
ATT 2.72 0.86 170 2.93 0.65 22
MOT 2.61** 0.86 108 3.00 0.79 58
*p < .01. **p < .005.

21
TABLE 8 Frequencies of male and female students in weak and strong LASSI groups (n=342) Sub-scale Weak skills
(<25th percentile)
Strong skills
(>75th percentile)
Chi-Square statistic
Male Female Male Female
Self-regulation component
CON 26 49 35 26 χ2(1, N=165)=0.31
SFT 81 49 26 35 χ2(1, N=191)=6.53**
TST 43 48 43 36 χ2(1, N=170)=0.87
TMT 79 48 17 35 χ2(1, N=179)=12.92***
Skill-specific component
INP 48 41 37 36 χ2(1, N=162)=0.17
SMI 33 54 40 31 χ2(1, N=158)=5.33*
STA 99 43 17 42 χ2(1, N=201)=28.58***
Affect and motivation component
ANX 38 62 51 17 χ2(1, N=168) =22.24***
ATT 115 55 11 11 χ2(1, N=192) =2.69
MOT 67 41 23 35 χ2(1, N=166)=7.62**
*p<.05; **p<.01;*** p<.001


![Amul Lassi 2007[1]](https://img.dokumen.tips/doc/110x75/544bb22fb1af9f74678b4ea6/amul-lassi-20071-558448360c443.jpg)


