Embed Size (px)
Citation preview
Boris Vujčić: The EU and CEE: Productivity and Convergence 1
The EU and CEE: Productivity and Convergence
Boris Vujčić Governor of the Croatian National Bank
In the past twenty-five years, the countries of central and east Europe (CEE) have gone through a significant institutional and economic transition and most of them are now fully-fledged members of the European Union. Nonetheless, their economic convergence is far from over, while income and productivity gaps between CEE and "old" Europe have not closed yet. Moreover, it seems that, since the onset of the global financial crisis, the convergence progress has slowed down. Faced with the post-crisis challenges, the CEE countries will have to find new and more flexible drivers to support the relaunch of the catching up process and to build more efficient and productive economic systems in the years to come. So, let us revise what has been achieved so far, and look into where potentials for further improvement of the CEE economies lie.
The importance of productivity for a relative position of a country
The performance of the central and eastern EU member countries over the past two and a half decades has been outstanding, making them the key driver of growth in Europe, and the only converging story on the Old Continent. The CEE countries started with a low level of productivity compared to "old" Europe. It was still the case even ten years into the transition. The productivity level was only half of the "old" Europe average in 2002 (Figure 1). However, convergence was very quick and productivity growth demonstrates just how fast this progress was. Over the past 15 years, productivity growth in CEE was on average more than three times higher than in the rest of the EU (Figure 2). To a large extent, this was due to a dismal performance of "old" Europe, which has barely seen any increases in productivity. This catch-up process has slowed down somewhat during the crisis, but it is still in place.

Boris Vujčić: The EU and CEE: Productivity and Convergence 2
Figure 1 Labour productivity levels, 2002, in thousands of PPS
Source: Eurostat.
Figure 2 Real labour productivity growth per person employed, average annual percentage change 2002–2013
Source: Eurostat.
On the other hand, misallocation of resources remains a potential issue among EU countries. According to the results from the CompNet research network (ECB, 2014) productivity was very heterogeneous across firms operating within narrowly defined sectors, and distribution was not only disperse, but also very asymmetric, featuring a large mass of low productive firms and very few high productive firms (Lopez-Garcia et al., 2015). According to available data for the CEE countries, labour productivity distribution for Slovenia can be outlined as one of the better ones, while, at the other end, Romania has a significant cluster of firms in the low productive area. Therefore, data demonstrate a
0
10
20
30
40
50
60
70
PT
CY
MT
EL
DK
ES
DE
SE FI
UK
NL IT FR
AT IE BE
LU RO
BG LV LT EE
HU
SK PL
HR
CZ SI
thou
sand
s of
PP
S
average EU17 average EU CEE
EU17 EU CEE
-1
0
1
2
3
4
5
SE IE ES
PT
UK FI
FR
DE
DK
NL
EL
AT
BE IT
RO LT LV SK
EE PL
BG CZ SI
HU
HR
%
average EU14 average EU CEE
EU14 EU CEE

Boris Vujčić: The EU and CEE: Productivity and Convergence 3
significant potential for a further increase in efficiency that can come from within-sector reallocation towards more productive firms that can generate further productivity gains.
Where does the EU stand compared to the US?
Using the "old" EU as the benchmark for the CEE countries is motivated by its role as the major economic and trade partner of the CEE economies, as well as by the objective of creating a fully converged common currency area. On the other hand, since WWII the United States (US) has been used as a benchmark for the convergence of Europe, as well as of the rest of the world. The crisis has revealed many of the structural and institutional weaknesses of the "old" EU. However, Europe's convergence progress towards the US actually stopped long before the crisis, in mid-1990s. In the recent years, the US productivity growth has accelerated again and the US-Europe gap has widened. Today, "old" Europe stands at approximately 75% of the US GDP per capita level (Figure 3), the same as the CEE countries towards "old" Europe.
Figure 3 EU15 labour productivity compared to US labour productivity
Note: Labour productivity per hour worked in 1990 US$ (converted at Geary Khamis PPPs), US=100. Source: Total Economy Database, The Conference Board (2015).
There has been a long strand of literature trying to explain the differences in productivity between the US and Europe and large emphasis has been put on the ICT revolution. It has been argued that the reason for a higher productivity growth in the US lies in the ICT contribution and the amount of investment in the ICT industry. According to the data, there is a significant difference in the investment in the ICT and the contribution of the ICT and total factor productivity to the US increase in productivity compared to the EU (Figure 4). Also, an interesting research by Bartelsman and others (2010) shows that inflexible labour markets are not conducive to the growth of the ICT industry. In that sense,
10
20
30
40
50
60
70
80
90
1950 1960 1970 1980 1990 2000 2010
% o
f US
labo
ur p
rodu
ctiv
ity
EU15

Boris Vujčić: The EU and CEE: Productivity and Convergence 4
doing business, as measured, for example, by labour market flexibility, as well as by other indicators, is important for productivity growth. Fast-changing industries like the ICT are prone to shocks and need to have flexible conditions for hiring and firing. Thus, they will refrain from setting up their business in countries with overly regulated labour markets. This research shows that there are differences between the flexibility of labour markets in the US and Europe, but also significant differences within Europe itself, making them more or less attractive for ICT investments.
Figure 4 ICT investments
Sources: EU KLEMS, The Conference Board and OECD.
Part of the explanation behind divergent productivity trends also lies in the working habits. There are two trends. The first trend is actually a favourable labour market trend in Europe that has served as a partial explanation of Europe's lagging behind in terms of productivity growth. Namely, since mid-1990s, Europe was converging towards the US in terms of the increase in labour participation and employment and this trend was present all the time up until the beginning of the crisis. Since the breakout of the crisis, employment has dropped both in the EU and in the US, albeit at a much faster pace in the US. Few years into the crisis, however, it seems that the US and the EU are diverging again (Figure 5). Another crucial, but less favourable trend is the trend of continued decline in working hours in Europe (Figure 6), both in absolute terms and relative to the US.
0,0
0,5
1,0
1,5
2,0
2,5
3,0
EU US
ICT and productivity growth in %, average 2000-2013
Other ICT+TFP contribution
0
5
10
15
20
25
30
35
EU US
Investment in ICT as % of total investment, average 2000-2010

Boris Vujčić: The EU and CEE: Productivity and Convergence 5
Figure 5 Employment as % of total population
Note: Average monthly hours worked for EU15 are calculated as average for the EU15 countries. Source: Total Economy Database, The Conference Board (2015).
Figure 6 Average monthly hours worked per worker
Note: Average monthly hours worked for EU15 are calculated as average for the EU15 countries weighted by GDP (converted at Geary Khamis PPPs). Source: Total Economy Database, The Conference Board (2015).
In addition, there are significant institutional differences between Europe and the US. According to "Doing Business", the US is a place where the business environment is much more favourable than in "old" Europe, and the CEE countries are lagging even more behind. Although the CEE countries have done a lot since the beginning of their transition period, in the post-crisis period they improved their business environment even more. Nevertheless, this
40
41
42
43
44
45
46
47
48
49
50
1970 1980 1990 2000 2010
%
EU15 US
120
130
140
150
160
170
1970 1980 1990 2000 2010
hour
spe
r w
orke
r
EU15 US
Boris Vujčić: The EU and CEE: Productivity and Convergence 6
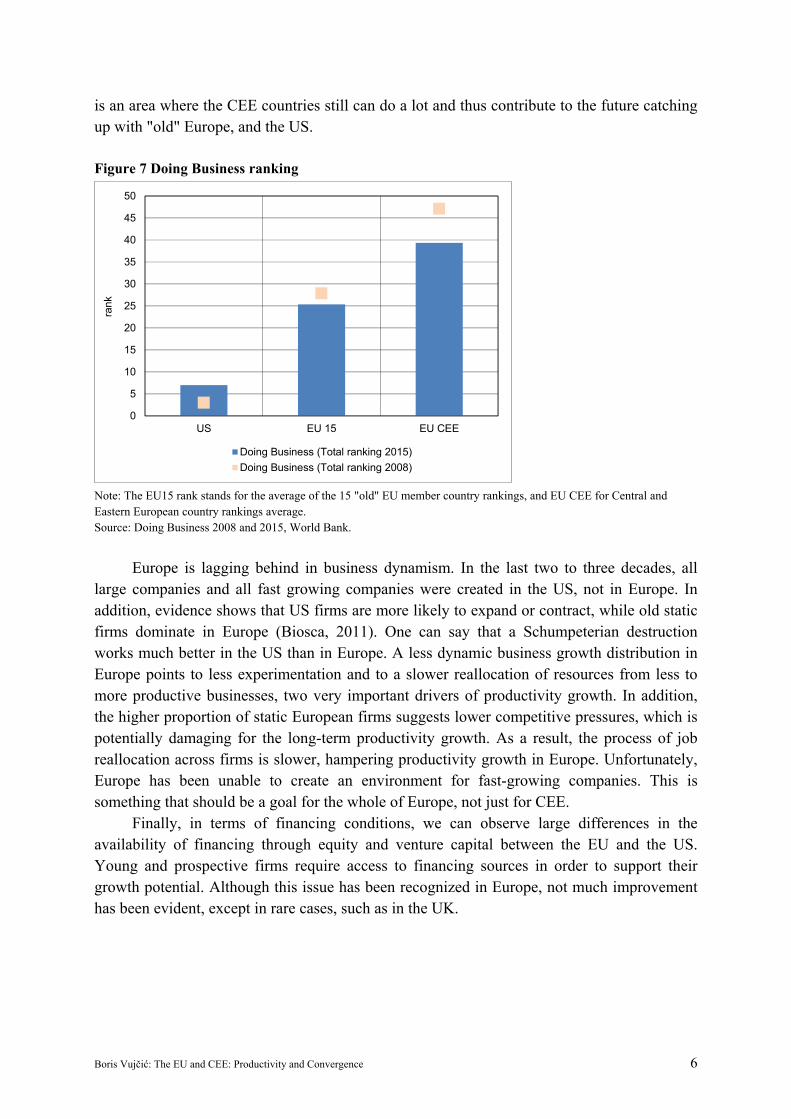
is an area where the CEE countries still can do a lot and thus contribute to the future catching up with "old" Europe, and the US.
Figure 7 Doing Business ranking
Note: The EU15 rank stands for the average of the 15 "old" EU member country rankings, and EU CEE for Central and Eastern European country rankings average. Source: Doing Business 2008 and 2015, World Bank.
Europe is lagging behind in business dynamism. In the last two to three decades, all large companies and all fast growing companies were created in the US, not in Europe. In addition, evidence shows that US firms are more likely to expand or contract, while old static firms dominate in Europe (Biosca, 2011). One can say that a Schumpeterian destruction works much better in the US than in Europe. A less dynamic business growth distribution in Europe points to less experimentation and to a slower reallocation of resources from less to more productive businesses, two very important drivers of productivity growth. In addition, the higher proportion of static European firms suggests lower competitive pressures, which is potentially damaging for the long-term productivity growth. As a result, the process of job reallocation across firms is slower, hampering productivity growth in Europe. Unfortunately, Europe has been unable to create an environment for fast-growing companies. This is something that should be a goal for the whole of Europe, not just for CEE.
Finally, in terms of financing conditions, we can observe large differences in the availability of financing through equity and venture capital between the EU and the US. Young and prospective firms require access to financing sources in order to support their growth potential. Although this issue has been recognized in Europe, not much improvement has been evident, except in rare cases, such as in the UK.
0
5
10
15
20
25
30
35
40
45
50
US EU 15 EU CEE
rank
Doing Business (Total ranking 2015)
Doing Business (Total ranking 2008)

Boris Vujčić: The EU and CEE: Productivity and Convergence 7
Figure 8 Ranking according to access to finance
Note: The EU rank is the GDP weighted average of the EU28 country rankings. Source: Global Competitiveness Report 2014-2015, World Economic Forum.
Going forward
One thing that marked the change in the world landscape over the last 15 years was a very rapid growth of productivity in emerging and developing economies. It was not only Central and Eastern Europe catching up with "old" Europe, but the whole emerging market world catching up with mature economies, which increased competitive pressures significantly. The productivity growth in emerging and developing economies reached its peak around 2007. Since then, mature and emerging economies have embarked on a slower trend of productivity growth. This slowdown, for emerging markets, appears to be the result of the end of a rapid catch-up growth period (The Conference Board, 2014, 2015).
Moreover, globalisation and increased trade integration have reduced barriers to market access, and led to the relocation of production. The relative price of tradable goods declined, which might have influenced the long-term trends in the inflation rates. A more intense global competition prevents companies from raising prices and puts downward pressures on wages in many sectors. This might partly explain the absence of the usual (historical) reaction of inflation rates to the unusually expansionary monetary policies that central banks are running these days. Globalization may have reduced the strength of the cyclical response of inflation to domestic output fluctuations. The prices of many items that are produced or consumed at home are increasingly determined by foreign demand and supply factors rather than by local factors. Moreover, financial integration allows for larger trade balance deficits or surpluses and thereby weakens the relationship between domestic output and demand. However, in the globalised, more competitive world, countries with the absence of wage flexibility and/or productivity response, experience a relative increase in unit labour costs (ULCs), which leads
0
10
20
30
40
50
60
Financing throughlocal equity
market
Venture capitalavailability
Financing throughlocal equity
market
Venture capitalavailability
rank
EU
US

Boris Vujčić: The EU and CEE: Productivity and Convergence 8
to an increase in unemployment rates, and/or increase in public debt in the countries that decide to support weak sectors.
The crisis brought the investment-driven growth model to an end. The pre-crisis foreign capital inflows dried up abruptly, thus negatively affecting economic performance in the CEE region (Figure 9). In the post-crisis period, net FDI inflows fell in all countries of the region. In the pre-crisis period, Slovenia was the only exception recording net outflows of international investments, all other countries were the recipients of a strong inflow of foreign direct investments (FDIs) (Figure 10). Post crisis, along with the downward-heading investment cycle, the CEE region was also faced with the excessive private sector leverage. Rapid debt build-up in the run up to the crisis raised concerns about debt repayment possibilities during the crisis, which triggered a deleveraging process in the post-crisis period. Consequently, it has put an additional drag on investment recovery. Once debt becomes sustainable and collateral rates increase, only then can we expect the resumption in investment again. The completion of the deleveraging process is a necessary, but not sufficient condition, for restoring investment growth. The CEE region clearly needs to find new investment drivers, and they are more likely to be found domestically, as the pre-crisis abundant foreign capital inflows are unlikely to come back anytime soon. Hence, the key challenge for Central and Eastern Europe today is to manage the transition from imported productivity gains to the endogenous sources of innovation as drivers of growth.
Figure 9 Investment contribution to GDP growth, %
Source: Eurostat.
-20
-10
0
10
20
30
40
50
60
EU CEE
%
2001-2008
Fixed capital formation
Other sources of growth
GDP growth
-20
-10
0
10
20
30
40
50
60
EU CEE
%
2009-2014
Fixed capital formation
Other sources of growth
GDP growth
Boris Vujčić: The EU and CEE: Productivity and Convergence 9
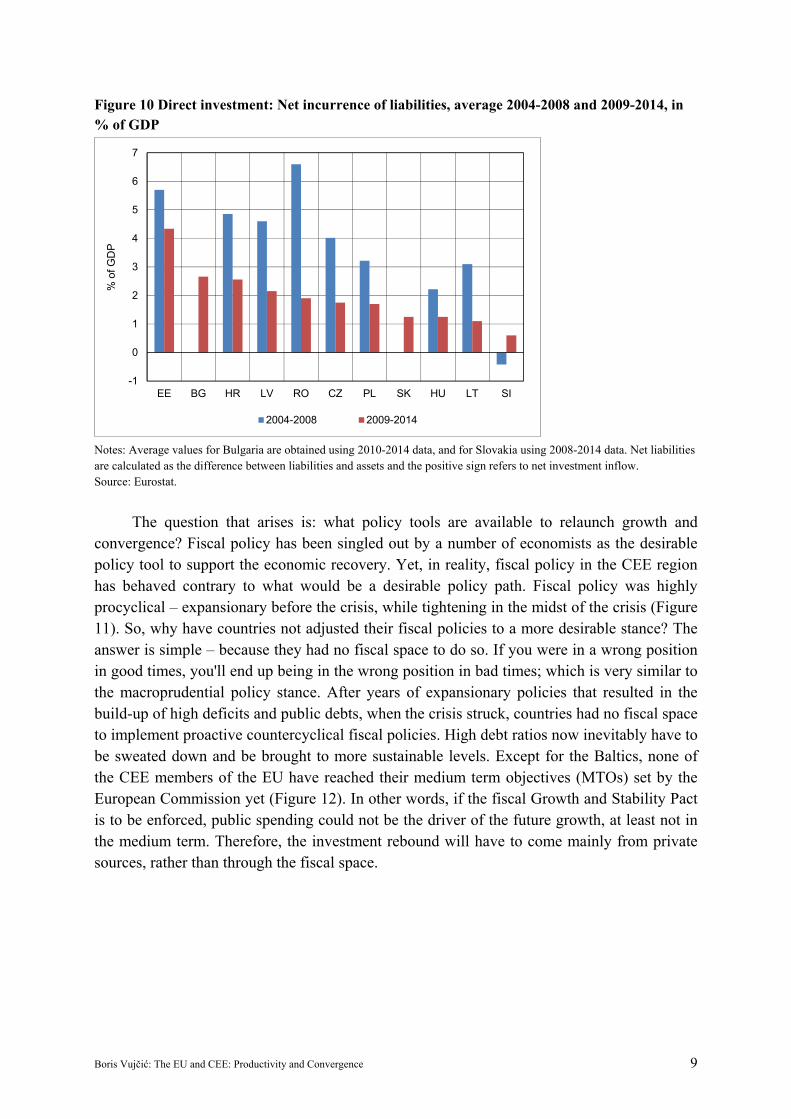
Figure 10 Direct investment: Net incurrence of liabilities, average 2004-2008 and 2009-2014, in % of GDP
Notes: Average values for Bulgaria are obtained using 2010-2014 data, and for Slovakia using 2008-2014 data. Net liabilities are calculated as the difference between liabilities and assets and the positive sign refers to net investment inflow. Source: Eurostat.
The question that arises is: what policy tools are available to relaunch growth and convergence? Fiscal policy has been singled out by a number of economists as the desirable policy tool to support the economic recovery. Yet, in reality, fiscal policy in the CEE region has behaved contrary to what would be a desirable policy path. Fiscal policy was highly procyclical – expansionary before the crisis, while tightening in the midst of the crisis (Figure 11). So, why have countries not adjusted their fiscal policies to a more desirable stance? The answer is simple – because they had no fiscal space to do so. If you were in a wrong position in good times, you'll end up being in the wrong position in bad times; which is very similar to the macroprudential policy stance. After years of expansionary policies that resulted in the build-up of high deficits and public debts, when the crisis struck, countries had no fiscal space to implement proactive countercyclical fiscal policies. High debt ratios now inevitably have to be sweated down and be brought to more sustainable levels. Except for the Baltics, none of the CEE members of the EU have reached their medium term objectives (MTOs) set by the European Commission yet (Figure 12). In other words, if the fiscal Growth and Stability Pact is to be enforced, public spending could not be the driver of the future growth, at least not in the medium term. Therefore, the investment rebound will have to come mainly from private sources, rather than through the fiscal space.
-1
0
1
2
3
4
5
6
7
EE BG HR LV RO CZ PL SK HU LT SI
% o
f GD
P
2004-2008 2009-2014
Boris Vujčić: The EU and CEE: Productivity and Convergence 10
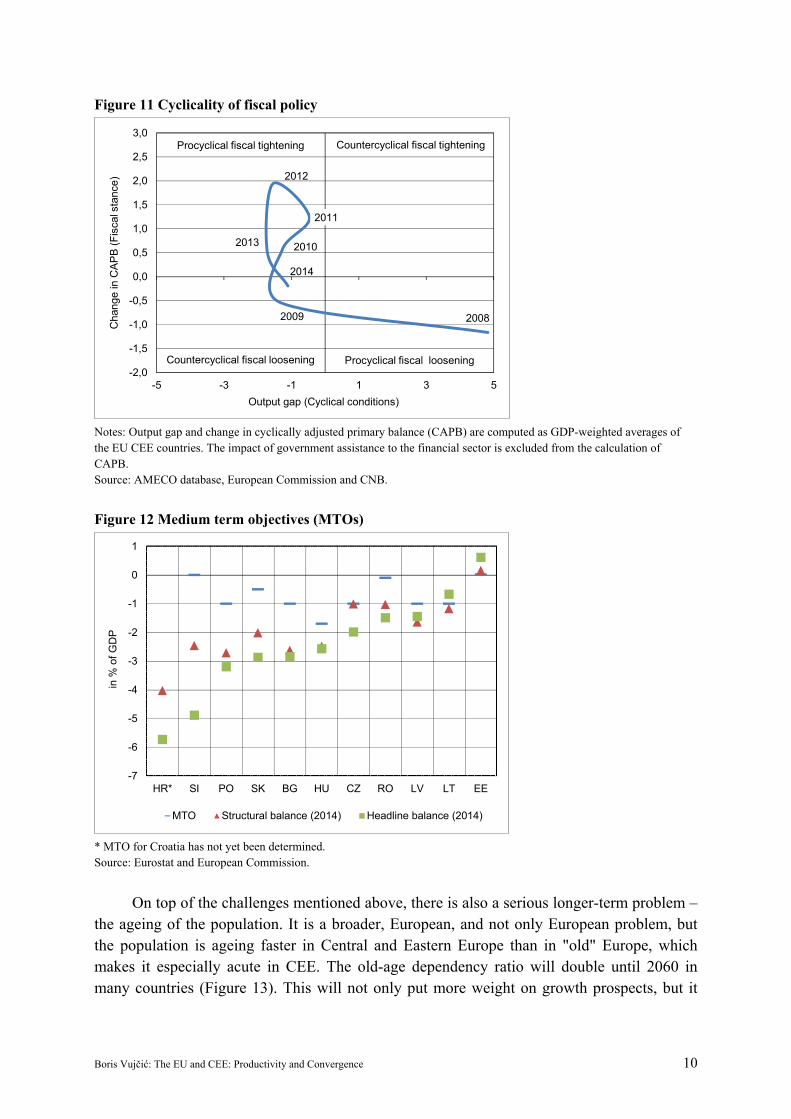
Figure 11 Cyclicality of fiscal policy
Notes: Output gap and change in cyclically adjusted primary balance (CAPB) are computed as GDP-weighted averages of the EU CEE countries. The impact of government assistance to the financial sector is excluded from the calculation of CAPB. Source: AMECO database, European Commission and CNB.
Figure 12 Medium term objectives (MTOs)
* MTO for Croatia has not yet been determined. Source: Eurostat and European Commission.
On top of the challenges mentioned above, there is also a serious longer-term problem – the ageing of the population. It is a broader, European, and not only European problem, but the population is ageing faster in Central and Eastern Europe than in "old" Europe, which makes it especially acute in CEE. The old-age dependency ratio will double until 2060 in many countries (Figure 13). This will not only put more weight on growth prospects, but it
20082009
2010
2011
2012
2013
2014
-2,0
-1,5
-1,0
-0,5
0,0
0,5
1,0
1,5
2,0
2,5
3,0
-5 -3 -1 1 3 5
Cha
nge
in C
AP
B (
Fis
cal s
tanc
e)
Output gap (Cyclical conditions)
Procyclical fiscal tightening Countercyclical fiscal tightening
Countercyclical fiscal loosening Procyclical fiscal loosening
-7
-6
-5
-4
-3
-2
-1
0
1
HR* SI PO SK BG HU CZ RO LV LT EE
in %
of G
DP
MTO Structural balance (2014) Headline balance (2014)

Boris Vujčić: The EU and CEE: Productivity and Convergence 11
will also create additional pressures on the fiscal position of all countries, although at varying degrees. In order to address these challenges, authorities will have to re-think the compatibility of their labour market, pension and health care systems with demographic trends. The increase in the labour force participation rates seems to be an obvious, desirable policy venue, alongside the reforms of the pension and health care systems.
Figure 13 Economic old-age dependency ratio (15-64)
Note: People aged 65 or above as % of population aged 15-64. Source: Ageing Report 2015, European Commission.
Concluding remarks
With the limited space for fiscal and monetary policies, the key priority for the CEE region is to embark on deep structural reforms. The monetary policy might have already done enough, if not too much. Furthermore, there is little or no fiscal space in most of the countries, particularly given the monetary policy constraints to support cheap government financing in the long run. Too long period of extremely low interest rates might become counterproductive, as it might induce more savings, rather than spending. Therefore, the CEE region needs to continue with reforms that increase the productivity of domestic economies, and in particular with “Doing Business” reforms aimed at reducing the complexity and cost of complying with business regulation and strengthening legal institutions, as well as improving overall efficiency of the public sector.
To conclude, over the next decade, CEE will have to move from a classical catching up by imitation and imported productivity gains to a more flexible and knowledge-based system with more value added and more diversified exports. The CEE countries will need to further increase the productivity of capital and labour by their own means which makes investments in education, ICT and R&D crucial. Fiscal policies will need to be directed toward restoring sustainability, while macroprudential measures should aim at safeguarding financial stability
0
10
20
30
40
50
60
70
IE BE
SE
DK
DE
UK
FR FI
NL
AT
ES IT EL
PT LT CZ
LV HR
RO
HU SI
EE
BG PL
SK
old
age
depe
nden
cy r
atio
average EU14 average EU CEE
EU14 CEE EU
20132060
20132060

Boris Vujčić: The EU and CEE: Productivity and Convergence 12
and avoiding recurrence of bubble episodes. Governments will need to find ways to encourage an environment that rewards experimentation, penalises inertia and reduces the costs of failure. This goes not only for the CEE countries, but also for all Europe aiming at building more efficient, dynamic and productive economic systems in the years to come. Finally, Europe, and in particular CEE, will have to re-think the compatibility of their labour market, pension and health care systems with a slowly, but surely, arriving challenge of a rapidly ageing population. This will almost certainly lead to all sorts of policies supportive of the increase in labour force participation.
References:
Bartelsman, E. J., P. A. Gautier, and J. de Wind (2010): Employment Protection, Technology Choice, and Worker Allocation, IZA DP No. 4895.
Biosca, A. B. (2011): A look at business growth and contraction in Europe, 3rd European Conference on Corporate R&D and Innovation, Nesta Working Paper Series.
Dabrowski, M. (2014): Central and Eastern Europe: uncertain prospects of economic Europe, Bruegel Institute, available at: http://www.bruegel.org/nc/blog/detail/view/1502/.
ECB: CompNet Task Force (2014): Micro-based evidence of EU competitiveness: the CompNet database, ECB WP N.1634.
European Commission (2014): The 2015 Ageing Report – Underlying Assumptions and Projection Methodologies, European economy 8|2014.
Lopez-Garcia, P. et al. (2015): Assessing European competitiveness: the new CompNet micro-based database, ECB WP N.1764.
Roaf, J., R.Atoyan, B. Joshi, K. Krogulski et al. (2014): 25 Years of Transition: Post-Communist Europe and the IMF, Regional Economic Issues, Special Report, International Monetary Fund, Washington, D.C.
Schwab, K., and X. Sala-i-Martin (2014): The Global Competitiveness Report 2014-2015, World Economic Forum.
The Conference Board (2014): 2014 Productivity Brief – Key Findings: Global Productivity Slowdown Moderated in 2013-2014 May See Better Performance, Report, The Conference Board.
The Conference Board (2015): Productivity Brief 2015: Global Productivity Growth Stuck in the Slow Lane with No Signs of Recovery in Sight, Report, The Conference Board.
World Bank (2007): Doing Business 2008, The World Bank Group.
World Bank (2015): Doing Business 2015 – Going Beyond Efficiency, The World Bank Group Flagship Report.


![Ekart Tol Tisina Govori[1]](https://img.dokumen.tips/doc/110x75/55cf99f0550346d0339fcf76/ekart-tol-tisina-govori1.jpg)