Embed Size (px)
Citation preview

Brigham Young University Brigham Young University
BYU ScholarsArchive BYU ScholarsArchive
Theses and Dissertations
2014-07-02
The Effects of Quantitative and Qualitative Feedback on Speaking The Effects of Quantitative and Qualitative Feedback on Speaking
Fluency Development Fluency Development
Carlos Eduardo dos Santos Brigham Young University - Provo
Follow this and additional works at: https://scholarsarchive.byu.edu/etd
Part of the Linguistics Commons
BYU ScholarsArchive Citation BYU ScholarsArchive Citation dos Santos, Carlos Eduardo, "The Effects of Quantitative and Qualitative Feedback on Speaking Fluency Development" (2014). Theses and Dissertations. 4153. https://scholarsarchive.byu.edu/etd/4153
This Thesis is brought to you for free and open access by BYU ScholarsArchive. It has been accepted for inclusion in Theses and Dissertations by an authorized administrator of BYU ScholarsArchive. For more information, please contact [email protected], [email protected].

i
The Effects of Quantitative and Qualitative Feedback on
Speaking Fluency Development
Carlos Eduardo dos Santos
A thesis submitted to the faculty of Brigham Young University
in partial fulfillment of the requirements for the degree of
Master of Arts
Neil J Anderson, Chair Mark Tanner
K. James Hartshorn
Department of Linguistics and English Language
Brigham Young University
July 2014
Copyright © 2014 Carlos Eduardo dos Santos
All Rights Reserved

ABSTRACT
The Effects of Quantitative and Qualitative Feedback on Speaking Fluency Development
Carlos Eduardo dos Santos
Department of Linguistics and English Language, BYU Master of Arts
This study examined the effect of two forms of feedback (qualitatitive and quantitative) on the development of the spoken fluency of English language learners. Sixty-five intermediate-high students from 22 countries and 11 native languages enrolled in an intensive English language program at the English Language Center, Brigham Young University in Provo, Utah, participated. Throughout the 11-week course, the treatment group (consisting of 33 participants) received feedback on a weekly basis during speaking assessment tasks. The first form of feedback consisted of a quantitative analysis of their spoken fluency. This analysis, performed by PRAAT acoustic analysis software, measured several key features: speech rate (syllables per minute), pause frequency and duration, fillers, false starts, and connectedness of speech (mean length of run). In addition to measurements of their own performance, participants were presented with data on the average performance of their peers, as well as measurements of how closely their performance approximated the fluency measurements of a native speaker. The second form of feedback was qualitative, consisting of written descriptions of the participants` dysfluencies including fillers, high pause frequency and duration, low speech rate and false starts. Participants also received qualitative feedback in the form of self-assessment where they analyzed their own previously made recordings. Following the completion of the treatment, participants completed a survey eliciting their perceptions of the forms and effectiveness of feedback they had received over the course of the treatment. Though participants reported that the feedback (especially the qualitative variety) was useful, through statistical analysis of test and task scores it was found that other than for filler and false starts, feedback was not a significant factor in influencing the students’ improvement over the course of the semester, and it is probable that other factors (task repetition) played a larger role.
Keywords: [fluency, qualitative feedback, quantitative feedback, attention, task repetition, ESL]

ACKNOWLEDGEMENTS
First and foremost, I would like to express my gratitude for my Father in Heaven. I know,
without a doubt, that the reason why I am here was because He prepared the way for this dream
to come true.
Second, I wish to acknowledge my wonderful wife, Rosa Santos. I can truly say that
without her help and support, I would never be able to accomplish my dream. She has been my
light in times of doubt, always encouraging me to succeed. I love her more than words can
express. I express gratitude for my wonderful kids, Pablo, Pietro and Paola. They are my
inspiration to always “climb new mountains”.
I would like to offer my sincere gratitude to my chair, Dr. Neil J Anderson. Without his
help, support, patience, and above all, his knowledge, I would not be able to complete my thesis.
I simply could not wish for a better supervisor. I also wish to acknowledge the help and support
of Dr. Mark Tanner for his wise advice and counseling on my pursuit for this career and Dr.
James Hartshorn for his valuable feedback and support.
I have always been blessed with “angels” who were sent from God to help me along the
way. For the completion of this thesis, there are two of them in particular that I would like to
express my eternal gratitude. First, Judson Hart, I can truly say he was the answer to my prayers
when I most needed it. Without his help and support I would never have been able to complete
this thesis. He was a source of support and encouragement. I owe him a great part of what I have
become during these years as a master student. Second, Daniel Smith, words will never be
enough to express my gratitude for his support and encouragement. He has been my tutor, my
support, my counselor, and above all, my dearest and eternal friend, without his help, I would
never have finished this thesis. In proverbs 17:17 says: “A friend is always loyal, and a brother is
born to help in time of need.” This is what I feel when I think of him.
I would also want to thank Garett Madril who was an instrument from our Heavenly
Father to help me realize that I could do more than I thought I could.
I am most grateful for Alberto Quartim, without his support in directing our schools in
Brazil, I would never have completed my thesis. He has become part of our family. I owe him a
lot for what he has done for us during these years. Thank you!
Last, but by no means least, I thank my family in Brazil, my father, my sister Sandra, my
brother Almir, my sister in-law Edilia who helped me with the data, and all those who one way
or another helped me accomplish this dream.

v
Table of Contents
List of Tables……………………………………………………………………………...……. vii
Introduction ..................................................................................................................................... 1
Review of Literature ...................................................................................................................... .3
Definitions of Fluency ............................................................................................................... .3
Features of L2 Oral Performance ............................................................................................... .6
Attention, Awareness, and Noticing .......................................................................................... .8
Feedback Instruction ................................................................................................................. 12
Methodology ................................................................................................................................. 14
Participants ................................................................................................................................ 15
Procedure .................................................................................................................................. 16
Weekly Tasks ............................................................................................................................ 17
Quantitative Analysis and Feedback ......................................................................................... 19
Qualitative Analysis and Feedback ........................................................................................... 21
Analysis..................................................................................................................................... 22
Results and Statistical Analysis .................................................................................................... 22
Weekly Task Performance ........................................................................................................ 23
Speech Rate ............................................................................................................................... 23
Pauses per Minute ..................................................................................................................... 24
Pause Length ............................................................................................................................. 24
Mean Length of Run ................................................................................................................. 25
Pre- and Post-Test Analysis (Overall Performance) ................................................................. 27
Analysis of Students' Survey Responses ................................................................................... 28
Discussion of Results …………………………………………………………………………...31
First Research Question ............................................................................................................ 31
Second Research Question ........................................................................................................ 32

vi
Third Research Question........................................................................................................... 34
Fourth Research Question ......................................................................................................... 35
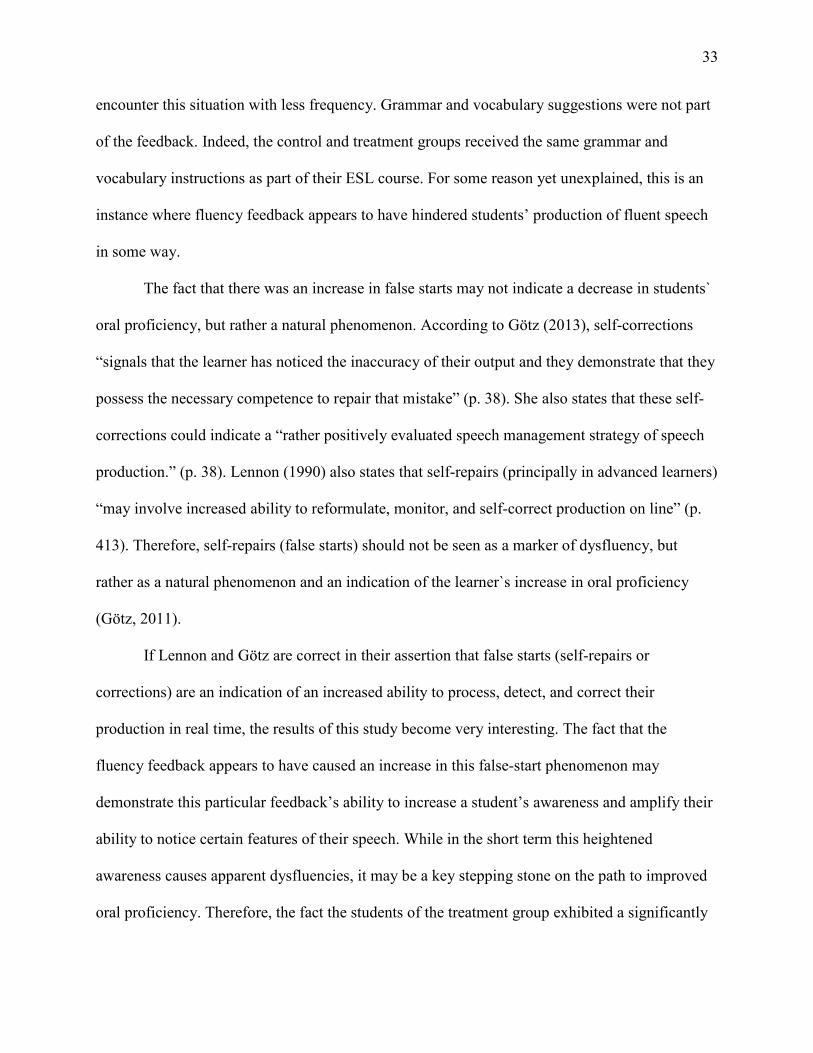
Alternative Explanation for Fluency Improvement .................................................................. 36
Pauses ........................................................................................................................................ 37
Speech Rate ............................................................................................................................... 37
Pause Length ............................................................................................................................. 38
Mean Length of Run ................................................................................................................. 38
Limitations …………………………………………………………………………...………40
Directions for Future Research ………………………………………………………………43
Conclusion .................................................................................................................................... 44
References……………………………………………………………………………………… 46
APPENDIX A: Pre- and Post-Test .............................................................................................. 52
APPENDIX B: Student Fluency Log ........................................................................................... 58
APPENDIX C: Rubric for Self and Teacher Evaluation .............................................................. 60
APPENDIX D: Surveys for Treatment and Control Groups ........................................................ 63

vii
List of Tables
Table 1. Group of Participants by Native Language and Gender ................................................. 16
Table 2. Improvement Measured by Comparison of Pre- and Post-Test Fluency Scores ............ 27
Table 3. Descriptive Statistics for Speech Rate Due to Task Repetition ...................................... 37
Table 4. Descriptive Statistics for Pause Length Due to Task Repetition .................................... 38
Table 5. Descriptive Statistics for Mean Length of Run Due to Task Repetition ........................ 39

viii
List of Figures
Figure 1. Schedule for Cascading Duration of Recording ............................................................ 18
Figure 2. Quantitative Feedback Received by Treatment Group ................................................. 20
Figure 3. Weekly Speech Rate Results in Syllables per Minute................................................... 23
Figure 4. Weekly Task Performance in Number of Pauses per Minute ....................................... 24
Figure 5. Weekly Task Performance in Average Pause Length ................................................... 25
Figure 6. Weekly Task Performance in Mean Length of Run ...................................................... 26
Figure 7. Students’ Description of the Characteristics of Fluent Speech ..................................... 29
Figure 8. Students’ Perception of the Helpfulness of the Different Feedback Types ................... 30
Figure 9. Fluency Improvement due to Task Repetition .............................................................. 36

1
Introduction
In the competitive world of language schools and institutions, there seems to be a quest
for the best procedure or technique that will enable students to speak English fluently. Although
some language schools and institutions are successful in helping learners achieve high levels of
proficiency, some students are rarely able to speak their L2 as fluently as their first language
(Segalowitz, 2010). According to Segalowitz “there is a fluency gap” and this gap is “often a
source of frustration and regret” (p. 2). Other important aspects to be considered are how well
professionals from these institutions and language schools know how to help students achieve
high levels of proficiency and how well they understand the term fluency while helping those
students with this “fluency gap.”
As a proprietor of a language institution and as a professional in the area of English as a
second and foreign language, my experience in the field has led me to postulate that when
students start to learn a second language, most of the time, they have one goal. It is not to be able
to know a large amount of vocabulary or learn English grammar. Their goal is to be fluent in
English, but what do the students mean when they say they want to be fluent in English? It is
true that for students the goal of fluency might include accuracy or communicative adequacy
(Nagel, 2012). While these are important objectives in SLA, this paper seeks to examine a more
focused definition of fluency. What is fluency? How can we measure it? Is it an outcome or a
process? Can it be improved?
As researchers and professionals in the field of language teaching, we are responsible for
investigating proposed answers to these questions to better help learners to accomplish their
goals of speaking English fluently, but it is a complex issue. There seems to be no agreement

2
concerning what is understood by these inquiries (Chambers, 1997; Segalowitz, 2010) as well as
no consensus as to its measurement (Koponen & Riggenbach, 2000; Kormos 2004).
This paper will provide a working definition for fluency and attempt to determine if
different forms of feedback (teachers to students, students` self assessment, and quantitative
feedback) play crucial roles in fluency development. This study will also seek to establish the
effect of feedback on the development of spoken fluency of English language learners.
Although there is a distinctive emphasis on building spoken fluency skills at the lower
levels of proficiency in a language instructional program, as a researcher, I have noticed that as
proficiency increases, spoken fluency becomes increasingly more difficult to measure in a
reliable and meaningful way. Consequently, while fluency remains prominent in terms of
instruction and practice, students receive less consistent and meaningful fluency feedback as
their apparent proficiency increases. One of the reasons that fluency feedback is less likely to be
provided to students may be due to the laborious nature of providing precise, consistent, and
reliable feedback.
This study aims to establish an informed direction for the English Language Center`s
curriculum for the Foundations program related to making the increase of spoken fluency a more
meaningful and manageable objective. ELC students enrolled in Foundations C Listening and
Speaking classes were included in the study during two consecutive semesters. Sections were
selected that would provide the most similarities in terms of teaching and timing of the
coursework. One of the two sections in both semesters was used as a control group. The other
two groups were used to test the treatment process. Within these sections, students received three
forms of feedback: quantitative feedback, which consisted of computer generated feedback;

3
qualitative feedback generated by the instructor, and self-assessment feedback generated by the
student.
This study will focus on answering the following research questions, which will be stated
here and reiterated throughout this paper:
1. Does providing qualitative feedback (self-assessment and assessments performed by
the instructor) and quantitative feedback (computerized measurements) to a treatment
group influence an increase in students’ oral fluency when compared to a control
group?
2. What specific fluency features (speech rate, pauses, mean length of run, fillers and
false starts) are most improved as a result of qualitative and quantitative feedback?
3. Which type of feedback (quantitative or qualitative) most significantly improves the
students’ speaking fluency?
4. What are the students’ perceptions of the different types of fluency feedback?
Review of Literature
This literature review will define fluency and identify its different qualitative and
quantitative aspects. Following the presentation on fluency, a brief explanation of attention and
awareness as a means of helping students achieve higher levels of fluency will be presented. This
review will also focus on the importance of task repetition to enhance fluency. Finally, a study
on the role of feedback and student self-assessment in fluency development will be described.
Definitions of Fluency
Experts have attempted to define fluency in a variety of different ways. Fluency is seen as
the metaphor “language is motion” (Koponen & Riggenbach, 2000, p. 7). In his book, Cognitive
Bases of Second Language Fluency, Segalowitz (2010) expands this concept and states that the

4
theme underlying this metaphor “focuses on those aspects of speech having to do with its fluidity or
flowing quality” (p. 4). Freed (2000) demonstrated how most laypeople use the term fluency. His
experiment was conducted with six native speakers of French who were asked to evaluate the
fluency of students learning French. They were also asked to explain the basis for their
observations, and to rank the importance of potential features of fluency listed for them by the
researchers. Freed said that “more than half of the judges selected rate of speech, smoother speech
with fewer false starts, fewer pauses/hesitancies, and better grammar and vocabulary” (p. 254) as
evidences of fluency.
Other researchers such as Brumfit (1984) define fluency as “the natural language use,
whether or not it results in native-speaker-like language comprehension or production” (p. 56).
Fluency is also defined as the “smooth, rapid, effortless use of language” (Crystal, 1987, p. 421).
Fillmore (1979) defines a fluent speaker as “the maximally gifted wielder of language” (p. 52).
Fillmore also expounds four main characteristics to define fluency. First, fluency is seen as the
ability that the speaker has to talk at length using few pauses and the ability to fill the time with
talk. Second, he states that fluency is the ability that a fluent speaker has to talk without hesitations
in a coherent manner, and produce semantically dense utterances. His third characteristic of fluency
is the ability to say appropriate things in different contexts. Fillmore`s last characteristic of fluency
is the ability that fluent speakers have to be creative and imaginative when communicating.
Lennon (1990, 2000) uses two different concepts to define fluency. The broad sense of
fluency, according to Lennon, is seen as the global oral proficiency in which the speaker has a high
command of the second language. In its narrower sense, fluency is considered to be one component
of oral proficiency, which is often used as one of the scores in assessing candidates' oral language
skills in an exam situation. Lennon (1990) posits that fluency differs from the other scores in oral

5
language exams such as accuracy and appropriacy. These other features are usually seen as
performance phenomena. Lennon defines fluency as “an impression on the listener’s part that the
psycholinguistic processes of speech planning and speech production are functioning easily and
efficiently” (p. 391).
As observed, fluency is a difficult concept to describe. Can it simply be defined as language
is motion? Or is it defined as the rate of speech, or as smoother speech with fewer false starts? Or is
it perhaps the smooth, rapid, effortless use of language? Or is it simply an impression on the
listener`s part? While entire literature reviews (including this one) have placed tremendous effort
into defining fluency, for this paper, it is important to have a definition of fluency that is
quantifiable. This is crucial for the feedback and measurement elements of the methodology of the
present study. Freed (2000) defined fluent speech as smoother speech with fewer false starts, fewer
pauses/hesitancies. Drawing heavily upon Freed’s specific definition, as well as components of the
aforementioned definitions from other researchers, fluent speech in this paper is defined as: speech
characterized by appropriate (native like) rate and operationalization of connectedness (mean
length of run) with minimal dysfluencies (pauses, fillers, and false starts).
As mentioned previously, even though the concept of fluency is seen as “confusing and
disappointing” with “a multitude of meanings” (Segalowitz, 2010, p. 2), some institutions and
language centers still rely on their English teachers and professionals to measure students` fluency.
Unfortunately, for some professionals, the most efficient tool utilized as a means to measure
students` fluency and differentiate between more fluent and less fluent speakers is the teachers’ own
perception. This measurement is often done by means of contrasting a native speaker’s speech
sample to a non-native speaker. Nevertheless, studies have shown that there are effective and more
accurate ways to measure speakers’ fluency (Cuchiarini, Strik, & Boves, 2000, 2002; De Jong,

6
Schoonen & Hulstijn, 2009; Iwashita, Brown, McNamara, & O`Hagan, 2008; Kormos, 2006;
Lennon, 1990; Towell, Hawkins, & Bazergui, 1996). These quantifiable indicators will be better
identified in the following paragraphs.
Features of L2 Oral Performance
1. Speech Rate. One of the first quantifiable indicators to measure fluency in language
production is speech rate. Chambers (1990) defines speech rate as “the number of syllables
uttered per second” (p. 538) and it is defined by Kormos (2006) as the “total number of syllables
produced in a given speech sample” (p. 163). These syllables are “divided by the total amount of
time required to produce the sample” which is then “multiplied by 60 to give a figure expressed
in syllables per minute” (p. 163). In an investigation to measure speech rate, Lennon (1990)
conducted a study in which four German advanced EFL learners at the beginning and at the end
of a six-month period of residence in Britain were rated by 10 native-English-speaking teachers
of English as a foreign language (EFL). The study suggested that increases in speech rate were
one of the perceived improvements in fluency. Other factors such as reduction in silent pause
time, non-lexical filled pauses, repetitions, and average number of syllables per utterance were
also indicators of improvements (Rossiter, 2009, p 397).
2. Mean Length of Run. Kormos (2006) states that most of the studies on fluency have
concluded that “the best predictors of fluency are speech rate . . . and the mean length of run,
that is, the average number of syllables produced in utterances between pauses of 0.25 seconds
and above” (p. 163).
3. Incidences of Pauses (unfilled pauses). A number of studies have also identified
unfilled pauses as a quantifiable measure of fluency. Chambers (1997) defines pauses as the
“presence, length and frequency of silences and hesitations” (p. 538). Chambers also states that

7
even though pauses in interaction are normal features in “verbal encounters common to all
languages,” the presence of silences are “often seen as a sign of dysfluency, especially in foreign
language speech” (p. 538). Also, even though pauses are accepted by native speakers, “not all
pauses are acceptable” (p. 538). He defines two kinds of pauses, the natural pause which is
allowed in breathing space and often occurs in clause junctures or after groups of words that
form a semantic unit, and the unnatural pause, often seen as a sign of hesitation and “revealing
either lexical or morphological uncertainty” (p. 538). Chafe (1985) explains that some pauses are
a necessary feature in native speaker`s production and that “speaking is not a matter of
regurgitating material already stored in the mind in linguistic form,” but according to him, it is “a
creative act, relating two media, thought and language, which are not isomorphic but require
adjustment and readjustments to each other” (p. 77). Another definition of silent pauses is stated
by Kormos (2006) as “the total number of pauses over 0.2 seconds divided by the total amount of
time spent speaking, expressed in seconds and multiplied by 60” (p. 163).
4. Fillers. Another way of delineating the measures of fluency is by examining the
occurrence of filled pauses or fillers. According to Kormos (2006), fillers are defined as “the
total number of filled pauses such as uhm, er, mm, divided by the total amount of time expressed
in seconds and multiplied by 60” (p. 163).
5. False Starts. Riggenbach (1991) defines false starts or unretraced restarts as
“reformulations in which the original utterance is rejected” (p. 427). In these instances, a speaker
begins an utterance, but becomes “stuck” due to some gap in their ability, causing them to
abandon the attempted utterance and begin a new one.
It has been established that the features of oral performance mentioned above are
essential indicators to help professionals understand and measure fluency, but the question

8
remains: how does the ability to measure fluency improve second language acquisition for the
students? In order for students to acquire a second language, they need to notice and become
aware of these features (Carr & Curran, 1994; De Jong & Perfetti, 2011; Schmidt, 1994, 2010;
Segalowitz, 2010)
Attention, Awareness, and Noticing
According to De Jong and Perfetti (2011), attention to meaning over form seems to be the
ultimate goal of many second-language learners (p. 534). Segalowitz (2010) points out that for
speakers to be able to communicate properly they “often have to cope with challenges of open
environments – situations where information critical to successful performance changes in
unpredictable ways” and that “such abilities can be crucial to success” (p. 90). Therefore, to be
able to “package information into appropriate language” speakers have to “redirect the focus of
attention in order to recruit the appropriate linguistic resources for formulating the message” (p.
41).
Attention is sometimes related to consciousness, noticing, awareness and understanding.
Carr and Curran (1994) pointed out, that “if you are conscious of something, then you are
attending to it . . . and if you are attending to something, then you are conscious of it” (p. 219).
According to Schmidt (2001) attention is an aspect of consciousness involving detection of
stimuli. Schmidt (2010) also states that attention plays an important role in learning in that
people learn about the things that they pay attention to and do not learn much about the things to
which they do not pay attention. This principle was salient in a study conducted with a young
Japanese artist who emigrated from Tokyo to Honolulu (given the pseudonym “Wes”). Schmidt
(1990) explains the attention process: “Wes” was “a remarkably good learner of English in many
ways” (p. 722). During the three years of study, Schmidt noticed that Wes became skillful and

9
expressive in his conversations and developed skills such as pronunciation, lexical development,
listening comprehension, and strategic competence and dimensions of fluency, but he also
concluded that “his development in the area of grammar —morphology and syntax— was very
limited” (p. 722). Schmidt concludes that one “possible explanation may be that he didn’t care
much for the small grammatical details of language. Or perhaps he just didn’t notice them” (p.
722). Wes`s inattention to grammar patterns severely limited his ability to learn them.
Schmidt`s (1986, 2010) second case study related to attention was his own experience as
a Portuguese learner in Brazil. During his stay in the country, he took a five-week Portuguese
class, but noticed that some forms that were frequent in input were still not acquired until they
were consciously noticed in the intake, and even though he received frequent corrections of his
grammatical errors in conversation with native speakers, in many cases this had no effect on his
acquisition of the language. He often was unaware that he was being corrected. This experience
led Schmidt to conclude that intake does not occur until learners attend to and notice linguistic
features of the input to which they are exposed (1994).
Leow (1997) conducted an experiment in which 28 Spanish learners were asked to
complete a crossword puzzle. He found that those who were more aware when performing the
task learned the most. Those students who noticed instances but attempted no generalization also
improved but to a lesser degree. There was no learning for that part of the students for whom
there was an absence of noticing instances.
VanPatten (1994) states that attention is essential when learning second language
structure. In his article, he comments the learning process of a student named Bob Smith:
Bob Smith is a learner of Spanish, a language that actively distinguishes between
subjunctive and indicative mood . . . He begins to notice subjunctive forms in others’

10
speech. He attends to it. Soon, he begins to use it in his own speech, perhaps in reduced
contexts, but nonetheless he is beginning to use it. If you ask him for a rule, he might
make one up. But in actuality, he doesn’t have a rule. All he knows is that he has begun
to attend to the subjunctive and the context in which it occurs and it has somehow begun
to enter his linguistic system . . . Bob did not need to come up with a conscious rule; he
only needed to pay attention. (p. 34)
It has been identified that students can improve their abilities in their second language by
paying attention to certain features of the target language, giving rise to other inquires regarding
improvement in second language acquisition. What other factors besides noticing and attention
might be beneficial in promoting an increase in fluency and a proceduralization of what was
learned? How can students transfer what they have learned to their long-term memory? A
compelling response to these questions is found in a study conducted by Bygate (2001), who
posited that students were able to proceduralize new information through task repetition. In his
study, Bygate investigated the effects of narrative and interview tasks. The results showed that
the second time the task was performed there was an increase in the fluency (measured in the
number of unfilled pauses per given unit of time) and complexity (measured in number of errors
per given unit of time) of the speech. He also found that when students repeated a narrative task,
their attention targeted different aspects of the oral production, in this case complexity, and the
performance improved gradually in each repetition.
Lynch and Mclean (2000, 2001) also made use of task repetition. In a study conducted
with medical students in an English for specific purpose course, Lynch and Mclean designed
what they called a ‘poster carousel’ task. The goal of this task was to have the medical students
stand in front of their posters and answer questions asked by those visiting the ‘carousel.’

11
Because the students who visited the posters all tended to ask similar questions, there was a great
opportunity for task repetition. Those students who presented the posters were also able to
monitor their responses, notice their mistakes and correct them the next time they had to answer
similar questions. Students` recordings during the tasks were transcribed and analyzed in order to
investigate whether there was any improvement during the task. They also asked the students to
answer a self-report questionnaire. Even though the task itself may not have been the only factor
that made students improve in both accuracy and fluency (some students were benefitted by
other students who corrected the their mistakes while presenting the posters), Lynch and Mclean
found that there was evidence of improvement in accuracy and fluency as students performed the
same task multiple times. Also, some students reported that the task made them aware of their
mistakes and they tried to correct them on subsequent presentations.
De Jong and Perfetti (2011) also investigated the influence of task repetition on the
development of oral fluency by performing a series of 4/3/2 tasks (a sequence of three tasks in
which the duration of speaking changes from four minutes on the first attempt to three minutes
on the second and finally two minutes on the third). Recordings were conducted in three training
sessions in which students were asked to record three speeches, the first speech lasting four
minutes, the second speech lasting three minutes, and the final speech lasting two minutes.
Participants were assigned to one of the three conditions. In the first condition, denominated
repetition condition, students spoke about one topic three times and completed the three speeches
within one day. Students in the second condition (no condition) were given the same time frame
for their speeches, but were assigned to talk about a different topic for each speech. In the third
condition, denominated repetition-II condition, students also spoke about the same topic three
times, as did the repetition condition group. They did not, however, perform the tasks at the

12
beginning of the training period, but rather at the end, so as to avoid overlapping the other
groups.
It was found that the groups of students (repetition condition and repetition II condition)
who repeated the same topic three times were able to improve their oral fluency compared to the
group of students who was asked to repeat different topics three times. According to De Jong and
Perfetti (2011), pause frequency and other features of fluency were reduced because the students
were able to pay more attention due to the process of repetition. This helped them to more
accurately know what to say and how to say it.
As shown in the previous sections of this paper, important features of fluency (speech
rate, pause frequency and duration, false starts, fillers, and mean length of run) can be measured
quantifiably. Also, repetition of tasks causes noticeable improvement in students’ fluency. In
order for language learners to improve in these same aspects of fluency, their errors must be
brought to their attention. This begs the question: What is the best way to promote attention and
at the same time help students proceduralize what they have learned? One proposed solution is
feedback.
Feedback Instruction
While feedback can refer to both written and oral feedback, this part of the literature
review will focus on written feedback for oral production. Controversy over whether or not
feedback enhances learning has been a topic of interest among ESL teachers and researchers
(Krashen, 1985; Truscott, 1999). Nonetheless, researches on the subject seem to provide enough
evidence that feedback can generate positive results on second language learners (Chaudron,
1977; Li 2010; Mackey and Goo, 2007).

13
Schmidt`s (1994) noticing hypothesis, as mentioned above, states that for attention to be
effective, feedback is an essential element of the acquisition process. Comparing a study
conducted by Ioup, G., Boustagi, E., El Tigi, M., & Moselle, M. (1994), on Julie, a 21-year old
English woman who, after living in Cairo for about two and a half years, was able to pass as a
native speaker, and Schimdt`s own study on Wes, a Japanese immigrant living in Hawaii, he
concluded that Julie “consciously manipulated the grammatical structure of the language, paid
attention to morphological variation, and kept careful track of corrections and expanded
repetitions from native speakers and greatly appreciated the feedback” and in contrast, “ Wes has
never appreciated being corrected” (p. 12).
Mackey (2006) investigated whether feedback promoted noticing on L2 forms in a
classroom context and whether there was a relationship between learners` reports of noticing and
learning outcomes. The finding of this study indicated that learners who reported more noticing
when feedback was provided were able to develop more compared to other students who
exhibited less noticing when they received feedback.
Various terms have been used to identify errors and provide feedback. Schachter (1991)
identified corrective feedback, negative evidence, and negative feedback as three terms used
respectively in the fields of language teaching, language acquisition, and cognitive psychology.
Different researchers often use these terms interchangeably. Corrective feedback can be explicit
(e.g., grammatical explanation or overt error correction) or implicit. Implicit correction includes,
but is not limited to, confirmation checks, repetitions, recasts, clarification requests, silence, and
even facial expressions that express confusion.

14
Brookhart (2008) states that “teacher feedback is input that, together with students`
internal input, will help the students decide where they are in regard to the learning goals they
need or want to meet and what they will tackle next” (p. 3).
As established by the literature, feedback plays a crucial role in language acquisition, and
may be the key to helping students notice features of fluency, giving the features proper
attention, and eventually mastering them. That being said, there are many different types of
feedback that can be used in the classroom. In the English Language Center at Brigham Young
University, two types of fluency feedback in particular are available to students. The first type is
qualitative feedback, which consists of written comments and suggestions provided by teachers
after listening to recordings of students’ speech. The second type is quantitative feedback
generated by PRAAT, a computer program which measures the rate, pauses, and mean length of
run of the students’ speech, providing them with a numerical score for each category. Are these
types of feedback beneficial in helping students acquire good fluency? The methodology of this
paper will examine this question.
Methodology
The purpose of this section is to describe the procedures used to measure the effects of
feedback on speaking fluency and to answer the research questions from the introductory section
of this paper. In order to answer these questions, the present study replicated certain aspects of
De Jong and Perfetti’s (2011) study, particularly those tasks performed by their repetition group
in which participants responded to the same prompt on multiple, sequential tasks varying in
duration. The current study, however, focused on researching a different timing approach.
Students at the English Language Center (ELC) at BYU are used to taking computerized tests.
The time given to students to respond to these test questions range from 45 seconds to two

15
minutes. Therefore, to reflect the same procedure used in these tests at the ELC, our study asked
students to repeat the same topic three times in a 120/90/45-second response instead of De Jong
and Perfetti’s (2011) 4/3/2 minute approach. The times were also adjusted in order to facilitate
and hasten the feedback process. An additional variation from De Jong and Perfetti’s approach
was related to the amount of time between the repetitions of the same prompt. In their study,
participants did the 4/3/2 recordings for the same prompt all in the same day. Because it was
important for students in the present study to receive feedback, one week passed between each
repetition of the same prompt. This is clearly illustrated in the section of this paper outlining the
procedure.
This section provides a description of the students who received quantitative and
qualitative feedback, along with a description of the control group of students who did not
receive any form of feedback. This section also describes the assignments given to the students
in the treatment groups and a description of the procedure and instruments used to measure
students’ speaking fluency. Finally, a brief description of how the findings were analyzed will be
provided.
Participants
The group of participants was composed of 65 ESL students at Brigham Young
University`s English Language Center, an intensive English program in Provo, Utah. Participants
were divided into four sections during two consecutive semesters. Each section consisted of
students in the level C of the Foundations Program, which is the third of eight proficiency levels
used at the ELC. Students were placed in this level based on their performance on a placement
test. The ELC uses the standards established by the American Council of Teaching Foreign
Language (ACTFL) to place students in their specific level. Participants in this study ranged in

16
proficiency from intermediate-mid to intermediate-high. They varied in age from 18 to 58 years
of age. Table 1 below shows relevant demographic information about the participants of the two
test groups.
Table 1 Group of Participants by Native Language and Gender
Treatment Group Control Group Native Language Male Female Total Male Female Total Spanish 5 14 19 5 11 16 Portuguese 1 2 3 3 2 5 Korean - 4 4 1 3 4 Japanese 1 1 2 - 1 1 Mandarin - 1 1 1 1 2 Haitian 1 - 1 - - 0 Mongolian - 2 2 - - 0 Thai - 1 1 - 1 1 Russian - - 0 - 1 1 Cantonese - - 0 - 1 1 Arabic - - 0 - 1 1 Totals 8 25 33 10 22 32
Of the 65 students who participated in the research, 33 students were assigned to the
treatment group and 32 students were assigned to the control group. Treatment and control
groups used separate classrooms during the study. The participants in the treatment group ranged
in age from 18 to 58 of age, with a mean age of 23.6 years. The control group had an age range
of 18 to 48, with an average of 24.4 years. The treatment group was 75 percent female while the
control group was just over 67 percent female.
Procedure
At the beginning of the semester, a pre-test was given to all of the participants. This pre-
test was designed specifically to measure students` current abilities on the chosen features of
17
fluency: speech rate, incidences of pauses (unfilled pauses), pause length, false starts, fillers, and
mean length of run. Two test forms were created so that the assessment could serve as both pre-
and post-test, and ten prompts were selected for each form. These prompts reflected the same
type of tasks students performed during the semester. Students recorded timed spoken responses
to each of the prompts ranging from 45 seconds to two minutes. The amount of time for each
response was also similar to the tasks students performed during their normal semester. Before
each response, students were given a short amount of time to prepare (15 seconds for a 45-
second answer, 30 seconds for a 90-second answer, and 45 seconds for a two-minute answer).
The amount of preparation time was determined by the amount of speech they were required to
produce, which is the common practice for similar tasks already in use at the ELC. The
preparation time given for the speaking tasks in the present study was also very similar to the
current speaking section of TOEFL test procedure. The other form of the test was used as the
post-test at the end of the semester to measure any gains in fluency (a sample of the pre- and
post-tests is given in Appendix A). The pre-test and post-test were administered in the computer
lab at the English Language Center at BYU. The participants’ responses were analyzed by
PRAAT, so that changes in speech rate, pauses, and mean length of runs over the course of the
semester could be measured.
Weekly Tasks
Every week (on Thursdays) throughout the semester, participants in the treatment and
control groups recorded spoken response to three prompts in the computer lab. For the
recordings, students were presented a new topic each week (prompt A in week 1) and were given
two minutes to respond to that topic. The following week (week 2), they were asked to respond
to the previous week’s two-minute topic (prompt A) in 90 seconds and were then given a new

18
two-minute response topic (prompt C). The third week, yet another two-minute response topic
was given (prompt D), and they had only 90 seconds for the previous week’s two-minute topic
(prompt C), and 45 seconds for the previous week’s 90-second topic (prompt A). Prompt B in
weeks one and two was an exception, as shown in Figure 1.
A detailed description of the application of task repetition and the schedule of the tasks
themselves is included in Figure 1.
Week 120 sec. prompt 90 sec. prompt 45 sec. prompt 1 A B 2 C A B 3 D C A 4 E D C 5 F E D 6 G F E 7 H G F 8 I H G 9 J I H 10 K J I 11 K J
Figure 1. Schedule for cascading duration of recordings.
At the beginning of the semester, students were given a detailed set of instructions
entitled fluency log outlining the tasks they would perform throughout the duration of the course
(see Appendix B). Audio recordings of the students` speech were made with NetRecorder, a
pedagogical tool developed by the Humanities Resource Learning Center at BYU with the
central function of delivering and managing computerized oral language tasks. This tool enables
instructors to easily set up assignments composed of speaking tasks that target specific functions
and topics that the instructor sets. The instructor can also vary the length of individual tasks and
the number of tasks per assignment. In addition, the teacher is able to choose when to make the

19
assignment available and for how long it should be available. The tool also manages the data
collected, allowing the instructor to easily retrieve the sound files from a student's tests.
Quantitative Analysis and Feedback
After each weekly recording session, participants’ recordings were analyzed by PRAAT,
a scientific computer and freeware program for the analysis and reconstruction of acoustic
speech signals. For this study, PRAAT was set up to measure the following:
1. Speech rate – Similar to Kormos (2006), PRAAT measured the total number of
syllables uttered in a speech sample, which was then divided by the amount of
time required to produce the sample (including pause time) expressed in
seconds (p. 163). In accordance with Riggenbach (1991), unfilled pauses under
0.3 seconds were not included in the calculation of speech rate.
2. Incidences of pauses (unfilled pauses) – The specific duration of the silence
that constitutes an unfilled pause has not been consistently defined in the
literature. For example, Freed (2000) measured only those pauses that were
longer than 0.4 seconds, Riggenbach (1991) measured pauses at 0.3 seconds,
Lennon`s (1990) cut-off point for pauses was 0.2 seconds and Kormos (2006)
identifies pauses as the “total length of pauses above 0.2 seconds divided by the
total amount of time spent speaking expressed in seconds and multiplied by 60”
(p. 163). For facility in using PRAAT and in accordance with the average pause
duration examined by the literature, the present study examined pauses above
0.3 seconds (which PRAAT was programmed to recognize).
3. Pause length – PRAAT also measured the average duration of all pauses that
were longer than 0.3 seconds.
20
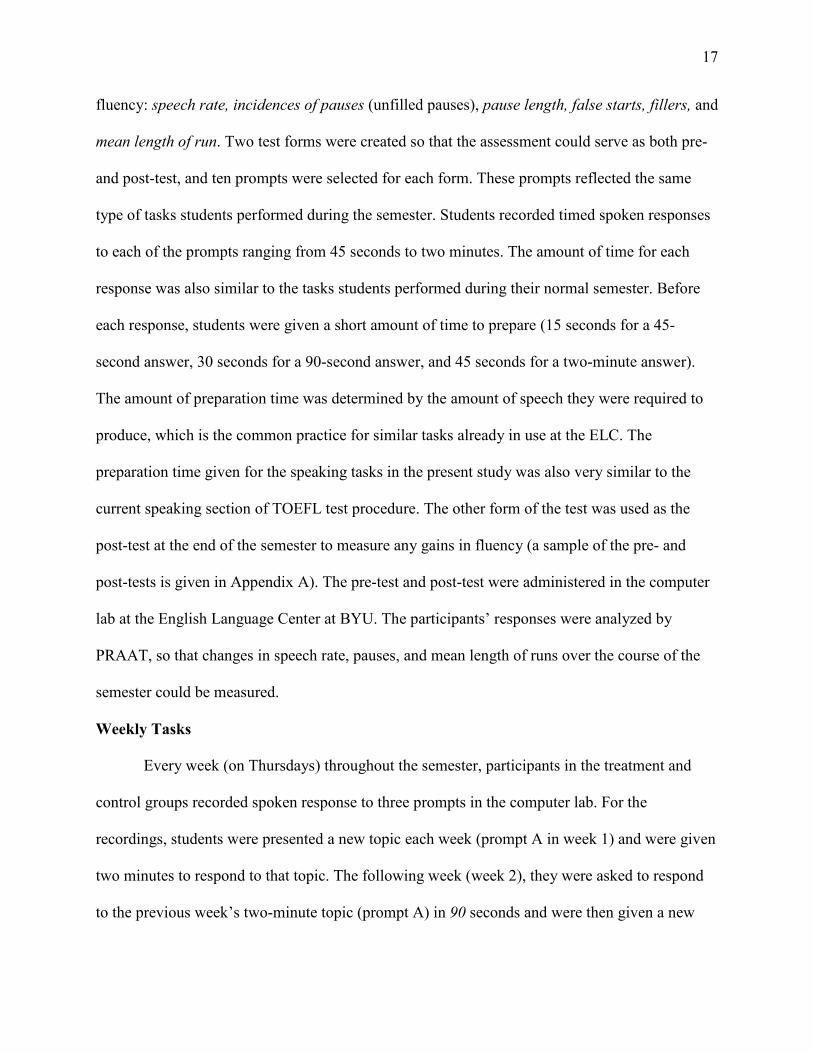
4. Mean length of run – This measurement consisted of the average number of
syllables produced in utterances between pauses of 0.25 seconds and above
(Kormos, p.163)
This quantitative feedback analyzed by PRAAT was handed out to the treatment group the next
week (on Thursday) and showed the results of their own assessments from the week before.
Figure 2 shows how the quantitative feedback includes data regarding students`
performance, average class performance, and a space for them to calculate their individual
difference from class performance. The figure also includes data on native speaker performance,
as well as a space for the participants to calculate their individual difference from the native
speaker performance. The native speaker row contains the scores that a native speaker received
on the same speaking task.
Prompt Time Performance Rate Pauses/min Pause Length Mean Length of Run
A
120
Your Performance 164.85 15.99 0.61 10.00 Class Performance 127.56 21.80 0.85 6.00 Difference Native Speaker 204.28 16.98 0.65 11.69 Difference
Figure 2. Quantitative feedback received by treatment group
The instructions on how the students were to interpret the quantitative feedback were
included in the fluency log (Appendix B). By receiving this weekly quantitative feedback,
students were able to analyze their performance over time. Using this data, students were also
able to measure their fluency performance against the median performance of peers as well as
native speakers performance on the same tasks. These quantified comparisons are not available
through other forms of feedback.

21
Qualitative Analysis and Feedback
Along with quantitative feedback, individual reports denominated teacher feedback were
also written by the teacher and handed out to the students the next week on the day of the task
before the new recordings were made. This was done in order to raise students’ awareness of
their dysfluencies and focus their attention on improving specific aspects of fluency. The teacher
also used a 4-point Likert scale denominated fluency rubric, as a means to ensure reliable and
consistent measurement of the four selected features of fluency: speech rate, pause frequency
and duration, fillers and false starts (A sample of the fluency rubric received by students is
included in Appendix C).
Due to time constraints and the fact that students were generally less prepared and less
confident for the initial two-minute response, the instructor used the rubric and the teacher
feedback to evaluate students’ performance only on the 90-second task, at which point students
were more confident for the specific topic. Students used a similar rubric denominated student
self-assessment during their recording sessions to analyze their own recordings from the previous
week. Where the teacher only provided feedback on the 90-second task, the students used the
rubric to perform a self-assessment of their fluency on all three weekly tasks. This is what
constituted the qualitative feedback that was provided to the treatment group.
Students in the control group followed all of the same procedures with regards to the pre-
and post-tests and the weekly recordings. Students in this group, however, were not evaluated by
PRAAT or the teacher on a weekly basis, nor did they self-evaluate. They also did not receive
fluency feedback of any kind (neither quantitative nor qualitative).
At the end of the semester, all of the students in both of the groups participated in a
survey in which they responded to questions regarding their experience with the different types

22
of fluency feedback, their perception of their own progress in speaking, their motivation, and the
overall effectiveness of the tasks. A sample of the survey is included in Appendix D.
Analysis
After the data collection period was complete, the participants’ scores on the pre- and
post-tests were compared to determine how much the students progressed in the individually
targeted aspects of fluency (speech rate, pauses, mean length of run, fillers and false starts). The
scores of the two test groups were compared, and ANOVA was performed to determine whether
or not the observed differences between the groups’ scores were significant. These results will be
discussed in the next section of this paper.
In addition to the test data that was collected and analyzed, the students’ survey responses
were also examined. The responses of the two test groups were compared to determine whether
or not the participants had a preference regarding the type of fluency tasks and feedback used in
the course. These responses were anonymous and were used to evaluate students` preferences
and perceived value of the feedback methods and personal gains over the course of the semester.
These results will also be discussed in the next section of this paper.
Results and Statistical Analysis
This section presents the data collected from the control and treatment groups’ weekly
tasks and their pre- and post-tests, as well as the statistical analysis used to determine whether or
not observed differences between the groups were significant. Though the study was conducted
during two consecutive semesters, the data from the two semesters were combined for the
analysis, as there was no significant difference across semesters.
23
Weekly Task Performance
For these analyses, students` weekly fluency task recordings were collected and analyzed
by PRAAT to measure any improvement. Due to time constraints and the laborious work in
collectiong data for two of the targeted features of fluency, fillers and false starts, only the
computarized analyses of fluency (speech rate, pauses, pause length and the mean length of run)
were analyzed in this specific measurement.
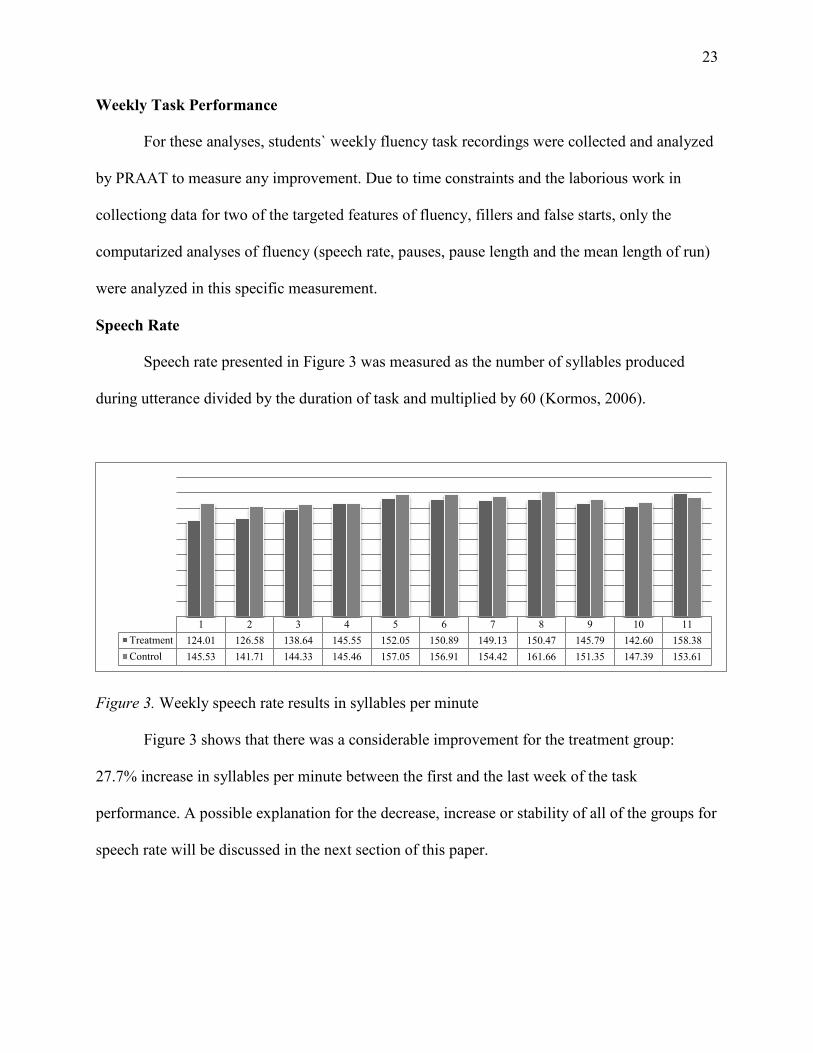
Speech Rate
Speech rate presented in Figure 3 was measured as the number of syllables produced
during utterance divided by the duration of task and multiplied by 60 (Kormos, 2006).
Figure 3. Weekly speech rate results in syllables per minute
Figure 3 shows that there was a considerable improvement for the treatment group:
27.7% increase in syllables per minute between the first and the last week of the task
performance. A possible explanation for the decrease, increase or stability of all of the groups for
speech rate will be discussed in the next section of this paper.
1 2 3 4 5 6 7 8 9 10 11Treatment 124.01 126.58 138.64 145.55 152.05 150.89 149.13 150.47 145.79 142.60 158.38Control 145.53 141.71 144.33 145.46 157.05 156.91 154.42 161.66 151.35 147.39 153.61

24
Pauses Per Minute
This measurement was determined by calculating the total number of pauses over 0.3 sec.
and dividing it by the total amount of time spent speaking expressed in seconds and multiplied
by 60. Figure 4 presents the results for the number of pauses per minute on the weekly tasks for
the treatment and control groups.
Figure 4. Weekly task performance in the number of pauses per minute
The data for the number of pauses produced per minute presented in Table 6 shows that
both of group made a slight decrease in the number of pauses produced in the explanations made
at the end compared to the first of the task. These values, however, are not statistically
significant.
Pause Length
In the analysis, pause length was measured by calculating the duration of the utterance
minus the phonation/time ratio divided by the number of pauses. Kormos (2006) defines this
measurement by calculating “ . . . the total length of pauses above 0.2 seconds divided by the
total number of pauses above 0.2 seconds” (p. 163). Since we have stipulated the duration of
1 2 3 4 5 6 7 8 9 10 11Treatment 21.95 23.6 23.68 21.65 23.11 20.94 22.45 22.71 23.43 22.37 19.85Control 23.26 22.67 23.55 22.01 21.73 21.75 23.04 21.95 23.88 21.33 21.54

25
pauses to be 0.3 seconds, our calculation was slightly different from what was defined by
Kormos.
Figure 5 presents the results of the average pause length for the treatment and control
groups.
Figure 5. Weekly task performance in average pause length
The data for mean length of pauses per minute presented in Figure 6 shows that while
their overall performance on pause length was fairly stable, the students were able to generally
decrease the duration of their pauses. This is in accordance to Towell et al. (1996) who states that
even though there is an increase in the mean length of run when proceduralization is acquired,
there may be no change in the mean length of pauses or phonation time.
Mean Length of Run
Mean length of run was measured by calculating the average number of syllables
produced in utterance between pauses of 0.3 seconds and above. According to Götz (2013)
“quantifying the mean amount of speech uttered without hesitation . . . helps to define the level
of automaticity of a speaker (p 17). De Jong (2011) states that the mean length of fluent runs
1 2 3 4 5 6 7 8 9 10 11Treatment 0.96 0.94 0.78 0.85 0.74 0.78 0.72 0.72 0.78 0.84 0.79Control 0.95 0.86 0.78 0.78 0.77 0.73 0.74 0.70 0.75 0.83 0.82

26
may be used as an indicator of proceduralization when it is used in combination with other
features of fluency.
The data presented in Figure 6 shows that, over the course of the semester, both groups
increased in their mean length of run in comparison to the first week of the task. This may be an
indication of proceduralization, which, according to De Jong (2011) “enables learners to produce
longer fluent stretches of speech without additional time for pausing” (p. 549). Figure 6 also
shows that towards the end of the semester (week nine), both groups dropped their length of
runs. This may have been due to task difficulty or motivation since they were coming closer to
the end of the semester. It is also noticeable that in week 10 and 11 both groups increase their
mean length of run, but there is not a statistically significant difference between the groups.
Figure 6. Weekly task performance in mean length of run
One possible explanation for the increase of mean length of run in both groups may be
due to the learning and use of new vocabulary as well as the use of formulaic sequences. Götz
(2013), explaining the use of formulaic sequences by nonnative speakers, states that “the more
formulae the learners use, the more processing time they can spend on the formulation of the rest
of the utterance and, logically, the longer the speech runs become” (p. 18).
1 2 3 4 5 6 7 8 9 10 11Treatmen 5.79 5.29 6.23 7.02 6.68 7.48 6.93 6.86 6.34 6.51 8.90Control 6.37 5.71 6.57 7.16 7.69 7.48 6.83 7.85 6.43 7.09 7.51

27
Pre- and Post-Test Analysis (Overall Performance)
The results of the weekly tasks described in the previous section establish a context of the
progress of both the treatment and control groups. In this section, the overall progress for both
groups is examined through the analysis of the pre- and post-test scores. Table 2 shows the pre-
and post-test scores for the two groups of participants in each of the six measured fluency
features. It also contains the overall improvement, or change measured by the difference between
the pre- and post-test scores for each category.
Table 2
Improvement Measured by Comparison of Pre- and Post-Test Fluency Scores
Group Test Rate Pauses PL MLR Fillers FS
Control Pre Mean 134.85 23.68 0.86 6.2 3.58 0.49
SD 26.22 4.67 0.21 3.1 2.84 0.48 Post Mean 154 22.92 0.77 7.04 3.1 0.34
SD 26.05 4.31 0.21 2.45 2.76 0.44
Change 19.15 0.76 0.09 0.84 0.48 0.15 Treatment Pre Mean 121.91 22.73 0.98 5.39 3.97 0.67
SD 22.5 3.79 0.26 1.7 2.77 0.55
Post Mean 143.17 21.43 0.84 6.96 2.24 1.05
SD 20.89 3.68 0.23 1.81 1.75 0.95
Change 21.26 1.3 0.14 1.57 1.73 -0.38
ANOVA of the speech rate results for the treatment and control groups showed that the
observed difference between the groups’ progress was not significant F(1,56) = 0.097, p = 0.756.
Similarly, there were no significant differences between the two groups’ progress in the number
of pauses F(1,56) = 0.196, p = 0.660, pause length F(1,56) = 0.413, p = 0.523, and the mean
length of run F(1,27) = 1.051, p = 0.310. However, the results were statistically significant for
fillers, F(1,61) = 4.466, p = 0.039, η2p
= 0.069. Mean differences for false starts were also

28
statistically signficant, F(1,61) = 5.672, p = 0.020, η2p
= 0.086, but interestingly the treatment
group did not improve but rather increased in the rate of occurrence of false starts. Considering
the guidelines proposed by Cohen1 (1988), the partial eta squared (η2p) of 0.069 for fillers and
0.086 for false starts suggest a moderate effect size that could be attributed to the instructional
methodology of the current study.
Analysis of Students’ Survey Responses
With regards to the fourth research question addressing students’ perception of the types of
fluency feedback they received, data were collected by way of a questionnaire administered to the
four groups of students at the end of each semester as described in the Methodology section of this
paper. The present section will present the results of the questionnaire. A more detailed discussion
of the results will be included in the next section.
When asked to describe what ‘fluent’ speech is like, the treatment group identified nine
different characteristics of fluent speech, and the participants in the control groups identified 12
different characteristics of fluent speech including four that were not mentioned by the treatment
group. The complete results for students’ responses to this question are shown in Figure 7.
1 Cohen’s guidelines for interpreting effect sizes: (η2p) 0.01 = small, 0.06 = moderate, 0.14 = large.

29
Figure 7. Students’ description of the characteristics of fluent speech
When asked which type of feedback the students found to be helpful for improving their
fluency, 68% percent of the students found the teacher feedback to be beneficial. The survey results
also showed that only 7% of the students found self-assessment to be useful, and 43% percent of the
students stated that the computerized fluency feedback was constructive. The complete results of
this survey item are described in Figure 8.
0 10 20 30 40 50 60 70
False StartsOrganizationNot Thinking
PronunciationNot Translation
VocabularyGrammar
ConfidenceFillers
Understandable"Good"
Native-likePauses
Speech Rate
Treatment Group
Control Group

30
Figure 8. Students’ perception of the helpfulness of the different feedback types
When asked the reason why feedback was helpful (or not), most of the students reported that
feedback was important in helping them increase in some aspects of fluency. Teacher feedback was
said to “help [them] in [their] mistakes.” One student stated that “my teacher knows me and he
know [sic] how I am. He can tell me exactly thing that I have to improve and I can talk with him
about my problems.” Another student said, “I think he [know] more than the computer and me.”
In relation to computerized feedback, one student said that “I could know my speech rate
and what part should I focus on.” Another student said that computerized feedback is “ . . . exact
and I can see the numbers and compare with a native speaker.” It is evident that even though
feedback may not have been crucial in the increase of students` fluency, it was definitely beneficial
in helping them to be more motivated in their performance of the tasks.
We were also interested in knowing whether noticing and attention were beneficial in
promoting not only an increase in fluency but also opportunities to proceduralize what was learned.
In our survey, students were asked if they reflected upon the feedback from previous assignments
when doing their weekly recordings, 96% of the participants responded that they did. Similarly, all
of the participants reported that they felt encouraged and motivated by the feedback that they
received. One student stated “ . . . feedback is good for me to guide me to know what I have to
0
20
40
60
80
Teacher Self Computerized

31
study more.” Finally, 95% of the participants stated that they would like to receive this type of
feedback in the future, stating things like, “I would like to continue it. Because it is one of the
useful practice” and “ . . . that worked, and I believe that will still work.”
Discussion of Results
In the literature review of this paper, fluent speech was defined as speech characterized by
appropriate (native like) rate and operationalization of connectedness (mean length of run) with
minimal dysfluencies (pauses, fillers, and false starts). This section will discuss how the results of
the present study determined whether or not feedback improved the fluency of students’ speech
based on this definition. This will be done by using the results and statistical analysis of the
previous section to suggest answers for each of the four principle research questions. This section
will also describe the possibility of alternative contributors to fluency improvement. In addition,
this section will discuss certain limitations experienced by the present study, as well as indicate
directions for future research.
First Research Question
The data suggested an answer to the first research question that was both interesting and
unexpected. It indicated that, for most of the measured fluency features, feedback did not
significantly contribute to an improvement in fluency performance. Both groups were shown to
improve in all of the measured fluency features (except for false starts, which will be discussed
hereafter), but for most of them (with two exceptions to be explained shortly), there was no
statistically significant difference between the treatment and control group’s progress as
measured by the pre- and post-tests. The general answer to the first question regarding
feedback’s overall contribution to fluency development would appear to be that it has very little

32
impact. Before jumping to a general conclusion regarding feedback’s effectiveness however, it is
important to examine the answer to question two.
Second Research Question
Regarding the second research question, which inquired as to which of the specific
fluency features measured was most improved by the feedback, the data yet again provided an
interesting answer. The treatment group’s improvement in the number of fillers was significantly
higher than that of the control group, and their improvement in the use of false starts was
significantly lower (their use of false starts actually increased). These are the only features that
appeared to be influenced by the feedback provided. This is definitely important to this study.
While the feedback did not appear to cause significant change for the other measured aspects of
fluency, at least for these two features there was a significant result.
The reason that the feedback appeared to be more effective in the improvement of filler
use than in the other fluency features could be a result of the nature of fillers themselves. Fillers
are very easy for learners to recognize, making it simple to promote awareness and noticing. It is
not difficult for teachers or students to identify the fillers that they use and focus on eliminating
them from their speech. This is one instance where fluency feedback was shown to be effective
in improving speech. The overuse of fillers is a very noticeable aspect of non-native or non-
fluent oral language. The fact that this particular type of feedback was useful in improving
students’ fluency for at least this one element warrants further investigation into its use in the
classroom.
The affect of feedback on the occurrence of false starts also needs to be examined further.
False starts seem to be the result of situations where students get “stuck” due to a gap in their
vocabulary or grammar abilities. As their vocabulary and grammar skills increase, they will
33
encounter this situation with less frequency. Grammar and vocabulary suggestions were not part
of the feedback. Indeed, the control and treatment groups received the same grammar and
vocabulary instructions as part of their ESL course. For some reason yet unexplained, this is an
instance where fluency feedback appears to have hindered students’ production of fluent speech
in some way.
The fact that there was an increase in false starts may not indicate a decrease in students`
oral proficiency, but rather a natural phenomenon. According to Götz (2013), self-corrections
“signals that the learner has noticed the inaccuracy of their output and they demonstrate that they
possess the necessary competence to repair that mistake” (p. 38). She also states that these self-
corrections could indicate a “rather positively evaluated speech management strategy of speech
production.” (p. 38). Lennon (1990) also states that self-repairs (principally in advanced learners)
“may involve increased ability to reformulate, monitor, and self-correct production on line” (p.
413). Therefore, self-repairs (false starts) should not be seen as a marker of dysfluency, but
rather as a natural phenomenon and an indication of the learner`s increase in oral proficiency
(Götz, 2011).
If Lennon and Götz are correct in their assertion that false starts (self-repairs or
corrections) are an indication of an increased ability to process, detect, and correct their
production in real time, the results of this study become very interesting. The fact that the
fluency feedback appears to have caused an increase in this false-start phenomenon may
demonstrate this particular feedback’s ability to increase a student’s awareness and amplify their
ability to notice certain features of their speech. While in the short term this heightened
awareness causes apparent dysfluencies, it may be a key stepping stone on the path to improved
oral proficiency. Therefore, the fact the students of the treatment group exhibited a significantly

34
higher rate of false-start production might actually be a point in favor of implementing
qualitative and quantitative fluency feedback in the classroom. This is still a complicated issue,
because students in the treatment groups were specifically instructed to avoid false starts. It is
still unclear what element of the feedback would cause them to do exactly the opposite of what
they were instructed. Perhaps the awareness that they were being evaluated and observed
heightened their anxiety about speaking correctly, contributing to their use of false starts.
Perhaps it was due to some other unexplored factor. As stated earlier, the question of false start
occurrence needs to be further examined.
Third Research Question
The answer to the third research question regarding which type of feedback (qualitative
or quantitative) was most helpful in improving fluency was similar to that of the second
question: neither, except in the case of fillers and false starts. According to the statistical analysis
comparing the results of the treatment and control groups, the feedback provided to students did
not significantly influence their improvement in speech rate, pause frequency and duration, and
mean length of run; however, they did improve in their use of fillers, and they significantly
increased their use of false starts. This is where the answer to question three gets interesting.
Students did not receive quantitative feedback for fillers and false starts, as these two features are
not measured by PRAAT. The only types of feedback given regarding these two features
specifically were the qualitative, teacher feedback and the self-assessment feedback that students
received. This indicates that of the two types of feedback given in the present study, the
qualitative feedback was the only one shown to significantly affect fluency in some way. This is
also interesting, as the participants reported a preference for qualitative feedback provided by the
teacher (as described in the next paragraphs).

35
Fourth Research Question
As described in the results section of this paper, the students’ responses on the
questionnaire were helpful in answering the fourth research question of the present study
regarding students’ perception of fluency feedback. The results described in Figure 7 of the
previous section provide a very interesting insight into the students’ understanding of what
‘fluent speech’ is. It was observed that students in the control group described a very broad range
of attributes associated with fluency (12 in all) where the students in the treatment group where
much more focused and consistent in their descriptions of fluent speech (nine attributes were
listed). If nothing else, the feedback provided by PRAAT and the teacher served to focus
students’ attention on very specific aspects of fluency. This is further evidenced by the fact that
the top three characteristics of fluency that students mentioned were among those specifically
measured by PRAAT.
As identified by the results shown in Figure 8, even though both teacher-provided and
computerized feedback were perceived to be helpful in terms of improving fluency, students in
the treatment group rated the teacher feedback as more beneficial. Perhaps students were able to
understand the feedback that was provided by the instructor better than they understood the
PRAAT feedback, which was numeric for the most part, and possibly more abstract and difficult
to interpret and apply. It is also interesting to note that while students received both types of
feedback in the same day, the teacher reported that many went straight to the qualitative
feedback.
It is interesting to note that only a very small portion of the treatment group (7%)
reported that self-assessment was helpful in improving their fluency. It is possible that these
particular students still felt very dependent on outside sources when it comes to language
36
learning. They probably still do not trust themselves to give meaningful self-evaluation. Maybe
if the same study were performed with a more advanced group of students, a different result
would have occurred.
Alternative Explanations for Fluency Improvement
Since the data showed that feedback was not a significant factor in students’ fluency
improvement (other than fillers), other factors must have played a key role. In this study we must
consider that gains in fluency may have been due to the repetition of the tasks performed every
week. It is noticeable that because students were more confident when answering the 45-second
responses (having previously performed the same task on two occasions) their speech rate
increased compared to the two-minute responses, which led to an increase in the mean length of
run, a decrease in pause length, and a slight decrease in the number of pauses. Figure 9 below
shows the fluency measurements for the three repetitions of the last task that the students
performed at the end of the semester.
Figure 9. Fluency improvement due to task repetition
Speech Rate (syllables perminute)
Number of Pauses perminute Pause Length (x10) Mean Length of Run (x10)
120 seconds 143.88 23.72 8.10 63.4090 seconds 146.26 22.35 7.90 67.4045 seconds 167.41 19.80 7.10 89.40

37
To assess whether there was any gain in fluency due to task repetition, a one-way
ANOVA was conducted for four features of fluency in this study (number of unfilled pauses per
minute, speech rate, pause length, and mean length of run). The results of these tests are showed
below.
Pauses
Similar to feedback, task repetition did not produce a statistically significant change in
the use of pauses, F(2,146) = 2.148, p = .120.
Speech Rate
The change in speech rate between the task repetitions was found to be statistically
significant, F(2,150) = 10.488, p < .001. The effect size between the first occasion (120 seconds)
and the last occasion (45 second) suggests a fairly large effect2 (d= 0.809) attributed to the
repetition of tasks. Table 3 shows the statistical analyses for significance in speech rate.
Table 3
Descriptive Statistics for Speech Rate Due to Task Repetition
Subsets for alpha = 0.05
1
2
Duration N Mean SD Mean SD 120 51 143.70 24.35
90 54 145 28.51 45 48 167.32 33.32
Sig. 0.976 1.000 Note. SD = standard deviation.
2 Cohen’s guidelines for interpreting effect sizes: (d) 0.20 = small, 0.50 = moderate, 0.80 = large.

38
Pause Length
The difference in mean pause length between task repetitions was also found to be
statistically significant F(2,146) = 3.262, p = 0.041. The effect size between the first occasion
(120 seconds) and the last occasion (45 second) suggests a small effect size (d = 0.229). The
results of this analysis are shown in Table 4.
Table 4
Descriptive Statistics for Pause Length Due to Task Repetition
Subsets for alpha = 0.05
1
2
Duration N Mean SD Mean SD 120 51 0.808 0.182 0.808 0.182 90 53 0.888 0.316 45 45 0.759 0.241
Sig. 0.604 0.262 Note. SD = standard deviation.
Mean Length of Run
Students’ improvement in mean length of run across the different task repetitions was
also found to be statistically significant, F(2,146) = 8.020, p< .001). The effect size between the
first occasion (120 seconds) and the last occasion (45 second) suggests a fairly large effect (d=
0.695), which could also be attributed to the repetition of tasks. These results are presented in
Table 5.

39
Table 5
Descriptive Statistics for Mean Length of Run Due to Task Repetition
Subsets for alpha = 0.05
1
2
Duration N Mean SD Mean SD 120 51 6.323 2.416
90 54 6.551 2.336 45 44 8.397 3.455
Sig. 0.910 1.000 Note. SD = standard deviation.
As shown by the data in Tables 3, 4, and 5, the task repetition likely led to an increase in
oral fluency. Analysis showed that there was a significant improvement between the repetitions
for speech rate, pause length, and mean length of run. These findings are in line with De Jong
(2011), where she posits that task repetition can lead to proceduralization. She supports the fact
that proceduralization “is considered a slow process that requires many encounters with the same
items” (p. 562). The use of mean length of fluent run, according to her, can be an indicator of
proceduralized language when other aspects of fluency such as mean length of pause and
phonation/time rate are combined (p. 539). She also states that “the improvement in performance
might be a reflection of the initial stages of proceduralization, in which new production rules are
formed that lead to relatively greater gains in performance” (p. 562). The current study appears
to support her findings in this regard. Repeated contact with the same item led to an
improvement in performance.
Another factor that may have contributed (more than feedback) to the increase in fluency,
was the students’ acquisition of new vocabulary. Over the course of the semester, students were
constantly learning new words through study and immersion, which led to an increase in speech
rate and mean length of run. Also, because they were living in an English-speaking environment,

40
they were able to learn and make use of formulaic expressions, (standardized phrases such as
collocations and idiomatic expressions) which, according to Gatbonton and Segalowitz (2005),
can lead to automaticity in language speaking and therefore, assist in proceduralization. As
students acquired new vocabulary, and especially formulaic sequences, it is possible that they did
not need to slow their rate of speech to the same extent in order to find the right words to express
themselves.
One important factor to consider was the fact that both the control and treatment groups
were taught by the same instructor during the two semesters. The lessons and activities were very
similar for the two groups during the semesters. Because most of the students at the highest level
of the foundations course at Brigham Young University and are getting prepared to take the
TOEFL, some of the activities in the classroom resembled the speaking section of that test. This
meant that there were many classroom activities that both groups participated in that specifically
targeted fluency development and proceduralization. At the end to the semester it was evident
that both control and treatment groups had benefitted from this practice. These practice exercises
seem to have more of an improvement in measured fluency than feedback did.
Limitations
There were several weaknesses in the procedure, which may have hindered students’
ability to use the fluency feedback. First, the feedback takes some time to generate, meaning that
students waited one week from the time of the task till they received their results, meaning that
they received feedback the day of the next recording session. This time should be cut down. This
also meant that students did not have time to internalize the feedback before they had to perform
the next set of recordings. Second, students had trouble understanding the numeric feedback
generated by PRAAT. In the future, quantitative feedback should include better explanations of

41
what each of the measurements means. In addition, greater teacher experience with this
methodology will enhance their ability to make this feedback meaningful for students. Both the
fact that the feedback was delayed and that the students had difficulty understanding it could
contribute to a lack of motivation.
Another obstacle to this type of fluency instruction had to do with the technology. The
computer’s recording device was quite sensitive, and at times it picked up the ambient classroom
noise. For example, some of the students in the laboratory may have been speaking louder than
the student making the recording, causing more than one voice to be captured simultaneously by
the computer program. In a few instances, the underlying hum of voices captured by the
recording equipment may have made it difficult for PRAAT to recognize the speaker’s pauses,
influencing both the measurement of the number of pauses and the mean length of run. These
cases were easily identified by a lack of pauses accompanied by impossibly high mean length of
run measurements in a few samples. This was inconvenient for research purposes, because some
of the individual scores had to be thrown out. It was even more inconvenient for the learners who
were unable to receive valuable feedback in some instances.
An additional weakness of the current methodology, which may have contributed to the
lack of significant findings, has to do with the way that pauses and fillers were examined. While
examining the data, the researcher was surprised to find that the analysis did not indicate a more
significant improvement in the fluency of the students’ speech. The researcher reported that their
general feeling was that the students had improved greatly, a fact that does not seem to be
reflected in the numbers. It is possible, therefore, that the features measured in the present study
are not the only, or even the strongest indicators of native-like speech.

42
The current study measured the overall number of unfilled pauses and fillers in the
students’ speech, and encouraged them to improve by reducing the number of pauses and fillers
they produced. While it is true that an overabundance of pauses and fillers is not conducive to
fluent-sounding speech, it is also important to note that truly native speech is not without pauses.
Rochester (1973) points out that fluent speech does not depend solely on the number of pauses
and fillers, but also on where they occur prosodically, something that the present study did not
account for. Maclay and Osgood (1959) explain that native speakers use fillers and pauses before
content words (verbs and nouns) and at phrase boundaries. Tavakoli (2011) further explained
that non-native speakers have a tendency to pause within clauses where native speakers pause at
clause boundaries. It is possible that although the participants in the present study continued to
use a similar number of pauses, they appeared to have more fluent speech because they were
using them in more native-like environments.
It is also important to take into account that there are a number of factors that can
influence the frequency of the fluency features measured in this study. Rochester (1973)
explained that on more difficult tasks, the speaker tends to use a much higher number of fillers
and pauses. Ejzenberg (2000) also states that high-fluency speakers make use of fillers and other
features of fluency such as formulaic speech probably because they need time to “organize their
discourse and maintain the speech flow.” (p. 308). While the tasks used in the present study were
produced in accordance with ACTFL guidelines for what students should be able to do at the
level tested, it is possible that some of the items were more challenging than others because of
the topics they required students to talk about. This could influence the number of pauses and
fillers, the speech rate, and the mean length of run, etc. of the participants. Many of the items that

43
students responded to were previously untested, and may have included difficult or unfamiliar
topics (see Appendix A for the pre- and post-test tasks).
Directions for Future Research
There are also several other directions that this research could take. Future studies could
examine variables that weren’t examined here, such as hesitations, intonation, phonation time,
articulation, etc.). Perhaps this type of feedback could also be tested in conjunction with different
types of tasks, like storytelling, simulated interviews, reading texts aloud, debates, etc. It would
also be important to examine location of pauses and fillers, as mentioned earlier, as this is a big
indicator of native-like fluency.
Regarding students’ perception of feedback and fluency instruction, perhaps different
survey items would also be useful. For example, the addition of Likert scale items could provide
interesting feedback. It would also be interesting to ask which feedback students looked to first,
or what suggestions they have for improving the instructional and testing methodology. These
changes might be helpful for better capturing students’ opinions.
Another improvement on the current study would be the investigation of a system or
program that could provide immediate feedback to the students’ tasks and test. Perhaps cutting
down on the time they have to wait would greatly increase their motivation and progress. It
would also give students more time to process and apply the feedback before performing the next
task. Also, it may be important to examine the effect of task length on fluency development.
Here, 120, 90, and 45 second durations were examined, but perhaps there are other time
allotments that would be more beneficial.
Another important direction that follow-up studies should take would be a more
quantitative look at the effects of the different types of feedback provided to learners. In the

44
present study, the most important question examined was feedback vs. no feedback. Future
studies could learn a great deal from comparing the scores of groups receiving only quantitative
feedback with those of students receiving only qualitative feedback. The current study indirectly
examined this question, but only insofar as to ask which type of feedback the students preferred.
Much could be learned from a deeper investigation on this point.
Finally, and most importantly, the fact that the feedback implemented in the present
methodology significantly influenced the use of fillers (decreasing their use) and false start
(increasing their use) is still largely unexplained. This must be investigated further. Why were
fillers decreased when other features were not? Does an improvement in this feature alone
warrant the continued use of fluency feedback in the classroom? What about the qualitative or
quantitative feedback (or both) caused students to use more false starts when they were
specifically instructed not to? Is an increase in false start use actually detrimental at this level of
proficiency? These questions must be answered before a confident recommendation for
classroom implementation of the present methodology can be made. It would also be important
to perform more longitudinal data collection to determine whether or not any changes that occur
during the procedure are lasting.
Conclusion
The primary objective of this study was to investigate the effects of qualitative and
quantitative feedback on students’ fluency development in the Foundations C course at the
English Language Center at Brigham Young University.
First, a lack of significant difference between treatment and control groups indicated that
feedback did not contribute to the students’ improvement in a significant way. While
improvement did occur for all of the tested groups, it was likely the result of the task repetition

45
that they performed. Looking closer at the effect of feedback on the specific fluency features (the
second question) the data once again showed that feedback had no significant influence on the
students’ fluency improvement, with the exception of the use of fillers and the negative
improvement in the occurrence of false starts. Students did significantly improve in the case of
filler use, and as discussed earlier, even the increase in false starts as a result of the feedback may
actually be an indicator of an increase in overall oral proficiency, if not immediately in fluency
performance. This leads to the answer for the third question, suggesting that neither of the two
types of feedback provided truly influenced students’ fluency for speech rate, pause frequency
and duration, and mean length of run, but that qualitative feedback did significantly change
students’ fluency in the case of fillers and false starts (although, here again, the increase in false
starts is not technically an immediate improvement in fluency).
The fourth question was examined differently. Survey responses provided by the students
suggested that, while the statistics did not indicate that quantitative and (other than for fillers and
false starts) qualitative feedback were useful, the qualitative feedback given by the teacher was
greatly appreciated and useful in their learning. The survey results also indicated that, for what it
is worth, the students who received fluency feedback had a more focused understanding of the
characteristics of fluent speech than the control group.
The results of this study are important, because they show that perhaps quantitative and
(to some degree) qualitative fluency feedback are not as important as previously expected.
Students were shown to develop fluency through repetitive practice. Other factors, including
high levels of exposure to native speakers and the learning of new vocabulary and formulaic
sequences may also have played a larger role in the students’ fluency development than feedback
did. Teachers should be aware of these findings, focusing their efforts on activities involving task

46
repetition for example. The types of feedback tested in the present study can be time consuming.
They are difficult to produce, and the quantitative feedback is especially difficult to explain to
students in a meaningful, applicable manner. These facts, combined with the data from this
study, perhaps would indicate that these specific forms of feedback should not be the focus of
fluency teaching methodologies. The exception to this recommendation is in the case of fillers.
There was definite fluency improvement in students’ use of fillers as a result of qualitative
feedback. Future research should be conducted to see if improvement in this one aspect of fluent
speech is enough cause for recommending the use of qualitative fluency feedback in the ESL
classroom.
References Brookhart, S. M. (2008). How to give effective feedback to your students. Alexandria, VA:
ASCD.
Brumfit, C. J. (1984). Communicative methodology in language teaching: The roles of fluency
and accuracy. Cambridge, UK: Cambridge University Press.
Bygate, M. (2001). Effect of task repetition on the structure and control of oral language. In M.
Bygate, P. Skehan, & M. Swain (Eds,), Researching pedagogic tasks, second language
learning, teaching and testing (pp. 23-48). Harlow, UK: Longman.
Carr, T. H., & Curran, T. (1994). Cognitive factors in learning about structured sequences:
Applications to syntax. Studies in Second Language Acquisition, 16, 205-230.
Chafe, W. L. 1985. Some reasons for hesitating. In D. Tannen & M. Saville-Troike (Eds.),
Perspectives on Silence (pp. 77–89). Norwood, NJ: Ablex.
Chambers, F. (1997). What do we mean by fluency? System, 25, 535–544.

47
Chaudron, C. (1977). A descriptive model of discourse in the corrective treatment of learners`
error. Language Learning, 27, 29-46.
Cohen, J. (1988). Statistical power analysis for the behavioral sciences (2nd ed.). Hillsdale, NJ:
Lawrence Erlbaum.
Crystal, D. (1987). The Cambridge Encyclopedia of Language. Cambridge UK: Cambridge
University Press.
Cucchiarini, C. S. Quantitative assessment of second language learners` fluency: Comparisions
between read and spontaneous speech. Journal of the Acoustical Society of America,
111, 2862-2873.
De Jong, N., & Perfetti, C. A. (2011). Fluency training in the ESL classroom: An experimental
study of fluency development and proceduralization. Language Learning, 61, 533-
568.
De Jong, N. H., Schoonen, R., & Hulstijn, J. (2009). Fluency in L2 is related to fluency in L1.
Paper presented at the Seventh International Symposium on Bilingualism (ISB7),
Utrecht, The Netherlands.
Ellis, Y. S. (2011). Corrective Feedback in Language Teaching (Vol. II). New York, NY:
Routledge.
Fillmore, C. J. (1979). On fluency. In D. Kempler, and W.S.Y. Wang (Eds.), Individual
differences in language ability and language behavior. New York, NY: Academic Press.
Freed, B. F. (2000). Is fluency, like beauty, in the eyes (and ears) of the beholder? In H.
Riggenbach, (Ed.), Perspectives on fluency, (pp. 243-265). Ann Arbor, MI: University of
Michigan Press.

48
Götz, S. (2013). Fluency in Native and Nonnative English Speech. Philadelphia, PA: John
Benjamins Publishing Company.
Ioup, G. B., Boustagui, E., El Tigi, M., & Moselle, M. (1994). Reexamining the critical period
hypothesis: A case study of a successful adult SLA in a naturalistic environment. Studies
in Second Language Acquisition, 16, 73-98.
Iwashita, N. M. (2008). Assessed levels of second language speaking proficiency: How distinct?
Applied Linguistics, 29, 24-49.
Koponen, M., & Riggenbach, H. (2000). Overview: Varying perspectives on fluency.
In H. Riggenbach (Ed.), Perspectives on fluency (pp. 5–24). Ann Arbor, MI: University
of Michigan Press.
Kormos, J. (2006). Speech production and second language acquisition. Mahwah, NJ:
Erlbaum.
Krashen, S. (1985). The input hypothesis: Issues and implications. London, UK: Longman.
Lennon, P. (1990). Investigating fluency in EFL: A quantitative approach. Language
Learning, 40, 387–417.
Lennon, P. (2000). The lexical element in spoken second language fluency. In H. R. Riggenbach
(Ed.), Perspectives on fluency (pp. 25-42). Ann Arbor, MI: University of Michigan Press.
Leow, R. P. (1997). Attention, awareness, and foreign language behavior. Language Learning,
47, 467-505.
Li, S. (2010). The effectiveness of corrective feedback in SLA: A meta analysis. Language
Learning, 60, 309-365.
Lynch, T. & Maclen, J. (2000). Exploring the benefits of task repetition and recycling in
classroom language learning . Language Teaching Research, 4, 221-250.

49
Lynch, T., & Maclean, J. (2001). A case of exercising: Effects of immediate task repetition on
learners’ performance. In M. Bygate, P. Skehan, & M. Swain (Eds.), Researching
pedagogic tasks: Second language learning, teaching and testing (pp.
141-162). Harlow, UK: Pearson Longman.
Mackey, A., & Goo, J. (2007). Interaction research in SLA: a meta-analysis and research
synthesis. In A. Mackey (Ed.), Conversational interaction in second language
acquisition, 407–72. Oxford, UK: Oxford University Press.
Maclay, H., & Osgood, C. E. (1959). Hesitation phenomena in spontaneous English speech.
Word, 15, 19-44.
Nagel, D. (2012, February). Fluency in a language-what does that mean exactly? Retrieved June
16, 2014, from The Mezzofanti Guild: www.mezzoguild.com/being-fluent-in-your-
target-language/
Riggenbach, H. (1991). Towards an understanding of fluency: A microanalysis of non-native
speaker conversation. Discourse Processes, 14, 423-441.
Riggenback, H., & M. Koponen. (2000). Overview: Varying perspectives on fluency. In H. R.
Riggenbach (Ed.), Perspectives on fluency (pp. 25-42). Ann Arbor, MI: University of
Michigan Press.
Rochester, S. R. (1973). The Significance of Pauses in Spontaneous Speech. Psycholinguistic
Research, 2, 51-80.
Rossiter, M. J. (2009). Perception of L2 fluency by native and non-native speakers of English.
The Canadian Modern Language Review/La Revue canadiense des langues vivantes, 65,
395-412.

50
Russell, J., & Spada, N. (2006). The effectiveness of corrective feedback for the acquisition of
L2 grammar. In J. M. Norris & L. Ortega (Eds.), Synthesizing research on language
learning and teaching (pp. 133-164). Philadelphia, PA: John Benjamins Publishing
Company.
Schachter, J. (1991). Corrective feedback in historical perspective. Second Language Research,
7, 89-102.
Schmidt, R., & Frota, S. N. (1986). Developing basic conversational ability in a second
language: A case study of an adult learner of Portuguese. In R. R. Day (Ed.), Talking to
learn: Conversation in second language acquisition (pp. 237-326). Rowley, MA:
Newbury House.
Schmidt, R. (1990). The role of consciousness in second language learning. Applied
Linguistics, 11, 129-158.
Schmidt, R. (2001). Attention. In P. Robinson (Ed.), Cognition and second language instruction
(pp. 3- 32). Cambridge, UK: Cambridge University Press.
Schmidt, R. (2010). Attention, awareness, and individual differences in language learning. In S.
C. W. M. Chan, Proceedings of CLaSIC 2010 (pp. 721-737). Singapore: National
University of Singapore, Centre for Language Studies.
Segalowitz, N. (2010). Cognitive bases of second language fluency. New York, NY: Routledge.
Swain, M. (1995). Three functions of output in second language learning. In G. Cook & B.
Seidlhofer (Eds.), Principle and practice in applied linguistics: Studies in honor of H. G.
Widdowson (pp. 125-144). Oxford, UK: Oxford University Press.
Tavakoli, P. (2011). Pausing patterns: Differences between L2 learners and native speakers.
ELT Journal, 65, 71–79.

51
Towel, R. H. (1996). The development of fluency in advanced learners of French. Applied
Linguistics, 17, 84-119.
Truscott, J. (1999). What`s wrong with oral grammar correction. The Canadian Modern
Language Review, 55, 435-455.
VanPatten, B. (1994). Evaluating the role of consciousness in second language acquisition:
Terms, linguistic features & research methodology. AILA Review, 11, 27-36.

52
APPENDIX A: Pre- and Post-Test
Form A: General Directions
This is a speaking test. There will be ten tasks for this test. Each task will require you to speak in English for between 45 seconds to 2 minutes. Read and listen to the directions for each task and give your best answer. Try to speak as naturally as possible and completely answer each question. You will be given time to prepare for each task. You will only be able to record once and you will not be able to listen to your recordings.
Good Luck!
1- 45-second task Questions Directions: For this task you will have 15 seconds to prepare you answer and 45 seconds to answer the question. Prompt: You are looking for a person to share your apartment with. Someone responds to your advertisement. Ask several questions that will help you to decide if this person will be a good roommate for you. 2- 45-second task Narration Directions: This part of the assessment will consist of a one-question task. You will have 15 seconds to prepare you answer and 45 seconds to answer the question. Prompt: Read the paragraph below and in your own words tell me what the speaker said. It is important to keep the original meaning. Use past tenses if necessary. Please tell Jeff that I`m tied up in traffic so I`m going to be about a half-hour late for the nine o`clock meeting. And ask him to bring our question about the employee benefits plan. If he wants to check in with me on my cell phone, have him call 415-338-3095. Thanks 3- 90-second task Using Language Creatively Directions: This part of the assessment will consist of a one-question task. You will have 30 seconds to prepare you answer and 90 seconds to answer the question. Prompt: Talk about your reasons and motivation for learning English in terms of short term and long terms goals..

53
4- 90-second task Description For this task compare and contrast the pictures on your screen in as much detail as you can. What is happening? Where are they? How do they feel? etc. You will have 30 seconds to prepare your response and 90 seconds to talk about the pictures.
5- 120-second task Description Directions: This part of the assessment will consist of a one-question task. You will have 45 seconds to prepare you answer and 2 minutes to answer the question. Prompt: Describe a home from your early childhood. Describe the characteristics from inside and outside the house or apartment. Compare this house to other places you have lived. What do you see when you walk in the door? What is hanging on the walls? What is the furniture like? Who is in your home? What do you feel in your home? etc. 6- 120-second task Problem Solving Directions: This part of the assessment will consist of a one-question task. You will have 45 seconds to prepare you answer and 2 minutes to answer the question. Prompt: You borrowed a friend`s car and had a slight accident. Call your friend and explain what happened, describe the damage, and offer a solution. Have you ever been in a similar situation in real life? 7- 120-second task Narration Directions: This part of the assessment will consist of a one-question task. You will have 45 seconds to prepare you answer and 2 minutes to answer the question. Prompt: Tell me a story about a time when you were traveling and there was a problem. Include details from before the problem occurred and after it was solved. What did you do to solve it? In the future, will you do something to avoid similar problems?

54
8- 90-second task Picture-cued story-telling task Directions: Tell the story that these pictures describe. You will have 30 seconds to prepare your answer and 90 seconds to describe the pictures. 9- 45-second task Description Directions: In this part of the test, you will describe the picture on your screen. Who is in the picture? What are they doing? How do they feel? etc. You will have 15 seconds to prepare your response. Then you will have 45 seconds to talk about the picture.
10- 45-second task Using Language Creatively Directions: This part of the assessment will consist of a one-question task. You will have 15 seconds to prepare you answer and 45 seconds to answer the question. Prompt: Describe an adult that affected you as child. How do you know him/her? What does this person look like? How did he/she affect your life?

55
Form B: General Directions This is a speaking test. There will be ten tasks for this test. Each task will require you to speak in English for between 45 seconds to 2 minutes. Read and listen to the directions for each task and give your best answer. Try to speak as naturally as possible and completely answer each question. You will be given time to prepare for each task. You will only be able to record once and you will not be able to listen to your recordings.
Good Luck! 1- 45-second task Questions Directions: For this task you will have 15 seconds to prepare you answer and 45 seconds to answer the question. Prompt: You are looking for a university where you can study. You visit a university in the United States and meet one of the students. Ask several questions that will help you decide if this would be a good university for you. 2- 45-second task Narration Directions: This part of the assessment will consist of a one-question task. You will have 15 seconds to prepare you answer and 45 seconds to answer the question. Prompt: Read the paragraph below and in your own words tell me what the speaker said. It is important to keep the original meaning. Use past tenses if necessary. Please tell Jenny that my doctor’s appointment was moved to this afternoon so I am not going to be able to meet her for lunch at one o’clock. If it is okay with her, we can reschedule for tomorrow. If she has any questions, could you have her call me on my cell phone at 415-338-3095? Thank you! 3- 90-second task Using Language Creatively Directions: This part of the assessment will consist of a one-question task. You will have 30 seconds to prepare you answer and 90 seconds to answer the question. Prompt: Talk about the advantages of studying at a university in terms of short term and long terms goals. Talk about your reasons and motivation for going to a university or not. 4- 90-second task Description Directions: In this part of the test, you will compare and contrast the pictures on your screen in as much detail as you can. What is happening? Where are they? How do they feel? etc. You will have 30 seconds to prepare your response. Then you will have 90 seconds to talk about the pictures.

56
5- 120-second task Description Directions: This part of the assessment will consist of a one-question task. You will have 45 seconds to prepare you answer and 2 minutes to answer the question. Make sure to speak as clearly as you can. Prompt: Describe the city where you grew up. Describe the way it looks and what is happening there. Compare it to where you live now. What are the buildings and streets like? What do the people do for work or fun? What are the people like? What do you feel when you are there? etc. 6- 120-second task Problem Solving Directions: This part of the assessment will consist of a one-question task. You will have 45 seconds to prepare you answer and 2 minutes to answer the question. Prompt: You borrowed a friend`s camera and had a slight accident. Call your friend and explain what happened, describe the damage, and offer a solution. Have you ever been in a similar situation in real life? 7- 120-second task Narration Directions: This part of the assessment will consist of a one-question task. You will have 45 seconds to prepare you answer and 2 minutes to answer the question. Prompt: Tell me a story about a time when you lost something that it was important to you. Include details from before the problem occurred and after it was solved. What did you do to solve it? In the future will you do something to avoid similar problems? 8- 90-second task Picture-cued story-telling task Directions: Tell the story that these pictures describe. You will have 45 seconds to prepare your answer and 90 seconds to describe the pictures.

57
9- 45-second task Description Directions: In this part of the test, you will describe the picture on your screen. Who is in the picture? What are they doing? How do they feel? etc. You will have 15 seconds to prepare your response. Then you will have 45 seconds to talk about the picture.
10- 45-second task Using Language Creatively Directions: This part of the assessment will consist of a one-question task. You will have 15 seconds to prepare you answer and 45 seconds to answer the question. Make sure to speak as clearly as you can. Prompt: Describe a friend from your hometown. What does he look like? What does he like to do? What do you talk about when you are together?

58
APPENDIX B: Student Fluency Log
Fluency Log
PURPOSE
The purpose of the Fluency Log is to help you improve spoken fluency and the ability to communicate and to answer questions appropriately. As you practice, you might start to notice an increase in your spoken fluency. ASSIGNMENT You will complete your Fluency Log assignment by answering three questions every week. When assessing your responses, I will measure your oral fluency by focusing on the following specific features:
• Speech Rate - how many syllables per minute you spoke. • Mean Length of Run - number of syllables between each pause or speech
disruption • Number of silent pauses – The number of silent pauses over 0.3 seconds. • Fillers- Common fillers in English are um, eh, er, ah, like, right, okay, and
you know.
The assignment will be divided into the following categories: Questions Using language creatively Description Narration Problem solving You will answer the same question three times for three consecutive weeks. The first week you will have 120 seconds to respond to the question, the second week you will answer the same question in 90 seconds, and the final week you will answer the same question in 45 seconds. You are encouraged to answer the questions as completely as possible in the time allowed. Depending on the kind of question you are asked to answer, you will have 15-45 seconds to prepare your response. Do not stop your recording at any time during the test. If you have a problem with the recording during the test, notify your teacher immediately. After you answer the questions, you will perform a self-evaluation, in which you will answer a few questions in a fluency rubric regarding your performance. Every Thursday, you will receive a teacher evaluation report regarding your performance. You should compare your self-evaluation with your teacher`s to check if your evaluation is in accordance with your teacher`s as well as check areas where you can improve. You will also receive a technology feedback. This feedback will measure features of your fluency such as: Speaking Rate, Mean Length of Run and Number of silent pauses. An example of a technology feedback is provided below. PERFORMANCE ON THIS TEST

59
Prompt Time Performance Rate Pauses/min Pause Length Mean Length of Run
A
120
Your Performance 164.85 15.99 0.61 10.00 Class Performance 127.56 21.80 0.85 6.00 Difference Native Speaker 204.28 16.98 0.65 11.69 Difference
DUE DATES Your Fluency Log is due in class every Thursday.

60
APPENDIX C: Rubric for teacher and self-evaluation
Student name__________________________________________________________________________________
Feature 1 2 3 4 Speech Rate
Speech rate is slow and hesitation is frequent throughout the entire response. The flow of speech is frequently interrupted.
Speech rate is improving. however portions of the response ares slow and hesitant. The flow of speech is often inconsistant.
Speech rate is consistent throughout response, but flow may be noticebly slower than native speech.
Speech rate is very consistent and flow is similar to native speech throughout the response.
Pauses
Pauses are frequent, long and disrupt communication of ideas.
Pauses are frequent, but short. Pauses may also disrupt communication of ideas.
Pauses although occasionally present are short. Pauses are not disruptive but they may make speech less natural.
Pauses are rare or absent and strategic to communication.
False Starts
False starts occur frequently with several repetitions at each occurrence. False starts are highly distracting to listener.
False starts occur regularly but are a single repetition at each occurrence. False starts may be distracting.
False starts occur occasionally in isolation. They are not distracting.
False starts are rare or absent. Repetition is strategic to communication.
Fillers
Fillers are frequent, repetitious and unconventional.
Fillers are frequent and repetitious but conventional although inappropriate for the level of discourse.
Fillers are infrequent and occur in isolation. Fillers are sometimes appropriate for the level of discourse.
Fillers are rare and varied and appropriate for the level of discourse.
Comments: You may want to consider the following points when commenting.
• Some particularly good aspects about the task. • Comparison to past performance. • Characteristics other people would notice about the speech. • Goals set before the task. • Analyses about whether these goals were met. • Some areas that could be improved about the task.

61
Teacher Feedback Prompt C – Teacher Feedback 2 Minutes – Week 2 Feature 1 2 3 4 False Starts Pauses Fillers Speech Rate Comments: 90 Seconds – Week 3 Feature 1 2 3 4 False Starts Pauses Fillers Speech Rate Comments: 45 Seconds – Week 4 Feature 1 2 3 4 False Starts Pauses Fillers Speech Rate Comments:

62
Student Self-Assessment
Prompt C – Student Self-Assessment 2 Minutes – Week 2 Feature 1 2 3 4 False Starts Pauses Fillers Speech Rate Comments: 90 Seconds – Week 3 Feature 1 2 3 4 False Starts Pauses Fillers Speech Rate Comments: 45 Seconds – Week 4 Feature 1 2 3 4 False Starts Pauses Fillers Speech Rate Comments:
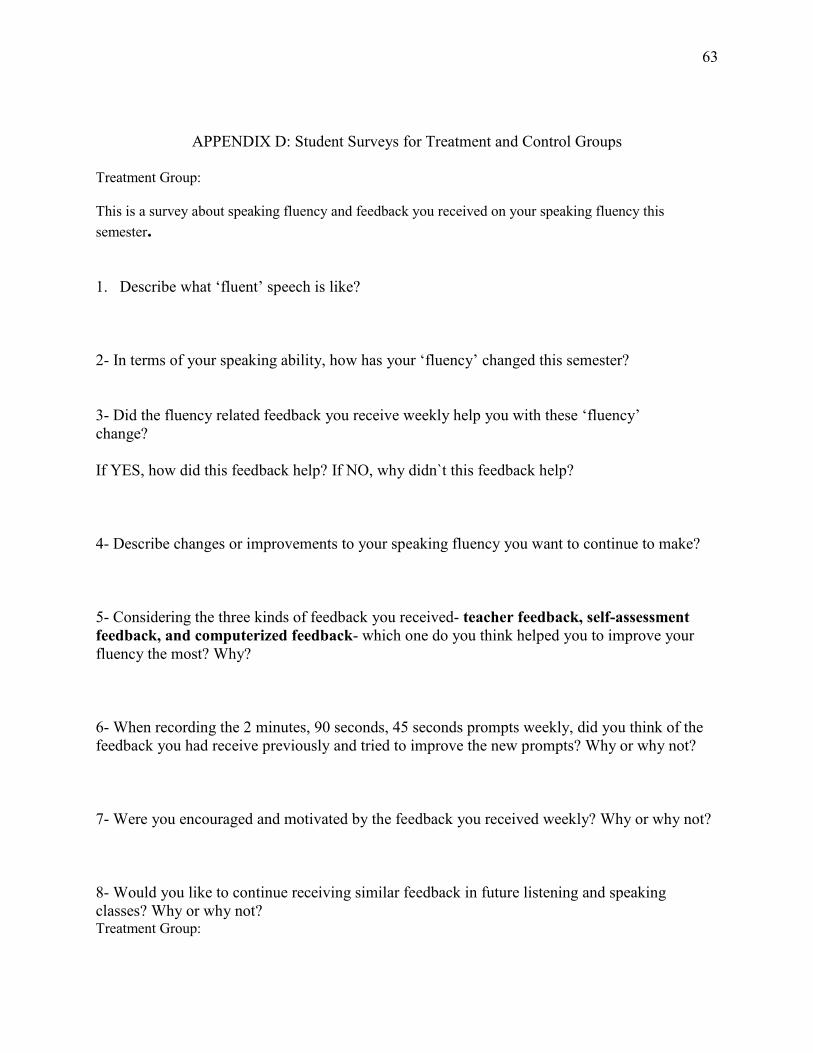
63
APPENDIX D: Student Surveys for Treatment and Control Groups
Treatment Group: This is a survey about speaking fluency and feedback you received on your speaking fluency this semester. 1. Describe what ‘fluent’ speech is like? 2- In terms of your speaking ability, how has your ‘fluency’ changed this semester? 3- Did the fluency related feedback you receive weekly help you with these ‘fluency’ change? If YES, how did this feedback help? If NO, why didn`t this feedback help? 4- Describe changes or improvements to your speaking fluency you want to continue to make? 5- Considering the three kinds of feedback you received- teacher feedback, self-assessment feedback, and computerized feedback- which one do you think helped you to improve your fluency the most? Why? 6- When recording the 2 minutes, 90 seconds, 45 seconds prompts weekly, did you think of the feedback you had receive previously and tried to improve the new prompts? Why or why not? 7- Were you encouraged and motivated by the feedback you received weekly? Why or why not? 8- Would you like to continue receiving similar feedback in future listening and speaking classes? Why or why not? Treatment Group:

64
This is a survey about speaking fluency and feedback you received on your speaking fluency this semester. 1. Describe what ‘fluent’ speech is like? 2- In terms of your speaking ability, how has your ‘fluency’ changed this semester? 3- Did the 2 minutes, 90 seconds, 45 seconds prompts you record weekly helped you improve your speaking ability? Yes______ No________ If YES how did this help, If NO Why didn’t this help? 4- Describe changes or improvements to your speaking fluency you want to continue to make? 6- When recording the 2 minutes, 90 seconds, 45 seconds prompts weekly, did you think of the previous recordings and tried to improve the new prompts? Yes________ No ________ 7- Were you encouraged and motivated by doing these kinds of recordings weekly? Yes________ No ________ If YES Why were you encouraged and motivated? If NO why weren`t you encouraged and motivated? 8- Would you like to continue performing these types of tasks in future listening and speaking classes? Yes________ No ________ Why or why not?