Embed Size (px)
Citation preview

ST. MARY’S UNIVERSTY
SCHOOL OF GRADUATE STUDIES
INTERNAL SUPPLY CHAIN PERFORMANCE ANALYSIS OF
ETHIO TELECOM
BY
AFERA MULUADAM KEBEDE
MARCH, 2014
ADDIS ABABA, ETHIOPIA

INTERNAL SUPPLY CHAIN PERFORMANCE ANALYSIS OF
ETHIO TELECOM
BY
AFERA MULUADAM KEBEDE
ID №: SGS/0042/2004B
A THESIS SUBMITTED TO ST.MARY’S UNIVERSITY, SCHOOL OF
GRADUATE STUDIES IN PARTIAL FULFILLMENT OF THE
REQUIREMENTS FOR THE DEGREE OF MASTER OF BUSINESS
ADMINISTRATION (GENERAL)
MARCH, 2014
ADDIS ABABA, ETHIOPIA

ST. MARY’S UNIVERSTY
SCHOOL OF GRADUATE STUDIES
FACULTY OF BUSINESS
INTERNAL SUPPLY CHAIN PERFORMANCE ANALYSIS OF
ETHIO TELECOM
BY
AFERA MULUADAM KEBEDE
ID №: SGS/0042/2004B
APPROVED BY BOARD OF EXAMINERS
___________________________ ___________________
Dean, Graduate Studies Signature & Date
___________________________ ___________________
Advisor Signature & Date
___________________________ ___________________
External Examiner Signature & Date
___________________________ ___________________
Internal Examiner Signature & Date

DECLARATION
I, the undersigned, declare that this thesis is my original work, prepared under the guidance of
Matewos Ensermu (PhD). All sources of materials used for the thesis have been duly
acknowledged. I further confirm that the thesis has not been submitted either in part or in full to
any other higher learning institution for the purpose of earning any degree.
Afera Muluadam Kebede ______________________
Name Signature & Date

ENDORSEMENT
This thesis has been submitted to St. Mary’s University, School of Graduate Studies for
examination with my approval as a university advisor.
Matewos Ensermu (PhD) ______________________
Advisor Signature & Date

i
Table of contents
Acknowledgement .............................................................................................................................. iii
List of Abbreviations and Acronyms ............................................................................................... iv
List of figures ...................................................................................................................................... v
List of Tables ....................................................................................................................................... v
Abstract .............................................................................................................................................. vi
CHAPTER I: INTRODUCTION ...................................................................................................... 1
1.1. Background of the study ..................................................................................................... 1
1.2. Background of the company ............................................................................................... 3
1.3. Statement of the problem .................................................................................................... 4
1.4. Objective of the study .......................................................................................................... 5
1.5. Significance of the study ...................................................................................................... 6
1.6. Definition of terms ............................................................................................................... 6
1.7. Scope of the Study ................................................................................................................ 7
1.8. Organization of the study .................................................................................................... 7
CHAPTER II: LITRATURE REVIEW ........................................................................................... 9
2.1. Theoretical Literature ......................................................................................................... 9
2.2. Performance Measures in Supply Chain ......................................................................... 14
2.3. PMS ..................................................................................................................................... 16
2.4. SCOR model ....................................................................................................................... 16
CHAPTER III: RESEARCH METHODOLOGY ........................................................................ 19
3.1. Research study area ........................................................................................................... 19
3.2. Research design .................................................................................................................. 19
3.3. Sample size and Sampling techniques .............................................................................. 20
3.4. Method of data collection .................................................................................................. 21

ii
3.5. Data processing / analysis .................................................................................................. 21
3.6. Framework development................................................................................................... 22
3.7. Ethical consideration ......................................................................................................... 23
CHAPTER IV: DATA ANALYSIS AND FINDINGS .................................................................. 24
4.1. Data analysis ....................................................................................................................... 24
4.2. Discussion............................................................................................................................ 32
4.2.1. Planning performance ................................................................................................ 32
4.2.2. Sourcing performance ................................................................................................ 33
4.2.3. Delivery performance ................................................................................................. 35
4.3. Summary of findings.......................................................................................................... 36
CHAPTER V: CONCLUSIONS AND RECOMMENDATIONS................................................ 38
5.1. Conclusions ......................................................................................................................... 38
5.2. Limitation of the study ...................................................................................................... 39
5.3. Recommendations .............................................................................................................. 39
References .......................................................................................................................................... 41
Appendix……………………………………………………………………………………..……. 43
Interview questions......................................................................................................................…...44
Questioner……………...……………………………………………………………………………49
Declaration
Endorsement

iii
Acknowledgement
First and foremost, the lord our God, the almighty lord of hosts and of the world, glory to
be to him for his eternal support and cherish. My supportive Supervisor, Matiwos Ensermu
deserves my special thanks for everything especially for his commitment to share everything
that he has with me. Those employees, who didn’t hesitate to fill up the questionnaire in spite of
their busy schedule and work time deserve a special mention here without whose contribution
and cooperation, Friends and families who support in my whole career development.
Thanks All!!!
Afera M.

iv
List of Abbreviations and Acronyms
ERP Enterprise Resource Planning
SCM Supply Chain Management
SLA Service Level Agreement
OLA Organizational Level Agreement
SCOR Supply Chain Operation Reference
ERCA Ethiopian Revenue Custom Authority
EAL Ethiopian Airlines
PMS Performance Management Systems
BSC Balanced Scorecard
ABC Activity Based Costing
DRP Distribution Requirements Planning
OD Overall delivery performance
OS Overall sourcing performance
OP Overall planning performance
OSP Overall internal supply chain performance

v
List of figures
Supply chain flow…………………………………………….19
Internal supply chain measurement framework…………...27
Work experience……………………………………………...31
List of Tables
General Information.………………………………………..23
Reliability analysis…………………………………………...25
Planning performance……………………………………….27
Sourcing performance……………………………………….29
Delivery performance………………………………………..31
Correlations…………………………………………………..32
vi
Abstract
The purpose of the paper is to analyze the internal supply chain performance of ethio telecom, with
specific reference of the supply chain operation reference model. Quantitative, survey based
research was carried out with in supply chain department of Ethio telecom. In addition the study was
dedicated to look over the relationship between plan, source and deliver with the overall
performance of the company. Empirical results indicate a strong and positive statistical relationship
between supply chain performance and three processes of SCOR model. The study indicates
unsatisfactory internal supply chain performance of ethio telecom. Finally the researcher suggest
ethio telecom to owe standardized framework to measure its supply chain performance and the
researcher developed the framework presented herein, in hopes that it would stimulate more interest
in this important area.

1
CHAPTER I
INTRODUCTION
1.1. Background of the study
In a highly competitive market, all organizations strive to improve their product quality, to
reduce their product and service cost, and to shorten their product delivery and response time to
the market. With the emergence of a new business partnership and the information revolution,
“Supply Chain Management” concept is made possible as a conventional management tool
(Mohammad Ali¹, 2012). To search for the better answer of satisfying customer demands in the
face of fierce global competition, companies have experienced dramatic changes in the way
they operate. For more than a decade, companies have reengineered and restructured in an effort
to improve efficiency and meet customer expectations. The goal is to develop value-added
processes that deliver innovative, high-quality, low-cost products on time with shorter
development cycles and greater responsiveness, to supply a quality product to customers at an
affordable cost and to increase the profit margin for investors and shareholders. Development of
cross-functional teams aligns organizations with process oriented structure, which is much
needed to realize a smooth flow of resources in a supply chain, such teams promote improved
supply chain effectiveness, and such teams promote improved supply chain effectiveness (Trent
and Monczka 1994). Supply Chain Management is key for achieving sustainable business
results, According to Deloitte research, best companies are 50%-100% more productive
enjoying a 5%-10% cost advantage compared to competition. (http://www.deloitte.com as of
10/12/2013)
The supply chain management has been accepted as an alternative to meet the stated goals and
to improve the competitive power. SCM became a general and strategic concept of dealing with
efficient logistics and network collaboration with business partners. The concept of supply
chain management (SCM), according to Thomas and Griffin (1996) represents the most
advanced state in the evolutionary development of purchasing, procurement and other supply
chain activities.
A supply chain may be defined as an integrated process wherein a number of various business
entities (i.e., suppliers, manufacturers, distributors, and retailers) work together in an effort to:
(1) acquire raw materials, (2) convert these raw materials into specified final products, and (3)

2
deliver these final products to retailers (Seruga2, 2011). This chain is traditionally characterized
by a forward flow of materials and a backward flow of information. For years, researchers and
practitioners have primarily investigated the various processes of the supply chain individually.
Recently, however, there has been increasing attention placed on the performance, design, and
analysis of the supply chain as a whole.
Internal supply chain refers to the chain of activities or functions within a company that results in
providing a product/service to the customer. Integration of these functions involves the holistic
performance of activities across departmental boundaries. (Basnet, 2013)
The central roles of these internal supply chain performance measurement systems are
highlighted by Chen (2006) as measuring the performance of business processes, measuring the
effects of the companies’ strategies and plans, diagnosing of problems, supporting decision-
making, motivating improvements and supporting communication within a company.
Ethio telecom internal Supply chain management includes many tasks today such as purchasing,
payment flow, material handling, production planning and control logistics and warehousing,
inventory control and distribution and delivery by using ERP software.
This study is designed to analyze the internal supply chain performance of ethio telecom, and to
develop a framework that supports effective management of ethio telecom supply chains which
can be viewed as an alternative to improve supply chain performance of the company.
Developing an efficient supply chain does not only help companies reduce costs but also deliver
better services to the customers while maintaining the quality of the products with the global
standard. In order to fulfill research objective, the KPI’s of SCOR (supply chain operation
reference) model will be employed with the identification of key performance indicators
(KPI/Metrics) of telecom companies supply chains. The aim of SCOR is to provide a standard
way to measure Supply chain performance and to use common metrics to benchmark against
other organizations according to (Christopher, 1998).
The toolbox of the SCOR-Model also offers predefined KPI-metrics for performance
measurement. In general, such an analysis enables best practice companies to understand the
value contribution of each internal and external business process involved, as well as their value
tradeoffs systematically.

3
1.2. Background of the company
The introduction of telecommunication in Ethiopia dates back to 1884. Ethiopian
Telecommunication Corporation is the oldest public telecommunications operator in Africa. In
those years, the technological scheme contributed to the integration of the Ethiopian society
when the extensive open wire line system was laid out linking the capital with all the important
administrative cities of the country. After the end of the war against Italy, during which
telecommunication network was destroyed, Ethiopia re-organized the telephone, telegraph and
postal services in 1941 (Company Profile, 2010).
According to same cite, originally a division of the Ministry of Post, Telephone and Telegraph,
what would become the ETC was established as the Imperial Board of Telecommunications of
Ethiopia (IBTE) by proclamation No. 131/52 in 1952. Under the DERG Regime, the IBTE was
reorganized as the Ethiopian Telecommunications Service on October 1975, which was in turn
reorganized on January 1981 as the Ethiopian Telecommunications Authority. On November
1996, the Ethiopian Telecommunications Authority became ETC by Council of Ministers
regulation No. 10/1996. The subsequent Proclamation 49/1996 expanded the ETC's duties and
responsibilities. For its international traffic links and communication services, ETC mainly uses
its earth station at Sululta which transmits and receives to both Indian Ocean and the Atlantic
Ocean satellites.
In late 2006, the ETC signed an agreement worth US$1.5 billion with three Chinese
companies, ZTE Corporation, Huawei Technologies and the Chinese International
Telecommunication Construction Corporation, to upgrade and expand Ethiopian
telecommunications services. This agreement increases the number of mobile services from 1.5
million to 7 million, land line telephone services from 1 million to 4 million, and expansion of
the fiber optic network, from the 4,000 kilometers to 10,000 by 2010. It is part of a larger US$
2.4 billion plan by the Ethiopian government to
France Telecom (Orange), the French telecom company, had taken over the management of the
Country’s sole telecom provider, Ethiopian Telecommunications Corporation, as of December
2, 2011 up to December 1, 2013. Orange was managed ethio telecom for two years before

4
leaving the job back to Ethiopians. Ethio-telecom has 12 divisions. These divisions are namely;
finance, legal, human resource, sourcing and facilities, residential marketing and sales,
customer services, enterprises, internal audit, Program Management Office/security/public
relation, quality and process, information system, and network divisions. Each division has its
own chief officer.
Ethio telecom’s network coverage and type of services rendered are increasing from time to
time. The same is true for its revenue. The annual gross profit growth rate is showing an
increase from year to year.
Procurement, material planning, material shipping and warehousing had been undertaken in the
former ETC from the introduction up to know. However, managing this activities in an
organized supply chain is very recent history; not more than 7 years. In the last five years ethio
telecom extends its effort in to more organized supply chain and implement ERP system. The
main objective this study is to analyze the implemented supply chain performance using SCOR
model three processes that are appropriate for ethio telecom internal supply chain.
1.3. Statement of the problem
In the present day business is ridiculous without telecommunication technologies and this
technology is highly hot-blooded to change in a short period of time. Unless and otherwise
applying efficient and effective supply chain companies like ethio telecom may simply failed to
go hand in hand with this rapidly changing environment. Because this highly changing
environment telecom companies including ethio telecom demands efficient and continuously
improving supply chain now than ever.
Ethio telecom had tried to organize its supply chain using ERP (enterprise resource planning)
system. However the performance had never been analyzed and measured using scientific
measurement. “You cannot improve what you cannot measure” (Wisner, 2005).
By today ethio telecom is actively promoting the further modernization and expansion of the
telecom infrastructure for instance ethio telecom sign 1.6 billion USD vendor financing
agreement with two china telecom companies. This mega project will come up with huge
inventories of different telecommunication equipment. The current project and the overall

5
operation demands high level of efficiency of internal supply chain. However, the company’s
internal supply chain is not believed at this level of maturity. After transformation ethio telecom
strongy working to integrate its functional departments and it is supposed that there is slight
improvement. When reengeenering was made on the supply chian the aim was to incerease the
supply chain management efficiency. However, there is a gap between what was expected and
what is actually at hand. To narrow-down this gap the company must improve its supply chain
efficiency in sustaiable manner. To do so, first the level of performance should be measured
well.
Even if the company implement ERP system to integerate the performance of planing,
sourcing,delivering and returning comercial, network and statioonery materials is still
inefficient. Because of improper planning user departments couldn’t find materials. There is a
tendency of improper material utilization and in accurate forcasting
The supply chain department is responsible to source materials from external and internal
suppliers.sourcing performance still remains with high procurement cost an difficulty of
sourcing materials as per the specification. In addtion ethio telecom facing with the problem of
on time shipment and quality at delivery.
To improve the supply chain performance of the company, there should be a standardized
framwork to measure its internal supply chain that is belived to be appropriate to the company
by company’s experts of in the area.
1.4. Objective of the study
The main objective of this study were to analyze the internal supply chain performance of Ethio
telecom by using three processes of SCOR model. More specifically, to attain the following
objectives:
To develop a framework for facilitation of the standard supply chain performance analysis
telecom company.
Using the frame work the following questions were be addressed:
How is the supply chain efficiency of the company in planning commercial, network
and stationery items?

6
How is the supply chain efficiency of the company in sourcing commercial, network
and stationery items?
How is the supply chain efficiency of the company in delivering commercial,
network and stationery items?
How the above three processes impacts the overall supply chain efficiency?
1.5. Significance of the study
Given the extreme competition in the global industry, measuring and integrating their supply
chain became essential for organizations in order to succeed, to gain maintainable very
competitive advantage. To do so the material and information flow efficiency among functional
business units in the company must be analyzed. This study were tried to play an important role
in analyzing the supply chain performance of ethio telecom. At the end, the researcher were
designed standardized framwork to measure its internal supply chain that is belived to be
appropriate to the company by company’s experts of in the area. Aframework that intiate the
company’s experts to improve it for the better use of the company. Furthermore the researcher
tried to locate the level of performance of the copany to enable the company to have
information where they are.
1.6. Definition of terms
Supply chain: A supply chain is broadly defined as all of the linked individual organizations
that, by direct or indirect means, lead to the delivery of a service or a good to a customer
(Meindl, 2004).
Supply chain management: SCM is defined as the integration of key business processes from
end user through original suppliers that provide products, services, and information and hence
add value for customers and other stakeholders (Lambert, 1998).
Internal supply chain: refers to the chain of activities or functions within a company that
results in providing a product to the customer. Integration of these functions involves the
holistic performance of activities across departmental boundaries. (Basnet, 2013)
Supply chain performance: the performance of the various processes included within the firm’s
supply chain function.

7
Ethio telecom: sole telecommunication company in Ethiopia.
Commercial items: refers to category of materials including Voucher card, SIM card, EVDO,
Mobile apparatus etc.
Network Items: refers to category of materials including Cables, ADSL modems, Aironet
devices, Network card etc.
Stationery items: refers to category of materials including Paper, pen, etc.
ERP systems: are the software infrastructure that facilitates the flow of information between all
functions in a company (e.g., manufacturing, finance, HR, sales and marketing, logistics and
procurement).
1.7. Scope of the Study
Supply Chain Management has a wide scope and includes a lot of theories about how to set up
the chain. The thesis were not going into details regarding everything included in the term
Supply Chain Management. The aim for this study were only to analyze the internal supply
chain performance and give a view of methods that can be used to evaluate if internal supply
chain is efficient or not through adopting SCOR model three processes out of five.
1.8. Organization of the study
This study shall be categorized in five chapters. The first chapter shows the general background
of the study, business facts of the organization, defining the research problem, objective,
significance, and scope of the study. Then the second chapter is followed which reviews both
theoretical framework and empirical literatures related to the area. The third chapter shall talk
about research methodology that the researcher were used. Followed by this the fourth chapter
which the data analysis and findings shall done. And the final chapter which is chapter five
contain conclusions and possible recommendation.

9
CHAPTER II
LITRATURE REVIEW
2.1. Theoretical Literature
A competitive firm has to have the ability to acquire the goods and services it needs just when
and where it needs them, at a favorable price, and with acceptable payment an delivery terms.
A competitive firm needs to directly manage the flow of goods through its distribution
networks in a cost-effective manner (Chen, 2004).
Effective supply chain management (SCM) has become a potentially valuable way of
securing competitive advantage and improving organizational performance since competition
is no longer between organizations, but among supply chains. Baharanchi (2009) discuss
integration would enable the value creation and transfer process, right from the supplier to the
end customer to operate as a seamless chain along which information, knowledge, equipment
and physical assets flow as if water. Seamless flow of physical and non-physical assets
amongst companies would lead to pooling synergy and optimization of tangible and
intangible assets that could possibly led to gain competitive advantage. According to Suhong
et al. (2004), the findings of their research on the impact of supply chain management
practices on competitive advantage and organizational performance indicate that higher levels
of SCM practice can lead to enhanced competitive advantage and improved organizational
performance.
A supply chain is broadly defined as all of the linked individual organizations that, by direct
or indirect means, lead to the delivery of a service or a good to a customer (Meindl, 2004). A
supply chain may be defined as an integrated process wherein a number of various business
entities (i.e., suppliers, manufacturers, distributors, and retailers) work together in an effort to:
(1) acquire raw materials, (2) convert these raw materials into specified final products, and (3)
deliver these final products to retailers. (Beamon, 1998)
SCM is defined as the integration of key business processes from end user through original
suppliers that provide products, services, and information and hence add value for customers
and other stakeholders (Lambert, 1998). The concepts of supply chain design and

10
management have become a popular business paradigm in these days. Supply chain
management emphasizes the overall and long-term benefit of all parties on the chain through
co-operation and information sharing. This signifies the importance of communication and the
application of IT in SCM. Information sharing between members of a supply chain using EDI
technology should be increased to reduce uncertainty and enhance shipment performance of
suppliers and greatly improve the performance of the supply chain system (Srinivasan, 1994).
Supply chain management refers to a situation where the buyer (or the buyer and its suppliers
jointly) proactively seeks to drive performance improvement in value for money throughout
the totality of a supply chain (Andrew cox, 2003).
In a supply chain world, suppliers, finished goods producers, service providers, and retailers
are required to create and deliver the best products and services possible. Collaboration
enables a company to do exceptionally well a few things for which it has unique advantages.
Other activities are shifted to channel members that possess superior capabilities. However,
there are several underlying themes. Outstanding supply chain companies stay customer-
centric, focus on process management, invest in IT as a capability enabler, and are obsessed
with performance measurement. Supply chain management is the collaborative design and
management of seamless value-added processes to meet the real needs of the end customer.
The development and integration of people and technological resources as well as the
coordinated management of materials, information and financial flows are critical to
successful supply chain integration. The primary of SCM is to establish unique value-added
processes that satisfy customers better and more efficiently than the competition. Managing
outstanding processes across functional and organizational boundaries require dramatic and
often painful changes in both thinking and behavior.
In the supply chain literature, attempts to define supply chain performance have been rare.
Srinivasan (2011) defined supply chain performance for a firm as the performance of the
various processes included within the firm’s supply chain function.
Performance measurement (as promoted in the literature and practised in leading companies)
refers to the use of a multi-dimensional set of performance measures. The set of measures is

11
multi-dimensional as it includes both financial and non-financial measures, it includes both
internal and external measures of performance and it often includes both measures which
quantify what has been achieved as well as measures which are used to help predict the
future.(Neely,2003)
Performance measurement cannot be done in isolation. Performance measurement is only
relevant within a reference framework against which the efficiency and effectiveness of action
can be judged. In the past, performance measurement has been criticized for judging
performance against the wrong frame of reference and now there is widespread support for
the belief that performance measures should be developed from strategy. Performance
measurement has an impact on the environment in which it operates. Starting to measure,
deciding what to measure, how to measure and what the targets will be, are all acts which
influence individuals and groups within the organization. Once measurement has started, the
performance review will have consequences, as will the actions agreed upon as a result of that
review. Performance measurement, is therefore, an integral part of the management planning
and control system of the organization being measured. Performance measurement is now
being used to assess the impact of actions on the stakeholders of the organization whose
performance is being measured. Although this can be considered ‘as quantifying the
efficiency and effectiveness of action’, in the case of measuring the impact of the
organization’s performance on customer satisfaction, it is not as obvious in the cases of
measuring the impact of the Organization’s actions and performance on employee satisfaction
or local community satisfaction. (Neely, 2003)
Studies have investigated supply chain performance in several dimensions and perspectives. It
is evident that as a supply chain is a network of several organizations; hence working in
collaboration is essential for optimal performance. There are several constituents that affect
the collaboration potential of a supply chain and any unmeasured changes in these can have
adverse effects on performance. This evolution of PMS illustrates the shift to the long-term
approach of innovative PMS over the short-term, traditional PMS. In this sense, companies
are becoming more aware that value means much more than cost efficiency and being profit
oriented. Moreover, evaluating performance on only financial indicators points to results and

12
does not consider its determinants, providing a myopic approach for long-term results.
(McCormack, 2008)
Within the recent developments of performance measurement systems, mainly related to the
processes in the supply chain, supply chain operation reference model (SCOR) has gained
increasing visibility in business and academic communities as an approach, which moves
toward innovative PMS. By offering a standardize way of viewing the supply chain, the
SCOR model has also contributed to the development and evolution of different supply chain
maturity models which take an innovative PMS perspective. (McCormack, 2008)
The traditional supply chain was normally driven by manufacturers who managed and
controlled the pace at which products were developed, manufactured and distributed
(Stewart, 1997). Generally, the efficiency is measured by taking the ratio of revenue over the
total supply chain operational costs. However, in recent years, new trends have emerged in
the efficiency measurement, where, customers have increasing demands on manufacturers
for quick order fulfillment and fast delivery. This has made the supply chain efficiency
difficult to be measured (Stewart, 1997). In addition to the usual financial measures, the
supply chain performance needs to take into consideration other specific indicators such as
the delivery rate and percentage of order fulfillment. This measurement is further
complicated by the influence of manufacturing capacity and other influential operational
constraints. In view of the increasing performance measures in supply chain, not many
companies will know how to gauge the performance of their supply chain.
Companies thereby need to continuously improve their processes by redesigning processes
and products, by sharing knowledge between the supply chain partners, by continuously
improving the information flows, and by exploring new threats or substitutes affecting the
value delivered to the customer (Brewer & Speh, 2000). To do so the performance should be
analyzed and measured.
Lambert and Pohlen (2001) state that in most cases articles about supply chain metrics mainly
consider internal logistics performance measures. In order to understand the problems and
challenges of performance measurement in supply chains it is therefore significant to separate

13
internal and external performance measurement. The internal performance measurement
mainly focuses on the value chain or logistics supply chain within a single company with its
operational functions sourcing, inbound storage/transportation, operations, outbound
storage/transportation and consumer distribution (Langley, 2003), while the external
performance measurement has an emphasis on measuring the performance of the efficient
and effective flows of material/products, services, information and financials from the
supplier’s supplier through various organizations/ companies out to the customer’s customer
(Coyle et al., 2003). In the current research an attempt was made to evaluate the internal
supply chain performance of ethio telecom.
Internal supply chain refers to the chain of activities or functions within a company that
results in providing a product to the customer. Integration of these functions involves the
holistic performance of activities across departmental boundaries. (Basnet, 2013).according to
(Mohammed, 2008) internal supply chain concerned with the flow of goods. This includes
transportation, Warehousing and storage, inventory management, packaging and returns good
handling.
The central roles of these internal supply chain performance measurement systems are
highlighted by Chan (2006) as measuring the performance of business processes, measuring
the effects of the companies’ strategies and plans, diagnosing of problems, supporting
decision-making, motivating improvements and supporting communication within a
company.
Furthermore, Chan (2006) criticized such traditional roles of performance measurement as
short-term and finance oriented, lacking strategic relevance, strong internal focus, avoiding
overall improvements, inconsistent measures and the quantification of performance in
numbers.

14
Fig 2.1. Supply chain Flow_____________________
Source: http://www.ibimapublishing.com/journals/ 15/11/2013
In an effort to improve internal supply chain performance organizations used different
information technology based systems like enterprise resource planning/ERP/. ERP
(Enterprise Resource Planning) software is the internal technological hub of the organization.
It is used to support existing business strategies and provides the company with the flexibility
required to improve customer responsiveness (the demand-side) and to better manage
production needs, inventory and the procurement of inputs (the supply-side). It is also the
ultimate tool for allocating scarce resources. Using ERP, a company can create a new
information foundation (that is organized, consistent, codified and standardized) by replacing
the existing diverse legacy systems. Essentially, ERP systems are the software infrastructure
that facilitates the flow of information between all functions in a company (e.g.,
manufacturing, finance, HR, sales and marketing, logistics and procurement). (Andrew cox,
2003).
2.2. Performance Measures in Supply Chain
Last few decades has seen an increasing stress on obtaining optimal performance in the
supply chain regime. In this context, managing supply chain operations effectively and
efficiently has served for the success of firms. Accordingly, the importance of various
supply chain performance metrics has been repeatedly underscored. All these have formed
the platform to establish appropriate measure of supply chain performance has long been
highlighted. The analysis of literature in the area of supply chain performance shows that

15
different researchers have presented different metrics and measures to capture supply chain
performance. However, there has been no consensus on measuring supply chain
performance and each measure has its own benefits and drawbacks. In recent times,
researchers have attempted to respond to these limitations by designing systemic and
balanced performance measurements systems.
In the realm of performance measures, few attempts have been made to systematically
classify the measures for evaluating the performance of supply chains. Moreover, there is
disagreement over the most appropriate way to categories them. For example, they have
been grouped according to: Whether they are qualitative or quantitative. What they measure:
cost and non-cost (Mandal, 2012)
Thus there exists great ambiguity among decision makers and practitioners regarding the
usage of performance metrics in supply chain performance evaluation. To address this
problem, some researchers have used Balanced Scorecard (BSC) and Activity Based Costing
(ABC) methods to evaluate supply chain performance (Liberatore, 1998). Other researchers
have also proposed similar balanced frameworks, such as Performance Measurement Matrix,
results-determinants framework, performance pyramid, etc.(Neely,2005).
Perhaps the most well-known of these is the supply chain operations reference (SCOR) model
alluded to earlier. This was developed by the Supply Chain Council in 1997 and has been
described as a “systematic approach for identifying, evaluating and monitoring supply chain
performance” (Stephens, 2001). It rests on the principle that a balanced approach is crucial;
single indicators (e.g. cost or time) cannot be adequately taken to measure supply chain
performance, which must be measured at multiple levels(Shepherd & Gunter,2006). The
SCOR model is a business process reference model. It provides a framework that includes SC
business processes, performance metrics, best practices, and people features. In the SCOR
model the metrics are linked with five management processes: plan, source, make, deliver,
and return. (Supply-Chain Council 2010).
Performance measurement provides information for management and decision makers,
enable identifying the success and potential of management strategies and facilitating the
16
understanding of the situation. In addition performance measurement assists in directing
management attention, revising company goals, and re-engineering business processes. SC
performance measurement is helpful in the continuous improvement of SCM. (Chan 2003)
2.3. Performance measurement systems (PMS)
Performance measurement systems are evolving from a system based on measurement and
cost control, referred to as traditional PMS, to a system based on the measurement and
creation of value using non-cost performance measures, those that are not economic or
explicitly financial, referred to as innovative PMS (De Toni and Tonchia, 2001). Table I
highlights examples of these two approaches.
This evolution of PMS illustrates the shift to the long-term approach of innovative PMS
over the short-term, traditional PMS. In this sense, companies are becoming more aware that
value means much more than cost efficiency and being profit oriented. Moreover, evaluating
performance on only financial indicators points to results and does not consider its
determinants, providing a myopic approach for long-term results.
Within the recent developments of performance measurement systems, mainly related to the
processes in the supply chain, supply chain operation reference model (SCOR) has gained
increasing visibility in business and academic communities as an approach, which moves
toward innovative PMS. By offering a standardize way of viewing the supply chain, the
SCOR model has also contributed to the
2.4. SCOR model
Even if there are plenty of models used to measure supply chain performance to meet the
objective of this research were to analyze the supply chain performance of ethio telecom
using planning, sourcing and delivery processes from SCOR model were used.
In 1996 the Supply Chain Council defined the Supply Chain operation Reference (SCOR)
model, defining five processes: Plan, Source, Make, Deliver and return that operated in three
channels Suppliers, firm and customers (Ronald, Stephan & Ashok, 2000). The SCOR Model

17
is used as a supply chain improvement tool by notable successful firms such as Intel, IBM, &
3M (Wisner et al., 2005). Poluha (2007) details the five processes of the SCOR Method:
Plan: processes that adjust the expected resource need to the expected demand conditions.
Source: Processes that procure goods and service to meet planned or actual demand.
Make: processes that transform product to a finished state to meet planned or actual.
Deliver: processes that provide finished goods/services to meet planned or actual demand,
typically including order management, transportation management and distribution
management.
Return: Processes associated with returning or receiving returned products for any reason.
These processes extend into post-delivery customer support.
In an integrated supply chain, coordination of logistical activities is effectively extended to
encompass source, make and deliver processes in collaboration with channel partners.
Intrafirm coordination of sourcing, production and logistics activities enhances the ability to
respond to market volatility by eliminating redundant activities and reducing response time
by facilitating seamless flow of demand information, supply of materials and finished goods
(Rao, 2010).
The Plan processes describe the planning activities associated with operating a supply chain.
This includes gathering customer requirements, collecting information on available
resources, and balancing requirements and resources to determine planned capabilities and
resource gaps. This is followed by identifying the actions required to correct any gaps.
(Supply chain council, 2010). To measure the planning performance of the internal supply
chain performance order lead time, martial utilization, order entry method and accuracy of
forecasting measures were used.
The Source processes describe the ordering (or scheduling) and receipt of goods and
services. The Source process includes issuing purchase orders, scheduling deliveries,
receiving, shipment validation and storage, and accepting supplier invoices. (Supply chain

18
council, 2010). Sourcing is the entire set of business processes required to purchasegoods
and services. To measure inward material quality, quantity and timely delivery, procurement
cost, material inventory level, vendor development capability, defect rate and suppliers
pricing were used as metrics to analyze sourcing performance.
The Deliver processes describe the activities associated with the creation, maintenance, and
fulfillment of customer orders. It includes the receipt, validation, and creation of customer
orders; scheduling order delivery; pick, pack, and shipment; and invoicing the customer.
(Supply chain council, 2010). In this particular study to analyze delivery performance
different metric including onetime shipment, order fulfillment, number of delivery faults,
quality at delivery, transit time, effectiveness of delivery invoicing and total distribution cost.

19
CHAPTER III
RESEARCH METHODOLOGY
3.1. Research study area
This study was conducted in the sole telecommunication company of Ethiopia, ethio
telecom. The researcher had been distributing 118 questioners to corporate, zonal and
regional supply chain experts of ethio telecom and interview with managers and supervisors
in the study area. This were help the researcher to identify which metrics are really measures
telecom companies. There are several metrics in the literature and in business organizations
recommended for use in measuring the performance of a supply chain management
(Gunasekaran and Kobu, 2007). By compiling taxonomy of metrics from the articles I had
download and recent books concerned with performance measurement in supply chains. The
measures were then categorized according to their applicability to the three supply chain
processes defined in the supply chain operations reference (SCOR) model (plan, source, and
deliver)
3.2. Research design
A qualitative research offers the opportunity to carefully communicate with and capture the
experience of the interviewed participants or managers and supervisors. The qualitative
method helps the researcher to understand the meaning of situation, event, experiences, and
actions of participants (Maxwell, 2005) while a quantitative research requires standardized
measures and is often expressed in form of numbers to verify and test facts.
To attain the objective of this study both of the methods were employed. Descriptive study
design had been used to analyze performance of ethio telecom internal supply chain using
selected key performance indicators from SCOR model. Qualitative study were employed to
explain interview results that were collected from managers and supervisors.

20
3.3. Sample size and Sampling techniques
In principle, accurate information about given population could be obtained only from census
study. However, due to time and financial constraint, in many cases, a complete coverage of
population is not possible; thus sampling is one of the methods, which allow the researcher
to study relatively small number of units representing the whole population (Sartnakos,
1998). Out of 168 staff in the study area questioner were distributed to 118 of them
randomly. In addition to the questioner 6 supervisors and 3 managers were be interviewed. A
total of 104 responses were received, of which 95 were substantially complete, which
represents a response rate of 80.5 percent. The responses were received over a three-week
period in December 2013 and were submitted electronically in to SPSS.
In determining the sample the researcher were used sample size determination formula which
was used by Glen D in 2009(http://www.webcitation.org at 11/12/13).
n=168/1+168(0.05)2
=118
№ Level of occupation
Total population
Sample size
1 Staff 168 118
2 Supervisors 16 6
3 Managers 9 3
Where:
n is the sample size
N is the population size
e is the level of precision

21
3.4. Method of data collection
To gather necessary data that are relevant for maintaining the stated objective both primary
and secondary data were used. Secondary data were collected from studies conducted and
information documented in the company’s supply chain working manual, issuing reports,
receiving reports, material requisitions and packing slip. These documents help the
researcher to have more information in addition to the information collected through primary
data collection methods.
Primary data had been collected through questioners via email and personal contact with
supply chain experts of the company and Semi structured interview were employed to collect
primary data from managers and supervisors in the area.
3.5. Data processing / analysis
Raw data collected using questioner were organized and data verification were carried out
after the field data collection completed. And concerning the processing software issues
SPSS were used to analyze.
The data collected from ethio telecom employees, supervisors and managers through primary
and secondary data collection methods were thoroughly verified by the researcher. Then after
coding the collected data through questioner were done with the help of the software called
SPSS (statistical package for social science).
The data were analyzed based on the type of question that were asked by the researcher and
type of data demanded. Accordingly different statistical techniques were used incorporating
descriptive statistics which includes frequencies, percentages etc. in addition Pearson’s
correlation coefficients had been used to show the relationship between SCOR processes and
overall supply chain performance.
22
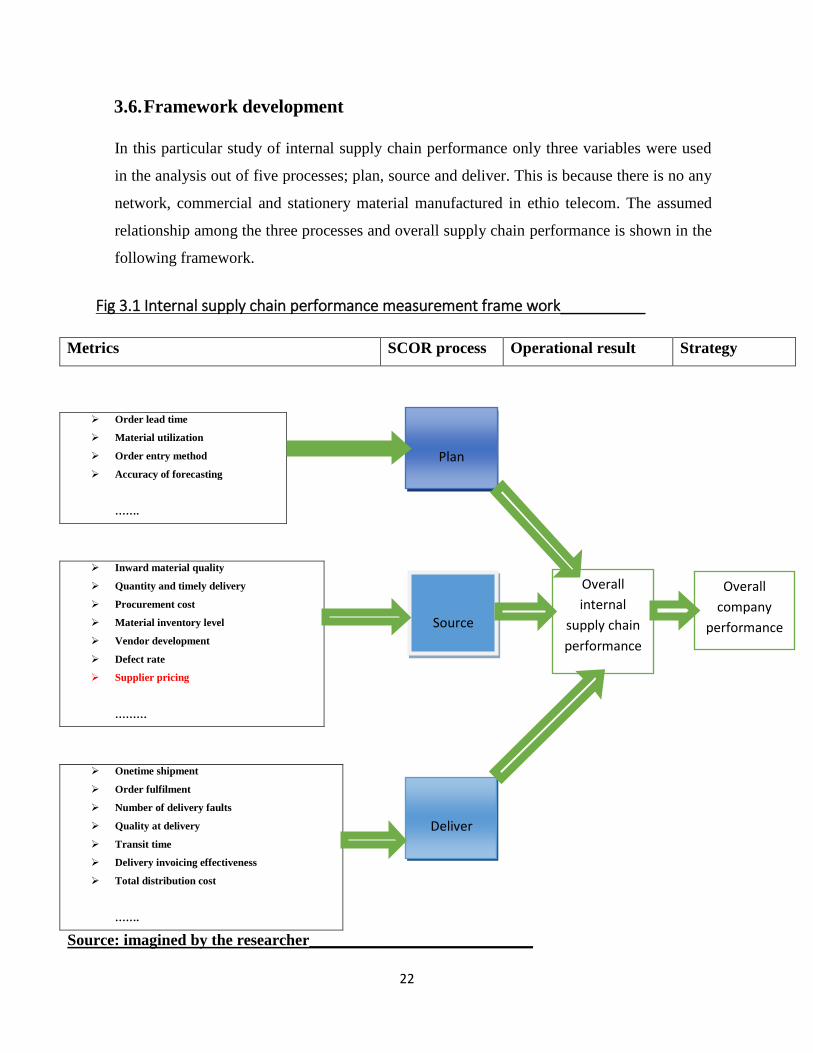
3.6. Framework development
In this particular study of internal supply chain performance only three variables were used
in the analysis out of five processes; plan, source and deliver. This is because there is no any
network, commercial and stationery material manufactured in ethio telecom. The assumed
relationship among the three processes and overall supply chain performance is shown in the
following framework.
Fig 3.1 Internal supply chain performance measurement frame work__________
Metrics SCOR process Operational result Strategy
Order lead time
Material utilization
Order entry method
Accuracy of forecasting
…….
Inward material quality
Quantity and timely delivery
Procurement cost
Material inventory level
Vendor development
Defect rate
Supplier pricing
………
Onetime shipment
Order fulfilment
Number of delivery faults
Quality at delivery
Transit time
Delivery invoicing effectiveness
Total distribution cost
…….
Source: imagined by the researcher____________________________
Overall
company
performance
Deliver
Source
Plan
Overall
internal
supply chain
performance

23
3.7. Ethical consideration
Informed consent is the major ethical issue in conducting research. According to Armiger. “It
means that a person knowingly, voluntarily and intelligently and in a clear and manifest way
gives his/her consent”.
Accordingly, respondents were assured that the information they provide is confidential and
used for exclusively for academic purpose. In addition statements conform the prohibition
incorporating any identity details or personal references in the questioner. This helps the
researcher to collect bias free response and allow respondents a room for express their idea
with full of freedom. Much effort were made to keep the response confidential and would not
be used for any personal interest. Generally the whole process of the research was controlled
to be within acceptable professional ethics.

24
CHAPTER IV
DATA ANALYSIS AND FINDINGS
4.1. Data analysis
In this part of the research, the data that were collected using interview, questioner and document
review are presented and an attempt is made to show the results and findings of the study
according to relevant issues and as per the objective set above. The data had played very
important role in analyzing the internal supply chain performance of ethio telecom. Questioner
were used to gather data form supply chain experts of the company and the interview were
employed to collect information from supervisors and managers regarding appropriateness of
measures and their suggestion about SCOR variables. Further document assessment was made to
investigate the performance.
4.1.1. General information of respondents
As depicted in table I below out of 95 respondents 29.5 percent of the respondents were female
respondents and the remaining 70.5 percent were male respondents. In this study respondents
from different working titles were participated i.e. out of 95 respondents 21 were Logistic
administrators, 5 were Procurement administrator, 25 were procurement and supplier relation
administrator and the remaining 44 respondents were belongs to the working title supply chain
administrator. Regarding educational background, a great majority of these respondents hold
their first degree which accounts for 75 percent, 25 percent of the respondents were Second
degree holders. Regarding their qualification the 100 percent of the respondents are being
working as professional supply chain experts.

25
Table 4.1 General information of respondents
Source* SPSS research data
When we have a look at the work experience in the study area, 1 percent of the respondents had
been serving their organization in this area for 1-4 years, 53 percent of the respondents had been
serving their organization for 5-8 years, 37 percent of the respondents were serving their
organization for 9-12 years and the remaining serving for above 12 years. As indicated in the
statistics most of the respondents which accounts for 99% were pretty much experienced they
had been serving their organization in the supply chain area for more than 5 years. Their long
experience in the area was playing an in important role in in responding questions that had been
asked to analyzing the internal supply chain performance of the company.
Table I General information of sample respondents
General Information of respondents Number Percentage
Education Diploma 0 0
Degree 75 78.9
Masters 20 21.1
PhD 0 0
Other 0 0
Gender Male 67 70.5
Female 28 29.5
Position Clerical 0 0.0
Professional 95 100.0
Title Logistic Admin 21 22.1
Procurement Admin I 0 0.0
Procurement Admin II 5 5.3
Procurement and supplier relation admin 25 26.3
Supply chain Admin 44 46.3

26
Figure 4.1 Supply chain working experience .
_Source* SPSS research data_______________________
4.1.2. Reliability analysis
Reliability is essentially the dependability of an instrument to test what it was designed to test.
The appropriate test for reliability is inter-item consistency reliability which is popularly known
as the Cronbach's coefficient alpha which is used for multi-point-scaled items. The internal
consistency can be considered to be satisfactory for all factors (Cronbach Alpha; α>.7).All
eighteen variables have internal consistency
Table 4.2 reliability analysis
Reliability Statistics
Cronbach's Alpha N of Items
.826 18

27
Item-Total Statistics
No Variables Cronbach's Alpha
1 Inward Material Quality .808
2 Quantity and Timely Delivery .814
3 Procurement Cost .820
4 Material Inventory Level .807
5 Vendor Development Capability .821
6 Defect rate .824
7 Suppliers pricing .830
8 Order lead time .819
9 Material Utilization .815
10 Order entry Method .815
11 Accuracy of forecasting .816
12 On Time Shipment .809
13 Order Fulfillment .809
14 Number of delivery faults .816
15 Quality at Delivery .821
16 Transit time .817
17 Effectiveness of delivery invoicing method .826
18 Total distribution cost .830
Source* SPSS research data
4.1.3. Planning performance result of questioner
Order lead lime includes request processing from user department, order confirmation by
saying accepted or out of stock and shipment to the destination. 16.8 percent strongly
disagree, 34.7 percent disagree, 25.3 percent neutral, 18.9 percent agree, and 4.2 percent of
Respondents replayed strongly agree for the question “Period between placing an order and
receiving the ordered item from the vendor is short enough”
As shown in the table 4.2 14.7 percent of sample respondents answered the strongly disagree
material utilization efficiency, 34.7 percent agree, 28.4 percent neither, 15.8 percent agree
and the remaining 6.3 percent of the respondents respond strongly agree for the question
material utilization efficiency is efficient. 14.7 percent of respondents strongly disagree, 34.7
percent disagree 28.4 percent neither, 15.8 percent agree, 6.3 percent or respondents replay
strongly agree for the question “Order entry method speedy and accurate”
28
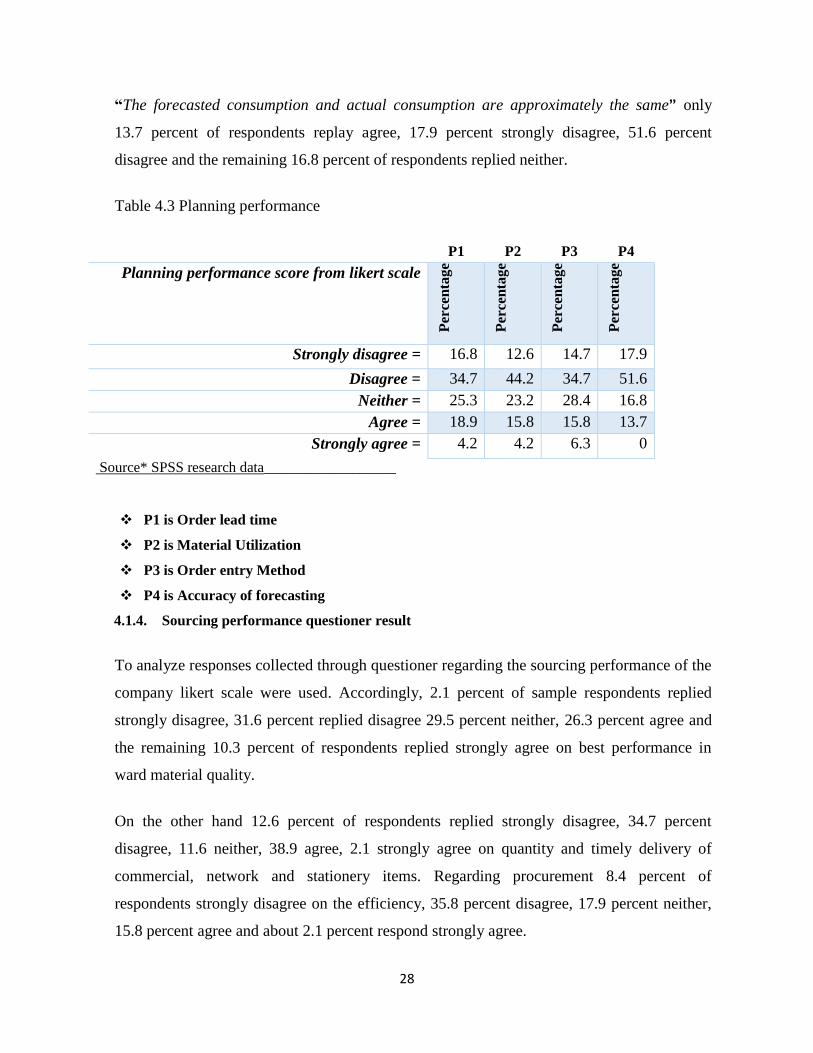
“The forecasted consumption and actual consumption are approximately the same” only
13.7 percent of respondents replay agree, 17.9 percent strongly disagree, 51.6 percent
disagree and the remaining 16.8 percent of respondents replied neither.
Table 4.3 Planning performance
P1 P2 P3 P4
Planning performance score from likert scale
Per
cen
tag
e
Per
cen
tag
e
Per
cen
tag
e
Per
cen
tag
e
Strongly disagree = 16.8 12.6 14.7 17.9
Disagree = 34.7 44.2 34.7 51.6
Neither = 25.3 23.2 28.4 16.8
Agree = 18.9 15.8 15.8 13.7
Strongly agree = 4.2 4.2 6.3 0
Source* SPSS research data__________________
P1 is Order lead time
P2 is Material Utilization
P3 is Order entry Method
P4 is Accuracy of forecasting
4.1.4. Sourcing performance questioner result
To analyze responses collected through questioner regarding the sourcing performance of the
company likert scale were used. Accordingly, 2.1 percent of sample respondents replied
strongly disagree, 31.6 percent replied disagree 29.5 percent neither, 26.3 percent agree and
the remaining 10.3 percent of respondents replied strongly agree on best performance in
ward material quality.
On the other hand 12.6 percent of respondents replied strongly disagree, 34.7 percent
disagree, 11.6 neither, 38.9 agree, 2.1 strongly agree on quantity and timely delivery of
commercial, network and stationery items. Regarding procurement 8.4 percent of
respondents strongly disagree on the efficiency, 35.8 percent disagree, 17.9 percent neither,
15.8 percent agree and about 2.1 percent respond strongly agree.

29
The other metrics that had used to measure sourcing performance of the supply chain were
Material inventory level. 26.3 percent of samples respondents were replied strongly disagree
on material inventory level efficiency of the supply chain, other 21.1 percent disagree, 23.2
percent were neither and the remaining 29.5 present replayed agree. Concerning vender
development capability 14.7 percent of respondents respond strongly disagree, 20percent of
them disagree, 52.6 percent remain neutral and about 9.5 and 3.2 percent replayed agree and
strongly disagree respectively.
Regarding defect rate, a measure used to analyses sourcing performance. 9.5 percent of
respondents respond strongly disagree, 47.4 disagree, 22.1 remain neutral and 21.1 percent of
the respondents replied agree on minimum defect rate. The last but not the list metrics in the
sourcing performance were supplier pricing. About 14.7 percent of sample respondents
strongly disagree on “Suppliers set price that keeps the benefit of ethio telecom. “, 44.2 percent
disagree and 29.5 remains neutral.
Table 4.4 Sourcing performance______________
Sourcing performance score from Likert scale S1 S2 S3 S4 S5 S6 S7
Per
cen
tage
Per
cen
tage
Per
cen
tage
Per
cen
tage
Per
cen
tage
Per
cen
tage
Per
cen
tage
Strongly disagree = 10.5 12.6 6.3 5.3 11.6 3.2 9.5
Disagree = 28.4 27.4 30.5 42.1 20 33.7 18.9
Neither = 34.7 24.2 28.4 17.9 29.5 24.2 38.9
Agree = 22.1 30.5 30.5 27.4 33.7 31.6 24.2
Strongly agree = 4.2 5.3 4.2 7.4 5.3 7.4 8.4
Source* SPSS research data____________________
S1 is Inward Material Quality
S2 is Quantity and Timely Delivery
S3 is Procurement Cost
S4 is Material Inventory Level
S5 is Vendor Development Capability
S6 is Defect rate
57 is Suppliers pricing

30
4.1.5. Delivery performance questioner result
Likert scale was used to analyze the delivery performance as well. To measure the sourcing
performance different metrics were used. Among the metrics on time shipment were the one,
regarding this measure 10.5 percent of sample respondents replied strongly disagree on time
shipment best performance,28.4 percent disagree, 34.7 percent remains neutral, 22.1 percent
agree and only 4.2 percent of sample respondents replied strongly agree.
As far as order fulfillment metric concerned, 12.6 percent of respondents replied strongly
disagree on best performance of order fulfillment, 27.4 percent disagree, 24.2 percent were
neutral, 30.5 replied agree and the remaining 5.3 percent strongly disagree with the statement
“Orders from different user departments were meet”. The other measure that had been used
to analyze the delivery performance were number of delivery faults, 6.3 percent of
respondents strongly disagree on minimum delivery faults of the supply chain, 30.5 percent
disagree, 28.4 percent remains neutral, 30.5 percent respond agree and only 4.2 percent of
respondents replied strongly agree.
On the other hand, quality on delivery was used to analyze the sourcing performance.
According to the questioner collected from sample respondents 5.3 percent of respondents
replied strongly disagree on performance of quality on delivery, 42.1 percent respond
disagree, 17.9 percent stayed neutral, 27.4 percent respond agree and the remaining 7.4
percent replied strongly agree. Transit time were used to analyze the sourcing performance
as well, 11.6 percent of respondents replied strongly disagree on the shortness of the transit
time,20 percent respond disagree, 29.5 replied neutral, 33.7 percent respond agree and only
5.3 percent of respondents replied strongly agree.
Effectiveness of delivery invoicing method were used as a metric as suggested by supply
chain manager interviewed. Accordingly, 3.2 percent of respondents replied strongly
disagree, 33.7, 24.2 percent of respondents replied neither and only 8. 4 percent replied
strongly agree on the effectiveness of delivery invoicing system. Total distribution cost were
used as a metric, 9.5 percent of respondents replied strongly disagree regarding the efficiency
of distribution cost. 18.9 percent disagree, 38.9 percent neither, 24.2 percent agree and the
reaming 8.4 percent replied strongly agree.

31
Table 4.5 Delivery performance______________
Delivery performance score from Likert scale D1 D2 D3 D4 D5 D6 D7
Per
cen
tage
Per
cen
tage
Per
cen
tage
Per
cen
tage
Per
cen
tage
Per
cen
tage
Per
cen
tage
Strongly disagree = 10.5 13 6.3 5.3 11.6 3.2 9.5
Disagree = 28.4 27 30.5 42.1 20 33.7 18.9
Neither = 34.7 24 28.4 17.9 29.5 24.2 38.9
Agree = 22.1 31 30.5 27.4 33.7 31.6 24.2
Strongly agree = 4.2 5.3 4.2 7.4 5.3 7.4 8.4
Source* SPSS research data____________________
D1 is On Time Shipment
D2 is Order Fulfillment
D3 is Number of delivery faults
D4 is Quality at Delivery
D5 is Transit time
D6 is Effectiveness of delivery invoicing method
D7 is Total distribution cost
4.1.6. Correlation
In order to check the impact of the supply chain processes on the overall supply chain
performance of the company, as illustrated in the table 4.6 test were run using the Pearson
correlation coefficient. The results examining the relationship between performance of main
areas of SCOR; plan, source and deliver with overall supply chain by using Pearson
correlation indicted a significant relationship.
The study revealed a significant positive relationship between planning performance with
overall supply chain performance. (r=.628**, p<0.01), sourcing performance and delivery
performance have also significant positive relationship (r=.397**, p<0.01 and r=.469**,
p<0.01). As shown in the following correlation statistics all of SCOR processes have
established positively significant associations with overall supply chain performance of the
organization with correlation coefficient 0.397-0.628. This positive significant bondage
supports my framework that I had imagined.
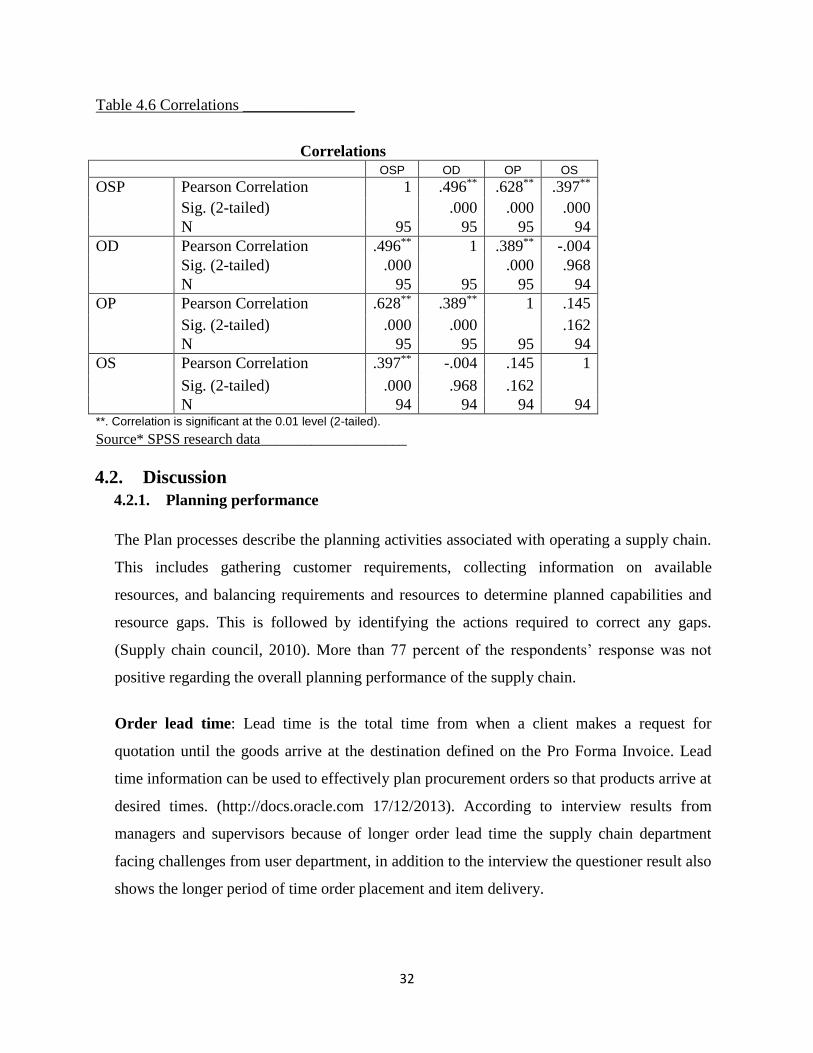
32
Table 4.6 Correlations ______________
Correlations
OSP OD OP OS
OSP Pearson Correlation 1 .496** .628** .397**
Sig. (2-tailed) .000 .000 .000
N 95 95 95 94
OD Pearson Correlation .496** 1 .389** -.004
Sig. (2-tailed) .000 .000 .968
N 95 95 95 94
OP Pearson Correlation .628** .389** 1 .145
Sig. (2-tailed) .000 .000 .162
N 95 95 95 94
OS Pearson Correlation .397** -.004 .145 1
Sig. (2-tailed) .000 .968 .162
N 94 94 94 94 **. Correlation is significant at the 0.01 level (2-tailed).
Source* SPSS research data____________________
4.2. Discussion
4.2.1. Planning performance
The Plan processes describe the planning activities associated with operating a supply chain.
This includes gathering customer requirements, collecting information on available
resources, and balancing requirements and resources to determine planned capabilities and
resource gaps. This is followed by identifying the actions required to correct any gaps.
(Supply chain council, 2010). More than 77 percent of the respondents’ response was not
positive regarding the overall planning performance of the supply chain.
Order lead time: Lead time is the total time from when a client makes a request for
quotation until the goods arrive at the destination defined on the Pro Forma Invoice. Lead
time information can be used to effectively plan procurement orders so that products arrive at
desired times. (http://docs.oracle.com 17/12/2013). According to interview results from
managers and supervisors because of longer order lead time the supply chain department
facing challenges from user department, in addition to the interview the questioner result also
shows the longer period of time order placement and item delivery.

33
Material Utilization: Material is required at the right time, right quantity and at right price.
Material requirement planning is done by planning department and raise a bill of
material. After the material is arrived and consumed its utilization record need to be
compiled to determine accuracy of planning (the quantity parameter). Regarding material
utilizations ethio telecom supply chain performance is not in a proper position. Interview and
questioner result confirm this fact. 80 percent of respondents replied negatively about the
efficiency of the material utilization.
Order entry Method: The Order Entry module is designed for high volume and fast
processing method for filling and shipping orders according to inventory availability.
(http://www.openpro.com/ 17/12/2013). Even if the questioner result doesn’t support
managers and supervisors assure that order entry method is simple using ERP and my
observation also support this idea.
Accuracy of forecasting: In the modern supply chain, forecasting is necessary for
companies that hold items for inventory and that are not hold to order. Companies will use
material forecasting to ensure that they produce the level of material that satisfies their
customers without making on demand and purchasing situation where too much inventory is
produced and remains on the shelf. Accurate forecasting helps organizations improve
financial management and helps procure adequate quantities of each product, thereby
reducing the likelihood of wastage or shortage, and increasing the likelihood of meeting
customer needs with available products (USAID, 2010). The questioner result shows the low
level performance of supply chain with regard to forecasting accuracy. A business partner
manager expressed this metrics with the example of aironet device. There is aironet demand
from banking sector but the device is unavailable because of in efficient forecasting.
4.2.2. Sourcing performance
The Source processes describe the ordering (or scheduling) and receipt of goods and
services. The Source process includes issuing purchase orders, scheduling deliveries,
receiving, shipment validation and storage, and accepting supplier invoices. (Supply chain
council, 2010). More than 90 percent of respondents respond negative and neutral regarding
the sourcing performance of the supply chain.

34
Inward Material Quality: This parameter shall evaluate the adherence of quality standards
of material received from vendors to that specified. Concerning this measure only 38.9
percent of respondents defend the efficiency. According to the interview results from
managers and supervisors most of the time stationery and commercial items are being
presented as per the specification. However, there is problem in network materials.
Quantity and Timely Delivery: This parameter shall evaluate whether the quantity ordered
is delivered on time. 62 percent of the respondents replied not negatively regarding this
measure. Managers and supervisors support the questioner result.
Procurement Cost: the cost incurred to procure the material i.e. the various costs such as
correspondence (e-mail, fax, courier, telephone etc.), conveyance (transportation cost of
personnel involved in procurement), official’s salary, electricity bills, and etc. because of
planning in efficiency on demand purchases are being made. Due to this the procurement
cost remains high especially in network materials according to the interview with managers
and supervisors.
Material Inventory Level: the stocked inventory level of the company. Higher inventory
level increases the capital investment and also acquires more physical space. Balanced
inventory level indicates better sourcing efficiency. 52 percent of the respondents were not
negative inventory level. Still there is a problem in network items. According to the supply
chain manager interviewed, minimum reorder quantity had not been set for network items
like commercial items.
Vendor Development Capability: Vendor Development can be defined as any activity that
a Buying Firm undertakes to improve a Supplier's performance and capabilities to meet the
Buying Firms' supply needs. According to the interview result, ethio telecom work
intelligently to develop the capability of its vendors. The questioner result supports this idea
as well, only 31.6 percent of respondents replied negatively. At present ethio telecom
purchase products from suppliers registered in its supplier list to develop their capability.

35
Defect rate: defect rate is amount of defective material with in purchased items. According
to the procurement manager, they are facing defects in different bulk purchases, for example
mobile apparatus like Tana, Samsung, and Smadel. The questioner result indicates the
presence defect in different items purchasing.
Suppliers pricing: this parameter were suggested by one of the mangers that had been
interviewed, to measure the ethio telecom’s supply chain in influencing suppliers to set price
that is for the benefit of ethio telecom. The questioner result shoes that only 32.6 percent of
the respondents respond negatively, managers and supervisors blame the supply chain in
influencing suppliers
4.2.3. Delivery performance
The Deliver processes describe the activities associated with the creation, maintenance, and
fulfillment of customer orders. It includes the receipt, validation, and creation of customer
orders; scheduling order delivery; pick, pack, and shipment; and invoicing the customer.
(Supply chain council, 2010). Regarding the delivery performance only 15.8 percent of the
respondents were replied positively. This confirms poor performance of delivery.
On Time Shipment: Shipment at the exporter's end is just the delivery of goods. When the P.O
is made for an order, the buyer fixes a favorable date. If these goods are exported by the
shipment department as per scheduled date then it is termed as on - time shipment. While
delay in shipment is of great concern and dealt with in this parameter, early shipment is also
draws a penalty. Only 38 percent of sample respondents defend on time shipment efficiency.
Order Fulfillment: For a company, the quantity to be shipped by the supply chain (as per the
Martial requisition) is the order quantity. If the supply chain division ships the exact quantity,
then we call it as an order fulfilled. But, in case any variation, whether positive or negative is
termed as excess or a short shipment respectively. 64 percent of respondents replied
negatively and neutral regarding order fulfillment efficiency of the supply chain. Managers
and supervisors shares this idea, order fulfillment couldn’t meet because of shortage,
materials are being distributed by quota rather than quantity ordered.
36
Number of delivery faults: Delivery of different material made with insignificant delivery
faults, at the time of distribution from central warehouse to different regional, zonal and
different branches delivery faults had been made in terms of quantity, product type according
to the interview result. 65.3 percent of respondents also replied negatively and neutral
regarding delivery faults.
Quality at Delivery: Quality performance is an overall index to measure the capability of a
company to churn out goods right the first time in the right quantity, at the right time and right
quality. 65.3 percent of the respondents respond not positively. The same is true for managers,
they believe quality at delivery is not in a better performance.
Transit time: It is the time taken to export the goods from the source Central
warehouse/CWH/ to the warehouse at the destination in different zonal and regional telecom
branches. Regarding the time taken to transport materials from CWH to different destination
is relatively better than ever before because of increment in the number of heavy truck.
Effectiveness of delivery invoicing method: more than 38 percent of respondents agree with
the effectiveness of delivery invoicing. Managers and supervisors confirm the effectiveness of
the invoicing method. Except language problem, the packing slip is being printing by English
language it is a bit difficult for drivers to communicate.
Total distribution cost: the total cost of distributing material to different regional offices is
remains costly, even after the implementation of ERP, this is because improper planning
performance for different materials trucks are busy in transporting on demand materials. The
questioner result also depicts the costly of distribution cost 67.3 percent of respondents
replied negative and neutral on the efficient of distribution cost.
4.3. Summary of findings
The finding indicates that all constructs of planning processes; material utilization,
forecasting accuracy and order lead time are inefficient especially in network items.
The same is true for sourcing performance of the supply chain, as findings shown the
cardinal sin in the supply chain is running out of stock, low level of quality of inward

37
materials, high cost of procurement, failure of suppliers on timely delivery of
commercial, stationery and network materials.
Early and late deliveries introduce waste in the form of excess cost into the supply
chain; early deliveries contribute to excess inventory holding costs, while late
deliveries may contribute to operation disruption and loss of goodwill like the
happenings this day’s. Regarding the delivery performance it remains poor and it
needs improvement.
In general terms the overall supply chain performance of ethio telecom is not
operating in a manner that satisfied the current need of internal customers.
38
CHAPTER V
CONCLUSIONS AND RECOMMENDATIONS
5.1. Conclusions
The ultimate purpose of this paper is to analyze the supply chain performance of ethio
telecom by using SCOR frame work presses. Based on the findings presented in the previous
section, the following conclusions are drawn.
Despite the fact that the implementation of ERP system, the planning efficiency of
the supply chain remains unsatisfactory that needs continuous assessment and
improvement. The finding indicates that all constructs of planning processes; material
utilization, forecasting accuracy and order lead time are inefficient especially in
network items.
In recent years, sourcing is evolved from relatively obscure buck office activity to an
recognized source of cost saving and relationship building The same is true for
sourcing performance of the supply chain, as findings shown the cardinal sin in the
supply chain is running out of stock, low level of quality of inward materials, high
cost of procurement, failure of suppliers on timely delivery of commercial, stationery
and network materials.
Today ethio telecom internal customers require dependable on-time delivery from
their CWH. In the short term, delivery deviations the earliness and lateness from the
targeted delivery date - must be analyzed, as both early and late deliveries are
disruptive to supply chains. Early and late deliveries introduce waste in the form of
excess cost into the supply chain; early deliveries contribute to excess inventory
holding costs, while late deliveries may contribute to operation disruption and loss of
goodwill like the happenings this day’s. Regarding the delivery performance it
remains poor and it needs improvement.
Supply chain processes, as well as other kinds of processes, demand assessment and
management models geared towards actions resulting in improvement and
measurement of results or impacts of these actions. Quantifying its supply chain
39
performance levels using a clearly an innovative PMS, represents an opportunity for a
company to solidify and align its performance measurements and process
improvement actions with its competitive strategies. PMS supported by the use of
process frameworks such as SCOR, can be a valuable input into supply chain
strategies.
In general terms the overall supply chain performance of ethio telecom is not
operating in a manner that satisfied the current need of internal customers.
5.2. Limitation of the study
Although an attempt were to make the study smooth based on strong methodology, it doesn’t
make it limitation free. The first limitation of this study were, it’s confined only in internal
supply chain. This is Because of time and financial resource. If time and financial resources
were not scarce, the whole supply chain shall be included in the research.
Secondly, in trying to analyze the performance of the ethio telecom KPI’s from SCOR
Framework were employed among other models with its own limitation. The limitation
includes; Overall performance measurement still difficult and not all processes are included.
5.3. Recommendations
Every link in the supply chain is dependent upon the Plan, so getting it right is vital to the
health of the business. Ethio telecom need to be able to generate multi-site distribution plans
that respect materials and capacity constraints and be able to quickly adjust those plans as
demand changes to ensure that customer orders are delivered on time. Supply Chain
Planning solutions like full-fledged ERP system provide global, end-to-end supply chain
optimization across the company, enabling ethio telecom to improve service levels, increase
productivity, reduce operational costs, minimize order lead time, maximize material
utilization, and increase demand forecasting.
Ethio telecom should implement Distribution requirements planning (DRP) a system that
replenishes inventory at branch locations throughout a distribution network using a time-
phased order point or other logic for every item incorporating commercial, network and

40
stationery materials. To minimize problem in relation with forecasting accuracy ethio
telecom should employee forecasting system, a system that uses historical demand and time
series algorithms to predict future demand by forecasting time intervals over the forecasting
time horizon.
Ethio telecom should work with its suppliers to increase inward material quality, to minimize
procurement cost, to influence suppliers in setting price, to minimize the rate of defect.
Increasing sourcing performance is considered as one of the most important variables for
improving SC Performance. Efficient sourcing helps to make optimum inventory level, which
further improves service level. Service level improvement enhance the internal customer
satisfaction level this directs to external customer satisfaction. Efficient sourcing would also
help to improve quality level by reducing different types of waste. Timely information sharing
system among Ethio Telecom, internal customers/user departments/ and suppliers would
alleviate both lead time and inventory problems.
If ethio telecom needs to work toward enabling what we call the unbroken supply chain, the
unbroken supply chain is an idealized concept of perfect information flow and perfect
material flow, facilitated by all supply chain players thinking and acting as one. Making
delivery performance efficient would play an important role. Charming and fully trust
communication between Stakeholders like ERCA, EAL and Ethiopian shipping lines.
In order to the overall supply chain performance the company should establish both internal
and external integration SAL/Service level agreement/ and OLA/Organizational level
agreement/ should be signed. Finally, the researcher recommend further research to examine a
wide verity of measures to analyze the internal supply chain using mathematical formulas to
measure each metric in the SCOR model which is believed to be appropriate for the company.
With this regard ethio telecom officials especially in supply chain area should continuously
undertake internal supply chain performance analysis by using standard measures because
“You cannot improve what you cannot measure” (Wisner, 2005).
41
References
Allahdad. (2012). A SUPPLY CHAIN MODEL FOR SMEs IN THE WEAVING SECTOR OF
PUNJAB, PAKISTAN. Far East Journal of Marketing and Management, 60-72.
ANDREW COX, P. I. (2003). Supply Chain Management a guide to best practice. Great
Britain: PEARSON EDUCATION LIMITED.
Basnet, C. (2013). The measurement of internal supply chain integration. Management
Research Review, pp. 153-172.
Beamon, B. M. (1999). Measuring Supply chain performance. International Journal of
Operations & Production Management, Vol. 19, No. 3, pp. 275-292.
Bowersox, D, J., Closs, D. J., & Cooper, B. M. (2007).Supply Chain Logistics Management.
McGraw-Hill/Irwin, New York.
Bourne, M.C.S., Mills, J.F., Bicheno, J., Hamblin, D.J., Wilcox, M., Neely, A.D. and Platts,
K.W. (1999) ‘Performance measurement system design: testing a process approach
in manufacturing companies’, International Journal of Business Performance
Measurement, Vol. 1, No. 2, pp.154–170.
Chen, C.T., Lin, Ching-Tong and Huang, Sue-Fn. (2006), “A fuzzy approach for supplier
evaluation and selection in supply chain management”, International Journal of
Production Economics, Vol.102, No.6, pp.141-164.
Christopher, M. (1998). Logistics and supply chain management: strategies for reducing cost
& improving service. (2nd Ed.). London: Financial Times Publishing.
Cooper, M. C., Lambert, D. M., & Pagh, J. D. (1997). Supply Chain Management: More than
a new name for Logistics. The International Journal of Logistics Management, 8
(1): 1-14.
Council of Supply Chain Management Professionals (2010), Supply Chain Management
Terms and Glossary.
Coyle, J.J., Bardi, E. and Langley, C.J. (2003), the Management of Business Logistics: A
Supply Chain Perspective, Thomson Learning, Belmont, CA.
Frohlich, M.T. and Westbrook, R. (2001), “Arcs of integration: An international study of
supply chain strategies”, Journal of Operations Management, Vol. 19, pp. 185-200.
(Sunil Chopra, 2007)
42
Gunasekaran, A. and Kobu, B. (2007), “Performance measures and metrics in logistics and
supply chain management: a review of recent literature (1995-2004) for research
and applications”, International Journal of Production Research, Vol. 45 No. 12,
pp. 2819-40.
Gunasekaran, A., Patel, C. and Tirtiroglu, E. (2001), “Performance measurement and metrics
in a supply chain environment”, International Journal of Operations & Production
Management, Vol. 21 Nos 1/2, pp. 71-87.
Habib, M. (2012). Enhancing Supply Chain Management for the Universities: ITESCM
Model Perspective. Int. J Sup. Chain. Mgt, 11-25.
Kaplan, R.S. and Norton, D.P. (1992) ‘The balanced scorecard–measures that drive
performance ‘, Harvard Business Review, Jan. /Feb., pp.71–79.
Lambert, D. M., & Pohlen, T. L. (2001). Supply chain metrics. International Journal of
Logistics Management, 12(1), 1.
Martin, W. (2008). Operation Exelence. New York: CRC press.
Maxwell, J. A. (2005). Qualitative research design: An interactive approach (2nd ed.).
Thousand Oaks, CA: Sage.
McCormack, K. (2004), “The development of a supply chain management process maturity
model”
McCormack, K. (2008). Supply chain maturity and performance. Supply Chain Management:
An International Journal, 272–282.
McCormack, K., Johnson, W. and Walker, W. (2003), Supply Chain Networks and Business
Process Orientation: Advanced Strategies and Best Practices.
Mentzer, J.T., Dewitt, W., Keebler, J.S., Min, S., Nix, N., Smith, C.D. and Zach, Z.G.
(2001), “Defining supply chain management”, Journal of Business Logistics, Vol.
22 No. 2, pp. 1-25.
Mohammad Ali¹, D. M. (2012). Supply Chain Management of Textile Industry: A Case Study
on Bangladesh. International journal of supply chain management, 35-40.
Rao, P. and Holt, D. (2005). Do green supply chains lead to competitiveness and economic
performance? International Journal of Operations and Production Management,
25(9), 898-916.

43
Seruga2, H. J. (2011). An Intelligent Supply Chain Management System to Enhance
Collaboration. International Journal of u- and e- Service, Science and Technology,
47-62.
Srinivasan, M., Mukherjee, D. and Gaur, A.S. (2011), “Buyer-Supplier Partnership Quality
and Supply Chain Performance: Moderating Role of Risks, and Environmental
Uncertainty”,
European Management Journal, Vol. 29, pp. 260-271.
Suhong Li, Bhanu Ragu-Nathan, T.S. Ragu-Nathan S., Subba Rao (2006).The Impact of
Supply Chain Management Practices on Competitive Advantage and
Organizational Performance. An International journal of Management Science,
Volume 34, pp 107-124.
Sunil Chopra and Peter Meindl. (1998). Spply Chain Management: Strategy Planning and
Operation. 2nd ed.New Delhi.
Sunil Chopra, P. M. (2007). SUPPLY CHAIN MANAGEMENT Strategy, Planning, and
Operation. Upper Saddle River, New Jersey.
Supply chain council, S. (2010). Supply Chain Operations Reference (SCOR®), model
Overview - Version 10.0. Supply Chain Council, Inc.
Thomas, DJ. And Griffin, PM (1996),"Coordinated supply chain management", European
journal of Operational Research, Vol. 94 No.1, pp.1-15.
Trent, R. a. (2002). A Framework to Improve Sourcing Strategy Implementation. Academy of
Management Executive, Vol. 16, No. 2, 66-80
USAID. (2010). Measuring Supply Chain Performance, Guide to Key Performance
Indicators for Public Health Managers. USA: U.S. Agency for International Development
Wisner, JD 2005, Principles of Supply Chain Management: A Balanced Approach, South-
Western, Mason, OH.
(http://www.deloitte.com as of 10/12/2013)
.
.

44
Appendix

45
St. Mary University College
School of Graduate Studies
Interview questions to Managers and supervisors.
The following questions has been developed by students from St. Mary’s University to analyze
the supply chain performance of ethio telecom in fulfilling the requirement of Masters of
business Administration. Your co-operation in responding this interview by answering to the
following questions would be greatly appreciated. The overall purpose of this interview is
exclusively academic. Your response will not be used for any other purpose; it is confidential.
Thank you very much for taking the time for this interview.
1. Your title____________
2. What educational award you achieved?
Diploma Degree Masters PhD
If other specify_________________

46
Section I
In this section the supply chain performance metrics/measure/ Key performance indicator/ in
relation with planning process are presented. This metrics were collected different articles and
informal communications with supply chain experts of ethiotelecom. You are allowed to add
metrics which you believe important in measuring planning performance of the supply chain.
№
Metrics or
Key performance
indicators
Does
this appropriate
to
Ethio telecom?
1. Yes 2. No
1
Order lead time
2
Material Utilization
3 Order entry Method
4
Accuracy of forecasting
Add more

47
Section II
In this section the supply chain performance metrics/measure/ Key performance indicator/ in
relation with sourcing process are presented. This metrics are collected from SCOR model by
reading different articles and informal communications with supply chain experts of
ethiotelecom. You are allowed to add metrics which you believe important in measuring
sourcing performance of the supply chain.
№
Metrics or
Key performance
indicators
Does
this appropriate
to
Ethio telecom?
1. Yes 2.
No
1
Inward Material Quality
2 Quantity and Timely Delivery
3 Procurement Cost
4 Material Inventory Level
5
Vendor Development Capability
6 Defect rate
7 Suppliers pricing
Add more

48
Section III
In this section the supply chain performance metrics/measure/ Key performance indicator/ in
relation with delivery process are presented. This metrics are collected from SCOR model by
reading different articles. You are allowed to add metrics which you believe important in
measuring delivery performance of the supply chain.
№
Metrics or
Key performance
indicators
Does
this appropriate
to
Ethio telecom?
1. Yes 2.
No 1 On Time Shipment
2 Order Fulfillment
3 Number of delivery faults
4 Quality at Delivery
5 Transit time
6
Effectiveness of
delivery invoicing
method
7 Total distribution cost
Add more
Section IV

49
1. What is your opinion about the overall supply chain performance of ethiotelecom?
________________________________________________________________________
________________________________________________________________________
________________________________________________________________________
_______________________________
2. What is your opinion about the planning efficiency of ethiotelecom?
________________________________________________________________________
________________________________________________________________________
________________________________________________________________________
________________________________
3. How do you explain the sourcing performance of ethiotelecom?
________________________________________________________________________
________________________________________________________________________
________________________________________________________________________
_________________________________
4. Do you think the delivery performance of ethiotelecom is efficient? Please explain?
________________________________________________________________________
________________________________________________________________________
________________________________________________________________________
_________________________________
5. If you have anything to add
________________________________________________________________________
________________________________________________________________________
________________________________________________________________________
____________________
Thank you!!

50
St. Mary’s University
School of Graduate Studies
The following questionnaire has been developed by student Afera Muluadam from St. Mary’s
University to analyze the supply chain performance of ethio telecom in fulfilling the
requirement of Masters of business Administration. Your co-operation in completing this
study by responding to the following questions would be greatly appreciated. Please do not put
your name on the questionnaire. The overall purpose of this questionnaire is exclusively
academic. Your response will not be used for any other purpose; it is confidential. Thank you
very much for taking the time to complete this questionnaire, your effort is greatly appreciated.
Do not hesitate to contact for any information with 0911510069 or [email protected].
3. Your title____________
4. Gender: M F
5. What educational award you achieved?
Diploma Degree Masters PhD
If other specify_________________
6. Total years of experience in any organization: ________________
7. Experience in telecom industry: ______________
8. Experience in logistic/ supply chain/ procurement area_____________
9. Position in the organization: Clerical Professional
10. Do your company have supply chain measure established?
Yes No

51
In the next three sections answer first the appropriateness of the metrics by putting: 1 for yes 2
for no and then answer questions by putting “X” sign on the scale that you believe right.
Section I
In this section the supply chain performance metrics/measure/ Key performance indicator/ in
relation with planning process are presented. This metrics were collected different articles and
informal communications with supply chain experts of ethiotelecom. You are allowed to add
metrics which you believe important in measuring planning performance of the supply chain.
№
Metrics or
Key performance
indicators
Does
this appropriate
to
Ethio telecom?
1. Yes 2. No
Question
Str
on
gly
dis
agre
e
Dis
agre
e
Nei
ther
Agre
e
Str
on
gly
agre
e
1
Order lead time
Period between placing an order and receiving the ordered item from the supplier is short enough.
2
Material Utilization
Material is required is being purchased at the right time, right quantity and at right price
3 Order entry Method
Order entry method speedy and accurate.
4
Accuracy of forecasting
The forecasted consumption and actual consumption are approximately the same.
Add more
1.1. Plan process most affect the overall internal supply chain performance of ethiotelecom.
Strongly dis agree
Disagree
Neither
Agree
Strongly agree

52
Section II
In this section the supply chain performance metrics/measure/ Key performance indicator/ in
relation with sourcing process are presented. This metrics are collected from SCOR model by
reading different articles and informal communications with supply chain experts of
ethiotelecom. You are allowed to add metrics which you believe important in measuring
sourcing performance of the supply chain.
№
Metrics or
Key performance
indicators
Does
this appropriate to
Ethio telecom?
1. Yes 2. No
Question
Str
on
gly
dis
agre
e
Dis
agre
e
Nei
ther
Agre
e
Str
on
gly
agre
e
1
Inward Material Quality
Quality standards of material received from vendors are as per the specification.
2 Quantity and Timely Delivery
Quantity ordered is delivered on time.
3 Procurement Cost
Cost incurred to procure the material is efficient.
4 Material Inventory Level
Stocked inventory level of the company is optimal.
5
Vendor Development Capability
Sourcing Department is capable to assist vendor during the product development or in Order processing
6 Defect rate
The rate of defect items from suppliers are minimal or insignificant.
7 Suppliers pricing
Suppliers set price that keeps the benefit of ethiotelecom.
Add more
1.2. Sourcing process most affect the overall internal supply chain performance of
ethiotelecom.
Strongly dis agree
Disagree
Neither
Agree
Strongly agree

53
Section III
In this section the supply chain performance metrics/measure/ Key performance indicator/ in
relation with delivery process are presented. This metrics are collected from SCOR model by
reading different articles. You are allowed to add metrics which you believe important in
measuring delivery performance of the supply chain.
№
Metrics or
Key performance
indicators
Does
this appropriate
to
Ethio telecom?
1. Yes 2. No
Question
Str
on
gly
dis
agre
e
Dis
agre
e
Nei
ther
Agre
e
Str
on
gly
agre
e
1 On Time Shipment
All materials shipped to the user on time.
2 Order Fulfillment
Orders from different user departments were meet.
3
Number of delivery faults
Delivery of different material made with insignificant delivery faults.
4 Quality at Delivery
Right material with right specification is Bing delivered at a right time
5 Transit time
The time taken to transport materials to their destination is optimal
6
Effectiveness of
delivery invoicing
method
The invoicing method is effective and clear to understand
7 Total distribution cost
The cost that is incurred to transport the material is efficient.
Add more
1.3. Delver process most affect the overall internal supply chain performance of ethiotelecom.
Strongly dis agree
Disagree
Neither
Agree
Strongly agree

54
Section IV
6. What is your opinion about the overall supply chain performance of ethiotelecom?
________________________________________________________________________
________________________________________________________________________
________________________________________________________________________
_______________________________
7. What is your opinion about the planning efficiency of ethiotelecom?
________________________________________________________________________
________________________________________________________________________
________________________________________________________________________
________________________________
8. How do you explain the sourcing performance of ethiotelecom?
________________________________________________________________________
________________________________________________________________________
________________________________________________________________________
_________________________________
9. Do you think the delivery performance of ethiotelecom is efficient? Please explain?
________________________________________________________________________
________________________________________________________________________
________________________________________________________________________
_________________________________
10. If you have anything to add
________________________________________________________________________
________________________________________________________________________
________________________________________________________________________
____________________
Thank you!!