Embed Size (px)
Citation preview
Conference Proceedings: 2nd International Scientific Conference ITEMA 2018
514
SMOOTHED HEIKIN-ASHI ALGORITHMS OPTIMIZED FOR
AUTOMATED TRADING SYSTEMS
Cristian P�una199
https://doi.org/10.31410/itema.2018.514
Abstract: Heikin-Ashi is the Japanese term for "average bar". This methodology is well known
as one of the methods to identify and follow the trends using a price time series in financial
markets. Nowadays, in the first decades of the 21st century, in the electronic trading
environment, with very volatile price market conditions, using the Heikin-Ashi method gets new
and special connotations especially when it is about the high-frequency trading. It was found
that combining the classical Heikin-Ashi candlesticks with modern limit conditions reliable
trading algorithms can be generated in order to produce a good trading return with automated
trading systems. This paper will present several trading algorithms based on Heikin-Ashi
method for algorithmic trading especially adapted for high-frequency trading systems. It will
be revealed how the trading signals can be automatically built and used in order to automate
the trading decisions and orders. Exit signals will also be discussed. Trading results obtained
with the presented algorithms for Frankfurt Stock Exchange Deutscher Aktienindex Market will
be displayed in order to qualify the methods and to compare them with any other trading
strategies for high-frequency trading. As conclusions, Heikin-Ashi combined with special limit
conditions can generate reliable trading models for algorithmic trading.
Keywords: algorithmic trading, automated trading systems, Heikin-Ashi
1. INTRODUCTION
n the first decades of the 21st Century “the development of e-businesses represents an
important factor in boosting the growth and prosperity of the human society”. [1] In the new
electronic trading environment of the financial markets, automated trading systems (ATS)
have become an important part in any modern financial investment company. “The
development of the information and communication technology leads to the creation of new
business models and decision support systems”. [2]
“In electronic financial markets, algorithmic trading (AT) refers to the use of computer
programs to automate one or more stages of the trading process”. [3] The trading decisions and
orders are made partially or completely automatically nowadays by computers using advanced
mathematical algorithms. “High-frequency trading (HFT) is a type of algorithmic trading
characterized by high speeds, high turnover rates, and high order-to-trade ratios that leverages
high-frequency financial data and electronic trading tools”. [4]
There is a considerable number of trading strategies and models in the literature, but not all of
them are adapted for algorithmic trading. Nowadays the algorithmic traders “represent 52% of
market order volume and 64% of nonmarketable limit order volume”. [5]. Different analytical
���������������������������������������� �������������������199 Economic Informatics Doctoral School, Bucharest Academy of Economic Studies, 11th Tache Ionesc Str.,
Bucharest, Romania
This paper was co-financed by the Bucharest Academy of Economic Studies during the PhD program
I
Conference Proceedings: 2nd International Scientific Conference ITEMA 2018
515
trading models that can be automated for the financial markets are presented by Larry Connors
in [6] and [7] with proved reliable results. Using the genetic based algorithms, interesting
researches are presented by Yong Hu [8] and José Manuel Berutich [9]. Hybrid trading
strategies are also developed in the last time; a hybrid system is presented by Youngmin Kim
[10]. A significant number of the trading strategies that can be automated for the stock
exchanges are adapted from the currency market; some reliable strategies are presented by
Kathy Lien in [11] and [12]. Considering the current academic literature related with the trading
strategies adapted for algorithmic trading, the subject about how the Heikin-Ashi
transformation can be used to detect the trend and to automate the trading signals is not treated.
This is the purpose filled by the current paper.
This paper will present some algorithms optimized especially for HFT. The models presented
here are based on the Heikin-Ashi (HA) methodology. HA is the Japanese term ( ) for
the "average bar" and represents a transformation of the price time series into a new series with
the purpose to filter the noise and to obtain a graphic representation for the price trend. The HA
model is well known as a good method to identify and follow the trend in financial markets.
This paper will present how the HA methodology can be combined with modern limit
conditions (LC) in order to improve the trading efficiency and to automate the trading decisions
for inclusion in ATS.
It will be revealed the way how the trading signals based on HA can be automatically built and
used in order to automate the trading activity. Exit signals will also be discussed and built using
the same technique in order to automate the exit procedures. To qualify the presented methods
and to compare them with any other trading strategies for HFT, trading results will be presented
in the last part of the paper. These results were obtained with a HFT of the Frankfurt Stock
Exchange Deutscher Aktienindex DAX30 Market [13]. The results will qualify the signals
obtained with HA as to be reliable trading signals for AT that can be included and optimized
for any ATS.
2. HEIKEN-ASHI TECHNIQUE
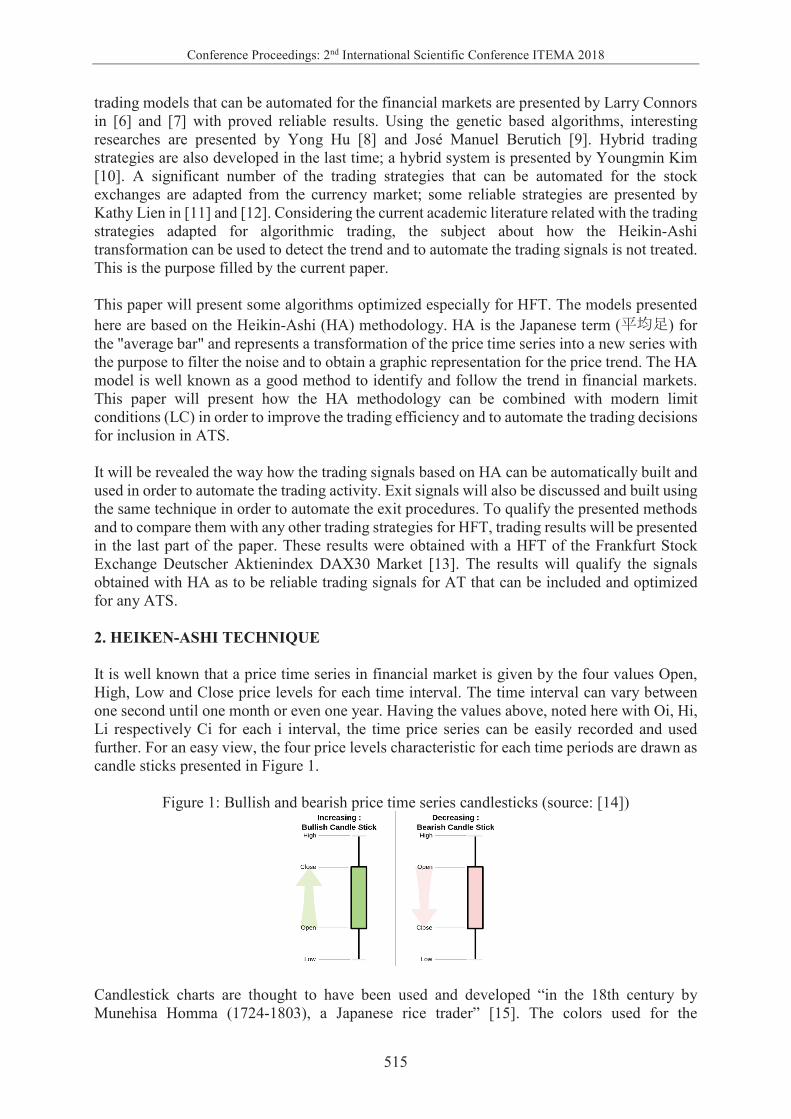
It is well known that a price time series in financial market is given by the four values Open,
High, Low and Close price levels for each time interval. The time interval can vary between
one second until one month or even one year. Having the values above, noted here with Oi, Hi,
Li respectively Ci for each i interval, the time price series can be easily recorded and used
further. For an easy view, the four price levels characteristic for each time periods are drawn as
candle sticks presented in Figure 1.
Figure 1: Bullish and bearish price time series candlesticks (source: [14])
Candlestick charts are thought to have been used and developed “in the 18th century by
Munehisa Homma (1724-1803), a Japanese rice trader” [15]. The colors used for the
Conference Proceedings: 2nd International Scientific Conference ITEMA 2018
516
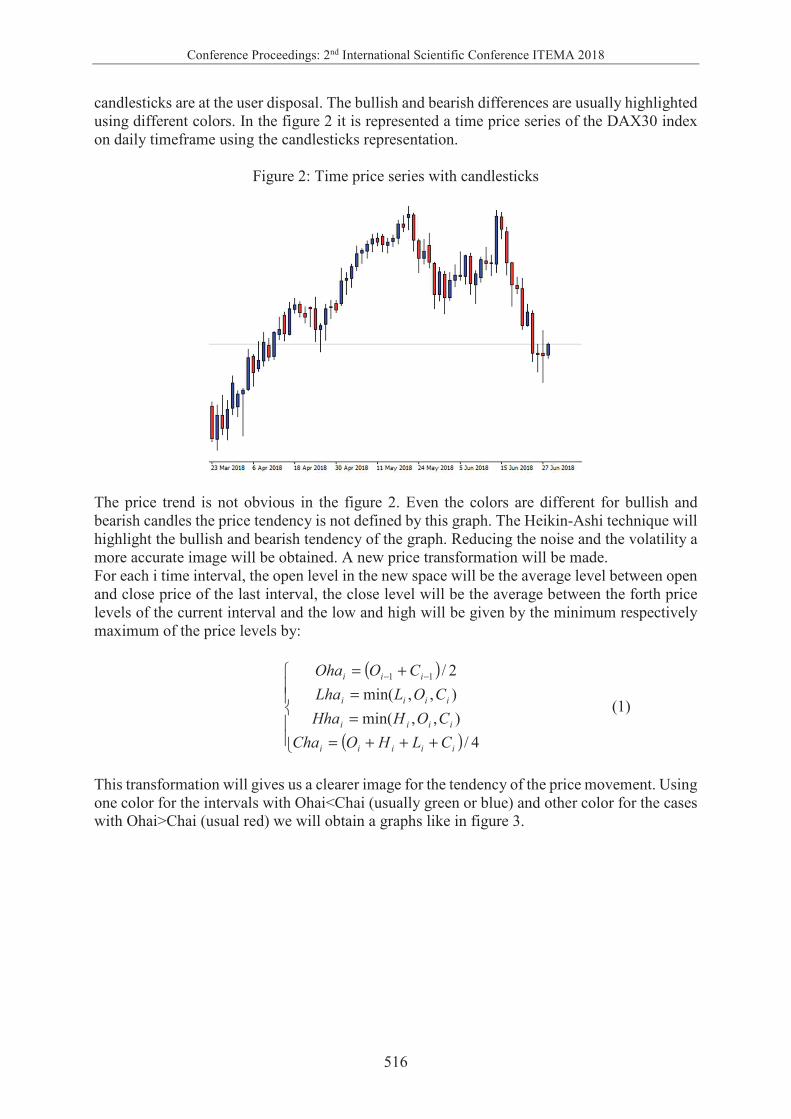
candlesticks are at the user disposal. The bullish and bearish differences are usually highlighted
using different colors. In the figure 2 it is represented a time price series of the DAX30 index
on daily timeframe using the candlesticks representation.
Figure 2: Time price series with candlesticks
The price trend is not obvious in the figure 2. Even the colors are different for bullish and
bearish candles the price tendency is not defined by this graph. The Heikin-Ashi technique will
highlight the bullish and bearish tendency of the graph. Reducing the noise and the volatility a
more accurate image will be obtained. A new price transformation will be made.
For each i time interval, the open level in the new space will be the average level between open
and close price of the last interval, the close level will be the average between the forth price
levels of the current interval and the low and high will be given by the minimum respectively
maximum of the price levels by:
(1)
This transformation will gives us a clearer image for the tendency of the price movement. Using
one color for the intervals with Ohai<Chai (usually green or blue) and other color for the cases
with Ohai>Chai (usual red) we will obtain a graphs like in figure 3.
( )
( )��
��
�
+++=
=
=
+= −−
4/
),,min(
),,min(
2/11
iiiii
iiii
iiii
iii
CLHOCha
COHHha
COLLha
COOha
Conference Proceedings: 2nd International Scientific Conference ITEMA 2018
517
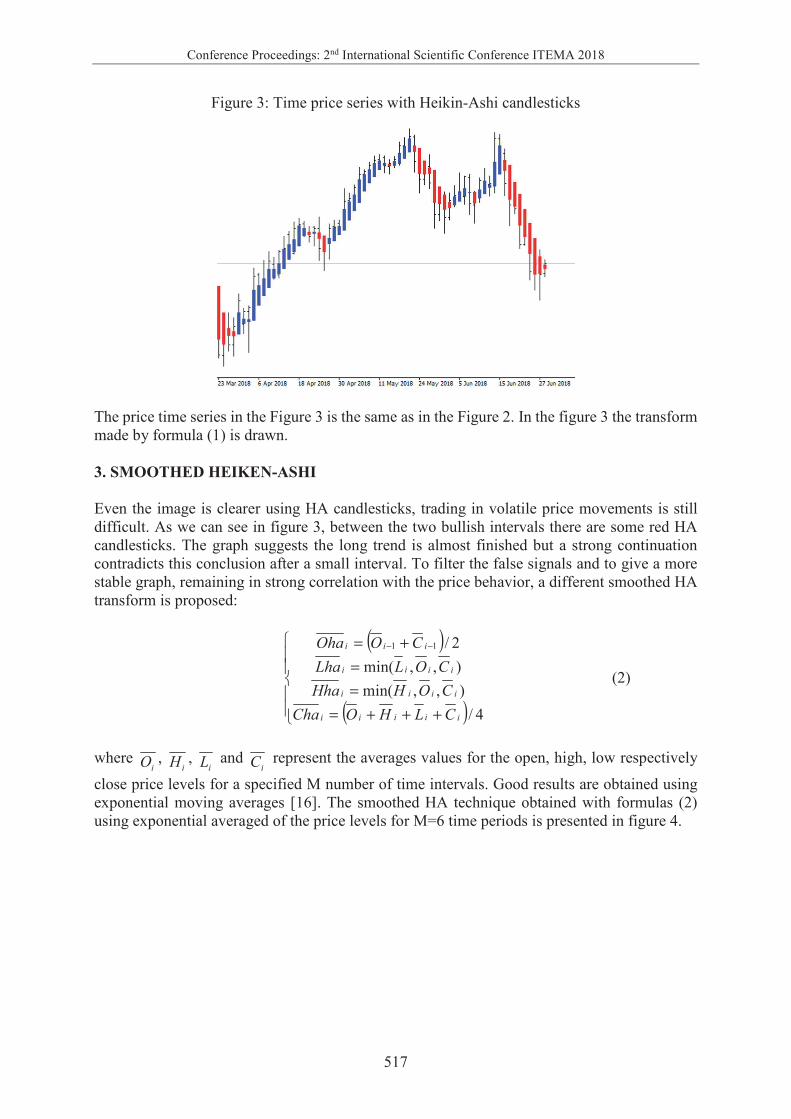
Figure 3: Time price series with Heikin-Ashi candlesticks
The price time series in the Figure 3 is the same as in the Figure 2. In the figure 3 the transform
made by formula (1) is drawn.
3. SMOOTHED HEIKEN-ASHI
Even the image is clearer using HA candlesticks, trading in volatile price movements is still
difficult. As we can see in figure 3, between the two bullish intervals there are some red HA
candlesticks. The graph suggests the long trend is almost finished but a strong continuation
contradicts this conclusion after a small interval. To filter the false signals and to give a more
stable graph, remaining in strong correlation with the price behavior, a different smoothed HA
transform is proposed:
(2)
where iO ,
iH , iL and
iC represent the averages values for the open, high, low respectively
close price levels for a specified M number of time intervals. Good results are obtained using
exponential moving averages [16]. The smoothed HA technique obtained with formulas (2)
using exponential averaged of the price levels for M=6 time periods is presented in figure 4.
( )
( )��
��
�
+++=
=
=
+= −−
4/
),,min(
),,min(
2/11
iiiii
iiii
iiii
iii
CLHOCha
COHHha
COLLha
COOha
Conference Proceedings: 2nd International Scientific Conference ITEMA 2018
518
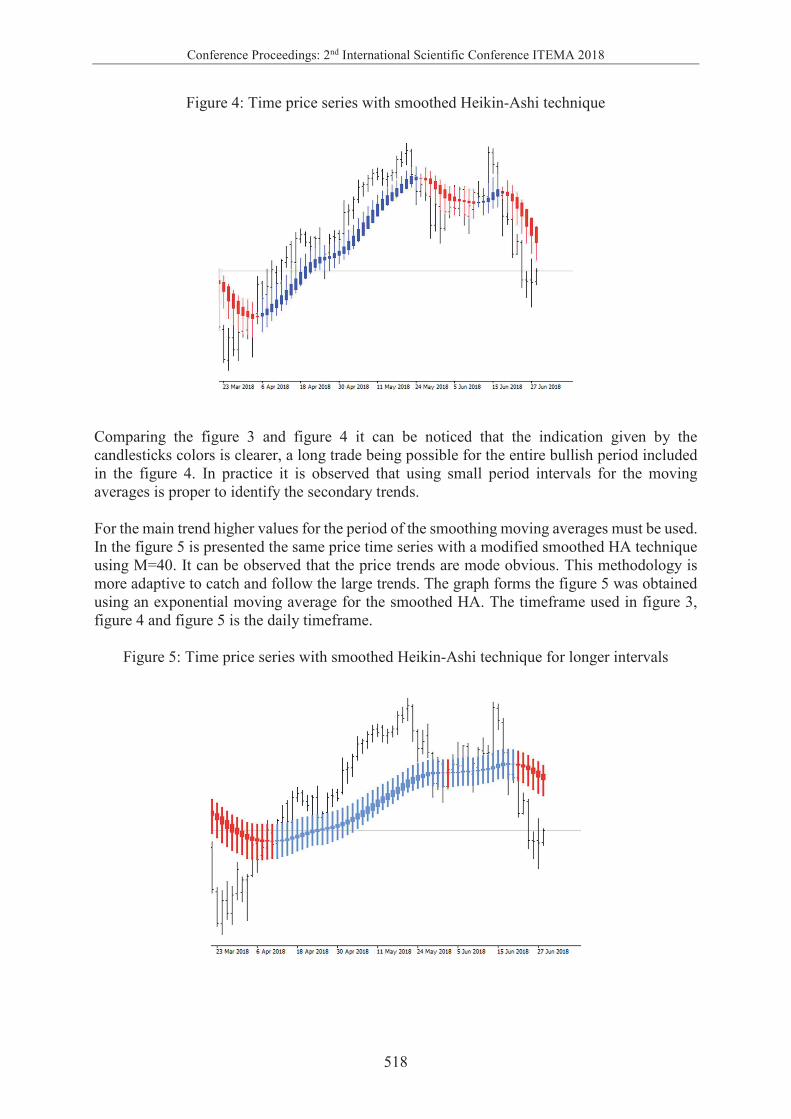
Figure 4: Time price series with smoothed Heikin-Ashi technique
Comparing the figure 3 and figure 4 it can be noticed that the indication given by the
candlesticks colors is clearer, a long trade being possible for the entire bullish period included
in the figure 4. In practice it is observed that using small period intervals for the moving
averages is proper to identify the secondary trends.
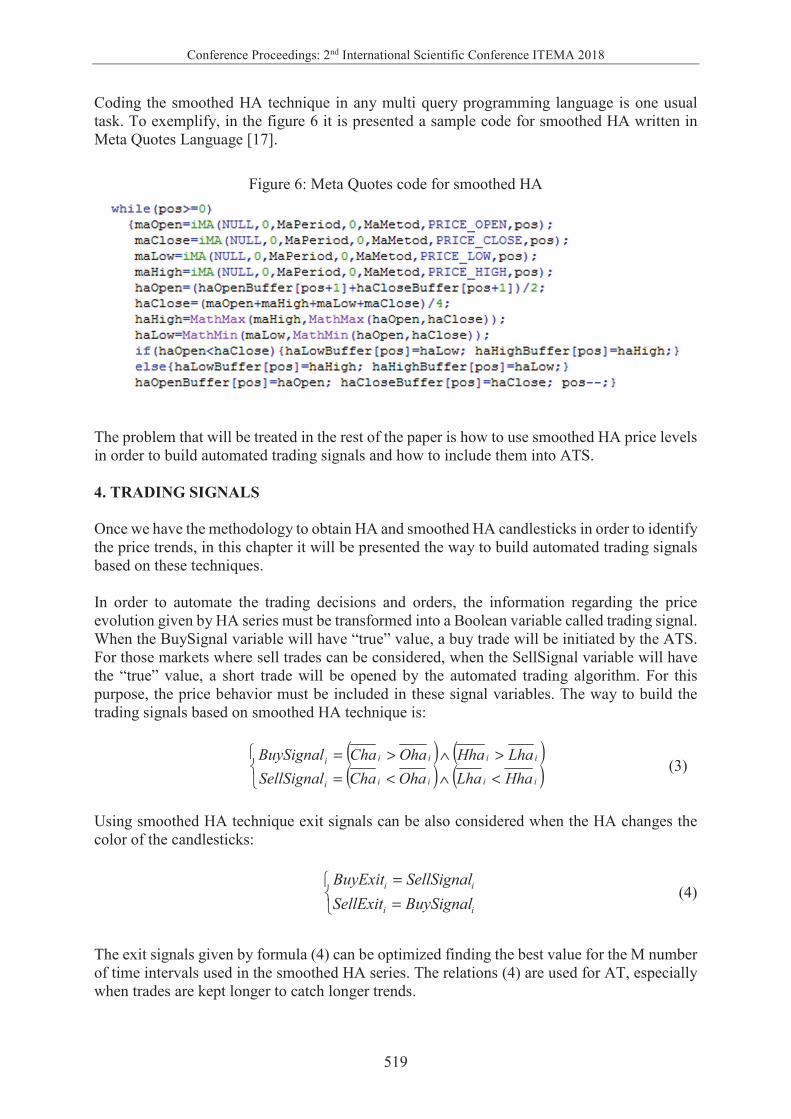
For the main trend higher values for the period of the smoothing moving averages must be used.
In the figure 5 is presented the same price time series with a modified smoothed HA technique
using M=40. It can be observed that the price trends are mode obvious. This methodology is
more adaptive to catch and follow the large trends. The graph forms the figure 5 was obtained
using an exponential moving average for the smoothed HA. The timeframe used in figure 3,
figure 4 and figure 5 is the daily timeframe.
Figure 5: Time price series with smoothed Heikin-Ashi technique for longer intervals
Conference Proceedings: 2nd International Scientific Conference ITEMA 2018
519
Coding the smoothed HA technique in any multi query programming language is one usual
task. To exemplify, in the figure 6 it is presented a sample code for smoothed HA written in
Meta Quotes Language [17].
Figure 6: Meta Quotes code for smoothed HA
The problem that will be treated in the rest of the paper is how to use smoothed HA price levels
in order to build automated trading signals and how to include them into ATS.
4. TRADING SIGNALS
Once we have the methodology to obtain HA and smoothed HA candlesticks in order to identify
the price trends, in this chapter it will be presented the way to build automated trading signals
based on these techniques.
In order to automate the trading decisions and orders, the information regarding the price
evolution given by HA series must be transformed into a Boolean variable called trading signal.
When the BuySignal variable will have “true” value, a buy trade will be initiated by the ATS.
For those markets where sell trades can be considered, when the SellSignal variable will have
the “true” value, a short trade will be opened by the automated trading algorithm. For this
purpose, the price behavior must be included in these signal variables. The way to build the
trading signals based on smoothed HA technique is:
(3)
Using smoothed HA technique exit signals can be also considered when the HA changes the
color of the candlesticks:
(4)
The exit signals given by formula (4) can be optimized finding the best value for the M number
of time intervals used in the smoothed HA series. The relations (4) are used for AT, especially
when trades are kept longer to catch longer trends.
( ) ( )( ) ( )
�
<∧<=
>∧>=
iiiii
iiiii
HhaLhaOhaChaSellSignal
LhaHhaOhaChaBuySignal
�
=
=
ii
ii
BuySignalSellExit
SellSignalBuyExit
Conference Proceedings: 2nd International Scientific Conference ITEMA 2018
520
The formula (4) is not proper for HFT where the profit target is very small. For HFT additional
conditions must be imposed in order to avoid opening trades in the overbought and oversold
intervals. These conditions will be presented in the next chapter.
In the figure 5 there is a direct relation between the price tendency and the distance between the
Open and the Close of the smoothed HA price levels. When the distance between Ohai and
Chai is increasing, the price has a strong movement tendency. When the distance between the
open and close of the HA smoothed levels is decreasing, the price is slowing down and it is
approaching to change its behavior or trend. This considerations will generate the second type
of trading signals based on HA technique. A buy signal can be considered when the open of the
smoothed HA is lower than the close and the distance between the two levels is increasing. The
sell signal can be made in the same idea for those periods with close less than open of the
smoothed HA:
(5)
The relations (5) will generate trades only on the intervals when the price makes significant
movements in the direction of the trend. All the rest intervals will be ignored or used in order
to close the already opened trades. Decreasing the distance between the open and close of the
smoothed HA can be also a good exit signal:
(6)
The signals (3), (4), (5) and (6) can be applied for different timeframes. These signals can be
used for both AT and HFT. For HFT the profit target is small. A significant larger number of
trades will be made for HFT. For this case additional conditions must to be imposed in order to
avoid opening trades on overbought and oversold intervals.
5. LIMIT CONDITIONS
Good results were obtained combining the trading signals presented in the last chapter with
limit conditions imposed in the “Price Cyclicality function” [18] values. Noting with PCYi the
value of the price cyclicality function, the limit conditions for the long signals can be automated
using the next formulas:
(7)
( )( )
( )( )��
��
�
−>−
∧<=
−>−
∧>=
−−
−−
11
11
iiii
iii
iiii
iii
ChaOhaChaOha
OhaChaSellSignal
OhaChaOhaCha
OhaChaBuySignal
( )( )
( )( )��
��
�
−<−
∨>=
−<−
∨<=
−−
−−
11
11
iiii
iii
iiii
iii
ChaOhaChaOha
OhaChaSellExit
OhaChaOhaCha
OhaChaBuyExit
( )( )( ) ( )ξρ <∧>
∧−>−
∧>=
−−
ii
iiii
iii
PCYPCY
OhaChaOhaCha
OhaChaBuySignal
11
Conference Proceedings: 2nd International Scientific Conference ITEMA 2018
521
where � and � are two functional parameters that will be optimized for each traded market. The
computational way to build the PCY function can be found in the author paper [10]. The
parameter � assure that the trading signal is not initiated too earlier while the parameter � will
filter the trades in order not to be opened in overbought intervals. The sell signals using the
limit conditions with the PCY function can be built similarly.
It was found that the trading signals (7) can open trades even the price trend is not strong
enough. In order to filter these cases, a limit condition can be imposed for the gradient of the
PCY function. Especially for HFT this filter will ensure good and positive profit expectancy.
New trades will be opened by (7) only if the gradient of the PCY function will be higher a
specified � value:
(8)
The measure of the functional parameters �, � and � will be found by an optimization process
using the time price series for a historical interval. Using an iterative process, the optimal values
for each functional parameter will be found checking the trading signals for each time interval
in the historical price series. Trading results obtained with (8) will be presented in the next
chapter.
6. TRADING RESULTS
In this section we will present trading results obtained with the signals detailed above. These
results were obtained using TheDaxTrader [19], an automated trading system that uses
smoothed HA trading signals in order to generate buy trades for DAX30.
The results presented in table 1 were obtained for HFT of contract for difference (CFD) of
DAX30 the period 01.06.2015 – 30.06.2018 with a spread of 1 point using a fixed target of 10
points for each trade. The risk and exposed capital management were made using the “Global
Stop Loss Method” presented in the author paper [20].
The smoothed HA trading signals (8) were built for a four hours timeframe interval. An
additional condition was imposed regarding the hourly intervals of the executed trades between
8:00 and 16:00 coordinated universal time (UTC) in order to ensure the liquidity on the market.
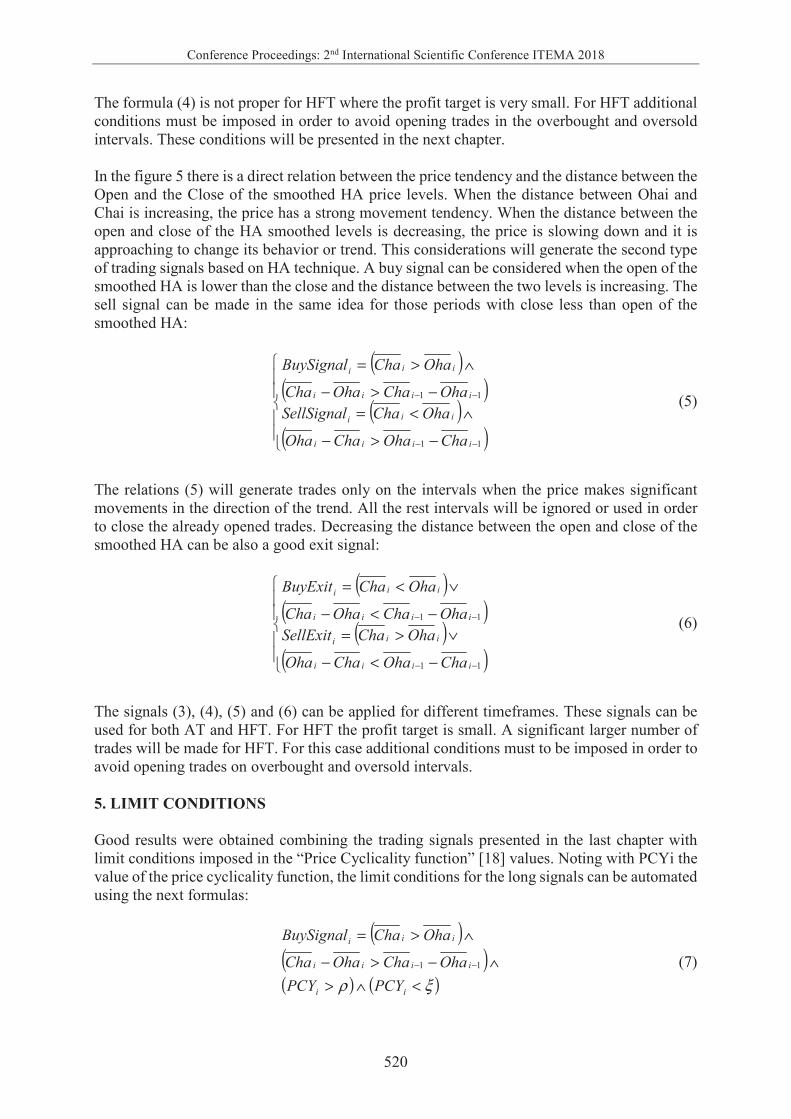
Table 1. Trading results obtained with smoothed HA trading signals
Trading signals (8) results
Start trading 01.06.2015
Stop trading 30.06.2018
CFD spread 1
Profit target 10
Number of trades 78
Total profit 23,257
Maximal drawdown 5,442
( )( )( ) ( )( )δ
ξρ
>−
∧<∧>
∧−>−
∧>=
−
−−
1
11
ii
ii
iiii
iii
PCYPCY
PCYPCY
OhaChaOhaCha
OhaChaBuySignal
Conference Proceedings: 2nd International Scientific Conference ITEMA 2018
522
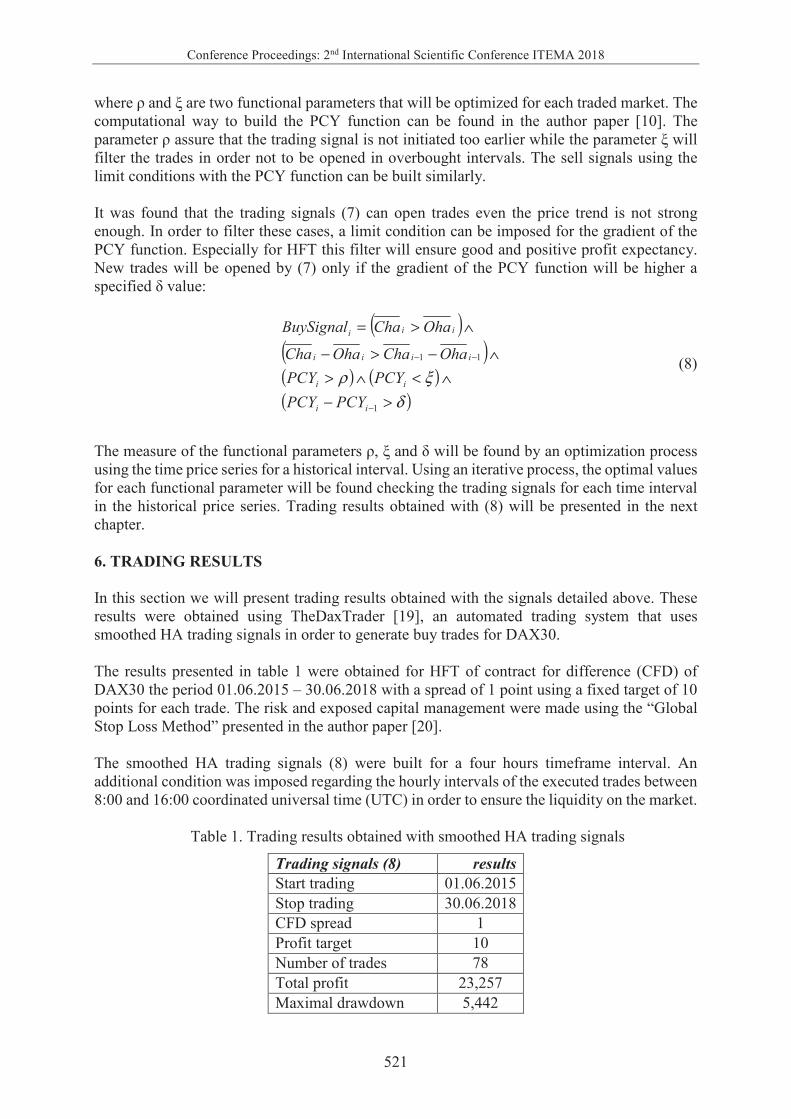
Absolute drawdown 2,204
Maximal RRR 1:4.27
Absolute RRR 1:10.55
The results presented were obtained with the next functional parameters included in the formula
(8): M=40, �=5, �=95 and �=8. The capital evolution due to the smoothed HA signals is
presented in figure 7. In the case presented no losing trades were recorded.
Figure 7: Capital evolution due to HA trading signals
The trading results above were obtained considering only one trade opened in a moment of
time. If a trade is opened and a new trading signal appears, no additional trade will be considered
until the initial trade is closed. The maximal time interval of the longest trade was 111 hours.
In order to reveal the advantages of the Smoothed Heikin-ashi methodology we present a
comparison with other known trading methods. The results presented in table 2 were obtained
using algorithmic trading in the same period of time (01.06.2015 – 30.06.2018), on the same
financial market (DAX30) with the same ten points target.
Table 2. Comparison between trigonometric interpolation and other known trading
methodologies
Trading signals Number
of trades Profit Drawdown
Risk to
reward ratio
Smoothed Heikin-Ashi signals 78 23.257 5,442 1:4.27
Moving averages perfect order signals 96 18,045 8,712 1:2.07
Parabolic stop and reverse signals 102 18,816 6,011 1:3,47
Relative Strength Index signals 68 16,372 5,901 1:2.77
The known trading methods used were the “Moving averages perfect order methodology” [11],
“Parabolic stop and reverse methodology” [21] and “Relative strength index methodology”. [6]
Each method was optimized to obtain the best trading efficiency for the financial market used.
In table 2 it can be seen that the SHA methodology makes a significant larger number of trades
with a very good value for the risk and reward ratio (RRR). These results are an additional
confirmation that the method is a reliable trading methodology for algorithmic trading.
The author uses the HSA trading signals presented in this paper since 2013 year. This
methodology was included in TheDaxTrader automated trading software. With a proper
optimization parameters set, the HSA trading signals generate only profitable trades in the stock
markets. This methodology was tested, implemented and used with the same good results for a
representative number of financial markets: Deutscher Aktienindex (DAX30), Dow Jones
Industrial Average (DJIA30), Financial Times London Stock Exchange (FTSE100), Cotation
Assistée en Continue Paris (CAC40), Swiss Stock Exchange Market Index (SMI20), Australian
Conference Proceedings: 2nd International Scientific Conference ITEMA 2018
523
Securities Exchange Sydney Index (ASX200), Tokyo stock Exchange Nikkei Index
(Nikkei225), NASDAQ100 Index, Standard & Poor’s Index (S&P500) and Small
Capitalization US Index (Russell2000). Also with good and stable results the trigonometric
interpolation methodology presented in this paper was applied for Gold and Bent Crude Oil
financial markets starting with 2015 year.
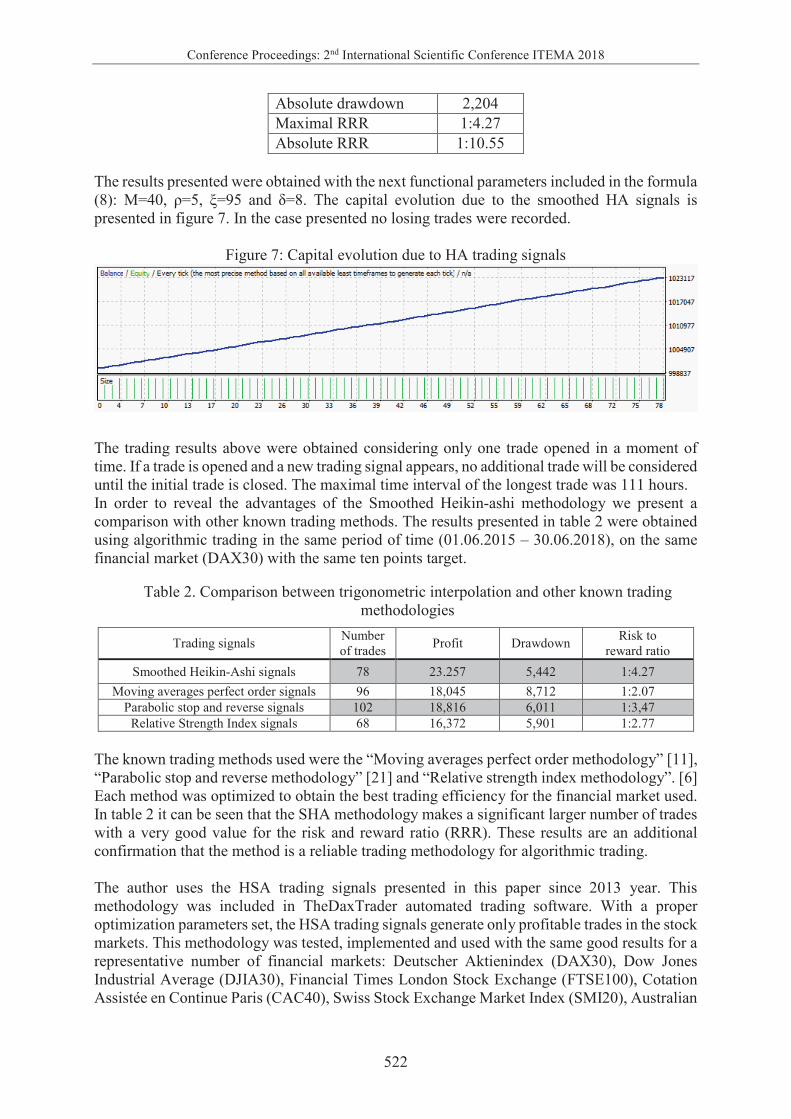
6. CONCLUSIONS
The Heikin-Ashi trading technique can be improved using smoothed methods with different
types of moving averages. The smoothed Heikin-Ashi model can be adapted for algorithmic
trading and high-frequency trading in the electronic trading today’s market conditions. The
presented model permits to identify the up and down trends for different timeframes in any
financial market. When an uptrend is detected, a buy signal will be generated by the trading
software. Similarly, for those markets with profitable sell conditions, when a down trend is
detected, sell trades can be considered.
Automated trading signals can be built using the smoothed Heikin-Ashi time series. Both buy
and sell trading signals can be automated together with the exit signals using Boolean variables.
In order to avoid opening trades in the overbought and oversold price intervals, additional limit
conditions must to be imposed for the Smoothed Heikin-Ashi trading model.
Using the price cyclicality model these conditions can be included in the trading signals
variables in order to automate the trade decisions. In order to avoid opening trade in the intervals
when the price is not making significant movements additional limit conditions can be imposed
with the gradient of the price cyclicality function in order to consider only the strong trends.
With all these conditions, the smoothed Heikin-Ashi trading signals can produce a significant
number of trades with positive profit expectancy.
The presented trading methodology can be optimized based on the functional parameters in
order to be traded on different timeframe intervals and different markets. The functional
parameters included in the trading signals formulas will be optimized using repetitive
algorithms in order to maximize the profit and to reduce the exposure and capital risk. The
proper parameter set will be obtained for each traded market.
The presented trading signals can be named reliable, once a period of 36 months produced
trading results with 1:4.27 RRR and 1:10.55 absolute RRR. The optimization process of the
functional parameters for the trading signals presented can be made using a time price series of
the historical price for any market with good liquidity. These signals can be also optimized for
algorithmic trading with longer profit target for automated trading or automated investment
systems.
Looking at the compared results included in table 2 we can say that the signals obtained using
the smoothed Heikin-Ashi methodology are reliable trading signals. The values for the RRR
and the number of trades and profit obtained with the presented methodology are a good
confirmation for this assumption.
All trading and the exit conditions included in the presented methodology are based on the
Heikin-Ashi price transformation and can constitute a stand-alone trading model for automated
trading systems. Being exclusively a mathematical model, the methodology presented in this
Conference Proceedings: 2nd International Scientific Conference ITEMA 2018
524
paper can be applied with good results for algorithmic trading and high-frequency trading. This
model can also be used for manual trading.
REFERENCES
[1] D�n�ia��, D., Margea, C., Hurbean, L., Artene, A.S. (2014) Electronic services for business
environment, Procedia - Social and Behavioral Sciences 124, Published by Elsevier Ltd.,
pp. 351-360, ISSN: 1877-0428, doi: 10.1016/j.sbspro. 2014.02.496
[2] Ghilic-Micu, B., Mircea, M., Stoica, M. (2010) The Audit of Business Intelligence
Solutions, Informatica Economic� vol. 14, no. 1/2010, pp. 66-77, ISSN 1453-1305
[3] Nuti, G., Mirghaemi, M., Traleaven, P., Yingsaeree, C. (2011) Algorithmic trading, IEEE
Journal, Volume 44, Issue 11, pp. 22
[4] Aldridge, I. (2013) High-Frequency Trading: A Practical Guide to Algorithmic Strategies
and Trading Systems, 2nd edition, Wiley, ISBN 1-118-34350-6
[5] Hendershott, T., Riordan, R. (2013) Algorithmic Trading and the Market for Liquidity,
Journal of Financial and Quantitative Analysis, 48(4), pp. 1001-1024.
DOI:10.1017/S0022109013000471
[6] Connors, L., Alvarez, C. (2009) Short Term Trading Strategies That Work, A Quantitative
Guide to Trading Stocks and ETFs, Trading Markets Publishing Group, New Jersey, US,
ISBN: 978-0-0919239-0-1
[7] Connors L., Alvarez, C. (2009) High Probability ETF Trading 7 Professional Strategies to
Improve Your ETF Trading, Connors Research. ISBN: 978-0-615-29741-5
[8] Yong, H., Kang, L., Xiangzhou, Z., Lijun, S., Ngai, E.W.T., Mei, L. (2015) Application of
evolutionary computation for rule discovery in stock algorithmic trading: A literature
review, Applied Soft Computing, Applied Soft Computing, 36, 534-551. DOI:
https://doi.org/10.1016/j.asoc.2015.07.008
[9] Berutich, J.M., Francisco, L., Francisco, l., Quintana, D. (2016) Robust technical trading
strategies using GP for algorithmic portfolio selection, Expert Systems with Applications,
Volume 46 Issue C, March 2016 pp. 307-315, Pergamon Press, Inc. Tarrytown, NY, USA.
DOI: 10.1016/j.eswa.2015.10.040
[10]Youngmin, K., Wonbin, A., Kyong J.O., Enke, D. (2017) An intelligent hybrid trading
system for discovering trading rules for the futures market using rough sets and genetic
algorithms, Applied Soft Computing Archive, Volume 55 Issue C, June 2017, pp. 127-140.
Elsevier Science Publishers B. V. Amsterdam, The Netherlands, DOI:
10.1016/j.asoc.2017.02.006
[11]Lien. K. (2009) Day Trading & Swing Trading the Currency Market. Technical and
Fundamental Strategies to Profit from market Moves, John Wiley & Sons. ISBN: 978-0-
470-37736-9
[12]Lien, K. (2011) The Little Book of Currency Trading. How to make big Profits in the World
of Forex, John Wiley & Sons. ISBN:978-0-470-77035-1
[13]Börse, Frankfurt. (2018) Frankfurt Stock Exchange Deutsche Aktienindex DAX30
Components. Retrieved from http://www. boerse-frankfurt.de/index/dax
[14]Wikipedia encyclopedia. (2018) Candle sticks chart presentation. Available at: https://en.
wikipedia.org/wiki/Candlestick_chart
[15]Morris, G.L. (2006) Candlestick Charting Explained: Timeless Techniques for Trading
Stocks and Futures, McGraw-Hill, ISBN 0-07-146154-X
[16]Cox, D.R.Sir. (1961) Prediction by Exponentially Weighted moving Averages and Related
Methods, Journal of the royal Statistical Society, Series B, Vol. 23, No. 2, pp. 414-422
[17]Meta Quotes. (2018) Online presentation Meta Quotes Language 4. Available at:
https://www. metatrader4.com/en/automated-trading/mql4-programming.

Conference Proceedings: 2nd International Scientific Conference ITEMA 2018
525
[18]P�una, C., Lungu, I. (2018) Price Cyclicality Model for Financial Market. Reliable Limit
Conditions for Algorithmic Trading, Journal of Studies and Researches of Economic
Calculation and Economic Cybernetics, 4/2018, ISSN: 0585-7511
[19]P�una, C. (2010) TheDaxTrader. Automated trading system. Online software presentation.
Available at: https://pauna.biz/thedaxtrader
[20]P�una, C. (2018) Capital and Risk Management for Automated Trading Systems,
Proceedings of the 17th International Conference on Informatics in Economy, pp 183-188.
Available at: https://pauna.biz/Capital_and_ Risk_Management
[21]Wilder, W. Jr. (1978). New Concepts in Technical Trading Systems. Greensboro, NC:
Trend Research. ISBN 978-0894590276
�