Embed Size (px)
Citation preview
THE TRADERS CLUB WEEKLY INDICES REPORT:
23/06/17
CONTENTS:
Week in the markets P.3
Major Indices Daily Heikin Ashi + Ichimoku View P.4
Major Indices Technical Levels P.5
Index Watch: UK FTSE100 P.6
Index Watch: Weekly Pick P.7
Index Watch: US S&P500 P.8
Volume at Price S&P 500 P.9
Index Watch: US Market Sentiment Dashboard P.10
Nasdaq 100 & Volatility (VXN) watch P.11
Index Watch: Far East: Nikkei 225 & Hang Seng P.12
Volume at Price: Nikkei 225 P.13
Indices
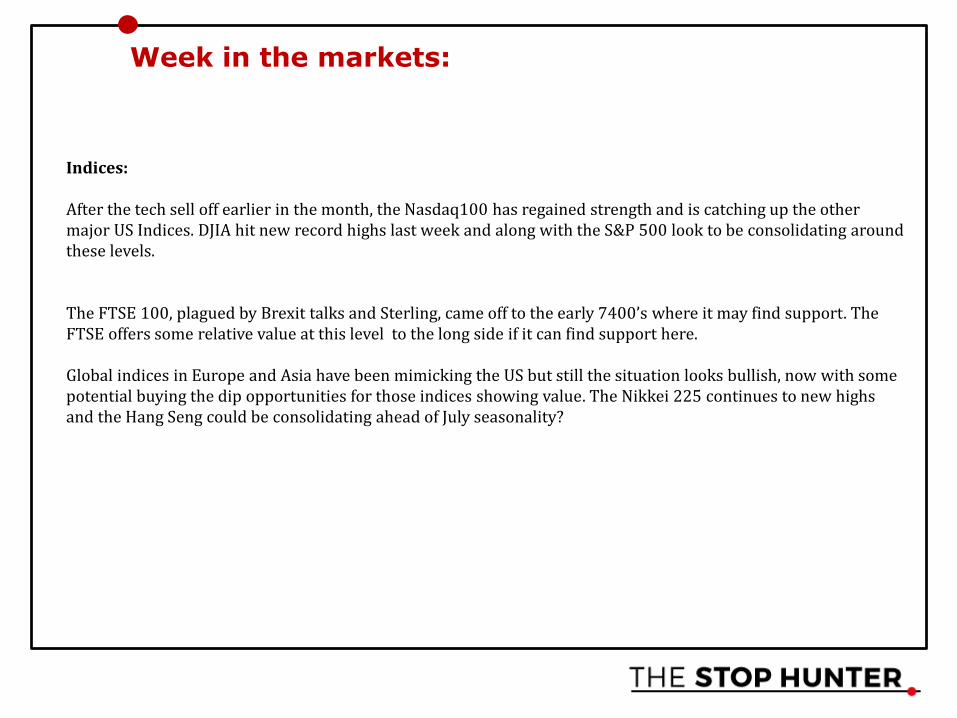
Week in the markets:
Indices:
After the tech sell off earlier in the month, the Nasdaq100 has regained strength and is catching up the other major US Indices. DJIA hit new record highs last week and along with the S&P 500 look to be consolidating around these levels.
The FTSE 100, plagued by Brexit talks and Sterling, came off to the early 7400’s where it may find support. The FTSE offers some relative value at this level to the long side if it can find support here.
Global indices in Europe and Asia have been mimicking the US but still the situation looks bullish, now with some potential buying the dip opportunities for those indices showing value. The Nikkei 225 continues to new highs and the Hang Seng could be consolidating ahead of July seasonality?
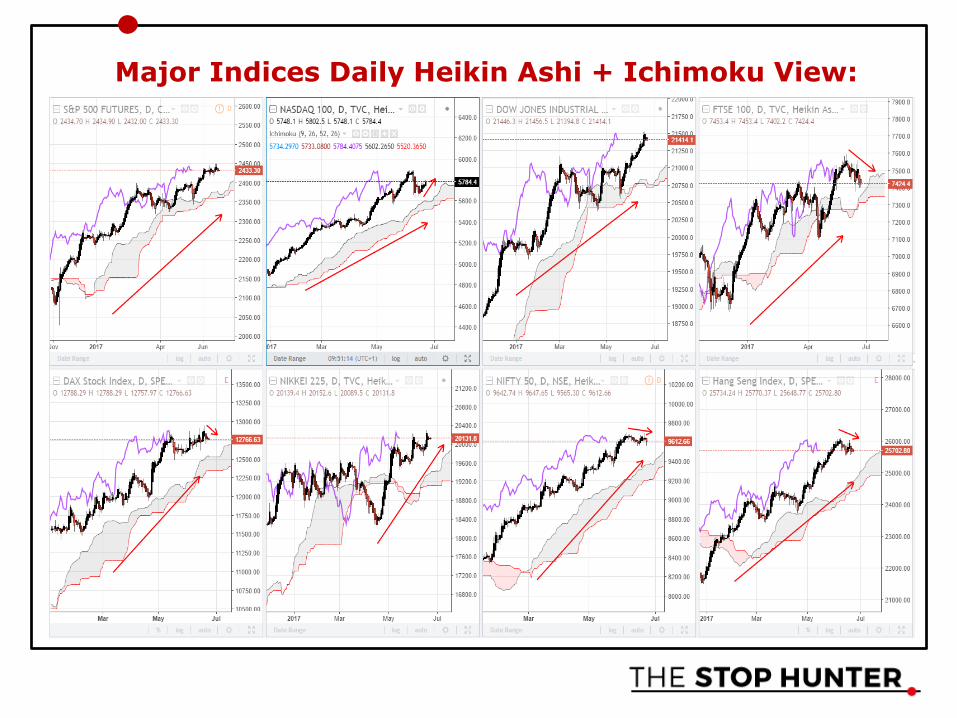
Major Indices Daily Heikin Ashi + Ichimoku View:
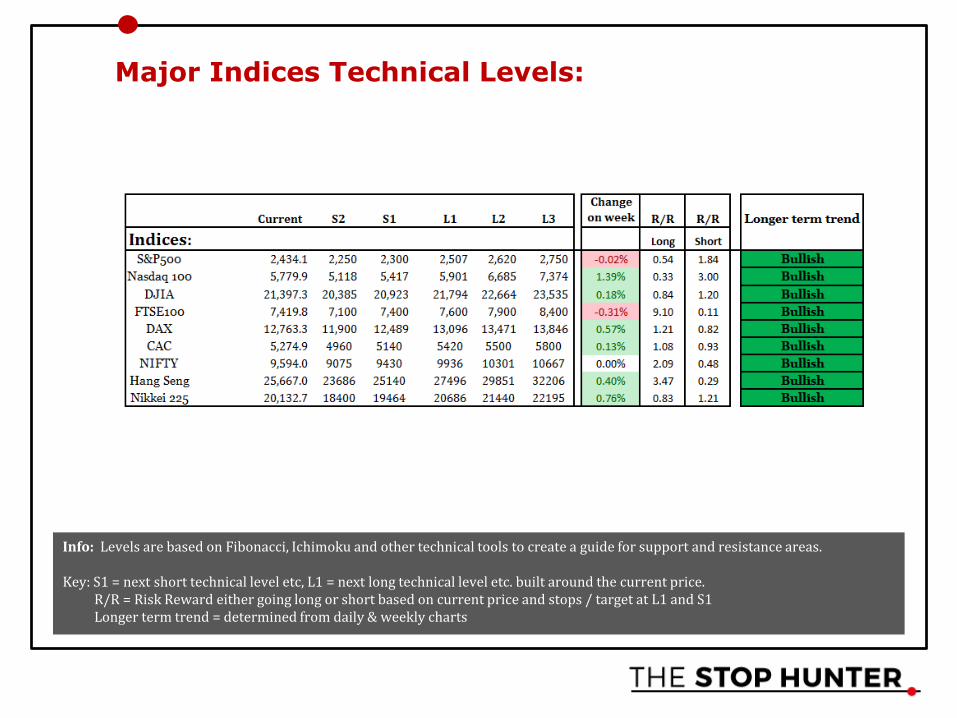
Major Indices Technical Levels:
Info: Levels are based on Fibonacci, Ichimoku and other technical tools to create a guide for support and resistance areas.
Key: S1 = next short technical level etc, L1 = next long technical level etc. built around the current price.R/R = Risk Reward either going long or short based on current price and stops / target at L1 and S1Longer term trend = determined from daily & weekly charts
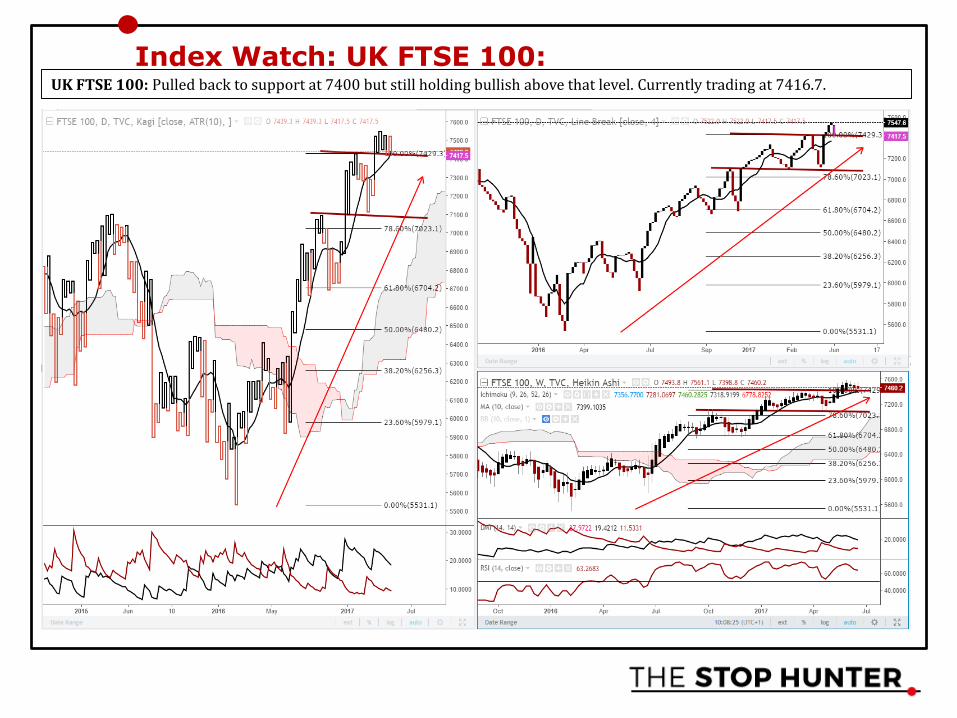
Index Watch: UK FTSE 100:UK FTSE 100: Pulled back to support at 7400 but still holding bullish above that level. Currently trading at 7416.7.
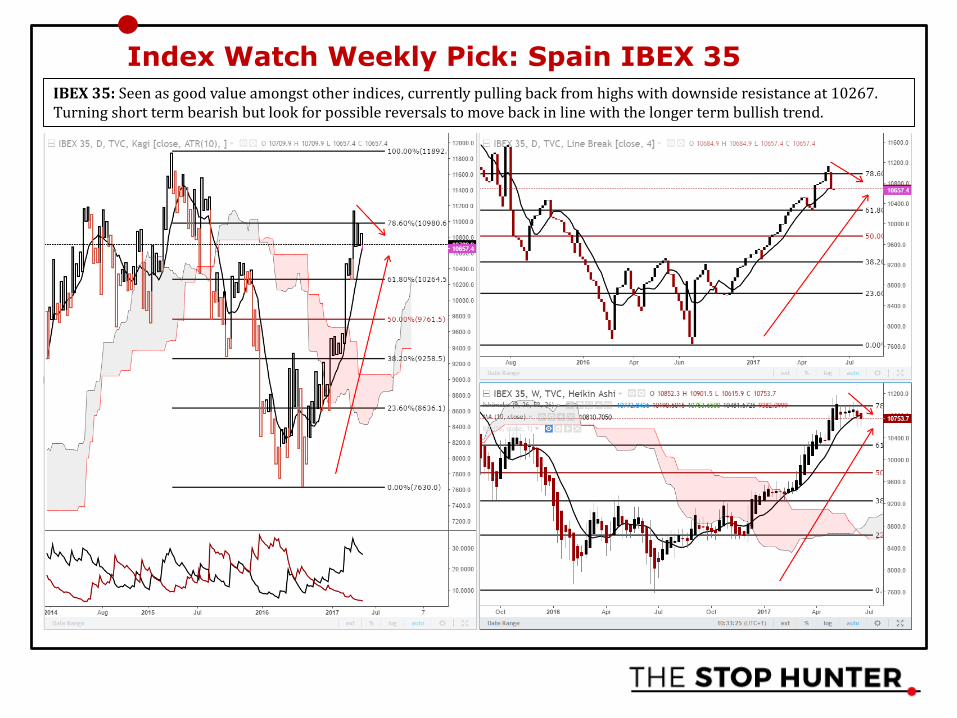
Index Watch Weekly Pick: Spain IBEX 35
IBEX 35: Seen as good value amongst other indices, currently pulling back from highs with downside resistance at 10267. Turning short term bearish but look for possible reversals to move back in line with the longer term bullish trend.
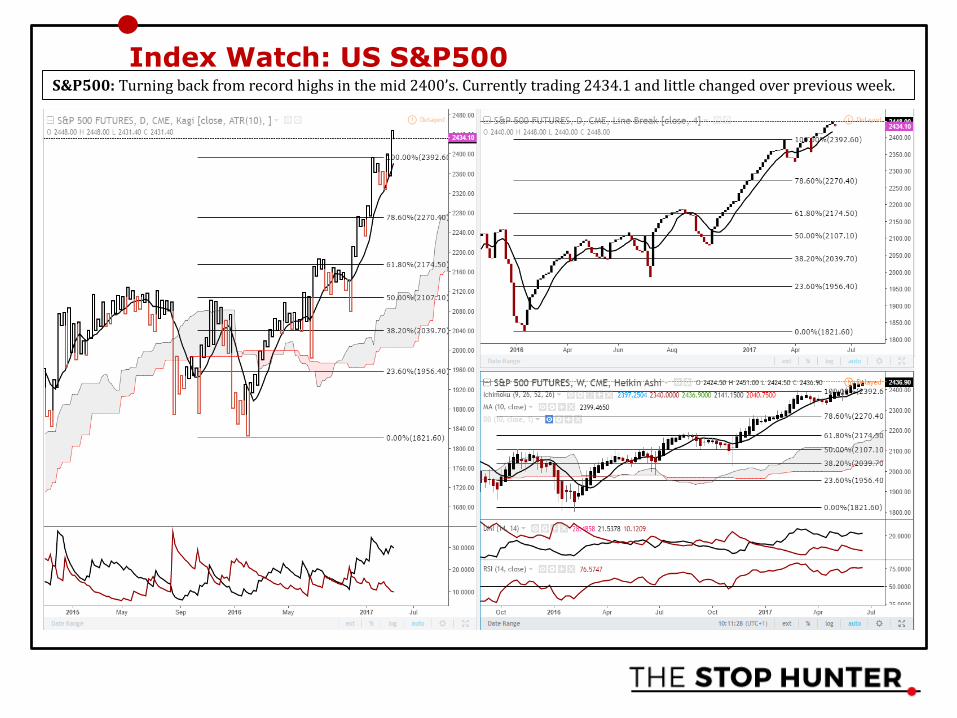
Index Watch: US S&P500S&P500: Turning back from record highs in the mid 2400’s. Currently trading 2434.1 and little changed over previous week.
4hr 3 Line Break chart:
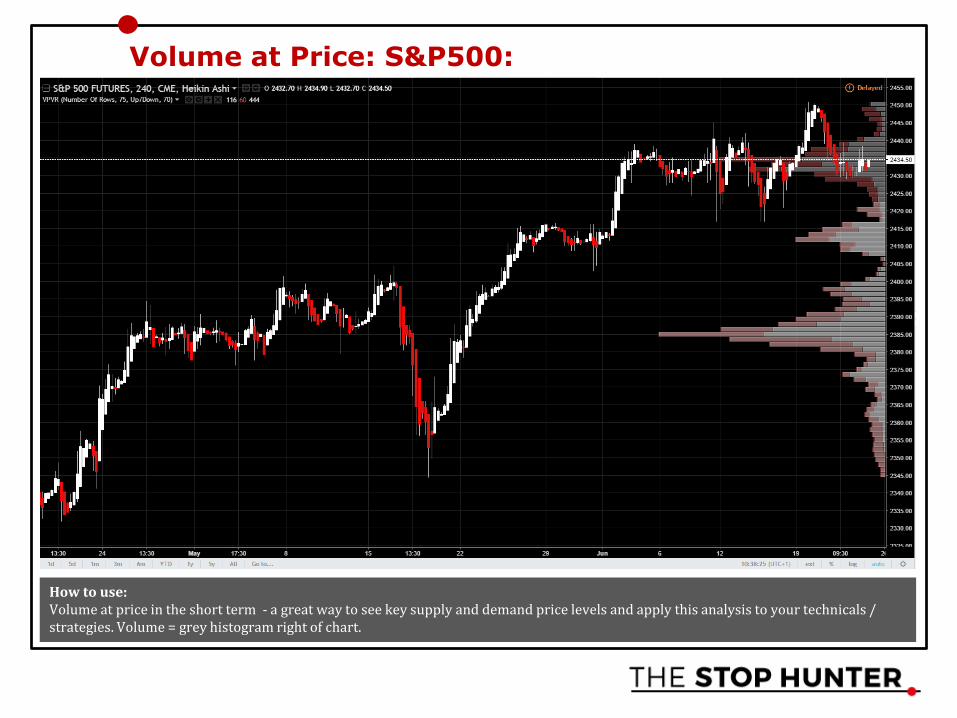
Volume at Price: S&P500:
How to use: Volume at price in the short term - a great way to see key supply and demand price levels and apply this analysis to your technicals / strategies. Volume = grey histogram right of chart.
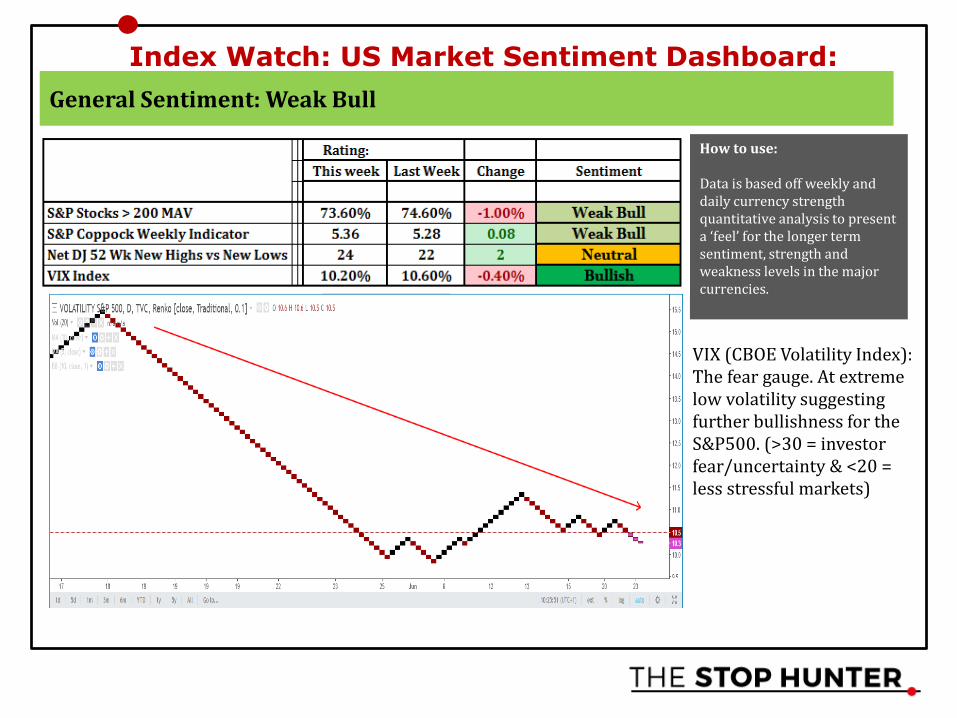
VIX (CBOE Volatility Index): The fear gauge. At extreme low volatility suggesting further bullishness for the S&P500. (>30 = investor fear/uncertainty & <20 = less stressful markets)
Index Watch: US Market Sentiment Dashboard:
General Sentiment: Weak Bull
How to use:
Data is based off weekly and daily currency strength quantitative analysis to present a ‘feel’ for the longer term sentiment, strength and weakness levels in the major currencies.
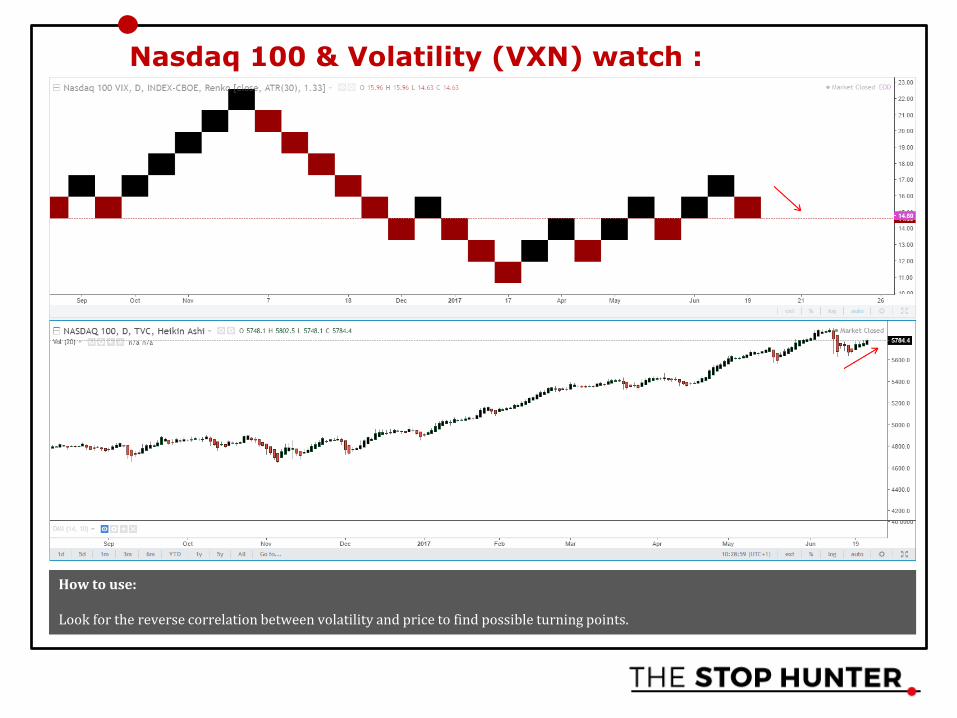
Nasdaq 100 & Volatility (VXN) watch :
How to use:
Look for the reverse correlation between volatility and price to find possible turning points.
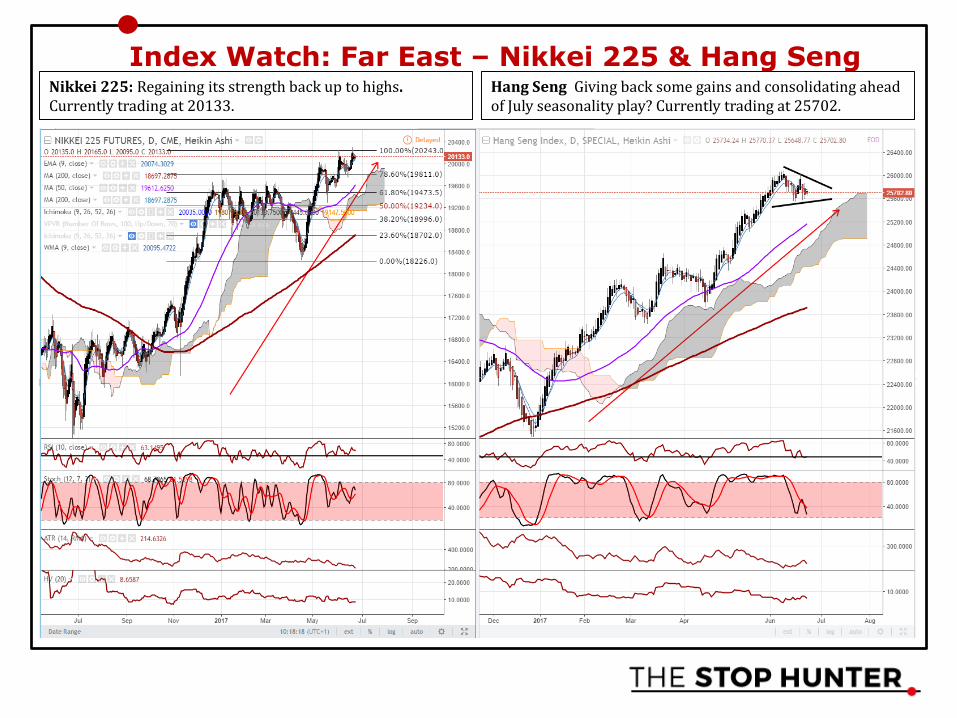
Index Watch: Far East – Nikkei 225 & Hang SengNikkei 225: Regaining its strength back up to highs. Currently trading at 20133.
Hang Seng Giving back some gains and consolidating ahead of July seasonality play? Currently trading at 25702.
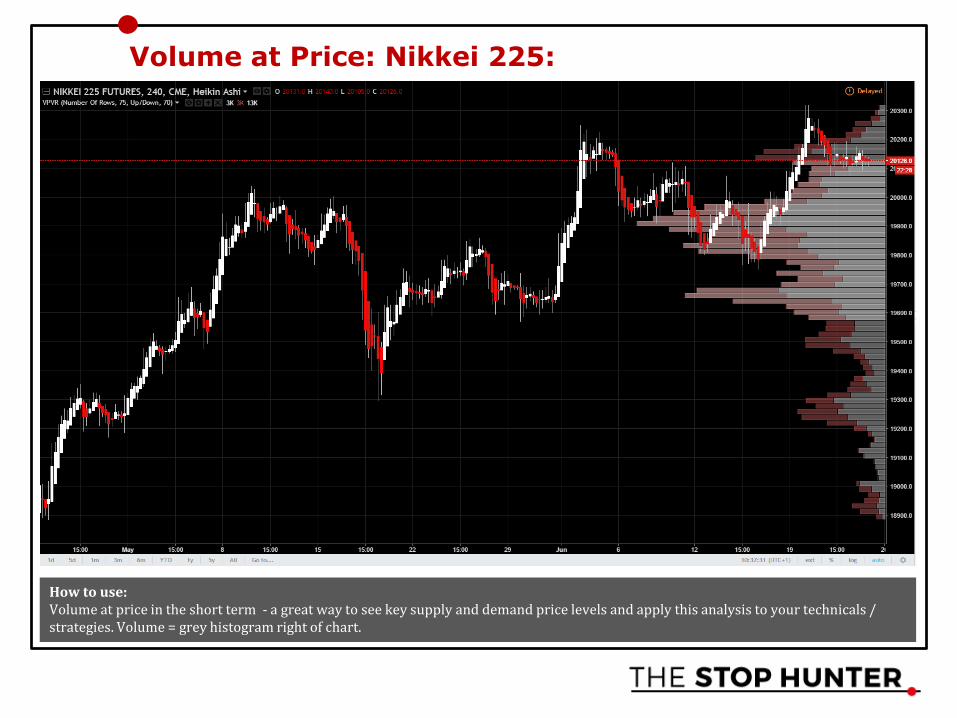
Volume at Price: Nikkei 225:
How to use: Volume at price in the short term - a great way to see key supply and demand price levels and apply this analysis to your technicals / strategies. Volume = grey histogram right of chart.
Author: Stephen Hoad, The STOP HUNTER
Stephen Hoad has worked in the City of London for nearly twenty years. He has worked for some of the top Investment Banks and Trading Houses, in a career that has taken him from global risk management (front office, market, quantitative), to successful commodities options trader, to own account proprietary trader.
His professional experience in the world of trading and risk management is vast and he has extensive knowledge of financial markets, especially in the fields of Commodities, FX and Equities. He has a strong quantitative background and is a qualified Technical Analyst – he is on the elite panel of lectures teaching the STA Diploma in Technical Analysis. He also holds an MSc in Financial Markets & Derivatives and a BA (Hons) in Business & Economics. His career has taken him worldwide and he has lectured in London, the Far East and the USA.
He is a leading expert in technical analysis, systematic/automated trading, derivatives products, financial and quantitative theory, risk management and regulatory practices. He also has experience of dealing and trading with China.
He founded THE STOP HUNTER in February 2015, which provides quality education, training, mentoring and resources to private investors throughout Kent, London and the South East, who want to learn how to successfully trade the financial markets. He also trades from his offices in Canterbury, Kent. Stephen also undertakes consultancy work in the City and is also a part-time University lecturer.
If you’d like to get in touch or require anyfurther information please contact us at:
w: www.thestophunter.co.ukt: 01227 811731e: [email protected]
For real-time market news, charts & much more follow us on Twitter:
@thestophunt3r
Disclaimer:
All rights reserved. This document may not be reproduced or transmitted in any form or by any means, electronic or mechanical, including photocopying, recording, or by any information storage and retrieval system in part or in whole without the express written permission of The Stop Hunter Ltd; except where permitted by law.
This document is intended solely for use by the individual recipient (Traders Club Member). It may not be reproduced or distributed for corporate purposes or personal gain without the express written permission of The Stop Hunter Ltd.
Commentaries, information and other materials contained in any part of this document are purely educational in nature and are not intended to amount to advice on which reliance should be placed. They should not be relied upon for the purpose of effecting securities transactions or other investing strategies, nor should they be construed as an offer or solicitation of an offer to sell or buy any security. We therefore disclaim all liability and responsibility arising from any reliance placed on any information displayed in this document (including without limitation liability and responsibility for any investment decision made), or by anyone who may be informed of any of its contents.
Trading and investing involves a very high degree of risk. Past results are not indicative of future returns and financial instruments can go down as well as up resulting in you receiving less than you invested. Do not assume that any recommendations, insights, charts, theories, or philosophies will ensure profitable investment.