Embed Size (px)
Citation preview

Chapter 3
Transmission Grids: Stakeholdersin SmartGrids
In political and economic circles, and even for the general public, the term“SmartGrids” is used to denote everything concerning the evolution of electricalgrids, and more generally the entire electrical system.
On the one hand this evolution tends towards a further integration of renewableenergies on a large scale, and on the other hand it tends towards a role of grids thatfavors a service that has been adapted to demand by supplying consumers with toolsand services, which will allow them to determine their personal consumption andtherefore act upon it.
A “SmartGrid” is thus an electrical grid capable of efficiently integrating theactions of all users – generators and consumers – in order to ensure a durable andreliable power supply at minimum cost. Such a grid resorts to products and servicesthat involve information, communication, observation, control (software) and grid(hardware) technologies.
The concept of SmartGrids intends to give consumers a more active role in themarket, and also when using the grid in general, by smoothing out peaks inconsumption and any other hazards.
For the general public, the transmission grid operators can wrongly appear toonly be in charge of operating the infrastructures that link the power station that
Chapter written by Hervé MIGNON.
SmartGrids Edited by Nouredine Hadjsaïd and Jean-Claude Sabonnadière© 2012 ISTE Ltd. Published 2012 by ISTE Ltd.

58 SmartGrids
supplies them to the transformer station close to their home. The role of transmissiongrid operators is a lot more complex, since beyond electricity flow management onthe interconnected grid they are also in charge of balancing consumption andgeneration for each second in their area. They are also initiating exchanges betweencountries that heavily contribute to supply security and to optimization of the energymix. Finally, they define and implement the market mechanisms, sometimes incooperation with other market players such as energy exchanges, which will enablethis optimization for the consumer.
The transmission grids are therefore stakeholders in the emergence of smartgrids.
3.1. A changing energy context: the development of renewable energies
The concept of smart grids comes at a time when energy is undergoing profoundchanges.
The coming decades will see the energy sector evolve profoundly, with acommon aim being to decrease carbon footprints. The European scenarios aim foran 80% reduction in CO2 by 2050.
The electricity sector will play a crucial role in this dynamic – more than anyother sector – with its ability to use means of generation that do not emit CO2, inparticular renewable energies. Some European scenarios aim to achieve completelycarbon-free electricity generation by 2050.
Achieving these goals requires the development of new uses and modes ofconsumption, and a redeployment of means of generation on a European scale.There is the large-scale development of off-shore wind power in the North ofEurope on the horizon and significant potentialities that should be confirmed by thedevelopment of solar energy in the south. This can only be achieved by adequatelydeveloping pan-European electric transmission, which is becoming a crucial tool inthe success of this energy revolution.
These prospects open up new and numerous opportunities for transmission grids,but also new challenges that they intend to address while keeping a high level oftechnical and economic performance.
In France, it is about preparing the grid for new means of generation on nationalterritory, but it is also about reinforcing its integration into the European electricalsystem, where it will be called upon to act as a link between the north and south.
Transmission Grids: Stakeholders in SmartGrids 59
At the same time, it is necessary to meet the expectations of our fellow membersof the public when developing infrastructures. We need to prepare ourselves for thegrowing needs of grid renewal, as there is now increasing pressure on the existinggrid.
Actions taken to address these long-term challenges include the development ofvisions for 2030, in France following the provisional schedule for the balancebetween supply and demand of electricity published by Réseau de Transportd’Electricité (RTE) in July 2011. This schedule is built around different scenariosconcerning the “supply/demand” problem (continuation of current trends versusachieving 20/20/20 goals).
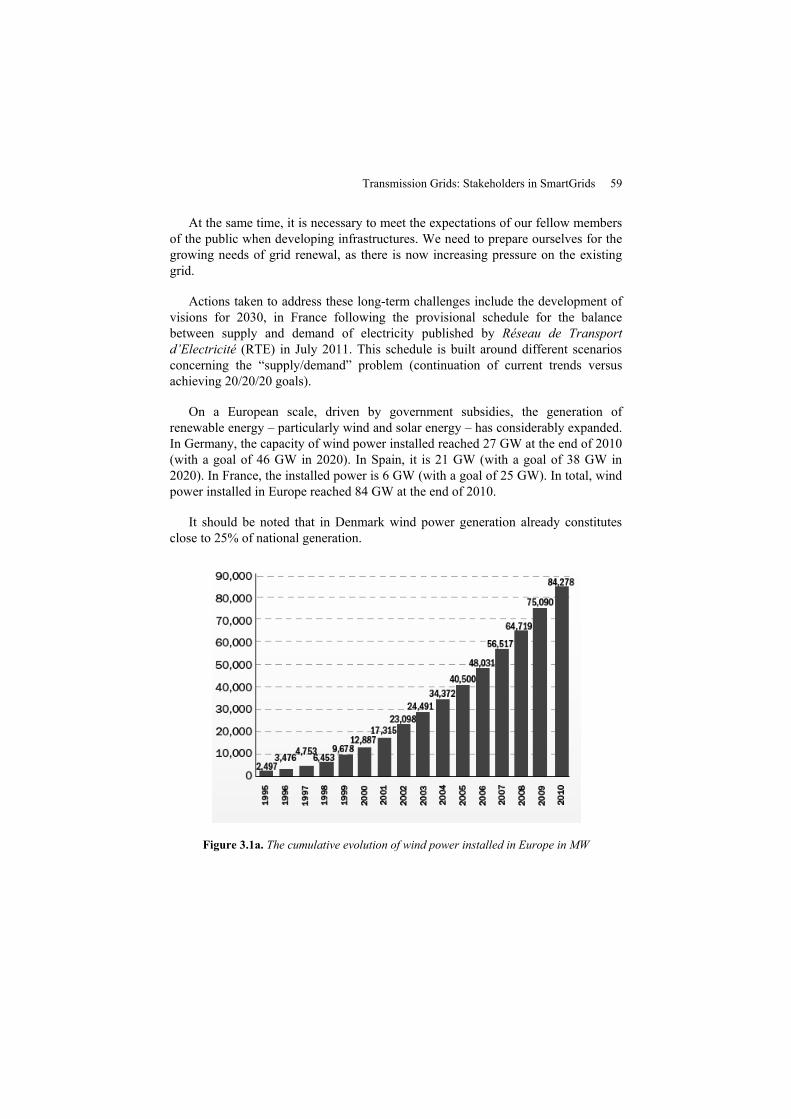
On a European scale, driven by government subsidies, the generation ofrenewable energy – particularly wind and solar energy – has considerably expanded.In Germany, the capacity of wind power installed reached 27 GW at the end of 2010(with a goal of 46 GW in 2020). In Spain, it is 21 GW (with a goal of 38 GW in2020). In France, the installed power is 6 GW (with a goal of 25 GW). In total, windpower installed in Europe reached 84 GW at the end of 2010.
It should be noted that in Denmark wind power generation already constitutesclose to 25% of national generation.
Figure 3.1a. The cumulative evolution of wind power installed in Europe in MW

60 SmartGrids
Figure 3.1b. The cumulative evolution of wind power installed in France
The size of wind farms is increasing considerably. Today the average size of awind turbine is between 2 and 3 MW, or even 5 to 6 MW for off-shore windturbines. According to farms, there is currently a continuous increase in the averagepower per farm in France, going from a few megawatts at the beginning of the 2000sto more than 16 MW at the end of 2010.
Solar energy is becoming more diffuse than wind energy. In France, at the end of2010, 91% of connected solar installations were less than 3 kW, representing 42% ofinstalled power. The greater 250 kW segment represents less than 1% of the systemsproducing 19% of the installed power.
In Europe, the evolution of solar power generation is very dynamic. In Germany,7.4 GWp were installed in 2011, for a generation achieving 17.3 GWp at the end of2010. In Italy, the capacity installed in 2010 was 2.3 GWp, i.e. more than double theinstalled capacity. In the initial phase in France, the pace of development wasquicker, moving from an installed power of 138 MW to 859 MW during 2010.
Annual installed powerCumulative power
6,000
5,000
4,000
3,000
2,000
1,000

Transmission Grids: Stakeholders in SmartGrids 61
Figure 3.2. European trend according to the roadmap for renewable energy sources (top);cumulative evolution of solar power installed in mainland France
(excluding Corsica (bottom))
Such levels of power illustrate the profound change in the nature of renewableenergies that were initially designed as distributed sources of energy via massproduction they have now become massive sources of generation close tocentralized levels of generation.
Currenttrend
NREAPRoadmap
Decimals are written with a comma. Source: EurObserv’ ER 2011
104,000
84,376
54,377
25,50929,329
16,30410,386
104,000
25,509
16.304 NREAPRoadmap
The Evolution of Solar Power
Annual installed powerCumulative power
62 SmartGrids
Contrary to a popular belief, the development of these new energies does notsignify the end of large transmission grids. Quite the contrary: as the German andSpanish examples have shown, these significant volumes of generation more thanever before require new transmission infrastructures.
3.2. A changing energy context: new modes of consumption
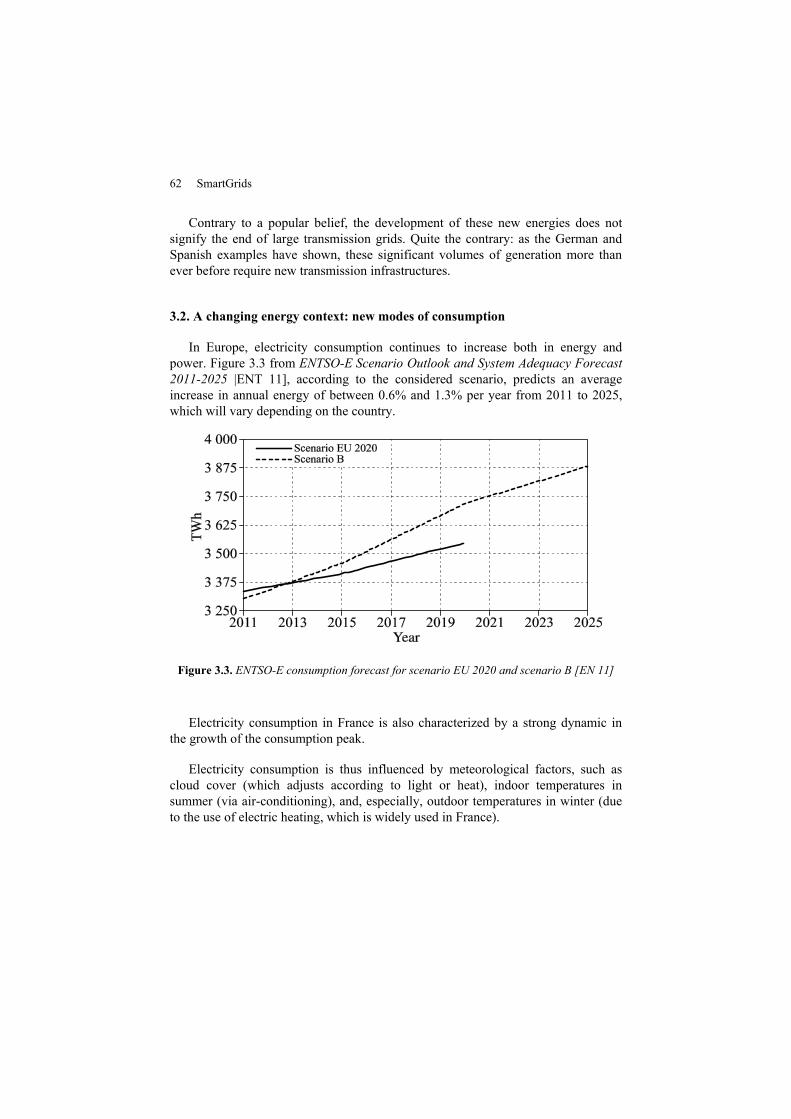
In Europe, electricity consumption continues to increase both in energy andpower. Figure 3.3 from ENTSO-E Scenario Outlook and System Adequacy Forecast2011-2025 |ENT 11], according to the considered scenario, predicts an averageincrease in annual energy of between 0.6% and 1.3% per year from 2011 to 2025,which will vary depending on the country.
Figure 3.3. ENTSO-E consumption forecast for scenario EU 2020 and scenario B [EN 11]
Electricity consumption in France is also characterized by a strong dynamic inthe growth of the consumption peak.
Electricity consumption is thus influenced by meteorological factors, such ascloud cover (which adjusts according to light or heat), indoor temperatures insummer (via air-conditioning), and, especially, outdoor temperatures in winter (dueto the use of electric heating, which is widely used in France).

Transmission Grids: Stakeholders in SmartGrids 63
To illustrate how electricity consumption depends on temperature, the graphs inFigure 3.5 show load curves measured during 11 weeks in the middle of winter, foreach of the past two winters.
These load curves are accompanied by average daily temperatures in France.
Figure 3.4. ENTSO-E average annual growth in consumptionbetween 2011 and 2020, EU 2020 scenario [ENT11]
It is in reference to these values that the temperature gradients are calculated(reports of changes in power consumption and changes in temperature), whose valueis currently around 2,300 MW/°C.

64 SmartGrids
Winter 2009/10
Winter 2010/11
Figure 3.5. Link between the electricity consumption and the temperature
It should also be noted that the height of a consumption peak is not the onlycharacteristic acting on the supply–demand balance that needs to be taken intoconsideration; its duration is just as important. This observation may seemparadoxical, since the balance is to be achieved in power at each moment,independently from what comes before or after.
December January February
(MW)
(°C)
December January February(°C)
(MW)
Key:
Power consumed (MW)
Instant temperature (°C)
Smothed temperature (°C)Smoothed temperature (°C)

Transmission Grids: Stakeholders in SmartGrids 65
It turns out that in practice, however, that some means of generation – especiallyhydraulics – have energy limitations that can occur each day due to the size of theirwater resource and/or restricted inputs. For example, a hydroelectric plant whosedaily generation is limited to 6 or even 4 or 3 hours at full power can easilyparticipate in a peak of high demand at full power when its duration is short. It willonly be able to participate at partial power, however, to cover a peak with a longduration. In this case, it is necessary to use additional means of generation – oftenthermal.
Figure 3.6a. Peak power during winter 2009-2010
Winter 2099/2010
March-10
February-10
January-10
Decem
ber-09
Novem
ber-09
Winter 2009/2010
Key:
supérieur à 88 000 MWentre 84 000 et 88 000 MWentre 81 000 et 84 000 MW
Greater than 88 000 MWFrom 84 000 to 88 000 MWFrom 81 000 to 84 000 MW

66 SmartGrids
Key:
Figure 3.6b. Peak power during winter 2010-2011
This behavior can be observed in real time during cold weather periods via“éCO2mix”, the service that provides details on emissions from consumption,generation by sector and details of CO2 emissions (supplied by RTE) on its websiteand on cell telephones.
In the French electrical system, the phenomenon of peak consumption is morestrictly associated with cold days (and, since these days come in groups, even in coldwaves) than a particular time of the day, as load curves illustrate.
Winter 2010/2011March-11
February-11
January-11
Decem
ber-10
Novem
ber-10
supérieur à 89 000 MWentre 85 000 et 89 000 MWentre 82 000 et 85 000 MW
Greater than 89 000 MWFrom 85 000 to 89 000 MWFrom 82 000 to 85 000 MW

Transmission Grids: Stakeholders in SmartGrids 67
One of the European objectives is to reduce energy consumption by 20%compared to 1990 while reducing greenhouse gas emissions by 20% compared with1990. This will require very significant demand-side management efforts and thetransfer of energy usage to electricity is very likely.
These include heat pumps and electric vehicles. Figure 3.7 from the provisional2009 RTE report [RTE 09] shows the outlook for the evolution of particular electricvehicles.
Figure 3.7. Consumption scenario as a function of EV fleet withand without DSM [RTE09]
The appearance of electric vehicles has an impact in terms of energy but alsopower. In France, the national plan for the development of rechargeable hybrid andelectric vehicles was launched in October 2009 in order to circulate 2 millionrechargeable hybrid and electric vehicles in 2020.
The deployment of charging infrastructures is one of the major elements of thisplan and in April 2011 was the subject of a Green Paper [MIN 11]. It recommendsfavoring normal charging (3 kVA) for parking spaces on which cars are parked formore than 90% of the time. Accelerated and rapid charging should be considered forthe minority and for exceptional solutions. Furthermore an analysis by theCommissariat Général au Développement Durable [COM 11] shows that chargingstations should predominantly be installed in the private domain (home), where slowcharging will be favored in order to limit power demand.

68 SmartGrids
Following studies on the impact of charging electric vehicles on the consumptioncurve, that were made public three scenarios were studied in the RTE provisionalreport [RTE 11]: “natural charge”, “price signal” and battery management system.
Consequent demand for power can therefore occur at peak times that are alreadysignificant if no incentive or strategy is predicted or planned to enhanceconsumption during off-peak hours.
Figure 3.8. Average consumption curves for a working day
3.3. New challenges
To respond to these different challenges, while ensuring the same level of supplysecurity, the electrical system must be more flexible. This requires greaterintelligence in the grids at all levels, from the distribution grid to the transmissiongrid, as well as more intelligence in the management of generation and consumption.
The IEA, in its smart grid roadmap [IEA 11a] quotes the different availablesmart technologies. These concern both generation, consumption and the grids.
At generation level, the smart grids will more widely accommodate generationfrom renewable sources. In fact, these energies are distinct in that they areintermittent and difficult to control, creating a potential mismatch between supplyand demand, as Figure 3.9 shows:
a
Pow
erkW
/vehicle
Natural With price signal Price signal + BMS
a
b
c
Timeb c

Transmission Grids: Stakeholders in SmartGrids 69
Figure 3.9. Consumption and (wind power) generation ofelectricity in February 2011
In France, the required margins calculated by RTE have for several years takeninto account the possibly unforeseen hazards of wind generation. Despite theabundance of generation made possible by different areas of wind, flexible means ofgeneration (hydraulic or gas turbines (TAC)) must be available when there aredecreases in wind generation, which clearly adds costs to the electrical system. Inaddition, at times, there are surpluses of wind generation, which repeatedly result innegative electricity prices. In other words, producers are ready to pay to get rid oftheir generation.
The integration of intermittent energy is thus not only a challenge for the use ofthe grid, but also for the market.
On a more local level, solar generation also raises difficulties for flowmanagement on low and medium voltages, while the distribution grid is not initiallyexpected to increase generation.
An initial pillar of development for smart grids is thus to develop systems thatenable better monitoring and control of intermittent generation, especially attransmission grid level.

70 SmartGrids
Figure 3.10. The price of electricity on EPEX on October 4, 2009
In France, the RTE’s IPES project has thus ensured the observability of morethan 75% of installed wind generation and can thus better predict wind generation.
Figure 3.11. Evolution of wind power over time and its observability
At the level of electricity consumption, all demand-side management efforts willhelp mitigate the evolution of both energy and power consumption. New regulationson buildings and household appliances will achieve an increased level of energy
a day a week a month a trimester years Total
Germany/ Austria Switzerland
Price

Transmission Grids: Stakeholders in SmartGrids 71
efficiency. Some systems, especially domestic ones, even allow for analysis of thefrequency of the grid and manage consumption according to this.
In addition, the introduction of new smart information and communicationtechnologies will allow the consumer to actively participate in the balance of thesystem.
Smart meters educate consumers about their consumption profiles. Load controlservices already allow an external operator (aggregator or supplier) to partiallycancel consumption on a market signal. The customer can also manage his ownconsumption with a price incentive from the provider.
In both cases, smart technologies are necessary. Any action on the load curve inreal time requires an information system that will allow for the collection ofinformation and the sending of orders for load-shedding consumers. Similarly, thedirect participation of the consumer requires a deployment of smart meters withseparate tariff items. The experiments on this subject, particularly in the US, showthat these price signals are more efficient when cancellation is automaticallycontrolled on the price signal.
There are many reasons for the consumer to participate in sheddingconsumption. On the one hand, their bill will be reduced because they will haveconsumed less; and on the other hand they will be able to benefit from incentiveprice packages from their provider in return for their cancellation. Some consumerswill also be interested in participating in a step towards eco-consumption.
Figure 3.12. CO2 gas emissions from France’s energy during two days in 2011
c
a
d
a
b
c
db
Consumption 04/01/2011
Consumption 22/08/2011Consum
ption(M
W)
CO2em
issio
ns(ton
s/h)

72 SmartGrids
In fact, the cancellations could be an alternative to medium and extreme peaks,which are major emitters of greenhouse gases. Figure 3.12 illustrates the CO2 gasemissions of France’s energy use for two days in 2011: although consumption levelsare two times higher than normal, the levels of CO2 emissions are four times higher.The removal of carbon from energy use requires the integration of renewableenergies, but the consumer can also actively participate in it.
Consumption shedding or load piloting are thus the second pillar for smart grids.These cancellations will be able to substitute for major emitters of greenhouse gas,resulting in gains for both the system and the environment.
By way of illustration, in Britain during winter of 2010–2011, the 30,000subscribers to the Ecowatt device set up by RTE favored a decrease of around 2.5%in the consumption of electricity at peak hours.
Storage is a third axis of research, which could provide an additional lever offlexibility. Electrical energy produced during a period of low consumption will bestored to be injected into the grid during peaks, and will thus balance theconsumption and generation curve.
Currently, the most mature storage is hydraulic storage. In France, the installedcapacity is 4.3 GW. The other means of storage, whether they are large or smallscale, although they have interesting technical performance, have not yet produced aconvincing business model. Technical progress must be achieved to sufficientlydecrease costs.
More generally, the various concepts mentioned in the proceeding sections mustbe technically and economically evaluated before possible deployment can bevalidated. Simulation and demonstration projects are taking place in France andEurope, and the transmission grid operators are involved in many of them, forexample the TWENTIES project, SafeWind, Optimate, etc.
3.4. An evolving transmission grid
If the transmission grids are already widely “smart”, with observability andpiloting capacity for grids, and generation has already been acquired, they will haveto cope with new challenges in order to balance large intermittent generation anddeliver energy from new remote areas of generation
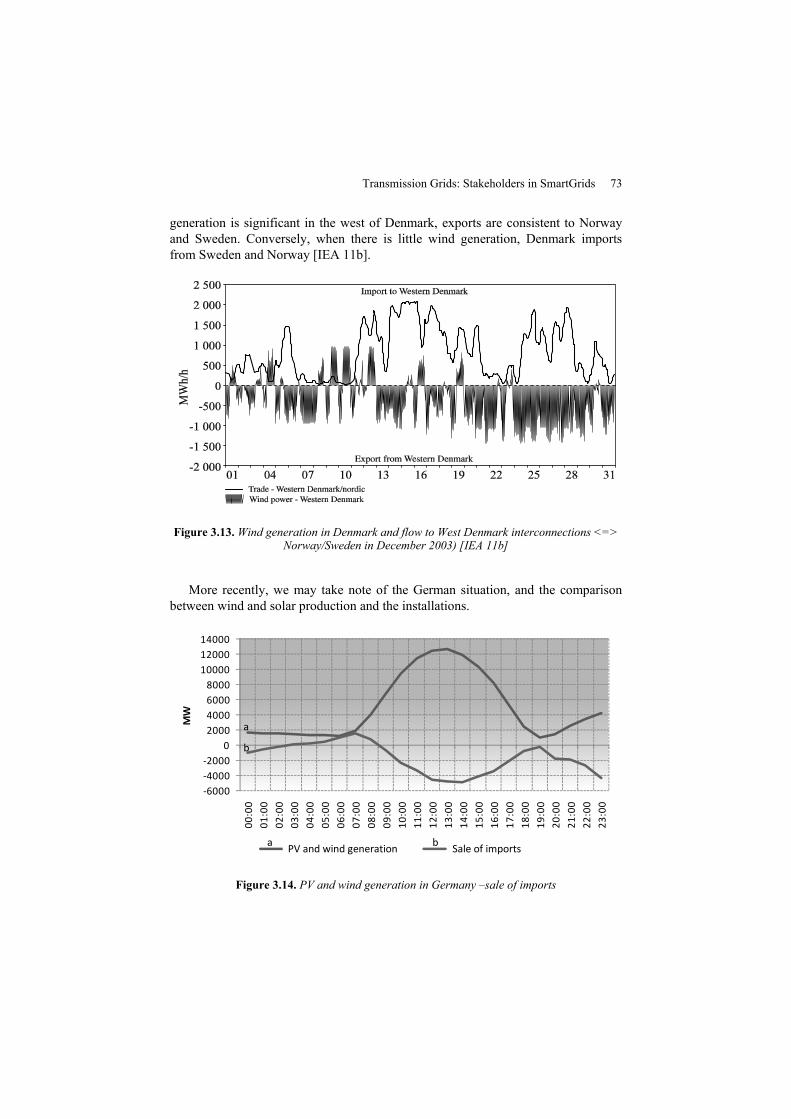
A frequently mentioned example is Danish wind power, whose variations arecompensated for by Norwegian and Swedish hydroelectric power thanks to well-developed interconnected grids. Figure 3.13 [IEA 11b] shows that when wind
Transmission Grids: Stakeholders in SmartGrids 73
generation is significant in the west of Denmark, exports are consistent to Norwayand Sweden. Conversely, when there is little wind generation, Denmark importsfrom Sweden and Norway [IEA 11b].
Figure 3.13. Wind generation in Denmark and flow to West Denmark interconnections <=>Norway/Sweden in December 2003) [IEA 11b]
More recently, we may take note of the German situation, and the comparisonbetween wind and solar production and the installations.
Figure 3.14. PV and wind generation in Germany –sale of imports
-6000-4000-2000
02000400060008000
100001200014000
00:00
01:00
02:00
03:00
04:00
05:00
06:00
07:00
08:00
09:00
10:00
11:00
12:00
13:00
14:00
15:00
16:00
17:00
18:00
19:00
20:00
21:00
22:00
23:00
MW
Production éolienne et PV Solde des imports
a
b
a bPV and wind generation Sale of imports

74 SmartGrids
Figure 3.15. PV and wind generation/imports to Germany
The development of Spanish wind generation has been very significant in recentyears. Up to now, hydraulic facilities and gas plants have brought sufficientflexibility. Thus, very little wind generation was lost (0.6% of the total generation in2010). The new connection between France and Spain will bring the advantage offlexibility in order to integrate and value the current renewable energies and expandacross an area larger than the Iberian Peninsula.
Figure 3.16. The driving forces behind grid development [ENT09]
-10000
-5000
0
5000
10000
15000
20000
25000
21/08/20
1100
:00
22/08/20
1100
:00
23/08/20
1100
:00
24/08/20
1100
:00
25/08/20
1100
:00
26/08/20
1100
:00
27/08/20
1100
:00
28/08/20
1100
:00
29/08/20
1100
:00
30/08/20
1100
:00
31/08/20
1100
:00
MW
PV+Eolien
Imports
a
bb
a PV + wind
Transmission Grids: Stakeholders in SmartGrids 75
The Ten Year Network Development Plan by ENTSO-E [ENT 09] shows thatthe development of renewable electric generation, particularly wind, is a drivingforce for transmission grid development in the same way as supply security andmarket liquidity. The ambitious objectives of European countries in terms of long-and short-term renewable energies will further highlight these needs.
In recent years, numerous scenarios have been published showing a long-termoutlook for the electrical system, with a large proportion of renewable energiesassociated with the development of smart grids. Aspects relating to transmissiongrids are becoming increasingly consequential in these scenarios and awareness forthe need to develop them is growing.
More than ever, the grid is a tool for sharing the uncertainties of the system. On alocal level, if a solar panel breaks down, an individual must be able to rely on windpower or sharing electricity generated by his neighbors, which will allow for asystem of solidarity to be created. On a larger scale, in Europe for example, a wellmeshed grid will increase the accessible resource and benefit from an expansion ingeneration that contributes to reducing the variability of renewable energy and alsocontributes to the organization of sharing generation hazards. Electricity is generatedwhere the quality of the resource is the most ample, for example wind power in thesea where winds are the most regular or in the desert for solar power where the areasare sunniest.
Furthermore, for the same energy – typically wind – a great distance between thesources leads to at least partial decorrelation of their generation. The wind patternsof the North Sea, the perimeter of the Mediterranean, the Atlantic coast and the eastof Europe being different, wind farms placed in these areas complement each otherand produce electricity for more hours in the year. By pooling several renewableenergies on the same grid, a degree of complementarity is introduced to theresource: when the wind does not blow, there is perhaps some sun to substitute it orvice versa. This complementarity, which is evident both during the day and whenconsidering the different seasons, could be particularly useful during a heat wavewhere a good solar resource would offset the lower wind generation.
Even with the development of diffuse generation (which remains modest orunspecified in the scenarios), the tendency for a greater population concentration,associated with the geographical constraints of production, makes a large-scaletransmission grid necessary. Finally, such a grid relying on a large diversity ofresources over a large area could allow for the significant growth of renewableenergy within the energy mix and thus consolidate the gains obtained by storage andenergy efficiency measures by reducing reliance upon emergency power, which usesfossil fuels.

76 SmartGrids
It also has an obvious economic interest: the larger and more meshed the grid is,the easier it will be able to overcome the loss of a line or a means of generation. Inaddition, the ratio between the cost of a means of generation and the cost of a line isoften in favor of the latter. The best pooling offered thus minimizes the totalcapacity that needs to be installed in order to meet the demand. The global loadcurve is even smoother when the number of consumers is high, especially if they areremote from one another because, among other things, of a greater decoupling oftemperatures. Similarly, by playing on the complementarity of different means ofgeneration in different countries, it is possible to reduce global costs.
3.5. Conclusion
The smart grid stakeholders, transmission grid operators, intend to address threechallenges to accompany the current change in energy.
The first challenge is geographical, as areas for the installation of new means ofgeneration can be situated far from current areas of generation and consumption,such as large agglomerations. The transmission grid must therefore evolve toaccommodate and deliver these new energies. By way of illustration, the analysiscarried out in Germany by the DENA (the German energy agency) for theintegration of renewable energies, highlights the need to create around 4,000 km ofadditional extra high voltage (EHV) lines to accompany the integration of renewableenergies. This need has been confirmed at European level by a 10-year plan for thedevelopment of the electricity transmission grid published by ENTSO-E [EN 09],which anticipates the creation or renewal of around 20,000 km of EHV linesbetween now and 2020 to accommodate renewable energies.
The second challenge is operational, because integration of fluctuating andintermittent energy on such a scale will lead to the structural modification ofmanagement arrangements for the reliability of the electrical system, especially interms of the generation capacity necessary for the prevention of peaks and troughs.In France, the inconsistency of consumption in winter, 1°C below the seasonalaverage is the equivalent of anticipating two years’ growth of the past 10-year peak– which is currently the basis for grid design. This will be replaced in futureoperation by variance in generation – changes in wind and solar rays.
The third challenge is temporal, because if some renewable capacities can becreated in two or three years the creation of new lines requires almost 10 years,which is mainly due to mounting administrative procedures. In this regard, it shouldbe noted that in Germany or Spain the development of electricity transmission gridsis perceived by all to be necessary in the development of green energies. Thus the

Transmission Grids: Stakeholders in SmartGrids 77
energies. Thus the German legislature has already speeded up the implementation ofthe EHV lines needed to support the development of renewable energies.
A security, flexibility and optimization tool for the electrical system, thetransmission grid should address these different challenges in order to address thenecessary long-term evolutions.
At European level, it will not be sufficient to create new lines of electricalinterconnections between countries and connect them to national electricitytransmission grids. It is the entire European grid that has to be technicallyreconsidered and adapted. The idea of the super-grid, the super-smart grid orelectricity highways is thus to profoundly remap the geography of the Europeanelectrical grid by allowing for a juxtaposition of national grids to a real Europeanelectrical grid capable of using the complementary qualities of European territoryand to accommodate renewable energies.
In its report, the WWF indicates in the report on energy that “the solution lies inthe combination of huge and smart grids. The electrical grids that supply our worldare one of the gems of 20th century engineering. The work that we need to carry outto modernize them over the next ten years will be one of the biggest challenges of the21st century” [WWF 11].
These are the challenges that the transmission grid intends to address.
3.6. Bibliography
[COM 11] COMMISSARIAT GÉNÉRAL AU DÉVELOPPEMENT DURABLE, Une ÉvaluationProspective des Véhicules Électriques, Review no. 86, CGDD, May 2011 (A ProspectiveEvaluation of Electric Vehicles).
[ENT 09] ENTSO-E, European Ten Year Network Development Plan, ENTSO-E, 2009,(Available at: http://www.entsog.eu/download/regional/ENTSOG_TYNDR_MAIN_23dec2009.pdf, accessed 2.8.12.)
[IEA 10] IEA, Smart Grid Roadmap, 2010.
[IEA 11a] IEA, Technology Roadmap, Smart Grids, International Energy Agency, 2011.(Available at: www.iea.org/papers/2011/smartgrids_roadmap.pdf, accessed 2.8.12.)
[IEA 11b] IEA, Empowering Variable Renewables – Options for Flexible Electricity Systems,International Energy Agency, 2011.
[KTH 09] KTH, Impact of the Electric Vehicle on the Electric System, KTH, July-November2009.
78 SmartGrids
[MIN 11] Ministère de l’Ècologie, du Développement Durable, des Transports et duLogement, Livre Vert sur les Infrastructures de Recharge Ouvertes au Public, MEDDTL,April 2011. (Green Paper on Public Charging Infrastructures) (Available at:www.developpement-durable.gouv.fr/Le-senateur-Louis-Negre-remet-son.html, accessed2.8.12.)
[RTE 11] RTE, Bilan Prévisionnel de l’Équilibre Offre-demande d’Électricté en France,Réseau de Transport d’Electricité, 2011. (Available at: https://eeweb01.ee.kth.se/upload/publications/reports/2009/XR-EE-ES_2009_018.pdf, accessed on 2.8.12.)
[WWF 11] WWF, 100% Renewable Energies in 2050, WWF, EuroObserv’Er, 2011.


![Smart Grids[1]](https://img.dokumen.tips/doc/110x75/541009b77bef0a0e0a8b45d7/smart-grids1.jpg)