Embed Size (px)
Citation preview

SIK – Rapport Nr. SR 860
2013
Cleaning technology in high
temperature food processing
-A Literature Review
Carin Hagsten
"[Klicka här och skriv År]"
SIK-Rapport Nr. SR 860
2013
Cleaning technology in high temperature
food processing
-A Literature Review
Carin Hagsten
Table of Contents
1 Introduction ......................................................................................................................... 1
1.1 Challenges for heat processing of milk ....................................................................... 2
2 Milk composition and properties ........................................................................................ 4
2.1 Carbohydrate and lipid chemistry of dairy products ................................................... 4
Lactose ............................................................................................................................ 4
Lipids ............................................................................................................................... 5
The milk fat globule ........................................................................................................ 5
2.2 Inorganic salts in milk ................................................................................................. 6
Calcium phosphate .......................................................................................................... 7
Reverse solubility ............................................................................................................ 7
2.3 Milk proteins ................................................................................................................ 8
2.3.1 Whey protein ........................................................................................................ 9
2.3.2 Caseins ................................................................................................................. 9
2.3.3 Casein micelle formation ................................................................................... 10
Coat-core model ............................................................................................................ 10
Submicellar model ......................................................................................................... 10
2.4 Conclusions on the milk composition ....................................................................... 11
3 Dairy fouling, produced during heat processing ............................................................... 12
3.1 Temperature dependent changes in fouling composition and structure .................... 12
3.2 Colloidal forces controlling milk fouling .................................................................. 13
3.2.1 Van der Waals attraction .................................................................................... 13
3.2.2 Electrostatic repulsion forces ............................................................................. 15
3.2.3 Lewis acid-base and hydrophobic interactions .................................................. 15
3.3 The growth of a fouling layer .................................................................................... 16
3.4 Conclusions regarding milk fouling .......................................................................... 19
4 Evaluation of milk fouling ................................................................................................ 20
4.1 Heat transfer changes due to dairy fouling ................................................................ 20
4.2 Pressure changes due to dairy fouling ....................................................................... 22
4.3 Methodologies for measuring fouling buildup, composition and structure ............... 24
Electron Spectroscopy for Chemical Analysis (ESCA) ................................................ 24
Time of Flight-Secondary Ion Mass Spectrometry (TOF-SIMS) ................................. 24
4.3.1 Content of organic compounds .......................................................................... 25

Kjeldahl methods ........................................................................................................... 25
UV absorbance .............................................................................................................. 25
Chemical oxygen demand (COD) ................................................................................. 26
High performance liquid chromatography (HPLC) ...................................................... 26
4.3.2 Mineral content .................................................................................................. 26
Atomic absorption spectroscopy (AAS) ....................................................................... 26
Flame photometry ......................................................................................................... 27
4.3.3 Structural analysis .............................................................................................. 27
Scanning electron microscopy (SEM) ........................................................................... 27
Transmission electron microscopy (TEM) .................................................................... 27
Atomic Force Microscopy (AFM) ................................................................................ 28
Confocal laser scanning microscopy (CLSM) .............................................................. 28
4.3.4 Thin film adsorption and desorption .................................................................. 28
Quartz crystal microbalance with dissipation (QCM-D) .............................................. 28
Ellipsometry .................................................................................................................. 29
5 Model fouling for studying fouling build up and cleaning processes ............................... 30
5.1 Production of model fouling ...................................................................................... 30
5.2 Model fouling to mimic type A fouling ..................................................................... 31
5.3 Model fouling to mimic type B fouling ..................................................................... 31
6 The importance of cleaning - to obtain and evaluate the clean surface ............................ 32
6.1 Cleaning of different fouling types in the dairy industry .......................................... 32
7 To understand the cleaning process .................................................................................. 34
7.1 Mechanisms involved in the cleaning process .......................................................... 34
7.2 Models to describe the cleaning process ................................................................... 38
7.2.1 Gallot-Lavalleé and Lalande 1985 ..................................................................... 38
7.2.2 Bird and Fryer 1991 ........................................................................................... 40
7.2.3 Jeurnink and Brinkman 1994 ............................................................................. 41
7.2.4 Grant et al 1999 .................................................................................................. 44
7.2.5 Xin et al 2004 ..................................................................................................... 45
7.3 Conclusion for the understanding of the cleaning process ........................................ 48
8 Evaluation of the cleaning efficiency................................................................................ 49
8.1 Industrial evaluation of the cleaning process ............................................................ 49
8.2 Evaluation of the cleaning process reveal the mechanism ........................................ 50

8.3 Methodologies for evaluating cleaning mechanisms and efficiency ......................... 50
Diffusion analysis by Fluorescence recovery after photo bleaching (FRAP) ............... 50
Fluid dynamic gauging to follow thickness changes .................................................... 51
Ultrasound to follow thickness changes in-line and over time ..................................... 52
Conductivity and turbidity ............................................................................................ 53
9 References ......................................................................................................................... 56
Abbreviations:
AAS - Atomic absorption spectroscopy
AFM - Atomic Force Microscopy
CIP – cleaning in place
COD - chemical oxygen demand
ESCA - Electron Spectroscopy for Chemical Analysis
FE-SEM - Field-Emission Scanning Electron
Microscope
FRAP - Fluorescence recovery after photo bleaching
HPLC - high performance liquid chromatography
MFGM - milk fat globule membrane
pI – isoelectric point
QCM-D - Quartz crystal microbalance with dissipation
SEM - Scanning Electron Microscope
SMUF - Simulated milk ultra-filtrate
TEM - Transmission electrone microscopy
UHT - Ultra high temperature
WPC - Whey Protein Concentrate
WPI - Whey Protein Isolate
XPS - X-ray Photoelectron Spectroscopy
Subscripts
A area
Axxx and Åxxx absorbance at a specific wavelength
C constant
c velocity of sound
ci concentration of element i
D diameter
Di diffusion coefficient of element i
E binding energy
e energy flux vector
Er rate of reaction
f friction factor
F thickness of reaction front
h convective heat transfer coefficient
h distance between two surfaces
H Hamaker constant
hυ photon energy (where h is the Planck’s constant and υ the photon frequency)
J mass transfer flux
k Boltzmann constant
kA first order rate constant
km is the mass transfer coefficient
ki thermal conductivity coefficient
L distance
M mass
n overtone number
p pressure
r and R radius
R ideal gas constant
r thickness of composite
RF fouling resistance
ri rate of reaction
T temperature
U overall heat transfer coefficient
V volume
w mass rate of flow
X unreacted fouling
Y swelled intermediate fouling
Z final removable unit.s (section 7.2.1)
Z impedance (section 8.3)
z valence
1/κ Debye screening length
β is the mass transfer coefficient
γ surface tension
η viscosity
θ contact angle
ξ kinetic constant
ρ density
φ volume fraction
ψ surface potential

Introduction
1
1 Introduction
Milk is a diverse raw material. Milk for human consumption mainly comes from cow, goat
sheep and buffalo, where the cow milk represents 84 % of the world’s milk consumption. The
milk consumption in the world is large, and in 2009 the consumption of milk and milk
products, also including production of feed, was 703 million tons [1]. In Sweden the produced
amount of milk was 2.85 million tons in 2011 and the largest part of the production is the
milk for direct consumption together with the ferment milk products like yoghurt (Figure 1)
[2].
Figure 1 The production of milk products from the Swedish cow milk. Adapted from the Swedish Dairy Association [2]
Milk is produced in the mammary glands in the cow udder and is released upon contraction.
The milk is sterile as long as it is inside the udder in a healthy cow. It is during milking and
transport to the dairy that the milk is exposed to microorganisms that can contaminate the
milk. Not all microorganisms can digest lactose, which is the main digestible carbohydrate
source in milk. Milk is also deficient in iron, which for many bacteria is necessary for growth,
but there are those that do survive and thrive. Some of these organisms can cause disease and
in severe cases be fatal.
Milk and milk products have to be safe to be allowed into the market for human consumption
and since raw milk may contain several bacteria, it has to be processed to assure safety. Milk
is therefore heated to a certain temperature in order to kill off the microbial growth and to
deactivate some of the enzymes that otherwise can degrade the lipids and proteins, decreasing
the shelf life of the product. The processing of raw milk can differ between different dairies,
but the main aim to produce a safe high quality product is the same.
Milk is usually standardized by mixing skim milk and cream to obtain the desired fat content
of the product. The standardized milk can then either be pasteurized, i.e. heat treated to about
75°C, or treated at a higher temperature to produce a product with a longer shelf life. The raw
milk is filtered when it arrives to the dairy and is as a second step either cooled or rapidly
heated before cooling. A rapid heating can neutralize some microorganisms, which allows the
pasteurization temperature to be slightly lower. The milk is then separated into one high fat or
44%
33%
18%
5% Liquid consumption,yoghurt, cream etc.
Cheese production
Milk powder andcondensed milk
Other (butter etc.)

Introduction
2
cream fraction, which partially is intended for high fat products, and skim milk. The cream
that is intended for low fat product is homogenized before remixing with the skim milk to the
desired fat content. The homogenization is needed to prevent phase separation with a cream
layer on top of the skim milk [3].
For countries where the milk consumption is high as it used as a beverage, the off flavor taste
that can be caused by ultra-high temperature (UHT) treatment is less desirable. In those
markets, the pasteurized milk is popular and the processing time after standardization is short.
The milk is pasteurized for 20 seconds at approximately 75 °C and is then packaged and
stored dark and cold. The milk processed with UHT sterilization is first going through a
pasteurization process and then the sterilization takes place at approximately 140°C. The
sterilization can be performed with both direct and indirect heating. Indirect heating with the
aid of a heat exchanger, require the milk to be homogenized. The gas dissolved in the liquid
phase needs to be removed before the heat treatment in order to decrease the deposit formed
on the walls of the heated tubes (or plates). UHT milk is packaged aseptically to prevent
recontamination after treatment and is then stored for a certain amount of days at the dairy in
room temperature to assure that no microbial growth occur in the product [3, 4].
1.1 Challenges for heat processing of milk
While reaching the fatal temperature for bacteria, the denaturation temperature of several
proteins is also reached and these proteins tend to aggregate and precipitate and or deposit
onto the heated surfaces, fouling (Figure 2).
Milk has the health benefit of providing the consumer with important minerals such as
calcium. However, the high content of calcium also creates one of the issues with fouling of
heated surfaces. The solubility of calcium phosphate has an inverse heat dependency and the
solubility of the mineral will therefore decrease with elevated temperature. Milk processing
therefore gives a fouling containing both proteins and minerals. For temperature below 100
°C the fouling on heated surface mainly contains protein (~60 %), whereas a change occur for
temperatures above 120 °C, above which the predominant constituents are inorganic
compounds (~80 %).
Figure 2 Fouling from heat-treated skim milk in a stainless steel canal.

Introduction
3
The deposit of protein and minerals on the heated surfaces is not so severe that it will decrease
the benefits of consuming milk and milk products by depleting them from nutrient. One of the
main draw-backs with the deposit is rather increase in the heat transfer resistance with the
buildup of fouling. The deposit is also a very nutritious habitat for thermophile bacteria and
spores from the unprocessed milk. One solution to assure that enough heat is transferred
through the deposit to the milk is to increase the temperature of the heated surface, but this
could both increase the fouling layer and is inefficient from an energy consumption
perspective. Cleaning of the equipment is done when the difference in temperature between
the heating media and the outlet milk exceed a certain limit.
Up to 6 hours per day is needed for sufficient cleaning of certain parts of the dairy process
equipment such as sterilizers. The water consumption during cleaning is high, approximately
0.5 to 5 liter per liter milk processed [5]. Cleaning is often performed in a closed loop
(Cleaning in place, CIP) with no other possibility to detect the result but to open the
equipment. The mechanisms of both fouling and cleaning have been studied for several
decades, but fundamental understanding of the mechanisms behind cleaning of milk fouling is
still lacking. This is especially true for the mineral rich fouling formed during elevated
temperatures. The reason is that it is difficult to study this process due to the lack of in-line
measurements and the difficulty to produce this particular fouling on a small laboratory scale.
With a better understanding of the mechanisms behind cleaning of different fouling systems, a
tailored cleaning protocol could be designed and used. Such cleaning programs could help
save energy, water and chemical consumption in the large dairy industries, thus provide input
towards an environmentally friendly, and safe food processes.

Milk composition and properties
4
2 Milk composition and properties
Milk from cows consists of approximately 87 % water. The remaining 13 % dry matter
components are divided among; carbohydrates, proteins, fat and inorganic material [6]. In
addition to milk; butter, cheese and milk powders are common dairy products consumed in
the world [1]. The concentration of the different components in milk can vary between
mammals of different species (Table 1), but also between different breeds. The health and the
environment for a cow are of great importance for the properties of milk, as well as the stage
of lactation and the breed. Seasonal changes occur in for example fat and protein
concentration, which prove a challenge and force adaptation in the dairy industry [7].
Table 1 Difference in milk composition between species g 100 g-1 [8]
Species Fat Protein Lactose Ash
Cow 3.9 3.2 4.6 0.7
Goat 4.5 3.2 4.3 0.8
Sheep 7.2 4.6 4.8 0.9
Buffalo 7.4 3.8 4.8 0.8
For this chapter the constituents of milk will be considered in more depth. The properties of
the constituents, when the temperature and pH change, are the reason that dairy products are
susceptible to fouling during the industrial process.
2.1 Carbohydrate and lipid chemistry of dairy products
Lactose
Together with fat and proteins, carbohydrates are main components in milk, where lactose (4-
O-β-D-galactopyranosyl-D-glucopyranose) is the most abundant sugar in milk. It is a
disaccharide composed of Galactose and Glucose (Figure 5). Lactose is important for the
newborn, due to the high energy content. The concentration in milk is approximately 4.6%
w/w [9]. The lactose concentration is higher early in lactation and then reduced with time due
to the decreased need for the energy supplement to the newborn. The synthesis of lactose in
the mammary gland can be regulated by the whey protein α-lactalbumin since its presence
changes the specificity of the enzyme Galactosyltransferase [7].
Figure 3 Lactose is a disaccharide formed by galactose and glucose.
During heat treatment Lactose will cause browning and off-flavor due to the Maillard reaction
(section 3.3).

Milk composition and properties
5
Lipids
The predominant lipids in milk are the triglycerides (98%, Figure 6), but milk also contain
phospholipids, cholesterol and low concentration of fat soluble vitamins [7].
The fatty acid composition can vary between batches of milk and differences in the amount of
saturated and unsaturated fatty acids can be seen at different stages of lactation as well as
varying with season [7]. Milk fats are generally more saturated during the winter and less
saturated during spring and summer. The fatty acid composition also differs depending on the
feed, which is another cause for the observed changing milk and dairy product properties with
season.
Figure 4 Schematic image of a triglyceride with the glycerol backbone and three fatty acids. R is a hydrocarbon chain and
the saturation of these will determine some of the properties of the fat in the milk.
The vitamin group β-carotenoids for example are soluble in the fat fraction of milk and give
the yellow color to butter. The concentration of β-carotenoids is feed dependent, hence also
the color of certain dairy products.
The milk fat globule
Most of the lipids found in milk are located in spherical globules (0.1 – 20 am) and milk can
therefore be regarded as an emulsion of oil in water [7]. The phospholipids, corresponding to
no more than 1% of the total amount of the milk lipids, are very important to the
microstructure of these fat globules. The phospholipids create the membrane structure
surrounding a triglyceride core [10, 11]. The main structure holding the globule together is a
monolayer of polar phospholipids surrounded by a phospholipid bilayer (Figure 7). The outer
membrane of the globule consists of not only phospholipids, but also of lipoproteins,
proteoglycans, trans-membrane proteins, and also of water bound to the surface. The protein
in the fat globule membrane account for approximately 1.2 % of the total protein content in
milk [6].
The polar outer layer of the fat globule prevents the oil phase to separate from the water
phase, i. e. prevent creaming. During homogenization of milk, the size of the globules are
decreased, thus the surface area is increasing. Since the phospholipid concentration in milk is
limited, proteins from whey and the casein fraction cover a significant fraction of the milk fat
globule. The interaction of protein and lipids on the fat globule, in addition to the smaller
droplet size, make the homogenized milk less prone to phase separate (less creaming).

Milk composition and properties
6
Figure 5 The milk fat globule membrane (MFGM) has a triglyceride core surrounded by first a monolayer followed
by a bilayer of polar phospholipids. Proteins are additionally inserted into the bilayer of lipids, influencing the
properties of the globule. Picture adapted from the work of Dewettinck and coworkers [11].
2.2 Inorganic salts in milk
The inorganic content of milk is in the literature usually referred to as ash and is a
combination of different inorganic components (Table 2). Although some of the salts in milk,
e.g. calcium phosphate, are associated with the casein micelles, significant amounts are still
present in the aqueous phase (1/3 of calcium, ½ of the inorganic phosphate, 2/3 of the
magnesium and 90% of the citrate) [12]. During the heat treatment of milk and the buildup of
fouling, one of the main roles is played by the calcium phosphate.
Table 2 Mineral content of milk given in mmol/kg. The numbers are adapted from [12].
Amount (mmol/kg) Amount (mmol/kg)
Cations Anions
Na 17-28 Cl 22-34
K 31-43 PO4 19-23
Ca 26-32 Citrate 7-11
Mg 4-6

Milk composition and properties
7
Calcium phosphate
Calcium content in milk is high and is regarded as one of the main health benefits of milk
consumption. The concentration of calcium phosphate in milk reaches the limit of super
saturation and would not be soluble in the milk if it did not form complexes with other
constituents in the milk.
Casein micelles are one of the main structures in milk and help to keep the calcium phosphate
dispersed under supersaturated conditions. Not all calcium ions bind to an inorganic
phosphor. A large part of the calcium in the casein micelle is bound to organic phosphor on
the phosphoserine groups. The calcium phosphate interactions in the casein micelle is as will
be discussed further below, important for the stability and properties of the micelle [12].
The micelles release lipids and calcium phosphate slowly during digestion in newborn and
children as well as in adults. The solution with casein will also help the secreting glands in the
animal to maintain their elasticity and not getting calcified. The role of caseins is to promote
calcification of bone tissue, but prevent calcification of soft in calcium saturated environments
[13].
Reverse solubility
Upon heating, the calcium phosphate will precipitate and is therefore one of the main sources
of fouling during the heat treatment of milk (Figure 8). The precipitate can under some
conditions be re-dissolved if the solution with precipitate is sufficiently cooled, but when the
temperature is high, above 90 °C, the precipitation is usually irreversible and cannot be
reversed by cooling [7, 12]
Figure 6 The dissolved concentration of calcium and phosphate decrease with an increase in temperature. Image adopted
from [7] with data from [14].
The formation of insoluble calcium phosphate particles during heating in dairy process often
lead to a decrease in pH [15].

Milk composition and properties
8
A decrease in in pH will change the properties of the milk and the behavior of many of the
proteins. During heat treatment above 100 °C, the pH of the milk will decrease linearly due to
the changes that occur in the mineral balance [16]. Up to approximately 80°C this change in
pH is reversible and will go back to the normal pH of 6.6-6.7 when the milk is subsequently
cooled. However for higher temperatures, further changes will occur, involving breakdown of
lactose to formic acid and this will irreversibly lower the pH of the milk. During heat
treatment at higher temperatures, for example at UHT-treatment, the ionic calcium content in
milk decreases by 10-20% [7].
2.3 Milk proteins
Proteins are one of the fundamental building blocks of life. Proteins consist of amino acids
and the structure of globular proteins can be divided into substructures, where the amino acid
sequence and the secondary structure will determine the folding into the tertiary structure. The
configuration of one domain will influence the folding of the protein, and without correct
folding, the protein can lose its original function. Changes in pH and temperature are
examples on environmental changes that can drastically alter the properties of proteins. Not
all of the proteins in milk have secondary structure, such as the caseins, and is therefore also
less sensitive to heat and pH changes. Cow milk has an approximate concentration of 3.4 %
proteins (Table 3), and as also observed for the other components in milk, seasonal changes
occur due to feed and lactation stages.
Table 3 The isoelectric point and the denaturation temperatures are important parameters for the denaturation and
aggregation of proteins. Values for the common proteins in milk are given as a combination of data from [6, 8].
Portion of
milk proteins
(%)
Isoelectric
point (pI)
Denaturation
temperature[7]
Caseins
αs1-casein 30.6 4.92-5.35 -
αs2-casein 8 -
β-casein 30.8 5.77-6.07 -
κ-casein 10.1 5.20-5.85 -
Whey Protein
β-lactoglobulin 9.8 5.1 74
α-lactalbumin 3.7 4.2-4.5 63
Serum albumin 1.2 5.13 87
Immunoglobulin 2.1 79
There are two main groups of proteins found in milk, whey proteins and caseins. The
predominant protein group in dairy products is casein. Both caseins and whey proteins have
colloidal dimensions when dispersed in the water phase of the milk [6]. Only a small fraction
of the casein proteins will remain in monomeric form, but will form micelles with the average
diameter of 140 nm [8].
Milk composition and properties
9
2.3.1 Whey protein
Whey proteins are the second largest group of proteins in milk and correspond to 20% of the
proteins in milk. The group of whey proteins includes; α-lactalbumin, β-lactoglobulin, serum
albumin and immunoglobulin, where the β-lactoglobulin is the most abundant. The whey
proteins are globular with a secondary structure that determines the folding of the proteins
into a tertiary structure.
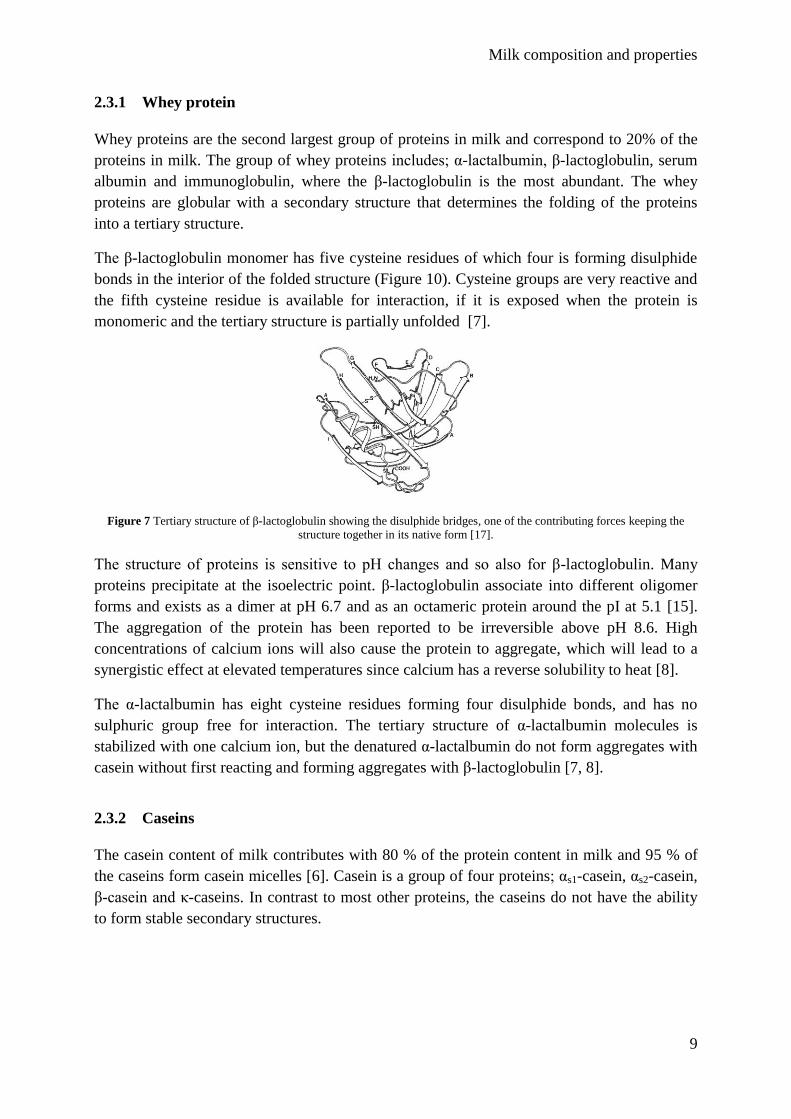
The β-lactoglobulin monomer has five cysteine residues of which four is forming disulphide
bonds in the interior of the folded structure (Figure 10). Cysteine groups are very reactive and
the fifth cysteine residue is available for interaction, if it is exposed when the protein is
monomeric and the tertiary structure is partially unfolded [7].
Figure 7 Tertiary structure of β-lactoglobulin showing the disulphide bridges, one of the contributing forces keeping the
structure together in its native form [17].
The structure of proteins is sensitive to pH changes and so also for β-lactoglobulin. Many
proteins precipitate at the isoelectric point. β-lactoglobulin associate into different oligomer
forms and exists as a dimer at pH 6.7 and as an octameric protein around the pI at 5.1 [15].
The aggregation of the protein has been reported to be irreversible above pH 8.6. High
concentrations of calcium ions will also cause the protein to aggregate, which will lead to a
synergistic effect at elevated temperatures since calcium has a reverse solubility to heat [8].
The α-lactalbumin has eight cysteine residues forming four disulphide bonds, and has no
sulphuric group free for interaction. The tertiary structure of α-lactalbumin molecules is
stabilized with one calcium ion, but the denatured α-lactalbumin do not form aggregates with
casein without first reacting and forming aggregates with β-lactoglobulin [7, 8].
2.3.2 Caseins
The casein content of milk contributes with 80 % of the protein content in milk and 95 % of
the caseins form casein micelles [6]. Casein is a group of four proteins; αs1-casein, αs2-casein,
β-casein and κ-caseins. In contrast to most other proteins, the caseins do not have the ability
to form stable secondary structures.
Milk composition and properties
10
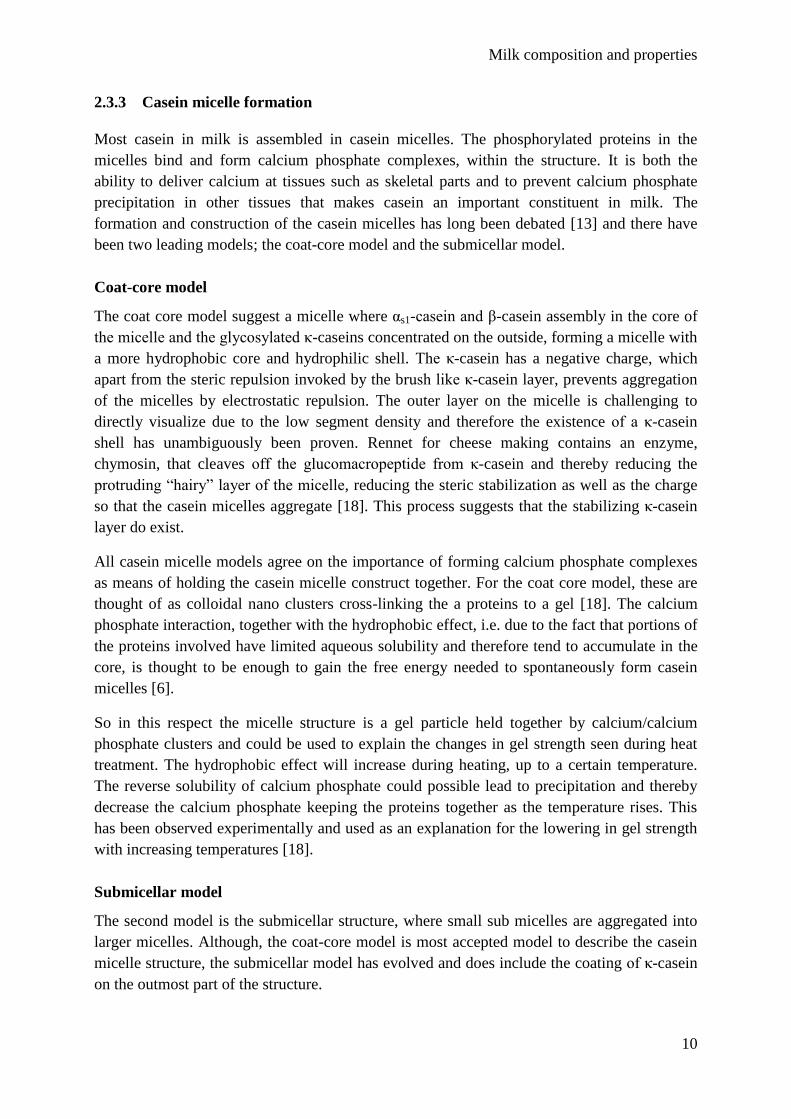
2.3.3 Casein micelle formation
Most casein in milk is assembled in casein micelles. The phosphorylated proteins in the
micelles bind and form calcium phosphate complexes, within the structure. It is both the
ability to deliver calcium at tissues such as skeletal parts and to prevent calcium phosphate
precipitation in other tissues that makes casein an important constituent in milk. The
formation and construction of the casein micelles has long been debated [13] and there have
been two leading models; the coat-core model and the submicellar model.
Coat-core model
The coat core model suggest a micelle where αs1-casein and β-casein assembly in the core of
the micelle and the glycosylated κ-caseins concentrated on the outside, forming a micelle with
a more hydrophobic core and hydrophilic shell. The κ-casein has a negative charge, which
apart from the steric repulsion invoked by the brush like κ-casein layer, prevents aggregation
of the micelles by electrostatic repulsion. The outer layer on the micelle is challenging to
directly visualize due to the low segment density and therefore the existence of a κ-casein
shell has unambiguously been proven. Rennet for cheese making contains an enzyme,
chymosin, that cleaves off the glucomacropeptide from κ-casein and thereby reducing the
protruding “hairy” layer of the micelle, reducing the steric stabilization as well as the charge
so that the casein micelles aggregate [18]. This process suggests that the stabilizing κ-casein
layer do exist.
All casein micelle models agree on the importance of forming calcium phosphate complexes
as means of holding the casein micelle construct together. For the coat core model, these are
thought of as colloidal nano clusters cross-linking the a proteins to a gel [18]. The calcium
phosphate interaction, together with the hydrophobic effect, i.e. due to the fact that portions of
the proteins involved have limited aqueous solubility and therefore tend to accumulate in the
core, is thought to be enough to gain the free energy needed to spontaneously form casein
micelles [6].
So in this respect the micelle structure is a gel particle held together by calcium/calcium
phosphate clusters and could be used to explain the changes in gel strength seen during heat
treatment. The hydrophobic effect will increase during heating, up to a certain temperature.
The reverse solubility of calcium phosphate could possible lead to precipitation and thereby
decrease the calcium phosphate keeping the proteins together as the temperature rises. This
has been observed experimentally and used as an explanation for the lowering in gel strength
with increasing temperatures [18].
Submicellar model
The second model is the submicellar structure, where small sub micelles are aggregated into
larger micelles. Although, the coat-core model is most accepted model to describe the casein
micelle structure, the submicellar model has evolved and does include the coating of κ-casein
on the outmost part of the structure.

Milk composition and properties
11
The submicellar model came before the coat-core model, in the beginning of the 1980th
and
was introduced by the research groups of Schmidt and Walstra in Wageningen. Images taken
by the scanning electron microscope gave a visual image with resemblance of a raspberry
shaped micelle, which inspired the development of the submicellar model.
In a study in 2004 the casein micelles from skim milk was visualized (Figure 12) with Field-
Emission Scanning Electron Microscope (FE-SEM) [19]. The authors suggest a more
complex structure than the coat-core model, with protruding cylindrical objects. They pointed
out the possibility of the micelles to have bicontinuous structure [19].
Figure 8 Image of a casein micelle taken by a Field-Emission Scanning Electron Microscope. Scale bar is 200 nm [19].
2.4 Conclusions on the milk composition
Milk is a diverse raw material, with several health benefits. Since milk is a natural product
produced by animals, the animal feed and other seasonal changes influences the overall
properties. The protein and mineral coexist in order to keep the high content of calcium
dispersed and accessible to the consumer. Both protein and mineral contents in milk are
sensitive to changes in temperature and pH. Heat denaturation of proteins and mineral
precipitation is there for inevitable during the heat processing in the dairy industry.

Dairy fouling
12
3 Dairy fouling, produced during heat processing
Fouling is the collective word used to describe the unwanted deposits forming on a surface in
process equipment. Fouling originates from the fluid in contact with the surface, in this case
the dairy product. All milk attended for consumption needs to be processed with a heat
treatment to fulfill the demands of long shelf life without product spoilage and to assure that
there is no growth of pathogenic microorganism in the product.
Proteins are naturally sensitive to heat, and heat treatment can therefore cause proteins to
unfold, aggregate or deposit due to the changes in the milk.
3.1 Temperature dependent changes in fouling composition and structure
Fouling formed during milk processing does not look the same throughout the process
equipment. It differs drastically. For the cold, non-heated sections, some adsorption from
proteins and minerals will occur. On the surfaces heated for pasteurization of the product,
more extensive fouling will occur. Another drastic change in both component composition
and in structure occurs again when reaching a temperature above 110 °C.
In 1968, Burton, made a distinction between different types of fouling generated from heating
milk [20]. This classification system has since been used for fouling at pasteurization and
sterilization temperatures. The two main types of fouling that are formed inside the dairy plant
are named type A and B (Table 4).
Table 4 The temperature dependence in fouling composition and structure caused the division of fouling type A and type B
in the late 1960th [20]
Protein Minerals Fat
Type A(>75 °C, max. 95-110 °C) 50-60 % 30-35 % 4-8 %
Type B (>120 °C) 15-20 % 70-80 % 4-8 %
The type A fouling is the most common fouling from pasteurization at temperatures below
100°C. The fouling layer closest to the metal surface might be dense, but the characteristic
feature of type A fouling is the soft, voluminous and white structure. At temperatures above
120 °C, the type B fouling is dominating and is characteristic by a grey, brittle and granular
structure. The fat content is about the same as for the type A fouling (4-8%), but the mineral
content rises from 30-35 % to approximately 70 %, whereas the protein content decreases
from 50-60% to 15-20%. Whey proteins are dominating in the protein deposit in spite that
they are only 15-20% of the proteins in milk.[20]

Dairy fouling
13
3.2 Colloidal forces controlling milk fouling
When trying to understand the build-up of fouling, knowledge of the different forces that
control the interaction between the deposits and between the deposits and the surface are of
large importance. The classical theory to predict colloidal stability is the DLVO theory,
named after four scientists active in the 1940s (Boris Dejaguin, Lev Landau, Evert Verwey
and Theo Overbeek). The joint theory of the four scientists model the interacting forces
between particles in solution and hence the colloidal stability of the system. According to the
DLVO theory, the stability is determined by the competition between attractive van der Waal
forces and the repulsion from the electrostatic double layer forces between the charged
particles [21].
The full thermodynamic approach involves estimation of the Gibbs free energy for the
different components of the adsorption process. Although it is hard to quantify in absolute
numbers, the contribution from different interactions can be estimated. According to Visser
G for the process can be expressed as
Visser chose to add the Lewis acid base interaction to explain the behavior of fouling [22].
The Brownian motion, is often neglected for particles adhering to a surface since the
contribution of 1 kT is very small in comparison to the other energies. Adsorption to the
surface, e.g. stainless steel surface in the process plant, will occur spontaneously as long as
the Gibbs free energy displays negative value.
3.2.1 Van der Waals attraction
Van der Waals forces include dipole-dipole, dipole-induced dipole and induced dipole-
induced dipole interactions. The Gibbs free energy for the van der Waals attraction of
particles is given by
Where r is the radius of the particle and L is the shortest distance between the two surfaces in
contact. H is the Hamaker constant that depends both of the particle-particle pair interactions
between the elements and the number atoms per unit volume [21].
Dairy fouling
14
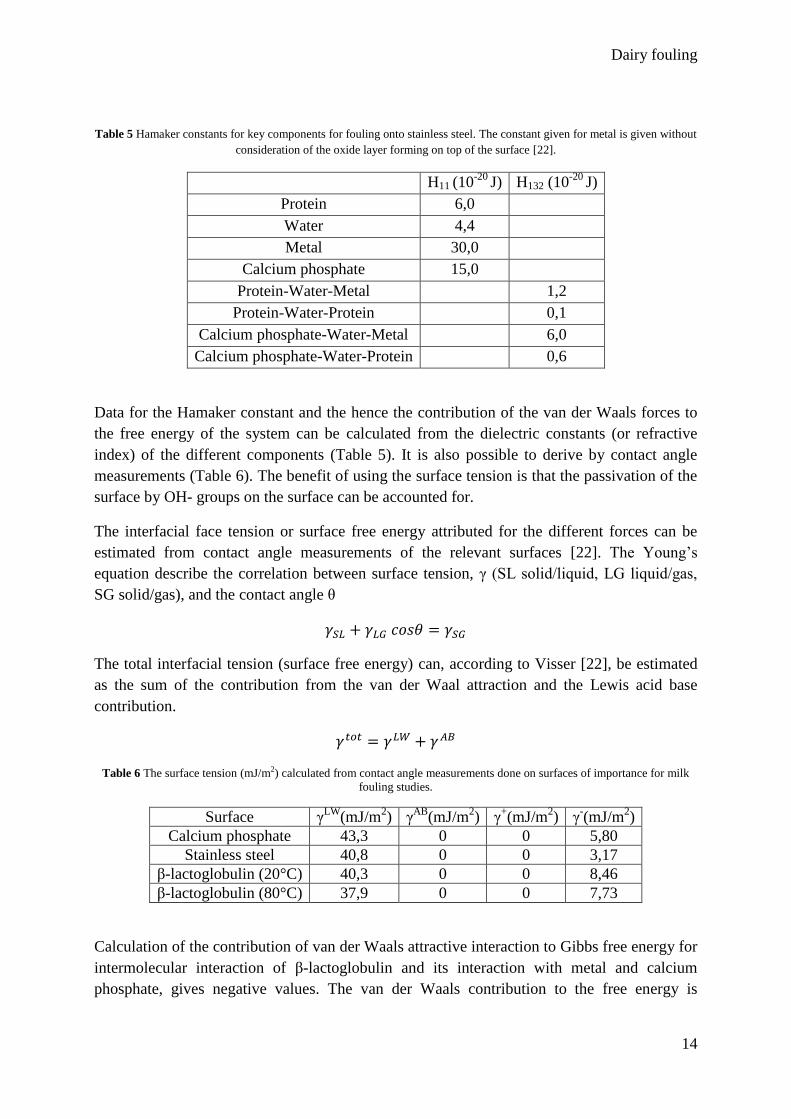
Table 5 Hamaker constants for key components for fouling onto stainless steel. The constant given for metal is given without
consideration of the oxide layer forming on top of the surface [22].
H11 (10-20
J) H132 (10-20
J)
Protein 6,0
Water 4,4
Metal 30,0
Calcium phosphate 15,0
Protein-Water-Metal 1,2
Protein-Water-Protein 0,1
Calcium phosphate-Water-Metal 6,0
Calcium phosphate-Water-Protein 0,6
Data for the Hamaker constant and the hence the contribution of the van der Waals forces to
the free energy of the system can be calculated from the dielectric constants (or refractive
index) of the different components (Table 5). It is also possible to derive by contact angle
measurements (Table 6). The benefit of using the surface tension is that the passivation of the
surface by OH- groups on the surface can be accounted for.
The interfacial face tension or surface free energy attributed for the different forces can be
estimated from contact angle measurements of the relevant surfaces [22]. The Young’s
equation describe the correlation between surface tension, γ (SL solid/liquid, LG liquid/gas,
SG solid/gas), and the contact angle θ
The total interfacial tension (surface free energy) can, according to Visser [22], be estimated
as the sum of the contribution from the van der Waal attraction and the Lewis acid base
contribution.
Table 6 The surface tension (mJ/m2) calculated from contact angle measurements done on surfaces of importance for milk
fouling studies.
Surface γLW
(mJ/m2) γ
AB(mJ/m
2) γ
+(mJ/m
2) γ
-(mJ/m
2)
Calcium phosphate 43,3 0 0 5,80
Stainless steel 40,8 0 0 3,17
β-lactoglobulin (20°C) 40,3 0 0 8,46
β-lactoglobulin (80°C) 37,9 0 0 7,73
Calculation of the contribution of van der Waals attractive interaction to Gibbs free energy for
intermolecular interaction of β-lactoglobulin and its interaction with metal and calcium
phosphate, gives negative values. The van der Waals contribution to the free energy is

Dairy fouling
15
expected to decrease with temperature but not enough to explain the fouling behavior of milk
during heat treatment on its own.
3.2.2 Electrostatic repulsion forces
The Gibbs free energy for the electrostatic forces between the adsorbing particle and the metal
plate at low (<50 mV) and constant surface potentials can be expressed as [22]
Where the ψ is the surface potential for the sphere (s) and the plate (p) and κ is the inverse
Debye screening length. L is the separation between the plate and the sphere and r the radius
of the sphere. The so-called electrical double layer force when two charged surfaces are
brought together with give rise to a repulsive force with a decay length, Debye screening
length, of 1/κ (m) due the counter ions between the surfaces. The Debye screening length
gives a measure of the width of the formed double layer:
∑
Where ε0εr is the dielectric properties of the solution, k is the Boltzmann constant, z the
valence and c the concentration of electrolytes in the bulk solution (ions/volume) [21].
The DLVO theory combines the attractive van der Waals forces and the repulsive electrostatic
double layer forces originating from the charges of the two surfaces. If the electrostatic
repulsion is significantly larger than the van der Waal attraction for protein particles, the
energy barrier (significantly larger than kT) for the particle to attach to the surface will,
according to the DLVO theory, be too high and no adsorption to the surface occurs. β-
Lactoglobulin were measured to still form a monolayer on the surface, which means that other
attractive forces than the van der Waals forces is needed to explain adsorption of proteins to
stainless steel. Visser suggests that a Lewis acid/base interaction can be used to explain the
phenomena [22]. For minerals like the calcium phosphate the attractive forces have been
reported to dominate over the electrostatic double layer force and hence DLVO could explain
the layer of minerals found on the steel surface [22].
3.2.3 Lewis acid-base and hydrophobic interactions
The concept of a Lewis acid base interaction is used by van Oss and Visser to model the
additional force present causing the monolayer adsorption of β-Lactoglobulin that is not
described by van der Waals forces or the electrostatic double layer [22, 23]. The Lewis acid
base interaction is the polar interaction between an electron donor and an electron acceptor.
Calculating the Lewis acid base free energy, the energy for the interaction between calcium
phosphate and a stainless steel surface, it is strongly negative at both high and low
temperatures. This is also found for the formation of a protein layer on the surface when the

Dairy fouling
16
calcium phosphate is present. The calculated interaction energy is however positive for pure
β-lactoglobulin in a solution without the presence of the salt component [22].
With estimation of the interactions influencing the Gibbs free energy of the initial step of
fouling Visser suggests that both the electrostatic double layer and the Lewis acid base
interaction can be used to describe the surface deposit [22]. It is also clear that the mineral
content is important also for the formation of a monolayer of proteins.
3.3 The growth of a fouling layer
Fouling of heated surfaces has been an issue for the dairy industry since the start of
pasteurization processes and therefor it has also been an important research field for quite
some time. The general composition and structure of fouling have been related to the
temperature of the heat treatment by classifying the fouling in distinguishable types [20].
Fouling at low temperatures, below the denaturation temperature of proteins occur on non-
heated surfaces. The fouling present is mainly composed of a monolayer of protein and
mineral deposit. Mineral deposition is faster than the adsorption of protein on to metal
surfaces at low temperatures (below 55 °C) and the deposit has therefor a higher calcium
phosphate content than protein in the non-tempered parts of the process system [24].
When heating the surfaces, the fouling increases. The buildup of the different fouling layers
has been studied intensely. Quite a number of studies agree on that the process is driven by
the unfolding and aggregation of proteins as well as protein interaction other milk components
in the bulk. The interaction between colloidal particles and the surface is less important at this
low temperature stage as they are few. Close to a heated surface on the other hand formed
aggregates or particles will adsorb [15, 25, 26]. Unfolded and denatured proteins can adsorb
due to hydrophobic interactions as a consequence of exposing hydrophobic residues during
the unfolding processes leading to decreased solubility [27].
The precipitation of calcium phosphate increase due to dephosphorylation of casein at high
temperature and the form calcium phosphate precipitate as the milk is heated. This lowers the
pH during heat treatment together with the formation of acids in milk (Figure 9). The lowered
pH causes hydrolysis of proteins which is of importance for the aggregation of milk proteins
during heat treatment.
Caseins in milk are not sensitive to temperature as they lack secondary and tertiary structure
and will therefore not unfold as the whey proteins with temperature. They will however
aggregate when the pH change to close to close to the iso-electric point of the proteins.
Furthermore they can react with the whey proteins as observed for κ-casein that will form
disulfide bond with β-lactoglobulin. Denatured whey proteins will all react with the casein
micelles and form aggregates if the pH is decreased below 6.5. Above 120 degrees casein
molecules will also leave the micelle and to a larger extent react with the whey protein. This
process is not only temperature dependent, but also observed at elevated pH (above 6.7) [7,
18].

Dairy fouling
17
β-lactoglobulin is the most abundant protein found in fouling at pasteurization temperatures,
which in part can be explained by the denaturation temperature of the protein, which
coincides with the pasteurization as well as the fact that the protein contains a free sulfhydryl
group [28, 29]. Visser and Jeurnink have formulated a model of the adsorption and fouling
from β-lactoglobulin (Figure 14). Native β-lactoglobulin protein exist as dimer under normal
condition, but when the solution is heated the dimeric protein will dissociate into monomers
and when the temperature reaches above 60°C the β-lactoglobulin will start to unfold and
expose the free SH group [15, 30].
In the Visser and Jeurnink model aggregates or monomers of β-lactoglobulin can be bound to
fouling layer, but also aggregate in the solution that can precipitate on to the surface and build
up the fouling layer. At 80°C they suggested that aggregates that form on the surface are
small and organized in a layered structure, whereas for higher temperatures larger aggregates
are formed that are more difficult to close-pack. The fouling layer grows until the aggregates
are so large that they are removed with the process flow. The formation of the larger
aggregates with temperature, which cannot be close packing in fouling layer, and are more
easily detached can be one of the reasons why aggregates of β-lactoglobulin and larger casein
micelles are less common in the fouling layer at higher temperature [15].
Figure 9 The whey protein β-lactoglobulin adsorbs to surfaces as dimers even at room temperature and at normal milk pH,
but will start to aggregate on the surface and form a thicker fouling layer when the temperature increase and in the presence
of calcium ions. Casein micelles also react with the activated β-lactoglobulin aggregates forming the fouling layer. The salt
components that are released upon heating and decreases in pH will either precipitate directly onto the stainless steel surface,
creating a mineral deposit or binding to whey protein aggregates [15].
There are other studies by de Jong in the late 1990th
and followed later by Grijspeerdt in 2004
[26] that present somewhat similar ideas on how the fouling layer is built up. When the β-
lactoglobulin starts to unfold, the molecules start to react in the solution together with other
unfolded protein molecules. These aggregates are thought not to be included in the fouling
buildup. The fouling is instead formed from unfolded protein molecules that react with other
components of the milk [26].
Calcium salts that have been shown to be important for the fouling can precipitate in different
forms onto the surface. Studies have been done on which complexes that are more likely to
form, commonly by studying the ratio between calcium and phosphate in the fouling sample

Dairy fouling
18
after ashing. As long as no irreversible complexes are formed, such as hydroxyapatite,
Ca5(PO4)3OH (Ca/P = 1.67), and the temperature is kept below 100°C, the precipitation is
reversible. Hydroxyapatite is a crystalline form of calcium phosphate and the crystallization is
usually disrupted by the interference by whey proteins and casein in the fouling layer [15].
The Ca/P ratio have been found to be close to 1.5 for the mineral content in type A fouling,
which would match the amorphous complex tricalcium phosphate Ca3H2(PO4)2. For higher
temperatures, causing type B fouling a lower ratio have been found, 1.2-1.35 [31].
Octacalcium phosphate, Ca8H2(PO4)6*5H2O, with a ratio of 1.33 and brushite or dicalcium
phosphate dehydrate (DCPD), CaH(PO4)*2H2O with the ratio of 1 are more crystalline than
the tricalcium phosphate and could be part of the reason for the hard and brittle structure of
type B fouling. Foster and Green found that the deposition at 140 °C has a layer enriched in
mineral closest to the steel surface and that the fouling had a smother surface than the fouling
formed at 100 °C [32].
The processing before the main heating step influences the progress of fouling build up. One
such example comes from the UHT treatment at 140 °C. The milk is most often pre-held at a
certain temperature for a couple of minutes before entering the last heating section, to reduce
the fouling build up (Figure 15). Without the preholding, type A fouling would form in a
relative large amount and obstruct the flow (Figure 15, left) and increase the pressure drop in
the system dramatically. The pre-holding step, prevent the type A fouling to form in the UHT
treatment step. Instead type B fouling will start to form, with a linear increase in deposited
amount as the temperature increases when entering the heater until the outlet (Figure 16,
right).
Figure 10 The effect of pre-holding is demonstrated with the type A fouling forming to the left when no preholding is used
before the high temperature zone in the UHT equipment. To the right the linear increase in deposited amount after pre-
holding as the temperature increases when entering the heater until the outlet, which in turn, lead to gradually increasing
pressure drop in the equipment [20].
Due to the build-up of the fouling layer, the thermal conductivity through the heat exchanger
wall will decrease; therefore the temperature of the heating media has to be increased. This
will cause the structure of the fouling layer next to the heated surface to change into a baked
and more burnt fouling.
Carbohydrates are completely soluble in the aqueous phase of the milk at room temperature
[6], but the sugar will react with free amino groups on protein residues during heating, via the
so-called Maillard reaction (fig. 16). The amino group is in most cases from a lysine residue

Dairy fouling
19
of a casein protein, and the loss of lysine after Maillard reaction will slightly reduce the
nutritive values of the milk [16, 33]. The Maillard reaction is a complex chain of events that
are not fully understood but as a final stage it will cause browning of the protein containing
surface layer and also a change in taste and odor [16].
3.4 Conclusions regarding milk fouling
There are two main types of fouling found in the dairy processing equipment for heat
treatment of milk, namely type A (<100 °C) and type B (>120°C). The protein content of the
type A fouling produced below 100 °C is high, around 60%, but is drastically decreased on
surfaces at higher temperature. The mineral content has the reverse temperature dependence
compared to protein and the mineral concentration in the type B fouling is around 70%.
The crystalline structure of the calcium phosphate precipitating into the fouling at different
temperatures differs. At lower temperatures the structure is amorphous, but the crystallinity
increases with temperature. The precipitation that occurs below 100 °C has been observed to
be reversible.
The colloidal forces discussed regarding the growth of a fouling layer are the combined forces
of van der Waals attraction, electrostatic repulsion and hydrophobic interactions. They all
seem to be important for the formation of the fouling layer. The mineral content is also
observed to be of importance for the first layer of proteins to adsorb to the surface.
Evaluation of dairy fouling
20
4 Evaluation of milk fouling
To be able to understand the mechanisms of the events during removal of fouling and the
structural and compositional changes over time, good measuring techniques are of
importance. The technique may be inline or off-line, depending on if the data need to be
measured continuously or not. Not all techniques available are suited for industrial
application, but mainly applicable for research.
4.1 Heat transfer changes due to dairy fouling
To understand the fundamentals of deposit removal from the heated surfaces, it is important to
look into the process of heat transfer and the effect of the fouling layer. Characterization of
the transfer of heat through a metallic material into a liquid is essential to the dairy industry.
Conductive heat transfer is in fluid a molecular transfer of energy, but the transfer heat
through a stainless steel can be connected to the transfer of electrons in the material. Heat
conduction is the way of transferring heat between the surface and the liquid at the stationary
surface layer (at r=R, v=0). Even for a turbulent flow, conductive heat transfer will be present
due to the stagnant layer closest to the surface [34]. Convective energy transfer occurs thanks
to the bulk motion of the fluid.
The transfer of heat and the temperature profile through the heat exchanger wall into the
processed dairy product can be revealed by combining the heat transfer rate for the conductive
heat transfer at the surface with the forced convective heat transfer from the surface into the
bulk liquid. This can be done by applying Newton’s law of cooling.
( ̂
)
Where ki (W/m*K) is the thermal conductivity coefficient and h (W/m2*K) the convective
heat transfer coefficient [34]. ρÛ is the internal energy and the 1/2ρv2 is the kinetic energy per
unit volume [35]. Combining the terms for conductive and convective energy transfer into the
combined energy flux vector e can be useful when calculating the heat transfer in a system.
The convection is in this case is forced by an external force creating a fluid under flow.
From the perspective of the dairy industry and the heat processing of milk, it is possible to
calculate the temperature needed for the surface to receive a certain outlet temperature, as
long as the process equipment is clean. As soon as a fouling layer is formed on the heated
surface the heat transferred to the bulk will decrease. To be able to correct for this change, the
properties of the newly formed surface layer needs to be known. This is generally not the case
for a fouling layer formed inside the dairy process equipment.

Evaluation of dairy fouling
21
Figure 11 Fouling during milk processing decreases the essential heat transfer to the product. The thickness, L2, and a
conductive heat transfer coefficient, ki, for a fouling layer is normally unknown. The complexity increases due to the fact that
both thickness and composition changes over time. The combined effect of L2/k2 is often referred to as the thermal resistance
of the fouling layer. Idea for the picture adapted from [34].
The temperature differences over a composite material system (Figure 17) can be written as:
(
)
(
)
(
)
The combined heat transfer rate can be calculated by adding the above equations and q can
then be expressed as,
(
)
The overall heat transfer coefficient, U (W/m2*K), can be introduced for the heat transfer
through composite materials:
Giving the result for the heat transfer through the heated metal surface and the fouling layer:
(
)

Evaluation of dairy fouling
22
By measuring the overall heat transfer coefficient relative to the value for the clean surface,
U0, the heat transfer coefficient for the fouling layer can be indirectly followed during both
fouling and cleaning. This is in literature often referred to as the thermal resistance of the
fouling, RF [36-43].
Calculating the corresponding value for deposit build up in a tube is slightly more complex,
but following the same principle the generalized description of the overall heat transfer
coefficient in the center of the tube, U0, can be obtained:
∑
Where L is now the length of the tube and r is the thickness of the composite layer [35].
The temperature of the heated surface can, to a certain extent, be increased to compensate for
the heat transfer due to the fouling build up. The extra heating from the surface will also cause
baking of the deposit, which in turn will change the heat transfer properties, but also the
cleanability of the surface after processing.
4.2 Pressure changes due to dairy fouling
Both the build up and removal of fouling from the tubular surface will cause a pressure
change in the system, since the flow rate is constant but the inner diameter is changeing. This
pressure change can be used to monitor the system and have been used to model the
behaviour of fouling [26].
As for heat transfer changes, measuring the changes in pressure to estimate the removal of
fouling is an indirect measurement and does only produce relative values. The pressure drop
in the pipes and tubular heat exchangers in the process equipment can be calculated with the
Darcy’s law adapted for circular pipes.
The friction factor, f, varies with the properties of the flow and also with properties of the
pipe.
The Moody diagram (Figure 18) can be used to determine the friction factor. Laminar flow
follow the Haagen-Poiseuille equation of mass rate of flow, w, over a crossectional tube area
(πR2)

Evaluation of dairy fouling
23
and the friction factor, f, is found to be
The fully turbulent regime will not be dependent of the flow rate, only on the roughness of the
pipe [44]. The relative roughness is determined by the absolute roughness and the hydraulic
diameter (ε/D).
Figure 12 Moody diagram showing the friction factor for pipes and it is dependence on flow rate and material roughness.
Friction factor for laminar flow follow the Hagen-Poiseuille equation, whereas friction fraction for fully developed turbulent
flow does not depend on the Reynold number.
For turbulent flow that are not fully developed, there are different ideas on how to explain the
friction factor. Equations for smooth and for rough surfaces are usefull and has been
combined into the Colbrook-White equation [44].
√
√
The pressure changes inside the system is commonly followed in the process industry and
also for research purposes for following the buildup and removal of fouling online [20, 45].

Evaluation of dairy fouling
24
4.3 Methodologies for measuring fouling buildup, composition and structure
There are several methods that can be used to study both the composition and the structure of
the surface deposit. To characterize the composition, most methods are destructive and do not
give any spatial information about the different elements.
The fouling layer closets to the product flow can be analyzed by several techniques such as
ESCA and TOF-SIMS.
Electron Spectroscopy for Chemical Analysis (ESCA)
ESCA is also known as X-ray Photoelectron Spectroscopy (XPS) and is used for
characterization of the chemical composition of the surface layer. The analysis can be done
both in terms of qualitative analysis and as a quantitative analysis of the present atoms. The
binding energy of two atoms can be calculated when the kinetic and the photon energy is
known. The binding energy is specific for each element [46].
The result from ESCA is displayed as a graph with photoemission intensity as a function of
binding energy (eV). The binding energy also depends on the neighboring atoms, which can
be seen as a shift in the peak. The higher the electronegativity of the neighboring atom is, the
higher the binding energy and the peak is shifted accordingly.
XPS has been used in order to determine the chemical composition of the fouling layer [47,
48]. The method is done under ultra-high vacuum and sample therefore needs to be
completely dry, with the risk of collapsing the structure of the sample. The analyzed area is
500x500 µm with a penetration depth of 4-5 nm.
Time of Flight-Secondary Ion Mass Spectrometry (TOF-SIMS)
TOF-SIMS is a surface analysis method with higher sensitivity than ESCA and molecular
composition and identification down to a depth of 1 nm from can be analyzed. Primary ions
are used to sputter the first monolayer of the sample surface, producing emitted secondary
ions from the material. The secondary ions are sent through the flight path, and are collected
by a detector at the end. The detector is a mass spectrometer and a spectrum of the molecular
composition on the surface can be generated. TOF-SIMS is to some extent a destructive
analysis method, and the layers below the first monolayer are damaged by radiation and
cannot be analyzed afterwards [11].

Evaluation of dairy fouling
25
4.3.1 Content of organic compounds
The organic components of fouling include the different proteins, some unfolded, but also
small amounts of lactose and citrate. There are several choices for protein determination;
Kjeldahl method, UV absorbance or chemical oxygen demand (COD). Lactose and citrate are
characterized by high performance liquid chromatography (HPLC).
Kjeldahl methods
The protein content in the fouling can indirectly been measured by the Kjeldahl method,
which has been used since it was developed in 1883 [31, 49-51]. By using the method, the
nitrogen content is determined by digesting the sample together with sulphuric acid and
transforming it to ammonium sulfate [52]. Mercury, copper or selenium based compounds are
used to catalyze the reaction.
The solution now containing the free is treated with an alkali solution, forming gaseous
ammonia. The ammonia is distilled into a container of HCl and the final amount of nitrogen in
the sample is determined by titration of the HCl that has not reacted with the ammonia [53].
UV absorbance
By measuring the absorption of ultra violet light at one or two wave-lengths, the concentration
(g/L) of protein in a solution can be determined. The absorption is dependent of the pH and
lipid/protein ratio. As long as the lipid/protein ratio is below the critical 0.05, an equation for
the calculation of protein content at pH 13 can be used without overestimating the protein due
to the scattering from lipid aggregates. For the two wave length used, the mineral
concentration will not interfere in the measurements [54].
(
)
Where the measure of Å248 and Å256 originates from measurements on a standard protein
solution. Xin et al used the UV absorption and used a similar equation for the use of dissolved
whey protein concentrate (WPC)[55].
(
)
The measurements performed were done continuously during the cleaning and was used to
calculate the cleaning rate of the model fouling. The sensitivity of the absorption method is 1
mg/L.

Evaluation of dairy fouling
26
Chemical oxygen demand (COD)
COD is a method to measure how much organic compounds that are available in a liquid
solution. It is measured as the amount of oxygen (mg/L) that is needed to oxidize the organic
compound to carbon dioxide, ammonia and water. This analysis has been used in several
studies for analysis of effluent liquid after cleaning of protein fouling [5, 56].
High performance liquid chromatography (HPLC)
High performance liquid chromatography is a separation either by size, charge or by affinity.
The sample of interest is in a solution that is passed through a column specially designed for
the molecules of interest. The result is shown as elution peaks with Gaussian spread and the
resolution between to peaks is given by
The retention time, tr, from the point where the liquid is injected to when it is again eluted
after the column into the detector cell, and is specific for the elements of separation. The
average spread of the two peaks is denoted wav [53]. In cleaning investigations the method has
been used to measure the content of lactose and citrate in the effluent liquid [56].
4.3.2 Mineral content
When the mineral content of the fouling is studied, the organic content is most often first
removed. This is often done by ashing the sample, leaving the inorganic material. This will
give the total mineral content in the sample. For further analysis the different atomic
adsorption spectroscopic methods are used.
Atomic absorption spectroscopy (AAS)
Atomic absorption spectroscopy can be used to determine the concentration of a specific
element in sample and measures the light absorbed by free atoms in the sample. The sample to
be analyzed is evaporated in a gas flame at a temperature between 2000 - 3000 K.
For the absorption spectroscopy an iron cathode is used that are exited and vaporized when in
contact with the gaseous flame. The ferrous atoms will emit light that is detected on the
opposite side of the flame. The sample atoms burning in the flame will absorb energy from
the light emitted by the ferrous atoms and the intensity loss will be detected as peaks on the
spectra. By using a graphite furnace instead of a gas flame solid sample could be directly
analyzed instead of dissolving them in a liquid [53].
There are other spectroscopic methods, one of which is the emission spectroscopy (flame
photometry). The different methods have different limits when it comes to sensitivity (Figure
19) and the sample volume needed. The atomic absorption has been used by several
researchers studying both build up and cleaning of fouling from dairy products [31, 49, 56].

Evaluation of dairy fouling
27
Flame photometry
Flame photometry is a kind of a simple atomic emission spectroscopy, but can also be used as
a detector connected to for example a gas chromatograph. For atomic emission spectroscopy
there is no need for an external light source. The molecules are burnt and separated by the gas
flame, exiting the elemental atoms. The wavelength of light that are emitted when the
electrons go back from the exited state to the ground state are specific for each element and
the intensity of the light can most often be translated proportionally into the quantity of the
atom[53]. Calcium ions is measured at 622 nm [14, 57] and phosphorous have an emission at
536 nm [53].
4.3.3 Structural analysis
Structural analysis can be done in several ways, depending on the information of interest.
With methods like scanning electron microscopy (SEM) or atomic force microscopy (AFM),
the knowledge gained are generally on the topography, whereas a three dimensional image of
the sample can be obtained from the use of transmission electron microscopy (TEM) and
confocal laser scanning microscopy (CLSM). By the use of CLSM it is also possible to
separate different components from each other, provided they can be labeled with fluorescent
probes.
Scanning electron microscopy (SEM)
Scanning electron microscope (SEM) is a microscope that detects electrons that are scattered
or emitted from a specimen surface due to irradiations of the surface with an electron beam.
With this technique, it is possible to get topography images of the surface of a sample. The
surface investigation is often performed in vacuum environment and one protruding challenge
with the analysis of soft milk fouling, which normally contains a lot of liquid, is to preserve
the structure when preparing the sample.
One additional possibility is to use an environmental SEM, which allows certain humidity.
The resolution of such a method is less than the vacuum SEM due to scattering of electrons by
the water present. A qualitative analysis of the surface composition can be performed if
energy-dispersive X-ray spectroscopy (EDX) is used together with the SEM.
Transmission electron microscopy (TEM)
The transmission electron microscope forms a major analysis method in a range of scientific
fields, in both physical and biological sciences. The transmission electron microscopy can
help to find out about the size, shape, and arrangement of particles on a surface, but also
allowing identification of the chemistry of the sample. One of the major drawbacks of TEM is
that it provides 2D images out of 3D samples, making result interpretation a challenge.
Sequence of images is able to create a 3D image. However, development of imaging
techniques, where the sample is tilted has made it possible to construct 3D images of the
sample. Many materials also require extensive sample preparation to produce a sample thin

Evaluation of dairy fouling
28
enough to be electron transparent, which makes TEM analysis a relatively time consuming
process.
Atomic Force Microscopy (AFM)
Atomic force microscopy (AFM) is another method to study the surface topography on a
nano meter scale. It is challenging to study milk fouling with AFM the surface is
heterogeneous and soft. The technique is sensitivity to large differences in depth of the
surface. However, one advantage is that it can be used to reveal the rheological properties of
the surface layer.
Confocal laser scanning microscopy (CLSM)
The structure and topography of the fouling layer could be useful to follow over time.
Information to be gained from this analysis could be to visualize diffusion and back diffusion
through the fouling layer. One could also get an idea whether the fouling is shredded off in
layers or rather removed in bigger pieces.
Confocal microscopy register a 2D image of a very thin section of the samples at a certain
depth and was first suggested by Marvin Minsky in 1955 [58]. By recording images at
varying depth and stacking these images on top of each other it is possible to create a 3D
image of for example a cross section of the object [59]. The method uses either light reflected
from the specimen or light released by excited fluorophores.
CLSM is most widely used in the field of microbiology [60] and is often used to study thin
section of biofilms [59, 61, 62]. But it has been used to study fouling layers from heating of
milk. CLSM has for example been used together with fluid dynamic gauging for the analysis
of a gel swelling process during cleaning in an alkali solution [63]. Since the confocal
microscope is still using light as a source the magnification is relatively low in comparison
with for example a microscope that uses electrons as source of energy.
4.3.4 Thin film adsorption and desorption
The initial adsorption and deposition to a large extent determines the buildup of fouling layer
and it is therefore important to understand the detailed mechanisms involved in this initial
process. Quartz crystal microbalance and ellipsometry are methods known for their use in this
purpose.
Quartz crystal microbalance with dissipation (QCM-D)
QCM-D is a technique used to in situ measure adsorption on to a surface. The QCM-D is
simplified, a very sensitive scale that measures the weight of a sample that attaches to the
sensing crystal surface. Part of the popularity of QCM-D is due to the fact that no labelling of
the samples is needed and is still a very sensitive method.
The QCM-D instrument is a quartz crystal to which a layer of gold is deposited, serving as
electrodes. The crystal material is piezoelectric and can be brought to oscillate at a specific

Evaluation of dairy fouling
29
resonance frequency when an oscillating electric field is applied. The resonance frequency is
dependent on the mass of the crystal, hence the resonance frequency will change with f,
when the sample adsorbs to the surface [64].
As long as the adsorbed mass is evenly distributed, rigidly attached, and small compared to
the mass of the crystal, the Sauerbrey equation can be used to evaluate the adsorption:
C is a constant (0.177 mg•m-2•Hz-1) and n is the overtone number.
Ellipsometry
Light reflection can be used to study the thickness of a layer and has been done so since the
days of Sir Isaac Newton. Ellipsometry is widely used to study thicknesses of thin films,
below the wavelength of visible light, using the changes in polarization state that occurs when
(polarized) light is reflected against the sample surface [65-67]. Depending on the optical
contrast and the reflectivity of the sample, the thickness resolution of this technique can be
0.1-1 nm [68].
From the values of refractive index and thickness the amount adsorbed can be calculated,
provided that the refractive index as a function of concentration (dn/dci) of the adsorbing
specie is known.
Model fouling
30
5 Model fouling for studying fouling build up and cleaning processes
Fouling and cleaning are complex processes and to gain fundamental understanding of the
mechanisms it is sometimes convenient to begin the investigation with a fouling liquid less
complex than the actual processed liquid. The question is then which model fouling to use in
order to gain fundamental and detailed knowledge about mechanisms, but still to be able to
study relevant properties. During the decades of research within the field of milk fouling and
cleaning, one of the difficulties has been to find such a model system, which also is
reproducible and easy to obtain.
5.1 Production of model fouling
The method used to create the model fouling will influence the properties. Passing a heated
solution over a stainless steel plate, preferably heated, will cause fouling to form on the
surface in a manner similar to the one occurring in the process equipment. The concentration
of protein solution used to build up the model fouling is often selected to mimic the
concentrations in milk, specifically the concentration of β-lactoglobulin (3 g/L) [67, 69]. The
deposition of the protein and in some cases a combination of protein and minerals relevant for
products to be heat treated is fairly common as means to prepare a model fouling.
Another way to form model fouling is to create a gel from the whey protein. Heat induced
gels are produced by heating the solution to the denaturation temperature of the proteins; this
will cause proteins to aggregate to form a gel [70-76]. Heat induced gels are one of the most
common model fouling to use when studying the dissolution behavior during alkali treatment
(Table 7). Gel formation is pH dependent and hence gels can also be formed by altering the
pH of the protein solution before heating [70, 75]. Many globular proteins will form
particulate gels, seen as opaque, when the pH is around the isoelectric point for the protein
(pH 5.4 for β-lactoglobulin), and stranded transparent gels at low and high pH.
Solvent evaporation from milk on a surface creates a thin film, but such a film will not have a
structure similar to the real fouling since it collapses when the liquid is removed. Studies of
the mineral fouling are also done mostly by evaporating the solvent from either a simulated
milk ultra filtrate (SMUF) solution or a calcium phosphate solution on the sample plate.
SMUF is a combined solution of the minerals found in milk. The crystallization of mineral is
influenced by the presence of proteins during the fouling process, but the protein deposition is
also influenced by the mineral content. This information is generally lost using a simple
model fouling.

Model fouling
31
Table 7 The variety of model fouling is vast and this is important to consider for the interpretation of the results of any study.
Protein fouling could be relevant for mimicking type A fouling, whereas studies of the type B fouling needs the input of a
mineral deposit.
Temperature (°C) Method Previous work
Whey protein
concentrate (WPC) <100
Circulation through a
heated section or
forming gels
[39, 70, 71, 77-84]
>100 Circulation through a
heat exchanger [43, 45, 50]
Whey protein isolate <100 [47, 49, 70, 85, 86]
β-lactoglobulin <100 Gel formation [72, 74, 76, 87]
Protein + SMUF Heated flow cell, pH
6.8 [82, 88, 89]
SMUF Evaporation [42, 69, 89-91]
Milk (both full and
skimmed) <100 Evaporation
[19, 28, 29, 56, 92-
95]
Calcium phosphate <100 Infrared drying [91]
5.2 Model fouling to mimic type A fouling
Several different milk proteins and protein mixtures are used today, making comparison
between results complicated. Common is the use of a model based on protein, either from
whey protein isolate (WPI) or whey protein concentrate (WPC). WPI is a more pure protein
powder than the WPC and contain less minerals and lactose (Table 8). For studies of milk
fouling representing type A fouling, mostly containing protein, this kind of system is often
used. The most abundant protein in the milk fouling at these temperatures is β-lactoglobulin
and a few research groups have used the pure protein to form a gel film on a surface
[72-74, 76, 87].
Table 8 Composition in wt.% of model system fouling used in literature [70].
β-lactoglobulin WPI WPC80 WPC35
Protein 97.4 90–94 80.1–83 34-35
Fat 0.1 <1 6.0 4.0
Moisture 5.8 4.3 4.0 5.0
Lactose <0.5 <3 6.0 50.0
Ash 2.4 2.0 3.0 6.0
5.3 Model fouling to mimic type B fouling
To produce the type B fouling temperature above 120 °C is needed and also a high
concentration of minerals. UHT treatment of only a WPC solution will mainly produce type A
fouling [45]. For studies on the formation and properties of the type B fouling formed during
UHT treatment of milk, most researchers have so far chosen to study the real fouling and not
used a model system [20, 31, 32, 96].

The importance of cleaning
32
6 The importance of cleaning - to obtain and evaluate the clean surface
A customer expects a high and even quality of the product. The traceability is therefore an
issue in the dairy industry and every step in the process needs to pass the requirement for
hygienic handling of food. Every batch is tested before leaving the dairy both for immediate
contaminations, but also for long time preservation studies. The most common analyses are
cultivation for bacteria and mold, but also sensory tests of the product such as texture, smell
and taste.
The heat treatment used in the dairy industry causes fouling and thereby imposes difficulties
with heat transfer of the milk and but can also cause off-flavors. The produced fouling needs
to be removed to ensure a safe process. Parameters discussed as relevant for cleaning is the
temperature of the cleaning solution as well as the concentration of cleaning agent, the time
and the flow parameters. These four parameters, used when discussing cleaning-in-place
(CIP) are usually visualized in something called the Zinner’s circle (Figure 20). Note that the
effects of pH dependence and mechanical shear forces are also included in the parameters of
flow and detergent concentration.
Figure 13 The Zinner’s circle visualizes the four parameters that are usually considered of importance for the cleaning
efficiency of a CIP process. The internal importance of the four parameters is important for the optimization of the process.
6.1 Cleaning of different fouling types in the dairy industry
Most dairy equipment for processing milk and milk products is cleaned with a so called CIP
system. CIP or cleaning-in-place means that the equipment is cleaned without dismantling.
Such a program is designed to make certain that the equipment is clean without the need to
open and look at the single parts of the system. An insufficient cleaning creates an
environment where microorganisms can survive and multiply. Left over fouling will also act
as a perfect nucleation site for the new fouling from the next batch of production, increasing
the fouling behavior of the heat-treated product.

The importance of cleaning
33
Since there are different ways to process milk products, there are also different ways in which
to clean the equipment, depending on the presence and severity of deposit on the surfaces.
With a fouling consisting of protein and fat, an alkali treatment is a sufficient method. There
are no industrially produced milk fouling that consists of only protein and fat and the acid
cleaning step is therefore always of importance. Acid detergents are used in the cleaning
process in addition to the cleaning with alkali in order to remove the inorganic part of fouling
from the surface. The acid step also decreases the possibility of microbial growth if they are
not efficiently washed out [97].
Heated and non-heated surfaces do not necessarily need the same cleaning program. The non-
heated surfaces could be cleaned with alkali at a low concentration, even though the alkali
step traditionally is followed by an acid step. The heated equipment from pasteurization
process (with a buildup of type A fouling) a higher concentration of alkali is used [98, 99].
For products processed at temperatures above 110 degrees, for example the UHT-treatment,
the fouling is a more complex mineral rich fouling and is cleaned with an alkali and acid
detergents at higher concentration than for pasteurization [99, 100].
Cleaning procedures in the food industry often follow the same patterns and does often
include the steps of pre-rinsing, detergent cleaning, intermediate rinsing if more than one
detergent step is needed and a rinsing step at the end to flush the system with water before the
following production [101]. The type of detergent used in the cleaning process differs, where
the equipment producers often recommend a detergent concentration based on pure alkali and
acid chemicals such as NaOH and HNO3, while others prefer formulated solutions.
The formulated detergents are supplemented with sequestering or chelating agents binding
either one or several of the mineral ions attached to the fouling. Surfactants can also be added
in order to disperse the fat into the solution. Surfactant and emulsion behavior is often
temperature dependent and the formulated cleaning solution often have optimal temperature
interval (usually 40-90°C) [102, 103].
It is possible to use a one-stage or a two-stage cleaning process of fouling from dairy
products, depending on the present fouling. One stage cleaning could be an alkali cleaning of
non-heated surfaces or the use of a formulated alkali detergent on a lightly fouled surface.
Two stage cleaning processes contain one alkali and one acid cleaning stage [40, 84]. Heavily
fouled surfaces, such as the heated surfaces forming both type A and type B fouling, uses
combination of the formulated alkali solution as for the one-stage cleaning, but with the added
acidic cleaning step.

Understanding the cleaning process
34
7 To understand the cleaning process
Designing an optimal cleaning process is difficult without the knowledge of the deposit
structure, composition and mechanisms involved during cleaning. The fouling produced
during heat treatment of milk is heterogeneous and varies throughout the different sections of
the processing equipment. The cleaning process has to be designed to take into account the
previous process of heat treatment of the fouling liquid and the duration of production. These
issues makes milk a complex liquid to study, and the milk fouling has been classified as type
A and B in order to characterize the mechanisms of fouling removal during cleaning.
Studies of protein removal, mimicking type A fouling from pasteurization temperature, has
been frequently studied and several models for the removal mechanisms can be found [56, 80,
84, 104, 105]. For protein removal, diffusion of cleaning solution is necessary and the
swelling of protein layers due to alkali solution, as well as other chemical reactions occurring
during buildup of the fouling layer. The impact of mechanical force on the removal by the
flow has been questioned [106].
The study of removal of type B fouling is more complex and more expensive, since both the
production and cleaning is performed at such temperatures that pressurized equipment is
needed. The initial challenges involve producing a fouling representing the one found after
high temperature treatments. The few studies of high temperature fouling (type B) have been
done on larger scale, either processing thousands of liters of milk or recirculating the liquid
that affects the properties of the fouling created [5, 26, 31, 107]. Solubility and dissolution of
pure mineral deposit from a stainless steel surface has also been studied. This study conceive
that both dissolution and removal due to shear forces from the flow is of importance for the
mineral deposit [91].
A cleaning model that is possible to adapt from a type A to a type B fouling has so far not
been presented. The mechanism for cleaning of the predominant mineral based type B fouling
cannot solely be explained by evaluating and understanding the cleaning of a mineral or a
protein layer, but a combination of the two types of deposits has to be considered. This
chapter will first introduce the cleaning mechanisms evaluated previously to understand and
explain the phenomena acting during the cleaning process, and then explain the models and
calculations made that support the experimental findings and the theoretical hypothesizes.
7.1 Mechanisms involved in the cleaning process
Since most studies are performed on the protein rich type A fouling and on model fouling
based on proteins, the mechanisms in focus are the reactions occurring between the cleaning
agent and the protein layer structure. The mineral deposit available in the type A fouling is
thought to either be transferred into the bulk together with the protein content [56] or through
a dissolution process. For the Type B fouling from high temperature processing, the

Understanding the cleaning process
35
understanding of mineral removal is essential. Studies on pure mineral fouling indicate that
minerals are essentially removed by dissolution in acidic environment [91].
The diffusion of the cleaning agent is of great importance at the beginning of the cleaning
process. Without the first diffusion the chemical and physical reactions between fouling and
the cleaning agent will not be possible, except from the outmost surface layer. Most
researchers do not consider the diffusive motion to be a rate limiting step in the process but
still an absolute necessity for the cleaning to be efficient [71, 84].
Diffusion can be described as the net flow of cleaning agent due to a concentration gradient
into the fouling layer [21] in through the stagnant boundary layer.
Diff is the diffusion coefficient and can either be determined experimentally or estimated
based on the size of the molecule. The diffusion coefficient for the hydroxyl ion present
during alkali cleaning has been approximated to sphere with the Stoke-Einstein
approximation.
Where R is the radius (ROH = 1.3*10-10
m), η is the solution viscosity (Ns/m2) and k is the
Boltzmann constant (1.38 *10-23
Nm/K). Using the Stoke-Einstein approximation, DOH in a 20
°C diluted water solution would theoretically be approximately 1.65 μm2/s. Jeurnink and
Brinkman claims that the effective diffusion coefficient is even slower and in the range of 10-8
m2/s [56]. Diffusion of dissolved compounds through the fouling and the boundary layer is
also present in the opposite direction while removing the fouling from the surface. Molecules
and small particles detached from the fouling layer will transfer into the bulk due to the
concentration gradient.
Swelling of protein fouling during cleaning with alkali, such as NaOH, has been monitored
and is part of most cleaning models for protein systems [72, 83, 84, 105, 108]. Swelling can
be visualized as a combination of chemical and physical reaction. The hydrolysis of the
protein tertiary structure is partially due to α and β elimination of the disulfide bridges. This is
only possible for proteins that contain the amino acid cysteine, which contain sulfur and are
able to form strong disulfide bridges. β-Lactoglobulin, which is the predominant whey protein
in type A fouling deposit [31], can readily form disulfide bridges and can thus be collapsed by
the reaction with hydroxyl ions, causing swelling of the protein layer.
Inside a protein-based fouling layer a range of reactions are likely to occur, when the cleaning
agent molecules enter the network. The heat used to coagulate and precipitate proteins has
altered the internal structure of the protein and exposed internal hydrophobic amino acid
residues. The unfolded protein can react with hydroxyl ions entering the protein layer, which
can lead to (partial) hydrolyse of the protein and disentanglement of the protein network. The
(negative) charge density is likely to be increased as the increase in pH, which in turn leads to

Understanding the cleaning process
36
an increases intra- and intermolecular electrostatic repulsion that causes swelling of the
fouling layer.
Figure 14 Swelling of protein gels occur even at low concentration of alkali. WPC gels were submerged in alkali solutions at
20 °C with different NaOH concentration (0.1, 0.5, 1.0 %, which should correspond to a pH of 12.4, 13.0 and 13.4). The
swelling is largest at 1% NaOH, that swelled almost with 100 % of the initial volume within 10 minutes [80].
Alkali solutions will cause protein fouling to swell even at low concentrations (Figure 21).
When using NaOH to remove a protein deposit, an optimum concentration has been found at
0.5-1% (w/w) or 0.1 M [76]. A higher concentration can create a gel layer on top of the
fouling, which restricts the transport of particles detached from the fouling layer into the bulk
and thus hampers the cleaning process [56, 76]. This phenomenon has been seen in lab scale
and for model fouling, but has so far not been observed in the industry where the chemical
concentration is generally larger than 1% and the temperature is also higher.
The main aim for using an acidic cleaning agent is to dissolve the mineral deposits by
lowering the pH. Calcium phosphates have a decreased solubility with increasing temperature
and can therefore not be dissolved by the warm regular cleaning solution, but needs the pH to
be lowered in order to disrupt the balance in the crystal formation.
The acidic cleaning agent is consumed in the cleaning process, which needs to be taken into
account for in the dosing. The regular concentration for acidic cleaning agent in the dairy
industry is in the range of 2% for heated and heavily fouled surface.
The fouling layer removal are not only determined by the individual components but can be
attributed to the properties of the whole of the fouling layer. Such properties are the cohesive
and adhesive strength of the layer. Cohesion is the forces holding the internal structure
whereas the adhesion is the force keeping the structure to a foreign material, in this case the
stainless steel of the process equipment.
The adhesive and cohesive properties of the fouling has been found important, but there is not
a straightforward answer to which one is the strongest in a protein fouling layer [56, 80].
Micromanipulation shows differences in these properties between for example different food
fouling. Tomato paste has higher cohesive properties whereas milk protein (WPC) fouling has

Understanding the cleaning process
37
shown a higher adhesive strength (figure 22) [80]. The adhesive forces in milk protein fouling
is affected by the protein the properties and differ between native and denatured globular
protein [27].
Figure 15 Milk protein fouling produced on a metal surface at 90°C has a higher adhesive strength than the cohesive fouling
strength further from the steel surface. The graph show the energy needed to pull a probe through the sample, and has been
shown to differ between different fouling products [80, 81].
Whether the adhesive or cohesive properties dominate is important for the way the fouling
layer is removed, i.e. if shredding of protein in layers and ripping lumps of protein from the
surface occurs [84]. The transfer mechanism of fouling components into the bulk cleaning
solution was discussed in a paper from Christian and Fryer from 2004, where they show that
both cohesive and adhesive forces might be available and that there is a possibility to change
the mass transfer mode of proteins by changing the alkali concentration [43].
Different strategies have been tried to modify the stainless steel in order to develop a new
non-adhesive surface for processing liquids that are known to cause severe fouling. Changing
the surface energy and/or topography, changes the adhesive properties, which in turn can
affect both the formation of the fouling layer and the cleanability of the surface [38] [48].
The mechanical forces are not static and will change both locally at each time point, but also
over time due to the changes in fouling properties. Cleaning is done in a fully developed
turbulent flow (Re >2300), but the irregularities in fouling might contribute further to increase
the turbulence. The flow will transport loose substances from the surface quickly, creating the
concentration gradient for new molecules to be transported out from the fouling layer.
Shear is the result of the difference in velocity between the fluid motion and the stainless steel
surface and will be influenced by turbulent motion. Shear forces are therefore of course
important for removal rate of fouling. Mineral fouling is considered to be smooth [91], not
creating increased turbulence in the flow pattern.

Understanding the cleaning process
38
7.2 Models to describe the cleaning process
The mechanisms involved are highly intertwined and changes over time as the fouling
structure and composition changes. In order to bring clarity to the problem, descriptive and
mathematical models have been developed, each simplifying the problem to produce a
solution that is applicable to the situation. Most models produced so far does not consider the
whole complexity of the milk fouling, but focusing on either the protein or the mineral part of
the fouling.
The protein-based models can represent the type A fouling that has a high concentration of
protein. The removal is then often regarded as a step-by-step reaction producing a perfectly
layered fouling/reaction front, with clearly specified steps. A protein system is not appropriate
to use to draw conclusions on the cleaning process of type B fouling, since a more complex
model system including proteins a high mineral concentration has to be used. For model
systems based on different content of the deposit, a direct comparison of the models is
difficult. Cleaning models that does not directly correspond to reality can still cast some light
over the many questions that so far have been un-answered. However, the benefit of using a
combined protein and mineral fouling in the search for a solution of the issue of cleaning is
clear.
The models introduced in this chapter are based on different fouling systems, which is
important to keep in mind when comparing models. The models presented are well known in
the field and frequently referred to when looking into the cleaning process of milk fouling.
7.2.1 Gallot-Lavalleé and Lalande 1985
The work presented by Gallot-Lavalleé and Lalande in 1985, were done on a heterogeneous
fouling. The fouling used was created in a pilot pasteurization of 2000 L raw milk, creating a
fouling corresponding to the type A group. The cleaning agent used was NaOH with
concentration varying from 0.1 to 3.9 %. The model is based on the data of online
measurements with optical sensors measuring turbidity changes [96].
Figure 16 According to the model suggested by Gallot-Lavalleé and Lalande, the mechanisms involved in cleaning is the
diffusion of sodium hydroxyl ions through the fouling layer. The protein layer swells, forming an intermediate layer, Y,.
Units of protein fouling will detach from the fouling, and will be transferred first by diffusion through the protein layer Y and
then by the fluid motion. The diffusion of Y into the formation of Z is considered to be the rate limiting step [96, 105].

Understanding the cleaning process
39
Based on studies of the fouling layer during the cleaning process, Gallot-Lavalleé and
Lalande suggest that the cleaning agent changes the fouling to layered structure (Figure 23).
Both the transformation of the unreacted fouling, X, into the swelled intermediate fouling, Y,
and the final transformation of Y into removable units, Z, is thought of as first order reactions
[96, 105]. The reaction rate constants for the two stages seem to be equal giving the reaction
rate for the formation of the final units, Z, to be:
M0 is the initial mass of the fouling. The reaction rate rz was seen first to increase, reach a
maximum and then decrease again. This suggests that the limiting step of the cleaning is the
reaction where the swelled protein detach and form the final units, Z [105].
The reaction stages have been described mathematically, using first order reactions. The first
stage in the cleaning process is the external transfer of hydroxyl ions to the fouling surface
followed by the internal diffusion of hydroxyl ions inside the fouling. The rate is calculated
by using Fick’s law of mass flux:
βOH is the mass transfer coefficient of hydroxyl ions between the bulk and deposit surface.
Rate of internal diffusion is dependent on the area, density of the intermediate fouling Y and
mass of swelled fouling MY. The diffusion coefficient DOH can be calculated from the Stoke-
Einstein relation for a spherical particle.
The expression for the diffusion coefficient DOH, clearly indicates that the increase in the
viscosity due to swelling of the protein layer will induce a lowering of the rate of diffusion
through the fouling.
The reaction, where the original fouling come in contact with the cleaning agent, which make
it swell to form an intermediate fouling layer occurs in the reaction zone f. This can described
as a first order reaction depending on the concentration of hydroxyl ions and the thickness (F)
and the number, n, of X reacting with the cleaning agent.
The temperature dependence according to the Arrhenius law of the reaction rate of fouling Y
swelling of the can be expressed as
(
)
⁄

Understanding the cleaning process
40
Where Er is the activation energy (kcal/mol) and R is the ideal gas constant. The mass transfer
of loose intermediate fouling in the swelled layer is described as
βD is the mass transfer coefficient of the protein residues released from the network structure.
MY is the mass of fouling residues from the swelled volume, and V is the total volume of the
tube. The formation rate of the final units that will be transferred from the fouling layer to the
bulk liquid is described in a similar way
Similar models with a reaction front or reaction zone have also been published by Bird and
Fryer, 1991 [30], but also Xin et al in 2004 [84]. These models will be discussed below.
7.2.2 Bird and Fryer 1991
In 1991 Bird and Fryer was published a cleaning study based on a model fouling made by
pumping a 3% whey protein solution through a pipe at Re = 6000 at a temperature from 75 to
95 during one hour [30].
The authors investigated cleaning as a function of temperature, flow and cleaning agent
concentration, referring to the work done in the late 50th
by Jennings and coworkers. These
are also the same parameters varied by Gallot-Lavalleé et al [96, 105]. The cleaning agent
used was also the sodium hydroxide.
The cleaning rate followed the same pattern as seen in other studies where there is a rapid
increase in the beginning, which then levels out and then decreases. This observation has been
done by several other researchers afterwards [84, 106], although for the Bird and Fryer study
it is shown that the temperature needs to be above 60°C to have an significant increase in
cleaning rate. The change in cleaning rate between 50 and 60 °C (Figure 17, left) was found
to be so large that it could not only be an effect of the increase of diffusion rates and
dissolution that occur at the elevated temperature [30]. This increase in cleaning rate occurs at
about 60 °C, which also was reported by Gallot-Lavalleé and Lalande [105]. The activation
energy barrier for some chemical reaction inside the fouling layer, which is important for the
cleaning process, seems to have been reached at this temperature.

Understanding the cleaning process
41
Figure 17 Left graph shows the removal rate at different temperature at a cleaning agent concentration 1% NaOH. Right
graph shows the effect of cleaning agent concentration at 50 °C is seen [30]. Color lines are added to highlight the measured
difference between 0.5 % and the 2 %NaOH often seen for heated surfaces in the dairy industry
At low temperatures like 50 °C a clear initial increase in cleaning rate with cleaning time
(Figure 17, right) is seen even for alkali cleaning solution concentrations far below used in the
industry.
Based on imaging data of the cleaning process with SEM, Bird and Fryer suggests that the
removal of the fouling is not uniform and is removed in lumps. But they also observed that
fouling treated with high concentration of NaOH will form a translucent protein layer that
only disappears very slowly, indicating that it for this type of fouling exist an optimal alkali
concentration. The formation of a smooth gel like layer due to high alkali concentration is
also discussed by Jeurnink and Brinkman, 1999, and Mercadé-Prieto et al 2008 [56, 76].
7.2.3 Jeurnink and Brinkman 1994
In 1994 a model of the mechanism for removal of milk fouling produced by pasteurization of
milk was presented (Figure 26) [56]. The fouling is removed with both an alkali and an acid
cleaning step. By monitoring the removal of both protein and mineral deposit a model of the
fouling layer removal, based on the transfer of the fouling as larger pieces from the surface to
the bulk, was developed. The fouling layer here is considered divided into a voluminous
protein layer on top of a thin and dense mineral layer next to the surface.
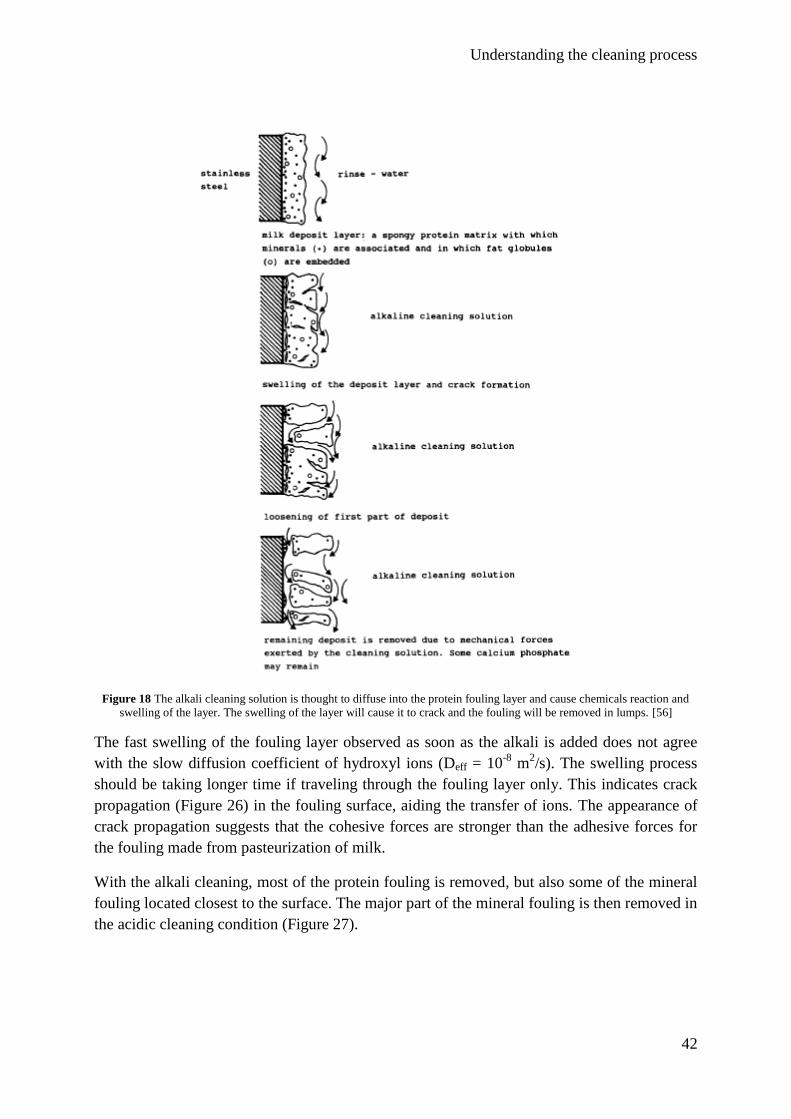
Understanding the cleaning process
42
Figure 18 The alkali cleaning solution is thought to diffuse into the protein fouling layer and cause chemicals reaction and
swelling of the layer. The swelling of the layer will cause it to crack and the fouling will be removed in lumps. [56]
The fast swelling of the fouling layer observed as soon as the alkali is added does not agree
with the slow diffusion coefficient of hydroxyl ions (Deff = 10-8
m2/s). The swelling process
should be taking longer time if traveling through the fouling layer only. This indicates crack
propagation (Figure 26) in the fouling surface, aiding the transfer of ions. The appearance of
crack propagation suggests that the cohesive forces are stronger than the adhesive forces for
the fouling made from pasteurization of milk.
With the alkali cleaning, most of the protein fouling is removed, but also some of the mineral
fouling located closest to the surface. The major part of the mineral fouling is then removed in
the acidic cleaning condition (Figure 27).

Understanding the cleaning process
43
Figure 19 The protein content of the fouling, but also some of the mineral fouling is removed during the alkali cleaning step.
The rest of the mineral fouling is removed during the acid cleaning step [56].
The model where the fouling cracks upon swelling and leaves the surface in larger lumps has
been supported in a study by van Asselt et al in 2002 showing that approximately 30% of the
inorganic deposit was removed during the first alkali cleaning. They also showed that almost
no organic compound could be detected by the turbidity measurement after the first alkali and
water rinse. The main inorganic part of the fouling was removed during the acid cleaning step
[56].
One aspect discussed in the model by Jeurnink and Brinkman in 1994, is that the efficiency of
the alkali cleaning agent concentration seem to have a maximum. A rubber like top layer was
seen when cleaning the deposit at high concentration (4.5%) or at regular concentration but
with reduced fluid velocity. This part of the experiment was conducted on the fouling
produced in an evaporator at 70 °C and not in the heat exchanger. This has been noticed by
other researchers and explained as due to a gel layer formed on top of the fouling layer that
is not permeable for the disentangling or erupting polymer of the fouling layer (Figure 28)
[16, 76]. Mercadé-Prieto et al in 2008 showed a retardation of cleaning when the gel was
soaked in a high concentration (>3M) NaOH, but also that the effect is reversible if the alkali
concentration is again lowered [76]. It should be noticed that these experiments are made in
room temperature or slightly above (50 °C).

Understanding the cleaning process
44
Figure 20 An increase of alkali concentration above the optimum causes a film to form on the surface of the fouling. This
does not allow swelling of and diffusion through the protein deposit. This have a negative effect on the cleaning process [56,
76].
7.2.4 Grant et al 1999
There is no model to be found in literature that discusses the complexity of the mechanism
involved in a type B fouling. The mineral deposit model produced by Grant et al in 1999
could be a complement to the type A fouling models seen.
A mineral deposit with radio-labeled calcium phosphate, P32
, was used as model fouling to
detect and follow the dissolution of the deposit. The deposit was formed by drying a solution
of calcium phosphate and calcium hydroxide inside the stainless steel tubes. The ratio of Ca/P
was kept at the level found in fouling after high temperature processing of milk. The model
discussed is based on the dissolving mass transfer flux, J, of a molecule due to the
concentration gradient.
Where the km is the mass transfer coefficient and the rate of removal of the mineral deposit
can be explained as
In the final model of mineral deposit removal, the process is a combination of shear forces,
ripping the deposit in lumps from the surface, and dissolution, dissolving the deposit on a
molecular level (Figure 29).

Understanding the cleaning process
45
Figure 21 Measurements of the removal rate of a calcium phosphate deposit onto a stainless steel. Both the mechanical shear
from the flow velocity and the pH is of importance when studying removal of mineral deposit [91].
7.2.5 Xin et al 2004
Xin et al 2004 bases their mathematical model on a heat induced gel (and thus not necessary
emulates protein layers formed under conditions close to those in a heat pasteurizer/sterilizer),
the dissolution model for polymeric materials is integrated. Dissolution of polymeric material
includes both disentanglement and diffusion through the polymer network, which was
identified in the Gallot-Lavalleé and Lalande model from 1985.
Parameters that have an impact on the dissolution according to Xin et al are: the diffusion
coefficient, D, of the cleaning solution, the molecular weight of the polymer, M, the quality of
the solvent, structure and shape of the fouling layer, agitation from the bulk flow and the
temperature [84].
The model introduced consists of two stages: swelling/uniform step and the decaying step
(Figure 30). The reptation time of the polymer molecules, which is a delay time before the
disentanglement of the polymer can be detected, is included in the model. The reptation and
disentanglement is part of the swelling/uniform part of the model. The reptation event in the
model has higher activation energy than the other processes, indicating that other mechanisms
are involved.
During the swelling and uniform cleaning stage the rate of cleaning, r, of deposit mass, M, is
given by

Understanding the cleaning process
46
Here, rm is the cleaning rate during the uniform cleaning and is function of the mass transfer
coefficient and volume fraction (Φ) of disengaged polymers in the boundary layer. is the
kinetic constant for the swelling process.
Figure 22 The cleaning process can be monitored by following the change in cleaning rate over time. During the reptation
time, tr, the cleaning rate is close to zero, then rapidly increases due to the cleaning agent/ fouling reaction causing the protein
layer to swe ll. mc in the decay stage correspond to the critical mass still on the surface [84].
After the uniform stage, the cleaning rate decay (decay stage) and at this stage the surface
appears patchy and non-uniform. The cleaning is now dependent on the amount of fouling
still left on the surface, AL, but is still to be controlled by dissolution and mass transfer.
kA is the first order rate constant that is dependent on temperature, flow velocity, cleaning
agent concentration and the mechanical forces from the flow.
The three stages of swelling, uniform removal and decay was also reported by Gillham et al in
1999, who measured the CIP removal of WPC fouling (3.5 w/w %) produced at
approximately 97 °C. The cleaning behavior was followed with the aid of heat transfer
measurements as well as imaging where the surface structure and composition was followed
over time [106].
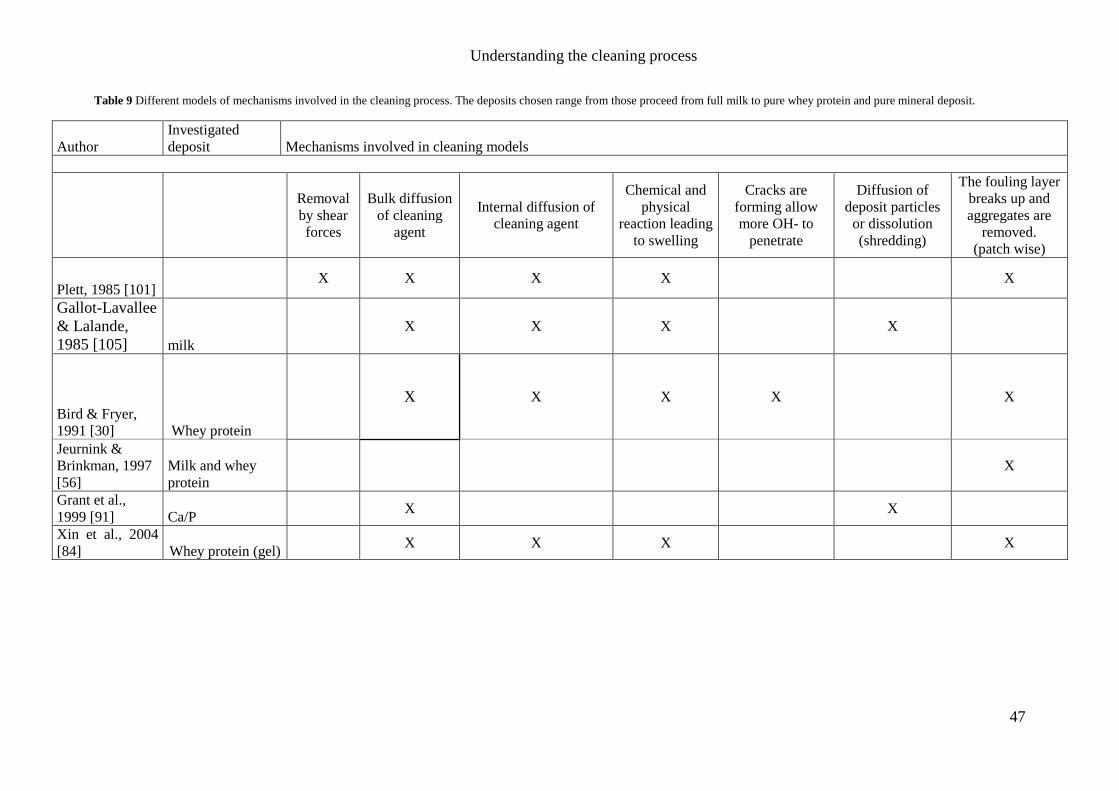
Understanding the cleaning process
47
Table 9 Different models of mechanisms involved in the cleaning process. The deposits chosen range from those proceed from full milk to pure whey protein and pure mineral deposit.
Author Investigated
deposit Mechanisms involved in cleaning models
Removal
by shear
forces
Bulk diffusion
of cleaning
agent
Internal diffusion of
cleaning agent
Chemical and
physical
reaction leading
to swelling
Cracks are
forming allow
more OH- to
penetrate
Diffusion of
deposit particles
or dissolution
(shredding)
The fouling layer
breaks up and
aggregates are
removed. (patch wise)
Plett, 1985 [101] X X X X X
Gallot-Lavallee
& Lalande,
1985 [105] milk
X X X X
Bird & Fryer,
1991 [30] Whey protein
X X X X X
Jeurnink &
Brinkman, 1997
[56] Milk and whey
protein X
Grant et al.,
1999 [91] Ca/P X X
Xin et al., 2004
[84] Whey protein (gel) X X X X

Understanding the cleaning process
48
7.3 Conclusion for the understanding of the cleaning process
Several research groups have been trying to explain the mechanisms of cleaning in the dairy
industry, mostly on type A, either by using fouling on pilot scale or a whey protein based
model system. The important mechanisms for cleaning of fouling is
Diffusion
Swelling
Disruption and dissolution
Shear forces from the flowing liquid
Most of the protein models assume that the protein is removed patch wise after the fouling
layer is swelled by treatment with an alkali detergent. The mineral content needs acidic
conditions to dissolve. Elevated cleaning temperatures do not help remove mineral deposits
due to the inverse solubility to several of the salts common in the milk fouling.
The formation of a gel on the fouling layer due to alkali treatment has been discussed and it
has generally been found that 0.5% NaOH do not give an extensive gel layer, but do give
sufficient cleaning. However, gel layer that retards the cleaning process if developed has not
been observed in industrial processes. Based on previous studies, the gel seems to form
At low concentrations, when the temperature is low (50 °C)
At low concentrations, with reduced fluid flow
At very high concentrations (NaOH at 4.5%)
For an industrial application where the temperature is between 85- 120 °C, the concentrations
at approximately 2% and normal production flow, gelation of the top layer of the fouling is
not likely to occur.

Evaluation of the cleaning process
49
8 Evaluation of the cleaning efficiency
Cleaning is a necessity in the industrial dairy production plant to sustain a safe product. The
deposit forming on the surface in the heating sections decrease the heat exchange between the
surface and the product. An efficient cleaning cycle is of importance in food production plants
to prevent re-contamination of the product. In dairy production plants CIP (Cleaning-in-place)
cycles are used, alternating NaOH or formulated alkali detergents and HNO3 in a closed
system. To measure the efficiency of the cleaning process is a challenge.
8.1 Industrial evaluation of the cleaning process
A clean surface in dairy processing industry is a surface with no microbial growth, but also no
residues from the previous production run. Cleanliness can be evaluated in different ways; for
example by quantify what is left on the surface after cleaning or by determine the amount
contamination in the effluent.
Bacterial and fungal tests are often used for product samples to be able to locate
contaminations and cross-contaminations; they are however not useful for the everyday
cleaning evaluation, due to the time needed to for cultures to grow in the lab. ATP (adenosine
tri-phosphate, an energy carrier inside the living cell) swabs and UV-light is faster and
commonly used to locate problem areas and investigate newly installed equipment [109]. The
interpretation of these methods is difficult and does not give an overall view of the state of the
equipment. A visual inspection of tubes and heat exchangers can be used [110] and is thought
of as being sufficient in many industrial applications, but more than a trained eye is
sometimes needed to see the remaining fouling on the surface.
When using a system like CIP cleaning or as for the UHT plants a completely aseptic process,
the equipment is not possible to dismantle for visual inspection after each run. It is therefore
important for an industrial environment to be able to ensure that the cleaning process is potent
enough to make certain that it is clean in every part of the system after each cleaning cycle.
The production process is optimized to have an as optimal schedule for production and
cleaning as possible. Normally there are sensors for temperature, pressure, conductivity and
flow available to assess the system. Fouling forming in the process equipment cause changes
in heat transfer and the temperature difference between the wall and the product will increase.
The fouling will also influence the flow behavior and pressure inside the tubes which can to
some extent be monitored by the pressure and flow meter.

Evaluation of the cleaning process
50
8.2 Evaluation of the cleaning process reveal the mechanism
For research purposes, the measurements do not need to be quick, easy to handle and non-
invasive. The equipment can be dismantled and prepared at different stages and for different
type of analyses.
Following the fouling removal (and buildup) with a direct online measurement with time on a
surface inside a process plant is difficult to do on an industrial scale. Downsizing the
equipment to a smaller pilot plant is many times used for research purposes, but still has not
given the obvious methods to online and on site follow the changes of the fouling. The
noninvasive effluent analysis are common in pilot scale cleaning studies [107]. By monitoring
and analyzing the effluent during cleaning over time, important information is obtained; such
as when the protein and mineral content is released in comparison to each other and to the
current parameters used for the cleaning process. From effluent analysis, the original
composition of the fouling can be determined, but without any spatial information. Since it’s
common to foul the surfaces in a closed system, it is difficult to a priori visualize and
determine the microstructure. The spatial information is therefore in many cases not available.
UV-absorbance can be used in cleaning studies to investigate the effluent concentration of
proteins [84]. It is also possible to measure the protein content by measuring the chemical
oxygen demand (COD) [5, 56] or the Kjeldahl method [31, 49-51]. An analysis of the effluent
can only tell when there is nothing left leaving the equipment, but cannot validate that the
surface is clean. Visual inspection is an off-line method and can range from ordinary photos
to follow the course of cleaning, but also together with dyes for specific elements and
microscopic techniques to enhance the details and resolution. Using Scanning electron
microscopy (SEM) structural changes of the fouling, such as the swelling of the protein
deposit, can be revealed. The content of the mineral deposit could be obtained in using a
SEM-EDX, giving the elemental composition in a certain area of the sample [111].
The above mentioned methods are the same as discussed in chapter 4 under fouling
characterization.
8.3 Methodologies for evaluating cleaning mechanisms and efficiency
The composition and structure of the fouling, before, during and after cleaning is important.
But the questions on mechanisms and cleanability are important as well. The cleaning
mechanisms presented in the models previously (7.2) could be verified by visualizing the
processes and how parameters like diffusion, swelling, dissolution, cohesive and adhesive
strength and mass transfer affecting them.
Diffusion analysis by Fluorescence recovery after photo bleaching (FRAP)
Diffusion in a material such as a gel can be followed by using a technique called Fluorescence
recovery after photo bleaching (FRAP), which make use of fluorescent probes and the
confocal laser scanning microscope. In this technique fluorescent probes in a defined area is

Evaluation of the cleaning process
51
bleached out and the back diffusion of still fluorescing probes into this area is measured. The
diffusion coefficient can be evaluated in a range of 0.1-300 μm2/s [112].Thus it can be used to
study hydroxide ions in an dilute alkali cleaning solution at 20 °C with an approximate
diffusion coefficient, D = 1.65 μm2/s (7.1, p 37). With the effective diffusion of hydroxyl ions
discussed by Jeurnink and Brinkman [56], the diffusion would be too slow to follow with the
FRAP.
There is also the possibility of measuring the diffusion of a particle by the dynamic light
scattering (DLS) technique. DLS works best when measuring dilute and transparent solution
of spherical particles. Thus following the diffusion inside of a gel like structure, such as
protein fouling, is challenging.
Fluid dynamic gauging to follow thickness changes
Fluid dynamic gauging is developed and used by the group of Professor Ian Wilson [108,
113-115]. With this technique, it is possible to measure the thickness of the fouling over time
inside the system. The instrument is based on a suction flow through a nozzle lowered down
toward the fouling surface (Figure 31). For the measurement to yield a good result the
distance between the surface and the nozzle should not exceed one fourth of the nozzle tip
diameter, the equipment therfore needs to be insertet close to the surface, with the possibility
of obstructing a passing flow. The method has been used both for measurements under
stagnant conditions and in fluid flow. Measurements with the FDG technique requires that
the surface remains smooth and that it is not substantially removed in lumps by the force of
the suction flow [108]. In addition to obtain the thickness of the fouling layer, analysis of the
clean surface is need.
Figure 23 Sketch of the principles of fluid dynamic gauging. The nozzle tip diameter is of importance since it will determine
the sensitivity of the measurement. When the distance between the surface and nozzle (h) is within a distance of dt/4 from
each other, the accuracy of the measurement can be down to ±10 μm. Image adapted from [116]

Evaluation of the cleaning process
52
Ultrasound to follow thickness changes in-line and over time
Another method of measuring thickness and thickness changes is the use of ultrasonic waves.
This method is possible to use in a way that will not disturb to the flow of cleaning agent
solution. Ultrsonic methods use sound waves with a frequency above 20 MHz and two
important parameters is the velocity and the attenuation of the sound waves [117].
Most ultrasonic devices uses piezoelectric crystal transducers that are both generating the
ultrasound vibrations due to applied electrical potential, and also detect the (reflected) sound
wave [117]. Thickness measurements of fouling in the food industry have previously been
performed with the aid of ultrasonic sensor. Li and co-workers have studied the fouling of
membranes [118, 119], whereas others like Withers and Lohr have studied the fouling in
pipes [117-121]. In industry ultrasonic equipment is sometimes used for thickness
measurement in pipes, monitoring corrosion and other similar phenomena.
There are mainly two types of ultrasonic transducers to be used for thickness measurements.
The transducer can have the function of both transmitting and receiving the signal, a pulse-
echo transducer (figure 32). There can also be use of two transducers, placed on the opposite
side of the pipe from each other. In the latter case, one transducer is emitting the signal
whereas the other is acting as a receiver [121].
Figure 24 Schematic picture of how ultrasound can be used to analyze thickness non-invasively. The figure shows pulse-
echo single transducer to the left. Here the energy waves from the echo of the opposite side of the pipe are used for analysis.
To the right in the figure the transmission technique is shown, using two transducers for measuring the fouling thickness.
The main drawback of the pulsed echo system is that enough of the sound waves need to be
reflected to make the analysis. An uneven surface of the fouling will spread the signal
dramatically whereas the surface topography for the transmission technique doesn’t have a
significant impact since the signal is going through the material. The scattering of sound
waves, hence the lack of information reaching the receiver has been the main reason for not
choosing the pulsed echo technique for thickness measurements [117, 120, 121].
It is not yet common to follow the thickness changes to quantify the cleaning. Another
approach based on ultrasound to monitor the presence and removal of fouling from a surface
is has been developed by the group of Professor Thomas Becker. The method makes use of
acoustic impedance measuring the existence of the fouling in the production line from beneath
the fouling suface. An artificial neural network has been adopted to analyze the data from the
sensory system makes it possible to with high reliability determine whether the fouling is
present or not [95]. The system is developed as a on/off system and is not possible to directly
use to follow the fouling changes in discrete steps.
Evaluation of the cleaning process
53
By using the accoustic impedance, which is the reluctancy to transmit the sound wave through
the medium, the fouling can be visualized. The impedance, Z, is dependent on the density, ρ,
and the velocity of sound through the medium.
The difference in density and velocity of sound between stainless steel, fouling and cleaning
solution, should be possible to use to receive a good measurements of the changes within the
fouling.
Conductivity and turbidity
Additional methods that can be used in the cleaning, to monitor the flow and concentration of
cleaning agent, are as mentioned conductivity and the turbidity measurements of the solution.
Electrical conductivity (mS/m) will not give explicit information on the cleaning efficiency,
but can give complementary information. Water, alkali and acid solutions will have different
conductivity, and it is therefore possible to monitor the different steps of cleaning and
correlate with additional measurements from another method. Conductivity is temperature
dependent which has to be accounted for when comparing measurement data. Conductivity
can be correlated to the concentration of cleaning agent and the pH at different temperature
and can be useful during dosing of cleaning agent.
Turbidity is a sensitive method to use to detect particles in a suspension and has been used
together with conductivity measurements to visualize when in the different cleaning steps the
fouling is released from the surface. Salts that completely dissolve in the solution cannot be
detected with this method. It is also more useful as an off-line method since the scattering
from the released particles can be distorted by the foam forming in in-line cleaning solution
[57].

Evaluation of the cleaning process
54
Additional methods, mainly suitable for research are discussed in detail in chapter 4.3. Table
10 and 11summarize methods can be used to follow and reveal the mechanisms of the
cleaning process ().
Table 10 Methods for evaluating cleaning efficiency and the mechanisms involved in cleaning, in-line measurements.
Online measurements
Method Positive aspects Negative aspects Sensitivity
Pressure
changes
Hydraulic
diameter
Non-invasive,
common in
industrial
applications
Indirect
measurement -
Heat transfer
changes
Temperature
difference
between
surface and
product
Follow overall heat
transfer over time
Indirect
measurement.
Heat transfer
coefficient for
fouling is not
constant
-
Fluid
dynamic
gauging
fouling
thickness
Visualize the
swelling and
removal
Invasive equipment ±10 μm if h<
dt/4
Ultrasound fouling
thickness
Good resolution of
thickness changes
Heterogeneous
surfaces scatter
signal and reduce
performance
Depends on the
sampling
frequency
Turbidity
Changes in
solution
turbidity
Visualize small
changes in particle
concentration in the
bulk
Sensitive to foam
880 nm
0 to 3000 ppm
0.0 to 3.0 g/l
Conductivity
Follow
changes
detergent
concentration
pH dependent Temperature
dependent
100 µS/cm –
2000 mS/cm at
temperature -5
– 140 °C

Evaluation of the cleaning process
55
Table 11 Methods for evaluating cleaning efficiency and the mechanisms involved in cleaning, off-line measurements. The
table focuses on research methods and does not include all industrial methods used.
Offline Measurements
Method Positive aspects Negative aspects Sensitivity
UV-lamp Product residues
ATP Microbial
growth Quick test
SEM structure Structural
information
Harsh preparations that
could interfere with the
structure stability
<1 nm
CLSM structure
Structural and
composition
information
Require preparation of
the sample
Depends on the
settings and equipment
ESCA/XPS Protein and
mineral content
Information on
both protein and
mineral
Need dry samples.
Some elements are
difficult to distinguish
500x500 µm, depth of
4-5nm
TOF-SIMS Protein and
mineral content
Information on
both protein and
mineral
Need dry samples.
Some elements are
difficult to distinguish
500x500 µm, depth of
1 nm
HPLC Mineral content
Information on
lactose and citrate
content
No spatial information Depends on the
column and method
COD Organic content Commonly used
in research No spatial information 1 mg/L
UV
absorbance
Protein
concentration
Commonly used
in research No spatial information 1 mg/L, protein size of
Kjeldahl Protein
concentration
Accurate and well
known method
Make use of toxic
substance for catalysis ~0.1wt %
Atomic
absorption Mineral content
Many atoms can
be identified No spatial information See figure 21
QCM-D
Fouling
adsorption/deso
rption
Investigation on
microscopic level
Only small amounts of
mass
Ellipsometer
Fouling
adsorption/deso
rption
Investigation on
microscopic level
Only thin film on
reflecting material

9 References
1. International Dairy Federation, Bulletin of the International Dairy Federation 446/2010, I.D.
Federation, Editor 2010.
2. Svensk Mjölk. Mjölk i siffror. 2012; Available from:
http://www.svenskmjolk.se/Global/Dokument/Dokumentarkiv/Statistik/Mj%C3%B6lk%20i%
20siffror.pdf.
3. Walstra, P., J.T.M. Wouters, and T.J. Geurts, Milk for Liquid Consumption, in Dairy Science
and Technology, Second Edition2005, CRC Press. p. 421-446.
4. Walstra, P., J.T.M. Wouters, and T.J. Geurts, Fouling and Sanitizing, in Dairy Science and
Technology, Second Edition2005, CRC Press. p. 399-410.
5. Alvarez, N., G. Daufin, and G. Gesan-Guiziou, Recommendations for rationalizing cleaning-
in-place in the dairy industry: case study of an ultra-high temperature heat exchanger. Journal
of dairy science, 2010. 93(2): p. 808-21.
6. Bylund, G., Dairy Processing handbook1995: Tetra Pak Processing Systems AB.
7. Huppertz, T. and A.L. Kelly, Properties and constituents of cow's milk, in Milk Processing
and Quality Management2009, John Wiley & Sons. p. 23-47.
8. Belitz, H.-D., W. Grosch, and P. Schieberle, Milk and Dairy Products, in Food
Chemistry2004, Springer. p. 471-512.
9. Walstra, P., J.T.M. Wouters, and T.J. Geurts, Milk Components, in Dairy Science and
Technology, Second Edition2005, CRC Press. p. 17-108.
10. Fox, P.F. and P.L.H. McSweeney, Milk Lipids, in Dairy Chemistry and Biochemistry1998,
Thomson Science, Kluwer Academic Publishers Group. p. 67-145.
11. Dewettinck, K., et al., Nutritional and technological aspects of milk fat globule membrane
material. International Dairy Journal, 2008. 18(5): p. 436-457.
12. Gaucheron, F., The minerals of milk. Reproduction Nutrition Development, 2005. 45(4): p.
473-483.
13. Holt, C., Structure and Stability of Bovine Casein Micelles, in Advances in Protein Chemistry,
F.M.R.J.T.E. C.B. Anfinsen and S.E. David, Editors. 1992, Academic Press. p. 63-151.
14. Pouliot, Y., M. Boulet, and P. Paquin, Observations on the heat-induced salt balance changes
in milk I. Effect of heating time between 4 and 90 degrees. Journal of Dairy Research, 1988.
56: p. 185-192.
15. Visser, J. and T.J.M. Jeurnink, Fouling of heat exchangers in the dairy industry. Experimental
Thermal and Fluid Science, 1997. 14(4): p. 407-424.
16. Walstra, P., J.T.M. Wouters, and T.J. Geurts, Heat Treatment, in Dairy Science and
Technology, Second Edition2005, CRC Press. p. 225-272.
17. Papiz, M.Z., et al., The structure of [beta]-lactoglobulin and its similarity to plasma retinol-
binding protein. Nature, 1986. 324(6095): p. 383-385.
18. Horne, D.S., Casein Interactions: Casting Light on the Black Boxes, the Structure in Dairy
Products. International Dairy Journal, 1998. 8(3): p. 171-177.
19. Dalgleish, D.G., P.A. Spagnuolo, and H. Douglas Goff, A possible structure of the casein
micelle based on high-resolution field-emission scanning electron microscopy. International
Dairy Journal, 2004. 14(12): p. 1025-1031.
20. Burton, H., Deposits from Milk in Heat Treatment Plants - a Review and Discussion. Journal
of Dairy Research, 1968. 35: p. 317-330.
21. Evans, D.F. and H. Wennerström, Colloidal Stability, in The colloidal domain. Where physics,
chemistry, biology and technology meet 1999, Wiley-VCH. p. 401-437.
22. Visser, H., The role of surfac forces in foluing of stainless steel in the dairy industry. Journal
of Dispersion Science and Technology, 1998. 19(6-7): p. 1127-1150.
23. van Oss, C.J., Acid-base interfacial interactions in aqueous media. Colloids and Surfaces A:
Physicochemical and Engineering Aspects, 1993. 78(C): p. 1-49.
24. Sandu, C. and D. Lund, Fouling of Heating Surfaces - Chemical Reaction Fouling ue to Milk,
in Fouling & Cleaning in Food Processing1985: University of Wisconsin-Madison. p. 122-
167.
25. Fryer, P.J. and M.T. Belmar-Beiny, Fouling of heat exchangers in the food industry: a
chemical engineering prespective. Trends in Food Science & Technology, 1991. 2: p. 33-37.
26. Grijspeerdt, K., Applications of modelling to optimise ultra high temperature milk heat
exchangers with respect to fouling. Food Control, 2004. 15(2): p. 117-130.
27. Nassauer, J. and H.G. Kessler, The effect of electrostatic phenomena on the cleaning of
surfaces. Chemical Engineering and Processing: Process Intensification, 1986. 20(1): p. 43-
52.
28. Hinrichs, J. and B. Rademacher, Kinetics of combined thermal and pressure-induced whey
protein denaturation in bovine skim milk. International Dairy Journal, 2005. 15: p. 315-323.
29. Oldfield, D.J., et al., Heat-induced interactions of b-lactoglobulin and a-lactalbumin with the
casein micelle in pH-adjusted skim milk. International Dairy Journal, 2000. 10: p. 509-518.
30. Bird, M.R. and P.J. Fryer, Experimental study of cleaning of surfaces fouled by whey proteins.
Food and Bioproducts Processing, 1991. 69: p. 13-21.
31. Lalande, M., J.P. Tissier, and G. Corrieu, Fouling of a plate heat exchanger used in ultra-
high-temperature sterilization of milk. Journal of Dairy Research, 1984. 51: p. 557-568.
32. Foster, C.L. and M.L. Green, A model heat exchange apparatus for the investigation of fouling
of stainless steel surfaces by milk II. Deposition of fouling material at 140 °C, its adhesion
and depth profiling. Journal of Dairy Research, 1990. 57: p. 339-348.
33. Van Boekel, M.A.J.S., Effect of heating on Maillard reactions in milk. Food Chemistry, 1998.
62(4): p. 403-414.
34. Welty, J.R., et al., Fundamentals of Heat Transfer, in Fundamentals of Momentum, Heat, and
Mass Transfer2001, John Wiley & Sons, Inc. p. 201-214.
35. Bird, B.R., E.W. Stewart, and N.E. Lightfoot, Shell energy balances and temperature
distributions in solids and laminar flow, in Transport Phenomena2007. p. 290-319.
36. Asteriadou, K., et al., Improving cleaning of industrial heat induced food an beverages
deposits: a scientific approach to practice, in Proceedings of International Conference on
Heat Exchanger Fouling and Cleaning VIII2009: Schladming, Austria. p. 158-164.
37. Bennet, H.A.E., Aspects of fouling in dairy processing, in Food Engineering2007, Massey
University: Palmerston North. p. 249.
38. Beuf, M., et al., Fouling and cleaning of modified stainless steel plate heat exchangers
processing milk products. Heat Exchanger Fouling and Cleaning: Fundamentals and
Applications, 2003. RP1: p. 99-106.
39. Bode, K., et al., Pulsed Flow Cleaning of Whey Protein Fouling Layers. Heat Transfer
Engineering, 2007. 28(3): p. 202-209.
40. Changani, S.D., M.T. Belmar-Beiny, and P.J. Fryer, Engineering and Chemical Factors
Associated with Fouling and Cleaning in Milk Processing. Experimental Thermal and Fluid
Science, 1997. 14(4): p. 392-406.
41. Robbins, P.T., et al., A Comparison of Milk and Whey Fouling in a Pilot Scale Plate Heat
Exchanger: Implications for Modelling and Mechanistic Studies. Food and Bioproducts
Processing, 1999. 77(2): p. 97-106.
42. Rosmaninho, R., et al., Deposition from a milk mineral solution on novel heat transfer
surfaces under turbulent flow conditions. Journal of Food Engineering, 2008. 85(1): p. 29-41.
43. Christian, G.K. and P.J. Fryer, The balance between chemical and physical effects in the
cleaning of milk fouling deposits, in ECI Conference on Heat Exchanger Fouling and
Cleaning: Fundamentals and Applications2003: New Mexico, USA p. Article 23.
44. Schroeder, D.W. A Tutorial on Pipe Flow Equations. 2001 2012-07-02]; Available from:
http://www.psig.org/papers/2000/0112.pdf.
45. Christian, G.K. and P.J. Fryer, The Effect of Pulsing Cleaning Chemicals on the Cleaning of
Whey Protein Deposits. Food and Bioproducts Processing, 2006. 84(4): p. 320-328.
46. Niemantsverdriet, J.W., Spectroscopy in Catalysis, an Introduction 2ed2000: Wiley-VCH.
47. Premathilaka, S., et al., A Study of the Effects of Surface Chemistry on the Initial Deposition
Mechanisms of Dairy Fouling. Food and Bioproducts Processing, 2006. 84(4): p. 265-273.
48. Santos, O., et al., Modified stainless steel surfaces targeted to reduce fouling--surface
characterization. Journal of Food Engineering, 2004. 64(1): p. 63-79.
49. Barbut, S., Effects of Calcium Level on the Structure of Pre-heated Whey Protein Isolate Gels.
Lebensm.-Wiss. u.-Technol., 1995. 28: p. 598-603.
50. Christian, G.K., S.D. Changani, and P.J. Fryer, The Effect of Adding Minerals on Fouling from
Whey Protein Concentrate. Food and Bioproducts Processing, 2002. 80(4): p. 231-239.
51. Perlat, M.-N., M. Lalande, and G. Corrieu, Etude du nettoyage d'un stérilisateur de lait U.H.T.
Ordre d'utilisation des détergents alcalin et acide et aspects cinétiques. Lait, 1986. 66(1): p.
31-63.
52. Kjeldahl method, in Britannica - Academic Edition.
53. Harris, D.C., Quantitative Chemical analysis. 7 ed2007: W. H. Freeman and Company.
54. Kuaye, A.Y., An ultraviolet spectrophotometric method to determine milk protein content in
alkaline medium. Food Chemistry, 1994. 49(2): p. 207-211.
55. Xin, H., X.D. Chen, and N. Özkan, Cleaning Rate in the Uniform Cleaning Stage for Whey
Protein Gel Deposits. Food and Bioproducts Processing, 2002. 80(4): p. 240-246.
56. Jeurnink, T.J.M. and D.W. Brinkman, The cleaning of heat exchangers and evaporators after
processing milk or whey. International Dairy Journal, 1994. 4(4): p. 347-368.
57. Van Asselt, A.J., G. Van Houwelingen, and M.C. Te Giffel, Monitoring System for Improving
Cleaning Efficiency of Cleaning-in-Place Processes in Dairy Environments. Food and
Bioproducts Processing, 2002. 80(4): p. 276-280.
58. Semwogerere, D. and E.R. Weeks, Confocal Microscopy, in Encyclopedia of Biomaterials and
Biomedical Engineering2005, Taylor & Francis.
59. Hinton, A.R., Thermophiles and Fouling Deposits in Milk Powder Plants, in Food and
Engineering Technology2003, Massey University: Palmerston North.
60. Pawley, J.B., Handbook of Biological Confocal Microscopy, ed. J.B. Pawley2006: Springer.
61. DeLeo, P.C., P. Baveye, and W.C. Ghiorse, Use of confocal laser scanning microscopy on soil
thin-sections for improved characterization of microbial growth in unconsolidated soils and
aquifer materials. Journal of Microbiological Methods, 1997. 30(3): p. 193-203.
62. Mittelman, M.W., Structure and Functional Characteristics of Bacterial Biofilms in Fluid
Processing Operations. Journal of dairy science, 1998. 81(10): p. 2760-2764.
63. Sahoo, P.K., et al., Fluid dynamic gauging studies of swelling behaviour of whey protein gels
in NaOH/NaCl solutions. International Journal of Food Science & Technology, 2008. 43(10):
p. 1901-1907.
64. Hedin, J., Characteristics of cellulose derivatives at surfaces - a QCM-D study, 2007,
Chalmers University of Technology.
65. Tompkins, H.G. and W.A. McGahan, Spectroscopic Ellipsometry and Reflectometry. A User's
Guide1999: John Wiley & Sons, Inc.
66. Karlsson, C.A.-C., M. Wahlgren, and C. Trägårdh, The removal of [beta]-lactoglobulin from
stainless steel surfaces at high and low temperature as influenced by the type and
concentration of cleaning agent. Journal of Food Process Engineering, 1998. 21: p. 485-501.
67. Santos, O., et al., Effect of surface and bulk solution properties on the adsorption of whey
protein onto steel surfaces at high temperature. Journal of Food Engineering, 2006. 73(2): p.
174-189.
68. Santos, O., Whey protein adsorption and aggregation on modified stainless steel surfaces
inrelation to fouling, in Food Technology, Engineering and Nutrition2004, Lund Institute of
Technology, Lund University.
69. Rosmaninho, R. and L. Melo, Protein–calcium phosphate interactions in fouling of modified
stainless-steel surfaces by simulated milk. International Dairy Journal, 2008. 18(1): p. 72-80.
70. Saikhwan, P., et al., Swelling and dissolution in cleaning of whey protein gels. Food and
Bioproducts Processing, 2010. 88(4): p. 375-383.
71. Mercadé-Prieto, R. and X.D. Chen, Dissolution of Whey Protein Concentrate Gels in Alkali.
Bioengineering, Food and Natural Products, 2006. 52: p. 792-803.
72. Mercadé-Prieto, R., et al., Swelling and Dissolution of â-Lactoglobulin Gels in Alkali.
Biomacromolecules, 2007. 8: p. 469-476.
73. Mercadé-Prieto, R., et al., Effect of Gel Structure on the Dissolution of Heat-Induced β-
Lactoglobulin Gels in Alkali. Journal of Agricultural and Food Chemistry, 2006. 54(15): p.
5437-5444.
74. Mercadé-Prieto, R., W.R. Paterson, and D.I. Wilson, Effect of salts on the alkaline
degradation of β-lactoglobulin gels and aggregates: Existence of a dissolution threshold.
Food Hydrocolloids, 2009. 23(6): p. 1587-1595.
75. Mercadé-Prieto, R., et al., Polyelectrolyte screening effects on the dissolution of whey protein
gels at high pH conditions. Food Hydrocolloids, 2007. 21(8): p. 1275-1284.
76. Mercadé-Prieto, R., D.I. Wilson, and W.R. Paterson, Effect of the NaOH Concentration and
Temperature on the Dissolution Mechanisms of ß-Lactoglobulin Gels in Alkali. International
Journal of Food Engineering, 2008. 4(5): p. Article 9.
77. Fickak, A., A. Al-Raisi, and X.D. Chen, Effect of whey protein concentration on the fouling
and cleaning of a heat transfer surface. Journal of Food Engineering, 2011. 104(3): p. 323-
331.
78. Hooper, R.J., et al., Comparative Studies of Fluid Dynamic Gauging and a Micromanipulation
Probe for Strength Measurements. Food and Bioproducts Processing, 2006. 84(4): p. 353-358.
79. Hooper, R.J., W.R. Paterson, and D.I. Wilson, Comparison of Whey Protein Model Foulants
for Studying Cleaning of Milk Fouling Deposits. Food and Bioproducts Processing, 2006.
84(4): p. 329-337.
80. Liu, W., et al., Direct measurement of the force required to disrupt and remove fouling
deposits of whey protein concentrate. International Dairy Journal, 2006. 16(2): p. 164-172.
81. Liu, W., et al., Identification of cohesive and adhesive effects in the cleaning of food fouling
deposits. Innovative Food Science and Emerging Technologies, 2006. 7(4): p. 263-269.
82. Simmons, M.J.H., P. Jayaraman, and P.J. Fryer, The effect of temperature and shear rate upon
the aggregation of whey protein and its implications for milk fouling. Journal of Food
Engineering, 2007. 79: p. 517-528.
83. Xin, H., X.D. Chen, and N. Özkan, Whey Protein-Based Gel as a Model Material for Studying
Initial Cleaning Mechanisms of Milk Fouling. Journal of Food Science, 2002. 67(7): p. 2702-
2711.
84. Xin, H., X.D. Chen, and N. Özkan, Removal of a model protein foulant from metal surfaces.
AIChE Journal, 2004. 50(8): p. 1961-1973.
85. Monahan, F.J., J.B. German, and J.E. Kinsella, Effect of pH and Temperature on Protein
Unfolding and Thiol/Disulfide Interchange Reactions during Heat-Induced Gelation of Whey
Proteins. Journal of Agricultural and Food Chemistry, 1995. 43: p. 46-52.
86. Schmitt, C., et al., Internal structure and colloidal behaviour of covalent whey protein
microgels obtained by heat treatment. Soft Matter, 2010. 6(19): p. 4876-4884.
87. Kroslak, M., J. Sefcik, and M. Morbidelli, Effects of Temperature, pH, and Salt Concentration
on β-Lactoglobulin Deposition Kinetics Studied by Optical Waveguide Lightmode
Spectroscopy. Biomacromolecules, 2007. 8(3): p. 963-970.
88. Morison, K. and S. Tie, The Development and Investigation of a Model Milk Mineral Fouling
Solution. Food and Bioproducts Processing, 2002. 80(4): p. 326-331.
89. Rosmaninho, R. and L. Melo, Effect of proteins on calcium phosphate deposition in turbulent
flow as a function of surface properties. Experimental Thermal and Fluid Science, 2007. 32: p.
375-386.
90. Rosmaninho, R. and L. Melo, Calcium phosphate deposition from simulated milk ultrafiltrate
on different stainless steel-based surfaces. International Dairy Journal, 2006. 16(1): p. 81-87.
91. Grant, C.S., G.E. Webb, and Y.W. Jeon, A Noninvasive study of milk cleaning processes:
calcium phosphate removal. Journal of Food Process Engineering, 1997. 20(3): p. 197-230.
92. Dürr, H. and A. Graßhoff, Milk Heat Exchanger Cleaning: Modelling of Deposit Removal.
Food and Bioproducts Processing, 1999. 77(2): p. 114-118.
93. Hinton, A.R., et al., Thermophile Survival in Milk Fouling and on Stainless Steel During
Cleaning. Food and Bioproducts Processing, 2002. 80(4): p. 299-304.
94. Lang, M.P., et al., Multicomponent Cleaning Verification of Stainless Steel Surfaces for the
Removal of Dairy Residues Using Infrared Microspectroscopy. Journal of Food Science,
2011. 76(2): p. C303-C308.
95. Wallhäußer, E., et al., On the usage of acoustic properties combined with an artificial neural
network – A new approach of determining presence of dairy fouling. Journal of Food
Engineering, 2011. 103(4): p. 449-456.
96. Gallot-Lavallee, T., M. Lalande, and G. Corrieu, Cleaning kinetics modeling of holding tubes
fouled during milk pasteurization. Journal of Food Process Engineering, 1984. 7(2): p. 123-
142.
97. Bremer, P.J., S. Fillery, and A.J. McQuillan, Laboratory scale Clean-In-Place (CIP) studies
on the effectiveness of different caustic and acid wash steps on the removal of dairy biofilms.
International journal of food microbiology, 2006. 106(3): p. 254-62.
98. Remius, U., Arla Foods, 2012.
99. Petersson, P., Ecolab, 2012.
100. Jensen, J., Arla Foods, 2012.
101. Plett, E., Cleaning of fouled surfaces, in Fouling & Cleaning in Food Processing1985:
University of Wisconsin-Madison. p. 286-311.
102. EcolabAB. P3 Mip SP. 2010 2012-06-05]; Available from:
http://productcatalogue.ecolab.se/UserFiles/VarePDF/156_2_1.pdf.
103. EcolabAB. P3 Mip HP. 2010 2012-06-05]; Available from:
http://productcatalogue.ecolab.se/UserFiles/VarePDF/175_2_1.pdf.
104. Galani, D. and R.K. Owusu Apenten, Heat-induced denaturation and aggregation of β-
lactoglobulin: Kinetics of formation of hydrophobic and disulphide-linked aggregates.
International Journal of Food Science and Technology, 1999. 34(5-6): p. 467-476.
105. Gallot-Lavallee, T. and M. Lalande, A mechanistic approach of pasteurized milk deposit
cleaning, in Fouling & Cleaning in Food Processing, D. Lund, E. Plett, and C. Sandu, Editors.
1985: University of Wisconsin-Madison. p. 374-394.
106. Gillham, C.R., et al., Cleaning-in-Place of Whey Protein Fouling Deposits: Mechanisms
Controlling Cleaning. Food and Bioproducts Processing, 1999. 77(2): p. 127-136.
107. Alvarez, N., G. Gesanguiziou, and G. Daufin, The role of surface tension of re-used caustic
soda on the cleaning efficiency in dairy plants. International Dairy Journal, 2007. 17(4): p.
403-411.
108. Tuladhar, T., W. Paterson, and D. Wilson, Investigation of Alkaline Cleaning-in-Place of
Whey Protein Deposits Using Dynamic Gauging. Food and Bioproducts Processing, 2002.
80(3): p. 199-214.
109. Bénézech, T., et al., A new test method for in-place cleanability of food processing equipment.
Journal of Food Engineering, 2002. 54(1): p. 7-15.
110. Branschriktlinjer för hygienisk produktion av mjölkprodukter, 2010, Svensk Mjölk.
111. Leclercq-Perlat, M.N., J.P. Tissier, and T. Benezech, Cleanability of stainless steel in relation
to chemical modifications due to industrial cleaning procedures used in the dairy industry.
Journal of Food Engineering, 1994. 23(4): p. 449-465.
112. Hagman, J., Structure DYnamics and Heterogeneity in Soft Material by FRAP, in Chemical
and Biological Engineering2012, Chalmers University of Technology: Gothenburg.
113. Tuladhar, T.R., W.R. Paterson, and D.I. Wilson, Thermal Conductivity of Whey Protein Films
Undergoing Swelling: Measurement by Dynamic Gauging. Food and Bioproducts Processing,
2002. 80(4): p. 332-339.
114. Tuladhar, T.R., W.R. Paterson, and D.I. Wilson, Dynamic Gauging in Duct Flows. The
Canadian Journal of Chemical Engineering, 2003. 81(2): p. 279-284.
115. Wilson, D.I., Challenges in Cleaning: Recent Developments and Future Prospects. Heat
Transfer Engineering, 2005. 26(1): p. 51-59.
116. Ali, A., et al., A fluid dynamic gauging device for measuring fouling deposit thickness in
opaque liquids at elevated temperature and pressure. Experimental Thermal and Fluid
Science, 2013. 48(0): p. 19-28.
117. Lohr, K.R. and J.L. Rose, Ultrasonic guided wave and acoustic impact methods for pipe
fouling detection. Journal of Food Engineering, 2003. 56(4): p. 315-324.
118. Li, J., D.K. Hallbauer, and R.D. Sanderson, Direct monitoring of membrane fouling and
cleaning during ultrafiltration using a non-invasive ultrasonic technique. Journal of
Membrane Science, 2003. 215(1-2): p. 33-52.

119. Li, J., et al., Measurement and modelling of organic fouling deposition in ultrafiltration by
ultrasonic transfer signals and reflections. Desalination, 2002. 146(1-3): p. 177-185.
120. Withers, P., Ultrasonic sensor for the detection of fouling in UHT processing plants. Food
Control, 1994. 5(2): p. 67-72.
121. Withers, P.M., Ultrasonic, acoustic and optical techniques for the non-invasive detection of
fouling in food processing equipment. Trends in Food Science & Technology, 1996. 7(9): p.
293-298.