Embed Size (px)
Citation preview

2018Report on the first nine months

2
Group sales increase of 23% to 786 million. Nearly half of the
increase driven by strong organic growth in the market segments
Mobility, Chemicals, Industrial Applications and Digitization
Group recurring EBIT increased by approx. 80% from 33 million in
9M/2017 to 59 million in 9M/2018 (including IFRS 15 effects of
15 million)
9M/2018 continues to be impacted by high positive effects
particularly relating to the initial adoption of IFRS 15 as well as the
full consolidation of the former JVs with BMW Group and Benteler
Successful placement of 159 million convertible bond in September
2018 extends maturity profile until 2023
Slight increase in guidance for 2018: Improvement in Business Unit
GMS more than compensates for weaker development in Business
Unit CFM and leads to slightly higher expectations for Group
recurring EBIT including additional IFRS 15 impacts
Group sales to now increase by 15% (previously: more than 10%) and
thereby to reach the 1 billion sales revenue mark for the first time
as the “new” SGL Carbon
Guidance for net income increased to a mid double digit million
amount and thus at upper end of previous guidance range (low to
mid double digit)
Summary

3SGL Carbon 9M 2018
Nine months
million 2018 2017 Change
Sales revenue
EBITDA before non-recurring items
Operating profit (EBIT) before non-recurring items (recurring EBIT)
Return on sales (EBIT-margin) 1) -
Return on capital employed (ROCE EBIT) 2) -
Operating profit
Result from discontinued operations, net of income taxes – >–
Consolidated net result (attributable to shareholders of the parent company)
million 30. Sep. 18 31. Dec. 17 Change
Total assets
Equity attributable to the shareholders of the parent company
Net financial debt 3)
Gearing 4) -
Equity ratio 5) -
1) Ratio of EBIT before non-recurring items to sales revenue 2) EBIT before non-recurring items for the last twelve months to average capital employed - continuing operations (total of goodwill, other intangible assets, property,
plant and equipment, investments accounted for At-Equity and working capital) 3) Financial liabilities (nominal amounts) less liquidity 4) Net financial debt divided by equity attributable to the shareholders of the parent company 5) Equity attributable to the shareholders of the parent company divided by total assets
Table of contents
News from the businesses ................................................ 4Interim Group Management Report ................................... 6Economic environment ........................................................ 6Key events of the business development .............................. 6Business development ........................................................ 7Opportunities and Risks ......................................................13Outlook ..............................................................................14
Condensed Consolidated Interim Financial Statements ..... 18Consolidated Income Statement ........................................ 18Consolidated Statement of Comprehensive Income ............. 19Consolidated Balance Sheet .............................................. 20Consolidated Cash Flow Statement .................................... 22Condensed Consolidated Statement of Changes in Equity .... 24
Notes to the Condensed Consolidated Interim Financial Statements....................................................................... 25
Responsibility statement ............................................... 34Other information .......................................................... 35Financial Calender 2019 ..................................................... 37Investor Relations Contact ................................................. 38
Financial highlights

4
Reporting segment Composites – Fibers & Materials (CFM)
February 2018 SGL Carbon and Fraunhofer IGCV founded a joint Fiber Placement Center headquartered at the SGL Carbon site in Meitingen (Germany) for increased use in more high-volume applications across industries and for improving cost-effectiveness and resource efficiency. Fiber placement is considered a particularly advanced method with its automated, load-path optimized, and material efficient laying and cutting of fibers. As part of the material mix of the future, fiber-reinforced plastics are gaining in importance, especially in the automotive and aerospace industries.
With its “Advanced Modulus” 50k carbon fiber, SGL Carbon has developed and started serial production of a high-performance and efficient carbon fiber for the aerospace industry, thus expanding its material portfolio. Due to its high stiffness and strength, the new fiber meets the special mechanical require-ments for aerospace as well as various industrial applications. The high Young’s modulus based on a 50k fiber (50,000 indi-vidual filaments) is unique to the market.
March 2018 At the JEC World in Paris, the worldwide largest composites trade fair, SGL Carbon presented a prototype of the “Carbon Carrier,” which is ready for large-scale production for new automotive body concepts. The above-mentioned “advanced modulus” 50k carbon fiber was also introduced and generated great interest. Additionally, SGL Carbon together with other partners received the JEC Innovation Award for the “MAI Sandwich” project for the development of innovative sandwich structures for aerospace and automotive components.
At the Austrian SGL Composite sites, we are currently manufacturing the trunk lid module for the Porsche GT3 which we developed together with Porsche. We are also serially producing, among others, the leaf springs for Volvo – with a targeted volume of 550,000 per annum.
August 2018 SGL Carbon receives an order from a large American aerospace customer for the refurbishment of their thrust reverser cowling blankets for a complete model series. The order comprises 350 blankets made of SGL Carbon’s high-performance insulation blankets and will be completed by November 2018.
September 2018 The Fiber Placement Center is officially opened with 150 guests from politics, industry and science. With various high-tech systems and a space of over 500 m², the FPC offers customers the opportunity to develop new production concepts and demonstrate them in prototype production. In addition, SGL Carbon can begin with high-volume production of fiber-reinforced components. The center’s work is closely linked with SGL Carbon’s Lightweight and Application Center (LAC), a facility measuring another approximately 1,500 m2, which is also located at the Meitingen site. Here the company collabo-rates with its customers to continually develop innovative lightweight structures, processes and prototypes.
Reporting segment Graphite Materials & Systems (GMS)
January 2018 SGL Carbon receives a major order from our customer Rheinmetall Automotive – Pierburg where we will supply the centerpiece, rotors and vanes, for generating a vacuum in the EVP 40 brake booster. The annual order volume is in the low double-digit million Euro range. Due to this project and a general increase in demand from the automotive industry, SGL Carbon is investing approximately 25 million over four years in expanding its production capacities at the Bonn site. The capacity expansion set to be complete by 2020.
February 2018 We informed about an order which we received at the end of last year for a hydrochloric acid (HCl) recovery system from a leading Chinese producer of isocyanate. The system was developed by SGL Carbon for the specific requirements of the customer and will significantly support an economic and environmental friendly production process in the MDI/TDI production (precursors for polyurethane production).
March 2018 Strong global growth in the semiconductor and LED industry is driving worldwide demand for susceptors and wafer carriers. The expansion of a new, state-of-the-art SiC coating production line which began last year in St. Mary’s, Pennsylvania (USA), has already been completed. Due to the further increasing global demand, we have decided on a second expansion stage, not only to increase the production volumes but also to ensure highest quality standards. A total of approximately 25 million will be invested over a period of three years for this expansion.
News from the businesses

5SGL Carbon 9M 2018
June 2018 At the trade fair ACHEMA, the world’s leading trade fair for the chemical industry, process technology, and biotechnology in Frankfurt am Main (Germany), SGL Carbon presented, among others, its newly developed silicon carbide (SiC) tube sheet for heat exchangers as one example for our solution competence. Together with technology group GEA, SGL Carbon has devel-oped a new steam jet vacuum pump made of DIABON® graphite, which was also shown at the fair. Compared with pumps made of porcelain, the main material used to date, the new vacuum pumps feature many advantages, such as energy savings of up to 30 percent, a greater degree of design freedom and faster delivery times.
We also demonstrated carbon 3D printing at the ACHEMA. After the market launch of CARBOPRINT®, which stands for printed carbon and graphite components, SGL Carbon has now expanded its 3D printing expertise to silicon carbide under the brand name SICAPRINT. Silicon carbide (SiC) features extremely high hardness, stiffness and strength, as well as high thermal conductivity.
July 2018 SGL Carbon introduces full size bipolar plates (BPP) made of a graphite/fluoropolymer composite material which we devel-oped and successfully tested in-house. In terms of good elec-trical conductivity, high chemical resistance, and light weight, the performance of the new large size plates is in line with their smaller size versions at the same thickness. These new larger size SIGRACELL BPP enable many different applications in various industries including flow battery, wastewater treat-ment system manufacturing, and other electrochemical appli-cations. Furthermore, they enable construction of larger electro-chemical cells and increase product efficiency.
We have substantially increased our capacities for the produc-tion of synthetic graphite anode materials for lithium-ion bat-teries. The current expansion phase is due to be completed until 2019. In addition to upgrading and optimizing the effi-ciency of existing plants, we are also investing in a battery application laboratory. The capex budget for the sites in Morganton (USA), Raciborz and Nowy Sacz (both Poland) and Meitingen (Germany) amounts to a low double digit million Euro amount in total.
Reporting segment Corporate
February 2018 Together with ExOne, a leading provider of 3D printing tech-nology, we present our project in the area of 3D printing with carbon components. 3D printing describes the building of individual layers of material into three-dimensional parts based on a digital file, without tooling or machining. SGL Carbon is bringing carbon and graphite components created using 3D printing technology provided by ExOne to the market under the brand name CARBOPRINT®.
April 2018 We are extending our long-standing collaboration for fuel cell components with HYUNDAI MOTOR GROUP. SGL Carbon will deliver gas diffusion layers for the fuel cell car NEXO. To continue playing a key role in the research and development of fuel cells, SGL Carbon is also an active development partner in the EU-funded “INSPIRE” project.
October 2018 For the first time in ten years SGL Carbon hosted a Capital Markets Day for analysts and investors with focus on market trends and material solutions. Approximately 35 participants from London, Frankfurt and other financial centers travelled to the all-day event in Meitingen (Germany).
Following an update on the strategic realignment by Jürgen Köhler, the two Business Unit Heads Andreas Wüllner and Burkhard Straube took the participants on a journey through the markets of SGL Carbon in almost two-hour sessions each, explaining the market drivers and technology trends as well as the details of our material solutions. Customers also gave testimonial in quotations and video messages. A real highlight was offered between the two sessions: an extensive tour of the LAC as well as a unique exhibition of carbon and graphite applications in a vacated factory hall. In his final presentation, Michael Majerus gave an overview of the measures taken by SGL Carbon to secure long term profitable growth, such as improved marketing activities with focus on higher margin “megatrend” markets, or the new investment processes aligned to strategic objectives and key financial figures.
You will find all presentations from the Capital Markets Day on our website www.sglcarbon.de/investor-relations/presentations.

6
Economic environment
In October, the international monetary fund revised downwards its forecast for global economic growth by 0.2%-points both for this and for next year due to unexpected weak activity in some industrialized nations at the beginning of the year 2018, adverse effects from the implemented and resolved trade barriers, weaker outlook for some developing countries, higher interest rates, geopolitical tensions, and higher prices for oil imports. In total, risks for the global growth outlook have increased also in the context of worldwide political uncer-tainties, while the potential for positive surprises declined.
According to the IMF, global gross domestic product (GDP) will increase by 3.7% in 2018 and 2019 and thus 0.2%-points below the July forecast. For the USA, the IMF kept its growth assumptions unchanged for 2018 at 2.9% and reduced it for 2019 to 2.5 (2.7)%. A reduced growth rate of 2.0 (2.2)% is forecasted for the Eurozone for 2018 and a constant one of 1.9 (1.9)% for 2019, for Germany 1.9 (2.2) and 1.9 (2.1)%.
Despite slightly reduced growth perspectives and the in-creased global economic risks, the statements made in our annual report 2017 remain essentially valid.
Key events of the business development
New convertible bond issued
On September 20, 2018, SGL Carbon SE issued a convertible bond with a principal amount of 159.3 million. The bond has a term of five years and matures in September 2023. The convertible bond is based on a volume of 12.2 million shares and carries a coupon of 3.0% p. a. The initial conversion price is 13.022, which corresponds to a premium of 30% above the volume weighted average price of the SGL Carbon SE share during the placement. The convertible bond is unsubordinated and unsecured and can be converted to shares. Upon issuance of the bond, the fair value of the conversion rights in the amount of 13.7 million was transferred to capital reserves and concurrently deducted from the bond liability.
Changes in scope of consolidation
After the acquisition of the former joint venture Benteler-SGL in December 2017, the acquisition of the remaining 49% shares in SGL Automotive Carbon Fibers GmbH & Co. KG (SGL ACF) in Wackersdorf (Germany) was concluded in January 2018. SGL Carbon is now the sole owner of the former joint operation, whose legal entity name is SGL Composites GmbH & Co. KG after its entry in the company's register. As reported, in the next step, the US legal entity will be transferred to SGL Carbon by the end of 2020 at the latest; in this context, SGL Carbon already exercises full control so that the US company is fully consolidated since January 11, 2018.
The transition to full consolidation required an adjustment to the fair value of the net assets of the previously proportionally consolidated joint operation with the BMW Group. This resulted in a positive non-cash impact of 28.4 million on EBIT after nonrecurring items in the first nine months 2018. On the other hand, the preliminary purchase price allocation (PPA) results in an increase in depreciation and amortization expense of around 10 million per year until 2021. In the first nine months 2018, the additional depreciation/amortization resulting from the PPA on identified assets and liabilities of the acquired companies in the US, Austria and Germany amount to minus
8.7 million. The sale of the 51% shareholding in SGL Kümpers GmbH & Co KG, Rheine (Germany) was completed on January 10, 2018. The related disposal of the assets of SGL Kümpers did not result in any effect on profit or loss in fiscal 2018, as this was already recognized in fiscal year 2017.
New IFRS accounting regulation
The first-time adoption of IFRS 15 resulted in an increase in sales revenue of 27.1 million and an increase in recurring EBIT of 15.3 million in the first nine months year 2018, mainly related to the reporting segment GMS. For details on this and the impacts on the opening balance resulting from the transition please refer to the segment reporting and the notes.
Interim Group Management Report (unaudited)

7SGL Carbon 9M 2018
Business development
Segment Reporting
Reporting segment Composites – Fibers & Materials (CFM)
Nine months
million 2018 2017 Change
Sales revenue
EBITDA before non-recurring items 1)
EBIT before non-recurring items (recurring EBIT) 1)
Return on sales (EBIT-margin) 1) -
Return on capital employed (ROCE EBIT)2) % -
Operating profit (EBIT)
1) Non-recurring items of 18.1 million and minus 6.0 million in the first nine months 2018 and 2017, respectively
2) EBIT before non-recurring items for the last twelve months to average capital employed (total of goodwill, other intangible assets, property, plant and equipment, investments accounted for At-Equity and working capital)
In total, sales in the first nine months 2018 increased by 28% (currency adjusted by 30%) to 323.9 million compared to the prior year period (9M/2017: 253.9 million) primarily due to structural effects resulting from the initial consolidation of the former At-Equity accounted joint venture Benteler SGL as well as the complete acquisition of the former partially consolidat-ed SGL ACF, which more than compensated for the sale of the former fully consolidated joint venture SGL Kümpers. Operation-ally, sales growth was mainly driven by the market segments Aerospace and Automotive. In the market segment Textile Fibers, sales remained on the prior year level, while sales with the wind energy industry decreased substantially due to the sale of our participation in SGL Kümpers, as well as the declining sales of carbon fibers to the wind energy industry. As anticipated, sales in the reporting segment CFM in the third quarter 2018 was below the level of the first two quarters, especially following the phase out of two particular projects at the half year stage.
Following the complete acquisition of Benteler SGL at the end of 2017, Ceramic Brake Discs (Brembo SGL: development and production of carbon ceramic brake discs) remains as the only major investment accounted for At-Equity and is allocated to the market segment Automotive. Sales of all investments accounted for At-Equity increased by 13% in the first nine months 2018 to 181.6 million (9M/2017: 161.1 million, 100% values for companies) and is not included in our Group sales
revenue. Compared to the first half 2018, sales growth of the At-Equity accounted investments in the third quarter 2018 slightly slowed down due to seasonal factors.
Recurring EBIT in the first nine months 2018 increased by 22% to 20.9 million compared to the prior year period ( 17.2 million) and lead to an EBIT margin of 6.5% (9M/2017: 6.8%). The highest earnings growth was recorded in the market segment Auto-motive, particularly due to the full consolidation of SGL Composites (former SGL ACF). Earnings were almost stable on the prior year level in the market segments Aerospace and Textile Fibers, while Wind Energy and Industrial Applications recorded a substantial decrease in earnings. In line with the sales development, recurring EBIT in the reporting segment CFM in the third quarter 2018 was also below the level of the two prior quarters due to the lower capacity utilization.
After consideration of non-recurring items amounting to 18.1 million, EBIT in the first nine months 2018 increased to 39.0 million (9M/2017: 11.2 million). These non-recurring
items include a positive effect from the full consolidation of the former joint venture with BMW Group (SGL ACF) resulting from the adjustment to the fair value of the proportionate share-holding as of the date of acquisition of 28.4 million. Restruc-turing expenses at Textile Fibers amounting to 1.6 million and increased depreciation in the amount of 8.8 million from the preliminary purchase price allocation (PPA) had an opposite effect on non-recurring items. The release of a provision at SGL Composites (Austria) led to a positive effect in the amount of
3.2 million. In addition, the expert report on the purchase price allocation relating to the acquisition of the remaining shares in SGL ACF in September 2018 led to a negative effect from the subsequent valuation of inventories at market values as of the date of acquisition in January 2018 in the amount of
3.1 million.

8
Reporting segment Graphite Materials & Systems (GMS)
Nine months
million 2018 2017 Change
Sales revenue
EBITDA before non-recurring items 1)
EBIT before non-recurring items (recurring EBIT) 1)
Return on sales (EBIT-margin) -
Return on capital employed (ROCE EBIT)2) -
Operating profit (EBIT)
1) Non-recurring items of 0,6 million and 1.0 million in the first nine months 2018 and 2017, respectively
2) EBIT before non-recurring items for the last twelve months to average capital employed (total of goodwill, other intangible assets, property, plant and equipment, investments accounted for At-Equity and working capital)
Sales in the reporting segment Graphite Materials & Systems in the third quarter 2018 remained on the level of the prior quarter and thus slight above our expectations, as particularly the market segments LED and Semiconductors were able to com-pensate for the seasonal weakness in Industrial Applications. Recurring EBIT in the third quarter 2018 was below the level of the strong second quarter due only to higher bonus provisions resulting from the substantially better business development compared to the budget.
In the first nine months 2018, sales in the market segments Battery & other Energy, LED, Semiconductors, Automotive & Transport as well as Chemicals posted double digit growth rates. Business with the Industrial Applications segment remained slightly above the prior year level. We limited our sales with the market segment Solar to below the prior year level, as we increased our deliveries to customers from the LED and Semiconductor segments, who also posted a high demand for solutions based on isostatic graphite. In total, sales increased substantially by 15% (currency adjusted by 17%) to
436.8 million (9M/2017: 381.5 million) in the reporting period. The initial adoption of IFRS 15 increased sales by approximately
24 million. Adjusted for this and the currency effect, sales in GMS grew by approximately 11%.
In total, recurring EBIT in the reporting period increased sub-stantially more than proportionately by 59% to 59.5 million (9M/2017: 37.5 million), leading to a significant improvement in the EBIT margin to 13.6% (9M/2017: 9.8%) mainly due to im-provements in nearly all market segments. Based on increased
raw material costs, we had initiated negotiations with our customers already at the beginning of the year and have partially already implemented price increases. Particularly in the market segment Battery & other Energy we were thus able to stabilize earnings on the prior year level. Included in recurring EBIT is an impact from the initial adoption of IFRS 15 in the amount of 14.7 million, which relates mainly to the price increases described above. Adjusted for this effect, recurring EBIT increased by 19%.
Non-recurring items of 0.6 million were recorded in the period under review in the reporting segment GMS (9M/2017: 1.0 Mio.
). Accordingly, EBIT after non-recurring items increased to 60.1 million (9M/2017: 38.5 million).
Reporting segment Corporate
Nine months
million 2018 2017 Change
Sales revenue
EBITDA before non-recurring items 1) – –
EBIT before non-recurring items (recurring EBIT) 1) – –
thereof Central Innovation – –
Operating profit/loss (EBIT) – –
1) Non-recurring items of 1.8 million in the first nine months 2018
Sales revenue in the reporting segment Corporate increased strongly once again in the third quarter 2018 compared to the prior year quarter relating mainly to the sale of the former business unit Performance Products (PP), as services provided to PP are recorded as external sales now that PP has been sold.
Recurring EBIT at minus 21.2 million remained on a similar level as in the prior year period (9M/2017: minus 21.7 million) in the reporting segment Corporate and includes a positive effect of 3.9 million from a land sale in Canada, which more than compensated for the implementation costs for the Operations Management System (OMS) and the termination of cost alloca-tions to the now sold PP. Expenses of our central research and development activities at 6.1 million were approximately at the prior year level.
The Board of Management together with the heads of the business units have decided to develop and implement the so-called “SGL Operations Management System“ (SGL OMS), a uniform and standardized management system for production across the sites and businesses. The goal is to create lean

9SGL Carbon 9M 2018
processes, high efficiency, and the best product quality. By 2020, all sites should be managed by uniform standards and key performance indicators. In doing so, we will also rely on best practice procedures. In addition, many of the methods and tools from SGL Excellence and Six Sigma will be integrated into the OMS.
Non-recurring items of 1.8 million relating mainly to asset sales were recorded in the period under review in the reporting segment Corporate (9M/2017: no non-recurring items).
Group business development
Condensed Consolidated Income Statement
Nine months
million 2018 2017 Change
Sales revenue
Cost of sales – – –
Gross profit
Selling, administrative and R&D expenses – – –
Other operating income/expenses –
Result from investments accounted for At-Equity
Operating profit (EBIT) before non-recurring items (recurring EBIT)Non-recurring items –
Operating profit (EBIT)EBITDA before non-recurring items
Sales revenue rose significantly by 23% (currency adjusted by 25%) to 786.3 million (9M/2017: 642.1 million). Slightly more than half of the sales growth related to the changes in the scope of consolidation and the initial adoption of IFRS 15. The gross margin improved to 21.7% in the reporting period (9M/2017: 20.5%) due to higher capacity utilization and the resulting increased fixed cost absorption. Accordingly, gross profit rose significantly to 170.9 million in the reporting period from
131.8 million in the prior year period. Selling, administrative, and R&D expenses increased by 10.5% to 137.4 million (9M/2017: 124.4 million), at a slower rate than sales revenue.
Recurring EBIT increased by 79% to 59.2 million in the reporting period after 33.0 million in the prior year period, due to improved earnings in the business unit GMS (including an impact of 14.7 million from the initial adoption of IFRS 15) and
an income of 3.9 million from a land sale in the reporting segment Corporate.
Non-recurring items of 20.5 million include an adjustment to the fair value of the net assets of the previously proportionally consolidated joint operation with the BMW Group amounting to
28.4 million at the date of acquisition as well as, with an opposite impact, the additional amortization of identified assets and liabilities resulting from purchase price allocation (PPA). Non-recurring items from the amortization of the PPA of the acquired SGL Composites companies in the US, Austria and Germany amounted to minus 8.7 million in total. In addition, income from restructuring totaling 0.8 million was reported as non-recurring items, comprising income from the sale of non-current assets in Italy and Germany of 3.3 million as well as restructuring expenses of 1.6 million in Portugal and
0.9 million in Germany. Accordingly, EBIT after non-recurring items amounted to 79.7 million (9M/2017: 28.0 million).
Net financing result
Nine months
million 2018 2017 Change
Interest income
Interest expense – –
Imputed interest convertible bonds (non-cash) – –
Imputed interest finance lease (non-cash) – – -
Interest expense on pensions – –
Interest expense, net – –
Amortization of refinancing costs (non-cash) – –
Foreign currency valuation of Group loans (non-cash) – >–
Other financial expense – – –
Other financing result – –
Net financing result – –
After the repayment of the corporate bond (interest rate of 4.875%) in October 2017 and the convertible bond 2012/2018 (interest rate of 2.75%) in January 2018, interest expense related particularly to the interest on the convertible bond 2015/2020 (interest rate of 3.5%) and the financial debt of SGL Composites due to BMW Group. The non-cash imputed interest on the convertible bond is recognized in order to adjust the coupon on the convertible bond to comparable interest rates at the time of its issuance. In the prior year period, the

10
accelerated amortization of refinancing costs resulted from the estimated early repayment of the corporate bond, which was redeemed ahead of schedule at the end of October 2017, compared to its original maturity in January 2021.
Due to the repayment of the corporate bond and the convertible bond 2012/2018, net financing result was improved from 38.6 million in the prior year period to 21.3 million in the reporting period.
The issue of the new convertible bond 2018/2023 on September 20, 2018 in the amount of 159.3 million and an interest rate of 3% had no material impact on the financial result in the reporting period due to its proximity to the reporting date.
Condensed Consolidated Income Statement (continued)
Nine months
million 2018 2017 Change
Operating profit (EBIT)Net financing result – –
Result from continuing operations before income taxes –
Income tax expense – –
Result from continuing operations –Result from discontinued operations, net of income taxes – >–
Net result for the period
Attributable to:
Non-controlling interests –
Consolidated net result (attributable to shareholders of the parent company)
Earnings per share - basic and diluted (in )
Earnings per share continuing operations, basic and diluted (in ) –
Earnings per share - discontinued operations, diluted (in ) – >–
Result from continuing operations
Due to the developments described above, the result from continuing operations before income taxes improved from minus 10.6 million in the prior year period to 58.4 million in the reporting period. Income tax expense of 6.4 million (prior year period: 6.8 million) was influenced by deferred tax
expenses related to temporary differences from IFRS 15 effects as well as the usage of tax loss carryforwards.
Result from discontinued operations after taxes and net result for the period
The result from discontinued operations includes mainly income and expenses incurred by the business unit Performance Products (PP). The sale of the PP activities was closed in 2017. The expense in the reporting period was impacted by additional tax provisions related to the sale of PP.
Consolidated net result of the period amounted to 47.7 million compared to 5.3 million in the prior year period (after deduction of non-controlling interests of 0.3 million in the reporting period and 2.8 million in the nine months 2017).
Balance sheet structure
ASSETS m 30. Sep. 18 31. Dec. 17 Change
Non-current assets
Current assets –
Assets held for sale –
Total assets
EQUITY AND LIABILITIES m
Equity attributable to the shareholders of the parent company
Non-controlling interests –
Total equity
Non-current liabilities
Current liabilities –
Liabilities in connection with assets held for sale -
Total equity and liabilities
Total assets as of September 30, 2018, increased by 78.3 million or 5.1% to 1,620.0 million compared to December
31, 2017. Non-current assets increased due to the full consolidation of the two SGL Composites companies in Germany and in the US (former SGL ACF) by a total of
187.5 million. The decrease in current assets is particularly attributable to the decrease in liquidity of 131.9 million, as the issue of the 159.3 million convertible bond in September 2018 was more than consumed by the repayment of the
239.2 million convertible bond in January 2018 and the
11SGL Carbon 9M 2018
67.5 million debt of SGL Composites. On the other side, current assets increased by 35.8 million from the adoption of IFRS 15. Receivables from the sale of PP amounting to 62.6 million (including interest) at year-end 2017 were completely paid to SGL Carbon in March 2018.
The increase in non-current liabilities is attributable on one hand to the issue of the 159.3 million convertible bond and on the other hand to the proportional debt assumed by SGL Composites (USA) in the amount of 92.2 million as well as the
51 million purchase price liability due in 2020 for the acquisi-tion of the former BMW joint operation. An opposite effect resulted from the decrease in pension provisions of
15.5 million to 277.5 million. The main driver for this develop-ment was an adjustment of the pension discount rates to the expected long-term interest environment in Germany and in the US by 0.2%-points to 1.9% and by 0.6%-points to 4.2%, respectively, as well as the adjustment of mortality tables in Germany amounting to a total of 12.9 million. The decrease in current liabilities can be mainly attributed to the repayment of the outstanding amount of the convertible bond 2012/2018 of
239.2 million in January 2018. In addition, a portion of the cur-rent liabilities of SGL Composites in the amount of 67.5 million was repaid in the first nine months 2018.
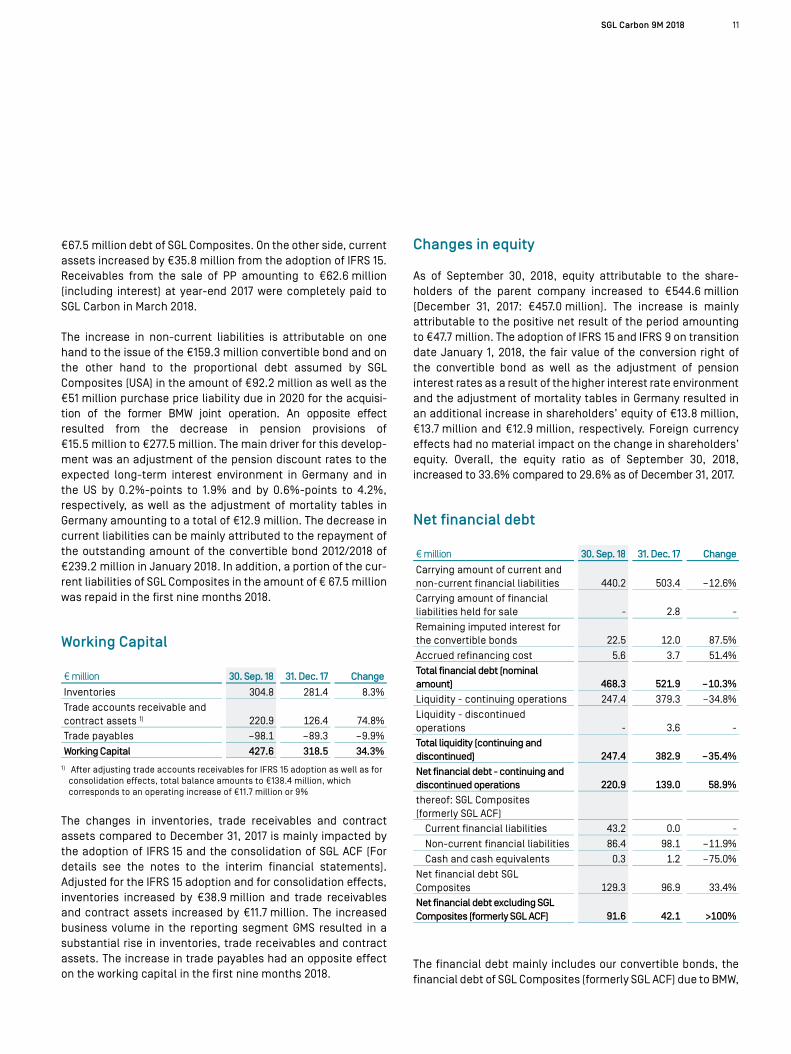
Working Capital
million 30. Sep. 18 31. Dec. 17 Change
Inventories
Trade accounts receivable and contract assets 1)
Trade payables – – –
Working Capital1) After adjusting trade accounts receivables for IFRS 15 adoption as well as for
consolidation effects, total balance amounts to 138.4 million, which corresponds to an operating increase of 11.7 million or 9%
The changes in inventories, trade receivables and contract assets compared to December 31, 2017 is mainly impacted by the adoption of IFRS 15 and the consolidation of SGL ACF (For details see the notes to the interim financial statements). Adjusted for the IFRS 15 adoption and for consolidation effects, inventories increased by 38.9 million and trade receivables and contract assets increased by 11.7 million. The increased business volume in the reporting segment GMS resulted in a substantial rise in inventories, trade receivables and contract assets. The increase in trade payables had an opposite effect on the working capital in the first nine months 2018.
Changes in equity
As of September 30, 2018, equity attributable to the share-holders of the parent company increased to 544.6 million (December 31, 2017: 457.0 million). The increase is mainly attributable to the positive net result of the period amounting to 47.7 million. The adoption of IFRS 15 and IFRS 9 on transition date January 1, 2018, the fair value of the conversion right of the convertible bond as well as the adjustment of pension interest rates as a result of the higher interest rate environment and the adjustment of mortality tables in Germany resulted in an additional increase in shareholders’ equity of 13.8 million,
13.7 million and 12.9 million, respectively. Foreign currency effects had no material impact on the change in shareholders’ equity. Overall, the equity ratio as of September 30, 2018, increased to 33.6% compared to 29.6% as of December 31, 2017.
Net financial debt
million 30. Sep. 18 31. Dec. 17 Change
Carrying amount of current and non-current financial liabilities –
Carrying amount of financial liabilities held for sale - -
Remaining imputed interest for the convertible bonds
Accrued refinancing cost
Total financial debt (nominal amount) –
Liquidity - continuing operations –
Liquidity - discontinued operations - -
Total liquidity (continuing and discontinued) –
Net financial debt - continuing and discontinued operationsthereof: SGL Composites (formerly SGL ACF)
Current financial liabilities -
Non-current financial liabilities –
Cash and cash equivalents –
Net financial debt SGL Composites
Net financial debt excluding SGL Composites (formerly SGL ACF)
The financial debt mainly includes our convertible bonds, the financial debt of SGL Composites (formerly SGL ACF) due to BMW,

12
the netted amounts of the remaining imputed interest compo-nent as well as the refinancing costs.
As of September 30, 2018, net financial debt increased by 81.9 million to 220.9 million. This development is primarily
attributable to the change from proportional consolidation to full consolidation of SGL Composites (USA). As a result, the share of financial liabilities of SGL Composites at SGL Carbon rose to 100%, representing an increase of 92.2 million. Payments received for the sale of PP had an opposite effect and reduced net debt by 62.6 million.
Free Cashflow
Nine months
million 2018 2017
Cash flow from operating activities
Result from continuing operations before income taxes –
Restructuring expenses – –
Value adjustments due to step acquisitions – -
Depreciation/amortization expense
Changes in working capital – –
Miscellaneous items –
Cash flow from operating activities - continuing operations –Cash flow from operating activities - discontinued operations –
Cash flow from operating activities - continuing and discontinued operations –
Cash flow from investing activities
Payments to purchase intangible assets and property, plant & equipment – –
Proceeds from the sale of intangible assets and property, plant & equipment
Payments for the acquisition of subsidiaries, net of cash acquired –
Dividend payments from investments accounted for At-Equity
Payments received for divestitures
Payments for capital contributions concerning investments accounted for At-Equity and investments in other financial assets –
Other investing activities –
Cash flow from investing activities - continuing operations – –
Cash flow from investing activities - discontinued operations –
Cash flow from investing activities - continuing and discontinued operations –
Free cash flow 1) - continuing operations – –
Free cash flow 1) - discontinued operations
1) Defined as cash flow from operating activities minus cash flow from investing activities
Despite the significant increase in working capital, cashflow from operating activities in the nine months 2018 improved significantly by 34.8 million to 7.6 million, mainly due to the positive development in the second quarter 2018. This reflects the improvement in the operating result. Cash flow from investing activities decreased from minus 10.2 million in the

13SGL Carbon 9M 2018
prior year period to minus 47.5 million in the reporting period and includes the net cash outflows for the acquisition of the SGL Composites company in Wackersdorf (Germany) amounting to 23.1 million, as well as the net proceeds from the sale of SGL Kümpers amounting to 3.4 million and from a land sale in Lachute (Canada) in the amount of 3.9 million. Cash flow from investing activities in the prior year period included the cash inflows from the sale of the carbon fiber production site in Evanston as well as the proceeds from a land sale in Banting (Malaysia) of 21.7 million in total. Capital expenditures in intangible assets and property plant and equipment in the reporting period increased by 28% to 38.7 million (9M/2017:
30.3 million).
As a result of the purchase price payment for the acquisition of SGL ACF and the resulting increased cash outflow from investing activities, free cash flow from continuing operations in the reporting period declined to minus 39.9 million com-pared to the prior year period (9M/2017: minus 37.4 million).
Free cash flow from discontinued operations improved significantly to 58.6 million in the reporting period (9M/2017:
4.1 million) and mainly includes the proceeds from the remaining purchase price from the sale of the former business unit PP and in the prior year period the operational cash in- and outflows of the PP business.
Employees
The following tables provide information on the headcount development according to reporting segments and to geo-graphic regions:
Headcount 30. Sep. 18 31. Dec. 17 Change
Composites - Fibers & Materials
Graphite Materials & Systems
Corporate –
Total SGL Carbon
Headcount 30. Sep. 18 31. Dec. 17 Change
Germany
Europe excluding Germany
North America
Asia
Total SGL Carbon
The number of employees at SGL Carbon amounted to 4,455 as of September 30, 2018 (December 31, 2017: 4,193) and increased both in CFM and GMS and declined as expected in Corporate. Headcount in CFM increased by 184 employees as a result of the full consolidation of the former BMW joint operation SGL Composites and decreased by 115 employees following the sale of SGL Kümpers. At GMS, the increase in the number of employees is due to the continuing good demand situation. Headcount amounted to 4,962 including temporary employees. Also for the final quarter of the year, we expect a further selective increase in employees in the business units to execute the growth strategy.
Employees of shared service functions are allocated to the reporting segments based on performance related keys. Headcount of Corporate still includes employees who provide services to the former business unit PP.
Opportunities and Risks
Regarding existing opportunities and risks, we refer to the detailed statements in the annual report for the financial year ended December 31, 2017. Opportunities and risks, which are presented in abbreviated form below, have not materially changed from the statements made in the annual report. The changes in the Group in the first nine months 2018 only lead to a minor change in the opportunity and risk profile: the acquisition of the remaining 49% of the shares in SGL ACF increase the opportunities and risks relating to automotive projects, while the sale of the shares in SGL Kümpers temporarily reduces the relevance of the wind energy market segment in the reporting segment CFM.
The global economy is currently experiencing a broad-based upturn. However, the Brexit and the existing political and economic conflicts could have significantly negative impacts. The form of the trade relationship between the EU and the United Kingdom after the Brexit remains unclear. A possible "hard" Brexit could have a particularly negative impact on the supply chain in the Composites - Fibers & Materials (CFM) reporting segment, as one of our two carbon fiber production sites is located in the United Kingdom. We have therefore established a task force under the leadership of the CFO to internally evaluate possible risks and have already initiated risk mitigation measures. Furthermore, a further escalation of the trade dispute between the US and China and further tariffs could have a negative impact on our business. A further deterioration of the situation in the Near and Middle East could

14
also have a negative impact on the global economy. Should these conflicts ease or be resolved, however, the global economy could gain even more momentum. An escalation of geopolitical conflicts and increasing governmental inter-vention could lead to further rising trade barriers and have a negative impact on the prices and availability of raw materials.
Significant growth and earnings opportunities may arise from our activities in very dynamic markets (e. g. electric mobility). However, seizing these opportunities could result in higher investment and working capital needs with resulting short-term negative effects on cash flow. Furthermore, the increasing utilization of our capacities in production entails higher downtime risks. This and delays on the procurement side could lead to supply bottlenecks or quality costs. We try to reduce this risk by investing into new equipment and preventive maintenance measures. Stricter environmental regulations could also require investments or even lead in the medium term to a situation where we are no longer able to operate production sites in the established ways. Furthermore, a stronger global economy may result in raw material and personnel costs significantly exceeding our expectations and having a negative impact on our business performance. On the other hand, the economic recovery could also lead to a further increase in demand for our products and thus result in price increases. In the medium term, exchange rate fluctuations - especially in the Yen and the USD - can have an impact on our key financial figures. Changes in tax laws or legal provisions in individual countries in which we operate may lead to higher tax expenses and higher tax payments. Legal disputes also entail risks for the earnings situation.
The reporting segment Composites - Fibers & Materials (CFM) aims to grow in the automotive, aerospace, energy and industrial applications industries. Risks may arise from lower growth as a result of delays in the expected increase in demand and from further capacity expansion by competitors. If customer projects do not materialize as quickly as planned, this will have a negative impact on the earnings situation. Furthermore, in particular the development of volumes and margins in the textile fiber business has to be monitored carefully.
In the reporting segment Graphite Materials & Systems (GMS), we see above average growth potential, especially in the LED and semiconductor industries as well as in the battery market segment with our anode materials for lithium-ion batteries. Exchange rates, oil price and sales price developments bear risks with regard to the impact on earnings of individual products, customer industries and regions. In the medium term,
our planning faces a risk of stagnating volumes, especially in the chemicals, solar and industrial applications industries. A drop in prices in the LED, battery and solar industries could also have a medium-term impact on SGL Carbon’s sales revenue and earnings potential. In the market segment chemicals, we see intense competition for few major projects.
Based on the information available at the present time, in our opinion there are no material individual risks that could jeopardize sustainably the business as a going concern. In our opinion, even if the individual risks are viewed on an aggregated basis, they do not threaten the going concern of SGL Carbon.
Outlook
Reporting segment Composites – Fibers & Materials (CFM)
As already outlined in our half year report, we continue to expect a sales increase of approximately 25% compared to the prior year level primarily as a result of acquisitions. Adjusted for currency and structural effects, this corresponds to growth in the mid to high single digit range. The initial adoption of IFRS 15 does not materially impact sales in this segment.
The expected sales development in the individual market segments also corresponds to the expectations outlined in the half year report: Sales with the automotive industry is antici-pated to more than double based on the full consolidation of the former joint ventures with Benteler and BMW as well as the strong demand development. Sales should slightly1 increase in the market segment Aerospace, while sales in the market segments Industrial Applications as well as Textile Fibers are anticipated to remain on the prior year level. In contrast, sales with the wind energy industry is adversely impacted not only by the deconsolidation of our former joint venture with Kümpers, but also due to the weak customer demand and is anticipated to decline by more than 50%.
Higher earnings contribution resulting from the full consolidation of our former joint venture SGL ACF as well as increasing volume demand will be offset by negative currency effects, higher development costs and the weaker than initially expected earnings in the market segment Wind Energy, Textile Fibers and Industrial Applications. This confirms our increased caution in the half year report as we now expect recurring EBIT
1 "Slight" indicates a variation of up to 10%; "significant“ indicates a variation of more than 10%

15SGL Carbon 9M 2018
approximately on the prior year level. The initial adoption of IFRS 15 has no material impact on EBIT in this segment.
As we had already highlighted in the past two interim reports, the highest quarterly earnings of this fiscal year, as in the past two years, will have been achieved in the first quarter 2018 due to the high capacity utilization as well as high shipments for particular projects.
The full consolidation of the former joint venture with BMW Group (SGL ACF) required an adjustment to the fair value of the proportionate shareholding as of the date of acquisition and led to a positive, non-cash earnings contribution of approxi-mately 28 million to the EBIT after non-recurring items already in the first quarter 2018. On the other hand, the preliminary purchase price allocation (PPA) will increase depreciation by approximately 10 million per annum until 2021, which will be recorded as a non-recurring item.
Reporting segment Graphite Materials & Systems (GMS)
The anticipated sales increase in the reporting segment Graphite Materials & Systems (GMS) is slightly higher than the one outlined in the half year report: though we continue to expect a slight increase in sales, this now translates into growth of approximately 10% when adjusted for currency effects (previously: mid to high single digit currency adjusted growth). In addition, we expect a low double digit million Euro positive impact on sales in this reporting segment from the initial adoption of IFRS 15.
The expected sales trends in the individual market segments are in line with the developments described in the half year report. Significant sales growth is expected in the market seg-ments LED, Automotive & Transport as well as Semiconductors, while a slight increase is anticipated in the market segments Industrial Applications and Chemicals. We are limiting our sales in the market segment Solar to benefit our customers in the LED and Semiconductor segments. Strong volume growth is again expected in the lithium-ion battery business. In combi-nation with successfully implemented price increases we should be able to record a sales increase also in this market segment in the full year 2018.
Following the strong development in the first nine months 2018, we now expect a more pronounced operational improvement in the reporting segment GMS, as the recurring EBIT is anticipated
to continue to increase substantially more than propor-tionately to the now higher expected sales growth. The positive effect from the initial adoption of IFRS 15 is also anticipated to be higher than previously expected. We now plan a high single to low double digit million amount, by which EBIT in this segment will be increased.
All in all, we expect that the reporting segment GMS will once again surpass our target Group ROCE (EBIT in relation to capital employed) of at least 9-10% and record an improvement over the prior year level.
Reporting segment Corporate
Guidance for the reporting segment Corporate corresponds to the outlook in the half year report: slightly higher expenses are expected to be incurred in the fiscal year 2018 compared to the prior year due to general cost increases, in particular relating to wage increases. One-off income from a land sale in Canada should be offset by one-off expenses for strategic projects. In particular these include the development and implementation of our Operations Management System (OMS) – a company-wide, uniform, standardized, cross-locational and cross-business unit management system for production. The goal of our new OMS is to streamline processes, increase efficiency, and maximize product quality, thereby maintaining high customer satisfaction.
Group
We increase once again our guidance for sales growth in the fiscal year 2018, which was already adjusted upwards at the half year stage and now anticipate an increase of approximately 15%. Accordingly, we will for the first time as the “new SGL“ reach the 1 billion sales mark. This corresponds to a high single digit growth rate adjusted for structural and currency effects. In addition, we anticipate a low double digit million Euro positive impact on Group sales from the initial adoption of IFRS 15.
We also slightly adjust upwards our expectation for recurring EBIT compared to the guidance at the half year stage, as the slightly weaker than expected earnings from CFM should be more than compensated by the higher than initially anticipated earnings contribution from GMS.
All in all, recurring EBIT should continue to slightly outpace the renewed higher sales growth expectations, driven by positive

16
effects from the significantly higher volume demand, the successful implementation of price increase initiatives in the reporting segment GMS, the additional earnings contribution from the full consolidation of the former joint venture SGL ACF as well as cost savings. In contrast, however, we anticipate slightly lower than expected earnings contribution from the reporting segment CFM, higher personnel and raw material costs as well as less favorable exchange rates compared to the prior year. Congruent to the explanations in the reporting segment GMS, the positive effect on Group sales from the initial adoption of IFRS 15 should also be higher than previously expected. We now expect a high single to low double digit million Euro amount, by which Group recurring EBIT will be increased.
As explained in the reporting segment CFM, the preliminary purchase price allocation (PPA) increases depreciation by approximately 10 million per annum until 2021. These expenses will be recorded as non-recurring items in the reporting segment CFM.
We also raise our guidance for net income from continued operations to the upper end of the range and now anticipate a mid double digit million Euro amount (previous guidance: low to mid double digit million Euro amount). The improvement compared to the prior year loss of approximately 16 million is primarily due to the higher operating result as well as the lower interest expense as a result of the early repayment of our corporate bond on October 30, 2017, as well as the repayment of a convertible bond at maturity on January 25, 2018.
Our net financial debt at the end of 2018 should be considerably higher than it was at the end of 2017, in particular due to the full consolidation of our former joint venture SGL ACF. Nevertheless, we expect to remain within our target gearing level of
approximately 0.5, and a leverage ratio based on EBITDA under 2.5. This confirms our previous guidance.
Despite project timing driven low expenditures in the first nine months 2018, our planned capex budget for the full year 2018 amounts to approximately 80 million, and thus slightly lower than the guidance at the half year stage. The focus of capital expenditure in our reporting segment CFM continues to be primarily on the market segment Automotive, for which we are continuing to strengthen the value chain, particularly for fabrics and components. In our reporting segment GMS, expansion investments are also focusing on the market segment Auto-motive, as well as on our lithium-ion battery business and our business with the semiconductor and LED industries.
Wiesbaden, November 6, 2018
SGL Carbon SE The Board of Management

17SGL CARBON 9M 2018

18
Consolidated Income Statement
3rd Quarter Nine months
million 2018 2017 Change 2018 2017 Change
Sales revenueCost of sales – – – – – –
Gross profit
Selling expenses – – – – – –
Research and development costs – – – – –
General and administrative expenses – – – – – –
Other operating income –
Other operating expenses – – – –
Result from investments accounted for At-Equity
Restructuring expenses – >– –
Operating profit –Interest income
Interest expense – – – –
Other financing result – – >– – –
Result from continuing operations before income taxes – –
Income tax expense – – – –
Result from continuing operations – –
Result from discontinued operations, net of income taxes – – >–
Net result for the period –
Thereof attributable to:
Non-controlling interests – –
Consolidated net result (attributable to shareholders of the parent company) –
Earnings per share, basic and diluted (in ) –
Earnings per share - continuing operations, basic and diluted (in ) – –
Condensed Consolidated Interim Financial Statements (unaudited)

19SGL CARBON 9M 2018
Consolidated Statement of Comprehensive Income
3rd Quarter Nine months
million 2018 2017 2018 2017
Net result for the periodItems that may be reclassified subsequently to profit or loss
Changes in the fair value of securities available for sale - -
Cash flow hedges 1) – –
Currency translation – –
Items that will not be reclassified subsequently to profit or loss
Actuarial gains/losses on pensions and similar obligations 2) –
Other comprehensive income – –Comprehensive income – –
Thereof attributable to:
Non-controlling interests –
Consolidated net result (attributable to shareholders of the parent company) – –
1) Includes tax effects of 0.4 million (2017: 0.1 million) in the first nine months 2) Includes tax effects of 0.1 million (2017: minus 3.5 million) in the first nine months

20
Consolidated Balance Sheet
ASSETS m 30. Sep. 18 31. Dec. 17 Change
Non-current assets
Goodwill
Other intangible assets
Property, plant and equipment
Investments accounted for At-Equity
Other non-currents assets
Deferred tax assets –
Current assets
Inventories
Trade receivables and contract assets
Other financial assets –
Other receivables and other assets – %
Liquidity –
Time deposits - -
Cash and cash equivalents –
–
Assets held for sale –
Total assets

21SGL CARBON 9M 2018
EQUITY AND LIABILITIES m 30. Sep. 18 31. Dec. 17 Change
Equity
Issued capital
Capital reserves
Accumulated losses – –
Equity attributable to the shareholders of the parent companyNon-controlling interests –
Total equity
Non-current liabilities
Provisions for pensions and similar employee benefits –
Other provisions
Interest-bearing loans
Other financial liabilities
Deferred tax liabilities
Current liabilities
Other provisions –
Current portion of interest-bearing loans –
Trade payables
Other liabilities
–Liabilities in connection with assets held for sale - -
Total equity and liabilities

22
Consolidated Cash Flow Statement
Nine months
million 2018 2017
Cash flow from operating activities
Result from continuing operations before income taxes –
Adjustments to reconcile the result from continuing operations to cash flow from operating activities:
Interest expense (net)
Result from the disposal of property, plant and equipment – –
Depreciation/amortization expense
Value adjustments due to step acquisitions – -
Restructuring expenses – –
Result from investments accounted for At-Equity – –
Amortization of refinancing costs
Interest received
Interest paid – –
Income taxes paid – –
Changes in provisions, net – –
Changes in working capital
Inventories – –
Trade receivables and contract assets – –
Trade payables –
Changes in other operating assets/liabilities –
Cash flow from operating activities - continuing operations –Cash flow from operating activities - discontinued operations –
Cash flow from operating activities - continuing and discontinued operations –

23SGL CARBON 9M 2018
Nine months
million 2018 2017
Cash flow from investing activities
Payments to purchase intangible assets and property, plant & equipment – –
Proceeds from the sale of intangible assets and property, plant & equipment
Dividend payments from investments accounted for At-Equity
Payments for the acquisition of subsidiaries, net of cash acquired – -
Payments received for divestitures
Payments for capital contributions concerning investments accounted for At-Equity and investments in other financial assets - –
Other investing activities - –
Cash flow from investing activities - continuing operations – –Changes in time deposits –
Cash flow from investing and cash management activities - continuing operations – –Cash flow from investing activities and cash management activities - discontinued operations –
Cash flow from investing activities and cash management activities - continuing and discontinued operations – –Cash flow from financing activities
Proceeds from issuance of financial liabilities
Repayment of financial liabilities – –
Payments in connection with financing activities – –
Other financing activities – –
Cash flow from financing activities - continuing operations – –
Cash flow from financing activities - continuing and discontinued operations – –Effect of foreign exchange rate changes – –
Net change in cash and cash equivalents – –Cash and cash equivalents at beginning of period
Cash and cash equivalents at end of period
Time deposits at end of period
Total liquidity
Less: Cash and cash equivalents of discontinued operations at end of period -
Liquidity

24
Condensed Consolidated Statement of Changes in Equity
Nine months 2018
million
Equity attributable to the shareholders of
the parent companyNon-controlling
interests Total equity
Cumulative adjustment on initial application of IFRS 15 and IFRS 9 (net of income taxes) -
Equity component of the convertible bonds -Dividends – –
Net result for the period
Other comprehensive income –
Comprehensive income
Nine months 17
million
Equity attributable to the shareholders of
the parent companyNon-controlling
interests Total equity
Net result for the period
Other comprehensive income – – –
Comprehensive income – –Other changes in equity 1) – –
1) In particular in connection with the acquisition of the non-controlling interests or the valuation of non-controlling interests in subsidiary partnerships

25SGL Carbon 9M 2018
Notes to the Condensed Consolidated Interim Financial Statements Description of business
SGL Carbon SE, located at Söhnleinstrasse 8, Wiesbaden (Germany), together with its subsidiaries (the Company or SGL Carbon) is a global manufacturer of products and solutions based on carbon fibers and specialty graphites.
Basis of preparation
The condensed consolidated interim financial statements of SGL Carbon have been prepared in accordance with International Financial Reporting Standards (IFRS) applicable to interim financial reporting (IAS 34) as issued by the International Accounting Standards Board and as adopted by the European Union (EU) and should be read in conjunction with the SGL Carbon Consolidated Financial Statements as of December 31, 2017. The condensed consolidated interim financial statements as of September 30, 2018, apply the same accounting principles and practices as well as the same estimates and assumptions as those used in the 2017 annual financial statements, except for the adoption of the new standards IFRS 15 Revenue from Contracts with Customers and IFRS 9 Financial Instruments effective as of January 1, 2018.
These condensed consolidated interim financial statements contain all of the information that is required for a fair pres-entation of the results of operations and the financial position of the Group.
The condensed consolidated interim financial statements were authorized by the Board of Management on November 6, 2018. The condensed consolidated interim financial statements and
interim group management report have not been audited, neither have they been subject to an auditor’s review.
Changes in scope of consolidation
Acquisitions The acquisition of SGL Automotive Carbon Fibers GmbH & Co KG, Munich (Germany) was completed on January 11, 2018. This transaction makes SGL Carbon the sole owner of the former joint operation with the BMW Group (renamed SGL Composites GmbH & Co. KG). The U.S. company of SGL ACF will, in a next step, be transferred to SGL Carbon no later than by the end of 2020 after payment of the purchase price and the redemption of the BMW financing; in this context, SGL Carbon exercises full control over the U.S. company based on the voting majority of 51% already upon the acquisition of the German shares. By acquiring SGL ACF, SGL Carbon is forging ahead with its strategy to consolidate all key activities in the value chain – from carbon fibers and materials to components – within SGL Carbon, giving it overall responsibility. Both companies will be integrated into the business unit CFM. Prior to obtaining control, the companies were consolidated on a proportional basis as joint operations within the meaning of IFRS 11. In a business combination achieved in stages, obtaining a controlling majority is recognized under the assumption of a cash payment (for the new 49% share) and an exchange (of the previously held 51% share at fair value). The difference between the carrying amount and the fair value of the previously held shares of 48.3 million and 76.2 million, respectively, led to an increase in other operating income in the income statement in the amount of 28.4 million (net of positive cumulative currency translation differences of 0.5 million). Based on the preliminary purchase price allocation, the breakdown of the fair value of identifiable assets and liabilities in SGL ACF on the date of acquisition on 100% basis is as follows. The corresponding proportional (51%) carrying amounts taken from the Group's financial statements immediately prior to the acquisition are shown for information purposes in column “Carrying amounts according to IFRS 11”:

26
millionFair Values at
acquisition date (100%)
Carrying amounts according to IFRS 11
(51%)1)
Assets
Other intangible assets
Property, plant and equipment
Deferred tax assets
Inventories
Trade receivables and contract assets
Other receivables and other assets
Cash and cash equivalents
Liabilities
Non-current liabilities
Provisions for pensions and similar employee benefits
Interest-bearing loans
Deferred tax liabilities
Current liabilities
Other provisions
Trade payables
Other liabilities
Net assets
Goodwill from business combination
Purchase price
1) Values immediately prior to the acquisition date
The other intangible assets are comprised of customer relationships with an estimated useful life of 51 months. Of the total consideration given for the acquisition, an amount of USD 62.2 million is due at the end of 2020 and 24.3 million (less acquired cash of 1.2 million) were paid at closing on January 11, 2018. The goodwill mainly includes intangible assets that could not be valued separately like the labor work force know how and positive business development expectations.
As of the acquisition date January 11, 2018 until September 30, 2018, the newly acquired companies contributed 94.5 million to the Group sales revenue and 6.9 million to Group operating profit (incl. additional depreciation and amortization expense on assets identified as part of the purchase price allocation, in each case based on 100%).
Disposals The sale of the 51% shareholding in SGL Kümpers GmbH & Co KG, Rheine (Germany) was completed on January 10, 2018. The related disposal of the assets of Kümpers did not result in any effect on profit or loss in fiscal 2018.
New accounting pronouncements with mandatory adoption as of January 1, 2018
IFRS 15 Revenue from Contracts with Customers This standard provides a single, principles-based five-step model for the determination and recognition of revenue to be applied to all contracts with customers. It replaces in particular IAS 18 and IAS 11 “Construction Contracts” and has a material effect on the presentation of SGL Carbon’s results of operations and financial position. SGL Carbon utilized the option for simplified initial application, i.e., contracts that are not completed by January 1, 2018 are accounted for as if they had been recognized in accordance with IFRS 15 from the very beginning.
IFRS 9 Financial instruments The standard changes the accounting requirements for classifying and measuring financial assets, for impairment of financial assets and for hedge accounting.
Financial assets are classified and measured on the basis of the entity’s business model and the character of the financial asset’s cash flow. A financial asset is initially measured either “at amortized cost”, “at fair value through other

27SGL Carbon 9M 2018
comprehensive income”, or “at fair value through profit or loss”. The classification and measurement of financial liabilities under IFRS 9 are unchanged compared with the current accounting requirements of IAS 39. IFRS 9 replaces the existing incurred loss model for financial assets with an expected credit loss model. IFRS 9 did not lead to any changes in regards to hedge accounting compared to IAS 39.
The cumulative effect arising from the transition of IFRS 15 and IFRS 9 was recognized as an adjustment to the opening balance of equity as of January 1, 2018. Prior-year comparatives are not adjusted; instead, they are presented based on the previous rules.
The tables below show the effects of the new accounting rules.
Adjustments to balance sheet amounts as of January 1, 2018
million 31. Dec. 17
IFRS 15 adjust-ments
IFRS 9 adjust-ments Netting 1. Jan. 18
Assets
Inventories –
Trade receivables and contract assets –
thereof: trade receivables –
thereof: contract assets –
Other financial assets –
Deferred tax assets –
Liabilities
Deferred tax liabilities –
Equity
Accumulated losses – – –
In accordance with the previous revenue recognition rules under IAS 18, sales revenues were recorded only upon the delivery of the goods to the customers’ site, i.e. at the date on which the customer accepts the goods and the related risks and rewards incidental to the transfer of title. The transition effects are attributable to the first-time recognition of contract assets that, under IFRS 15, lead to an earlier recognition of revenue from the sale of goods.
Pursuant to IFRS 15, revenue shall be recognized if the company’s performance does create a customized asset with no alternative use to the company and the company has an enforceable right for payment for performance completed to date. Assessing whether an asset created by the company’s performance is highly customized for a particular customer so
that it has no alternative use to the company requires accounting estimates that involve subjective judgements and the use of assumptions, some of which may be for matters that are inherently uncertain and susceptible to change.
The effects of the adoption of IFRS 9 result from the implementation of simplified impairment model based on expected credit losses particularly related to trade receivables as well as to contract assets recorded upon adoption of IFRS 15.
The following tables summarize the impacts of adopting IFRS 15 and IFRS 9 on the Group’s interim balance sheet and its interim income statement and OCI as of September 30, 2018. There was no impact on the Group’s interim statement of cash flows.

28
Impact on the interim consolidated income statement and OCI:
First nine months 2018
million
Amounts without adoption of IFRS 15 and
IFRS 9 IFRS 15 adjustments IFRS 9 adjustments As reported
Sales revenue
Cost of sales – – –
Gross profit
Impairment loss on trade receivables, other financial assets and contract assets – –
Operating profit –Credit value adjustment term deposits – –
Result before income taxes –
Income tax expense – – –
Net result for the period –
Other comprehensive income –
Impact on the interim consolidated balance sheet:
30. Sep. 18
million
Amounts without adoption of IFRS 15 and
IFRS 9 IFRS 15 adjustments IFRS 9 adjustments Netting As reported
Inventories –
Trade receivables and contract assets –
thereof: trade receivables –
thereof: contract assets –
Time deposits –
Deferred tax assets –
Deferred tax liabilities 11.9 9.8 – 7.8 13.9
Accumulated losses – – –

29SGL Carbon 9M 2018
Discontinued operations pursuant to IFRS 5
Result from discontinued operations Income and expenses incurred by the business unit PP (former business activities GE and CFL/CE) are reported separately under discontinued operations in the prior period income statement. The disposal of PP was completed at the end of 2017. Discontinued operations of the current period mainly include tax risks related to the former business unit PP.
Nine months
million 2018 2017
Sales revenue from discontinued operations -
Total expenses from discontinued operations – –
Result from operating activities of discontinued operations before income taxes –Attributable tax expense - –
Reversal of impairment losses arising on the remeasurement of assets included in disposal groups at fair value less costs to sell -
Result from discontinued operations –Earnings per share - discontinued operations, basic and diluted (in ) –
1) Attributable to the shareholders of the parent company
Other disclosures
Investments accounted for At-Equity The main joint venture accounted for At-Equity is Brembo SGL Carbon Ceramic Brakes S.p.A (Ceramic Brake Discs), Stezzano, Italy, which is operated together with Brembo and produces and further develops carbon ceramic brake discs. The table below provides the financial position of Brembo SGL, as reported in its financial statements. The summarized result of operations of the prior period also includes the amounts of the former joint venture Benteler GmbH & Co KG, Paderborn, Germany. The remaining 50% shares in Benteler SGL were acquired by SGL Carbon at the end of 2017.
Nine months
million 2018 2017
Ownership interest
Income statement
Sales revenue (100%)
Operating profit
Net financing result –
Net result for the period (100%)
Share of SGL Carbon in the net result for the period (50%)
Balance Sheet 30. Sep. 18 31. Dec. 17
Non-current assets
Current assets
Thereof cash and cash equivalents
Non-current liabilities
Thereof financial liabilities
Current liabilities
Thereof financial liabilities
Share of SGL Carbon in the net assets (50%)
Goodwill/customer base
Carrying amount of material joint ventures
The carrying amount of remaining investments accounted for At- Equity was 8.6 million (Dec. 31, 2017: 8.1 million) and their contribution to the result from investments accounted for At- Equity during the first nine months 2018 was 0.3 million (9M/2017: 1.1 million).
Additional disclosures on financial instruments
The following table assigns the individual balance sheet items for the financial instruments to classes and measurement categories:

30
million
Measure-ment
category under IFRS 9
Carrying amount at Sep. 30, 18
Carrying amount at Dec. 31, 17
Financial assets
Cash and cash equivalents
Time deposits
Trade receivables and contract assets
Marketable securities and similar investments (31.12: Available-for-sale financial assets)
Other financial assets
Derivative financial assets: Derivatives without a hedging relationship -
Derivative financial assets: Derivatives with a hedging relationship n.a.
Financial liabilities
Convertible bonds
Bank loans, overdrafts and other financial liabilities
Refinancing costs – –
Finance lease liabilities n.a.
Trade payables
Miscellaneous other financial liabilities
Derivative financial liabilities: Derivatives without a hedging relationship -
Derivative financial liabilities: Derivatives with hedging relationship n.a.
Thereof aggregated by measurement category in accordance with IFRS 9 (31. Dec. 2017: measurement category in accordance with IAS 39)
1) Financial assets measured at amortized costs (31. Dec. 2017: IAS 39 measurement category: Loans and receivables)
2) Financial assets measured at fair value through profit and loss (31. Dec. 2017: IAS 39 measurement category: Available-for-sale financial assets)
3) Financial assets measured at fair value through profit and loss (31. Dec. 2017: IAS 39 measurement category: Financial assets held for trading) -
4) Financial liabilities measured at amortized costs (31. Dec. 17: IAS 39 measurement category: Financial liabilities measured at amortized cost)
5) Financial liabilities measured at fair value through profit and loss (31. Dec. 2017: IAS 39 measurement category: Financial liabilities held for trading) -
The following table shows the breakdown of the assets and liabilities measured at fair value into the three levels of fair value hierarchy in accordance with IFRS 13:
30. Sep. 18
million Level1 Level2 Level3 Total
Marketable securities and similar investments - -
Derivative financial assets - -
Derivative financial liabilities - -
31. Dec. 17
million Level1 Level2 Level3 Total
Available for sale financial assets - -
Derivative financial assets - -
Derivative financial liabilities - -

31SGL Carbon 9M 2018
In September 2018, SGL Carbon SE issued an unsubordinated and unsecured convertible bond with a principal amount of
159.3 million (convertible bond 2018/2023). The bond has a term of five years and matures on September 20, 2023. It will be repaid at 100% of the nominal amount. The initial conversion price is 13.022, which corresponds to a premium of 30% above the reference price of the SGL Carbon SE share of 10.0169 during the placement. The convertible bond carries a coupon of 3.0% p.a., payable semi-annually in arrears on March 20 and September 20 beginning on March 20, 2019. Based on the current conversion price the complete volume of 12.2 million shares would be converted. The proceeds from the placement of the convertible bond will be used to refinance existing debt, extend the maturity profile, increase financial flexibility for further growth and for general business purposes. SKion GmbH holds a nominal amount of 30 million of the convertible bond 2018/2023. Upon issuance of the bond, the fair value of the conversion rights in the amount of 13.7 million was transferred to capital reserves and concurrently deducted from the bond liability. The fair market value of the convertible bond 2015/2020 as of September 30, 2018, was 171.4 million (December 31, 2017: 176.3 million) and for the convertible bond 2018/2023 157.5 million. As the fair value is derived from quoted prices in active markets, these financial instruments are allocated to Level 1. On January 25, 2018, the outstanding amount of the convertible bond 2012/2018 with a nominal value of 240.0 million was fully repaid in the amount of
239.2 million.
Seasonality of operations
Customer order patterns within the segments CFM and GMS primarily follow overall global trends (e. g. for lightweight materials) and depend on the availability in connection with the pricing of such materials. The overall economic environment is
usually a first indicator for any developments in the customers’ demand. In addition, individual large projects can significantly impact the business development and overlap regular seasonality.
Other additional information
Issued capital remained unchanged to December 31, 2017 at 313.2 million as of September 30, 2018, and is divided into
122,341,478 no-par value ordinary bearer shares at 2.56 per share. During the first nine months 2018, no new shares were issued from the authorized capital. As of September 30, 2018, there were 2,020,470 SARs outstanding. SGL Carbon SE held a total of 70,501 of its own shares (treasury shares) as of September 30, 2018. Based on an average number of 122.3 million shares, basic earnings per share amounted to
0.39 (9M/2017: 0.04).
The calculation of diluted earnings per share assumes the conversion of outstanding debt securities (convertible bonds) to shares or exercise of other contracts for the issue of common shares such as stock appreciation rights. The above-mentioned financial instruments are included in the calculation of diluted earnings per share only if there is a mathematical dilutive effect during the reporting period concerned. Accordingly, EPS diluted amounts to 0.39 (9M/2017: 0.04). EPS diluted (continuing operations) amounts to 0.42 (9M/2017: minus 0.17).

32
Segment information
million CFM GMS Corporate
Consoli-dation
adjust-ments
SGL Carbon
Nine months 2018 - continuing operations
External sales revenue
Intersegment sales revenue –
Total sales revenue –Timing of revenue recognition
Products transferred at point in time
Products and services transferred over time
Total sales revenue 323.9 436.8 25.6 0.0 786.3
Sales revenue by customer industry
Mobility
Energy
Industrial Applications
Chemicals
Digitalization
Textile Fibers
Total sales revenue 323.9 436.8 25.6 0.0 786.3
Operating profit (EBIT) before non-recurring items (recurring EBIT) –
Non-recurring items 1)
Operating profit/loss (EBIT) –
Capital expenditures 2)
Earnings before interest, taxes, depreciation and amortization (EBITDA) before non-recurring items –
Amortization/depreciation on intangible assets and property, plant and equipment before non-recurring items
Working Capital 3) –
Capital employed 4)
Sales revenue with one customer of the reporting segment CFM amount to approx. 89 million of total Group sales revenues.

33SGL Carbon 9M 2018
million CFM GMS Corporate
Consoli-dation
adjust-ments
SGL Carbon
Nine months 2017 - continuing operations
External sales revenue
Intersegment sales revenue –
Total sales revenue –
Operating profit (EBIT) before non-recurring items (recurring EBIT) –
Non-recurring items 1) – –
Operating profit/loss (EBIT) after non-recurring items –
Capital expenditures 2)
Earnings before interest, taxes, depreciation and amortization (EBITDA) before non-recurring items –
Amortization/depreciation on intangible assets and property, plant and equipment
Working Capital (31.12.) 3) –
Capital employed (31.12.) 4)
1) Non-recurring items comprise the full-consolidation effect of the former joint operations with the BMW Group (SGL ACF), the carryforward of hidden reserves realized as part of the purchase price allocation of the SGL Composite companies as well as restructuring expenses and, in 2017, restructuring expenses/others
2) Defined as total of capital expenditure in other intangible assets and property, plant and equipment 3) Defined as sum of inventories, trade receivables and contract assets less trade payables 4) Defined as the sum of goodwill, other intangible assets, property, plant and equipment, investments accounted for At-Equity, and working capital
Subsequent Events
None.
Wiesbaden, November 6, 2018
SGL Carbon SE The Board of Management
Dr. Jürgen Köhler Dr. Michael Majerus

34
To the best of our knowledge, and in accordance with the applicable reporting principles for interim financial reporting, the interim consolidated financial statements give a true and fair view of the assets, liabilities, financial position and profit or loss of the Group, and the interim Group Management Report includes a fair review of the development and performance of the business and the position of the Group, together with a description of the principal opportunities and risks associated
with the expected development of the Group for the remaining months of the financial year.
Wiesbaden, November 6, 2018
SGL Carbon SE
The Board of Management
Responsibility statement

35SGL Carbon 9M 2018
Sales Revenue and Operating Profit/Loss by Reporting Segment
Nine months
million 2018 2017 Change
Sales revenue
Composites - Fibers & Materials
Graphite Materials & Systems
Corporate
SGL Carbon - continuing operations
Nine months
million 2018 2017 Change
EBIT before non-recurring items (recurring EBIT) 1)
Composites - Fibers & Materials
Graphite Materials & Systems
Corporate – –
SGL Carbon - continuing operations
Quarterly Sales Revenue, Operating Profit/Loss (EBIT) and Return on Sales (based on EBIT before non-recurring items) by Reporting Segment
2017 2018
million Q1 Q2 Q3 Q4Full
Year Q1 Q2 Q3 Q1-Q3
Sales revenue
Composites - Fibers & Materials
Graphite Materials & Systems
Corporate
SGL Carbon - continuing operationsSGL Carbon - discontinued operations (PP) - - - -
2017 2018
million Q1 Q2 Q3 Q4 Full Year Q1 Q2 Q3 Q1-Q3
EBIT before non-recurring items (recurring EBIT) 1)
Composites - Fibers & Materials
Graphite Materials & Systems
Corporate – – – – – – – – –
SGL Carbon - continuing operationsSGL Carbon - discontinued operations (PP) - - - -
2017 2018
in % Q1 Q2 Q3 Q4Full
Year Q1 Q2 Q3 Q1-Q3
Return on sales (EBIT-margin) before non-recurring items 1)
Composites - Fibers & Materials
Graphite Materials & Systems
SGL Carbon - continuing operations
SGL Carbon - discontinued operations (PP) - - - - -1) Non-recurring items of 8.9 million in 2017 and 20.5 million in the first nine months 2018
Other information

36
Quarterly Consolidated Income Statement
2017 2018
million Q1 Q2 Q3 Q4 Full Year Q1 Q2 Q3 Q1-Q3
Sales revenueCost of sales – – – – – – – – –
Gross profitSelling, administrative, R&D and other operating income/expense – – – – – – – – –
Result from investments accounted for At-Equity
Operating profit (EBIT) before non-recurring items (recurring EBIT)Restructuring expenses – – –
Reversal of impairment losses/Others - -
Operating profit/loss (EBIT)
Net financing result – – 2.1 – – – – – – –
Result from continuing operations before income taxes – – – –
Income tax expense – – – – – – – –
Result from continuing operations – – – –
Result from discontinued operations, net of income taxes – –
Net result for the period –
Thereof attributable to:
Non-controlling interests –
Consolidated net result (attributable to shareholders of the parent company) – –

37SGL Carbon 9M 2018
Financial Calendar 2019
March 27, 2019
Publication of Annual Report 2018 Annual Press Conference Investor and analyst meeting (including conference call)
May 7, 2019
Report on the First Quarter 2019 Conference call for investors and analysts
May 10, 2019
Annual General Meeting
August 6, 2019
Report on the First Half Year 2019 Conference call for investors and analysts
November 5, 2019
Report on the First Nine Months 2019 Conference call for investors and analysts
38
Investor Relations Contact
SGL CARBON SE Head Office | Investor Relations Söhnleinstraße 8 65201 Wiesbaden Telephone: +49 611 6029-103 Telefax: +49 611 6029-101 E-Mail: [email protected] www.sglcarbon.com Produced inhouse with firesys

39SGL Carbon 9M 2018
Important Note
This interim report contains statements relating to certain projections and business trends that are forward-looking, including statements with respect to SGL Carbon’s
outlook and business development, including developments in SGL Carbon’s Composites - Fibers & Materials and Graphite Materials & Systems businesses, expected
customer demand, expected industry trends and expected trends in the business environment, statements related to SGL Carbon’s cost savings programs. You can
generally identify these statements by the use of words like "may", "will", "could", "should", "project", "believe", "anticipate", "expect", "plan", "estimate", "forecast",
"potential", "intend", "continue" and variations of these words or comparable words. These statements are not historical facts, but rather are based on current
expectations, estimates, assumptions and projections about SGL Carbon’s businesses and future financial results, and readers should not place undue reliance on
them. Forward-looking statements do not guarantee future performance and involve risks and uncertainties. These risks and uncertainties include, without limitation,
changes in political, economic, legal and business conditions, particularly relating to SGL Carbon’s main customer industries, competitive products and pricing, the
ability to achieve sustained growth and profitability in SGL Carbon’s Composites - Fibers & Materials and Graphite Materials & Systems businesses, the impact of any
manufacturing efficiencies and capacity constraints, widespread adoption of carbon fiber products and components in key end-markets of the SGL Carbon, including
the automotive and aviation industries, the inability to execute additional cost savings or restructuring measures, availability of raw materials and critical manufacturing
equipment, trade environment, changes in interest rates, exchange rates, tax rates, and regulation, available cash and liquidity, SGL Carbon’s ability to refinance its
indebtedness, development of the SGL Carbon’s pension obligations, share price fluctuation may have on SGL Carbon’s financial condition and results of operations
and other risks identified in SGL Carbon’s financial reports. These forward-looking statements are made only as of the date of this document. SGL Carbon does not
undertake to update or revise the forward-looking statements, whether as a result of new information, future events or otherwise.

SGL Carbon SEHead Office | Investor RelationsSöhnleinstrasse 865201 Wiesbaden/GermanyPhone +49 611 6029-103Fax +49 611 [email protected]