Embed Size (px)
Citation preview

4212
INTRODUCTIONA major theme in the field of ecological immunology (Sheldon andVerhulst, 1996; Wikelski and Ricklefs, 2001; Martin et al., 2007)is the potential for physiological trade-offs that are presumed tooccur when various functions compete for limited resources and/orinfluence the behavior of animals under natural conditions (Clobertet al., 2000; Careau and Garland, 2012). A number of studies, mostlyin birds, have investigated potential trade-offs between immunefunction and other energetically expensive traits. Energetically costlyactivities are particularly likely to suffer if a limited supply of energymust support immune upregulation in addition to other functions(Demas et al., 1997; Lochmiller and Deerenberg, 2000; Derting andCompton, 2003; French et al., 2009). Maintenance and upregulationof immune function are assumed to be expensive for most organisms,though many costs related to immune functions remain difficult toquantify (Lochmiller and Deerenberg, 2000; Ots et al., 2001;Bonneaud et al., 2003; Freitak et al., 2003; Pilorz et al., 2005; Amatet al., 2007; Colditz, 2008). Moreover, it may be less energeticallycostly to live with a low-level infection rather than investing the
energy to completely remove it (Bonneaud et al., 2003; Pilorz etal., 2005; Colditz, 2008).
Parasites are common in wild animals and produce wide-rangingeffects on their hosts, including immune responses elicited througha variety of mechanisms. Behavioral changes that occur in the hostas a result of infection are well studied, and various parasites(particularly helminths) have substantial impacts on energeticallyexpensive traits (e.g. a host’s locomotor behavior or performanceabilities), which may directly or indirectly alter the host’s ability tosurvive or reproduce (Anderson and May, 1991; Poirier et al., 1995;Meagher and Dudek, 2002; Careau and Garland, 2012). Assuminglimited resources, it is reasonable to expect that parasitized animalsmay redirect resources to allow for an upregulation of immunefunction, while compromising other functions.
In this study we investigated the effects of a common nematodeparasite, Trichinella spiralis, with an infective biology known todirectly affect its host (for example, effects on muscle physiology);it also elicits immune responses with potentially indirect effects (e.g.
SUMMARYFour lines of mice bred for high voluntary wheel running (HR lines) have high baseline circulating corticosterone levels andincreased daily energy expenditure as compared with four non-selected control (C) lines. High corticosterone may suppressimmune function and competing energy demands may limit ability to mount an immune response. We hypothesized that HR micehave a reduced immune response and therefore a decreased ability to fight an infection by Trichinella spiralis, an ecologicallyrelevant nematode common in mammals. Infections have an acute, intestinal phase while the nematode is migrating, reproducingand traveling throughout the bloodstream, followed by a chronic phase with larvae encysted in muscles. Adult males (generation55 of the selection experiment) were sham-infected or infected by oral gavage with ~300 J1 T. spiralis larvae. During the chronicphase of infection, mice were given wheel access for 6 days, followed by 2 days of maximum aerobic performance trials. Twoweeks post-infection, infected HR had significantly lower circulating immunoglobulin E levels compared with infected C mice.However, we found no statistical difference between infected HR and C mice in numbers of encysted larvae within the diaphragm.As expected, both voluntary running and maximum aerobic performance were significantly higher in HR mice and lower ininfected mice, with no line type-by-infection interactions. Results complement those of previous studies suggesting decreasedlocomotor abilities during the chronic phase of T. spiralis infection. However, despite reduced antibody production, breeding forhigh voluntary wheel exercise does not appear to have a substantial negative impact on general humoral function.
Supplementary material available online at http://jeb.biologists.org/cgi/content/full/216/22/4212/DC1
Key words: artificial selection, corticosterone, experimental evolution, immune function, trade-off, trichinosis, voluntary exercise, wheel running.
Received 23 February 2013; Accepted 7 August 2013
The Journal of Experimental Biology 216, 4212-4221© 2013. Published by The Company of Biologists Ltddoi:10.1242/jeb.087361
RESEARCH ARTICLEImmune response to a Trichinella spiralis infection in house mice from lines
selectively bred for high voluntary wheel running
Elizabeth M. Dlugosz1,*, Heidi Schutz1,†, Thomas H. Meek1,‡, Wendy Acosta1, Cynthia J. Downs2,§, Edward G. Platzer1,3, Mark A. Chappell1 and Theodore Garland, Jr1
1Department of Biology and Graduate Program in Evolution, Ecology and Organismal Biology, University of California, Riverside,Riverside, CA 92521, USA, 2Department of Biology and Program in Ecology, Evolution and Conservation Biology, University ofNevada, Reno, NV 89557, USA and 3Department of Nematology, University of California, Riverside, Riverside, CA 92521, USA*Author for correspondence at present address: Mitrani Department of Desert Ecology, The Jacob Blaustein Institutes for Desert Research,
Ben-Gurion University of the Negev, 84990 Midreshet Ben-Gurion, Israel ([email protected])†Present address: Department of Biology, Pacific Lutheran University, Tacoma, WA 98447, USA
‡Present address: Diabetes and Obesity Center of Excellence, Department of Medicine, University of Washington, Seattle, WA 98109, USA§Present address: Department of Natural Resources and Environmental Science, University of Nevada, Reno, NV 89557, USA
THE JOURNAL OF EXPERIMENTAL BIOLOGY

4213Immune response to T. spiralis in mice
changes in energy availability via alterations in allocation).Trichinella spiralis is geographically widely distributed andecologically relevant in many wild mammal species that consumemeat (even occasionally). Its biology has been intensely studiedbecause of is relevance to human health and the husbandry of stockanimals (Campbell, 1983; Capó and Despommier, 1996). DuringT. spiralis infections, a host experiences distinct acute and chronicphases (Frenkel, 1989; Meagher and Dudek, 2002). Infection beginswhen a host animal eats infected meat and larvae emerge in thestomach. During the initial acute phase, larvae mature in the smallintestines of the host. Adults mate, females reproduce, and newlarvae travel through the host’s bloodstream and preferentially enteractive skeletal muscle. Upon entering an individual muscle fiber,larvae induce a suite of changes, including de-differentiation of hostmuscle fibers (making them non-functional in contraction) andconsiderable upregulation of angiogenesis. The chronic phase ofthe infection begins when larvae encyst in ‘nurse cells’ within amuscle, where they can remain for years (Campbell, 1983;Despommier, 1998). Effects of acute trichinosis in rodents includeincreased weight loss, decreased locomotor activity, decreased runtime to exhaustion in a forced-exercise test, decreased home-cageactivity and decreased running speed (Von Brand et al., 1954;Bernard, 1959; Goodchild and Frankenberg, 1962; Zohar and Rau,1984; Zohar and Rau, 1986; Poirier et al., 1995).
The primary goal of the present study was to test for a trade-offbetween voluntary locomotor activity in wheels and immunefunction. We also tested whether maximal metabolic rates elicitedduring forced exercise were impacted by infection. Assumingcompeting energetic demands and a limited energy supply or abilityto process food, we predicted that parasitized animals would reducevoluntary activity levels to allow for an upregulation of immunefunction. A long-term experiment selectively breeding mice for highvoluntary wheel running (Swallow et al., 1998; Rhodes et al., 2005;Garland et al., 2011a; Garland et al., 2011b) is particularly well-suited to studies involving possible trade-offs between locomotionand other metabolically costly functions, including immuneresponses (Malisch et al., 2009a; Downs et al., 2012). Prior workshows that voluntary running can account for substantial fractionsof daily energy expenditure (Rezende et al., 2009), and running inhigh voluntary wheel running (HR) lines has remained unchangedfor >40 generations, despite continued selection, suggesting that ithas reached an upper limit (Rezende et al., 2009; Kolb et al., 2010;Careau et al., 2013). In addition, daily running distances of the fourreplicate HR lines are approximately threefold greater than thoseof mice from four non-selected control (C) lines, thus providinggreater protection against possible ‘floor effects’ as compared withmice that run at much lower levels. Finally, HR mice have evolvedincreased maximal oxygen consumption (V·O2max), as measuredduring forced treadmill exercise (Rezende et al., 2009), and anotherselection experiment with laboratory house mice that targetedV·O2max found evidence for altered innate immune function (e.g.decreased cytokine production in response to a lipopolysaccharideinjection) in their selected lines (Downs et al., 2013).
Regarding the effects of a T. spiralis infection on HR mice, twocompeting (although not mutually exclusive) hypotheses warrantexamination. First, because of possible energetic trade-offsassociated with very high activity levels (Rezende et al., 2009), weexpect that HR mice may allocate less energy toward resistinginfection and would therefore be susceptible to higher infectionlevels as compared with C mice. Assuming reduced energyallocation toward an immune response in HR mice, we would alsoexpect lower immunoglobulin levels in HR mice as compared with
C mice. Here, we measure immunoglobulin E (IgE), which is partof a broader T helper (Th)2 immune response associated withhelminth infections. Briefly, Th1 and Th2 cells represent twolymphocyte subpopulations. Both subpopulations are componentsof adaptive immunity and primarily work through the secretion ofcytokines, but Th1 broadly promotes cellular immunity, whereasTh2 promotes humoral immunity (Elenkov, 2004; Viveros-Paredeset al., 2006). Specifically, IgE is thought to directly induce expulsionof T. spiralis from the gut (Gurish et al., 2004; Watanabe et al.,2005). We expect higher parasite loads in HR mice versus C micebecause constraints on IgE levels and/or other immune functionsshould reduce the host’s ability to expel T. spiralis. Additionally,if energy allocation is the primary factor driving IgE productionand, consequently, the number of larvae eventually encysted inskeletal muscles, then we expect infected HR mice to show reducedmuscle function and hence a greater decrease in running performanceas compared with infected C mice. That finding would support theidea that HR mice are more energetically challenged by a T. spiralisinfection.
An alternate hypothesis is focused on elevated circulatingcorticosterone (CORT) concentrations in HR mice. CORT is asteroid hormone well known to mobilize energy stores, particularlyin times of increased stress. Malisch et al. (Malisch et al., 2007)showed that CORT levels changed in response to selection in HRmice, whose CORT levels are approximately double those of C mice(see also Malisch et al., 2008; Malisch et al., 2009a; Downs et al.,2012). Running on wheels further elevates CORT levels (Girardand Garland, 2002; Malisch et al., 2007), as CORT levels generallyincrease during exercise (Coleman et al., 1998). CORT is thoughtto be immunosuppressive (Sapolsky et al., 2000); however, it is notclear which aspect of an immune response is most affected byCORT. Malisch et al. showed that, although HR and C mice didnot differ statistically in the ability to clear an intestinal nematodeinfection (Nippostrongylus brasiliensis), an analysis of the eight linemeans revealed a negative relationship between clearance abilityand baseline CORT levels, supporting the hypothesis that CORThas immunosuppressive effects (Malisch et al., 2009a). Morerecently, a study by Downs and colleagues also found no statisticaldifference between the HR and C lines following an immunechallenge with lipopolysaccharide (Downs et al., 2012). Thus,evidence to date indicates that HR and C mice may be capable ofsimilar immune responses to infection. Despite the general predictionthat CORT is immunosuppressive, some studies have suggested thatCORT affects Th1/Th2 balance and works synergistically withcertain cytokines (specifically, interleukin 4) to induce IgE synthesis(Zieg et al., 1994; Wiegers and Reul, 1998; Elenkov, 2004; Viveros-Paredes et al., 2006). Therefore, if IgE levels are increased in HRmice as a result of increased baseline circulating CORT levels, thenwe may expect these mice to be more resistant to T. spiralis infectionand with fewer encysted larvae as compared with C mice.
Direct (invasion and deactivation of skeletal muscle cells) andpresumed indirect (costly immunological responses) influences ofT. spiralis on hosts are expected to decrease running performancein both HR and C mice. Thus, an intuitive prediction is a negativerelationship between parasite load and voluntary wheel running ormaximal performance ability [e.g. as indexed by maximal oxygenconsumption (Kolb et al., 2010)]. Assuming immunological andenergetic costs associated with infection and potentially anorexigeniceffects of parasite infection (Kyriazakis et al., 1998; Adamo et al.,2010), overall body mass and many organ masses are expected tobe negatively affected by infection. However, the spleen is oftenenlarged in organisms with parasitic infections, perhaps indicating
THE JOURNAL OF EXPERIMENTAL BIOLOGY

4214 The Journal of Experimental Biology 216 (22)
heightened immune response caused by increased production/storageof lymphocytes and immunoglobulins. As the spleen is consideredto be an immunologically important organ (Corbin et al., 2008;Cowan et al., 2009; Schulte-Hostedde and Elsasser, 2011), spleenmass is expected to increase with infection. Additionally, hematocritis expected to be positively correlated with both infection (Meagher,1998; Downs et al., 2012) and V·O2max performance.
Finally, we tested for effects of mini-muscle status (Garland etal., 2002; Kelly et al., in press). The primary characteristic of themini-muscle phenotype is a dramatic reduction in hindlimb musclemass (~50%) coupled with approximately doubled mass-specificaerobic capacity in hindlimb muscle (Houle-Leroy et al., 2003). Thisphenotype is caused by a simple Mendelian recessive allele and isassociated with alterations in various morphological, physiologicaland behavioral traits, including organ size, response to alipopolysaccharide (LPS) immune challenge, and wheel runningunder some conditions (e.g. Garland et al., 2002; Houle-Leroy etal., 2003; Swallow et al., 2005; Syme et al., 2005; Rezende et al.,2006; Dlugosz et al., 2009; Downs et al., 2012).
MATERIALS AND METHODSStudy animals and experimental design
Mice (Mus musculus domesticus Linnaeus) were from generation 55of an ongoing selection experiment, which includes four lines bredfor high voluntary wheel running (HR) and four control (C) linesbred without regard to wheel running (Swallow et al., 1998). Briefly,mice from each generation are given wheel access at ~6–8 weeks ofage, within-family selection is used, and a minimum of 10 matingpairs are used to produce litters. In the HR lines, the mice that runthe most on days 5 and 6 of the 6-day period of wheel access arebred to produce the next generation. C mice are also given access towheels for 6 days, but are bred without regard to their amount ofwheel running. All eight lines have been reproductively isolated sincethe beginning of the selection experiment. Mice are housed on a12 h:12 h light:dark cycle and given ad libitum food and water. Onehundred and one male mice were used for this experiment (maleswere used to avoid potential complications from estrous cycles). Micewere weaned at 21 days according to the selection protocol (Swallowet al., 1998) and housed four to a cage.
At approximately 7 weeks of age (Fig. 1), half of the mice (chosenrandomly) were infected (via a stomach tube) with approximately300 T. spiralis (Beltsville strain) J1-stage larvae in 0.1 ml saline[shown to be an ecologically relevant dose for mice (Despommier,1983; Meagher and Dudek, 2002)]. Larvae were recovered fromartificially digested skeletal muscle of a previously infectedlaboratory mouse host. The remaining mice received a shaminfection (0.1 ml saline). IgE levels were obtained from 75 μl bloodsamples taken from each mouse 2 weeks following infection usingan infraorbital socket protocol (Hoff, 2000). Blood was centrifugedfor 12 min at 46,000 g and 4°C, and plasma was stored at –20°Cuntil IgE assays.
At approximately 4 weeks after the initial infection, larvae wereexpected to be encysted in host skeletal muscle [the chronic phaseof infection (Despommier, 1998)]. At this time, mice were exposed
to the running wheels used in the selection experiment (1.12 mcircumference) for 6 days. Wheel running was recorded for 23.5 heach day in 1 min intervals, and total revolutions per day, totalnumber of 1 min intervals with at least one revolution, mean speed(total revolutions per number of active intervals) and maximumspeed in any 1 min interval were calculated. Wheel freeness(measured by the number of revolutions recorded followingacceleration to a standard revolutions per minute) was measuredprior to wheel testing and at the conclusion of the study. Wheeldata were recorded and downloaded each day.
Immediately following the 6-day wheel running test, we measuredV·O2max during forced exercise using open-flow respirometry in asmall enclosed treadmill (Rezende et al., 2006) (details below).Following V·O2max trials, mice were euthanized by decapitation anddissected. Liver, ventricles, lungs, diaphragm, spleen and the righttriceps surae muscle were collected and weighed. Liver, ventriclesand lungs were then dried to a constant mass and re-weighed.Diaphragm and spleen were frozen for future analyses. Right tricepssurae mass was used to determine mini-muscle status (Garland etal., 2002).
Diaphragm muscle compression for larvae detectionThe diaphragm is one of the most common sites of T. spiralis larvalencystment, so we used counts of larvae encysted in this tissue asan index of infection level (Gottstein et al., 2009). Diaphragms wereremoved, weighed and stored in a –20°C freezer. We counted totallarvae number in the diaphragm as a measure of final parasite loadfor each mouse. Prior to counting, diaphragms were stained inGiemsa Stain (see Ramirez-Melgar et al., 2007) and compressedbetween two glass microscope slides. All nurse cell–larvaecomplexes in the diaphragm were counted (Zeiss microscope, 100×total magnification) four times and averaged. Additionally,diaphragms from sham-infected mice were inspected to ensure theywere not infected.
IgE analysesPlasma samples collected 2 weeks post-infection (i.e. in the acutestate of infection) were used to assess the primary immune responseto infection. Two weeks post-infection is the predicted time ofmaximum IgE response (Jarrett and Haig, 1976; Dearman et al.,1998; Salagianni et al., 2007; Gurish et al., 2004). A double antibodyenzyme-linked sandwich immunoperoxidase assay (Mouse IgEELISA Kit E90-E; Immunology Consultants Laboratory, Portland,OR, USA) was used to determine plasma IgE levels. Samples werediluted and measured in duplicate on a pre-coated anti-mouse IgEplastic microtiter plate. Absorbance was determined at 450 nm usinga SpectraMax Plus microplate reader (Molecular Devices,Sunnyvale, CA, USA). Values (ng ml–1) were compared with astandard curve generated individually for each plate.
Maximal metabolic rate (V·O2max)Each mouse was run individually and was given two V·O2max testson consecutive days. Mice were given several minutes to acclimateto the motionless treadmill (volume 850 ml). When the test began,
InfectionMass 1 Mass 2
IgEMass 3
6 days of wheel access
Mass 4
V·O2max(2 trials)Masses 5, 6
DissectionsMass 7
Week0 1 2 3 4 5 6
Fig. 1. Timeline of experimental design.
THE JOURNAL OF EXPERIMENTAL BIOLOGY

4215Immune response to T. spiralis in mice
speed was initially low. Mice oriented quickly and ran well.Treadmill speed was matched to the behavior of the animals, andwas increased approximately every 30 s until V·O2 did not increaseor until the mouse could not keep pace with the treadmill or failedto continue running. At that point the treadmill was stopped andmice were allowed to recover before being removed. Flow rates(2000 ml min–1) and gas concentrations were recorded usingLabHelper software (www.warthog.ucr.edu) every 1 s withreferences taken at the beginning and end of each trial. Excurrentair was subsampled at 150 ml min–1, scrubbed and dried (soda limeand Drierite), and then passed through an O2 analyzer (AppliedElectrochemistry S-3A, Sunnyvale, CA, USA). Instantaneouscorrections (Bartholomew et al., 1981) were used to account formixing and washout characteristics and accurately record rapidchanges in metabolism. The effective volume for instantaneouscalculations was 900 ml, as determined from washout curvesgenerated with step changes in incurrent O2 concentration. Oxygenconsumption (V·O2) was calculated as:
V·O2 = V·(FIO2 – FEO2) / (1 – FeO2) , (1)
where FIO2 and FEO2 are the fractions of inspired and expired O2,respectively.
The V·O2max was defined as the highest consecutive 1 min of V·O2during exercise. The higher of the two V·O2max values was used inanalyses.
Statistical analysesProc Mixed in SAS version 9.2 was used for mixed-model ANOVAanalyses (SAS Institute, Cary, NC, USA). The mixed-modelANOVA included infection (referring to differences betweeninfected and uninfected mice), line type (referring to differencesbetween HR and C mice) and the infection-by-line type interaction.These effects were tested relative to the random effect of replicateline nested within line type, with 1 and 6 d.f. Our prediction thatHR mice were more affected by infection than C mice was testedvia the interaction between line type and infection. Mini-muscle[which may affect certain aspects of performance (Houle-Leroy etal., 2003; Syme et al., 2005; Dlugosz et al., 2009; McGillivray etal., 2009)] was coded as a dummy variable and included as a fixedeffect, tested relative to the error term with d.f. of 1 and ~76 (or~38 when only infected mice were analyzed). On a trait-by-traitbasis, mice were excluded from analyses in which their standardizedresidual was greater than |3|.
Body mass was recorded seven times over the course of theexperiment (see timeline in Fig. 1). Body mass 1 was analyzedwith a one-way mixed-model ANOVA (with line included as arandom effect), as mice were not yet infected at that time. Allother body mass data were analyzed with the general mixed-modelANOVA described above. Age was included as a covariate inanalyses of body mass and body mass was included as a covariatein analyses of organ masses. Spleen, ventricle and lung masseswere log10-transformed to achieve approximate normality ofresiduals.
To test for the effects of infection on wheel running, we usedmixed-model ANOVAs (as described above) for distance(revolutions day–1), time (min day–1), mean speed (revolutions min–1)and maximum speed (revolutions min–1). For consistency with thestandard selection protocol, only values averaged for days 5 and 6of the 6-day test were analyzed. Wheel freeness measures wereaveraged and used as a covariate in wheel-running analyses, as wasage. Distance and time were square-root transformed to reduceskewness of residuals.
For V·O2max, we used the mixed-model ANOVA described above.As is typical for metabolic measurements, V·O2max was log10-transformed and log10-tranformed body mass was used as acovariate. Because IgE levels for uninfected mice were, as expected,very low and often did not reliably fall on the standard curve, onlyinfected mice were included in IgE analyses. The number of larvaeencysted in the diaphragm was used as our measure of final infectionintensity, with body mass as a covariate.
For traits measured close to the time of dissection [body masses5, 6 and 7 (Fig. 1), organ masses, wheel running and V·O2max(ml min–1)], we also performed analyses of only the infected mice,using diaphragm larvae count as a covariate and line type and mini-muscle status as factors.
RESULTSBody mass
Consistent with many previous studies of these lines, uninfectedC mice were approximately 8–9% larger than uninfected HR miceat all seven body mass measurements, although none of thedifferences reached statistical significance (Fig. 1, supplementarymaterial Tables S1, S2) (e.g. Swallow et al., 1999; Malisch et al.,2009a; Meek et al., 2009; Rezende et al., 2009; Kolb et al., 2010).Mini-muscle HR mice were always significantly smaller thannormal mice. One week after infection (body mass 2), infectionstatus was not significantly associated with body mass. However,starting 2 weeks after infection and continuing through the end ofthe experiment, infected mice were significantly smaller thanuninfected mice. Overall, from the time of infection (bleed 1 mass)until dissection, uninfected C mice showed a 10.75% increase inbody mass and uninfected HR mice increased their body mass by10.01% compared with initial body mass. However, infected Cmice only showed a 0.33% increase in body mass, whereas infectedHR mice increased their body mass by 2.87%. There were nosignificant line type-by-infection interactions for body mass at anypoint of the experiment (i.e. body masses of both line types wereapproximately equally affected by infection). Considering only theinfected mice, diaphragm larvae counts had a significant negativerelationship with body mass (supplementary material Table S1).
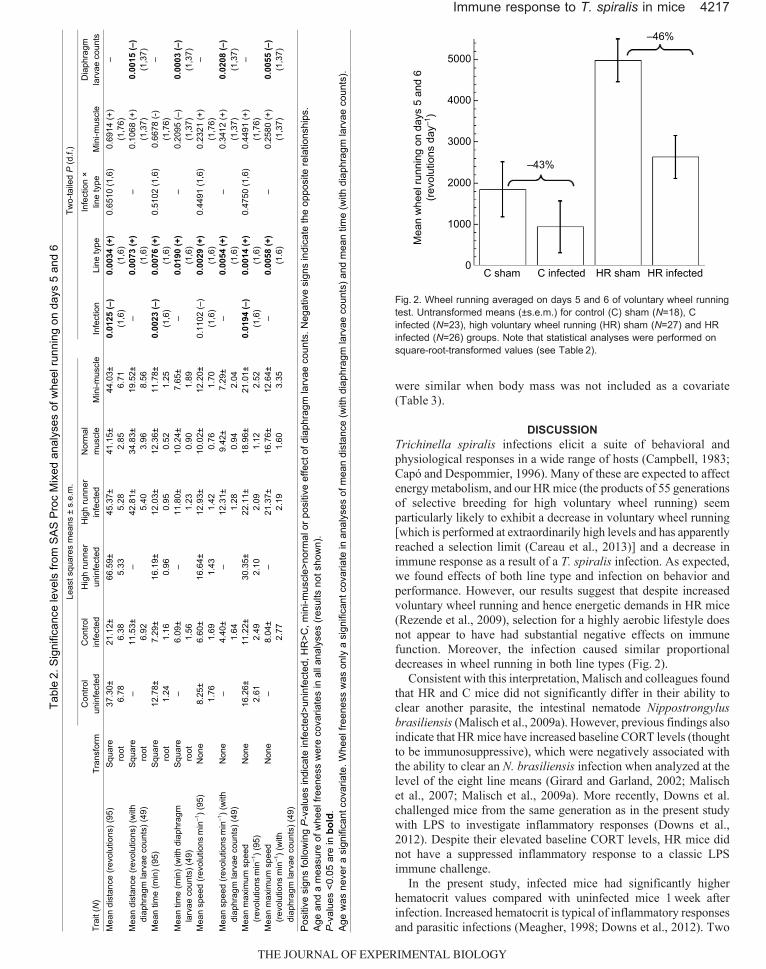
Organ massesBody mass at the time of dissection was a significant positivepredictor of all organ masses except wet and dry lung mass(Table 1). HR mice had significantly larger wet and dry ventriclemasses compared with C mice. Spleen mass [thought to be a goodindicator of immunological activity and parasitic infection inmammals (Cowan et al., 2009; Schulte-Hostedde and Elsasser,2011)] was significantly larger in infected mice than uninfected mice.Infected mice also had significantly smaller wet and dry lung massesthan uninfected mice. Line type-by-infection interactions were notstatistically significant for any organ mass. In previous studies, themini-muscle gene has been shown to have many pleiotropic effects,including increases in body-mass-adjusted organ masses (e.g.Garland et al., 2002; Swallow et al., 2005; Downs et al., 2012). Inthe present study, mini-muscle mice had significantly larger wetand dry liver masses than normal mice, but mini-muscle was not asignificant predictor of any other relative organ masses (Table 1).In infected mice, diaphragm larvae counts had a significant negativerelationship with ventricle mass (supplementary material Table S3).
HematocritHematocrit was never statistically different between HR and C mice,and body mass was never a significant predictor of hematocrit
THE JOURNAL OF EXPERIMENTAL BIOLOGY

4216 The Journal of Experimental Biology 216 (22)
(Table 1). One week after infection, infected mice had significantlyhigher hematocrit than uninfected mice (P=0.0148), but thisdifference was reversed a week later (P=0.0028). Two weeks post-infection, mini-muscle mice had significantly lower hematocritcompared with normal mice (P=0.0311).
Voluntary wheel runningFour components of voluntary wheel running (means for days 5 and6 of the 6-day test) were analyzed: distance, time, mean speed andmaximum speed. Neither age nor mini-muscle was significantlyassociated with any measure of wheel running (Table 2). As expectedbased on many previous studies, HR male mice ran significantlyfarther, for more minutes per day, and at a higher mean running speedthan C mice. As predicted, distance run, time run and maximum speedwere significantly lower in infected mice, although the decrease inmean speed did not reach statistical significance. There was noinfection-by-line type interaction for any aspect of voluntary wheelrunning; thus, based on back-transformed least squares means, theproportional reduction in distance run resulting from infection wassimilar in HR and C mice (−43% versus −46%, respectively).However, the absolute reduction in distance run due to infection wasapproximately fourfold larger in HR as compared with C mice (Fig. 2).In the infected mice, diaphragm larvae counts had a significantnegative relationship with all four measures of wheel running whileHR mice also ran more than C mice (Table 2).
V·O2maxThe two measurements of V·O2max were significantly correlatedbetween trial days (r=0.3982, P<0.0001), and did not differ onaverage between trials (paired t-test, P=0.1645). As expected, log10body mass was a highly significant predictor of log10 V·O2max(P<0.0001; Table 3). After accounting for log10 body mass, HR micehad significantly higher V·O2max than C mice (P=0.0170). Infectiondecreased V·O2max (P=0.0396), although the magnitude of thedecrease was small (2–6%). Similar to wheel running, there was noinfection-by-line type interaction (P=0.1286) and mini-muscle micedid not have different V·O2max from normal mice (P=0.9009). In theinfected mice, diaphragm larvae counts were not significantly relatedto V·O2max (Table 3).
Immunoglobulin EIn infected animals, plasma IgE levels at 2 weeks post-infection weresignificantly higher (~67%) in C mice as compared with HR mice(P=0.0077; Table 3). Surprisingly, although all mini-muscle miceare HR mice, mini-muscle mice had significantly higher IgE levelscompared with mice without mini-muscle (P=0.0361; Table 3).Although uninfected mice were not included in IgE analyses,preliminary tests suggested that baseline, uninfected IgE levels weresimilar in HR and C mice (P=0.9682) and IgE levels in uninfectedmini-muscle mice were not different from those of normal mice(P=0.4728).
Diaphragm larvae countsAmong infected mice, the number of larvae per diaphragm rangedfrom 285 to 2140 (mean ± s.e.m.=1261±54.5). Log10 body masswas strongly negatively correlated with infection level, asmeasured by counts of larvae in diaphragms (P<0.0001; Table 3).Contrary to our prediction, infected HR and C mice did not havesignificantly different numbers of larvae in their diaphragms (leastsquares means were 1278 versus 1132 larvae in C versus HR mice,respectively; P=0.2060). Mini-muscle status was not a significantpredictor of larvae encysted in the diaphragm (P=0.2605). Results
Ta
ble
1. S
igni
fican
ce le
vels
from
SA
S P
roc
Mix
ed a
naly
ses
of o
rgan
mas
ses
Leas
t squ
ares
mea
ns ±
s.e
.m.
Tw
o-ta
iled P
(d.f.
)
Org
an m
ass
(N)
Tran
sfor
m
Con
trol
unin
fect
ed
Con
trol
infe
cted
H
igh
runn
er
unin
fect
ed
Hig
h ru
nner
in
fect
ed
Nor
mal
m
uscl
e M
ini-m
uscl
e In
fect
ion
Line
type
In
fect
ion
lin
e ty
pe
Min
i-mus
cle
Bod
y m
ass
Spl
een
(94)
Lo
g 10
1.06
19±
0.04
16
0.99
82±
0.04
13
1.05
80±
0.03
82
0.94
16±
0.03
89
1.02
81±
0.02
09
1.00
17±
0.03
39
0.04
51 (+
) (1
,6)
0.49
82 (+
) (1
,6)
0.47
98 (1
,6)
0.41
32 (+
) (1
,76)
<0
.000
1 (+
) (1
,76)
W
et li
ver (
95)
Non
e 1.
8861
± 0.
0725
2.
0069
± 0.
0683
2.
0078
± 0.
0563
2.
0211
± 0.
0600
1.
7981
± 0.
0360
2.
1692
± 0.
0769
0.
1750
(+)
(1,6
) 0.
3947
(+)
(1,6
) 0.
2241
(1,6
) <0
.000
1 (+
) (1
,77)
<0
.000
1 (+
) (1
,77)
D
ry li
ver (
95)
Non
e 0.
6068
± 0.
0259
0.
6382
± 0.
0246
0.
6475
± 0.
0203
0.
6496
± 0.
0215
0.
5746
± 0.
0132
0.
6965
± 0.
0275
0.
3031
(+)
(1,6
) 0.
3717
(+)
(1,6
) 0.
3203
(1,6
) <0
.000
1 (+
) (1
,77)
<0
.000
1 (+
) (1
,77)
W
et v
entri
cle
(94)
Lo
g 10
0.84
78±
0.01
34
0.84
15±
0.01
28
0.79
54±
0.01
08
0.81
36±
0.01
13
0.83
19±
0.00
69
0.81
72±
0.01
44
0.45
57 (–
) (1
,6)
0.02
99 (+
) (1
,6)
0.12
33 (1
,6)
0.33
29 (+
) (1
,76)
<0
.000
1 (+
) (1
,76)
D
ry v
entri
cle
(93)
Lo
g 10
1.48
09±
0.01
35
1.48
27±
0.01
31
1.42
72±
0.01
13
1.44
84±
0.01
16
1.46
74±
0.00
74
1.45
21±
0.01
42
0.15
03 (–
) (1
,6)
0.02
61 (+
) (1
,6)
0.17
48 (1
,6)
0.29
48 (+
) (1
,75)
<0
.000
1 (+
) (1
,75)
W
et lu
ngs
(94)
Lo
g 10
0.59
67±
0.02
15
0.67
14±
0.01
90
0.60
37±
0.01
54
0.63
36±
0.01
71
0.63
14±
0.00
87
0.62
12±
0.02
14
0.01
80 (–
) (1
,6)
0.44
52 (+
) (1
,6)
0.18
43 (1
,6)
0.66
59 (+
) (1
,76)
0.
6478
(+)
(1,7
6)
Dry
lung
s (9
3)
Log 1
0 1.
2599
± 0.
0215
1.
3241
± 0.
0189
1.
2632
± 0.
0157
1.
2922
± 0.
0170
1.
2888
± 0.
0083
3 1.
2809
± 0.
0215
0.
0308
(–)
(1,6
) 0.
4660
(+)
(1,6
) 0.
2912
(1,6
) 0.
7375
(+)
(1,7
5)
0.67
49 (+
) (1
,75)
H
emat
ocrit
(b
leed
1) (
101)
N
one
47.0
1±
0.68
51
46.9
4±
0.55
46
.42±
0.
36
47.5
3±
0.89
–
0.94
15 (–
) (1
,6)
– 0.
2635
(+)
(1,9
1)
0.68
71 (–
) (1
,91)
H
emat
ocrit
(b
leed
2) (
98)
Non
e 45
.43±
1.
09
48.2
3±
1.04
44
.97±
0.
8552
47
.08±
0.
85
47.1
8±
0.50
45
.67±
1.
17
0.01
48 (+
) (1
,6)
0.46
79 (–
) (1
,6)
0.64
16 (1
,6)
0.24
09 (–
) (1
,80)
0.
6169
(+)
(1,8
0)
Hem
atoc
rit
(ble
ed 3
) (96
) N
one
44.1
1±
1.15
38
.86±
1.
08
44.2
8±
0.88
40
.35±
0.
92
43.2
4±
0.48
40
.56±
1.
12
0.00
28 (–
) (1
,6)
0.42
93 (+
) (1
,6)
0.48
91 (1
,6)
0.03
11 (–
) (1
,78)
0.
7277
(+)
(1,7
8)
Pos
itive
sig
ns fo
llow
ing P
-val
ues
indi
cate
infe
cted
>uni
nfec
ted,
HR
>C, m
ini-m
uscl
e>no
rmal
or p
ositi
ve e
ffect
of b
ody
mas
s. N
egat
ive
sign
s in
dica
te th
e op
posi
te re
latio
nshi
ps.
P-v
alue
s <0
.05
are
in b
old.
B
ody
mas
s w
as n
ot tr
ansf
orm
ed fo
r use
as
a co
varia
te in
ana
lyse
s of
org
an m
asse
s.
THE JOURNAL OF EXPERIMENTAL BIOLOGY

4216The Journal of E
xperimental B
iology 216 (22)
(Table 1). O
ne week after infection, infected m
ice had significantlyhigher hem
atocrit than uninfected mice (P
=0.0148), but thisdifference w
as reversed a week later (P
=0.0028). Tw
o weeks post-
infection, mini-m
uscle mice had significantly low
er hematocrit
compared w
ith normal m
ice (P=0.0311).
Voluntary wheel running
Four components of voluntary w
heel running (means for days 5 and
6 of the 6-day test) were analyzed: distance, tim
e, mean speed and
maxim
um speed. N
either age nor mini-m
uscle was significantly
associated with any m
easure of wheel running (T
able2). A
s expectedbased on m
any previous studies, HR
male m
ice ran significantlyfarther, for m
ore minutes per day, and at a higher m
ean running speedthan C
mice. A
s predicted, distance run, time run and m
aximum
speedw
ere significantly lower in infected m
ice, although the decrease inm
ean speed did not reach statistical significance. There was no
infection-by-line type interaction for any aspect of voluntary wheel
running; thus, based on back-transformed least squares m
eans, theproportional reduction in distance run resulting from
infection was
similar in H
R and C
mice (−43%
versus−46%
, respectively).H
owever, the absolute reduction in distance run due to infection w
asapproxim
ately fourfold larger in HR
as compared w
ith C m
ice (Fig.2).In the infected m
ice, diaphragm larvae counts had a significant
negative relationship with all four m
easures of wheel running w
hileH
R m
ice also ran more than C
mice (Table 2).
V ·O2 m
axT
he two m
easurements of V ·O
2 max
were significantly correlated
between trial days (r=0.3982, P
<0.0001), and did not differ onaverage betw
een trials (paired t-test, P=0.1645). A
s expected, log10
body mass w
as a highly significant predictor of log10
V ·O2 m
ax(P<0.0001; T
able3). A
fter accounting for log10 body m
ass, HR
mice
had significantly higher V ·O2 m
axthan C
mice (P
=0.0170). Infectiondecreased V ·O
2 max
(P=0.0396), although the m
agnitude of thedecrease w
as small (2–6%
). Similar to w
heel running, there was no
infection-by-line type interaction (P=0.1286) and m
ini-muscle m
icedid not have different V ·O
2 max
from norm
al mice (P
=0.9009). In theinfected m
ice, diaphragm larvae counts w
ere not significantly relatedto V ·O
2 max
(Table 3).
Imm
unoglobulin EIn infected anim
als, plasma IgE levels at 2 w
eeks post-infection were
significantly higher (~67%) in C
mice as com
pared with H
R m
ice(P
=0.0077; Table 3). Surprisingly, although all m
ini-muscle m
iceare H
R m
ice, mini-m
uscle mice had significantly higher IgE
levelscom
pared with m
ice without m
ini-muscle (P
=0.0361; Table 3).
Although uninfected m
ice were not included in IgE
analyses,prelim
inary tests suggested that baseline, uninfected IgE levels w
eresim
ilar in HR
and C m
ice (P=0.9682) and IgE
levels in uninfectedm
ini-muscle m
ice were not different from
those of normal m
ice(P
=0.4728).
Diaphragm
larvae countsA
mong infected m
ice, the number of larvae per diaphragm
rangedfrom
285 to 2140 (mean ± s.e.m
.=1261±54.5). Log
10body m
assw
as strongly
negatively correlated
with
infection level,
asm
easured by counts of larvae in diaphragms (P
<0.0001; Table 3).
Contrary to our prediction, infected H
R and C
mice did not have
significantly different numbers of larvae in their diaphragm
s (leastsquares m
eans were 1278 versus1132 larvae in C
versusHR
mice,
respectively; P=0.2060). M
ini-muscle status w
as not a significantpredictor of larvae encysted in the diaphragm
(P=0.2605). R
esults
Table 1. Significance levels from SAS Proc Mixed analyses of organ masses
Least squares means ± s.e.m. Two-tailed P (d.f.)
Organ mass (N) Transform Control
uninfected Control infected
High runner uninfected
High runner infected
Normal muscle Mini-muscle Infection Line type
Infection line type Mini-muscle Body mass
Spleen (94) Log10 1.0619± 0.0416
0.9982± 0.0413
1.0580± 0.0382
0.9416± 0.0389
1.0281± 0.0209
1.0017± 0.0339
0.0451 (+) (1,6)
0.4982 (+) (1,6)
0.4798 (1,6) 0.4132 (+) (1,76)
<0.0001 (+) (1,76)
Wet liver (95) None 1.8861± 0.0725
2.0069± 0.0683
2.0078± 0.0563
2.0211± 0.0600
1.7981± 0.0360
2.1692± 0.0769
0.1750 (+) (1,6)
0.3947 (+) (1,6)
0.2241 (1,6) <0.0001 (+) (1,77)
<0.0001 (+) (1,77)
Dry liver (95) None 0.6068± 0.0259
0.6382± 0.0246
0.6475± 0.0203
0.6496± 0.0215
0.5746± 0.0132
0.6965± 0.0275
0.3031 (+) (1,6)
0.3717 (+) (1,6)
0.3203 (1,6) <0.0001 (+) (1,77)
<0.0001 (+) (1,77)
Wet ventricle (94)
Log10 0.8478± 0.0134
0.8415± 0.0128
0.7954± 0.0108
0.8136± 0.0113
0.8319± 0.0069
0.8172± 0.0144
0.4557 (–) (1,6)
0.0299 (+) (1,6)
0.1233 (1,6) 0.3329 (+) (1,76)
<0.0001 (+) (1,76)
Dry ventricle (93) Log10 1.4809± 0.0135
1.4827± 0.0131
1.4272± 0.0113
1.4484± 0.0116
1.4674± 0.0074
1.4521± 0.0142
0.1503 (–) (1,6)
0.0261 (+) (1,6)
0.1748 (1,6) 0.2948 (+) (1,75)
<0.0001 (+) (1,75)
Wet lungs (94) Log10 0.5967± 0.0215
0.6714± 0.0190
0.6037± 0.0154
0.6336± 0.0171
0.6314± 0.0087
0.6212± 0.0214
0.0180 (–) (1,6)
0.4452 (+) (1,6)
0.1843 (1,6) 0.6659 (+) (1,76)
0.6478 (+) (1,76)
Dry lungs (93) Log10 1.2599± 0.0215
1.3241± 0.0189
1.2632± 0.0157
1.2922± 0.0170
1.2888± 0.00833
1.2809± 0.0215
0.0308 (–) (1,6)
0.4660 (+) (1,6)
0.2912 (1,6) 0.7375 (+) (1,75)
0.6749 (+) (1,75)
Hematocrit (bleed 1) (101)
None 47.01± 0.6851
46.94± 0.55
46.42± 0.36
47.53± 0.89
– 0.9415 (–) (1,6)
– 0.2635 (+) (1,91)
0.6871 (–) (1,91)
Hematocrit (bleed 2) (98)
None 45.43± 1.09
48.23± 1.04
44.97± 0.8552
47.08± 0.85
47.18± 0.50
45.67± 1.17
0.0148 (+) (1,6)
0.4679 (–) (1,6)
0.6416 (1,6) 0.2409 (–) (1,80)
0.6169 (+) (1,80)
Hematocrit (bleed 3) (96)
None 44.11± 1.15
38.86± 1.08
44.28± 0.88
40.35± 0.92
43.24± 0.48
40.56± 1.12
0.0028 (–) (1,6)
0.4293 (+) (1,6)
0.4891 (1,6) 0.0311 (–) (1,78)
0.7277 (+) (1,78)
Positive signs following P-values indicate infected>uninfected, HR>C, mini-muscle>normal or positive effect of body mass. Negative signs indicate the opposite relationships. P-values <0.05 are in bold. Body mass was not transformed for use as a covariate in analyses of organ masses.
TH
E JO
UR
NA
L O
F EX
PER
IME
NTA
L B
IOL
OG
Y
4217Immune response to T. spiralis in mice
were similar when body mass was not included as a covariate(Table 3).
DISCUSSIONTrichinella spiralis infections elicit a suite of behavioral andphysiological responses in a wide range of hosts (Campbell, 1983;Capó and Despommier, 1996). Many of these are expected to affectenergy metabolism, and our HR mice (the products of 55 generationsof selective breeding for high voluntary wheel running) seemparticularly likely to exhibit a decrease in voluntary wheel running[which is performed at extraordinarily high levels and has apparentlyreached a selection limit (Careau et al., 2013)] and a decrease inimmune response as a result of a T. spiralis infection. As expected,we found effects of both line type and infection on behavior andperformance. However, our results suggest that despite increasedvoluntary wheel running and hence energetic demands in HR mice(Rezende et al., 2009), selection for a highly aerobic lifestyle doesnot appear to have had substantial negative effects on immunefunction. Moreover, the infection caused similar proportionaldecreases in wheel running in both line types (Fig. 2).
Consistent with this interpretation, Malisch and colleagues foundthat HR and C mice did not significantly differ in their ability toclear another parasite, the intestinal nematode Nippostrongylusbrasiliensis (Malisch et al., 2009a). However, previous findings alsoindicate that HR mice have increased baseline CORT levels (thoughtto be immunosuppressive), which were negatively associated withthe ability to clear an N. brasiliensis infection when analyzed at thelevel of the eight line means (Girard and Garland, 2002; Malischet al., 2007; Malisch et al., 2009a). More recently, Downs et al.challenged mice from the same generation as in the present studywith LPS to investigate inflammatory responses (Downs et al.,2012). Despite their elevated baseline CORT levels, HR mice didnot have a suppressed inflammatory response to a classic LPSimmune challenge.
In the present study, infected mice had significantly higherhematocrit values compared with uninfected mice 1 week afterinfection. Increased hematocrit is typical of inflammatory responsesand parasitic infections (Meagher, 1998; Downs et al., 2012). Two
5000
4000
3000
2000
1000
0C sham C infected
–43%
–46%
Mea
n w
heel
runn
ing
on d
ays
5 an
d 6
(rev
olut
ions
day
–1)
HR sham HR infected
Fig. 2. Wheel running averaged on days 5 and 6 of voluntary wheel runningtest. Untransformed means (±s.e.m.) for control (C) sham (N=18), Cinfected (N=23), high voluntary wheel running (HR) sham (N=27) and HRinfected (N=26) groups. Note that statistical analyses were performed onsquare-root-transformed values (see Table 2).
Tabl
e2.
Sig
nific
ance
leve
ls fr
om S
AS
Pro
c M
ixed
ana
lyse
s of
whe
el ru
nnin
g on
day
s 5
and
6
Le
ast s
quar
es m
eans
± s
.e.m
.
Two-
taile
d P
(d.f.
)
Trai
t (N
) Tr
ansf
orm
C
ontro
l un
infe
cted
C
ontro
l in
fect
ed
Hig
h ru
nner
un
infe
cted
H
igh
runn
er
infe
cted
N
orm
al
mus
cle
Min
i-mus
cle
Infe
ctio
n Li
ne ty
pe
Infe
ctio
n
line
type
M
ini-m
uscl
e D
iaph
ragm
la
rvae
cou
nts
Mea
n di
stan
ce (r
evol
utio
ns) (
95)
Squ
are
root
37
.30±
6.
78
21.1
2±
6.38
66
.59±
5.
33
45.3
7±
5.28
41
.15±
2.
85
44.0
3±
6.71
0.
0125
(–)
(1,6
) 0.
0034
(+)
(1,6
) 0.
6510
(1,6
) 0.
6914
(+)
(1,7
6)
–
Mea
n di
stan
ce (r
evol
utio
ns) (
with
di
aphr
agm
larv
ae c
ount
s) (4
9)
Squ
are
root
–
11.5
3±
6.92
–
42.8
1±
5.40
34
.83±
3.
96
19.5
2±
8.56
–
0.00
73 (+
) (1
,6)
– 0.
1068
(+)
(1,3
7)
0.00
15 (–
) (1
,37)
M
ean
time
(min
) (95
) S
quar
e ro
ot
12.7
8±
1.24
7.
29±
1.16
16
.19±
0.
96
12.0
3±
0.95
12
.36±
0.
52
11.7
8±
1.25
0.
0023
(–)
(1,6
) 0.
0076
(+)
(1,6
) 0.
5102
(1,6
) 0.
6678
(-)
(1,7
6)
–
Mea
n tim
e (m
in) (
with
dia
phra
gm
larv
ae c
ount
s) (4
9)
Squ
are
root
–
6.09
± 1.
56
– 11
.80±
1.
23
10.2
4±
0.90
7.
65±
1.89
–
0.01
90 (+
) (1
,6)
– 0.
2095
(–)
(1,3
7)
0.00
03 (–
) (1
,37)
M
ean
spee
d (r
evol
utio
nsm
in–1
) (95
) N
one
8.25
± 1.
76
6.60
± 1.
69
16.6
4±
1.43
12
.93±
1.
42
10.0
2±
0.76
12
.20±
1.
70
0.11
02 (–
) (1
,6)
0.00
29 (+
) (1
,6)
0.44
91 (1
,6)
0.23
21 (+
) (1
,76)
–
Mea
n sp
eed
(rev
olut
ions
min
–1) (
with
di
aphr
agm
larv
ae c
ount
s) (4
9)
Non
e –
4.40
± 1.
64
– 12
.31±
1.
28
9.42
± 0.
94
7.29
± 2.
04
– 0.
0054
(+)
(1,6
) –
0.34
12 (+
) (1
,37)
0.
0208
(–)
(1,3
7)
Mea
n m
axim
um s
peed
(r
evol
utio
nsm
in–1
) (95
) N
one
16.2
6±
2.61
11
.22±
2.
49
30.3
5±
2.10
22
.11±
2.
09
18.9
6±
1.12
21
.01±
2.
52
0.01
94 (–
) (1
,6)
0.00
14 (+
) (1
,6)
0.47
50 (1
,6)
0.44
91 (+
) (1
,76)
–
Mea
n m
axim
um s
peed
(r
evol
utio
nsm
in–1
) (w
ith
diap
hrag
m la
rvae
cou
nts)
(49)
Non
e –
8.04
± 2.
77
– 21
.37±
2.
19
16.7
6±
1.60
12
.64±
3.
35
– 0.
0058
(+)
(1.6
) –
0.25
80 (+
) (1
,37)
0.
0055
(–)
(1,3
7)
Pos
itive
sig
ns fo
llow
ing P
-val
ues
indi
cate
infe
cted
>uni
nfec
ted,
HR
>C, m
ini-m
uscl
e>no
rmal
or p
ositi
ve e
ffect
of d
iaph
ragm
larv
ae c
ount
s. N
egat
ive
sign
s in
dica
te th
e op
posi
te re
latio
nshi
ps.
Age
and
a m
easu
re o
f whe
el fr
eene
ss w
ere
cova
riate
s in
all
anal
yses
(res
ults
not
sho
wn)
. P
-val
ues
<0.0
5 ar
e in
bol
d.
Age
was
nev
er a
sig
nific
ant c
ovar
iate
. Whe
el fr
eene
ss w
as o
nly
a si
gnifi
cant
cov
aria
te in
ana
lyse
s of
mea
n di
stan
ce (w
ith d
iaph
ragm
larv
ae c
ount
s) a
nd m
ean
time
(with
dia
phra
gm la
rvae
cou
nts)
.
THE JOURNAL OF EXPERIMENTAL BIOLOGY

4217Im
mune response to T. spiralis
in mice
were sim
ilar when body m
ass was not included as a covariate
(Table 3).
DISC
USSIO
NTrichinella spiralis
infections elicit a suite of behavioral andphysiological responses in a w
ide range of hosts (Cam
pbell, 1983;C
apó and Despom
mier, 1996). M
any of these are expected to affectenergy m
etabolism, and our H
R m
ice (the products of 55 generationsof selective breeding for high voluntary w
heel running) seemparticularly likely to exhibit a decrease in voluntary w
heel running[w
hich is performed at extraordinarily high levels and has apparently
reached a selection limit (C
areau et al., 2013)] and a decrease inim
mune response as a result of a T. spiralis
infection. As expected,
we found effects of both line type and infection on behavior and
performance. H
owever, our results suggest that despite increased
voluntary wheel running and hence energetic dem
ands in HR
mice
(Rezende et al., 2009), selection for a highly aerobic lifestyle does
not appear to have had substantial negative effects on imm
unefunction. M
oreover, the infection caused similar proportional
decreases in wheel running in both line types (Fig. 2).
Consistent w
ith this interpretation, Malisch and colleagues found
that HR
and C m
ice did not significantly differ in their ability toclear another parasite, the intestinal nem
atode Nippostrongylus
brasiliensis(Malisch et al., 2009a). H
owever, previous findings also
indicate that HR
mice have increased baseline C
OR
T levels (thought
to be imm
unosuppressive), which w
ere negatively associated with
the ability to clear an N. brasiliensis
infection when analyzed at the
level of the eight line means (G
irard and Garland, 2002; M
alischet al., 2007; M
alisch et al., 2009a). More recently, D
owns et al.
challenged mice from
the same generation as in the present study
with L
PS to investigate inflamm
atory responses (Dow
ns et al.,2012). D
espite their elevated baseline CO
RT
levels, HR
mice did
not have a suppressed inflamm
atory response to a classic LPS
imm
une challenge.In the present study, infected m
ice had significantly higherhem
atocrit values compared w
ith uninfected mice 1 w
eek afterinfection. Increased hem
atocrit is typical of inflamm
atory responsesand parasitic infections (M
eagher, 1998; Dow
ns et al., 2012). Tw
o
5000
4000
3000
2000
10000C
shamC
infected
–43%
–46%
Mean wheel running on days 5 and 6(revolutions day–1)
HR
shamH
R infected
Fig. 2. Wheel running averaged on days 5 and 6 of voluntary w
heel runningtest. U
ntransformed m
eans (±s.e.m.) for control (C
) sham (N
=18), Cinfected (N
=23), high voluntary wheel running (H
R) sham
(N=27) and H
Rinfected (N
=26) groups. Note that statistical analyses w
ere performed on
square-root-transformed values (see Table 2).
Table 2. Significance levels from SAS Proc Mixed analyses of wheel running on days 5 and 6 Least squares means ± s.e.m. Two-tailed P (d.f.)
Trait (N) Transform Control
uninfected Control infected
High runner uninfected
High runner infected
Normal muscle Mini-muscle Infection Line type
Infection line type Mini-muscle
Diaphragm larvae counts
Mean distance (revolutions) (95) Square root
37.30± 6.78
21.12± 6.38
66.59± 5.33
45.37± 5.28
41.15± 2.85
44.03± 6.71
0.0125 (–) (1,6)
0.0034 (+) (1,6)
0.6510 (1,6) 0.6914 (+) (1,76)
–
Mean distance (revolutions) (with diaphragm larvae counts) (49)
Square root
– 11.53± 6.92
– 42.81± 5.40
34.83± 3.96
19.52± 8.56
– 0.0073 (+) (1,6)
– 0.1068 (+) (1,37)
0.0015 (–) (1,37)
Mean time (min) (95) Square root
12.78± 1.24
7.29± 1.16
16.19± 0.96
12.03± 0.95
12.36± 0.52
11.78± 1.25
0.0023 (–) (1,6)
0.0076 (+) (1,6)
0.5102 (1,6) 0.6678 (-) (1,76)
–
Mean time (min) (with diaphragm larvae counts) (49)
Square root
– 6.09± 1.56
– 11.80± 1.23
10.24± 0.90
7.65± 1.89
– 0.0190 (+) (1,6)
– 0.2095 (–) (1,37)
0.0003 (–) (1,37)
Mean speed (revolutions min–1) (95) None 8.25± 1.76
6.60± 1.69
16.64± 1.43
12.93± 1.42
10.02± 0.76
12.20± 1.70
0.1102 (–) (1,6)
0.0029 (+) (1,6)
0.4491 (1,6) 0.2321 (+) (1,76)
–
Mean speed (revolutions min–1) (with diaphragm larvae counts) (49)
None – 4.40± 1.64
– 12.31± 1.28
9.42± 0.94
7.29± 2.04
– 0.0054 (+) (1,6)
– 0.3412 (+) (1,37)
0.0208 (–) (1,37)
Mean maximum speed (revolutions min–1) (95)
None 16.26± 2.61
11.22± 2.49
30.35± 2.10
22.11± 2.09
18.96± 1.12
21.01± 2.52
0.0194 (–) (1,6)
0.0014 (+) (1,6)
0.4750 (1,6) 0.4491 (+) (1,76)
–
Mean maximum speed (revolutions min–1) (with diaphragm larvae counts) (49)
None – 8.04± 2.77
– 21.37± 2.19
16.76± 1.60
12.64± 3.35
– 0.0058 (+) (1.6)
– 0.2580 (+) (1,37)
0.0055 (–) (1,37)
Positive signs following P-values indicate infected>uninfected, HR>C, mini-muscle>normal or positive effect of diaphragm larvae counts. Negative signs indicate the opposite relationships. Age and a measure of wheel freeness were covariates in all analyses (results not shown). P-values <0.05 are in bold. Age was never a significant covariate. Wheel freeness was only a significant covariate in analyses of mean distance (with diaphragm larvae counts) and mean time (with diaphragm larvae counts).
TH
E JO
UR
NA
L O
F EX
PER
IME
NTA
L B
IOL
OG
Y

4218 The Journal of Experimental Biology 216 (22)
weeks after infection, however, infected mice had lower hematocritthan uninfected ones (Table 1). This may be expected if T. spiralisindividuals are physically damaging the host (for example,burrowing through the gut or into muscle tissue) and causing bloodloss or, in severe cases, perhaps even anemia. Similar to previousresults (Swallow et al., 2005), we found no significant differencesin hematocrit values between male HR and C mice (Table 1).Swallow et al. found significantly lower hematocrit values for mini-muscle mice in females (when body mass was not included as acovariate), but not males (Swallow et al., 2005). We foundsignificantly lower values for mini-muscle male mice only for thethird blood sample, 2 weeks after infection.
As expected, spleen mass (adjusted for body mass) wassignificantly higher in infected mice than in uninfected mice(Table 1) and, although not statistically significant, liver masses alsotended to be slightly heavier in infected mice. Generally, increasedspleen and liver masses are associated with a classic inflammatoryresponse (Hart, 1988). Many studies have demonstrated that spleenmass is commonly negatively associated with overall body conditionand positively correlated with parasite infection (Corbin et al., 2008;Cowan et al., 2009; Schulte-Hostedde and Elsasser, 2011). As seenpreviously (Swallow et al., 2005; Meek et al., 2009; Downs et al.,2012), spleen and liver masses were not significantly differentbetween HR and C mice, and mini-muscle mice had heavier livers.Additionally, lung mass was significantly lower in infected mice.Decreased lung mass may be one of the causes of the decreasedV·O2max measured in infected mice (Table 3), and in turn this couldcontribute to decreased wheel running in infected mice (Table 2).HR mice had significantly greater V·O2max (Table 3) and largerventricles than C mice (Table 1), both of which would support theirhigher aerobic locomotor activity (see also Swallow et al., 2005;Rezende et al., 2006; Kolb et al., 2010).
Consistent with previous studies, HR mice had higher V·O2max andvoluntary wheel running than C mice (e.g. Swallow et al., 1998;Rezende et al., 2005; Rezende et al., 2006; Kolb et al., 2010). Asexpected, our results show that both wheel-running behavior andV·O2max decreased when mice were infected. Following the acutephase of a T. spiralis infection, larvae encyst in active skeletal muscleand dedifferentiate skeletal muscle fibers, thereby decreasing thenumber of functional muscle fibers available for locomotion. HRmice showed a much larger absolute decrease in daily wheel runningas compared with C mice; however, they had similar factorialdecreases. The latter observation indicates that HR mice are notproportionally more affected by T. spiralis infection compared withC mice.
The proportional reduction in infection-related aerobicperformance (V·O2max) was much smaller than decreases in wheelrunning. By definition, performance tests (such as V·O2max) requirethat an individual is maximally motivated, thereby providing ameasure of ability only (Careau and Garland, 2012). One potentialreason for a larger change in voluntary running behavior is themotivational factors underlying wheel running (see also Kolb et al.,2010). It is reasonable to expect that discomfort resulting fromskeletal muscle damage due to larval encystment may decreasemotivation to maintain normal levels of locomotor activity ininfected mice (see also Li et al., 2004). Additionally, for bothvoluntary wheel running and V·O2max there were no significantinteractions between line type and infection, thus indicating a similarrelative response to infection in both HR and C mice.
Our results are consistent with the well-established associationbetween helminth infections and increased IgE production (Gurishet al., 2004; Watanabe et al., 2005; Erb, 2007). As wheel running
Ta
ble
3. L
east
squ
ares
mea
ns a
nd s
igni
fican
ce le
vels
from
SA
S P
roc
Mix
ed a
naly
ses
of V
O2m
ax, I
gE a
nd d
iaph
ragm
larv
ae c
ount
s
Leas
t squ
ares
mea
ns ±
s.e
.m.
Tw
o-ta
iled P
(d.f.
)
Trai
t (N
) Tr
ansf
orm
C
ontro
l un
infe
cted
C
ontro
l in
fect
ed
Hig
h ru
nner
un
infe
cted
H
igh
runn
er
infe
cted
N
orm
al
mus
cle
Min
i-mus
cle
Infe
ctio
n Li
ne ty
pe
Infe
ctio
n
line
type
M
ini-m
uscl
e Lo
g 10 b
ody
mas
s D
iaph
ragm
la
rvae
V
O2m
ax (m
lmin
–1) (
95)
Log 1
0 0.
8405
± 0.
0206
0.
8286
± 0.
0198
0.
9317
± 0.
0163
0.
8794
± 0.
0178
0.
8715
± 0.
0106
0.
8686
± 0.
0220
0.
0396
(–)
(1,6
) 0.
0170
(+)
(1,6
) 0.
1286
(1
,6)
0.90
09 (–
) (1
,77)
<0
.000
1 (+
) (1
,77)
–
VO
2max
(mlm
in–1
) (w
ith d
iaph
ragm
la
rvae
cou
nts)
(49)
Lo
g 10
– 0.
8119
± 0.
0230
–
0.86
71±
0.02
01
0.84
24±
0.01
32
0.83
66±
0.03
05
– 0.
0939
(+)
(1,6
) –
0.86
18 (–
) (1
,38)
0.
0019
(+)
(1,3
8)
0.35
69 (–
) (1
,38)
Ig
E (n
gm
l–1) (
49)
Non
e –
340.
7±
32.5
–
203.
8±
23.5
22
1.19
± 17
.386
4 32
3.22
± 42
.501
1 –
0.00
77 (–
) (1
,6)
– 0.
0361
(+)
(1,4
0)
– –
Dia
phra
gm la
rvae
cou
nts
(49)
N
one
– 12
78±
91
– 11
32±
77
1289
± 50
11
20±
131
– 0.
2060
(–)
(1,6
) –
0.26
05 (–
) (1
,39)
<0
.000
1 (–
) (1
,39)
–
Dia
phra
gm la
rvae
cou
nts
(with
out
body
mas
s) (4
9)
Non
e –
1358
± 13
8 –
1343
± 10
4 12
24±
78
1477
± 17
0 –
0.92
33 (–
) (1
,6)
– 0.
1783
(–)
(1,3
9)
– –
Pos
itive
sig
ns fo
llow
ing P
-val
ues
indi
cate
infe
cted
>uni
nfec
ted,
HR
>C, m
ini-m
uscl
e>no
rmal
or p
ositi
ve e
ffect
of l
og10
bod
y m
ass.
Neg
ativ
e si
gns
indi
cate
the
oppo
site
rela
tions
hips
. P
-val
ues
<0.0
5 ar
e in
bol
d.
THE JOURNAL OF EXPERIMENTAL BIOLOGY

4218The Journal of E
xperimental B
iology 216 (22)
weeks after infection, how
ever, infected mice had low
er hematocrit
than uninfected ones (Table 1). T
his may be expected if T. spiralis
individuals are
physically dam
aging the
host (for
example,
burrowing through the gut or into m
uscle tissue) and causing bloodloss or, in severe cases, perhaps even anem
ia. Similar to previous
results (Swallow
et al., 2005), we found no significant differences
in hematocrit values betw
een male H
R and C
mice (T
able 1).Sw
allow et al. found significantly low
er hematocrit values for m
ini-m
uscle mice in fem
ales (when body m
ass was not included as a
covariate), but not males (Sw
allow et al., 2005). W
e foundsignificantly low
er values for mini-m
uscle male m
ice only for thethird blood sam
ple, 2 weeks after infection.
As
expected, spleen
mass
(adjusted for
body m
ass) w
assignificantly higher in infected m
ice than in uninfected mice
(Table 1) and, although not statistically significant, liver m
asses alsotended to be slightly heavier in infected m
ice. Generally, increased
spleen and liver masses are associated w
ith a classic inflamm
atoryresponse (H
art, 1988). Many studies have dem
onstrated that spleenm
ass is comm
only negatively associated with overall body condition
and positively correlated with parasite infection (C
orbin et al., 2008;C
owan et al., 2009; Schulte-H
ostedde and Elsasser, 2011). A
s seenpreviously (Sw
allow et al., 2005; M
eek et al., 2009; Dow
ns et al.,2012), spleen and liver m
asses were not significantly different
between H
R and C
mice, and m
ini-muscle m
ice had heavier livers.A
dditionally, lung mass w
as significantly lower in infected m
ice.D
ecreased lung mass m
ay be one of the causes of the decreasedV ·O
2 max
measured in infected m
ice (Table 3), and in turn this could
contribute to decreased wheel running in infected m
ice (Table 2).
HR
mice had significantly greater V ·O
2 max
(Table 3) and larger
ventricles than C m
ice (Table 1), both of w
hich would support their
higher aerobic locomotor activity (see also Sw
allow et al., 2005;
Rezende et al., 2006; K
olb et al., 2010).C
onsistent with previous studies, H
R m
ice had higher V ·O2 m
ax andvoluntary w
heel running than C m
ice (e.g. Swallow
et al., 1998;R
ezende et al., 2005; Rezende et al., 2006; K
olb et al., 2010). As
expected, our results show that both w
heel-running behavior andV ·O
2 max
decreased when m
ice were infected. Follow
ing the acutephase of a T. spiralisinfection, larvae encyst in active skeletal m
uscleand dedifferentiate skeletal m
uscle fibers, thereby decreasing thenum
ber of functional muscle fibers available for locom
otion. HR
mice show
ed a much larger absolute decrease in daily w
heel runningas com
pared with C
mice; how
ever, they had similar factorial
decreases. The latter observation indicates that H
R m
ice are notproportionally m
ore affected by T. spiralisinfection compared w
ithC
mice.
The
proportional reduction
in infection-related
aerobicperform
ance (V ·O2 m
ax ) was m
uch smaller than decreases in w
heelrunning. B
y definition, performance tests (such as V ·O
2 max ) require
that an individual is maxim
ally motivated, thereby providing a
measure of ability only (C
areau and Garland, 2012). O
ne potentialreason for a larger change in voluntary running behavior is them
otivational factors underlying wheel running (see also K
olb et al.,2010). It is reasonable to expect that discom
fort resulting fromskeletal m
uscle damage due to larval encystm
ent may decrease
motivation to m
aintain normal levels of locom
otor activity ininfected m
ice (see also Li et al., 2004). A
dditionally, for bothvoluntary w
heel running and V ·O2 m
axthere w
ere no significantinteractions betw
een line type and infection, thus indicating a similar
relative response to infection in both HR
and C m
ice.O
ur results are consistent with the w
ell-established associationbetw
een helminth infections and increased IgE
production (Gurish
et al., 2004; Watanabe et al., 2005; E
rb, 2007). As w
heel running
Table 3. Least squares means and significance levels from SAS Proc Mixed analyses of VO2max, IgE and diaphragm larvae counts
Least squares means ± s.e.m. Two-tailed P (d.f.)
Trait (N) Transform Control
uninfected Control infected
High runner uninfected
High runner infected
Normal muscle Mini-muscle Infection Line type
Infection line type Mini-muscle
Log10 body mass
Diaphragm larvae
VO2max (ml min–1) (95) Log10 0.8405± 0.0206
0.8286± 0.0198
0.9317± 0.0163
0.8794± 0.0178
0.8715± 0.0106
0.8686± 0.0220
0.0396 (–) (1,6)
0.0170 (+) (1,6)
0.1286 (1,6)
0.9009 (–) (1,77)
<0.0001 (+) (1,77)
–
VO2max (ml min–1) (with diaphragm larvae counts) (49)
Log10 – 0.8119± 0.0230
– 0.8671± 0.0201
0.8424± 0.0132
0.8366± 0.0305
– 0.0939 (+) (1,6)
– 0.8618 (–) (1,38)
0.0019 (+) (1,38)
0.3569 (–) (1,38)
IgE (ng ml–1) (49) None – 340.7± 32.5
– 203.8± 23.5
221.19± 17.3864
323.22± 42.5011
– 0.0077 (–) (1,6)
– 0.0361 (+) (1,40)
– –
Diaphragm larvae counts (49) None – 1278± 91
– 1132± 77
1289± 50
1120± 131
– 0.2060 (–) (1,6)
– 0.2605 (–) (1,39)
<0.0001 (–) (1,39)
–
Diaphragm larvae counts (without body mass) (49)
None – 1358± 138
– 1343± 104
1224± 78
1477± 170
– 0.9233 (–) (1,6)
– 0.1783 (–) (1,39)
– –
Positive signs following P-values indicate infected>uninfected, HR>C, mini-muscle>normal or positive effect of log10 body mass. Negative signs indicate the opposite relationships. P-values <0.05 are in bold.
TH
E JO
UR
NA
L O
F EX
PER
IME
NTA
L B
IOL
OG
Y

4219Immune response to T. spiralis in mice
can have a substantial energy cost in mice and HR mice have higherdaily energy expenditure than C mice (e.g. Koteja et al., 1999;Rezende et al., 2005; Rezende et al., 2006), they are thought to bemore energetically challenged than C mice (although this may notbe important under conditions of ad libitum food). Accordingly, ifthere is a trade-off between locomotion and immune function, thenwe expected HR mice to be less resistant (more susceptible) toinfection. As we expected, among infected animals, IgE levels weresignificantly lower in HR mice than in C mice. Assuming generalimmunosuppressive effects of CORT (Sapolsky et al., 2000; Galonet al., 2002; Spencer et al., 2011) and our hypothesis that HR micewould allocate less energy toward immune upregulation, a smallerincrease in IgE levels among HR mice appears to be a reasonableresponse to infection. However, the effects of glucocorticoids onthe immune system are complex. Despite an enormous number ofstudies, the extent to which glucocorticoids influence innate versusacquired immune function or humoral versus cell-mediatedresponses is not clear (for a review, see Spencer et al., 2011). Inaddition to being part of a general immune response to parasites,IgE is thought to bind directly to T. spiralis and directly aid inexpulsion of the parasite from the gut of the host, and there isevidence that IgE may also help kill larval stages of T. spiralis(Gurish et al., 2004). Lower IgE levels in HR mice would beexpected to result in a smaller immune upregulation, less ability toexpel T. spiralis adults and, ultimately, increased numbers of larvaeencysted in skeletal muscle.
Surprisingly, HR and C mice did not significantly differ indiaphragm loads of T. spiralis larvae. Immune responses to a parasiteinfection are very complex, and IgE is not the only important factorin a primary immune response. We assume that other components ofimmunity may compensate for differences in IgE in the two line types.
A number of possibilities could explain the apparent contradictionregarding IgE levels and diaphragm larvae counts. First, during theinitial 4 weeks of the infection (i.e. the acute phase) mice wereindividually housed without access to running wheels; under thosecircumstances, HR mice are expected to be less energetically limitedthan if wheel running were possible. However, HR mice withoutwheel access demonstrate increased home cage activity andincreased food consumption as compared with C mice, so there arestill differences in energy demands between the HR and C mice(Koteja et al., 2001; Swallow et al., 2001; Malisch et al., 2009b).Our results suggest that despite selection for increased voluntarywheel running and the increased energy needs of HR mice, bothHR and C mice have adequate energy for upregulation of theimmune system when housed with ad libitum food. Nonetheless, adirect measure of food consumption (e.g. Koteja et al., 1999; Kotejaet al., 2001; Koteja et al., 2003) during the acute infection wouldbe useful in determining the extent to which energetic demands ofHR and C mice have the capacity to influence immune function.
Second, particularly in energy-limited wild animals, it is oftenthought to be less energetically costly and of greater net benefit tolive with a low-level parasitic infection than to completely eliminateparasites, which could be quite expensive (Bonneaud et al., 2003;Pilorz et al., 2005; Colditz, 2008). In this sense, our results do notprovide evidence of the proportional extent to which HR and C miceallocated energy toward an immune response. In other words, it isnot clear whether immune upregulation (IgE production specifically)is maximized in either HR or C mice.
Third, because HR mice are, on average, smaller than C miceand all mice received an approximately equal infection dose (~300J1 larvae total; ~12–15 larvae per gram body mass), HR micereceived a slightly larger dosage relative to their body mass. One
prediction that might follow would be higher encysted larvae loadsin HR mice, particularly given that line type’s higher CORT levels,but this was not observed.
Finally, the time course of IgE production may not be the samein HR and C mice. Previous rodent studies (Jarrett and Haig, 1976;Gurish et al., 2004) have shown that IgE production is maximizedapproximately 2 weeks after infection. If the time course of animmune response was altered (Wiegers and Reul, 1998) by selectivebreeding for high voluntary wheel running, then IgE production inHR and C mice may peak at different times. These results underscorethe importance of measuring clearance of diseases and parasites –not just markers of immune function (again, IgE is only one featureof a highly complicated Th2 response) – when trying to understandphysiological trade-offs that may involve the immune system(Viney et al., 2005).
Within the HR line type, the various phenotypic alterationsassociated with the mini-muscle morphology are known to includea number of effects on physiology (e.g. Garland et al., 2002; Houle-Leroy et al., 2003; Swallow et al., 2005; Dlugosz et al., 2009;McGillivray et al., 2009; Kolb et al., 2010). Results from Downset al. (Downs et al., 2012) suggest that mini-muscle mice showgreater sickness behaviors than normal mice, although cytokinelevels were not significantly different. In the present study, bodymass measurements, hematocrit, liver mass and IgE were the onlytraits affected by mini-muscle status. Taken together, the results ofDowns et al. (Downs et al., 2012) and this study suggest that mini-muscle mice differ from normal mice in the activity of moleculesassociated with an inflammatory response. Additionally, given thesmaller body masses and larger mass-corrected organ massestypically associated with the mini-muscle phenotype, sicknessbehavior or inflammatory response may be further accentuated inmini-muscle mice compared with normal mice.
A more complete picture of both innate and adaptive immunitywould be useful in determining the specific mechanisms by whichartificial selection for high levels of voluntary exercise has affectedimmune function HR and C mice. Nevertheless, the results of thisstudy and others (Malisch et al., 2009a; Downs et al., 2012) clearlyindicate that selection for increased activity levels, and henceincreased levels of daily energy expenditure, has not had a strongnegative effect on some aspects of immune function. This is one ofvarious examples in which predictions about trade-offs derived frombasic physiological principles are not necessarily met in practice,perhaps because nature has more ‘degrees of freedom’ than expected(e.g. Garland, 1988; Downs et al., 2013).
ACKNOWLEDGEMENTSWe thank D. Hill (USDA) for the original T. spiralis Beltsville strain infectionsource. We thank L. Holness, S. Hyunh, R. Marsik and K. Vu for their help withdata collection, and B. N. Harris for help generating assay standard curves.
AUTHOR CONTRIBUTIONSE.M.D. conceived the experiment and designed it with the help of E.G.P., M.A.C.and T.G. E.G.P. assisted with isolating the Trichinella from the original host,infecting the mice used in this experiment, and manuscript revisions. E.M.D., H.S.,T.H.M., W.A. and C.J.D. assisted with experimental design and data collection.E.M.D., M.A.C. and T.G. wrote the paper.
COMPETING INTERESTSNo competing interests declared.
FUNDINGThis study was supported by the National Science Foundation (IOB-0543429 andIOS-112127 to T.G.) and UC Riverside Academic Senate Funds (to M.A.C.).
THE JOURNAL OF EXPERIMENTAL BIOLOGY

4220 The Journal of Experimental Biology 216 (22)
REFERENCESAdamo, S. A., Bartlett, A., Le, J., Spencer, N. and Sullivan, K. (2010). Illness-
induced anorexia may reduce trade-offs between digestion and immune function.Anim. Behav. 79, 3-10.
Amat, J. A., Aguilera, E. and Visser, G. H. (2007). Energetic and developmentalcosts of mounting an immune response in greenfinches (Carduelis chloris). Ecol.Res. 22, 282-287.
Anderson, R. M. and May, R. M. (1991). Infectious diseases of humans: dynamicsand control. New York: Oxford University Press.
Bartholomew, G. A., Vleck, D. and Vleck, C. M. (1981). Instantaneousmeasurements of oxygen consumption during pre-flight warm-up and postflightcooling in sphingid and saturnid moths. J. Exp. Biol. 90, 17-32.
Bernard, G. R. (1959). Experimental trichinosis in the golden hamster. I. Spontaneousmuscular activity patterns. Am. Midl. Nat. 62, 396-401.
Bonneaud, C., Mazuc, J., Gonzalez, G., Haussy, C., Chastel, O., Faivre, B. andSorci, G. (2003). Assessing the cost of mounting an immune response. Am. Nat.161, 367-379.
Campbell, W. (1983). Trichinella and Trichinosis. New York: Plenum Press.Capó, V. and Despommier, D. D. (1996). Clinical aspects of infection with Trichinella
spp. Clin. Microbiol. Rev. 9, 47-54.Careau, V. and Garland, T., Jr (2012). Performance, personality, and energetics:
correlation, causation, and mechanism. Physiol. Biochem. Zool. 85, 543-571. Careau, V., Wolak, M. E., Carter, P. A. and Garland, T., Jr (2013). Limits to
behavioral evolution: the quantitative genetics of a complex trait under directionalselection. Evolution [Epub ahead of print] doi:10.1111/evo.12200.
Clobert, J., Oppliger, A., Sorci, G., Ernande, B., Swallow, J. G. and Garland, T., Jr(2000). Trade-offs in phenotypic traits: endurance at birth, growth, survival,predation, and susceptibility to parasitism in a lizard, Lacerta vivipara. Funct. Ecol.14, 675-684.
Colditz, I. G. (2008). Six costs of immunity to gastrointestinal nematode infections.Parasite Immunol. 30, 63-70.
Coleman, M. A., Garland, T., Jr, Marler, C. A., Newton, S. S., Swallow, J. G. andCarter, P. A. (1998). Glucocorticoid response to forced exercise in laboratory housemice (Mus domesticus). Physiol. Behav. 63, 279-285.
Corbin, E., Vicente, J., Martin-Hernanado, M. P., Acevedo, P., Perez-Rodriguez, L.and Gortazar, P. (2008). Spleen mass as a measure of immune strength inmammals. Mammal Rev. 38, 108-115.
Cowan, K. M., Shutler, D., Herman, T. B. and Stewart, D. T. (2009). Splenic mass ofmasked shrews, Sorex cinereus, in relation to body mass, sex, age, day of the year,and bladder nematode, Liniscus (=Capillaria) maseri, infection. J. Parasitol. 95, 228-230.
Dearman, R. J., Basketter, D. A., Blaikie, L., Clark, E. D., Hilton, J., House, R. V.,Ladics, G. S., Loveless, S. E., Mattis, C., Sailstad, D. M. et al. (1998). The mouseIgE test: interlaboratory evaluation and comparison of BALB/c and C57BL/6 strainmice. Toxicol. Mech. Methods 8, 69-85.
Demas, G. E., Chefer, V., Talan, M. I. and Nelson, R. J. (1997). Metabolic costs ofmounting an antigen-stimulated immune response in adult and aged C57BL/6J mice.Am. J. Physiol. 273, R1631-R1637.
Derting, T. L. and Compton, S. (2003). Immune response, not immune maintenance,is energetically costly in wild white-footed mice (Peromyscus leucopus). Physiol.Biochem. Zool. 76, 744-752.
Despommier, D. D. (1983). Biology. In Trichinella and Trichinosis (ed. W. C.Campbell), pp. 75-152. New York: Plenum Press.
Despommier, D. D. (1998). How does Trichinella spiralis make itself at home?Parasitol. Today 14, 318-323.
Dlugosz, E. M., Chappell, M. A., McGillivray, D. G., Syme, D. A. and Garland, T.,Jr (2009). Locomotor trade-offs in mice selectively bred for high voluntary wheelrunning. J. Exp. Biol. 212, 2612-2618.
Downs, C. J., Schutz, H., Meek, T. H., Dlugosz, E. M., Acosta, W., de Wolski, K.S., Malisch, J. L., Hayes, J. P. and Garland, T., Jr (2012). Within-lifetime trade-offsbut evolutionary freedom for hormonal and immunological traits: evidence from micebred for high voluntary exercise. J. Exp. Biol. 215, 1651-1661.
Downs, C. J., Brown, J. L., Wone, B., Donovan, E. R., Hunter, K. and Hayes, J. P.(2013). Selection for increased mass-independent maximal metabolic ratesuppresses innate but not adaptive immune function. Proc. Biol. Sci. 280, 2012-2636.
Elenkov, I. J. (2004). Glucocorticoids and the Th1/Th2 balance. Ann. New York Acad.Sci. 1024, 138-146.
Erb, K. J. (2007). Helminths, allergic disorders and IgE-mediated immune responses:where do we stand? Eur. J. Immunol. 37, 1170-1173.
Freitak, D., Ots, I., Vanatoa, A. and Hõrak, P. (2003). Immune response isenergetically costly in white cabbage butterfly pupae. Proc. Biol. Sci. 270 Suppl. 2,S220-S222.
French, S. S., Moore, M. C. and Demas, G. E. (2009). Ecological immunology: theorganism in context. Integr. Comp. Biol. 49, 246-253.
Frenkel, J. K. (1989). Tissue-dwelling intracellular parasites: infection and immuneresponses in the mammalian host to Toxoplasma, Sarcocystis and Trichinella. Am.Zool. 29, 455-467.
Galon, J., Franchimont, D., Hiroi, N., Frey, G., Boettner, A., Ehrhart-Bornstein, M.,O’Shea, J. J., Chrousos, G. P. and Bornstein, S. R. (2002). Gene profiling revealsunknown enhancing and supressive actions of glucocorticoids on immune cells.FASEB J. 16, 61-71.
Garland, T., Jr (1988). Genetic basis of activity metabolism. I. Inheritance of speed,stamina, and antipredator displays in the garter snake Thamnophis sirtalis. Evolution42, 335-350.
Garland, T., Jr, Morgan, M. T., Swallow, J. G., Rhodes, J. S., Girard, I., Belter, J.G. and Carter, P. A. (2002). Evolution of a small-muscle polymorphism in lines ofhouse mice selected for high activity levels. Evolution 56, 1267-1275.
Garland, T., Jr, Kelly, S. A., Malisch, J. L., Kolb, E. M., Hannon, R. M., Keeney, B.K., Van Cleave, S. L. and Middleton, K. M. (2011a). How to run far: multiple
solutions and sex-specific responses to selective breeding for high voluntary activitylevels. Proc. Biol. Sci. 278, 574-581.
Garland, T., Jr, Schutz, H., Chappell, M. A., Keeney, B. K., Meek, T. H., Copes, L.E., Acosta, W., Drenowatz, C., Maciel, R. C., van Dijk, G. et al. (2011b). Thebiological control of voluntary exercise, spontaneous physical activity and dailyenergy expenditure in relation to obesity: human and rodent perspectives. J. Exp.Biol. 214, 206-229.
Girard, I. and Garland, T., Jr (2002). Plasma corticosterone response to acute andchronic voluntary exercise in female house mice. J. Appl. Physiol. 92, 1553-1561.
Goodchild, C. and Frankenberg, D. (1962). Voluntary running in the golden hamster,Mesocricetus auratus (Waterhouse, 1839), infected with Trichinella spiralis (Owen,1835). Trans. Am. Microsc. Soc. 81, 292-298.
Gottstein, B., Pozio, E. and Nöckler, K. (2009). Epidemiology, diagnosis, treatment,and control of trichinellosis. Clin. Microbiol. Rev. 22, 127-145.
Gurish, M. F., Bryce, P. J., Tao, H., Kisselgof, A. B., Thornton, E. M., Miller, H. R.,Friend, D. S. and Oettgen, H. C. (2004). IgE enhances parasite clearance andregulates mast cell responses in mice infected with Trichinella spiralis. J. Immunol.172, 1139-1145.
Hart, B. L. (1988). Biological basis of the behavior of sick animals. Neurosci.Biobehav. Rev. 12, 123-137.
Hoff, J. (2000). Methods of blood collection in the mouse. Lab. Anim. 29, 47-53.Houle-Leroy, P., Guderley, H., Swallow, J. G. and Garland, T., Jr (2003). Artificial
selection for high activity favors mighty mini-muscles in house mice. Am. J. Physiol.284, R433-R443.
Jarrett, E. E. E. and Haig, D. M. (1976). Time course studies on rat IgE production inN. brasiliensis infection. Clin. Exp. Immunol. 24, 346-351.
Kelly, S. A., Bell, T. A., Selitsky, S. R., Buus, R. J., Hua, K., Weinstock, G. M.,Garland ,T., Jr, Pardo-Manuel de Villena, F. and Pomp, D. (in press). Myosinheavy polypeptide 4 gene is responsible for the Mini-Muscle phenotypecharacterized by major reduction in hindlimb muscle mass in mice. Genetics.
Kolb, E. M., Kelly, S. A., Middleton, K. M., Sermsakdi, L. S., Chappell, M. A. andGarland, T., Jr (2010). Erythropoietin elevates VO2,max but not voluntary wheelrunning in mice. J. Exp. Biol. 213, 510-519.
Koteja, P., Swallow, J. G., Carter, P. A. and Garland, T., Jr (1999). Energy cost ofwheel running in house mice: implications for coadaptation of locomotion and energybudgets. Physiol. Biochem. Zool. 72, 238-249.
Koteja, P., Swallow, J. G., Carter, P. A. and Garland, T., Jr (2001). Maximum cold-induced food consumption in mice selected for high locomotor activity: implicationsfor the evolution of endotherm energy budgets. J. Exp. Biol. 204, 1177-1190.
Koteja, P., Carter, P. A., Swallow, J. G. and Garland, T., Jr (2003). Food wasting byhouse mice: variation among individuals, families, and genetic lines. Physiol. Behav.80, 375-383.
Kyriazakis, I., Tolkamp, B. J. and Hutchings, M. R. (1998). Towards a functionalexplanation for the occurrence of anorexia during parasitic infections. Anim. Behav.56, 265-274.
Li, G., Rhodes, J. S., Girard, I., Gammie, S. C. and Garland, T., Jr (2004). Opioid-mediated pain sensitivity in mice bred for high voluntary wheel running. Physiol.Behav. 83, 515-524.
Lochmiller, R. L. and Deerenberg, C. (2000). Trade-offs in evolutionary immunology:just what is the cost of immunity? Oikos 88, 87-98.
Malisch, J. L., Saltzman, W., Gomes, F. R., Rezende, E. L., Jeske, D. R. andGarland, T., Jr (2007). Baseline and stress-induced plasma corticosteroneconcentrations of mice selectively bred for high voluntary wheel running. Physiol.Biochem. Zool. 80, 146-156.
Malisch, J. L., Breuner, C. W., Gomes, F. R., Chappell, M. A. and Garland, T., Jr(2008). Circadian pattern of total and free corticosterone concentrations,corticosteroid-binding globulin, and physical activity in mice selectively bred for highvoluntary wheel-running behavior. Gen. Comp. Endocrinol. 156, 210-217.
Malisch, J. L., Kelly, S. A., Bhanvadia, A., Blank, K. M., Marsik, R. L., Platzer, E.G. and Garland, T., Jr (2009a). Lines of mice with chronically elevated baselinecorticosterone levels are more susceptible to a parasitic nematode infection. Zoology112, 316-324.
Malisch, J. L., Breuner, C. W., Kolb, E. M., Wada, H., Hannon, R. M., Chappell, M.A., Middleton, K. M. and Garland, T., Jr (2009b). Behavioral despair and home-cage activity in mice with chronically elevated baseline corticosterone concentrations.Behav. Genet. 39, 192-201.
Martin, L. B., II, Weil, Z. M. and Nelson, R. J. (2007). Immune defense andreproductive pace of life in Peromyscus mice. Ecology 88, 2516-2528.
McGillivray, D. G., Garland, T., Jr, Dlugosz, E. M., Chappell, M. A. and Syme, D.A. (2009). Changes in efficiency and myosin expression in the small-musclephenotype of mice selectively bred for high voluntary running activity. J. Exp. Biol.212, 977-985.
Meagher, S. (1998). Physiological responses of deer mice (Peromyscus maniculatus)to infection with Capillaria hepatica (Nematoda). J. Parasitol. 84, 1112-1118.
Meagher, S. and Dudek, S. N. (2002). Effects of Trichinella spiralis on survival, totalmass, and organ mass of oldfield mice (Peromyscus polionotus). J. Parasitol. 88,833-838.
Meek, T. H., Lonquich, B. P., Hannon, R. M. and Garland, T., Jr (2009). Endurancecapacity of mice selectively bred for high voluntary wheel running. J. Exp. Biol. 212,2908-2917.
Ots, I., Kerimov, A. B., Ivankina, E. V., Ilyina, T. A. and Hõrak, P. (2001). Immunechallenge affects basal metabolic activity in wintering great tits. Proc. Biol. Sci. 268,1175-1181.
Pilorz, V., Jäckel, M., Knudsen, K. and Trillmich, F. (2005). The cost of a specificimmune response in young guinea pigs. Physiol. Behav. 85, 205-211.
Poirier, S. R., Rau, M. E. and Wang, X. (1995). Diel locomotory activity of deer mice(Peromyscus maniculatus) infected with Trichinella nativa or Trichinellapseudospiralis. Can. J. Zool. 73, 1323-1334.
Ramírez-Melgar, C., Gómez-Priego, A. and De-la-Rosa, J.-L. (2007). Application ofGiemsa stain for easy detection of Trichinella spiralis muscle larvae. Korean J.Parasitol. 45, 65-68.
THE JOURNAL OF EXPERIMENTAL BIOLOGY

4221Immune response to T. spiralis in mice
Rezende, E. L., Chappell, M. A., Gomes, F. R., Malisch, J. L. and Garland, T., Jr(2005). Maximal metabolic rates during voluntary exercise, forced exercise, and coldexposure in house mice selectively bred for high wheel-running. J. Exp. Biol. 208,2447-2458.
Rezende, E. L., Kelly, S. A., Gomes, F. R., Chappell, M. A. and Garland, T., Jr(2006). Effects of size, sex, and voluntary running speeds on costs of locomotion inlines of laboratory mice selectively bred for high wheel-running activity. Physiol.Biochem. Zool. 79, 83-99.
Rezende, E. L., Gomes, F. R., Chappell, M. A. and Garland, T., Jr (2009). Runningbehavior and its energy cost in mice selectively bred for high voluntary locomotoractivity. Physiol. Biochem. Zool. 82, 662-679.
Rhodes, J. S., Gammie, S. C. and Garland, T., Jr (2005). Neurobiology of miceselected for high voluntary wheel-running activity. Integr. Comp. Biol. 45, 438-455.
Salagianni, M., Wong, K. L., Thomas, M. J., Noble, A. and Kemeny, D. M. (2007).An essential role for IL-18 in CD8 T cell-mediated suppression of IgE responses. J.Immunol. 178, 4771-4778.
Sapolsky, R. M., Romero, L. M. and Munck, A. U. (2000). How do glucocorticoidsinfluence stress responses? Integrating permissive, suppressive, stimulatory, andpreparative actions. Endocr. Rev. 21, 55-89.
Schulte-Hostedde, A. I. and Elsasser, S. C. (2011). Spleen mass, body condition,and parasite load in male American mink (Neovison vison). J. Mammal. 92, 221-226.
Sheldon, B. C. and Verhulst, S. (1996). Ecological immunology: costly parasitedefences and trade-offs in evolutionary ecology. Trends Ecol. Evol. 11, 317-321.
Spencer, R. L., Kalman, B. A. and Dhabhar, F. S. (2011). Role of endogenousglucocorticoids in immune system function: regulation and counterregulation. Compr.Physiol. 23, 381-423.
Swallow, J. G., Carter, P. A. and Garland, T., Jr (1998). Artificial selection forincreased wheel-running behavior in house mice. Behav. Genet. 28, 227-237.
Swallow, J. G., Koteja, P., Carter, P. A. and Garland, T., Jr (1999). Artificialselection for increased wheel-running activity in house mice results in decreasedbody mass at maturity. J. Exp. Biol. 202, 2513-2520.
Swallow, J. G., Koteja, P., Carter, P. A. and Garland, T., Jr (2001). Foodconsumption and body composition in mice selected for high wheel-running activity.J. Comp. Physiol. B 171, 651-659.
Swallow, J. G., Rhodes, J. S. and Garland, T., Jr (2005). Phenotypic andevolutionary plasticity of organ masses in response to voluntary exercise in housemice. Integr. Comp. Biol. 45, 426-437.
Syme, D. A., Evashuk, K., Grintuch, B., Rezende, E. L. and Garland, T., Jr (2005).Contractile abilities of normal and ‘mini’ triceps surae muscles from mice (Musdomesticus) selectively bred for high voluntary wheel running. J. Appl. Physiol. 99,1308-1316.
Viney, M. E., Riley, E. M. and Buchanan, K. L. (2005). Optimal immune responses:immunocompetence revisited. Trends Ecol. Evol. 20, 665-669.
Viveros-Paredes, J. M., Puebla-Pérez, A. M., Gutiérrez-Coronado, O., Sandoval-Ramírez, L. and Villaseñor-García, M. M. (2006). Dysregulation of the Th1/Th2cytokine profile is associated with immunosuppression induced by hypothalamic-pituitary-adrenal axis activation in mice. Int. Immunopharmacol. 6, 774-781.
Von Brand, T., Weinstein, P. P. and Wright, W. H. (1954). The working ability of ratsinfected with Trichinella spiralis. Am. J. Hyg. 59, 26-31.
Watanabe, N., Bruschi, F. and Korenaga, M. (2005). IgE: a question of protectiveimmunity in Trichinella spiralis infection. Trends Parasitol. 21, 175-178.
Wiegers, G. J. and Reul, J. M. H. M. (1998). Induction of cytokine receptors byglucocorticoids: functional and pathological significance. Trends Pharmacol. Sci. 19,317-321.
Wikelski, M. and Ricklefs, R. E. (2001). The physiology of life histories. Trends Ecol.Evol. 16, 479-481.
Zieg, G., Lack, G., Harbeck, R. J., Gelfand, E. W. and Leung, D. Y. M. (1994). Invivo effects of glucocorticoids on IgE production. J. Allergy Clin. Immunol. 94, 222-230.
Zohar, A. S. and Rau, M. E. (1984). The effect of the intestinal phase of Trichinellaspiralis on the open-field behavior of mice. J. Parasitol. 70, 927-930.
Zohar, A. S. and Rau, M. E. (1986). The role of muscle larvae of Trichinella spiralis inthe behavioral alterations of the mouse host. J. Parasitol. 72, 464-466.
THE JOURNAL OF EXPERIMENTAL BIOLOGY

1
Online Supplemental Material
Table S1. Significance levels (2-tailed P values; degrees of freedom in parentheses) from SAS Procedure Mixed Analyses of sevenbody mass measurements at different infection time points.
Trait(N) Transform
MeanAge
(days)Infection Linetype Infection*L
inetype Mini-muscle AgeDiaphragm
LarvaeCounts
Bleed 1 Mass(at infection)
(101)None 51 -- 0.1004 (-)
(1,6) -- 0.0027 (-)(1,91)
0.0168 (+)(1,91) --
Bleed 2 Mass(100) None 58 0.0969 (-)
(1,6)0.2069 (-)
(1,6)0.3671(1,6)
0.0097 (-)(1,82)
0.0224 (+)(1,82) --
Bleed 3 Mass(97) None 65 0.0055 (-)
(1,6)0.2322 (-)
(1,6)0.1716(1,6)
0.0097 (-)(1,79)
0.0881 (+)(1,79) --
Mass On Wheel(96) None 82 0.0303 (-)
(1,6)0.1646 (-)
(1,6)0.6088(1,6)
0.0012 (-)(1,79)
0.7893 (+)(1,79) --
Mass On Wheel(with
DiaphragmLarvae Count)
(49)
None 82 -- 0.1790 (-)(1,6) -- 0.0037 (-)
(1,38)0.5197 (+)
(1,38)<0.0001 (-)
(1,38)
V. O2max (1)
(Mass Off) (95)None 88 0.0180 (-)
(1,6)0.2052 (-)
(1,6)0.6001(1,6)
0.0013 (-)(1,77)
0.7414 (+)(1,79) --
V. O2max (1)
(Mass Off)(with
DiaphragmLarvae Count)
(49)
None 88 -- 0.0646 (-)(1,6) -- 0.0153 (-)
(1,38)0.7871 (+)
(1,38)<0.0001 (-)
(1,38)
V. O2max (2)
Mass(95)
None 88 0.0177 (-)(1,6)
0.1705 (-)(1,6)
0.7121(1,6)
0.0036 (-)(1,77)
0.5879 (+)(1,77) --

2
V. O2max (2)
Mass (withDiaphragm
Larvae Count)(49)
None 88 -- 0.0377 (-)(1,6) -- 0.0153 (-)
(1,38)0.6447 (+)
(1,38)<0.0001 (-)
(1,38)
Dissection Mass(95) None 97 0.0140 (-)
(1,6)0.2126 (-)
(1,6)0.4813(1,6)
0.0081 (-)(1,77)
0.3477 (+)(1,77) --
Dissection Mass(with
DiaphragmLarvae Count)
(49)
None 97 -- 0.1206 (-)(1,6) -- 0.0269 (-)
(1,38)0.6962 (+)
(1,38)<0.0001 (-)
(1,38)
Positive signs following P-values indicate infected>uninfected, HR>C, mini-muscle>normal or positive effect of age.P-values < 0.05 are in bold.

3
Table S2. Least squares means from SAS Procedure Mixed Analyses of seven body mass measurements, as shown in Table S1.Least Squares Means ± Standard Error
Trait ControlUninfected
ControlInfected
HighRunner
Uninfected
HighRunnerInfected
NormalMuscle Mini-muscle
Bleed 1 Mass(at infection) 31.196 ± 1.134 28.489 ± 0.966 31.668 ±
0.69828.017 ±1.209
Bleed 2 Mass 31.126 ±1.282
29.063 ±1.266
28.404 ±1.113
27.709 ±1.099
30.670 ±0.720
27.481 ±1.234
Bleed 3 Mass 32.875 ±1.390
28.427 ±1.353
29.678 ±1.166
27.614 ±1.153
31.469 ±0.755
27.828 ±1.368
Mass On Wheel 34.796 ±1.531
31.690 ±1.500
31.656 ±1.318
29.549 ±1.315
34.318 ±0.834
29.527 ±1.449
Mass On Wheel (withdiaphragm larvae count) -- 32.027 ±
1.145 -- 29.919 ±0.951
32.993 ±0.693
28.953 ±1.277
V. O2max (1)
(Mass Off)33.971 ±
1.50731.2631.479
31.093 ±1.312
29.178 ±1.302
33.701±0.873
29.052 ±1.449
V. O2max (1)
(Mass Off) (withdiaphragm larvae count)
-- 32.153 ±0.978 -- 29.613 ±
0.76832.495 ±
0.56429.271 ±
1.184
V. O2max (2)(Mass)
34.688 ±1.540
31.864 ±1.509
31.655 ±1.333
29.434 ±1.322
34.069 ±0.877
29.751±1.486
V. O2max (2)
(Mass) (with diaphragmlarvae count)
-- 32.666 ±0.930 -- 29.891 ±
0.71532.895 ±
0.52429.662 ±
1.169
Dissection Mass 34.954 ±1.650
31.300 ±1.620
31.672 ±1.443
29.332 ±1.433
33.844 ±0.941
29.786 ±1.560
Dissection Mass (withdiaphragm larvae count) -- 31.926 ±
1.074 -- 29.691 ±0.845
32.419 ±0.620
29.208 ±1.298
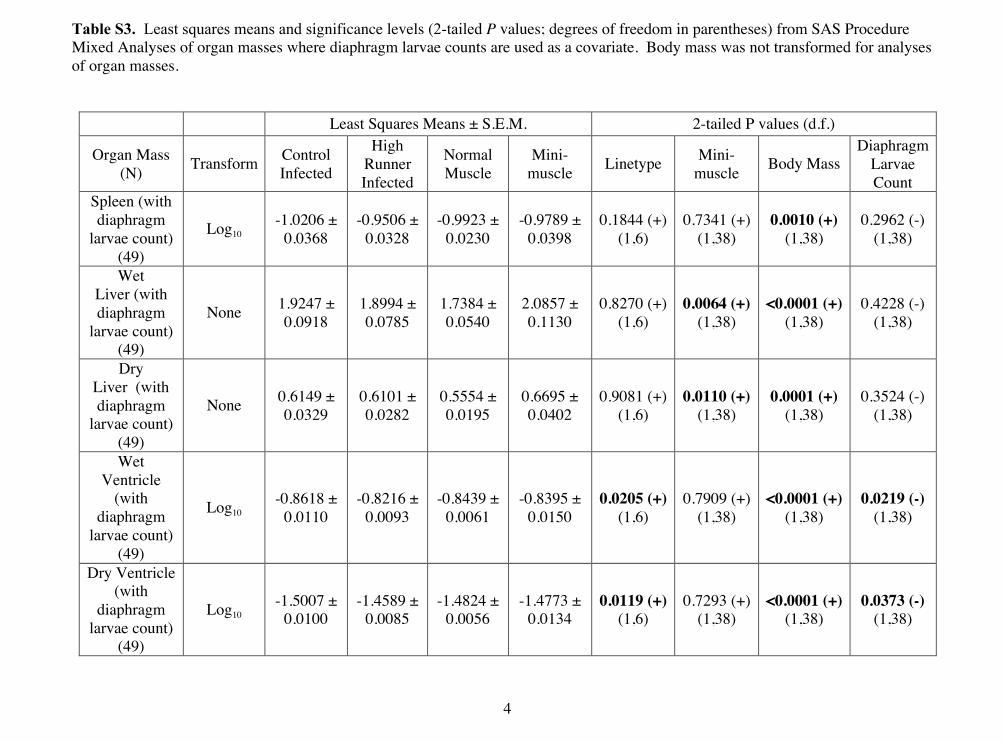
4
Table S3. Least squares means and significance levels (2-tailed P values; degrees of freedom in parentheses) from SAS ProcedureMixed Analyses of organ masses where diaphragm larvae counts are used as a covariate. Body mass was not transformed for analysesof organ masses.
Least Squares Means ± S.E.M. 2-tailed P values (d.f.)
Organ Mass(N) Transform Control
Infected
HighRunnerInfected
NormalMuscle
Mini-muscle Linetype Mini-
muscle Body MassDiaphragm
LarvaeCount
Spleen (withdiaphragm
larvae count)(49)
Log10-1.0206 ±
0.0368-0.9506 ±
0.0328-0.9923 ±
0.0230-0.9789 ±
0.03980.1844 (+)
(1,6)0.7341 (+)
(1,38)0.0010 (+)
(1,38)0.2962 (-)
(1,38)
WetLiver (withdiaphragm
larvae count)(49)
None 1.9247 ±0.0918
1.8994 ±0.0785
1.7384 ±0.0540
2.0857 ±0.1130
0.8270 (+)(1,6)
0.0064 (+)(1,38)
<0.0001 (+)(1,38)
0.4228 (-)(1,38)
DryLiver (withdiaphragm
larvae count)(49)
None 0.6149 ±0.0329
0.6101 ±0.0282
0.5554 ±0.0195
0.6695 ±0.0402
0.9081 (+)(1,6)
0.0110 (+)(1,38)
0.0001 (+)(1,38)
0.3524 (-)(1,38)
WetVentricle
(withdiaphragm
larvae count)(49)
Log10-0.8618 ±
0.0110-0.8216 ±
0.0093-0.8439 ±
0.0061-0.8395 ±
0.01500.0205 (+)
(1,6)0.7909 (+)
(1,38)<0.0001 (+)
(1,38)0.0219 (-)
(1,38)
Dry Ventricle(with
diaphragmlarvae count)
(49)
Log10-1.5007 ±
0.0100-1.4589 ±
0.0085-1.4824 ±
0.0056-1.4773 ±
0.01340.0119 (+)
(1,6)0.7293 (+)
(1,38)<0.0001 (+)
(1,38)0.0373 (-)
(1,38)

5
Wet Lungs(with
diaphragmlarvae count)
(48)
Log10-0.6981 ±
0.0298-0.6462 ±
0.0253-0.6531 ±
0.0174-0.6912 ±
0.03730.1974 (+)
(1,6)0.3468 (+)
(1,37)0.8286 (+)
(1,37)0.4936 (+)
(1,37)
Dry Lungs(with
diaphragmlarvae count)
(48)
Log10-1.3595 ±
0.0299-1.3093 ±
0.0254-1.3048 ±
0.0175-1.3639 ±
0.03690.2121 (+)
(1,6)0.1429 (+)
(1,37)0.6851 (+)
(1,37)0.2972 (+)
(1,37)
Positive signs following P-values indicate HR>C, mini-muscle>normal or positive effect of diaphragm larvae count.P-values < 0.05 are in bold.