Embed Size (px)
Citation preview

BANKS BU
LLE
TIN
Year I • No. 2 • September • 2001
2CROATIAN NATIONAL BANK

Croatian National Bank
Banks Bulletin

Croatian National BankPublishing DepartmentTrg hrvatskih velikana 310002 ZagrebPhone: 385-1-4564-555Contact phone: 385-1-4922-070, 385-1-4922-077Fax: 385-1-4873-623
PUBLISHER
WEB http://www.hnb.hr
EDITOR-IN-CHIEF ^edo Maleti}
EDITORIAL BOARD Mladen DulibaSnje`ana LevarBoris Nini}
EDITOR Romana Sinkovi}
TECHNICAL EDITORS Bo`idar BengezSlavko Kri`njak
TRNSLATION Tamara Kova~evi}Sandra Papac
ASSOCIATE Ines Merkl
PRINTED BY Poslovna knjiga d.o.o., Zagreb
Those using data from this publicationare requested to cite the source.
Printed in 500 copies
ISSN 1333-1043

Zagreb 2001
BANKSBULLETIN
Croatian National Bank
5
BANKS BULLETIN
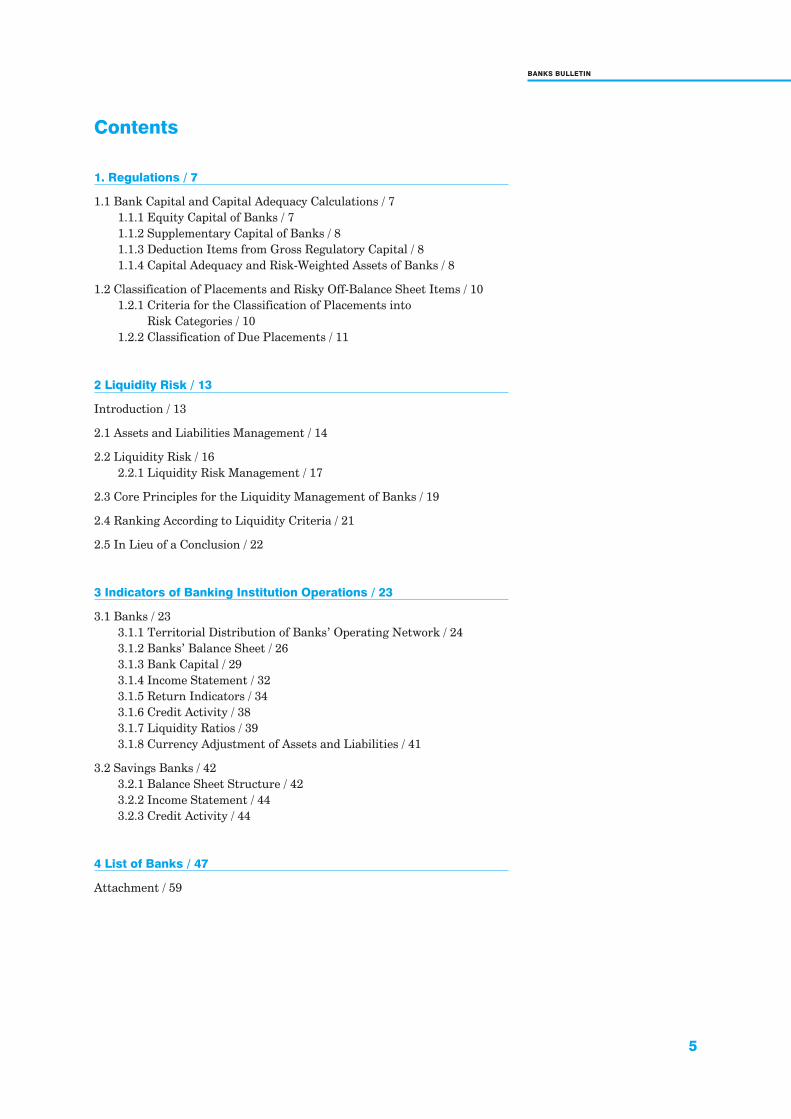
Contents
1. Regulations / 7
1.1 Bank Capital and Capital Adequacy Calculations / 71.1.1 Equity Capital of Banks / 71.1.2 Supplementary Capital of Banks / 81.1.3 Deduction Items from Gross Regulatory Capital / 81.1.4 Capital Adequacy and Risk-Weighted Assets of Banks / 8
1.2 Classification of Placements and Risky Off-Balance Sheet Items / 101.2.1 Criteria for the Classification of Placements into
Risk Categories / 101.2.2 Classification of Due Placements / 11
2 Liquidity Risk / 13
Introduction / 13
2.1 Assets and Liabilities Management / 14
2.2 Liquidity Risk / 162.2.1 Liquidity Risk Management / 17
2.3 Core Principles for the Liquidity Management of Banks / 19
2.4 Ranking According to Liquidity Criteria / 21
2.5 In Lieu of a Conclusion / 22
3 Indicators of Banking Institution Operations / 23
3.1 Banks / 233.1.1 Territorial Distribution of Banks’ Operating Network / 243.1.2 Banks’ Balance Sheet / 263.1.3 Bank Capital / 293.1.4 Income Statement / 323.1.5 Return Indicators / 343.1.6 Credit Activity / 383.1.7 Liquidity Ratios / 393.1.8 Currency Adjustment of Assets and Liabilities / 41
3.2 Savings Banks / 423.2.1 Balance Sheet Structure / 423.2.2 Income Statement / 443.2.3 Credit Activity / 44
4 List of Banks / 47
Attachment / 59

6
CROATIAN NATIONAL BANK
7
REGULATIONS
1. RegulationsAuthor: \uro Vrga
The previous issue of the Banks Bulletin outlines the main determinants ofthe current Banking Law and the regulations enacted during 1999 on the ba-sis of that Law. This issue of the Bulletin summarizes the major amendmentsto the regulations enacted during 2000. These amendments are primarily re-lated to the calculation of capital and its adequacy and classification of place-ments according to degrees of risk.
1.1 Bank Capitaland CapitalAdequacyCalculations
The Decision on the Methodology for Calculating Bank Capital and the Deci-sion on the Methodology for Calculating the Capital Adequacy andRisk-Weighted Assets of Banks were published in Narodne novine1, No. 32/99,and were applied as of April 1, 1999. By the end of 2000, the amendments tothese Decisions were enacted. These amendments were published in Narodne
novine, No. 101/2000, and have been applied as of January 1, 2001.
1.1.1 Equity Capital ofBanks
The amendments to the regulation on the methodology for calculating bankcapital partly altered the component parts of equity capital, as well as thestructure of deduction items from equity capital, which is shown in the over-view below.
Component Parts and Deduction Items from Bank’s Equity Capital
Prior to Amendments Following Amendments
Component Parts of Equity Capital
� paid-in capital raised by selling bank’s own common
and preference shares
� paid-in capital raised by selling bank’s shares apart
from cumulative preference shares
� reserves � reserves
� retained income � retained income
� profit for the current year � profit for the current year
� capital gain (loss) � capital gain
� reserve for repurchased own shares � reserve for own shares
Deduction Items from Equity Capital
� previous years’ losses � previous years’ losses
� loss for the current year when capital is calculated
during the year
� loss for the current year
� capital loss incurred by trading own shares
� intangible assets such as goodwill, licenses, patents
and trademarks
� intangible assets such as goodwill, licenses, patents
and trademarks
� repurchased own common and preference shares � acquired own shares, excluding cumulative preference
shares (Art. 233, 237 and 238 of the Company Law)
� claims and contingent liabilities secured by bank’s
own common and preference shares
� loans used for the purchase of bank’s shares � unpaid amount of a loan which was directly
or indirectly granted by a bank for the purchase
of bank’s shares apart from cumulative preference
shares
1 Official gazette of the Republic of Croatia;
hereinafter Narodne novine.

8
BANKS BULLETIN
1.1.2 SupplementaryCapital of Banks
Alterations in the component parts of equity capital required a certain adjust-ment of the component parts of supplementary capital, presented in the tablebelow.
Component Parts and Deduction Items from Bank’s Supplementary Capital
Prior to Amendments Following Amendments
Component Parts of Supplementary Capital
� paid-in capital raised by selling cumulative preference
shares
� specific reserves for unidentified losses � specific reserves for unidentified losses
� hybrid instruments � hybrid instruments
� subordinated instruments � subordinated instruments
Deduction Items from Supplementary Capital
� acquired own cumulative preference shares
� specific reserves exceeding 1.50 percent of
risk-weighted assets
� specific reserves exceeding 1.50 percent of
risk-weighted assets
� subordinated instruments exceeding 50 percent
of equity capital
� subordinated instruments exceeding 50 percent
of equity capital
� claims secured by hybrid and subordinated
instruments
� claims secured by hybrid and subordinated
instruments
� unpaid amount of a loan used to purchase cumulative
preference shares of a bank
1.1.3 Deduction Itemsfrom Gross RegulatoryCapital
Indirect investments in other banks as a deduction item from gross regula-tory capital were previously determined on the basis of a bank’s majority own-
ership of a company that invested in another bank. According to the amendedDecision, indirect investments of a bank encompass investments of branches– juridical persons which are under the bank’s control, in shares and other fi-nancial instruments included in another bank’s regulatory capital.
Additionally, the definition of direct and indirect investments of banks inshares and other financial instruments included in another bank’s regulatorycapital has been changed, comprising at present only direct and indirect in-vestments in other domestic banks, in contrast to the previous practice of re-ducing capital by all investments both in domestic and foreign banks. It isconsidered that such a calculation will provide a more realistic amount of thetotal regulatory capital in the Croatian banking system.
1.1.4 Capital Adequacyand Risk-WeightedAssets of Banks
The amendments to the regulations on the methodology for calculating capi-tal adequacy and risk-weighted assets of banks assure a more appropriate riskassessment in the banking operations. Furthermore, this is a step forward inthe compliance with the EU directives and standards of the Basel Committeeon Banking Supervision related to the bank capital adequacy calculation.
Regarding capital adequacy calculation, two major changes have been intro-duced:
(a) 75 percent risk-weight for balance sheet items has been eliminated (thisrisk-weight applied to claims on state-owned companies whose losses werecovered from the central government budget);
(b) higher credit conversion factors were introduced for some off-balancesheet items.
There were two reasons for eliminating the 75 percent risk-weight. Firstly, itsimplementation in practice was questionable, since rather than applying therisk-weight automatically to claims on all state-owned companies, a proof wasrequired that funds for covering losses of an individual company were assured
9
REGULATIONS
within the budget. Taking this into account, the conclusion is reached thatthis risk-weight could be applied in very rare situations and that it influencedthe banks’ capital adequacy ratio only to a small extent.
Secondly, the elimination of the 75 percent risk-weight is a step forward inthe compliance with the regulations of the international community, whichdo not apply this risk-weight, i.e. according to which, companies in state own-ership are treated identically to companies in private ownership when weight-ing risk assets.
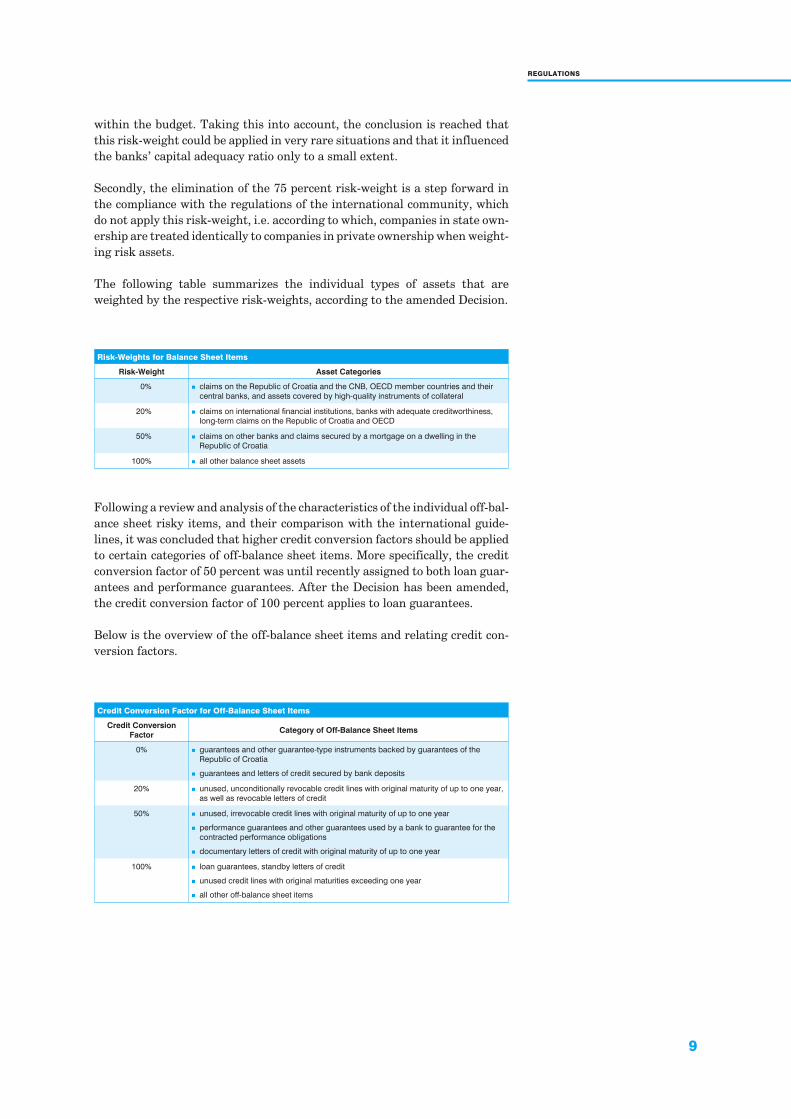
The following table summarizes the individual types of assets that areweighted by the respective risk-weights, according to the amended Decision.
Risk-Weights for Balance Sheet Items
Risk-Weight Asset Categories
0% � claims on the Republic of Croatia and the CNB, OECD member countries and their
central banks, and assets covered by high-quality instruments of collateral
20% � claims on international financial institutions, banks with adequate creditworthiness,
long-term claims on the Republic of Croatia and OECD
50% � claims on other banks and claims secured by a mortgage on a dwelling in the
Republic of Croatia
100% � all other balance sheet assets
Following a review and analysis of the characteristics of the individual off-bal-ance sheet risky items, and their comparison with the international guide-lines, it was concluded that higher credit conversion factors should be appliedto certain categories of off-balance sheet items. More specifically, the creditconversion factor of 50 percent was until recently assigned to both loan guar-antees and performance guarantees. After the Decision has been amended,the credit conversion factor of 100 percent applies to loan guarantees.
Below is the overview of the off-balance sheet items and relating credit con-version factors.
Credit Conversion Factor for Off-Balance Sheet Items
Credit Conversion
FactorCategory of Off-Balance Sheet Items
0% � guarantees and other guarantee-type instruments backed by guarantees of the
Republic of Croatia
� guarantees and letters of credit secured by bank deposits
20% � unused, unconditionally revocable credit lines with original maturity of up to one year,
as well as revocable letters of credit
50% � unused, irrevocable credit lines with original maturity of up to one year
� performance guarantees and other guarantees used by a bank to guarantee for the
contracted performance obligations
� documentary letters of credit with original maturity of up to one year
100% � loan guarantees, standby letters of credit
� unused credit lines with original maturities exceeding one year
� all other off-balance sheet items
10
BANKS BULLETIN
1.2 Classificationof Placementsand RiskyOff-Balance SheetItems
The Decision on the Classification of Placements and Risky Off-Balance SheetItems and Assessment of Bank Exposure was published in Narodne novine,
No. 32/99, and was applied as of April 1, 1999. By the end of 2000, amend-ments to this Decision were adopted and published in Narodne novine, No.101/2000, prescribing January 1, 2001 as the date of application.
1.2.1 Criteria for theClassification ofPlacements into RiskCategories
One of the most important amendments to the Decision is the relatively lessstrict criteria that have to be satisfied for classifying a placement into risk cat-egory A.
In general, debtors, i.e. placements, meeting the following requirements cu-mulatively could previously be classified into risk category A:
a) whose financial position does not compromise further operations andmeeting of their obligations within the due date (appropriate credit-worthiness of a debtor);
b) placements to debtors that are secured by high quality instruments of col-lateral.
This general principle of classifying placements into risk category A has beenretained, but the amendments to the Decision allow for the exceptional classi-fication of an individual placement, i.e. debtor, into risk category A in specialcircumstances (which have to be properly documented) if only one of theabove criteria is fulfilled.
Specifically, if the creditworthiness of a bank debtor is unquestionable and ifit alone represents a sufficient instrument of collateral, a bank can classifysuch a placement into risk category A without requesting an additional for-mal instrument of collateral. An individual placement can also be graded Awhen a debtor with a poorer creditworthiness offers a high quality collateralwhich will, in case the debtor fails to meet their obligation, assure bank collec-tion of its claim by activating this instrument of collateral.
The more flexible criteria set for the classification of placements into risk cat-egory A create more room for banks to classify placements into an appropriaterisk category in the most realistic and objective manner (taking into accountthe given circumstances and specific characteristics of each placement, i.e.debtor), and thus to determine the realistic basis for the calculation and for-mation of the reserves required for covering the losses incurred from riskyplacements. This, however, also implies the increased accountability of banksfor the adequate classification of placements, based on objectively assessedrisk.
The criteria for the classification of placements into risk category B have re-mained unchanged, whereas the criteria for the classification into risk catego-ries C, D, and E have been only to some extent complemented by more preciseformulations of the existing provisions.
Other significant amendments to this part are those related to the redefini-tion of the term restructuring of claims, as well as the criteria for the classifi-cation of these placements into risk categories.
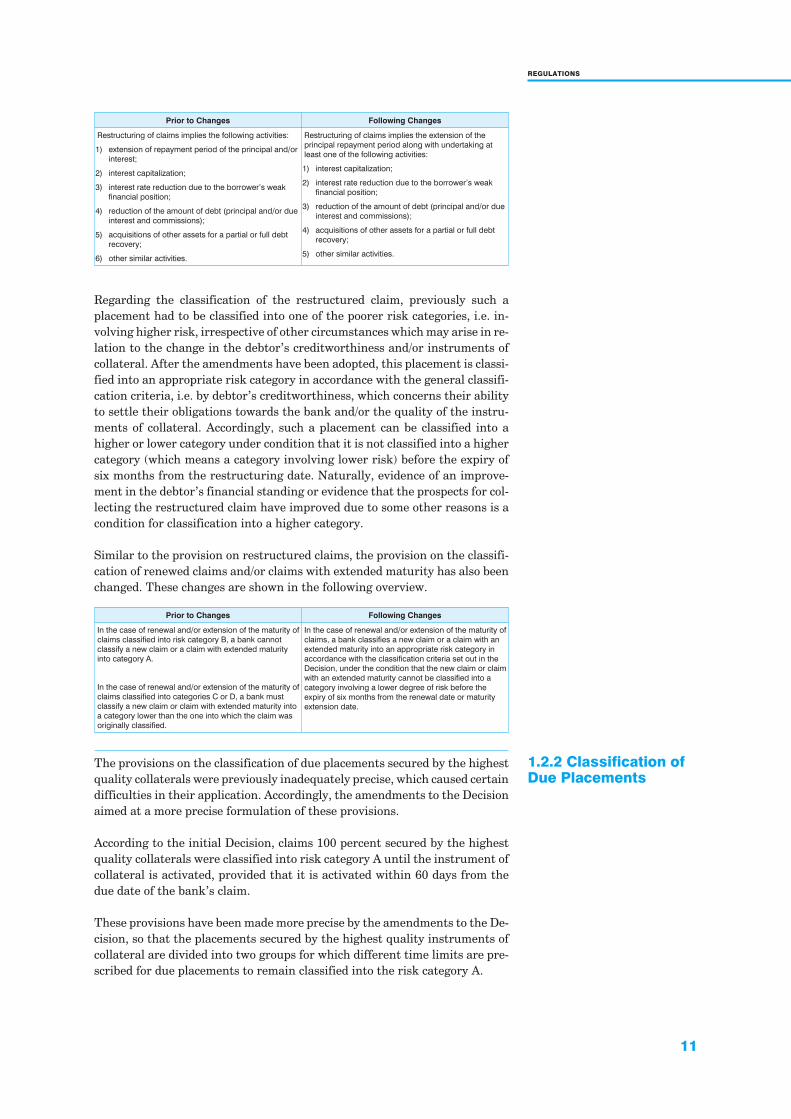
The changes in the definition of the term restructuring of claims are shown inthe following overview.
11
REGULATIONS
Regarding the classification of the restructured claim, previously such aplacement had to be classified into one of the poorer risk categories, i.e. in-volving higher risk, irrespective of other circumstances which may arise in re-lation to the change in the debtor’s creditworthiness and/or instruments ofcollateral. After the amendments have been adopted, this placement is classi-fied into an appropriate risk category in accordance with the general classifi-cation criteria, i.e. by debtor’s creditworthiness, which concerns their abilityto settle their obligations towards the bank and/or the quality of the instru-ments of collateral. Accordingly, such a placement can be classified into ahigher or lower category under condition that it is not classified into a highercategory (which means a category involving lower risk) before the expiry ofsix months from the restructuring date. Naturally, evidence of an improve-ment in the debtor’s financial standing or evidence that the prospects for col-lecting the restructured claim have improved due to some other reasons is acondition for classification into a higher category.
Similar to the provision on restructured claims, the provision on the classifi-cation of renewed claims and/or claims with extended maturity has also beenchanged. These changes are shown in the following overview.
Prior to Changes Following Changes
Restructuring of claims implies the following activities:
1) extension of repayment period of the principal and/or
interest;
2) interest capitalization;
3) interest rate reduction due to the borrower’s weak
financial position;
4) reduction of the amount of debt (principal and/or due
interest and commissions);
5) acquisitions of other assets for a partial or full debt
recovery;
6) other similar activities.
Restructuring of claims implies the extension of the
principal repayment period along with undertaking at
least one of the following activities:
1) interest capitalization;
2) interest rate reduction due to the borrower’s weak
financial position;
3) reduction of the amount of debt (principal and/or due
interest and commissions);
4) acquisitions of other assets for a partial or full debt
recovery;
5) other similar activities.
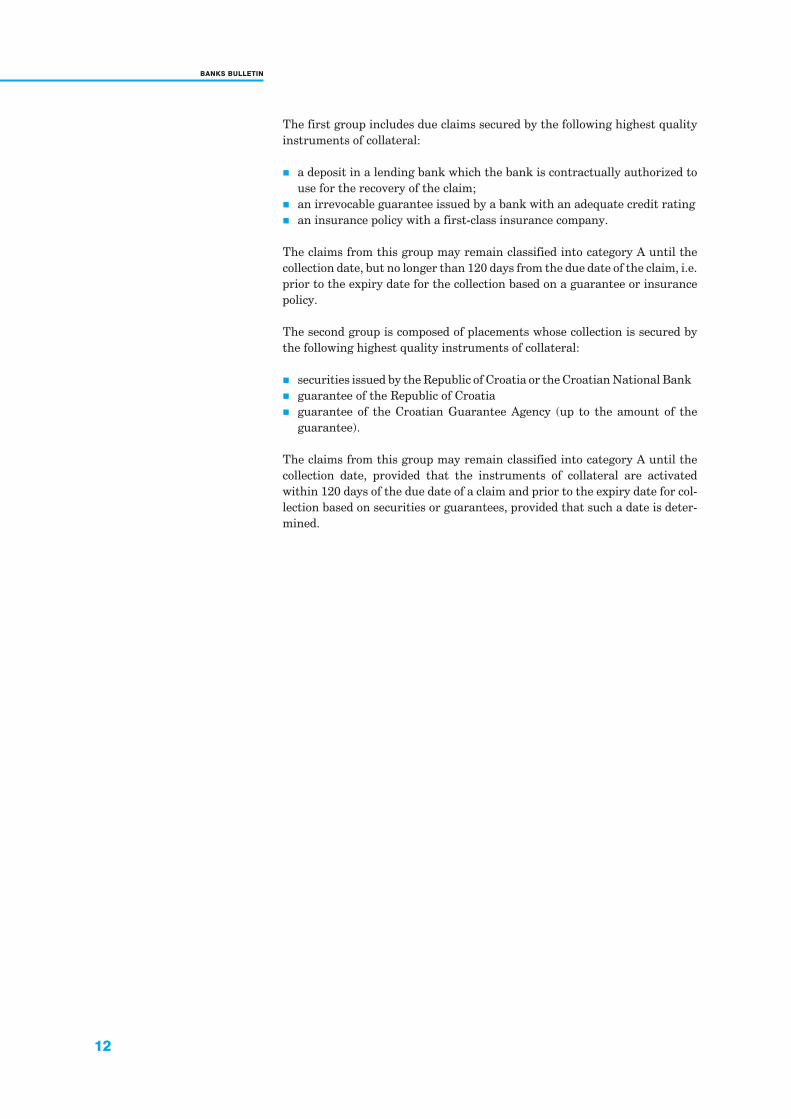
Prior to Changes Following Changes
In the case of renewal and/or extension of the maturity of
claims classified into risk category B, a bank cannot
classify a new claim or a claim with extended maturity
into category A.
In the case of renewal and/or extension of the maturity of
claims classified into categories C or D, a bank must
classify a new claim or claim with extended maturity into
a category lower than the one into which the claim was
originally classified.
In the case of renewal and/or extension of the maturity of
claims, a bank classifies a new claim or a claim with an
extended maturity into an appropriate risk category in
accordance with the classification criteria set out in the
Decision, under the condition that the new claim or claim
with an extended maturity cannot be classified into a
category involving a lower degree of risk before the
expiry of six months from the renewal date or maturity
extension date.
1.2.2 Classification ofDue Placements
The provisions on the classification of due placements secured by the highestquality collaterals were previously inadequately precise, which caused certaindifficulties in their application. Accordingly, the amendments to the Decisionaimed at a more precise formulation of these provisions.
According to the initial Decision, claims 100 percent secured by the highestquality collaterals were classified into risk category A until the instrument ofcollateral is activated, provided that it is activated within 60 days from thedue date of the bank’s claim.
These provisions have been made more precise by the amendments to the De-cision, so that the placements secured by the highest quality instruments ofcollateral are divided into two groups for which different time limits are pre-scribed for due placements to remain classified into the risk category A.
12
BANKS BULLETIN
The first group includes due claims secured by the following highest qualityinstruments of collateral:
� a deposit in a lending bank which the bank is contractually authorized touse for the recovery of the claim;
� an irrevocable guarantee issued by a bank with an adequate credit rating� an insurance policy with a first-class insurance company.
The claims from this group may remain classified into category A until thecollection date, but no longer than 120 days from the due date of the claim, i.e.prior to the expiry date for the collection based on a guarantee or insurancepolicy.
The second group is composed of placements whose collection is secured bythe following highest quality instruments of collateral:
� securities issued by the Republic of Croatia or the Croatian National Bank� guarantee of the Republic of Croatia� guarantee of the Croatian Guarantee Agency (up to the amount of the
guarantee).
The claims from this group may remain classified into category A until thecollection date, provided that the instruments of collateral are activatedwithin 120 days of the due date of a claim and prior to the expiry date for col-lection based on securities or guarantees, provided that such a date is deter-mined.
13
LIQUIDITY RISK
The most commonly quoted definition of liquidity is that it is a company’sability to provide the cash required for the settlement of its due liabilities. Re-garding the liquidity of banks as specific companies, liquidity is generally de-fined as the ability to provide the required cash primarily through the bank’shighly liquid assets at a reasonable cost and in a timely manner, whether forthe purpose of asset growth or for settling due liabilities.
Within the integrated development of a company, i.e. integrated managementsystem, there are four main criteria1:
� liquidity� success� present success potential� future success potential
As we can see, liquidity is the first and foremost criterion, representing theshortest-term management measure. More specifically, it is a survival crite-rion defined in economic and legal terms, implying that a company cannot beestablished without liquid assets (which particularly refers to banks, sincethe basic condition for their establishment is the minimum equity capital incash). Almost the same applies to companies that cannot assure liquid assets –such companies face a crisis which often ends in bankruptcy.
Liquidity risk and its management is one of the management segments whichin a broader context is called funds management or assets and liabilitiesmanagement2, and which, apart from liquidity risk, encompasses interest raterisk, currency risk3 and reputation risk. It is sometimes believed that fundsmanagement should be included in capital adequacy risk, which we hold justi-fied, since capital is the most stable source, permanently assuring liquidity.
A summary of liquidity risk management within the process of assets and lia-bility management is given below, as well as the supervisory requirements forsound practices for liquidity management, the most important techniques fordetermining liquidity risk and the most important liquidity ratios, and fi-nally, the core principles for ranking banks relative to their liquidity positionand risk management competence.
2 Liquidity Risk
Author: Milan Potkonjak
1 Osmanagi} Bedenik (1993), p. 53.
2 There are various interpretations in profes-
sional literature, according to which assets
and liabilities management represents a
“broader” aspect of this issue. Assets and lia-
bilities management, according to these
views, represents a broader and a more com-
plex analysis and assessment of a bank’s po-
sition in a certain market taking into account
risks to which the bank is exposed in its oper-
ation (the determined credit risk and its analy-
sis in the context of other risks are pointed
out). The term funds management is used to
refer to a “deeper” analysis of the aforemen-
tioned risks, which is beyond the scope of
this report.
3 Interest rate and currency risk together are
frequently referred to in the literature as mar-
ket risk, although the assessment of market
risk includes other segments, such as key
products offered in a particular market and
their competitiveness and profitability.
Introduction
14
BANKS BULLETIN
Assets and liabilities management is basic to sound banking planning and fi-nancial management. It focuses on two main aspects: profitability and risk.As previously mentioned, assets and liabilities management includes marketrisk management (interest rate and currency risk), liquidity risk, reputationrisk and capital risk (as the most important and stable source of funds).
A well-designed and realistic strategic plan (five-year plan) should be the ba-sis of any assets and liabilities management program. On the basis of such aplan, detailed one-year plans are elaborated, as well as operating plans thatare drawn up for each month, quarter and semester. It is crucial to monitorthe achievement of targets and analyze the achieved results in order to set re-alistic tasks. In order to devise high quality, attainable, both long-term andshort-term, operating plans (daily, weekly, monthly, quarterly, etc.), a moni-toring system and data recording system (statistics) must be established.They will provide high quality data for writing reports, determining ratiosand indicators, and adequately analyzing the achieved results and unrealizedtargets. The basic point is to establish why a plan was incorrectly defined andwhy it was not accomplished, and to undertake measures in response to thefailure to accomplish the plan, i.e. to propose and issue decisions on correctingand amending the existing plans and defined targets, methods, proceduresand measures for their realization. Sound planning, monitoring and report-ing on the actual results and the analysis of what is achieved is a preconditionfor organized and efficient risk management. All this is also required by thesupervisory standards and recommendations, as well as by the bodies autho-rized for banking supervision in an individual country.
Assets and liabilities management basically encompasses the management ofthe following:
� bank’s liquidity position for the purpose of assuring adequate funds to sat-isfy the expected demand for funds without jeopardizing the prudent li-quidity requirements set by the supervisors and shareholders;
� allocation of funds and determination of loan and deposit prices for thepurpose of realizing specific goals related to profit in accordance with thebank’s annual profit plan;
� sensitivity to changes in interest rates on bank’s assets and liabilities forthe purpose of assuring net interest income;
� bank’s assets and liabilities in a manner which will not jeopardize thebank’s capital accounts while providing continuous growth.
The purpose of all of these procedures is to attain the strategic goals4:
� to earn the highest income sustainable in a particular period while main-taining an acceptable level of risks arising from banking operations, and
� to maximally increase the bank shareholders’ wealth measured by themarket price of their shares.
Assets and liabilities management includes the following four areas ofresonsibility:
� planning the bank’s future orientation, which may encompass: markets,products, human resources, organizational improvement, new technology,etc.;
� providing adequate sources of funds by combining such sources, includingequity capital, which require the lowest costs necessary for the satisfactionof the demand for funds;
2.1 Assets andLiabilitiesManagement
4 Funds management can be defined as the
process of managing the margin between the
interests earned and other commissions and
interests paid and ensuring adequate liquid-
ity while maintaining the risk operating pro-
file.
15
LIQUIDITY RISK
� classifying funds into cash funds and funds earning higher income for thebank (placements, investments, etc.) with a risk that can be controlled bythe bank;
� bank positioning, i.e. positioning of its operations, to enable the bank to ad-just its activities in a profitable manner to any future conditions – to re-spond to new market conditions and situations promptly, efficiently andwith the lowest costs.
Within the tasks and activities of assets and liabilities management, the obli-gations and responsibilities are shared among:
1. the supervisory board of a bank, which should:
� approve the strategic plan (as one of the crucial criteria and elements forselecting and confirming the bank’s management board);
� assure continuous supervision of the performance and fulfillment of theplanned tasks;
� continuously supervise the implementation of the procedures and activi-ties assuring the control and measurement of risks and the legality of oper-ations;
2. bank’s management board:
� adopts the strategic plan, an annual plan which must project in detail reve-nues and expenditures and determine the expected level of profit;
� defines the strategy, adopts policies that will determine the measures forthe realization of the strategic goals, and prescribes procedures for the at-tainment of these goals;
� provides an adequate system of:a. risk measurementb. monitoring compliance with the set limitsc. providing accurate reports on the current bank position and its
observance of guidelines and limits� assures adequate control of the observance of the established polices and
procedures� issues decisions on corrective measures and amendments to the estab-
lished policies and procedures on the basis of information on changes andmarket developments, data and analyses of the set targets, forecasts etc.;
3. assets and liabilities management committee5:
� formulates and proposes the fund management plan by individual ele-ments;
� proposes individual restrictions and limits;� monitors the realization of goals, analyzes them and regularly reports on
the same to the management board;� manages the balance sheet structure;� monitors the maturity mismatch of assets and liabilities and analyzes its
causes and consequences, as well as breaches of the determined restric-tions and limits;
� controls the liquidity level and manages liquidity;� controls the interest rate risk level and manages this risk;� monitors and analyzes the foreign exchange position, both total and by in-
dividual currencies;� monitors and prescribes the capital adequacy requirements;� plans the future and makes projections.
5 The basic tasks of this committee (ALCO),
which, depending on the bank, may consist
of a special committee (or subcommittee for
liquidity management) are summarized here,
with no intention of offering final solutions or
imposing strict rules of conduct. For details
see: Stigum, M.L. and Branch, R.O.Jr. (1991),
Baughn, W.H., Storrs, T.I. and Walker, C.E.
(1993) and Fabozzi, F.J. and Konishi, A.
(1996).

16
BANKS BULLETIN
The committee is obliged to inform the management board and senior man-agement (relative to the bank size) at certain intervals through reports of theachieved results, i.e. it should provide concise and sufficient information onthe basis of which the bank management board can make timely and efficientdecisions. Every bank, relative to the stated factors, must issue policies ade-quate to its size, human and technical resources, products and markets inwhich it operates, and which prescribe the form, content and terms in whichthe reports are composed and presented.
2.2 Liquidity Risk In terms of banks, liquidity risk may be defined as follows:
� risk arising from the mismatch between cash inflows and outflows – struc-tural liquidity risk, and
� risk arising from the inability to sell financial instruments within the ap-propriate time limits and at an acceptable price – financial instruments li-quidity risk.
A bank’s survival depends primarily on its liquidity; an illiquid bank cannotfunction in the market. Furthermore, confidence is a basic prerequisite for asound, stable and growing banking business. Confidence, along with the ful-fillment of other conditions, is a prerequisite for an increase in liquidity,which assures continuous bank growth (balance sheet amount). This, in turn,continuously provides a stable and competitive position in the market. Newsof a bank’s inability to meet its due obligations to its creditors, mostly smallsavers, spreads rapidly, and the perception of a bank as a stable and safe fi-nancial institution can change overnight. Although a bank can have true li-quidity problems, such a bank is frequently viewed as an insolvent bank6. Thepanic that can be caused by the illiquidity of a single bank can have systemicconsequences. The consequences of bank illiquidity of which its clients havebeen informed are the following:
� depositors’ and other creditors’ fear for the funds invested in the bank;� occasional withdrawals of large amounts of funds, which has a direct effect
on profitability due to the increase in liquidity reserves or the sale of assets,most frequently those earning the highest profit, at a low price;
� limited asset growth as a result of the reduction or cessation of inflows ofnew sources of funds (deposits);
� due to the exceptional nature of the situation, the non-application ofadopted policies and procedures, which can have adverse effects (e.g. con-centration and increased dependence upon particular sources);
� possible insolvency and the threat of bankruptcy;� restricted access to stable and cheap sources of funds (market);� the violation of regulatory rules.
In addition to the internal causes threatening bank liquidity, the external ele-ments can also represent a possible threat to liquidity. However, sound liquid-ity risk management must take into account both types of risks. The externalrisks can include:
� geographical risk, reflecting the safety and stability of a particular regionand its level of development – macroeconomic stability;
� systemic reasons as a result of risk of a single bank failure and the “conta-gion” which can arise due to investors’ general lack of confidence;
� specific reasons, such as a lack of confidence in certain financial instru-
6 There are different definitions and interpreta-
tions of insolvency, but for the purpose of this
report insolvency will be defined as a bank
condition when liabilities exceed the amount
of assets, taking into account the influence of
off-balance sheet items.
17
LIQUIDITY RISK
ments (e.g. problems with foreign exchange deposits following the breakupof the SFRY).
In an environment such as Croatia’s, there is a specific risk, “judiciary risk”,that must also be taken into account. This refers to the problems caused byprolonged and exhausting lawsuits filed by banks against their debtors,whether to directly collect claims based on placements or to activate the in-struments of collateral. Such legal disputes can last for years, and during thewhole period the bank is obliged to provide liquidity (sources) for financingthe frozen, non-performing assets, resulting in a profitability problem. In ad-dition, although the bank usually wins the case, whose outcome was predict-able, and gains the right to exercise the lien, the costs of such lawsuits arevery high. Furthermore, the bank commonly cannot collect the high defaultinterest and other damages since the debtor’s overall assets are often insuffi-cient and the damage must be assessed and claimed through a separate legalaction. The settlement of these problems would have a positive effect on theincreased safety, stability and liquidity of the financial system of Croatia.This would reduce the need for such high liquidity reserves, strengthen themarket (especially real estate market, goods markets, securities market, etc.)and increase the supply of placements and other banking products. Conse-quently, interest rates and prices of other banking products would be re-duced, even if deposit interest rates and prices of other sources remainedunchanged.
The bank management board is required to establish liquidity risk manage-ment as an organizational unit and to provide adequate funds and human re-sources for the purpose of measuring the liquidity position on an on-goingbasis. The final aim is to assess and evaluate the quality and level of liquidityreserves and to establish other options for forming liquidity reserves, takinginto account different scenarios, including unfavorable situations, applyingthe “what if” principle.
2.2.1 Liquidity RiskManagement
It is evident from the above that any well-organized bank that has operatingand business strategies must manage liquidity risk, since adequate liquidity isthe basic condition for its successful operation and survival. In principle, theliquidity risk management methods are:
� by asset management: increasing or decreasing liquid assets,� by sources of founds management: increasing or decreasing liabilities, and� by a combined method: increasing liquid assets and liabilities.
Smaller banks, which cannot significantly influence the size of their sourcesof funds and have limited access to the capital and short-term security mar-ket, manage their liquidity through assets. The need for increased liquidity inthat case is met by changing the asset structure, that is, by selling highly liq-uid assets or a part of those assets which would not have been sold if the li-quidity had not deteriorated.
An example of managing liquidity by means of bank assets is that of placingfunds through syndicated loans. When managing liquidity in such a manner (i.e.assets and liabilities management), the bank participates in fund placements to-gether with a number of banks and takes part in several syndicates, expectingthat it can relatively easily sell its participation to another bank in the syndicateat an acceptable price in the event of a sudden need for liquid assets.
18
BANKS BULLETIN
The weakness of liquidity management by manipulating asset structure isthat a bank, having assessed its liquidity needs, holds this amount in highlyliquid assets with a low return on capital employed. On the other hand, if abank opts for a low level of liquidity reserves that would be compensated forby selling assets that are not highly liquid, the market would respond by offer-ing a lower price for such assets, thus causing losses for the bank from suchsale. Additionally, by selling performing assets, a bank is deprived of its in-come in the future.
The advantage of such a policy is that a bank holding liquidity reserves inhighly liquid assets can at any time and in an efficient manner respond to pos-sible liquidity disorders.
Another method of liquidity management is management by increasingsources of funds (liabilities). Such liquidity management requires the avail-ability of sources of funds, which should be quickly obtained by the bank at areasonable cost.
In order for a bank to decide to manage liquidity risk by increasing liabilities,the following assumptions must be in place, i.e. a bank must be able to:
� raise new funds by taking new deposits;� borrow in capital markets;� sell securities, commonly through repo agreements;� assure credit lines granted by a correspondent bank;� as a last resort – borrow from the central bank.
One of the most frequent options for providing liquidity sources is to increasedeposit interest rates above the interest rates offered by competing banks,thus making the bank more attractive to potential investors. This policy isgenerally very risky and its far-reaching weaknesses were evident in thebanking crisis in Croatia, when there were serious weaknesses in the liquiditymanagement policies, poor liquidity planning or no planning at all. The mostcommon consequence of using this expensive source of funds is bad loans.
Liquidity risk management by relying on bank’s liabilities is reflected inlower costs and simple techniques, under the condition that the bank has anadequate market position and credit rating.
The weaknesses of liquidity risk management by relying on liabilities is re-flected in the following:
1. It may not be possible to acquire new deposits when this is really neces-sary.
2. The concentration of sources of funds may increase liquidity risk.3. As a result of interest rate competition, financing costs may increase.4. When money is expensive in the entire country, interest rate discrimina-
tion may occur and also discrimination against smaller banks ornon-money-center banks, which implies that new deposits are not easilyavailable to banks other than money-center banks. Accordingly, a bankwith limited sources of financing should rather focus on its local market, ifpossible, instead of buying assets in the national market.
5. The purchase of assets at the lowest possible price, irrespective of maturi-ties and maturity mismatch restrictions, significantly increases bank ex-posure to risks of great changes in interest rates.
19
LIQUIDITY RISK
The bank’s management board should adopt liquidity policies according tothe size and characteristics of the bank’s operations, the strategic goals andplans, the bank’s internal organization and its environment. Liquidity poli-cies should determine data to be collected and time limits, define proceduresand methods for calculating liquidity ratios, analyze trends for the purpose ofmonitoring the realization of plans, and making decisions and taking timelymeasures, all with a single aim: to provide sufficient liquidity sources. Thebank’s assets and liabilities should be structured so as to provide an adequateliquidity reserve.
2.3 CorePrinciples forthe LiquidityManagementof Banks
The provision and maintenance of optimum liquidity, i.e. bank liquidity riskmanagement, in contrast to most of the other elements that must be man-aged, is specific to each bank; there are no two banks to which the same liquid-ity policies and procedures can be applied, nor is there the identicalorganization of these activities. Liquidity and liquidity risk management thusneed special attention from the supervisory point of view. Bank supervisionchecks that the management board and senior management of a bank under-stand the bank’s specific needs for liquidity and assesses whether the bankhas appropriately established its procedures related to monitoring, measur-ing and analyzing data and different liquidity ratios and whether it makestimely decisions and timely adjustment of the planned goals.
This approach to liquidity is important since there are no established rules,no data which would serve as indicators for taking particular measures and noratios which can be unequivocally interpreted as a certain standard andwhich can unmistakably evaluate the liquidity position of banks of all sizesand categories, in various markets. A particular liquidity position can be ade-quate for one bank but inadequate for another, or it can be adequate for onebank in a particular time period but inadequate for the same bank in anotherperiod.
In order to achieve the goals of adequate liquidity risk management, the man-agement board and senior management of a bank should understand the ba-sic principles and accept sound practices for liquidity management. Only thenwill the preconditions be created for adopting policies and procedures appro-priate for the bank. A bank is obliged to develop an organization and liquiditymeasuring system that assures that liquidity requirements are implemented,analyzed and supervised by a well-organized internal control system that alsoevaluates internal audits. The task of bank supervision is to continuouslymonitor and evaluate bank liquidity and its method of risk management.
Due to the specific characteristics of the problems to be resolved when manag-ing liquidity risk, the Basel Committee on Banking Supervision issued a spe-cial document referring banks and bank supervisors to the core principles andsound practices for managing this risk. In early 2000, the Committee updatedthe 1992 document entitled A Framework for Measuring and Managing Li-
quidity. In the new document issued in February 2000, under the title Sound
Practices for Managing Liquidity in Banking Organisations, 14 principleswere established which every banking organization should observe andshould incorporate in their liquidity risk policies and procedures as applica-ble.
The principles for liquidity risk management are outlined below.

20
BANKS BULLETIN
Developing a Structure for Managing Liquidity
Principle 1: Each bank should have an agreed strategy for the day-to-daymanagement of liquidity. This strategy should be communicated throughoutthe organization.
Principle 2: Each bank’s board of directors should approve the strategy andsignificant policies related to the management of liquidity. The board shouldalso ensure that senior management takes the steps necessary to monitor andcontrol liquidity risk. The board should be informed regularly of the liquiditysituation of the bank and immediately if there are any material changes in thebank’s current or prospective liquidity position.
Principle 3: Each bank should have a management structure in place to exe-cute effectively the liquidity strategy. This structure should include the ongo-ing involvement of members of senior management. Senior managementmust ensure that liquidity is effectively managed, and that appropriate poli-cies and procedures are established to control and limit liquidity risk. Banksshould set and regularly review limits on the size of their liquidity positionsover particular time horizons.
Principle 4. Each bank must have adequate information systems for measur-ing, monitoring, controlling and reporting liquidity risk. Reports should beprovided on a timely basis to the bank’s board of directors, senior manage-ment and appropriate personnel.
Measuring and Monitoring Net Funding Requirements
Principle 5: Each bank should establish a process for the ongoing measure-ment and monitoring of net funding requirements.
Principle 6: Each bank should analyze liquidity utilizing a variety of “what if”scenarios.
Principle 7: Each bank should frequently review their assumptions in manag-ing liquidity to determine that they continue to be valid.
Managing Market Access
Principle 8: Each bank should periodically review its efforts to establish andmaintain relationships with liability holders, to maintain the diversificationof liabilities, and aim to ensure its capacity to sell assets.
Contingency Planning
Principle 9: Each bank should have contingency plans in place that addressthe strategy for handling liquidity crises and include procedures for makingup cash flow shortfalls in emergency situations.
Foreign Currency Liquidity Management
Principle 10: Each bank should have a measurement, monitoring and controlsystem for its liquidity positions in the major currencies in which it is active.In addition to assessing its aggregate foreign currency liquidity needs and theacceptable mismatch in combination with its domestic currency commit-
21
LIQUIDITY RISK
ments, each bank should also undertake separate analysis of its strategy foreach currency individually.
Principle 11: Subject to the analysis undertaken according to Principle 10,each bank should, where appropriate, set and regularly review limits on thesize of its cash flow mismatches over particular time horizons for foreign cur-rencies in aggregate and for each significant individual currency in which thebank operates.
Internal Controls for Liquidity Risk Management
Principle 12: Each bank must have an adequate system of internal controlsover its liquidity risk management process. A fundamental component of theinternal control system involves regular independent reviews and evaluationsof the effectiveness of the system, ensuring, where necessary, that appropri-ate revisions or enhancements to internal controls are made. The results ofsuch reviews should be available to the supervisory authorities.
Role of Public Disclosure in Improving Liquidity
Principle 13: Each bank should have in place a mechanism for ensuring thatthere is an adequate level of disclosure of information about the bank in orderto manage public perception of the organization and its soundness.
Role of Supervisors
Principle 14: Supervisors should conduct an independent evaluation of thebank’s strategies, policies, procedures and practices related to the manage-ment of liquidity. Supervisors should require that the bank has an effectivesystem in place to measure, monitor and control liquidity risk. Supervisorsshould obtain from each bank sufficient and timely information with which toevaluate its level of liquidity risk and should ensure that the bank has ade-quate liquidity contingency plans.
7 CAMELS basically denotes the assessment
of bank operating quality according to: capi-
tal amount and adequacy, asset quality,
management quality, earnings, liquidity, and
sensitivity to market risk. With the develop-
ment of supervisory techniques, ratings have
recently included the assessment of the
bank’s competence in risk management,
where a 9th rating component may also ap-
pear.
2.4 RankingAccording toLiquidity Criteria
Bank ranking is very common and any bank of importance commonly asksone or more credit rating agencies to assess its short-term and long-termcredit rating for a particular year. The significance of credit rating for a bankis understandable and requires no special explanation.
The supervisory bodies also give ratings to banks, most frequently accordingto individual components of the CAMELS rating system, and assign a com-posite rating from 1 to 5, where 1 denotes the highest rating and a bank of thehighest operating quality according to the elements of the system7.
The most important elements taken into account when determining a bank’scondition concerning liquidity reserves and assessing liquidity risk manage-ment are given below.
The liquidity and liquidity risk management of a bank is commonly rated onthe basis of determining and assessing the following elements:
� the position of liquid assets, which is measured by taking into account thepresent need of the bank for settling liabilities and future asset increase;special assessment is made of whether the required liquidity sources are
22
BANKS BULLETIN
provided without adverse effects on bank operations, i.e. whether cash canbe obtained without additional losses;
� access to money markets and other sources of finance, which sets the pricesat which a bank borrows;
� the trend and stability of deposits;� the level of diversification of sources of funds both on– and off-balance
sheet, as well as the quantity of various financial instruments that thebank uses to ensure sources of funds;
� the competence of the management board and senior management in ap-propriately organizing the establishment, measurement and supervisionof the bank’s liquidity position. Funds management strategies, planningdocuments, policies and procedures are assessed, as well as informationsystem quality.
2.5 In Lieu of aConclusion
As previously mentioned, the provision of liquid assets necessary for normalbank operations and liquidity risk management are a part of the broader pro-cesses of funds management or assets and liabilities management. Therefore,all the described represents only an introduction to the issue of liquidity,whereas other segments of assets and liabilities management are beyond thescope of our review and are not discussed here. Contemporary approaches toassets and liabilities management increasingly take into account a largernumber of interrelated elements, assessing risk through a dynamic analysis,as well as by evaluating the strengths and weaknesses of the bank and the op-portunities and threats in the environment (mostly in the market). The bankmanagement board should recognize its potentials (comparative advantages)for success, but it should also continuously supervise risks that may causelosses. The provision of an adequate liquidity level in banks and liquidity riskmanagement is at the top of the pyramid, meaning that almost all analyticaland diagnostic models start with liquidity analysis.
References Austin, D. V. and M. S. Mondula (1985): Bankers’ Handbook for Strategic Planning, Boston: Pub-lishing Company, 1985.
Baughn, W. H., T. I. Storrs, and C. E. Walker (1993): The Bankers’ Handbook, Third Edition, DownJones Irwin, Homewood, 1993.
Benton, E. G. (1996): The Bank Director’s Handbook, A Bank Line Publication, Irwin, ProfesionalPublishing, 1996.
Fabozzi, F. J. and A. Konishi (1996): The Handbook of Asset/Liability Management, Irwin, 1996.
Kraj~evi}, F. (1971): Analiza poslovanja poduze}a, Informator, Zagreb, 1971.
Leko, V., A. Milinovi} and M. Potkonjak (1996): Procjena boniteta trgova~kog dru{tva, Masmedia,Zagreb, 1996.
LeRoy Miller, R. and D. D. VanHoose (1993): Moderni novac i bankarstvo, Tre}e izdanje, Ma-Te,Zagreb, 1993.
Osmanagi} Bedenik, N. (1993): Potencijali poduze}a, Alinea, Zagreb, 1993.
Stigum, M. L. and R. O. Branch, Jr. (1991): Managing Bank Assets and Liabilities: Strategies forRisk Control and Profit, Dow Jones Irwin, Homewood, 1991.
23
INDICATORS OF OPERATIONS
By the end of 2000, the banking system of the Republic of Croatia consisted of44 commercial banks – 9 less than in the previous year. In 2000, the number ofbanks was reduced for three main reasons. Bankruptcy proceedings were initi-ated in Agroobrtni~ka banka d.d., Zagreb, Cibalae banka d.d., Vinkovci,Hrvatska gospodarska banka d.d., Zagreb, and Trgova~ka-turisti~ka bankad.d., Split, and the operating license for Razvojna banka “Dalmacija” d.o.o.,Split was not renewed, according to Articles 35, 36, and 37 of the Banking Law.Zagreba~ka banka – Pomorska banka d.d., Split merged with Zagreba~kabanka d.d., Zagreb; Krapinsko-zagorska banka d.d., Krapina merged withPrivredna banka Zagreb d.d., Zagreb; ^akova~ka banka d.d., ^akovec andTrgova~ka banka d.d., Zagreb merged with Bjelovarska banka d.d., Bjelovarand Erste & Steiermärkische Bank d.d., Zagreb was established.
In 2000, the number of banks in majority foreign ownership increased from13 to 20. Simultaneously, their share in total assets of the system grew signifi-cantly, from 39.9 percent at the end of 1999 to 76.1 percent in mid-2000, and84.1 percent at the end of 2000. The significant growth in the asset share re-sults from the fact that foreign banks acquired the majority interest in capitalof the second, third and fourth largest banks by asset size1.
For the purpose of simplified comparison, banks are classified into fourgroups in the text below. The classification criterion is asset size. Group I thusincludes banks with assets exceeding 5 billion kuna, Group II banks with as-
3 Indicators of Banking InstitutionOperations
3.1 Banks
� In accordance with the selected criterion – the
size of assets – the table shows the parameters
for the classification of banks into individual
groups.
The reports submitted by banks in Schedule BS
(Bank Statistical Report – Narodne novine, Nos.
57/99 and 3/2001) are the source of data on the
size (amount) of assets.
In foreign ownership In domestic ownership
FIGURE 1. Number of Banks
0
10
20
30
40
50
60
70
1996 1997 1998 1999 2000
54 53 50
40
24
4 7 10
13
20
� With respect to the ownership structure,
banks in the Republic of Croatia are divided into
domestic and foreign banks. A bank is classified
as a domestic bank if it is in majority ownership
of domestic juridical and natural persons. The
same rule is applied to the classification of a
bank into banks in majority foreign ownership.
The total number of banks is the sum of banks in
domestic and foreign ownership.
The Croatian National Bank statistics is the
source of data on the number of banks.
TABLE 1. Peer Groups of Banks, end of period, in thousand kuna
Group Classification criterion Dec. 1997 Dec. 1998 Dec. 1999 Dec. 2000
I Assets (A)>5 000 000 4 4 4 5
II 1 000 000<A<5 000 000 15 19 15 13
III 500 000<A<1 000 000 9 9 5 8
IV A<500 000 32 28 29 18
1 Privredna banka Zagreb d.d., Zagreb,
Splitska banka d.d., Split, Rije~ka banka d.d.,
Rijeka
24
BANKS BULLETIN
sets between 1 billion and 5 billion kuna, Group III banks with assets between500 million and 1 billion kuna, and finally Group IV banks with assets lessthan 500 million kuna.
The largest growth rates of assets were recorded for the largest and smallbanks, which is the main reason for the increase in the number of banks inGroups I and III and the reduction in the number of banks in Group II. Thereduced number of banks in Group IV mainly resulted from the initiation ofbankruptcy proceedings in the above mentioned small banks, apart from theabove stated reason.
3.1.1 TerritorialDistribution of Banks’Operating Network
The operating network is analyzed here at the county level, on the basis of thechanges in the number of branches and sub-branches and ATMs2. At the levelof the banking system, the number of branches and sub-branches was reducedin 2000 by 60 operating units (8 percent). This was the result of the reductionin the number of banks in the system (56 operating units) and the reduction inthe number of operating units, primarily in several medium-size regionalbanks (34 operating units), along with a simultaneous establishment of 24 newsub-branches, mainly of foreign banks. The majority of these changes occurredin the first half of 2000. While there was noticeable expansion of the operationsof several banks to regions where they were not previously active, there was ev-ident rationalization of several regional banks’ operating networks followingthe entry of new owners. In 2000, new branches and sub-branches were mainlyestablished by banks in the City of Zagreb and the County of Zagreb, theCounty of Primorje and Gorski Kotar, and the County of Istria.
TABLE 2. Territorial Distribution of Branches and Sub-Branches, end of period
Counties Dec. 1997 Dec. 1998 Dec. 1999 Dec. 2000
County of Zagreb and City of Zagreb 167 159 157 140
County of Krapina-Zagorje 9 18 18 18
County of Sisak-Moslavina 31 30 27 24
County of Karlovac 19 19 20 18
County of Vara`din 22 24 26 23
County of Koprivnica-Kri`evci 27 25 24 23
County of Bjelovar-Bilogora 26 25 22 20
County of Primorje and Gorski Kotar 46 46 55 57
County of Lika-Senj 9 9 8 8
County of Virovitica-Podravina 18 18 18 14
County of Po`ega-Slavonia 16 16 15 16
County of Slavonski Brod-Posavina 12 12 12 13
County of Zadar 36 40 39 32
County of Osijek-Baranya 57 59 59 47
County of [ibenik-Knin 29 30 28 28
County of Vukovar-Srijem 16 19 22 15
County of Split-Dalmatia 93 104 106 100
County of Istria 79 83 86 85
County of Dubrovnik and Neretva 50 54 55 49
County of Me|imurje 22 23 25 26
As regards the ATM network, high growth rates continued. In 2000, the num-ber of installed ATMs increased by 213 units, or 40.7 percent. The number ofinstalled ATMs increased in all counties. The largest absolute growth (56ATMs) was recorded in the County of Zagreb (including the City of Zagreb),and the largest relative growth (150 percent) in the County of SlavonskiBrod-Posavina. A significant growth was recorded in the County of Split andDalmatia (32 ATMs), the County of Primorje and Gorski Kotar (27 ATMs)and the County of Dubrovnik and Neretva (17 ATMs).
� The total number of branches and
sub-branches of all banks in the Republic of
Croatia is classified by counties.
Banks are the source of data.
2 This analysis does not cover the operating
network of banks against which bankruptcy
proceedings were initiated in 1999. The dif-
ference in the number of branches and
sub-branches in particular counties at the
end of 1998 and 1999 in comparison with the
data published in the last issue of the Banks
Bulletin can be accounted for by the change
in the series of data for one bank.
25
INDICATORS OF OPERATIONS
� The total number of installed ATMs of all
banks in the Republic of Croatia is classified by
counties.
Banks are the source of data.
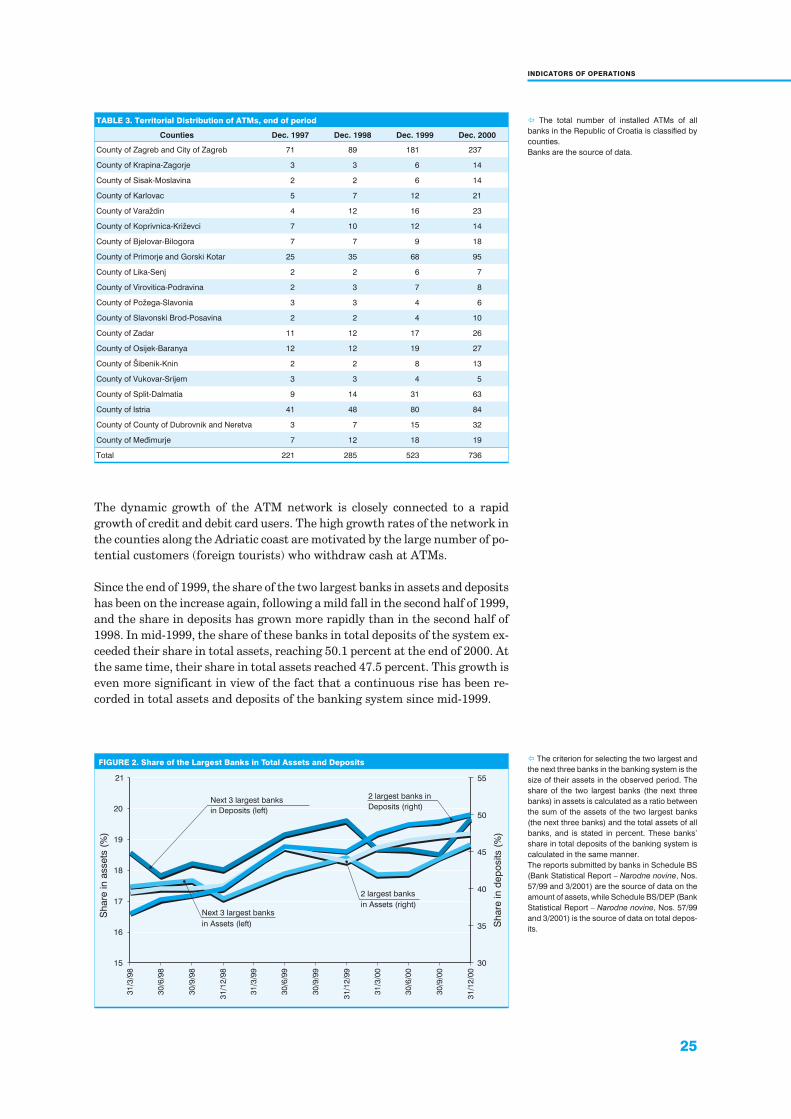
The dynamic growth of the ATM network is closely connected to a rapidgrowth of credit and debit card users. The high growth rates of the network inthe counties along the Adriatic coast are motivated by the large number of po-tential customers (foreign tourists) who withdraw cash at ATMs.
Since the end of 1999, the share of the two largest banks in assets and depositshas been on the increase again, following a mild fall in the second half of 1999,and the share in deposits has grown more rapidly than in the second half of1998. In mid-1999, the share of these banks in total deposits of the system ex-ceeded their share in total assets, reaching 50.1 percent at the end of 2000. Atthe same time, their share in total assets reached 47.5 percent. This growth iseven more significant in view of the fact that a continuous rise has been re-corded in total assets and deposits of the banking system since mid-1999.
TABLE 3. Territorial Distribution of ATMs, end of period
Counties Dec. 1997 Dec. 1998 Dec. 1999 Dec. 2000
County of Zagreb and City of Zagreb 71 89 181 237
County of Krapina-Zagorje 3 3 6 14
County of Sisak-Moslavina 2 2 6 14
County of Karlovac 5 7 12 21
County of Vara`din 4 12 16 23
County of Koprivnica-Kri`evci 7 10 12 14
County of Bjelovar-Bilogora 7 7 9 18
County of Primorje and Gorski Kotar 25 35 68 95
County of Lika-Senj 2 2 6 7
County of Virovitica-Podravina 2 3 7 8
County of Po`ega-Slavonia 3 3 4 6
County of Slavonski Brod-Posavina 2 2 4 10
County of Zadar 11 12 17 26
County of Osijek-Baranya 12 12 19 27
County of [ibenik-Knin 2 2 8 13
County of Vukovar-Srijem 3 3 4 5
County of Split-Dalmatia 9 14 31 63
County of Istria 41 48 80 84
County of County of Dubrovnik and Neretva 3 7 15 32
County of Me|imurje 7 12 18 19
Total 221 285 523 736
FIGURE 2. Share of the Largest Banks in Total Assets and Deposits
15
16
17
18
19
20
21
30
35
40
45
50
55
31
/3/9
8
30
/6/9
8
30
/9/9
8
31
/12
/98
31
/3/9
9
30
/6/9
9
30
/9/9
9
31
/12
/99
31
/3/0
0
30
/6/0
0
30
/9/0
0
31
/12
/00
Next 3 largest banks
in Deposits (left)
2 largest banks in
Deposits (right)
Next 3 largest banks
in Assets (left)
2 largest banks
in Assets (right)
Sh
are
inassets
(%)
Sh
are
ind
ep
osits
(%)
� The criterion for selecting the two largest and
the next three banks in the banking system is the
size of their assets in the observed period. The
share of the two largest banks (the next three
banks) in assets is calculated as a ratio between
the sum of the assets of the two largest banks
(the next three banks) and the total assets of all
banks, and is stated in percent. These banks’
share in total deposits of the banking system is
calculated in the same manner.
The reports submitted by banks in Schedule BS
(Bank Statistical Report – Narodne novine, Nos.
57/99 and 3/2001) are the source of data on the
amount of assets, while Schedule BS/DEP (Bank
Statistical Report – Narodne novine, Nos. 57/99
and 3/2001) is the source of data on total depos-
its.
26
BANKS BULLETIN
Assets and deposits of the next three largest banks3 have been continuouslygrowing in nominal terms since mid-1999, but their share in total assets of thesystem and in total deposits decreased slightly in the first half of 2000. By theend of 2000, the share of these banks in total assets and deposits of the systembegan to grow again, reaching 18.8 percent of total assets, while their share intotal deposits reached 19.7 percent.
The share of the five largest banks in total assets and total deposits went upfrom 62.1 percent (assets) and 64.7 percent (deposits) at the end of 1999 to66.3 percent and 69.8 percent, respectively, at the end of 2000.
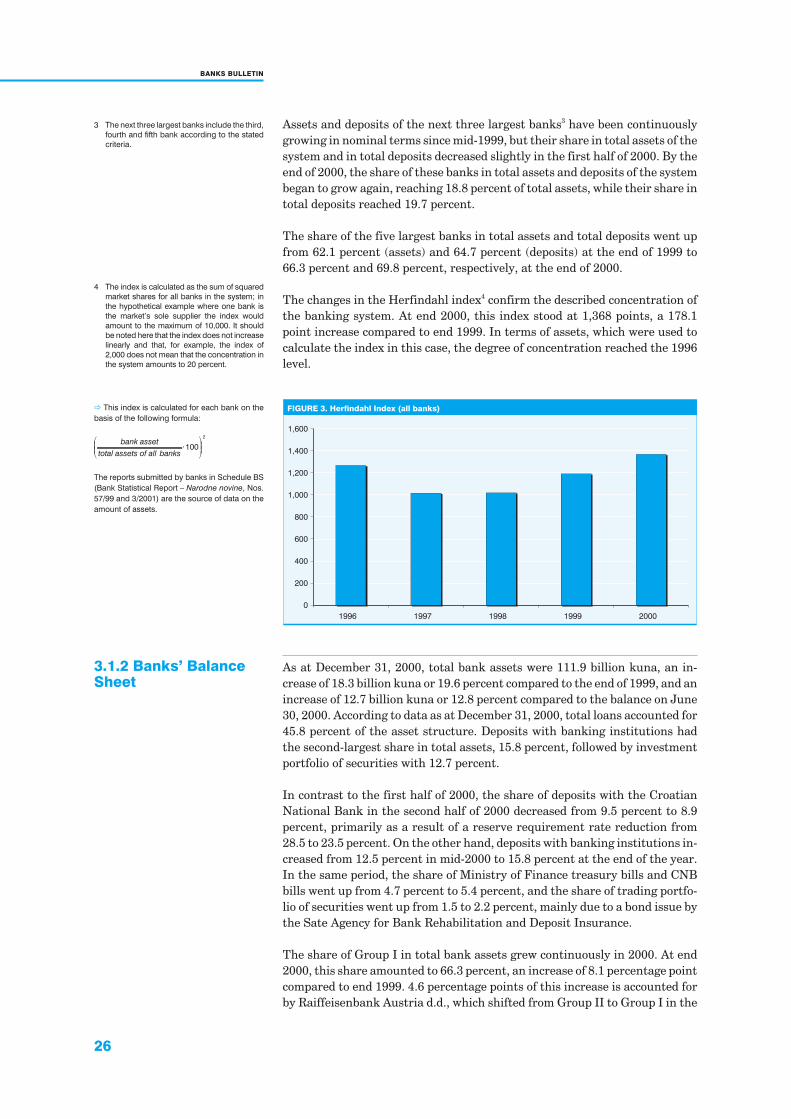
The changes in the Herfindahl index4 confirm the described concentration ofthe banking system. At end 2000, this index stood at 1,368 points, a 178.1point increase compared to end 1999. In terms of assets, which were used tocalculate the index in this case, the degree of concentration reached the 1996level.
FIGURE 3. Herfindahl Index (all banks)
0
200
400
600
800
1,000
1,200
1,400
1,600
1996 1997 1998 1999 2000
� This index is calculated for each bank on the
basis of the following formula:
bank asset
total assets of all banks�
�
���
�
���100
2
The reports submitted by banks in Schedule BS
(Bank Statistical Report – Narodne novine, Nos.
57/99 and 3/2001) are the source of data on the
amount of assets.
As at December 31, 2000, total bank assets were 111.9 billion kuna, an in-crease of 18.3 billion kuna or 19.6 percent compared to the end of 1999, and anincrease of 12.7 billion kuna or 12.8 percent compared to the balance on June30, 2000. According to data as at December 31, 2000, total loans accounted for45.8 percent of the asset structure. Deposits with banking institutions hadthe second-largest share in total assets, 15.8 percent, followed by investmentportfolio of securities with 12.7 percent.
In contrast to the first half of 2000, the share of deposits with the CroatianNational Bank in the second half of 2000 decreased from 9.5 percent to 8.9percent, primarily as a result of a reserve requirement rate reduction from28.5 to 23.5 percent. On the other hand, deposits with banking institutions in-creased from 12.5 percent in mid-2000 to 15.8 percent at the end of the year.In the same period, the share of Ministry of Finance treasury bills and CNBbills went up from 4.7 percent to 5.4 percent, and the share of trading portfo-lio of securities went up from 1.5 to 2.2 percent, mainly due to a bond issue bythe Sate Agency for Bank Rehabilitation and Deposit Insurance.
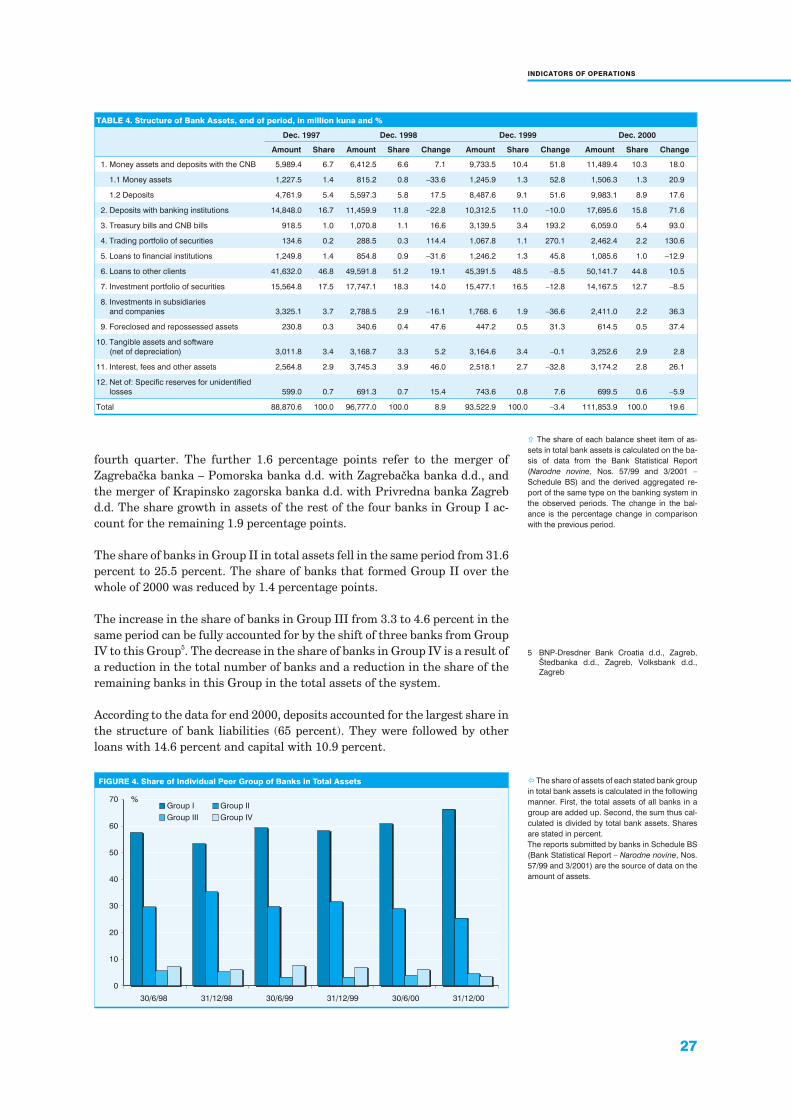
The share of Group I in total bank assets grew continuously in 2000. At end2000, this share amounted to 66.3 percent, an increase of 8.1 percentage pointcompared to end 1999. 4.6 percentage points of this increase is accounted forby Raiffeisenbank Austria d.d., which shifted from Group II to Group I in the
3.1.2 Banks’ BalanceSheet
3 The next three largest banks include the third,
fourth and fifth bank according to the stated
criteria.
4 The index is calculated as the sum of squared
market shares for all banks in the system; in
the hypothetical example where one bank is
the market’s sole supplier the index would
amount to the maximum of 10,000. It should
be noted here that the index does not increase
linearly and that, for example, the index of
2,000 does not mean that the concentration in
the system amounts to 20 percent.
27
INDICATORS OF OPERATIONS
TABLE 4. Structure of Bank Assets, end of period, in million kuna and %
Dec. 1997 Dec. 1998 Dec. 1999 Dec. 2000
Amount Share Amount Share Change Amount Share Change Amount Share Change
1. Money assets and deposits with the CNB 5,989.4 6.7 6,412.5 6.6 7.1 9,733.5 10.4 51.8 11,489.4 10.3 18.0
1.1 Money assets 1,227.5 1.4 815.2 0.8 –33.6 1,245.9 1.3 52.8 1,506.3 1.3 20.9
1.2 Deposits 4,761.9 5.4 5,597.3 5.8 17.5 8,487.6 9.1 51.6 9,983.1 8.9 17.6
2. Deposits with banking institutions 14,848.0 16.7 11,459.9 11.8 –22.8 10,312.5 11.0 –10.0 17,695.6 15.8 71.6
3. Treasury bills and CNB bills 918.5 1.0 1,070.8 1.1 16.6 3,139.5 3.4 193.2 6,059.0 5.4 93.0
4. Trading portfolio of securities 134.6 0.2 288.5 0.3 114.4 1,067.8 1.1 270.1 2,462.4 2.2 130.6
5. Loans to financial institutions 1,249.8 1.4 854.8 0.9 –31.6 1,246.2 1.3 45.8 1,085.6 1.0 –12.9
6. Loans to other clients 41,632.0 46.8 49,591.8 51.2 19.1 45,391.5 48.5 –8.5 50,141.7 44.8 10.5
7. Investment portfolio of securities 15,564.8 17.5 17,747.1 18.3 14.0 15,477.1 16.5 –12.8 14,167.5 12.7 –8.5
8. Investments in subsidiaries
and companies 3,325.1 3.7 2,788.5 2.9 –16.1 1,768. 6 1.9 –36.6 2,411.0 2.2 36.3
9. Foreclosed and repossessed assets 230.8 0.3 340.6 0.4 47.6 447.2 0.5 31.3 614.5 0.5 37.4
10. Tangible assets and software
(net of depreciation) 3,011.8 3.4 3,168.7 3.3 5.2 3,164.6 3.4 –0.1 3,252.6 2.9 2.8
11. Interest, fees and other assets 2,564.8 2.9 3,745.3 3.9 46.0 2,518.1 2.7 –32.8 3,174.2 2.8 26.1
12. Net of: Specific reserves for unidentified
losses 599.0 0.7 691.3 0.7 15.4 743.6 0.8 7.6 699.5 0.6 –5.9
Total 88,870.6 100.0 96,777.0 100.0 8.9 93,522.9 100.0 –3.4 111,853.9 100.0 19.6
fourth quarter. The further 1.6 percentage points refer to the merger ofZagreba~ka banka – Pomorska banka d.d. with Zagreba~ka banka d.d., andthe merger of Krapinsko zagorska banka d.d. with Privredna banka Zagrebd.d. The share growth in assets of the rest of the four banks in Group I ac-count for the remaining 1.9 percentage points.
The share of banks in Group II in total assets fell in the same period from 31.6percent to 25.5 percent. The share of banks that formed Group II over thewhole of 2000 was reduced by 1.4 percentage points.
The increase in the share of banks in Group III from 3.3 to 4.6 percent in thesame period can be fully accounted for by the shift of three banks from GroupIV to this Group5. The decrease in the share of banks in Group IV is a result ofa reduction in the total number of banks and a reduction in the share of theremaining banks in this Group in the total assets of the system.
According to the data for end 2000, deposits accounted for the largest share inthe structure of bank liabilities (65 percent). They were followed by otherloans with 14.6 percent and capital with 10.9 percent.
� The share of each balance sheet item of as-
sets in total bank assets is calculated on the ba-
sis of data from the Bank Statistical Report
(Narodne novine, Nos. 57/99 and 3/2001 –
Schedule BS) and the derived aggregated re-
port of the same type on the banking system in
the observed periods. The change in the bal-
ance is the percentage change in comparison
with the previous period.
FIGURE 4. Share of Individual Peer Group of Banks in Total Assets
Group I Group II
Group III Group IV
0
10
20
30
40
50
60
70
30/6/98 31/12/98 30/6/99 31/12/99 30/6/00 31/12/00
%
5 BNP-Dresdner Bank Croatia d.d., Zagreb,
[tedbanka d.d., Zagreb, Volksbank d.d.,
Zagreb
� The share of assets of each stated bank group
in total bank assets is calculated in the following
manner. First, the total assets of all banks in a
group are added up. Second, the sum thus cal-
culated is divided by total bank assets. Shares
are stated in percent.
The reports submitted by banks in Schedule BS
(Bank Statistical Report – Narodne novine, Nos.
57/99 and 3/2001) are the source of data on the
amount of assets.
28
BANKS BULLETIN
In 2000, total deposits recorded the largest absolute growth of 15.7 billionkuna and the largest growth in share of total liabilities of 4.1 percentagepoints. In the structure of deposits, the shares of giro account deposits, cur-rent account deposits and time deposits showed similar growth. At the end of2000, the share of giro and current account deposits in total deposits stood at21.7 percent, the share of savings deposits at 25.6 percent and the share oftime deposits at 52.7 percent.
In the second half of 2000, loans from financial institutions further decreased,and their share in total liabilities fell from 4.4 percent in mid-2000 to 3.1 per-cent at the end of 2000.
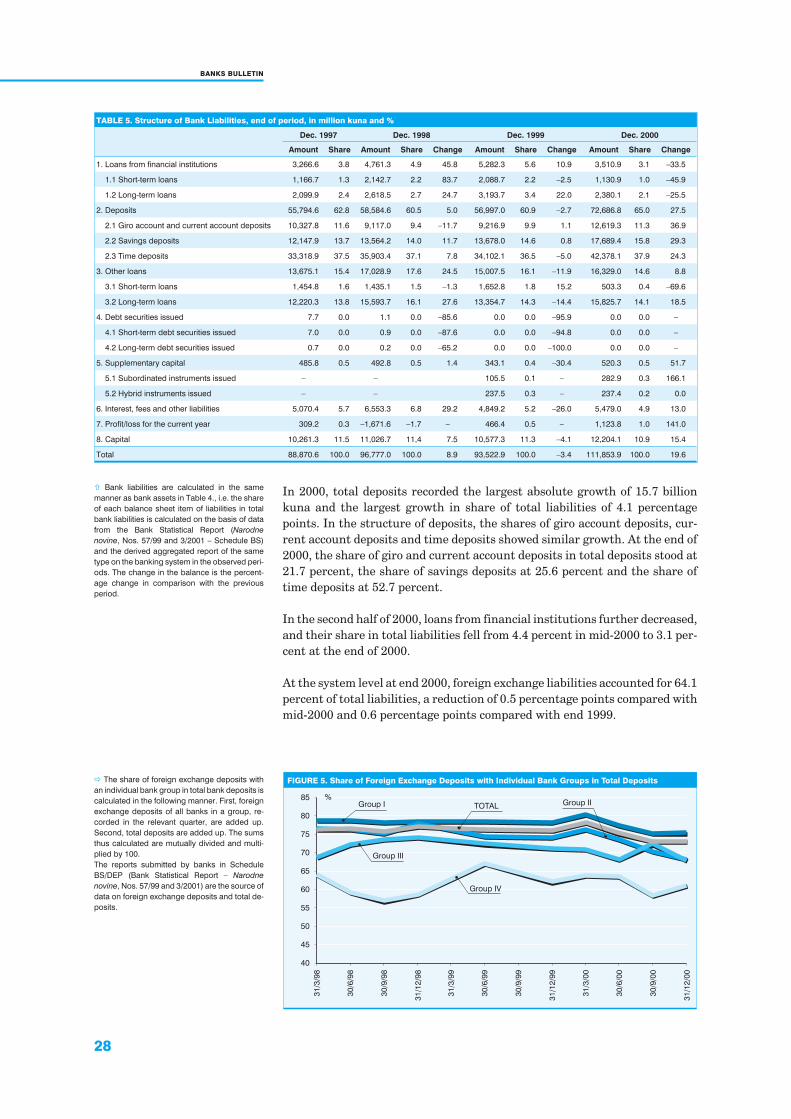
At the system level at end 2000, foreign exchange liabilities accounted for 64.1percent of total liabilities, a reduction of 0.5 percentage points compared withmid-2000 and 0.6 percentage points compared with end 1999.
TABLE 5. Structure of Bank Liabilities, end of period, in million kuna and %
Dec. 1997 Dec. 1998 Dec. 1999 Dec. 2000
Amount Share Amount Share Change Amount Share Change Amount Share Change
1. Loans from financial institutions 3,266.6 3.8 4,761.3 4.9 45.8 5,282.3 5.6 10.9 3,510.9 3.1 –33.5
1.1 Short-term loans 1,166.7 1.3 2,142.7 2.2 83.7 2,088.7 2.2 –2.5 1,130.9 1.0 –45.9
1.2 Long-term loans 2,099.9 2.4 2,618.5 2.7 24.7 3,193.7 3.4 22.0 2,380.1 2.1 –25.5
2. Deposits 55,794.6 62.8 58,584.6 60.5 5.0 56,997.0 60.9 –2.7 72,686.8 65.0 27.5
2.1 Giro account and current account deposits 10,327.8 11.6 9,117.0 9.4 –11.7 9,216.9 9.9 1.1 12,619.3 11.3 36.9
2.2 Savings deposits 12,147.9 13.7 13,564.2 14.0 11.7 13,678.0 14.6 0.8 17,689.4 15.8 29.3
2.3 Time deposits 33,318.9 37.5 35,903.4 37.1 7.8 34,102.1 36.5 –5.0 42,378.1 37.9 24.3
3. Other loans 13,675.1 15.4 17,028.9 17.6 24.5 15,007.5 16.1 –11.9 16,329.0 14.6 8.8
3.1 Short-term loans 1,454.8 1.6 1,435.1 1.5 –1.3 1,652.8 1.8 15.2 503.3 0.4 –69.6
3.2 Long-term loans 12,220.3 13.8 15,593.7 16.1 27.6 13,354.7 14.3 –14.4 15,825.7 14.1 18.5
4. Debt securities issued 7.7 0.0 1.1 0.0 –85.6 0.0 0.0 –95.9 0.0 0.0 –
4.1 Short-term debt securities issued 7.0 0.0 0.9 0.0 –87.6 0.0 0.0 –94.8 0.0 0.0 –
4.2 Long-term debt securities issued 0.7 0.0 0.2 0.0 –65.2 0.0 0.0 –100.0 0.0 0.0 –
5. Supplementary capital 485.8 0.5 492.8 0.5 1.4 343.1 0.4 –30.4 520.3 0.5 51.7
5.1 Subordinated instruments issued – – 105.5 0.1 – 282.9 0.3 166.1
5.2 Hybrid instruments issued – – 237.5 0.3 – 237.4 0.2 0.0
6. Interest, fees and other liabilities 5,070.4 5.7 6,553.3 6.8 29.2 4,849.2 5.2 –26.0 5,479.0 4.9 13.0
7. Profit/loss for the current year 309.2 0.3 –1,671.6 –1.7 – 466.4 0.5 – 1,123.8 1.0 141.0
8. Capital 10,261.3 11.5 11,026.7 11,4 7.5 10,577.3 11.3 –4.1 12,204.1 10.9 15.4
Total 88,870.6 100.0 96,777.0 100.0 8.9 93,522.9 100.0 –3.4 111,853.9 100.0 19.6
� Bank liabilities are calculated in the same
manner as bank assets in Table 4., i.e. the share
of each balance sheet item of liabilities in total
bank liabilities is calculated on the basis of data
from the Bank Statistical Report (Narodne
novine, Nos. 57/99 and 3/2001 – Schedule BS)
and the derived aggregated report of the same
type on the banking system in the observed peri-
ods. The change in the balance is the percent-
age change in comparison with the previous
period.
FIGURE 5. Share of Foreign Exchange Deposits with Individual Bank Groups in Total Deposits
40
45
50
55
60
65
70
75
80
85 %
31
/3/9
8
30
/6/9
8
30
/9/9
8
31
/12
/98
31
/3/9
9
30
/6/9
9
30
/9/9
9
31
/12
/99
31
/3/0
0
30
/6/0
0
30
/9/0
0
31
/12
/00
Group II
Group III
Group IV
TOTALGroup I
� The share of foreign exchange deposits with
an individual bank group in total bank deposits is
calculated in the following manner. First, foreign
exchange deposits of all banks in a group, re-
corded in the relevant quarter, are added up.
Second, total deposits are added up. The sums
thus calculated are mutually divided and multi-
plied by 100.
The reports submitted by banks in Schedule
BS/DEP (Bank Statistical Report – Narodne
novine, Nos. 57/99 and 3/2001) are the source of
data on foreign exchange deposits and total de-
posits.
29
INDICATORS OF OPERATIONS
The share of foreign exchange deposits in total deposits at the system level atend 2000 amounted to 73 percent, a reduction of 2.9 percentage points com-pared with end 1999.
Bank capital in the second half of 2000 continued its growth from the first halfof the year. It increased by 6.9 percent compared with mid-2000 and by 15.4percent compared with end 1999. In 2000, retained income and reserves pro-vided for by articles of association and other capital reserves significantly in-creased.
TABLE 6. Structure of Bank Capital, end of period, in million kuna and %
Dec. 1997 Dec. 1998 Dec. 1999 Dec. 2000
Amount Share Amount Share Change Amount Share Change Amount Share Change
1. Share capital 8,224.4 80.1 8,944.7 81.1 8.8 8,219.7 77.7 –8.1 8,568.4 70.2 4.2
2. Retained income/loss brought forward 58.8 0.6 16.7 0.2 –71.6 73.7 0.7 341.0 315.4 2.6 328.1
3. Legal reserves 818.9 8.0 1,165.5 10.6 42.3 1,540.2 14.6 32.2 2,099.0 17.2 36.3
4. Reserves provided for by the articles of
association and other capital reserves
1,159.2 11.3 899.8 8.2 –22.4 743.8 7.0 –17.3 1,221.3 10.0 64.2
Total 10,261.3 100.0 11,026.7 100.0 7.5 10,577.3 100.0 –4.1 12,204.1 100.0 15.4
According to data for end 2000, share capital accounted for 70.2 percent ofcapital structure. Legal reserves had the second-largest share, 17.2 percent,followed by the reserves provided for by the articles of association and othercapital reserves at 10 percent.
In comparison with end 1999, the share of share capital in total capital de-creased from 77.7 to 70.2 percent, which represents a continuation of theslightly downward trend recorded in 2000. On the other hand, the share of re-tained income in total capital increased to 2.6 percent of total capital at end2000.
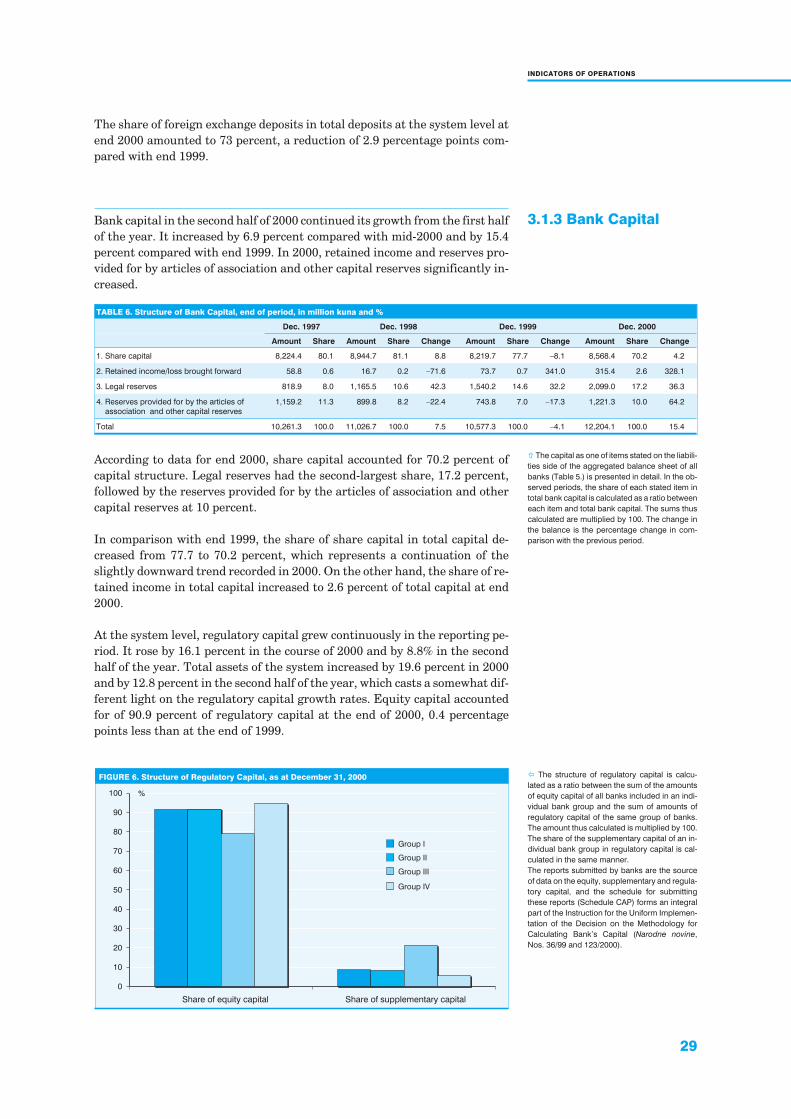
At the system level, regulatory capital grew continuously in the reporting pe-riod. It rose by 16.1 percent in the course of 2000 and by 8.8% in the secondhalf of the year. Total assets of the system increased by 19.6 percent in 2000and by 12.8 percent in the second half of the year, which casts a somewhat dif-ferent light on the regulatory capital growth rates. Equity capital accountedfor of 90.9 percent of regulatory capital at the end of 2000, 0.4 percentagepoints less than at the end of 1999.
� The capital as one of items stated on the liabili-
ties side of the aggregated balance sheet of all
banks (Table 5.) is presented in detail. In the ob-
served periods, the share of each stated item in
total bank capital is calculated as a ratio between
each item and total bank capital. The sums thus
calculated are multiplied by 100. The change in
the balance is the percentage change in com-
parison with the previous period.
3.1.3 Bank Capital
FIGURE 6. Structure of Regulatory Capital, as at December 31, 2000
0
10
20
30
40
50
60
70
80
90
100
Share of equity capital Share of supplementary capital
%
Group I
Group II
Group III
Group IV
� The structure of regulatory capital is calcu-
lated as a ratio between the sum of the amounts
of equity capital of all banks included in an indi-
vidual bank group and the sum of amounts of
regulatory capital of the same group of banks.
The amount thus calculated is multiplied by 100.
The share of the supplementary capital of an in-
dividual bank group in regulatory capital is cal-
culated in the same manner.
The reports submitted by banks are the source
of data on the equity, supplementary and regula-
tory capital, and the schedule for submitting
these reports (Schedule CAP) forms an integral
part of the Instruction for the Uniform Implemen-
tation of the Decision on the Methodology for
Calculating Bank’s Capital (Narodne novine,
Nos. 36/99 and 123/2000).

30
BANKS BULLETIN
TABLE 7. Changes in Regulatory Capital, end of period, in million kuna and %
Dec. 1997 Dec. 1998 Dec. 1999 Dec. 2000
Amount Share Amount Share Change Amount Share Change Amount Share Change
Group I 3,798.1 37.5 3,800.8 35.8 0.1 5,089.8 45.7 33.9 7,631.2 59.1 49.9
Group II 3,308.0 32.6 4,001.4 37.7 21.0 3,834.5 34.5 –4.2 3,144.6 24.3 –18.0
Group III 896.9 8.9 1,021.0 9.6 13.8 492.6 4.4 –51.8 924.5 7.2 87.7
Group IV 2,131.4 21.0 1,796.5 16.9 –15.7 1,711.9 15.4 –4.7 1,220.9 9.4 –28.7
Total 10,134.4 100.0 10,619.7 100.0 4.8 11,128.8 100.0 4.8 12,921.2 100.0 16.1
� The calculation of regulatory capital is regu-
lated by the Decision on the Methodology for
Calculating Bank’s Capital (Narodne novine,
Nos. 32/99 and 101/2000) and the pertaining in-
struction for its implementation (Instruction for
the Uniform Implementation of the Decision on
the Methodology for Calculating Bank’s Capital
– Narodne novine, Nos. 36/99 and 123/2000).
The reports submitted by banks are the source
of data on regulatory capital, and the schedule
for submitting these reports forms an integral
part of the stated regulation (Schedule CAP).
At the system level, equity grew continuously over the entire reporting pe-riod. In 2000, a 2 billion kuna growth was recorded, or 19.1 percent, whereasin the second half of 2000 alone, the growth amounted to 1 billion kuna, or 8.3percent.
The upward trend was caused by an increase in equity capital of Group Ibanks, which accounted for 60.5 percent of the total equity capital of banks atthe end of 2000.
FIGURE 7. Equity Capital
million kuna
0
2,000
4,000
6,000
8,000
10,000
12,000
14,000
Group I Group II Group III Group IV Total
December 31, 1997
December 31, 1998
December 31, 1999
December 31, 2000
� The calculation of equity capital is regulated
by the Decision on the Methodology for Calcu-
lating Bank’s Capital (Narodne novine, Nos.
32/99 and 101/2000) and the pertaining instruc-
tion for its implementation (Instruction for the
Uniform Implementation of the Decision on the
Methodology for Calculating Bank’s Capital –
Narodne novine, Nos. 36/99 and 123/2000).
This figure shows the changes in the equity capi-
tal in the observed period. The equity capital of
an individual bank group represents the sum of
amounts of equity capital of all banks included in
the group. The reports submitted by banks are
the source of data. The schedule for submitting
these reports forms an integral part of the stated
regulation (Schedule CAP).
The share of individual groups of banks in equity capital changed as follows:
� at the end of 1999, Group I accounted for 47.2 percent of equity capital, GroupII for 34.2 percent, Group III for 4.5 percent, and Group IV for 14.1 percent;
� in mid-2000, Group I accounted for 52.9 percent of equity capital, Group IIfor 28.9 percent, Group III for 4.4 percent, and Group IV for 13.8 percent;
� at the end of 2000, Group I accounted for 60.5 percent of equity capital, GroupII for 24.2 percent, Group III for 6.1 percent, and Group IV for 9.1 percent.
At the system level, supplementary capital rose by 254 million kuna, or 24.9percent, in 2000. In the second half of 2000 alone, this growth amounted to242 million kuna, or 23.4 percent.
The share of individual groups of banks in supplementary capital changed asfollows:
� at the end of 1999, Group I accounted for 43.5 percent of supplementarycapital, Group II for 26 percent, Group III for 2.9 percent, and Group IV for27.6 percent;
� in mid-2000, Group I accounted for 44.1 percent of supplementary capital,Group II for 25.6 percent, Group III for 4.9 percent and Group IV for 25.4percent;

31
INDICATORS OF OPERATIONS
� at the end of 2000, Group I accounted for 56.7 percent, Group II for 21.8percent, Group III for 16.2 percent and Group IV for 5.3 percent.
The capital to deposit ratio (Figure 9) shows that in contrast to smaller banks,the capital of larger banks participated significantly less in the sources offunds. This ratio amounted to 15.7 percent at end 2000 in Group I, whereas itwas 57.1 percent in Group IV.
In 2000, the capital/deposit ratio rose in Groups I, III, and IV. The increase inthe capital/deposit ratio of Groups I and III resulted from the increase in bothcapital and deposits, where capital growth was larger. In contrast, the in-crease in the capital/deposit ratio of Group IV resulted from the fall in bothdeposits and capital, where the decrease in deposits was larger.
At the end of 2000, the capital adequacy ratios6 were as follows: 20 percent inGroup I, 18.9 percent in Group II, 28.6 percent in Group III, and 46.7 percentin Group IV. At the same time, the capital adequacy ratio of the banking sys-tem amounted to 21.3 percent. At the system level, in 2000 the ratio increasedby 0.7 percentage points compared to 1999.
The change in the capital adequacy ratio of Group 1 in 2000 is primarily theresult of changes in risk-weighted assets, whereas in other Groups it wasmainly the result of changes in regulatory capital.
FIGURE 8. Supplementary Capital
0
200
400
600
800
1,000
1,200
1,400
Group I Group II Group III Group IV Total
December 31, 1997
December 31, 1998
December 31, 1999
December 31, 2000
million kuna
� The calculation of supplementary capital is
regulated by the Decision on the Methodology
for Calculating Bank’s Capital (Narodne novine,
Nos. 32/99 and 101/2000) and the pertaining in-
struction for its implementation (Instruction for
the Uniform Implementation of the Decision on
the Methodology for Calculating Bank’s Capital
– Narodne novine, Nos. 36/99 and 123/2000).
This figure shows changes in the supplementary
capital in the observed period. The supplemen-
tary capital of an individual bank group repre-
sents the sum of amounts of supplementary
capital of all banks included in the group. The re-
ports submitted by banks are the source of data.
The schedule for submitting these reports forms
an integral part of the stated regulation (Sched-
ule CAP).
FIGURE 9. Capital/Deposits
0
10
20
30
40
50
60
Group I Group II Group III Group IV Total
%
December 31, 1997
December 31, 1998
December 31, 1999
December 31, 2000
� Each bank group ratio between the capital
and deposits is calculated in the following man-
ner. First, the amounts of capital of all banks in a
relevant group are added up. Second, all depos-
its of the banks in the group are added up. The
sums thus calculated are mutually divided and
multiplied by 100.
The reports submitted by banks in Schedule BS
(Bank Statistical Report – Narodne novine, Nos.
57/99 and 3/2001) are the source of data on the
amount of capital.
The deposits used in this calculation are giro
and current account deposits, savings deposits
and time deposits. The reports submitted by
banks in Schedule BS/DEP (Bank Statistical Re-
port – Narodne novine, Nos. 57/99 and 3/2001)
are the source of data.
6 Pursuant to the Banking Law (Narodne
novine, No. 161/98) banks are obliged to
maintain the minimum capital adequacy ratio
of 10 percent. This provision came into force
on January 1, 2001 (see Articles 39 and 112
of the Law).
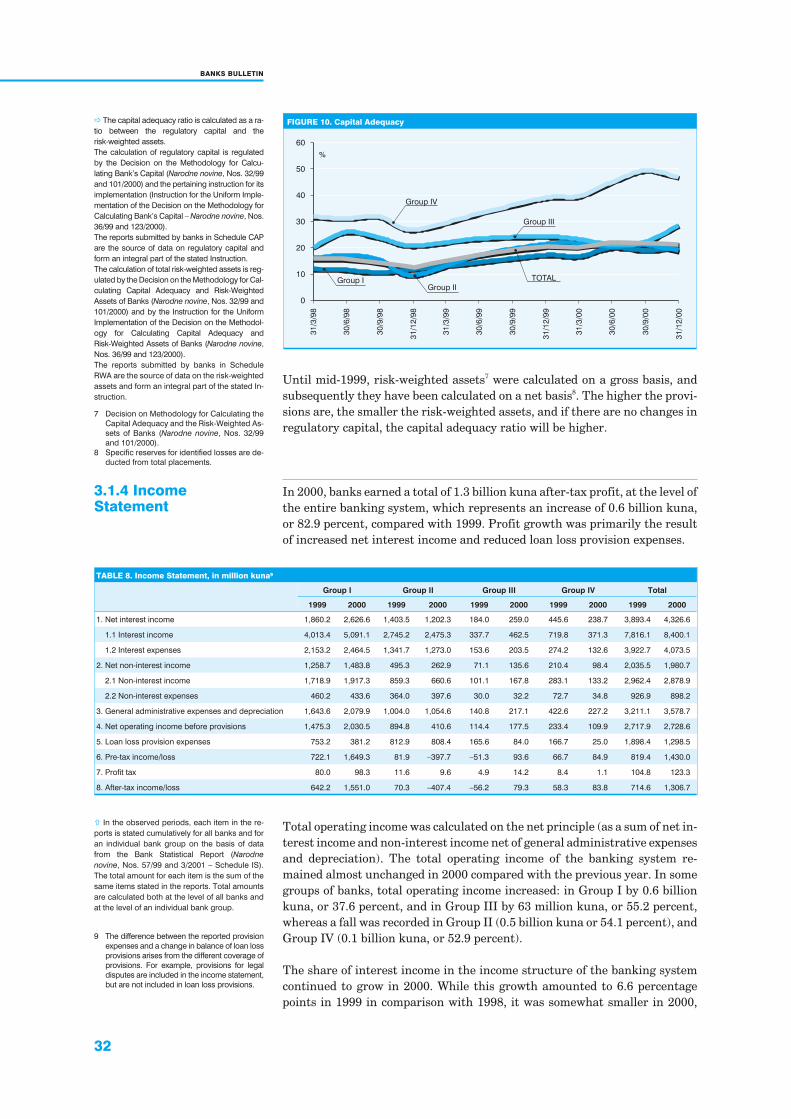
32
BANKS BULLETIN
FIGURE 10. Capital Adequacy
0
10
20
30
40
50
60
31
/3/9
8
30
/6/9
8
30
/9/9
8
31
/12
/98
31
/3/9
9
30
/6/9
9
30
/9/9
9
31
/12
/99
31
/3/0
0
30
/6/0
0
30
/9/0
0
31
/12
/00
%
Group I TOTAL
Group II
Group IV
Group III
� The capital adequacy ratio is calculated as a ra-
tio between the regulatory capital and the
risk-weighted assets.
The calculation of regulatory capital is regulated
by the Decision on the Methodology for Calcu-
lating Bank’s Capital (Narodne novine, Nos. 32/99
and 101/2000) and the pertaining instruction for its
implementation (Instruction for the Uniform Imple-
mentation of the Decision on the Methodology for
Calculating Bank’s Capital – Narodne novine, Nos.
36/99 and 123/2000).
The reports submitted by banks in Schedule CAP
are the source of data on regulatory capital and
form an integral part of the stated Instruction.
The calculation of total risk-weighted assets is reg-
ulated by the Decision on the Methodology for Cal-
culating Capital Adequacy and Risk-Weighted
Assets of Banks (Narodne novine, Nos. 32/99 and
101/2000) and by the Instruction for the Uniform
Implementation of the Decision on the Methodol-
ogy for Calculating Capital Adequacy and
Risk-Weighted Assets of Banks (Narodne novine,
Nos. 36/99 and 123/2000).
The reports submitted by banks in Schedule
RWA are the source of data on the risk-weighted
assets and form an integral part of the stated In-
struction.
Until mid-1999, risk-weighted assets7 were calculated on a gross basis, andsubsequently they have been calculated on a net basis8. The higher the provi-sions are, the smaller the risk-weighted assets, and if there are no changes inregulatory capital, the capital adequacy ratio will be higher.
3.1.4 IncomeStatement
In 2000, banks earned a total of 1.3 billion kuna after-tax profit, at the level ofthe entire banking system, which represents an increase of 0.6 billion kuna,or 82.9 percent, compared with 1999. Profit growth was primarily the resultof increased net interest income and reduced loan loss provision expenses.
� In the observed periods, each item in the re-
ports is stated cumulatively for all banks and for
an individual bank group on the basis of data
from the Bank Statistical Report (Narodne
novine, Nos. 57/99 and 3/2001 – Schedule IS).
The total amount for each item is the sum of the
same items stated in the reports. Total amounts
are calculated both at the level of all banks and
at the level of an individual bank group.
TABLE 8. Income Statement, in million kuna9
Group I Group II Group III Group IV Total
1999 2000 1999 2000 1999 2000 1999 2000 1999 2000
1. Net interest income 1,860.2 2,626.6 1,403.5 1,202.3 184.0 259.0 445.6 238.7 3,893.4 4,326.6
1.1 Interest income 4,013.4 5,091.1 2,745.2 2,475.3 337.7 462.5 719.8 371.3 7,816.1 8,400.1
1.2 Interest expenses 2,153.2 2,464.5 1,341.7 1,273.0 153.6 203.5 274.2 132.6 3,922.7 4,073.5
2. Net non-interest income 1,258.7 1,483.8 495.3 262.9 71.1 135.6 210.4 98.4 2,035.5 1,980.7
2.1 Non-interest income 1,718.9 1,917.3 859.3 660.6 101.1 167.8 283.1 133.2 2,962.4 2,878.9
2.2 Non-interest expenses 460.2 433.6 364.0 397.6 30.0 32.2 72.7 34.8 926.9 898.2
3. General administrative expenses and depreciation 1,643.6 2,079.9 1,004.0 1,054.6 140.8 217.1 422.6 227.2 3,211.1 3,578.7
4. Net operating income before provisions 1,475.3 2,030.5 894.8 410.6 114.4 177.5 233.4 109.9 2,717.9 2,728.6
5. Loan loss provision expenses 753.2 381.2 812.9 808.4 165.6 84.0 166.7 25.0 1,898.4 1,298.5
6. Pre-tax income/loss 722.1 1,649.3 81.9 –397.7 –51.3 93.6 66.7 84.9 819.4 1,430.0
7. Profit tax 80.0 98.3 11.6 9.6 4.9 14.2 8.4 1.1 104.8 123.3
8. After-tax income/loss 642.2 1,551.0 70.3 –407.4 –56.2 79.3 58.3 83.8 714.6 1,306.7
Total operating income was calculated on the net principle (as a sum of net in-terest income and non-interest income net of general administrative expensesand depreciation). The total operating income of the banking system re-mained almost unchanged in 2000 compared with the previous year. In somegroups of banks, total operating income increased: in Group I by 0.6 billionkuna, or 37.6 percent, and in Group III by 63 million kuna, or 55.2 percent,whereas a fall was recorded in Group II (0.5 billion kuna or 54.1 percent), andGroup IV (0.1 billion kuna, or 52.9 percent).
The share of interest income in the income structure of the banking systemcontinued to grow in 2000. While this growth amounted to 6.6 percentagepoints in 1999 in comparison with 1998, it was somewhat smaller in 2000,
9 The difference between the reported provision
expenses and a change in balance of loan loss
provisions arises from the different coverage of
provisions. For example, provisions for legal
disputes are included in the income statement,
but are not included in loan loss provisions.
7 Decision on Methodology for Calculating the
Capital Adequacy and the Risk-Weighted As-
sets of Banks (Narodne novine, Nos. 32/99
and 101/2000).
8 Specific reserves for identified losses are de-
ducted from total placements.
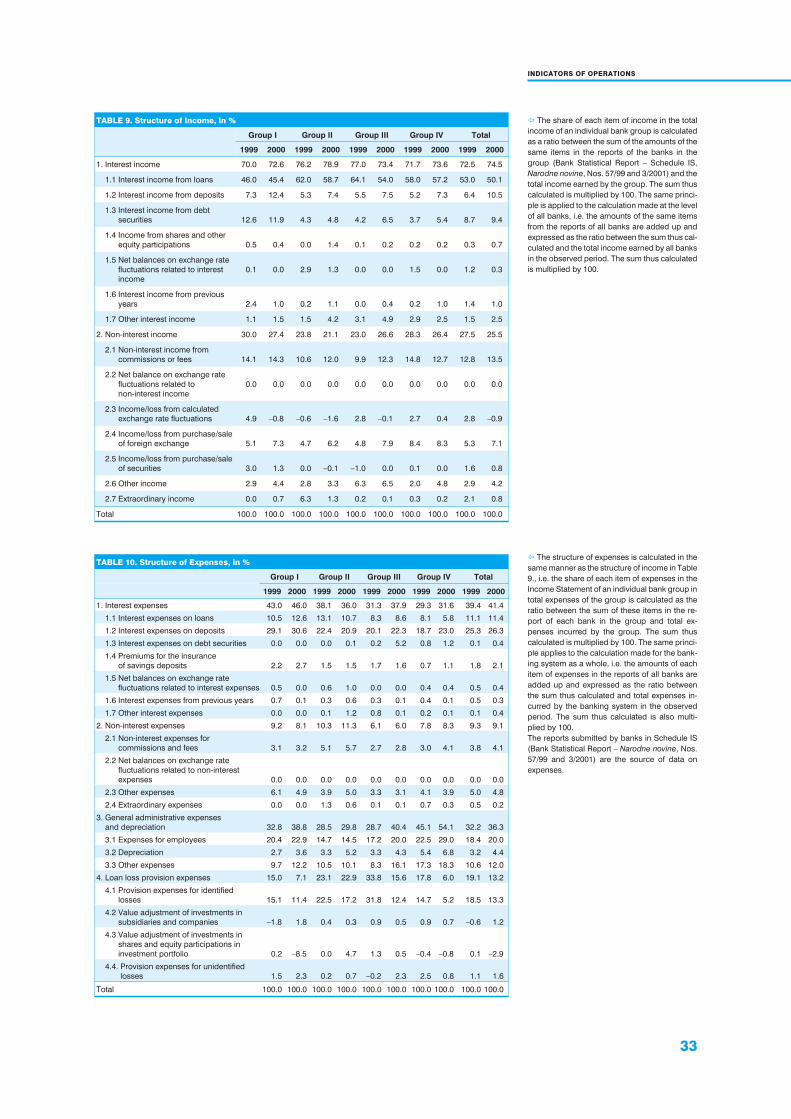
33
INDICATORS OF OPERATIONS
TABLE 9. Structure of Income, in %
Group I Group II Group III Group IV Total
1999 2000 1999 2000 1999 2000 1999 2000 1999 2000
1. Interest income 70.0 72.6 76.2 78.9 77.0 73.4 71.7 73.6 72.5 74.5
1.1 Interest income from loans 46.0 45.4 62.0 58.7 64.1 54.0 58.0 57.2 53.0 50.1
1.2 Interest income from deposits 7.3 12.4 5.3 7.4 5.5 7.5 5.2 7.3 6.4 10.5
1.3 Interest income from debt
securities 12.6 11.9 4.3 4.8 4.2 6.5 3.7 5.4 8.7 9.4
1.4 Income from shares and other
equity participations 0.5 0.4 0.0 1.4 0.1 0.2 0.2 0.2 0.3 0.7
1.5 Net balances on exchange rate
fluctuations related to interest
income
0.1 0.0 2.9 1.3 0.0 0.0 1.5 0.0 1.2 0.3
1.6 Interest income from previous
years 2.4 1.0 0.2 1.1 0.0 0.4 0.2 1.0 1.4 1.0
1.7 Other interest income 1.1 1.5 1.5 4.2 3.1 4.9 2.9 2.5 1.5 2.5
2. Non-interest income 30.0 27.4 23.8 21.1 23.0 26.6 28.3 26.4 27.5 25.5
2.1 Non-interest income from
commissions or fees 14.1 14.3 10.6 12.0 9.9 12.3 14.8 12.7 12.8 13.5
2.2 Net balance on exchange rate
fluctuations related to
non-interest income
0.0 0.0 0.0 0.0 0.0 0.0 0.0 0.0 0.0 0.0
2.3 Income/loss from calculated
exchange rate fluctuations 4.9 –0.8 –0.6 –1.6 2.8 –0.1 2.7 0.4 2.8 –0.9
2.4 Income/loss from purchase/sale
of foreign exchange 5.1 7.3 4.7 6.2 4.8 7.9 8.4 8.3 5.3 7.1
2.5 Income/loss from purchase/sale
of securities 3.0 1.3 0.0 –0.1 –1.0 0.0 0.1 0.0 1.6 0.8
2.6 Other income 2.9 4.4 2.8 3.3 6.3 6.5 2.0 4.8 2.9 4.2
2.7 Extraordinary income 0.0 0.7 6.3 1.3 0.2 0.1 0.3 0.2 2.1 0.8
Total 100.0 100.0 100.0 100.0 100.0 100.0 100.0 100.0 100.0 100.0
� The share of each item of income in the total
income of an individual bank group is calculated
as a ratio between the sum of the amounts of the
same items in the reports of the banks in the
group (Bank Statistical Report – Schedule IS,
Narodne novine, Nos. 57/99 and 3/2001) and the
total income earned by the group. The sum thus
calculated is multiplied by 100. The same princi-
ple is applied to the calculation made at the level
of all banks, i.e. the amounts of the same items
from the reports of all banks are added up and
expressed as the ratio between the sum thus cal-
culated and the total income earned by all banks
in the observed period. The sum thus calculated
is multiplied by 100.
TABLE 10. Structure of Expenses, in %
Group I Group II Group III Group IV Total
1999 2000 1999 2000 1999 2000 1999 2000 1999 2000
1. Interest expenses 43.0 46.0 38.1 36.0 31.3 37.9 29.3 31.6 39.4 41.4
1.1 Interest expenses on loans 10.5 12.6 13.1 10.7 8.3 8.6 8.1 5.8 11.1 11.4
1.2 Interest expenses on deposits 29.1 30.6 22.4 20.9 20.1 22.3 18.7 23.0 25.3 26.3
1.3 Interest expenses on debt securities 0.0 0.0 0.0 0.1 0.2 5.2 0.8 1.2 0.1 0.4
1.4 Premiums for the insurance
of savings deposits 2.2 2.7 1.5 1.5 1.7 1.6 0.7 1.1 1.8 2.1
1.5 Net balances on exchange rate
fluctuations related to interest expenses 0.5 0.0 0.6 1.0 0.0 0.0 0.4 0.4 0.5 0.4
1.6 Interest expenses from previous years 0.7 0.1 0.3 0.6 0.3 0.1 0.4 0.1 0.5 0.3
1.7 Other interest expenses 0.0 0.0 0.1 1.2 0.8 0.1 0.2 0.1 0.1 0.4
2. Non-interest expenses 9.2 8.1 10.3 11.3 6.1 6.0 7.8 8.3 9.3 9.1
2.1 Non-interest expenses for
commissions and fees 3.1 3.2 5.1 5.7 2.7 2.8 3.0 4.1 3.8 4.1
2.2 Net balances on exchange rate
fluctuations related to non-interest
expenses 0.0 0.0 0.0 0.0 0.0 0.0 0.0 0.0 0.0 0.0
2.3 Other expenses 6.1 4.9 3.9 5.0 3.3 3.1 4.1 3.9 5.0 4.8
2.4 Extraordinary expenses 0.0 0.0 1.3 0.6 0.1 0.1 0.7 0.3 0.5 0.2
3. General administrative expenses
and depreciation 32.8 38.8 28.5 29.8 28.7 40.4 45.1 54.1 32.2 36.3
3.1 Expenses for employees 20.4 22.9 14.7 14.5 17.2 20.0 22.5 29.0 18.4 20.0
3.2 Depreciation 2.7 3.6 3.3 5.2 3.3 4.3 5.4 6.8 3.2 4.4
3.3 Other expenses 9.7 12.2 10.5 10.1 8.3 16.1 17.3 18.3 10.6 12.0
4. Loan loss provision expenses 15.0 7.1 23.1 22.9 33.8 15.6 17.8 6.0 19.1 13.2
4.1 Provision expenses for identified
losses 15.1 11.4 22.5 17.2 31.8 12.4 14.7 5.2 18.5 13.3
4.2 Value adjustment of investments in
subsidiaries and companies –1.8 1.8 0.4 0.3 0.9 0.5 0.9 0.7 –0.6 1.2
4.3 Value adjustment of investments in
shares and equity participations in
investment portfolio 0.2 –8.5 0.0 4.7 1.3 0.5 –0.4 –0.8 0.1 –2.9
4.4. Provision expenses for unidentified
losses 1.5 2.3 0.2 0.7 –0.2 2.3 2.5 0.8 1.1 1.6
Total 100.0 100.0 100.0 100.0 100.0 100.0 100.0 100.0 100.0 100.0
� The structure of expenses is calculated in the
same manner as the structure of income in Table
9., i.e. the share of each item of expenses in the
Income Statement of an individual bank group in
total expenses of the group is calculated as the
ratio between the sum of these items in the re-
port of each bank in the group and total ex-
penses incurred by the group. The sum thus
calculated is multiplied by 100. The same princi-
ple applies to the calculation made for the bank-
ing system as a whole, i.e. the amounts of each
item of expenses in the reports of all banks are
added up and expressed as the ratio between
the sum thus calculated and total expenses in-
curred by the banking system in the observed
period. The sum thus calculated is also multi-
plied by 100.
The reports submitted by banks in Schedule IS
(Bank Statistical Report – Narodne novine, Nos.
57/99 and 3/2001) are the source of data on
expenses.
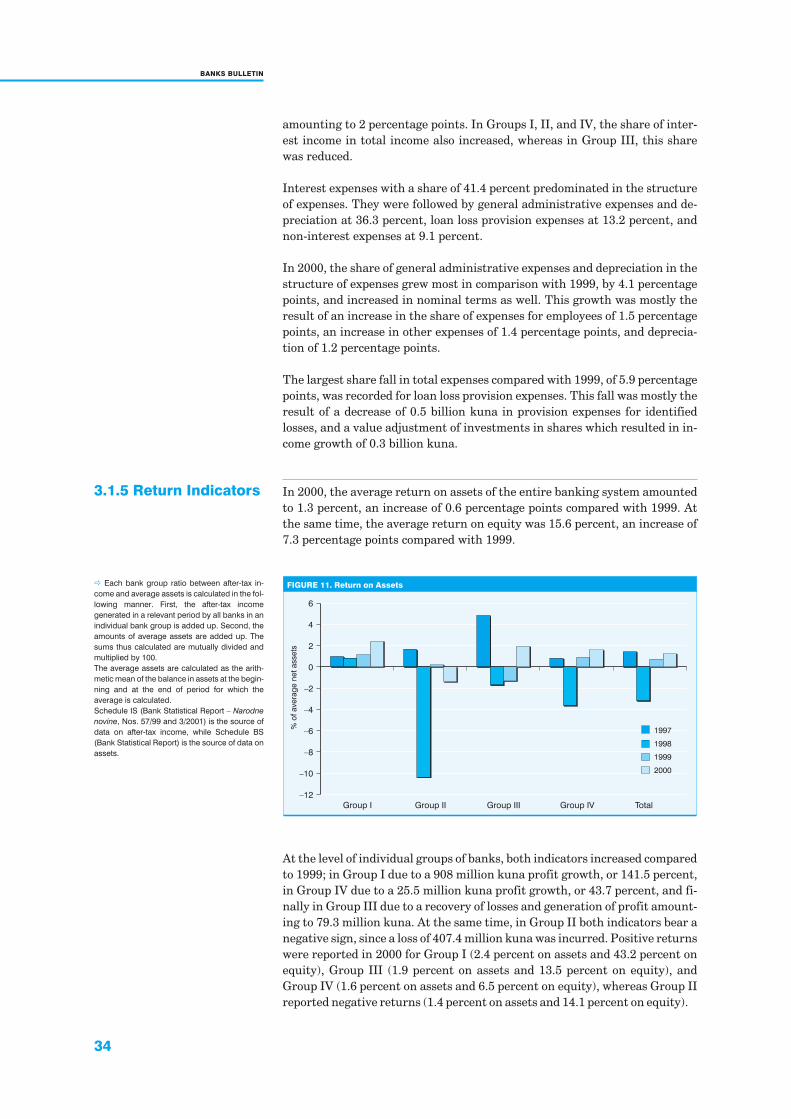
34
BANKS BULLETIN
amounting to 2 percentage points. In Groups I, II, and IV, the share of inter-est income in total income also increased, whereas in Group III, this sharewas reduced.
Interest expenses with a share of 41.4 percent predominated in the structureof expenses. They were followed by general administrative expenses and de-preciation at 36.3 percent, loan loss provision expenses at 13.2 percent, andnon-interest expenses at 9.1 percent.
In 2000, the share of general administrative expenses and depreciation in thestructure of expenses grew most in comparison with 1999, by 4.1 percentagepoints, and increased in nominal terms as well. This growth was mostly theresult of an increase in the share of expenses for employees of 1.5 percentagepoints, an increase in other expenses of 1.4 percentage points, and deprecia-tion of 1.2 percentage points.
The largest share fall in total expenses compared with 1999, of 5.9 percentagepoints, was recorded for loan loss provision expenses. This fall was mostly theresult of a decrease of 0.5 billion kuna in provision expenses for identifiedlosses, and a value adjustment of investments in shares which resulted in in-come growth of 0.3 billion kuna.
3.1.5 Return Indicators In 2000, the average return on assets of the entire banking system amountedto 1.3 percent, an increase of 0.6 percentage points compared with 1999. Atthe same time, the average return on equity was 15.6 percent, an increase of7.3 percentage points compared with 1999.
� Each bank group ratio between after-tax in-
come and average assets is calculated in the fol-
lowing manner. First, the after-tax income
generated in a relevant period by all banks in an
individual bank group is added up. Second, the
amounts of average assets are added up. The
sums thus calculated are mutually divided and
multiplied by 100.
The average assets are calculated as the arith-
metic mean of the balance in assets at the begin-
ning and at the end of period for which the
average is calculated.
Schedule IS (Bank Statistical Report – Narodne
novine, Nos. 57/99 and 3/2001) is the source of
data on after-tax income, while Schedule BS
(Bank Statistical Report) is the source of data on
assets.
FIGURE 11. Return on Assets
–12
–10
–8
–6
–4
–2
0
2
4
6
Group I Group II Group III Group IV Total
%o
fave
rag
en
et
assets
1997
1998
1999
2000
At the level of individual groups of banks, both indicators increased comparedto 1999; in Group I due to a 908 million kuna profit growth, or 141.5 percent,in Group IV due to a 25.5 million kuna profit growth, or 43.7 percent, and fi-nally in Group III due to a recovery of losses and generation of profit amount-ing to 79.3 million kuna. At the same time, in Group II both indicators bear anegative sign, since a loss of 407.4 million kuna was incurred. Positive returnswere reported in 2000 for Group I (2.4 percent on assets and 43.2 percent onequity), Group III (1.9 percent on assets and 13.5 percent on equity), andGroup IV (1.6 percent on assets and 6.5 percent on equity), whereas Group IIreported negative returns (1.4 percent on assets and 14.1 percent on equity).
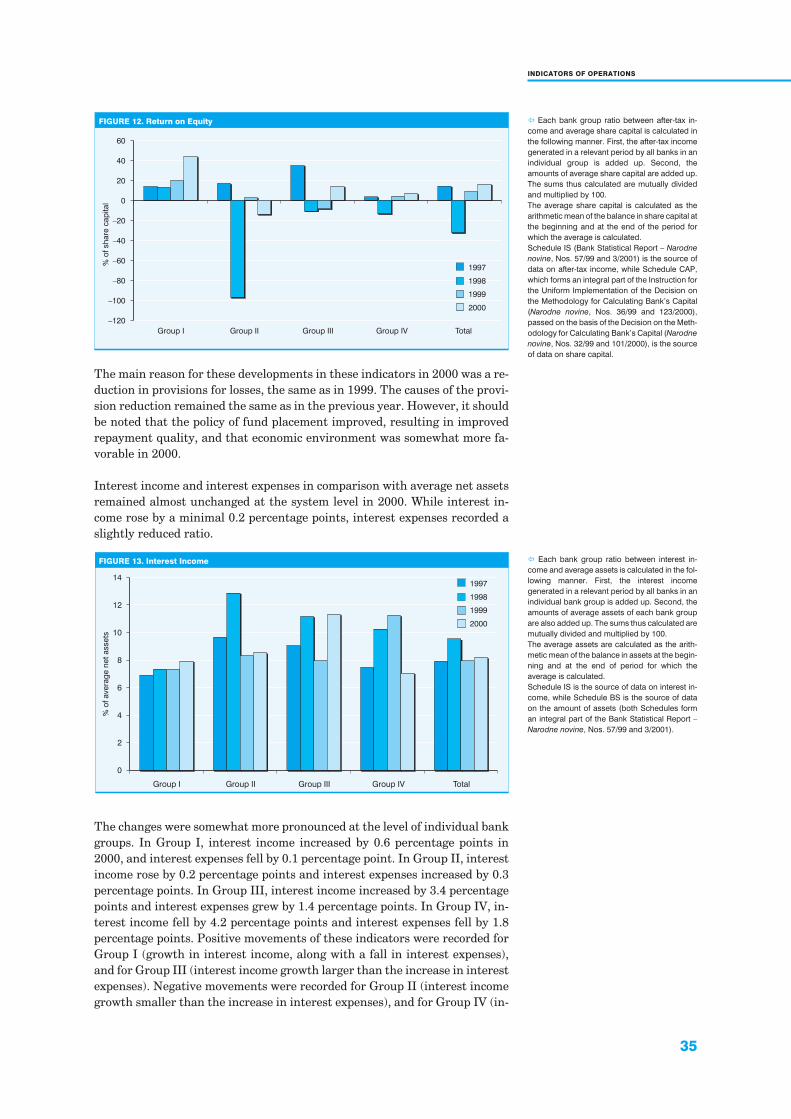
35
INDICATORS OF OPERATIONS
The main reason for these developments in these indicators in 2000 was a re-duction in provisions for losses, the same as in 1999. The causes of the provi-sion reduction remained the same as in the previous year. However, it shouldbe noted that the policy of fund placement improved, resulting in improvedrepayment quality, and that economic environment was somewhat more fa-vorable in 2000.
Interest income and interest expenses in comparison with average net assetsremained almost unchanged at the system level in 2000. While interest in-come rose by a minimal 0.2 percentage points, interest expenses recorded aslightly reduced ratio.
The changes were somewhat more pronounced at the level of individual bankgroups. In Group I, interest income increased by 0.6 percentage points in2000, and interest expenses fell by 0.1 percentage point. In Group II, interestincome rose by 0.2 percentage points and interest expenses increased by 0.3percentage points. In Group III, interest income increased by 3.4 percentagepoints and interest expenses grew by 1.4 percentage points. In Group IV, in-terest income fell by 4.2 percentage points and interest expenses fell by 1.8percentage points. Positive movements of these indicators were recorded forGroup I (growth in interest income, along with a fall in interest expenses),and for Group III (interest income growth larger than the increase in interestexpenses). Negative movements were recorded for Group II (interest incomegrowth smaller than the increase in interest expenses), and for Group IV (in-
FIGURE 12. Return on Equity
Group I Group II Group III Group IV Total
–120
–100
–80
–60
–40
–20
0
20
40
60
1997
1998
1999
2000
%o
fsh
are
cap
ital
� Each bank group ratio between after-tax in-
come and average share capital is calculated in
the following manner. First, the after-tax income
generated in a relevant period by all banks in an
individual group is added up. Second, the
amounts of average share capital are added up.
The sums thus calculated are mutually divided
and multiplied by 100.
The average share capital is calculated as the
arithmetic mean of the balance in share capital at
the beginning and at the end of the period for
which the average is calculated.
Schedule IS (Bank Statistical Report – Narodne
novine, Nos. 57/99 and 3/2001) is the source of
data on after-tax income, while Schedule CAP,
which forms an integral part of the Instruction for
the Uniform Implementation of the Decision on
the Methodology for Calculating Bank’s Capital
(Narodne novine, Nos. 36/99 and 123/2000),
passed on the basis of the Decision on the Meth-
odology for Calculating Bank’s Capital (Narodne
novine, Nos. 32/99 and 101/2000), is the source
of data on share capital.
FIGURE 13. Interest Income
1997
1998
1999
2000
%o
fn
et
assets
avera
ge
0
2
4
6
8
10
12
14
Group I Group II Group III Group IV Total
� Each bank group ratio between interest in-
come and average assets is calculated in the fol-
lowing manner. First, the interest income
generated in a relevant period by all banks in an
individual bank group is added up. Second, the
amounts of average assets of each bank group
are also added up. The sums thus calculated are
mutually divided and multiplied by 100.
The average assets are calculated as the arith-
metic mean of the balance in assets at the begin-
ning and at the end of period for which the
average is calculated.
Schedule IS is the source of data on interest in-
come, while Schedule BS is the source of data
on the amount of assets (both Schedules form
an integral part of the Bank Statistical Report –
Narodne novine, Nos. 57/99 and 3/2001).
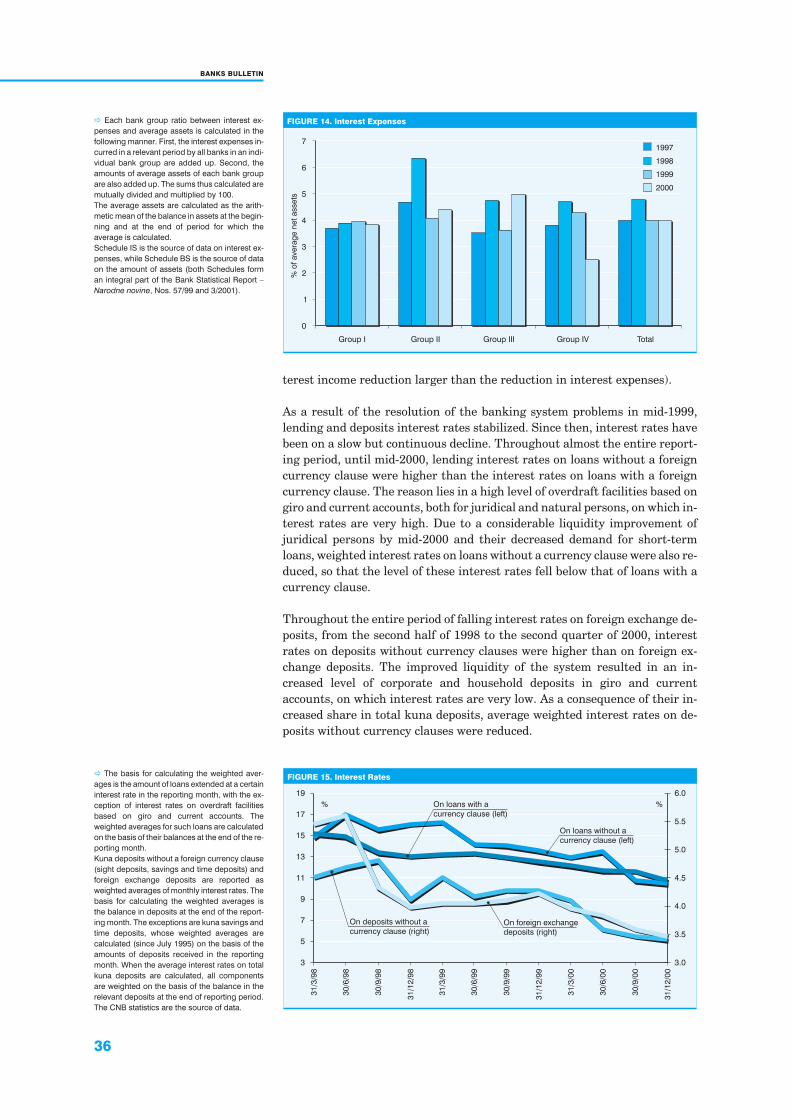
36
BANKS BULLETIN
terest income reduction larger than the reduction in interest expenses).
As a result of the resolution of the banking system problems in mid-1999,lending and deposits interest rates stabilized. Since then, interest rates havebeen on a slow but continuous decline. Throughout almost the entire report-ing period, until mid-2000, lending interest rates on loans without a foreigncurrency clause were higher than the interest rates on loans with a foreigncurrency clause. The reason lies in a high level of overdraft facilities based ongiro and current accounts, both for juridical and natural persons, on which in-terest rates are very high. Due to a considerable liquidity improvement ofjuridical persons by mid-2000 and their decreased demand for short-termloans, weighted interest rates on loans without a currency clause were also re-duced, so that the level of these interest rates fell below that of loans with acurrency clause.
Throughout the entire period of falling interest rates on foreign exchange de-posits, from the second half of 1998 to the second quarter of 2000, interestrates on deposits without currency clauses were higher than on foreign ex-change deposits. The improved liquidity of the system resulted in an in-creased level of corporate and household deposits in giro and currentaccounts, on which interest rates are very low. As a consequence of their in-creased share in total kuna deposits, average weighted interest rates on de-posits without currency clauses were reduced.
FIGURE 14. Interest Expenses
0
1
2
3
4
5
6
7
Group I Group II Group III Group IV Total
1997
1998
1999
2000
%o
favera
ge
assets
net
� Each bank group ratio between interest ex-
penses and average assets is calculated in the
following manner. First, the interest expenses in-
curred in a relevant period by all banks in an indi-
vidual bank group are added up. Second, the
amounts of average assets of each bank group
are also added up. The sums thus calculated are
mutually divided and multiplied by 100.
The average assets are calculated as the arith-
metic mean of the balance in assets at the begin-
ning and at the end of period for which the
average is calculated.
Schedule IS is the source of data on interest ex-
penses, while Schedule BS is the source of data
on the amount of assets (both Schedules form
an integral part of the Bank Statistical Report –
Narodne novine, Nos. 57/99 and 3/2001).
� The basis for calculating the weighted aver-
ages is the amount of loans extended at a certain
interest rate in the reporting month, with the ex-
ception of interest rates on overdraft facilities
based on giro and current accounts. The
weighted averages for such loans are calculated
on the basis of their balances at the end of the re-
porting month.
Kuna deposits without a foreign currency clause
(sight deposits, savings and time deposits) and
foreign exchange deposits are reported as
weighted averages of monthly interest rates. The
basis for calculating the weighted averages is
the balance in deposits at the end of the report-
ing month. The exceptions are kuna savings and
time deposits, whose weighted averages are
calculated (since July 1995) on the basis of the
amounts of deposits received in the reporting
month. When the average interest rates on total
kuna deposits are calculated, all components
are weighted on the basis of the balance in the
relevant deposits at the end of reporting period.
The CNB statistics are the source of data.
FIGURE 15. Interest Rates
3
5
7
9
11
13
15
17
19
3.0
3.5
4.0
4.5
5.0
5.5
6.0
31
/3/9
8
30
/6/9
8
30
/9/9
8
31
/12
/98
31
/3/9
9
30
/6/9
9
30
/9/9
9
31
/12
/99
31
/3/0
0
30
/6/0
0
30
/9/0
0
31
/12
/00
On loans with a
currency clause (left)
On loans without a
currency clause (left)
On foreign exchange
deposits (right)
On deposits without a
currency clause (right)
%%
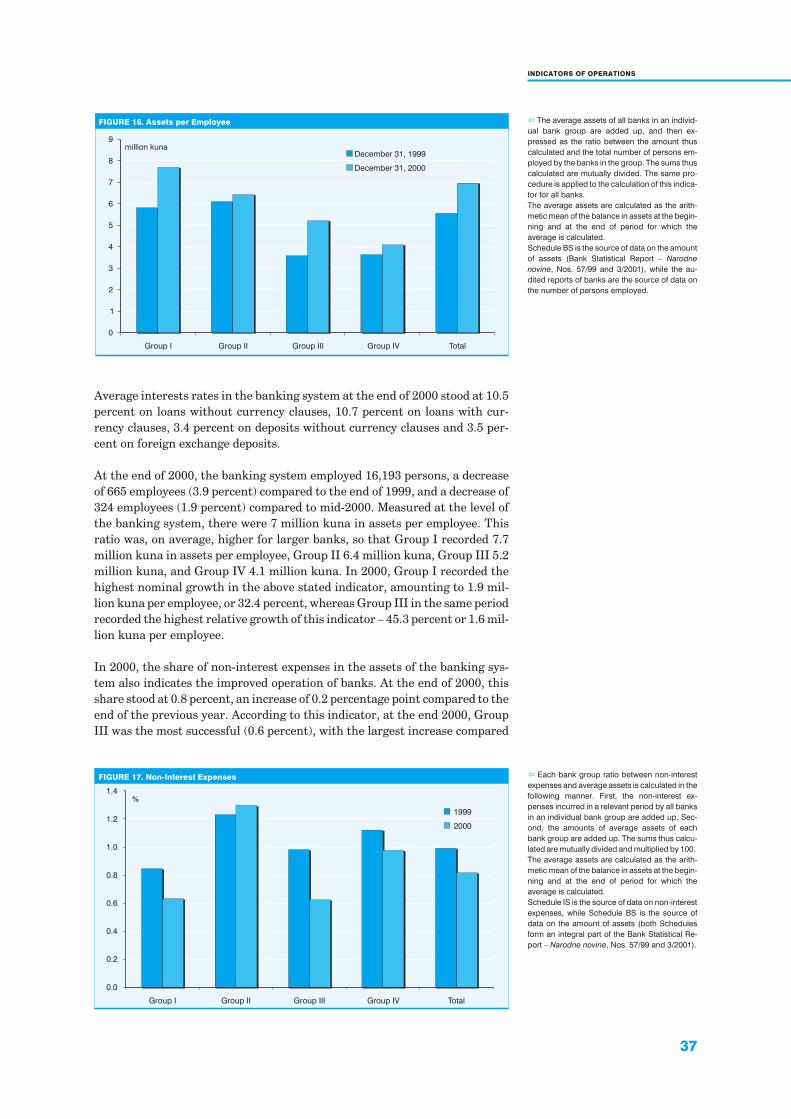
37
INDICATORS OF OPERATIONS
Average interests rates in the banking system at the end of 2000 stood at 10.5percent on loans without currency clauses, 10.7 percent on loans with cur-rency clauses, 3.4 percent on deposits without currency clauses and 3.5 per-cent on foreign exchange deposits.
At the end of 2000, the banking system employed 16,193 persons, a decreaseof 665 employees (3.9 percent) compared to the end of 1999, and a decrease of324 employees (1.9 percent) compared to mid-2000. Measured at the level ofthe banking system, there were 7 million kuna in assets per employee. Thisratio was, on average, higher for larger banks, so that Group I recorded 7.7million kuna in assets per employee, Group II 6.4 million kuna, Group III 5.2million kuna, and Group IV 4.1 million kuna. In 2000, Group I recorded thehighest nominal growth in the above stated indicator, amounting to 1.9 mil-lion kuna per employee, or 32.4 percent, whereas Group III in the same periodrecorded the highest relative growth of this indicator – 45.3 percent or 1.6 mil-lion kuna per employee.
In 2000, the share of non-interest expenses in the assets of the banking sys-tem also indicates the improved operation of banks. At the end of 2000, thisshare stood at 0.8 percent, an increase of 0.2 percentage point compared to theend of the previous year. According to this indicator, at the end 2000, GroupIII was the most successful (0.6 percent), with the largest increase compared
FIGURE 16. Assets per Employee
December 31, 1999
December 31, 2000
million kuna
0
1
2
3
4
5
6
7
8
9
Group I Group II Group III Group IV Total
� The average assets of all banks in an individ-
ual bank group are added up, and then ex-
pressed as the ratio between the amount thus
calculated and the total number of persons em-
ployed by the banks in the group. The sums thus
calculated are mutually divided. The same pro-
cedure is applied to the calculation of this indica-
tor for all banks.
The average assets are calculated as the arith-
metic mean of the balance in assets at the begin-
ning and at the end of period for which the
average is calculated.
Schedule BS is the source of data on the amount
of assets (Bank Statistical Report – Narodne
novine, Nos. 57/99 and 3/2001), while the au-
dited reports of banks are the source of data on
the number of persons employed.
FIGURE 17. Non-Interest Expenses
%
0.0
0.2
0.4
0.6
0.8
1.0
1.2
1.4
Group I Group II Group III Group IV Total
1999
2000
� Each bank group ratio between non-interest
expenses and average assets is calculated in the
following manner. First, the non-interest ex-
penses incurred in a relevant period by all banks
in an individual bank group are added up. Sec-
ond, the amounts of average assets of each
bank group are added up. The sums thus calcu-
lated are mutually divided and multiplied by 100.
The average assets are calculated as the arith-
metic mean of the balance in assets at the begin-
ning and at the end of period for which the
average is calculated.
Schedule IS is the source of data on non-interest
expenses, while Schedule BS is the source of
data on the amount of assets (both Schedules
form an integral part of the Bank Statistical Re-
port – Narodne novine, Nos. 57/99 and 3/2001).
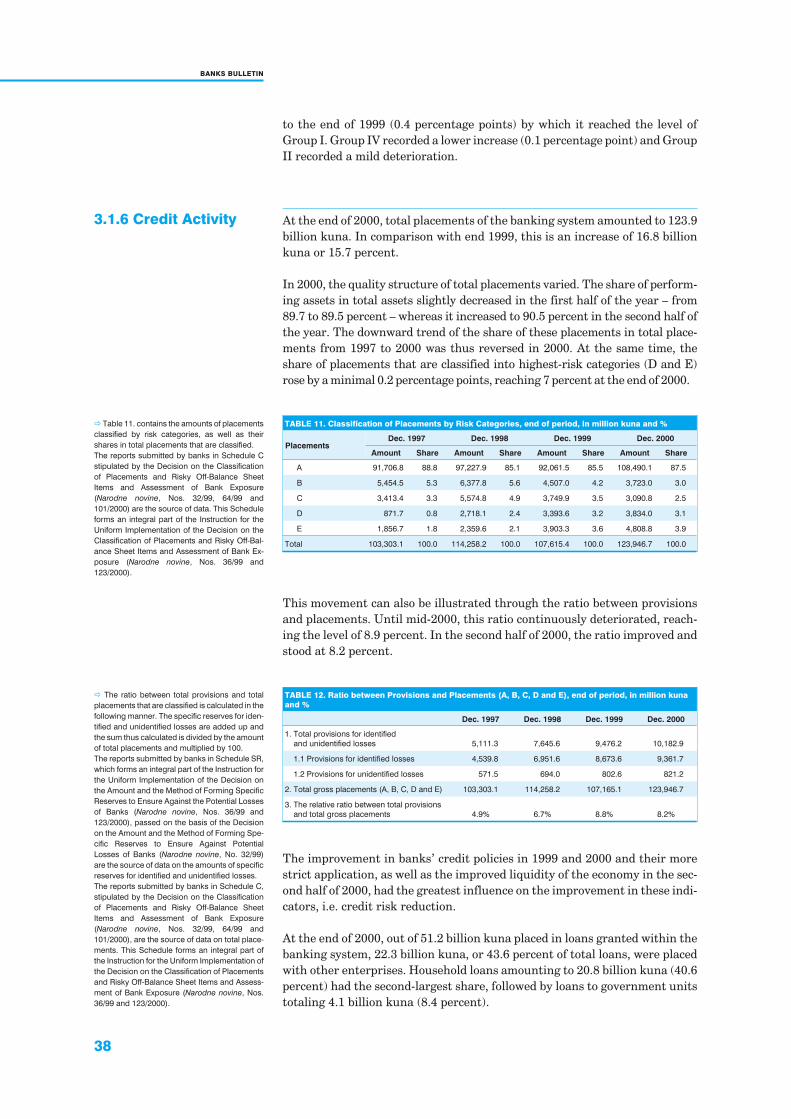
38
BANKS BULLETIN
to the end of 1999 (0.4 percentage points) by which it reached the level ofGroup I. Group IV recorded a lower increase (0.1 percentage point) and GroupII recorded a mild deterioration.
3.1.6 Credit Activity At the end of 2000, total placements of the banking system amounted to 123.9billion kuna. In comparison with end 1999, this is an increase of 16.8 billionkuna or 15.7 percent.
In 2000, the quality structure of total placements varied. The share of perform-ing assets in total assets slightly decreased in the first half of the year – from89.7 to 89.5 percent – whereas it increased to 90.5 percent in the second half ofthe year. The downward trend of the share of these placements in total place-ments from 1997 to 2000 was thus reversed in 2000. At the same time, theshare of placements that are classified into highest-risk categories (D and E)rose by a minimal 0.2 percentage points, reaching 7 percent at the end of 2000.
TABLE 11. Classification of Placements by Risk Categories, end of period, in million kuna and %
PlacementsDec. 1997 Dec. 1998 Dec. 1999 Dec. 2000
Amount Share Amount Share Amount Share Amount Share
A 91,706.8 88.8 97,227.9 85.1 92,061.5 85.5 108,490.1 87.5
B 5,454.5 5.3 6,377.8 5.6 4,507.0 4.2 3,723.0 3.0
C 3,413.4 3.3 5,574.8 4.9 3,749.9 3.5 3,090.8 2.5
D 871.7 0.8 2,718.1 2.4 3,393.6 3.2 3,834.0 3.1
E 1,856.7 1.8 2,359.6 2.1 3,903.3 3.6 4,808.8 3.9
Total 103,303.1 100.0 114,258.2 100.0 107,615.4 100.0 123,946.7 100.0
� Table 11. contains the amounts of placements
classified by risk categories, as well as their
shares in total placements that are classified.
The reports submitted by banks in Schedule C
stipulated by the Decision on the Classification
of Placements and Risky Off-Balance Sheet
Items and Assessment of Bank Exposure
(Narodne novine, Nos. 32/99, 64/99 and
101/2000) are the source of data. This Schedule
forms an integral part of the Instruction for the
Uniform Implementation of the Decision on the
Classification of Placements and Risky Off-Bal-
ance Sheet Items and Assessment of Bank Ex-
posure (Narodne novine, Nos. 36/99 and
123/2000).
This movement can also be illustrated through the ratio between provisionsand placements. Until mid-2000, this ratio continuously deteriorated, reach-ing the level of 8.9 percent. In the second half of 2000, the ratio improved andstood at 8.2 percent.
TABLE 12. Ratio between Provisions and Placements (A, B, C, D and E), end of period, in million kuna
and %
Dec. 1997 Dec. 1998 Dec. 1999 Dec. 2000
1. Total provisions for identified
and unidentified losses 5,111.3 7,645.6 9,476.2 10,182.9
1.1 Provisions for identified losses 4,539.8 6,951.6 8,673.6 9,361.7
1.2 Provisions for unidentified losses 571.5 694.0 802.6 821.2
2. Total gross placements (A, B, C, D and E) 103,303.1 114,258.2 107,165.1 123,946.7
3. The relative ratio between total provisions
and total gross placements 4.9% 6.7% 8.8% 8.2%
� The ratio between total provisions and total
placements that are classified is calculated in the
following manner. The specific reserves for iden-
tified and unidentified losses are added up and
the sum thus calculated is divided by the amount
of total placements and multiplied by 100.
The reports submitted by banks in Schedule SR,
which forms an integral part of the Instruction for
the Uniform Implementation of the Decision on
the Amount and the Method of Forming Specific
Reserves to Ensure Against the Potential Losses
of Banks (Narodne novine, Nos. 36/99 and
123/2000), passed on the basis of the Decision
on the Amount and the Method of Forming Spe-
cific Reserves to Ensure Against Potential
Losses of Banks (Narodne novine, No. 32/99)
are the source of data on the amounts of specific
reserves for identified and unidentified losses.
The reports submitted by banks in Schedule C,
stipulated by the Decision on the Classification
of Placements and Risky Off-Balance Sheet
Items and Assessment of Bank Exposure
(Narodne novine, Nos. 32/99, 64/99 and
101/2000), are the source of data on total place-
ments. This Schedule forms an integral part of
the Instruction for the Uniform Implementation of
the Decision on the Classification of Placements
and Risky Off-Balance Sheet Items and Assess-
ment of Bank Exposure (Narodne novine, Nos.
36/99 and 123/2000).
The improvement in banks’ credit policies in 1999 and 2000 and their morestrict application, as well as the improved liquidity of the economy in the sec-ond half of 2000, had the greatest influence on the improvement in these indi-cators, i.e. credit risk reduction.
At the end of 2000, out of 51.2 billion kuna placed in loans granted within thebanking system, 22.3 billion kuna, or 43.6 percent of total loans, were placedwith other enterprises. Household loans amounting to 20.8 billion kuna (40.6percent) had the second-largest share, followed by loans to government unitstotaling 4.1 billion kuna (8.4 percent).
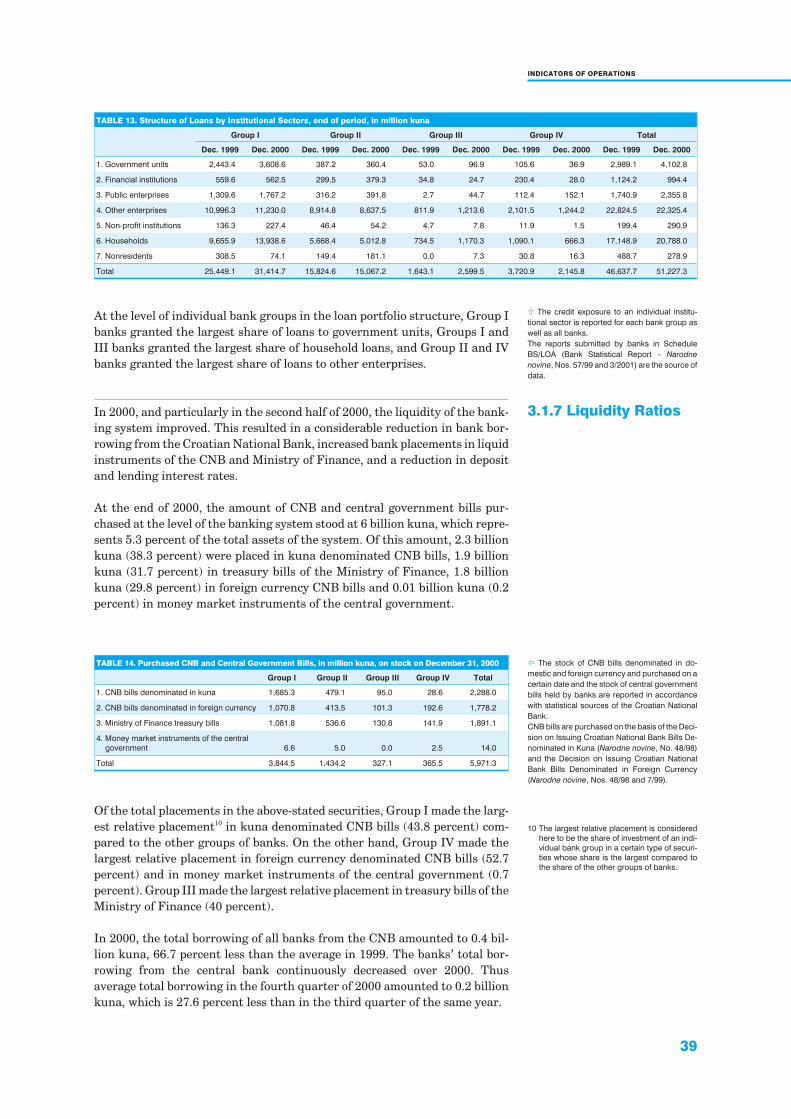
39
INDICATORS OF OPERATIONS
At the level of individual bank groups in the loan portfolio structure, Group Ibanks granted the largest share of loans to government units, Groups I andIII banks granted the largest share of household loans, and Group II and IVbanks granted the largest share of loans to other enterprises.
3.1.7 Liquidity RatiosIn 2000, and particularly in the second half of 2000, the liquidity of the bank-ing system improved. This resulted in a considerable reduction in bank bor-rowing from the Croatian National Bank, increased bank placements in liquidinstruments of the CNB and Ministry of Finance, and a reduction in depositand lending interest rates.
At the end of 2000, the amount of CNB and central government bills pur-chased at the level of the banking system stood at 6 billion kuna, which repre-sents 5.3 percent of the total assets of the system. Of this amount, 2.3 billionkuna (38.3 percent) were placed in kuna denominated CNB bills, 1.9 billionkuna (31.7 percent) in treasury bills of the Ministry of Finance, 1.8 billionkuna (29.8 percent) in foreign currency CNB bills and 0.01 billion kuna (0.2percent) in money market instruments of the central government.
TABLE 13. Structure of Loans by Institutional Sectors, end of period, in million kuna
Group I Group II Group III Group IV Total
Dec. 1999 Dec. 2000 Dec. 1999 Dec. 2000 Dec. 1999 Dec. 2000 Dec. 1999 Dec. 2000 Dec. 1999 Dec. 2000
1. Government units 2,443.4 3,608.6 387.2 360.4 53.0 96.9 105.6 36.9 2,989.1 4,102.8
2. Financial institutions 559.6 562.5 299.5 379.3 34.8 24.7 230.4 28.0 1,124.2 994.4
3. Public enterprises 1,309.6 1,767.2 316.2 391.8 2.7 44.7 112.4 152.1 1,740.9 2,355.8
4. Other enterprises 10,996.3 11,230.0 8,914.8 8,637.5 811.9 1,213.6 2,101.5 1,244.2 22,824.5 22,325.4
5. Non-profit institutions 136.3 227.4 46.4 54.2 4.7 7.8 11.9 1.5 199.4 290.9
6. Households 9,655.9 13,938.6 5,668.4 5,012.8 734.5 1,170.3 1,090.1 666.3 17,148.9 20,788.0
7. Nonresidents 308.5 74.1 149.4 181.1 0.0 7.3 30.8 16.3 488.7 278.9
Total 25,449.1 31,414.7 15,824.6 15,067.2 1,643.1 2,599.5 3,720.9 2,145.8 46,637.7 51,227.3
� The credit exposure to an individual institu-
tional sector is reported for each bank group as
well as all banks.
The reports submitted by banks in Schedule
BS/LOA (Bank Statistical Report – Narodne
novine, Nos. 57/99 and 3/2001) are the source of
data.
TABLE 14. Purchased CNB and Central Government Bills, in million kuna, on stock on December 31, 2000
Group I Group II Group III Group IV Total
1. CNB bills denominated in kuna 1,685.3 479.1 95.0 28.6 2,288.0
2. CNB bills denominated in foreign currency 1,070.8 413.5 101.3 192.6 1,778.2
3. Ministry of Finance treasury bills 1,081.8 536.6 130.8 141.9 1,891.1
4. Money market instruments of the central
government 6.6 5.0 0.0 2.5 14.0
Total 3,844.5 1,434.2 327.1 365.5 5,971.3
� The stock of CNB bills denominated in do-
mestic and foreign currency and purchased on a
certain date and the stock of central government
bills held by banks are reported in accordance
with statistical sources of the Croatian National
Bank.
CNB bills are purchased on the basis of the Deci-
sion on Issuing Croatian National Bank Bills De-
nominated in Kuna (Narodne novine, No. 48/98)
and the Decision on Issuing Croatian National
Bank Bills Denominated in Foreign Currency
(Narodne novine, Nos. 48/98 and 7/99).
Of the total placements in the above-stated securities, Group I made the larg-est relative placement10 in kuna denominated CNB bills (43.8 percent) com-pared to the other groups of banks. On the other hand, Group IV made thelargest relative placement in foreign currency denominated CNB bills (52.7percent) and in money market instruments of the central government (0.7percent). Group III made the largest relative placement in treasury bills of theMinistry of Finance (40 percent).
In 2000, the total borrowing of all banks from the CNB amounted to 0.4 bil-lion kuna, 66.7 percent less than the average in 1999. The banks’ total bor-rowing from the central bank continuously decreased over 2000. Thusaverage total borrowing in the fourth quarter of 2000 amounted to 0.2 billionkuna, which is 27.6 percent less than in the third quarter of the same year.
10 The largest relative placement is considered
here to be the share of investment of an indi-
vidual bank group in a certain type of securi-
ties whose share is the largest compared to
the share of the other groups of banks.
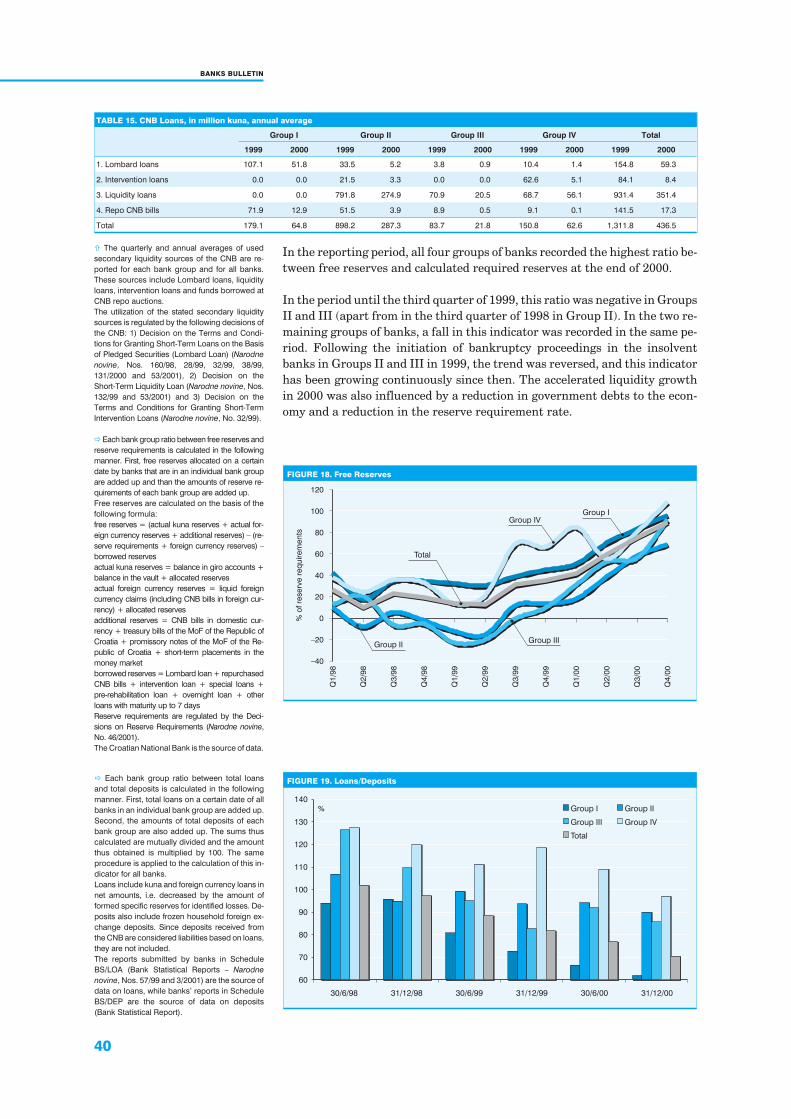
40
BANKS BULLETIN
In the reporting period, all four groups of banks recorded the highest ratio be-tween free reserves and calculated required reserves at the end of 2000.
In the period until the third quarter of 1999, this ratio was negative in GroupsII and III (apart from in the third quarter of 1998 in Group II). In the two re-maining groups of banks, a fall in this indicator was recorded in the same pe-riod. Following the initiation of bankruptcy proceedings in the insolventbanks in Groups II and III in 1999, the trend was reversed, and this indicatorhas been growing continuously since then. The accelerated liquidity growthin 2000 was also influenced by a reduction in government debts to the econ-omy and a reduction in the reserve requirement rate.
TABLE 15. CNB Loans, in million kuna, annual average
Group I Group II Group III Group IV Total
1999 2000 1999 2000 1999 2000 1999 2000 1999 2000
1. Lombard loans 107.1 51.8 33.5 5.2 3.8 0.9 10.4 1.4 154.8 59.3
2. Intervention loans 0.0 0.0 21.5 3.3 0.0 0.0 62.6 5.1 84.1 8.4
3. Liquidity loans 0.0 0.0 791.8 274.9 70.9 20.5 68.7 56.1 931.4 351.4
4. Repo CNB bills 71.9 12.9 51.5 3.9 8.9 0.5 9.1 0.1 141.5 17.3
Total 179.1 64.8 898.2 287.3 83.7 21.8 150.8 62.6 1,311.8 436.5
� The quarterly and annual averages of used
secondary liquidity sources of the CNB are re-
ported for each bank group and for all banks.
These sources include Lombard loans, liquidity
loans, intervention loans and funds borrowed at
CNB repo auctions.
The utilization of the stated secondary liquidity
sources is regulated by the following decisions of
the CNB: 1) Decision on the Terms and Condi-
tions for Granting Short-Term Loans on the Basis
of Pledged Securities (Lombard Loan) (Narodne
novine, Nos. 160/98, 28/99, 32/99, 38/99,
131/2000 and 53/2001), 2) Decision on the
Short-Term Liquidity Loan (Narodne novine, Nos.
132/99 and 53/2001) and 3) Decision on the
Terms and Conditions for Granting Short-Term
Intervention Loans (Narodne novine, No. 32/99).
FIGURE 18. Free Reserves
%o
fre
serv
ere
qu
irem
en
ts
–40
–20
0
20
40
60
80
100
120
Q1
/98
Q2
/98
Q3
/98
Q4
/98
Q1
/99
Q2
/99
Q3
/99
Q4
/99
Q1
/00
Q2
/00
Q3
/00
Q4
/00
Group IIGroup III
Total
Group IVGroup I
�Each bank group ratio between free reserves and
reserve requirements is calculated in the following
manner. First, free reserves allocated on a certain
date by banks that are in an individual bank group
are added up and than the amounts of reserve re-
quirements of each bank group are added up.
Free reserves are calculated on the basis of the
following formula:
free reserves = (actual kuna reserves + actual for-
eign currency reserves + additional reserves) – (re-
serve requirements + foreign currency reserves) –
borrowed reserves
actual kuna reserves = balance in giro accounts +
balance in the vault + allocated reserves
actual foreign currency reserves = liquid foreign
currency claims (including CNB bills in foreign cur-
rency) + allocated reserves
additional reserves = CNB bills in domestic cur-
rency + treasury bills of the MoF of the Republic of
Croatia + promissory notes of the MoF of the Re-
public of Croatia + short-term placements in the
money market
borrowed reserves = Lombard loan + repurchased
CNB bills + intervention loan + special loans +
pre-rehabilitation loan + overnight loan + other
loans with maturity up to 7 days
Reserve requirements are regulated by the Deci-
sions on Reserve Requirements (Narodne novine,
No. 46/2001).
The Croatian National Bank is the source of data.
FIGURE 19. Loans/Deposits
%
60
70
80
90
100
110
120
130
140
30/6/98 31/12/98 30/6/99 31/12/99 30/6/00 31/12/00
Group I Group II
Group III Group IV
Total
� Each bank group ratio between total loans
and total deposits is calculated in the following
manner. First, total loans on a certain date of all
banks in an individual bank group are added up.
Second, the amounts of total deposits of each
bank group are also added up. The sums thus
calculated are mutually divided and the amount
thus obtained is multiplied by 100. The same
procedure is applied to the calculation of this in-
dicator for all banks.
Loans include kuna and foreign currency loans in
net amounts, i.e. decreased by the amount of
formed specific reserves for identified losses. De-
posits also include frozen household foreign ex-
change deposits. Since deposits received from
the CNB are considered liabilities based on loans,
they are not included.
The reports submitted by banks in Schedule
BS/LOA (Bank Statistical Reports – Narodne
novine, Nos. 57/99 and 3/2001) are the source of
data on loans, while banks’ reports in Schedule
BS/DEP are the source of data on deposits
(Bank Statistical Report).
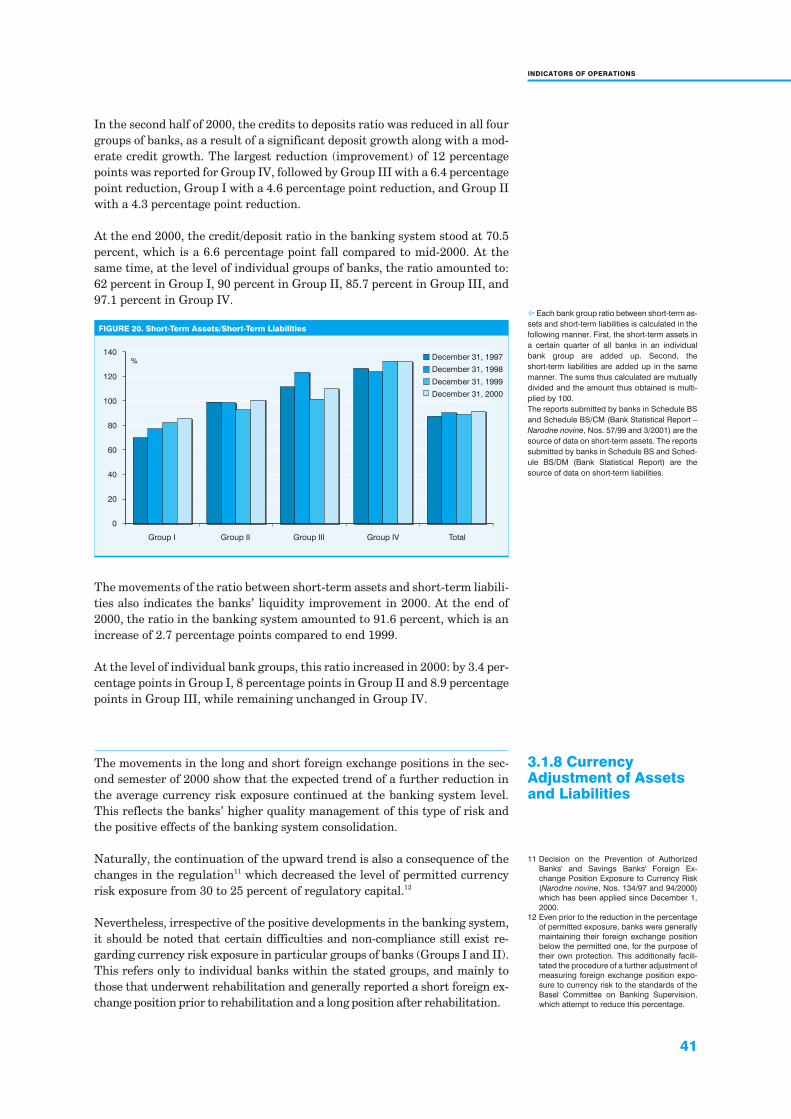
41
INDICATORS OF OPERATIONS
In the second half of 2000, the credits to deposits ratio was reduced in all fourgroups of banks, as a result of a significant deposit growth along with a mod-erate credit growth. The largest reduction (improvement) of 12 percentagepoints was reported for Group IV, followed by Group III with a 6.4 percentagepoint reduction, Group I with a 4.6 percentage point reduction, and Group IIwith a 4.3 percentage point reduction.
At the end 2000, the credit/deposit ratio in the banking system stood at 70.5percent, which is a 6.6 percentage point fall compared to mid-2000. At thesame time, at the level of individual groups of banks, the ratio amounted to:62 percent in Group I, 90 percent in Group II, 85.7 percent in Group III, and97.1 percent in Group IV.
The movements of the ratio between short-term assets and short-term liabili-ties also indicates the banks’ liquidity improvement in 2000. At the end of2000, the ratio in the banking system amounted to 91.6 percent, which is anincrease of 2.7 percentage points compared to end 1999.
At the level of individual bank groups, this ratio increased in 2000: by 3.4 per-centage points in Group I, 8 percentage points in Group II and 8.9 percentagepoints in Group III, while remaining unchanged in Group IV.
FIGURE 20. Short-Term Assets/Short-Term Liabilities
December 31, 1997
December 31, 1998
December 31, 1999
December 31, 2000
%
0
20
40
60
80
100
120
140
Group I Group II Group III Group IV Total
� Each bank group ratio between short-term as-
sets and short-term liabilities is calculated in the
following manner. First, the short-term assets in
a certain quarter of all banks in an individual
bank group are added up. Second, the
short-term liabilities are added up in the same
manner. The sums thus calculated are mutually
divided and the amount thus obtained is multi-
plied by 100.
The reports submitted by banks in Schedule BS
and Schedule BS/CM (Bank Statistical Report –
Narodne novine, Nos. 57/99 and 3/2001) are the
source of data on short-term assets. The reports
submitted by banks in Schedule BS and Sched-
ule BS/DM (Bank Statistical Report) are the
source of data on short-term liabilities.
3.1.8 CurrencyAdjustment of Assetsand Liabilities
The movements in the long and short foreign exchange positions in the sec-ond semester of 2000 show that the expected trend of a further reduction inthe average currency risk exposure continued at the banking system level.This reflects the banks’ higher quality management of this type of risk andthe positive effects of the banking system consolidation.
Naturally, the continuation of the upward trend is also a consequence of thechanges in the regulation11 which decreased the level of permitted currencyrisk exposure from 30 to 25 percent of regulatory capital.12
Nevertheless, irrespective of the positive developments in the banking system,it should be noted that certain difficulties and non-compliance still exist re-garding currency risk exposure in particular groups of banks (Groups I and II).This refers only to individual banks within the stated groups, and mainly tothose that underwent rehabilitation and generally reported a short foreign ex-change position prior to rehabilitation and a long position after rehabilitation.
11 Decision on the Prevention of Authorized
Banks' and Savings Banks' Foreign Ex-
change Position Exposure to Currency Risk
(Narodne novine, Nos. 134/97 and 94/2000)
which has been applied since December 1,
2000.
12 Even prior to the reduction in the percentage
of permitted exposure, banks were generally
maintaining their foreign exchange position
below the permitted one, for the purpose of
their own protection. This additionally facili-
tated the procedure of a further adjustment of
measuring foreign exchange position expo-
sure to currency risk to the standards of the
Basel Committee on Banking Supervision,
which attempt to reduce this percentage.
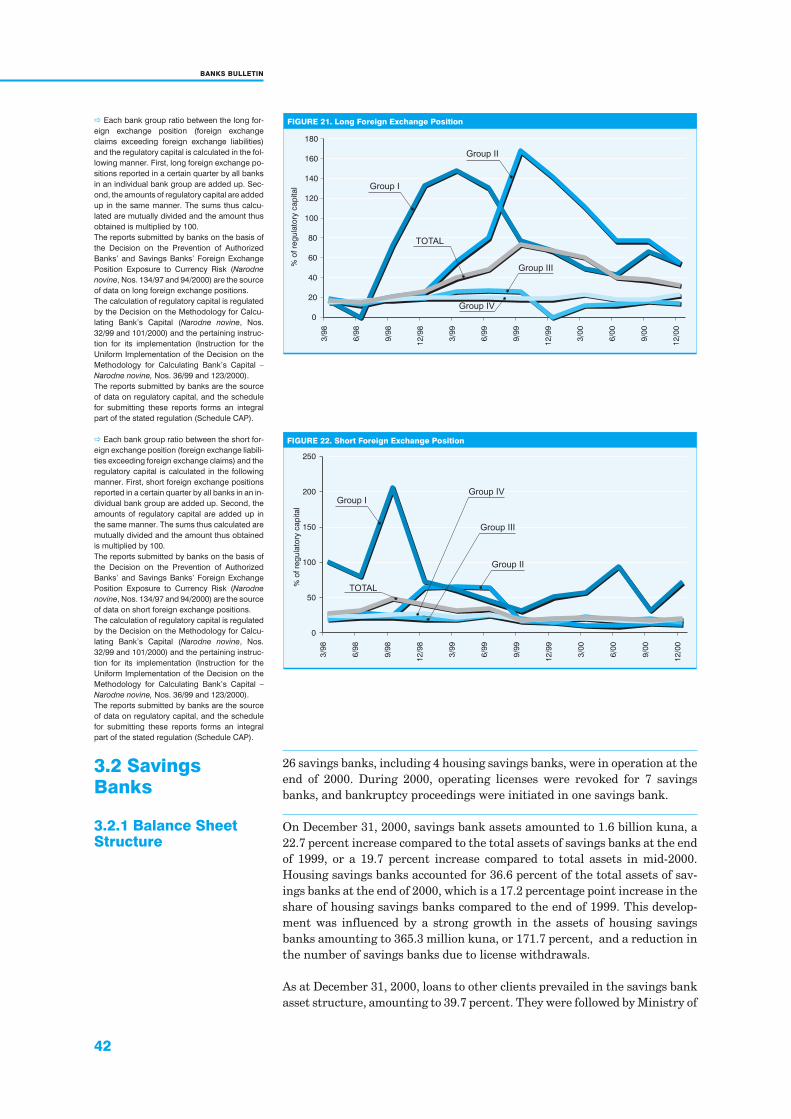
42
BANKS BULLETIN
26 savings banks, including 4 housing savings banks, were in operation at theend of 2000. During 2000, operating licenses were revoked for 7 savingsbanks, and bankruptcy proceedings were initiated in one savings bank.
FIGURE 21. Long Foreign Exchange Position
%o
fre
gu
lato
rycap
ital
0
20
40
60
80
100
120
140
160
180
3/9
8
6/9
8
9/9
8
12
/98
3/9
9
6/9
9
9/9
9
12
/99
3/0
0
6/0
0
9/0
0
12
/00
Group II
Group I
TOTAL
Group III
Group IV
� Each bank group ratio between the long for-
eign exchange position (foreign exchange
claims exceeding foreign exchange liabilities)
and the regulatory capital is calculated in the fol-
lowing manner. First, long foreign exchange po-
sitions reported in a certain quarter by all banks
in an individual bank group are added up. Sec-
ond, the amounts of regulatory capital are added
up in the same manner. The sums thus calcu-
lated are mutually divided and the amount thus
obtained is multiplied by 100.
The reports submitted by banks on the basis of
the Decision on the Prevention of Authorized
Banks’ and Savings Banks’ Foreign Exchange
Position Exposure to Currency Risk (Narodne
novine, Nos. 134/97 and 94/2000) are the source
of data on long foreign exchange positions.
The calculation of regulatory capital is regulated
by the Decision on the Methodology for Calcu-
lating Bank’s Capital (Narodne novine, Nos.
32/99 and 101/2000) and the pertaining instruc-
tion for its implementation (Instruction for the
Uniform Implementation of the Decision on the
Methodology for Calculating Bank’s Capital –
Narodne novine, Nos. 36/99 and 123/2000).
The reports submitted by banks are the source
of data on regulatory capital, and the schedule
for submitting these reports forms an integral
part of the stated regulation (Schedule CAP).
FIGURE 22. Short Foreign Exchange Position
%o
fre
gu
lato
rycap
ital
0
50
100
150
200
250
3/9
8
6/9
8
9/9
8
12
/98
3/9
9
6/9
9
9/9
9
12
/99
3/0
0
6/0
0
9/0
0
12
/00
Group I
Group II
TOTAL
Group IV
Group III
� Each bank group ratio between the short for-
eign exchange position (foreign exchange liabili-
ties exceeding foreign exchange claims) and the
regulatory capital is calculated in the following
manner. First, short foreign exchange positions
reported in a certain quarter by all banks in an in-
dividual bank group are added up. Second, the
amounts of regulatory capital are added up in
the same manner. The sums thus calculated are
mutually divided and the amount thus obtained
is multiplied by 100.
The reports submitted by banks on the basis of
the Decision on the Prevention of Authorized
Banks’ and Savings Banks’ Foreign Exchange
Position Exposure to Currency Risk (Narodne
novine, Nos. 134/97 and 94/2000) are the source
of data on short foreign exchange positions.
The calculation of regulatory capital is regulated
by the Decision on the Methodology for Calcu-
lating Bank’s Capital (Narodne novine, Nos.
32/99 and 101/2000) and the pertaining instruc-
tion for its implementation (Instruction for the
Uniform Implementation of the Decision on the
Methodology for Calculating Bank’s Capital –
Narodne novine, Nos. 36/99 and 123/2000).
The reports submitted by banks are the source
of data on regulatory capital, and the schedule
for submitting these reports forms an integral
part of the stated regulation (Schedule CAP).
3.2 SavingsBanks
3.2.1 Balance SheetStructure
On December 31, 2000, savings bank assets amounted to 1.6 billion kuna, a22.7 percent increase compared to the total assets of savings banks at the endof 1999, or a 19.7 percent increase compared to total assets in mid-2000.Housing savings banks accounted for 36.6 percent of the total assets of sav-ings banks at the end of 2000, which is a 17.2 percentage point increase in theshare of housing savings banks compared to the end of 1999. This develop-ment was influenced by a strong growth in the assets of housing savingsbanks amounting to 365.3 million kuna, or 171.7 percent, and a reduction inthe number of savings banks due to license withdrawals.
As at December 31, 2000, loans to other clients prevailed in the savings bankasset structure, amounting to 39.7 percent. They were followed by Ministry of
43
INDICATORS OF OPERATIONS
Finance treasury bills and CNB bills with 15 percent, and investment portfo-lio of securities with 12.1 percent. In 2000, the largest asset growth (of 9.6 per-centage points) was recorded in investment portfolio of securities, whereasthe largest fall in share (of 11.8 percentage points) was recorded in loans toother clients, whose total amount fell in absolute terms as well, indicating re-duced credit activities of savings banks over this period.
Housing savings banks had a different asset structure from other savingsbanks. At the end of 2000, 91.2 percent of total assets were placed in securi-ties. In time, when an increasingly larger number of savers meet the condi-tions for taking out a housing loan, the structure of housing savings bankassets will change as well.
According to the data for end 2000, deposits had the largest share in the struc-ture of savings bank liabilities – 75.9 percent. Capital had the second-largest
TABLE 16. Structure of Savings Bank Assets, end of period, in million kuna and %
Dec. 1999 Dec. 2000
Amount Share Amount Share Change
1. Money assets and deposits with the CNB 89.8 7.0 91.6 5.8 2.1
1.1 Money assets 24.3 1.9 34.5 2.2 42.1
1.2 Deposits 65.5 5.1 57.1 3.6 –12.8
2. Deposits with banking institutions 93.1 7.2 99.0 6.3 6.3
3. Treasury bills and CNB bills 126.4 9.8 237.3 15.0 87.7
4. Trading portfolio of securities 3.1 0.2 144.4 9.2 4,605.6
5. Loans to financial institutions 50.5 3.9 10.8 0.7 –78.7
6. Loans to other clients 662.3 51.5 625.7 39.7 –5.5
7. Investment portfolio of securities 32.4 2.5 190.9 12.1 488.4
8. Investments in subsidiaries and companies 1.4 0.1 1.4 0.1 2.6
9. Foreclosed and repossessed assets 25.8 2.0 17.7 1.1 –31.3
10. Tangible assets and software (net of depreciation) 66.5 5.2 57.2 3.6 –14.0
11. Interests, fees and other assets 142.5 11.1 109.6 6.9 –23.1
12. Net of: Specific reserves for unidentified losses 7.6 0.6 7.9 0.5 4.6
Total 1,286.2 100.0 1,577.6 100.0 22.7
� The share of each balance sheet item of as-
sets in total assets is calculated on the basis of
data from the Bank Statistical Report (Narodne
novine, Nos. 57/99 and 3/2001 – Schedule BS)
and the derived aggregated report of the same
type on the banking system in the observed peri-
ods. The change in the balance is the percent-
age change in comparison with the previous
period.
TABLE 17. Structure of Savings Bank Liabilities, end of period, in million kuna and %
Dec. 1999 Dec. 2000
Amount Share Amount Share Change
1. Loans from financial institutions 28.8 2.2 13.6 0.9 –52.8
1.1 Short-term loans 24.8 1.9 12.4 0.8 –50.1
1.2 Long-term loans 4.1 0.3 1.2 0.1 –69.9
2. Deposits 826.3 64.2 1,197.0 75.9 44.9
2.1 Giro account and current account deposits 6.6 0.5 7.0 0.4 5.5
2.2 Savings deposits 38.6 3.0 46.9 3.0 21.4
2.3 Time deposits 781.1 60.7 1,143.2 72.5 46.4
3. Other loans 8.4 0.7 4.4 0.3 –48.0
3.1 Short-term loans 7.8 0.6 3.8 0.2 –51.2
3.2 Long-term loans 0.6 0.0 0.6 0.0 –5.5
4. Debt securities issued 0.0 0.0 0.0 0.0 –
4.1 Short-term debt securities issued 0.0 0.0 0.0 0.0 –
4.2 Long-term debt securities issued 0.0 0.0 0.0 0.0 –
5. Supplementary capital 52.0 4.0 52.5 3.3 1.1
5.1 Subordinated instruments issued 12.8 1.0 7.9 0.5 –38.4
5.2 Hybrid instruments issued 39.2 3.0 44.7 2.8 14.0
6. Interest, fees and other liabilities 53.0 4.1 64.5 4.1 21.7
7. Profit/loss for the current year –41.4 –3.2 –66.1 –4.2 59.6
8. Capital 359.1 27.9 311.6 19.8 –13.2
Total 1,286.2 100.0 1,577.6 100.0 22.7
� These are calculated in the same manner as in
Table 16., i.e. the share of each balance sheet
item of liabilities in total liabilities is calculated on
the basis of data from the Bank Statistical Report
(Narodne novine, Nos. 57/99 and 3/2001 –
Schedule BS) and the derived aggregated re-
port of the same type on the banking system in
the observed periods. The change in the bal-
ance is the percentage change in comparison
with the previous period.
44
BANKS BULLETIN
share at 19.8 percent, followed by supplementary capital at 3.3 percent. In2000, the share of deposits in liabilities grew most by 11.6 percentage points,whereas capital recorded the largest fall in share, amounting to 8.2 percent-age points. Deposits of housing savings banks accounted for 46.2 percent oftotal deposit growth in the stated period.
Savings banks’ capital decreased by 13.2 percent in comparison with end1999, partly due to a reduction in the number of savings banks in 2000, andpartly due to increased losses of savings banks, or a reduction in legal re-serves, reserves provided for by the articles of association and other reservesfor covering losses.
The capital adequacy ratio of savings banks was 33.5 percent at the end of2000, which is a 9.2 percentage point fall compared to end 1999.
TABLE 18. Structure of Savings Bank Capital, end of period, in million kuna and %
Dec. 1999 Dec. 2000
Amount Share Amount Share Change
1. Share capital 369.4 102.9 339.5 109.0 –8.1
2. Retained income/loss brought forward –46.1 –12.8 –52.9 –17.0 14.7
3. Legal reserves 13.6 3.8 4.0 1.3 –71.0
4. Reserves provided for by the articles of
association and other capital reserves
22.2 6.2 21.0 6.7 –5.3
Total 359.1 100.0 311.6 100.0 –13.2
� The capital as one of items stated on the liabil-
ities side of the aggregated balance sheet of all
savings banks (Table 17.) is presented in detail.
In the observed periods, the share of each stated
item in the total capital of savings banks is calcu-
lated as a ratio between each item and the total
capital of savings banks. The sums thus calcu-
lated are multiplied by 100. The change in the
balance is the percentage change in compari-
son with the previous period.
3.2.2 IncomeStatement
In 2000, savings banks incurred operating losses of 66 million kuna, which, fol-lowing a loss of 49.2 million kuna in 1999, indicates a further deterioration insavings banks’ operation during 2000. The amount of the reported loss was alsoinfluenced by the operational losses of individual housing savings banks thatare not a result of poor performance but of the fact that these housing savingsbanks have only recently been established. Net interest income, net non-inter-est income and loan loss provision expenses were on the decrease, whereas gen-eral administrative expenses and depreciation were on the increase.
TABLE 19. Savings Banks’ Income Statement, in million kuna
1999 2000
1. Net interest income 114.0 76.0
1.1 Interest income 231.4 193.8
1.2 Interest expenses 117.4 117.8
2. Net non-interest income 26.9 9.9
2.1 Non-interest income 60.4 72.1
2.2 Non-interest expenses 33.6 62.2
3. General administrative expenses and depreciation 122.8 131.1
4. Net operating income before provisions 18.0 –45.3
5. Loan loss provision expenses 66.0 16.2
6. Pre-tax income/loss –48.0 –61.4
7. Profit tax 1.2 4.6
8. After-tax income/loss –49.2 –66.0
� In the observed periods, each item from re-
ports is stated cumulatively for all savings banks
on the basis of data from the Bank Statistical Re-
port (Narodne novine, Nos. 57/99 and 3/2001 –
Schedule IS). The total amount for each item is
the sum of the same items stated in the reports.
Total amounts are calculated at the level of all
savings banks.
3.2.3 Credit Activity At the end of 2000, total placements of all savings banks amounted to 1.4 bil-lion kuna, which is an increase of 0.1 billion kuna, or 12.4 percent, comparedto 1999. As the amount of total placements changed, their structure by indi-vidual risk categories changed as well. The share of performing assets in totalassets increased from 83.5 percent at the end of 1999 to 90.5 percent at theend 2000, whereas the share of placements classified into highest-risk catego-
45
INDICATORS OF OPERATIONS
ries decreased. The share of placements rated D and E thus fell from 7.4 per-cent at the end of 1999 to 5.8 percent at the end of 2000.
Movements in the ratio between total provisions and total gross placementsalso indicate an improvement in asset quality. This ratio decreased (im-proved) from 10.6 percent at the end of 1999 to 6.9 at the end of 2000.
TABLE 20. Classification of Savings Banks’ Placements by Risk Categories, end of period, in million
kuna and %
PlacementsDec. 1999 Dec. 2000
Amount Share Amount Share
A 925.4 75.9 1,177.7 86.0
B 92.7 7.6 61.4 4.5
C 110.3 9.0 50.7 3.7
D 46.0 3.8 36.1 2.6
E 44.6 3.7 43.8 3.2
Total 1,218.9 100.0 1,369.6 100.0
� Table 20. contains the amounts of placements
classified by risk categories, as well as their
shares in the total placements that are classified.
The reports submitted by savings banks in
Schedule C, stipulated by the Decision on the
Classification of Placements and Risky Off-Bal-
ance Sheet Items and Assessment of Bank Expo-
sure (Narodne novine, Nos. 32/99, 64/99 and
101/2000), are the source of data. This Schedule
forms an integral part of the Instruction for the
Uniform Implementation of the Decision on the
Classification of Placements and Risky Off-Bal-
ance Sheet Items and Assessment of Bank Expo-
sure (Narodne novine, Nos. 36/99 and 123/2000).
TABLE 21. Ratio between Savings Banks’ Provisions and Placements (A, B, C, D and E), end of period,
in million kuna and %
Dec. 1999 Dec. 2000
1. Total provisions for identified and unidentified losses 129.2 94.9
1.1 Provision for identified losses 121.6 87.2
1.2 Provisions for unidentified losses 7.6 7.7
2. Total gross placements (A, B, C, D and E) 1,218.9 1,369.6
3. The relative ratio between total provisions and total gross placements 10.6% 6.9%
� The ratio between total provisions and total
placements of savings banks that are classified
is calculated in the following manner. The spe-
cific reserves for savings banks’ identified and
unidentified losses are added up and the sum
thus calculated is divided by the amount of sav-
ings banks’ total placements and multiplied by
100.
The reports submitted by savings banks in
Schedule SR, which forms an integral part of the
Instruction for the Uniform Implementation of the
Decision on the Amount and the Method of
Forming Specific Reserves to Ensure Against
Potential Losses of Banks (Narodne novine, Nos.
36/99 and 123/2000), passed on the basis of the
Decision on the Amount and the Method of
Forming Specific Reserves to Ensure Against
Potential Losses of Banks (Narodne novine, No.
32/99) are the source of data on amounts of spe-
cific reserves for identified and unidentified
losses.
The reports submitted by savings banks in
Schedule C, stipulated by the Decision on the
Classification of Placements and Risky Off-Bal-
ance Sheet Items and Assessment of Bank Ex-
posure (Narodne novine, Nos. 32/99, 64/99 and
101/2000), are the source of data on total place-
ments. This Schedule forms an integral part of
the Instruction for the Uniform Implementation of
the Decision on the Classification of Placements
and Risky Off-Balance Sheet Items and Assess-
ment of Bank Exposure (Narodne novine, Nos.
36/99 and 123/2000).
47
LIST OF BANKS
Data on individual banks' addresses, telephone numbers, fax numbers, mem-bers of management and supervisory boards, shareholders who hold 3 percentor more of share in the bank's equity capital, and on bank auditors for 2000.
As at December 31, 2000
4 List of Banks
BANK AUSTRIA CREDITANSTALT
CROATIA d.d.
Juri{i}eva 2, 10000 Zagreb
Phone: +385 1 4800-777
Fax: +385 1 4800-890
VBDI1 2502004
Management Board
Goran Gazivoda – chairman, Ivo Bili}
Supervisory Board
Alois Steinbichler – chairman, Anton Knett, Wolfgang Helpa, Günter Ettenauer, Heinz Meidlinger,
Friedrich Racher, Alistair Bruce Turnbull
Shareholders Share in equity capital (%)
1. Bank Austria AG 80.02
2. European Bank for Reconstruction and Development 19.98
Audit firm for 2000: Ernst & Young Audit d.o.o., Zagreb
BNP-DRESDNER BANK
(CROATIA) d.d.
Andrije @aje 61, 10000 Zagreb
Phone: +385 1 3652-777
Fax: +385 1 3652-779
VBDI 2504000
Management Board
Thomas Grosse – chairman, Dominique Menu
Supervisory Board
Francois Brunot – chairman, Cally Alain Francois, Wolfdieter Engel, Hans-Jürgen Haas-Wittmüss,
Benoit Langelier
Shareholders Share in equity capital (%)
1. BNP Pariba S.A. 50.0
2. Dresdner Bank AG 50.0
Audit firm for 2000: Pricewaterhouse Coopers d.o.o., Zagreb
BRODSKO-POSAVSKA BANKA d.d.
Trg pobjede 29, 35000 Slavonski Brod
Phone: +385 35 445-800
Fax: +385 35 445-900
VBDI 2489004
Management Board
Gabrijel Senti} – chairman, Vesna Senjak, Anka Oli}
Supervisory Board
Ivan Bakovi} – chairman, Bartol Jerkovi}, Vlatko Bleki}, Mika Mimica, Marko Babi}, Ante ^ili}, Antun
Milovi}, Josip Gali}, Marijan Mandi}
Shareholders Share in equity capital (%)
1. Jurves d.o.o. 7.99
2. Nova Immobilia d.o.o. 7.95
3. Mikser beton d.o.o. 7.35
4. Prospera d.o.o. 7.22
5. Kaptol banka d.d. 7.22
6. \uro \akovi} – Poljoprivredni strojevi i ure|aji d.d. 6.76
7. Nord d.o.o. 6.48
8. Telecomp d.o.o. 4.26
9. Slavonska {tedionica d.d. 4.16
10. [o{tari} d.o.o. 4.07
11. \uro \akovi} holding d.d. 3.35
12. Croatia osiguranje d.d. 3.07
13. \uro \akovi} – Termoenergetska postrojenja d.d. 3.07
Audit firm for 2000: Revicon d.d., Zagreb
1 Account number of depository institution.
48
BANKS BULLETIN
Adriano Carisi – chairman, Jasna Mami}
Supervisory Board
Giovanni Battista Ravido – chairman, Giorgio Cerutti, Giorgio Covacich, Tito Favaretto, Luca Savino,
Milan Travan
Shareholders Share in equity capital (%)
1. Cassa di Risparmio di Trieste – Banca S.p.A. 72.06
2. International Finance Corporation 14.00
3. Finest S.p.A. 7.50
4. Simest-Societa Italiana Per Le Imprese Miste All’Estero
Simest S.p.A.
4.40
Audit firm for 2000: Pricewaterhouse Coopers d.o.o., Zagreb
CENTAR BANKA d.d.
Juri{i}eva 3, 10000 Zagreb
Phone: +385 1 4803-444
Fax: +385 1 4803-441
VBDI 2382001
Management Board
Gordana Zrin{}ak – chairman, Ljiljana Podhra{ki, Ru`ica Va|i}
Supervisory Board
Dragutin Biondi} – chairman, Igor Kne`evi}, Irena Kova~evi}, Zoran Smiljani}, @arko Kraljevi}
Shareholders Share in equity capital (%)
1. Heruc d.d. 38.38
2. Domus d.d. 6.02
3. Heruc-izrada odje}e d.o.o. 6.02
4. Lipa Mill d.d. 6.02
5. Lovin~i} d.d. 6.02
6. Villa Dubrovnik d.d. 4.41
7. Heruc Zug AG 4.22
8. Diners club Adriatic d.d. 4.13
Audit firm for 2000: Delloite & Touche d.o.o., Zagreb
Management Board
Ivan Maljevac – chairman, Drago Jakov~evi}, Frane Galzina
Supervisory Board
Janos Müller – chairman, Imre Balogh, Pero Peri{i}
Shareholders Share in equity capital (%)
1. Magyar Külkereskedelmi Bank R.t. 66.67
2. Pero Peri{i} 33.33
Audit firm for 2000: KPMG Croatia d.o.o., Zagreb
Management Board
[ime Luketin – chairman, Mato Mi{i}
Supervisory Board
Mirko Vukovi} – chairman, Boris Bara~, Dra`en Bili}
Shareholders Share in equity capital (%)
1. Ferocommerce d.o.o. 9.98
2. Darko Gaurina 9.98
3. Plastal d.o.o. 9.97
4. Uvel d.o.o. 9.52
5. Prima-auto d.o.o. 8.94
6. Berman d.o.o. 7.47
7. Arca Merkatus d.o.o. 6.98
Audit firm for 2000: Pricewaterhouse Coopers d.o.o., Zagreb
CASSA DI RISPARMIO DI
TRIESTE – BANCA d.d.
Smi~iklasova 23, 10000 Zagreb
Phone: +385 1 4614-346
Fax: +385 1 4552-603
VBDI 2499000
CONVEST BANKA d.d.
Gajeva 33, 10000 Zagreb
Phone: +385 1 4922-333
Fax: +385 1 4819-153
VBDI 2496001
CREDO BANKA d.d.
Zrinsko-Frankopanska 58, 21000 Split
Phone: +385 21 380-655,
Fax: +385 21 380-660
VBDI 2491005
49
LIST OF BANKS
CROATIA BANKA d.d.
Kvaternikov trg 9, 10000 Zagreb
Phone: +385 1 2391-111
Fax: +385 1 2391-470
VBDI 2485003
Management Board
Vedran Kui{ – chairman, Nata{a Marendi}, Nikola Samar`ija
Supervisory Board
Niko [eremet – chairman, Ivan Tomljenovi}, Jure [imovi}, @eljko Pecek, Jo{ko Mili{a
Shareholders Share in equity capital (%)
1. State Agency for Bank Rehabilitation and Deposit
Insurance
100.00
Audit firm for 2000: Delloite & Touche d.o.o., Zagreb
DALMATINSKA BANKA d.d.
Marka Ore{kovi}a 3, 23000 Zadar
Phone: +385 23 201-500
Fax: +385 23 201-774
VBDI 2407000
Management Board
Zdravko Bubalo – chairman, Darinko Pupovac, Jadranka Gotovac
Supervisory Board
Stanko Bani} – chairman, \enko Pero{, Veljko Ma{ina, Stjepan Me{trovi}, Damir Vrhovnik, Ivo
Mazi}, Marko Vuksan
Shareholders Share in equity capital (%)
1. Reginter d.o.o. 57.74
2. Ann Becerra 6.93
3. Nick Bubalo 6.93
4. Steve i Louise Bubalo 6.93
5. SWR Investment Limited 6.87
Audit firm for 2000: Pricewaterhouse Coopers d.o.o., Zagreb
Management Board
Vlaho Suti} – chairman, Krunoslav Brklja~i}, Kre{imir Krile
Supervisory Board
Marijan Marinko Filipovi} – chairman, Pave Ruskovi}-@upan, Ivan [prlje, Vido Bogdanovi}, Tomislav
Vuli~evi}
Shareholders Share in equity capital (%)
1. State Agency for Bank Rehabilitation and Deposit
Insurance
100.00
Audit firm for 2000: Delloite & Touche d.o.o., Zagreb
ERSTE & STEIERMÄRKISCHE
BANK d.d.
Var{avska 3-5, 10000 Zagreb
Phone: +385 1 4561-999
Fax: +385 1 4561-900
VBDI 2402006
Management Board
Petar Radakovi} – chairman, Tomislav Vui}, Nenad Je|ud, Borislav Centner
Supervisory Board
Reinhard Ortner – chairman, August Jost, Gerhard Fabisch, Josef Kassler, Otto Ilchmann, Herbert
Martinetz, Reinhold Schuster, Franz Mally, Ivan Ljubanovi}, Vladimir Jura{i}, Robert Tkal~ec
Shareholders Share in equity capital (%)
1. Steiermärkische Bank und Sparkassen AG 40.51
2. Erste Bank der Österreichischen Sparkassen AG 40.20
Audit firm for 2000: Ernst & Young Audit d.o.o., Zagreb
GOSPODARSKO KREDITNA
BANKA d.d.
Dra{kovi}eva 58, 10000 Zagreb
Phone: +385 1 4802-666
Fax: +385 1 4802-571
VBDI 2381009
Management Board
Izidor Su~i} – chairman, Jasna Fumagalli
Supervisory Board
Branko Josipovi} – chairman, Lovre Bo`ina, Zdenko Prohaska
DUBROVA^KA BANKA d.d.
Put Republike 9, 20000 Dubrovnik
Phone: +385 20 356-333
Fax: +385 20 356-778
VBDI 2401003
50
BANKS BULLETIN
Shareholders Share in equity capital (%)
1. Kristina Su~i} 9.22
2. Ivan Su~i} 8.74
3. Josip Ba{i} 7.43
4. @eljko Krznari} 7.43
5. Veritas BH d.o.o. 7.40
6. Veritas d.o.o. 7.40
7. Kata [parica 7.38
8. Darko Goj~i} 7.33
9. Branko Josipovi} 5.66
10. Milan Zec 5.43
11. Gospodarsko kreditna banka d.d. 4.25
12. Vesna Mijovi} 3.57
Audit firm for 2000: Reviz-biro d.o.o., Split
Management Board
Josip Slade – chairman, Slavko Durmi{
Supervisory Board
Ivan Videka – chairman, Bo`idar Sever, Jarmila Ba{i}, Bosiljka Oman-Tintor, Petar Kriste, Emilija
Vadlja
Shareholders Share in equity capital (%)
1. Hrvatska po{ta d.d. 51.00
2. Croatian Pension Insurance Institute 42.57
3. Croatian Privatization Fund 4.25
Audit firm for 2000: KPMG Croatia d.o.o., Zagreb
Management Board
Antun Sermek – chairman, Mira Ausmann
Supervisory Board
Katarina Hodko – chairman, Petar @aja, Damir Horvat
Shareholders Share in equity capital (%)
1. Zagreb{ped d.o.o. 43.42
2. Rijeka{ped d.o.o. 9.69
3. Slavonija{ped d.o.o. 9.66
4. Hypocentar d.o.o. 7.34
5. Intermerc d.o.o. 5.64
6. Servistransport d.d. 5.07
7. Agroznanje d.o.o. 4.60
8. Rudina d.o.o. 3.27
Audit firm for 2000: Revicon d.d., Zagreb
Management Board
Günther Striedinger – chairman, Heinz Truskaller, Igor Kod`oman
Supervisory Board
Wolfgang Kulterer – chairman, Jörg Schuster, Othmar Ederer, Roberto Marzanati, Gerd Pekner
Shareholders Share in equity capital (%)
1. Hypo Alpe-Adria-Bank AG 91.74
2. European Bank for Reconstruction
and Development
8.26
Audit firm for 2000: Ernst & Young Audit d.o.o., Zagreb
HRVATSKA PO[TANSKA BANKA d.d.
Juri{i}eva 4, 10000 Zagreb
Phone: +385 1 4804-513
Fax: +385 1 4810-791
VBDI 2390001
HYPOBANKA d.d.
Vodovodna 20a, 10000 Zagreb
Phone: +385 1 3643-710
Fax: +385 1 3643-687
VBDI 2426005
HYPO ALPE-ADRIA-BANK d.d.
Kotura{ka 47, 10000 Zagreb
Phone: +385 1 6103-666
Fax: +385 1 6103-555
VBDI 2500009
51
LIST OF BANKS
IMEX BANKA d.d.
Tolstojeva 6, 21000 Split
Phone: +385 21 357-015
Fax: +385 21 583-849
VBDI 2492008
Management Board
Branko Buljan – chairman, Milivoj Dela~, Ivka Miji}, Ru`ica [ari}
Supervisory Board
Marita Urli}-Radi} – chairman, Mara Delale, Ante ^uli}, Jure Sveti}, Nevenka Buljan
Shareholders Share in equity capital (%)
1. Imex trgovina d.o.o. 47.48
2. Branko Buljan 21.99
3. Trajektna luka d.d. 18.92
Audit firm for 2000: Maran d.o.o., Split
ISTARSKA BANKA d.d.
Dalmatinova 4, 52100 Pula
Phone: +385 52 527-101
Fax: +385 52 527-400
VBDI 2416000
Management Board
Milenko Vidulin – chairman, Anton [uran
Supervisory Board
Anton Brajkovi} – chairman, David Curl, Silvana Koste{i}, David Mc Mahon, Margot Jacobs
Shareholders Share in equity capital (%)
1. Dalmatinska banka d.d. 87.16
Audit firm for 2000: KPMG Croatia d.o.o., Zagreb
ISTARSKA KREDITNA BANKA
UMAG d.d.
Ernesta Milo{a 1, 52470 Umag
Phone: +385 52 702-300
Fax: +385 52 741-275
VBDI 2380006
Management Board
Miro Dodi} – chairman, Anton Belu{i}
Supervisory Board
Milan Travan – chairman, Marijan Kova~i}, Edo Ivan~i}, Marko Martin~i}, Klaudio Belu{i}, \enio
Radi}, Vlado Kraljevi}
Shareholders Share in equity capital (%)
1. Intercommerce d.o.o. 16.86
2. Tvornica cementa d.d. 15.04
3. Hempel d.d. 15.00
4. Montpelleir finance S.A. 10.00
5. Medias S.p.A. 7.63
6. Plava laguna d.d. 3.56
Audit firm for 2000: Pricewaterhouse Coopers d.o.o., Zagreb
JADRANSKA BANKA d.d.
Ante Star~evi}a 4, 22000 [ibenik
Phone: +385 22 242-242
Fax: +385 22 335-881
VBDI 2411006
Management Board
Ivo [inko – chairman, @eljko Kardum, Ankica Bandalovi}
Supervisory Board
@eljko Dekovi} – chairman, Mirjana [kugor, Josip Huljev, Miro Petric, Miho Mio~, Petar [kender,
Goran @uri}, Josip Stojanovi}, Branko Malenica, Ante ^obanov, Mirko Pralija
Shareholders Share in equity capital (%)
1. Jadranska banka d.d. 9.20
2. Alfa d.d. 7.89
3. TLM TPP d.o.o. 5.00
4. Vinoplod-vinarija d.d. 4.99
5. TLM d.d. 4.84
6. Vodovod i odvodnja d.o.o. 4.62
7. Jolly JBS d.o.o. 4.26
8. Tiskara Ka~i} d.d. 4.23
9. Rivijera d.d. 3.58
Audit firm for 2000: Pricewaterhouse Coopers d.o.o., Zagreb
52
BANKS BULLETIN
KAPTOL BANKA d.d.
Maksimirska 120, 10000 Zagreb
Phone: +385 1 2359-700
Fax: +385 1 2339-575
VBDI 2498007
Management Board
Dejan Ko{uti} – chairman, Bosiljka Rihter
Supervisory Board
Goran Mari} – chairman, Dubravka Klari}-^osi}, Bosiljka Rihter
Shareholders Share in equity capital (%)
1. Kaptol banka d.d. 15.00
2. Brodsko-posavska banka d.d. 7.16
3. Lorber d.o.o. 6.58
4. Dejan Ko{uti} 6.19
5. Urlich Seng 5.58
6. [kolska knjiga d.d. 4.61
7. Agrocroatia d.o.o. 4.38
8. Petra~ d.o.o. 3.68
9. Kaptol Petra~ leasing 3.68
10. G.E.I. Istring d.o.o. 3.29
11. Bond d.o.o. 3.29
12. Snje`ana Herceg 3.12
13. Spomenka ]urin 3.00
Audit firm for 2000: – in February 2001 the operating license was revoked for the bank, and on May 4,
2001 the bank General Assembly issued the Decision on the initation of liquidation procedure.
KARLOVA^KA BANKA d.d.
I. G. Kova~i}a 1, 47000 Karlovac
Phone: +385 47 611-540
Fax: +385 47 614-206
VBDI 2400008
Management Board
Sanda Cvite{i} – chairman, Stjepan Poljak, Marijana Trp~i}-Re{kovac
Supervisory Board
@elimir Feitl – chairman, @eljko Ma`uran, Marko [imunovi}, Ivan Podvorac, Ivan Guerrero
Devlahovich, Helena Lenac, Zoran Posinovac
Shareholders Share in equity capital (%)
1. Karlova~ka banka d.d. 14.35
2. Lanzville Investments 5.37
3. Croatian Privatization Fund 5.27
4. Karlova~ka pivovara d.d. 4.47
5. Hamowa d.o.o. 3.78
Audit firm for 2000: KPMG Croatia d.o.o., Zagreb
KREDITNA BANKA d.d.
Ul. grada Vukovara 74, 10000 Zagreb
Phone: +385 1 6167-333
Fax: +385 1 6116-466
VBDI 2481000
Management Board
Ante Todori} – chairman, @eljko Jaku{
Supervisory Board
Ivica Todori} – chairman, Branko Bek, Tihomir Mikuli}, Dane Gudelj, Ivica Serti}
Shareholders Share in equity capital (%)
1. Agrokor d.d. 15.88
2. Crodel d.o.o. 9.60
3. Investco vrijednosnice d.o.o. 8.94
4. Ledo d.d. 7.20
5. Jamnica d.d. 7.12
6. Konzum d.d. 5.98
7. Litograf d.o.o. 4.93
8. Zvijezda d.d. 4.78
9. Solana Pag d.d. 4.73
10. Perutnina Zagreb d.d. 4.73
11. Ceufin Brokers d.d. 4.30
Audit firm for 2000: Delloite & Touche d.o.o., Zagreb
53
LIST OF BANKS
Management Board
Anton Butorac – chairman, Goran Rame{a
Supervisory Board
Nikola Pavleti} – chairman, Mirjana Petkov}, Ivan Prpi}, Marijan Klju~ari~ek, Vito Svetina
Shareholders Share in equity capital (%)
1. Adriaconsulting S.R.L. 50.00
2. Rije~ka banka d.d. 31.85
3. Transadria d.d. 14.77
Audit firm for 2000: Iris nova d.o.o., Rijeka
ME\IMURSKA BANKA d.d.
V. Morandinija 37, 40000 ^akovec
Phone: +385 40 370-500
Fax: +385 40 315-065
VBDI 2392007
Management Board
Mladenka Gombar – chairman, Marija Ribi}, Zdravko Babi}
Supervisory Board
Mislav Bla`i} – chairman, Daniel Stepinac, Davorin Rimac, Stjepan Varga, Dragutin Lon~ari}
Shareholders Share in equity capital (%)
1. Privredna banka Zagreb d.d. 69.60
2. ^akove~ki mlinovi d.d. 5.95
Audit firm for 2000: KPMG Croatia d.o.o., Zagreb
NAVA BANKA d.d.
Tratinska 27, 10000 Zagreb
Phone: +385 1 3656-777
Fax: +385 1 3656-700
VBDI 2495009
Management Board
Stipan Pamukovi} – chairman, @eljko [kalec
Supervisory Board
Jakov Gelo – chairman, Ivan Gudelj, Milanka Klanfar, Tomislav Kli~ko, Bruno-Zvonimir Ore{ar
Shareholders Share in equity capital (%)
1. Kemika d.d. 21.65
2. GIP Pionir d.d. 8.86
3. Stipan Pamukovi} 5.85
4. @eljko [kalec 5.85
5. Aling j.t.d. 4.92
6. Ivan Gudelj 4.33
7. Ivan Leko 3.14
8. Ante Pamukovi} 3.14
9. Ante Samodol 3.14
Audit firm for 2000: Rudan d.o.o., Zagreb
PARTNER BANKA d.d.
Von~inina 2, 10000 Zagreb
Phone: +385 1 4602-222
Fax: +385 1 4602-289
VBDI 2408002
Management Board
Marija [ola – chairman, Brana O{tri}
Supervisory Board
Bo`o ^ulo – chairman, Igor Oppenheim, Ivan ]urkovi}
Shareholders Share in equity capital (%)
1. Metroholding d.d. 75.90
2. Andrija Mati} 9.62
3. INGRA d.d. 5.93
4. Josip Kova~ 4.07
Audit firm for 2000: Pricewaterhouse Coopers d.o.o., Zagreb
KVARNER BANKA d.d.
Jadranski trg 4/I, 51000 Rijeka
Phone: +385 51 353-555
Fax: +385 51 353-566
VBDI 2488001
54
BANKS BULLETIN
PODRAVSKA BANKA d.d.
Opati~ka 1a, 48300 Koprivnica
Phone: +385 48 65-50
Fax: +385 48 622-542
VBDI 2386002
Management Board
Julio Kuruc – chairman, Drago Galovi}, Bo`ica [iri}, Vladimir Novak
Supervisory Board
Ivan Pavli~ek – chairman, Ivan Henezi, Nevenka Cerovsky, Jurica (\uro) Predovi}, Miljan Todorovi}
Shareholders Share in equity capital (%)
1. Eumetra AG 9.36
2. Cerere S.R.L. 9.35
3. Jurica (\uro) Predovi} 4.82
4. Giovani Semerano 3.47
5. Antonia Gorgoni 3.04
6. Lorenzo Gorgoni 3.04
7. Andrea Montinari 3.04
8. Dario Montinari 3.04
9. Piero Montinari 3.04
10. Sigilfredo Montinari 3.04
Audit firm for 2000: Revidicon d.o.o., Zagreb i Deloitte & Touche d.o.o., Zagreb
PO@E[KA BANKA d.d.
Republike Hrvatske 1b, 34000 Po`ega
Phone: +385 34 254-200
Fax: +385 34 254-258
VBDI 2405004
Management Board
Vinko Matijevi} – chairman, Mihovil Petrovi}, Goran Matanovi}
Supervisory Board
Vlado Zec – chairman, @eljko Glavi}, Luka Balenovi}, \ur|a Babi}, Vlado Krauthaker
Shareholders Share in equity capital (%)
1. Po`e{ka banka d.d. 28.25
2. TIM 2000 d.o.o. 4.65
3. JP Hrvatske {ume p.o. 3.71
Audit firm for 2000: Delloite & Touche d.o.o., Zagreb
PRIVREDNA BANKA – LAGUNA
BANKA d.d.
Prvomajska 4a, 52440 Pore~
Phone: +385 52 416-777
Fax: +385 52 416-770
VBDI 2497004
Management Board
Zdravka Cukon – chairman, Roberto Drandi}
Supervisory Board
Tomislav Lazari} – chairman, Ljiljana Horvat, Danijel Stepinac
Shareholders Share in equity capital (%)
1. Privredna banka Zagreb d.d. 100.00
Audit firm for 2000: Pricewaterhouse Coopers d.o.o., Zagreb
PRIVREDNA BANKA ZAGREB d.d.
Ra~koga 6, 10000 Zagreb
Phone: +385 1 4723-344
Fax: +385 1 4723-131
VBDI 2340009
Management Board
Bo`o Prka – chairman, Franjo Filipovi}, Davor Holjevac, Ivan Gerovac, Ivan Krolo, Zvonko Agi~i},
Nediljko Mati}
Supervisory Board
Enrico Meucci – chairman, Adriano Bisogni, Gianfranco Mandelli, Adriano Arietti, Marijan-Marinko
Filipovi}
Shareholders Share in equity capital (%)
1. Comit Holding International S.A. 66.30
2. State Agency for Bank Rehabilitation and Deposit
Insurance
25.00
Audit firm for 2000: Pricewaterhouse Coopers d.o.o., Zagreb
55
LIST OF BANKS
RAIFFEISENBANK AUSTRIA d.d.
Petrinjska 59, 10000 Zagreb
Phone: +385 1 4566-466
Fax: +385 1 4819-459
VBDI 2484008
Management Board
Zdenko Adrovi} – chairman, Lovorka Penavi}, Michael Müller, Velimir [onje
Supervisory Board
Herbert Stepic – chairman, Renate Kattinger, Andreas Zakostelsky
Shareholders Share in equity capital (%)
1. Raiffeisen Zentralbank Österreich AG 62.71
2. Raiffeisenbank-Zagreb-Beteiligungsgesellschaft mbH 32.81
3. Raiffeisenlandesbank Kärnten reg. Ges. mbH 4.48
Audit firm for 2000: KPMG Croatia d.o.o., Zagreb
Management Board
Vesna Badurina – chairman, Branka Juri~ev
Supervisory Board
Tomislav Lazari} – chairman, Loretta Jakovac, Mislav Bla`i}, Snje`ana Sklizovi}, Marinko Dumani}
Shareholders Share in equity capital (%)
1. Privredna banka Zagreb d.d. 74.20
2. Riadria banka d.d. 7.96
Audit firm for 2000: Pricewaterhouse Coopers d.o.o., Zagreb
RIJE^KA BANKA d.d.
Jadranski trg 3a, 51000 Rijeka
Phone: +385 51 208-211
Fax: +385 51 330-525
VBDI 2300007
Management Board
Ivan [toki} – chairman, Antun Jurman, Borislav Pero`i}
Supervisory Board
Dietrich Wolf – chairman, Marinko U~ur, Jochen Bottermann, Klaus Rauscher, Vojko Obersnel
Shareholders Share in equity capital (%)
1. Bayerische Landesbank Girocentrale 59.90
2. State Agency for Bank Rehabilitation and Deposit
Insurance
25.12
Audit firm for 2000: KPMG Croatia d.o.o., Zagreb
SAMOBORSKA BANKA d.d.
Trg kralja Tomislava 8, 10430 Samobor
Phone: +385 1 3362-530
Fax: +385 1 3361-523
VBDI 2403009
Management Board
Marijan Trusk – chairman, Verica Lindi}, Vi{nja Jedna~ak
Supervisory Board
@elimir Kodri} – chairman, D`emal Me{inovi}, Ante Tustonji}, Zvonko Palameta, Antun [timac,
Milan Penava, Ignacije Mar|etko, Vladimir Mu~njak, Anica Vrban~i}
Shareholders Share in equity capital (%)
1. Samoborka d.d. 9.35
2. Hrvatske {ume p.o. 6.86
3. V.H. Trade d.o.o. 5.84
4. Sant d.o.o. 4.96
5. Tigra d.o.o. 4.96
6. Chromos d.d. 4.92
7. Vajda elvit d.o.o. 4.34
8. Ozas 4.04
9. Kon~ar d.d. 3.36
Audit firm for 2000: M.Z. Auditors d.o.o., Zagreb
RIADRIA BANKA d.d.
\ure [porera 3, 51000 Rijeka
Phone: +385 51 339-111
Fax: +385 51 211-093
VBDI 2325004
56
BANKS BULLETIN
SISA^KA BANKA d.d.
Trg Lj. Posavskoga 1, 44000 Sisak
Phone: +385 44 549-100
Fax: +385 44 549-101
VBDI 2419008
Management Board
Davorka Jakir – chairman, Mirjana Vipotnik, Andrea Zemlji}-Modronja
Supervisory Board
Dinko Pintari} – chairman, Zoran Gobac, Miroslav Mati}
Shareholders Share in equity capital (%)
1. Prvipromet d.o.o. 8.78
2. Madison d.o.o. 8.64
3. Blok usluge d.o.o. 8.59
4. Skok promet d.o.o. 8.54
5. State Agency for Bank Rehabilitation and Deposit
Insurance 4.70
6. Croatian Pension Insurance Institute 3.84
7. GE-ZE d.o.o. 3.64
Audit firm for 2000: Pricewaterhouse Coopers d.o.o., Zagreb
SLATINSKA BANKA d.d.
Vladimira Nazora 2, 33520 Slatina
Phone: +385 33 551-526
Fax: +385 33 551-566
VBDI 2412009
Management Board
Vera Rada{ – chairman, Angelina Horvat
Supervisory Board
Ante [imara – chairman, Josip Koleno, Marija Malekovi}, Ljiljana Katavi}, Ru`ica [imara
Shareholders Share in equity capital (%)
1. Pronekinvest d.d 7.42
2. State Agency for Bank Rehabilitation and Deposit
Insurance 7.33
3. Ante [imara 6.85
4. Sloper d.o.o. 5.56
5. Rima-promet d.o.o. 5.59
6. Ljiljana Katavi} 5.35
7. Lustrin d.o.o. 4.61
Audit firm for 2000: Pricewaterhouse Coopers d.o.o., Zagreb
SLAVONSKA BANKA d.d.
Kapucinska 29, 31000 Osijek
Phone: +385 31 231-231
Fax: +385 31 201-039
VBDI 2393000
Management Board
Ivan Mihaljevi} – chairman, Alma Juki}
Supervisory Board
Marija Crnjac – chairman, Wolfgang Kulterer, Victor Pastor, Walter Bleyer, Ernst Fanzott
Shareholders Share in equity capital (%)
1. Hypo Alpe-Adria-Bank d.d./ Hypo Alpe-Adria-Bank AG 45.14
2. European Bank for Reconstruction and Development 26.98
3. Slavonska banka d.d. 6.63
Audit firm for 2000: Ernst & Young Audit d.o.o., Zagreb
SPLITSKA BANKA d.d.
R. Bo{kovi}a 16, 21000 Split
Phone: +385 21 370-500
Fax: +385 21 370-541
VBDI 2330003
Management Board
Tomo Bolotin – chairman, Stjepan Kolovrat, Jerislav Ku{tera, Darko Medak, Pero Vrdoljak
Supervisory Board
Fausto Petteni – chairman, Giovanni Battista Ravida, Luigi Lovaglio, Alessandro Maria Decio, Mate
Kosovi}
Shareholders Share in equity capital (%)
1. UniCredito Italiano S.p.A. 62.59
2. State Agency for Bank Rehabilitation and Deposit
Insurance
25.00
Audit firm for 2000: Pricewaterhouse Coopers d.o.o., Zagreb
57
LIST OF BANKS
[TEDBANKA d.d.
Slavonska avenija 3, 10000 Zagreb
Phone: +385 1 6306-666
Fax: +385 1 6187-015
VBDI 2483005
Management Board
@eljko Udovi~i} – chairman, Ante Babi}, Josip [everdija
Supervisory Board
Ivo Andrijani} – chairman, \uro Ben~ek, Franjo [koda
Shareholders Share in equity capital (%)
1. [ted – Invest d.d. 89.71
2. Finer & Kolenc d.o.o. 4.16
3. Redip d.o.o. 4.05
Audit firm for 2000: Revizija d.o.o., Zagreb
VARA@DINSKA BANKA d.d.
Kapucinski trg 5, 42000 Vara`din
Phone: +385 42 400-000
Fax: +385 42 400-112
VBDI 2391004
Management Board
Mato Lukini} – chairman, Borna Zane, Pavao Parat
Supervisory Board
Tea Martin~i} – chairman, Renata Babi}, Ines Dabi}, Dragutin Drk, Duilio Beli}
Shareholders Share in equity capital (%)
1. Zagreba~ka banka d.d. 84.43
2. Vara`dinska banka d.d. 9.99
Audit firm for 2000: KPMG Croatia d.o.o., Zagreb
VOLKSBANK d.d.
Var{avska 9, 10000 Zagreb
Phone: +385 1 801-300
Fax: +385 1 4801-365
VBDI 2503007
Management Board
Heinrich Angelides – chairman, Julio Krevelj
Supervisory Board
Klaus Thalhammer – chairman, Hans Janeschitz, Klaus Störzbach, Gerhard Wöber, Fausto Maritan,
Ekkehard Fugl, Pierre-Yves Tarneaud
Shareholders Share in equity capital (%)
1. VBB International holding AG 70.00
2. Banque Federale des Banques Populaires 10.00
3. GZ Bank AG 6.66
4. WGZ Bank AG 3.33
Audit firm for 2000: KPMG Croatia d.o.o., Zagreb
ZAGREBA^KA BANKA d.d.
Paromlinska 2, 10000 Zagreb
Phone: +385 1 6104-000
Fax: +385 1 6110-555
VBDI 2360000
Management Board
Franjo Lukovi} – chairman, Milivoj Gold{tajn, Zvonimir Jurjevi}, Nikola Kalini}, Sanja Renduli},
Damir Odak, Tomica Pusti{ek
Supervisory Board
Petar \ukan – chairman, Jak{a Barbi}, Milan Artukovi}, Vladimir Bogatec, Klaus Junker, Charles
McWeigh III, Friedrich van Schwarzenberg, Miljenko @ivalji}, Ante Vlahovi}
Shareholders Share in equity capital (%)
1. Bankers Trust Company 40.12
2. UniCredito Italiano S.p.A. 9.95
3. Allianz AG 9.93
4. Caisse Nationale du Credit Agricole 4.30
Audit firm for 2000: KPMG Croatia d.o.o., Zagreb

58
BANKS BULLETIN
BAYERISCHE HYPO- UND
VEREINSBANK AG, Glavna
podru`nica Zagreb
Ul. Alexandera von Humboldta 4,
10000 Zagreb
Phone: +385 1 6159-206
Fax: +385 1 6159-197
VBDI 8801006
Management Board
An|elka ^avlek – representative, Vesna Garapi} – representative
Supervisory Board
Shareholders Share in equity capital (%)
1. Bayerische Hypo- und Vereinsbank AG 100.00
Audit firm for 2000: KPMG Croatia d.o.o., Zagreb
59
ATTACHMENT
List of Banks by Peer groups, end of period
Bank name and headquarterPeer group number
Dec. 1997 Dec. 1998 Dec. 1999 Dec. 2000
AGROOBRTNI^KA BANKA d.d., Zagreb1 III IV IV –
ALPE JADRAN BANKA d.d., Split IV IV IV IV
BANK AUSTRIA CREDITANSTALT CROATIA d.d., Zagreb IV II II II
BAYERISCHE HYPO-UND VEREINSBANK AG Glavna podru`nica Zagreb – – – IV
BJELOVARSKA BANKA d.d., Bjelovar5 III II II –
BNP-DRESDNER BANK (CROATIA) d.d., Zagreb IV IV IV III
BRODSKO-POSAVSKA BANKA d.d., Slavonski Brod IV IV IV IV
CASSA DI RISPARMIO DI TRIESTE – BANCA d.d., Zagreb IV IV IV IV
CENTAR BANKA d.d., Zagreb IV IV IV IV
CIBALAE BANKA d.d., Vinkovci1 III III IV –
CONVEST BANKA d.d., Zagreb IV IV IV IV
CREDO BANKA d.d., Split IV IV IV IV
CROATIA BANKA d.d., Zagreb II II II II
^AKOVE^KA BANKA d.d., ^akovec5 IV IV IV –
DALMATINSKA BANKA d.d., Zadar II II II II
DUBROVA^KA BANKA d.d., Dubrovnik II II II II
ERSTE & STEIERMÄRKISCHE BANK d.d., Zagreb – – – II
GLUMINA BANKA d.d., Zagreb1 II II – –
GOSPODARSKO KREDITNA BANKA d.d., Zagreb IV IV IV IV
GRADSKA BANKA d.d., Osijek1 II II – –
HRVATSKA GOSPODARSKA BANKA d.d., Zagreb1 III III IV –
HRVATSKA PO[TANSKA BANKA d.d., Zagreb II II II II
HYPOBANKA d.d., Zagreb IV IV IV IV
HYPO ALPE-ADRIA-BANK d.d., Zagreb IV II II II
ILIRIJA BANKA d.d., Zagreb1 IV IV – –
IMEX BANKA d.d., Split IV IV IV IV
ISTARSKA BANKA d.d., Pula II II II II
ISTARSKA KREDITNA BANKA UMAG d.d., Umag III III III III
JADRANSKA BANKA d.d., [ibenik II II II II
KAPTOL BANKA d.d., Zagreb IV IV IV IV
KARLOVA^KA BANKA d.d., Karlovac II II III III
KOMERCIJALNA BANKA d.d., Zagreb1 IV IV – –
KRAPINSKO ZAGORSKA BANKA d.d., Krapina3 IV IV IV –
KREDITNA BANKA ZAGREB d.d., Zagreb III III III III
KVARNER BANKA d.d., Rijeka IV IV IV IV
ME\IMURSKA BANKA d.d., ^akovec III II II II
NAVA BANKA d.d., Zagreb IV IV IV IV
NERETVANSKO GOSPODARSKA BANKA d.d., Plo~e1 IV IV – –
PARTNER BANKA d.d., Zagreb IV IV IV IV
PODRAVSKA BANKA d.d., Koprivnica IV III IV IV
PO@E[KA BANKA d.d., Po`ega IV III IV IV
PRIVREDNA BANKA – LAGUNA BANKA d.d., Pore~ IV IV IV IV
PRIVREDNA BANKA ZAGREB d.d., Zagreb I I I I
PROMDEI BANKA d.d., Zagreb1 IV IV – –
RAIFFEISENBANK AUSTRIA d.d., Zagreb II II II I
RAZVOJNA BANKA “DALMACIJA” d.o.o., Split2 IV IV IV –
RIADRIA BANKA d.d., Rijeka II II II II
RIJE^KA BANKA d.d., Rijeka I I I I
SAMOBORSKA BANKA d.d., Samobor IV IV IV IV
SISA^KA BANKA d.d., Sisak III III III III
SLATINSKA BANKA d.d., Slatina III III III III
SLAVONSKA BANKA d.d., Osijek II II II II
Podru`nica SOCIETE GENERALE d.d. PARIS, Zagreb6 IV IV IV –
SPLITSKA BANKA d.d., Split I I I I
[TEDBANKA d.d., Zagreb IV III IV III
TRGOVA^KA BANKA d.d., Zagreb5 IV IV IV –
TRGOVA^KO-TURISTI^KA BANKA d.d., Split1 IV IV IV –
VARA@DINSKA BANKA d.d., Vara`din II II II II
VOLKSBANK d.d., Zagreb IV IV IV III
ZAGREBA^KA BANKA d.d., Zagreb I I I I
ZAGREBA^KA BANKA – POMORSKA BANKA SPLIT d.d., Split4 II II II –
@UPANJSKA BANKA d.d., @upanja1 II II – –
1 Banks in bankruptcy proceedings.
2 Operating license was not renewed for the bank, in accordance with Articles 35, 36, and 37 of the Banking Law.
3 Merged with Privredna banka Zagreb d.d., Zagreb.
4 Merged with Zagreba~ka banka d.d., Zagreb.
5 Trgova~ka banka d.d., Zagreb and ^akove~ka banka d.d., ^akovec merged with Bjelovarska banka d.d., Bjelovar, and have seen operating as Erste & Steiermärkische Bank d.d., Zagrebsince then.
6 It was sold, and its operations were taken over by Bayerische Hypo- und Vereinsbank AG, Glavna podru`nica Zagreb.
Attachment

ISSN 1333-1043