Embed Size (px)
Citation preview

Volume 5(3), 154–166. http://dx.doi.org/10.18608/jla.2018.53.10
Quantitative and Qualitative Analysis of theLearning Analytics and Knowledge Conference 2018Xavier Ochoa1, Agathe Merceron2
1Email: [email protected] Address: New York University - Steinhardt, 82 Washington Square East, 7th Floor, New York, NY, 10003, USAORCID ID: 0000-0002-8709-57802Email: [email protected] Address: Beuth University of Applied Sciences Berlin, Luxemburger Strasse 10, 13353 Berlin,Germany ORCID ID: 0000-0003-1015-5359
IntroductionLAK-18, the 8th International Conference on Learning Analytics and Knowledge, was hosted by the University of Sydney,Australia, from March 5 to 9, 2018. Traditionally, authors of papers that have received high scores through the review processof the conference are invited to extend their paper and submit it for a special issue of this journal. The chairs of LAK-18 haveadopted a double-blind review process that has proven useful in maintaining the technical quality of the conference. Paperssubmitted to the special issue undergo a rigorous review process that is blind only, not double-blind, as a shorter version of thepaper has been already published. The theme for LAK-18 was “Towards User-Centred Analytics ”. Though several of thepapers receiving high scores in the review process explicitly dealt with this issue, it has been decided to devote a completespecial issue of the journal to this theme and invite those papers in this special issue to come. Thus, the present special issueLAK-18 covers a broad range of themes, which reflect well the diversity and the vibrancy of the community, but excludesUser-Centred Analytics.
In this editorial, we describe the story behind this special issue. This story begins with the contributions submitted to theconference and finishes with a short introduction to the papers in this issue. The two first episodes of the story, contributiontype and country, include both tracks, research and practitioner. The reminder episodes refer only to the research track.
Quantitative Analysis of LAK-18A conference can be first measured and understood by its numbers. The following section presents key metrics of LAK-18,from the submission of articles, their review, acceptance, and the final program.
SubmissionsThe papers accepted into a conference are, by the time and space limitations of the event, just a selection of the work done inthe field. To better appreciate the breadth of Learning Analytics research, a study of the unfiltered submissions is presented.A total of 348 works or proposals were submitted to LAK-18. The following subsections decompose those submissions intoseveral categories according to their type, country, topic and methodology used.
Submissions per Contribution TypeThe most immediate division of submission is by their contribution type. Each work was submitted specifically to one type.This year, LAK had seven contribution types. The first type is full papers, scientific articles that include a clearly explainedsubstantial conceptual, technical or empirical contribution to the field. This year 115 full papers were received. The second mostpopular type is short papers, scientific articles that address on-going work, which may include a briefly described theoreticalunderpinning, an initial proposal or rationale for a technical solution, and preliminary results. A total of 89 short papers werereceived. A new type this year is extended abstracts. This type, for some scholarly communities, is a more familiar form ofconference submission that can be used as a means for eliciting formative feedback on an idea or initial work. LAK-18 received23 extended abstracts. A part of LAK, since 2015, is the inclusion of a practitioner track with their own type of submissions. Theprimary goal of the practitioner track is to share thoughts and findings that stem from learning analytics project implementationsin the hope that such conversations will contribute to a shared, discipline understanding of interventions, and the factorsaffording or constraining their success and take up. This year, 38 practitioner contributions were received. The poster type is aconcise report of recent findings or other types of innovative work not ready to be submitted as a full or short paper. A total of28 posters were received. LAK, since its second edition in 2012, accepts proposals for workshops and tutorials or seminarsthat are hosted by the conference. Workshops provide an efficient forum for community building, sharing of perspectives, andidea generation for specific and emerging research topics or viewpoints. Tutorials aim to educate stakeholders on a specific
ISSN 1929-7750 (online). The Journal of Learning Analytics works under a Creative Commons License, Attribution - NonCommercial -NoDerivs 3.0 Unported(CC BY-NC-ND 3.0)
154
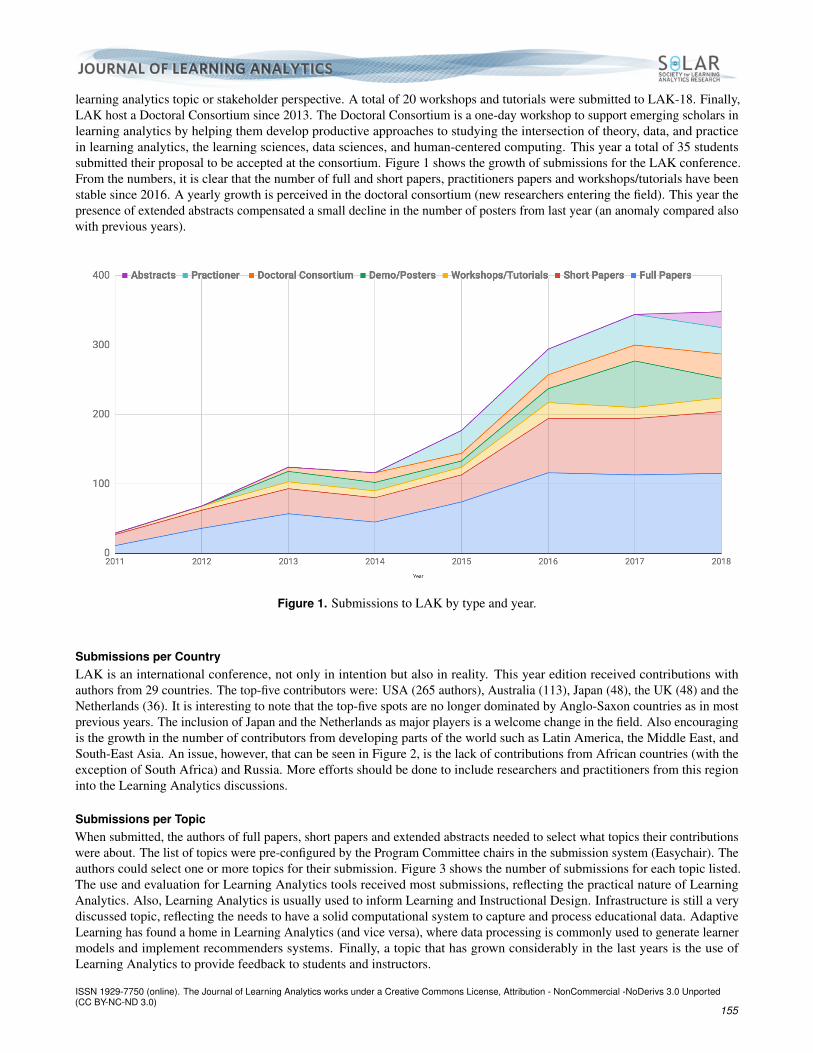
learning analytics topic or stakeholder perspective. A total of 20 workshops and tutorials were submitted to LAK-18. Finally,LAK host a Doctoral Consortium since 2013. The Doctoral Consortium is a one-day workshop to support emerging scholars inlearning analytics by helping them develop productive approaches to studying the intersection of theory, data, and practicein learning analytics, the learning sciences, data sciences, and human-centered computing. This year a total of 35 studentssubmitted their proposal to be accepted at the consortium. Figure 1 shows the growth of submissions for the LAK conference.From the numbers, it is clear that the number of full and short papers, practitioners papers and workshops/tutorials have beenstable since 2016. A yearly growth is perceived in the doctoral consortium (new researchers entering the field). This year thepresence of extended abstracts compensated a small decline in the number of posters from last year (an anomaly compared alsowith previous years).
Figure 1. Submissions to LAK by type and year.
Submissions per CountryLAK is an international conference, not only in intention but also in reality. This year edition received contributions withauthors from 29 countries. The top-five contributors were: USA (265 authors), Australia (113), Japan (48), the UK (48) and theNetherlands (36). It is interesting to note that the top-five spots are no longer dominated by Anglo-Saxon countries as in mostprevious years. The inclusion of Japan and the Netherlands as major players is a welcome change in the field. Also encouragingis the growth in the number of contributors from developing parts of the world such as Latin America, the Middle East, andSouth-East Asia. An issue, however, that can be seen in Figure 2, is the lack of contributions from African countries (with theexception of South Africa) and Russia. More efforts should be done to include researchers and practitioners from this regioninto the Learning Analytics discussions.
Submissions per TopicWhen submitted, the authors of full papers, short papers and extended abstracts needed to select what topics their contributionswere about. The list of topics were pre-configured by the Program Committee chairs in the submission system (Easychair). Theauthors could select one or more topics for their submission. Figure 3 shows the number of submissions for each topic listed.The use and evaluation for Learning Analytics tools received most submissions, reflecting the practical nature of LearningAnalytics. Also, Learning Analytics is usually used to inform Learning and Instructional Design. Infrastructure is still a verydiscussed topic, reflecting the needs to have a solid computational system to capture and process educational data. AdaptiveLearning has found a home in Learning Analytics (and vice versa), where data processing is commonly used to generate learnermodels and implement recommenders systems. Finally, a topic that has grown considerably in the last years is the use ofLearning Analytics to provide feedback to students and instructors.
ISSN 1929-7750 (online). The Journal of Learning Analytics works under a Creative Commons License, Attribution - NonCommercial -NoDerivs 3.0 Unported(CC BY-NC-ND 3.0)
155

Figure 2. Submissions per country. Node’s size and color represent the contribution of that country to the submitted papers.
It is interesting to note that there still a considerable number of papers that discuss the history and future of the LearningAnalytics field. This suggests that authors are preoccupied with the field itself and defining its boundaries, opportunities, anddevelopment.
Submissions per MethodThe authors of full and short papers and extended abstracts also had to select one or more methods used in their articles. Figure4 presents the number of submissions that selected each method. Data Mining and Machine Learning are the most used methodssubmitted to LAK, reflecting our cross-pollination with the Educational Data Mining field. However, statistical analysis andmodeling, preferred tools of quantitative Educational Researchers occupy the third and fourth positions. Also encouragingis the presence of qualitative analysis and mixed methods, used in more traditional Educational Research. This plethora ofmethods is a testament to the multivocality (Suthers & Verbert, 2013) of Learning Analytics.
Submissions by Topic and MethodTo obtain a better view of the methods used by each topic, a cross tabulation was created and it is presented in Figure 5. Thereare methods that are heavily used across all topics such as Case Studies, Data Mining, Machine Learning, Inferential Statisticsand Statistical Modelling. An interesting cross-topic methodology is Qualitative Analysis, due to the more quantitative natureof the field. Other methodologies are specifically linked to certain topics, for example, Natural Language Processing is mainlyused in Understanding Discourse and Multimodal Analytics in Cognition and Memory. Also, there as topics, such as FeedbackSystems, that make use of most of the methods.
Review Phase on the Research TrackThe Program Committee of the Research Track of LAK-18 had 85 members, that had the role of senior reviewers. Theconference also had 161 reviewers. The country of origin of this reviewers can be seen in Figure 6. It is interesting to note thatthe geographical distribution of reviewers is similar to the geographic distribution of submission, shown in Figure 1.
This year, each reviewer and senior reviewer were assigned between one and eight research papers, with an average of2.57 per reviewer. We had an excellent response rate, with 80% of reviews delivered by the deadline. The 90% of the reviewssubmitted was reached in the expanse of an additional week. The submission time of each review response can be seen inFigure 7.
A simple, although very rough, estimation of the quality of the reviews can be obtained by counting the number of wordsin the review. The average length of the reviews was 326 words, healthy over the required 250 words. The distribution of
ISSN 1929-7750 (online). The Journal of Learning Analytics works under a Creative Commons License, Attribution - NonCommercial -NoDerivs 3.0 Unported(CC BY-NC-ND 3.0)
156
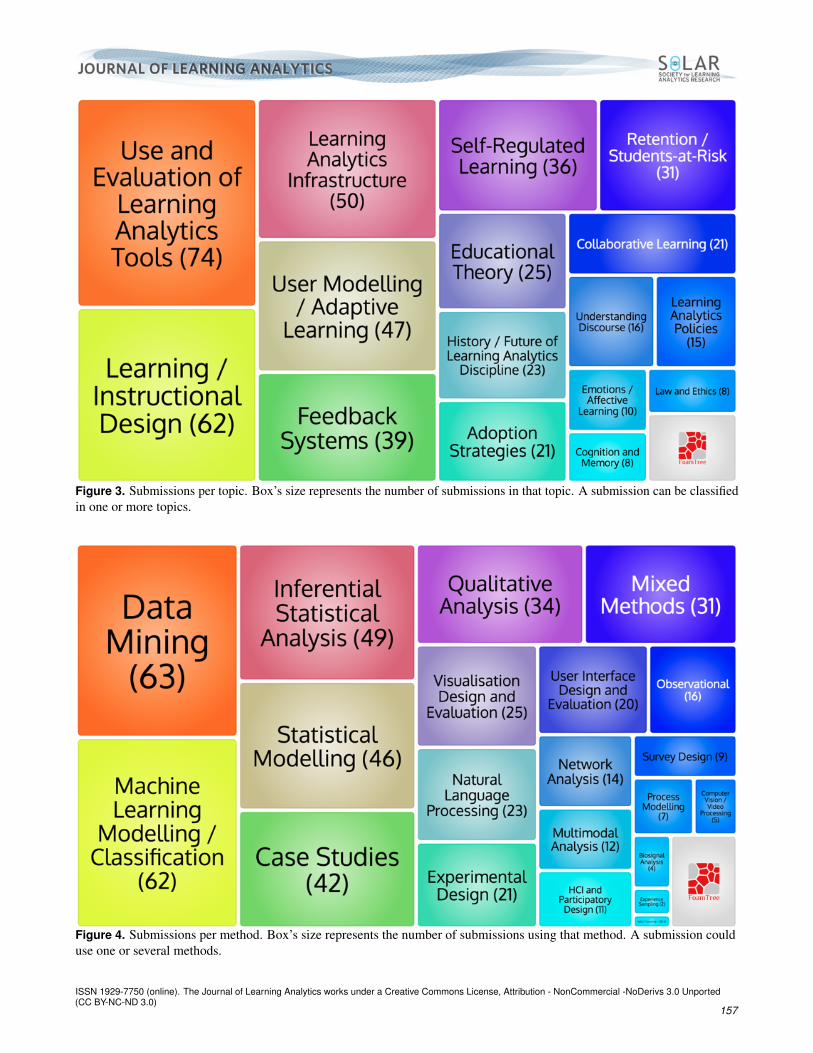
Figure 3. Submissions per topic. Box’s size represents the number of submissions in that topic. A submission can be classifiedin one or more topics.
Figure 4. Submissions per method. Box’s size represents the number of submissions using that method. A submission coulduse one or several methods.
ISSN 1929-7750 (online). The Journal of Learning Analytics works under a Creative Commons License, Attribution - NonCommercial -NoDerivs 3.0 Unported(CC BY-NC-ND 3.0)
157

Figure 5. Submissions per topic and method. Circle’s size represents the number of submissions classified in a given topic thatuse a given method.
ISSN 1929-7750 (online). The Journal of Learning Analytics works under a Creative Commons License, Attribution - NonCommercial -NoDerivs 3.0 Unported(CC BY-NC-ND 3.0)
158

Figure 6. Reviewers per country. Circle’s size and color represent the number of reviewers.
Figure 7. Time of review submission. Points to the left of the vertical line are on-time submissions.
ISSN 1929-7750 (online). The Journal of Learning Analytics works under a Creative Commons License, Attribution - NonCommercial -NoDerivs 3.0 Unported(CC BY-NC-ND 3.0)
159

Figure 8. Average number of words per review. Each point represents a reviewer.
these values can be seen in Figure 8. A long tail distribution means that a small group of reviewers provided very detailedexplanations to the authors about their review.
An interdisciplinary field, such as Learning Analytics, always presents a challenge to the Program Committee when scoresare provided by a diverse group of reviewers. What could be an excellent paper from a computational point of view could bevery weak from a more educational perspective and vice versa. This variance in the score could be easily captured by measuringthe deviation score of each reviewer from the average score finally given to the paper. In the case of LAK, where papers had 3reviewers, and each one can score the paper from +3 (Strong Accept) to -3 (Strong Reject), the deviation could take values from+4 (two -3 scores and the reviewer providing a +3) to -4 (two +3 scores and the reviewer providing a -3). If all the reviewerswere in agreement, the deviation score for all of them is 0. If the deviation for each review is obtained, the distribution shown inFigure 9 appears. Most reviews have a deviation in the range from -1 to +1. However, there is a sizable portion (42%) than isoutside this interval, signaling more diverging opinions in the reviewers.
To help the Program Committee chairs to make a final decision in the face of this diversity of opinions, this year LAKassigned Program Committee members with the task of meta-reviewing the submissions to the Research Track and provide arecommendation of acceptance or rejection to the chairs. This process was very successful and the recommendation of the metareviewers agreed 93.97% of the time with the final decision of the chairs. Moreover, this metareview phase help the conferenceto have a fairer review process that did not rely on reviewers’ scores to reach an acceptance decision. Proof of this can be seenin Figure 10, where full papers in the upper middle range of the scores are accepted or rejected independently of this score.
Accepted Papers and Authorship in the Research TrackFrom the 227 submissions received to the Research Track, 62 were accepted to be presented at LAK-18: 36 full papers, 22 shortpapers and 4 extended abstracts. A 30% acceptance rate for full papers, is very similar to previous editions of the conference.The countries with more contribution to the accepted papers were USA: 22.5, Australia: 12.5, Canada: 4.4, Belgium: 3.1, andthe Netherlands: 3.1. However, this picture should be complemented with the notion that 25% of the papers in the researchtrack are the result of international collaboration as it can be seen in Figure ??.
The authors of the accepted articles form a co-authorship network with special characteristics. Figure 12 presents thisco-authorship network. The size of the nodes represent the number of contributions made to any LAK conference. For thesmallest nodes this is their first contributions at LAK, while larger nodes are regular and prolific contributors. The color of
ISSN 1929-7750 (online). The Journal of Learning Analytics works under a Creative Commons License, Attribution - NonCommercial -NoDerivs 3.0 Unported(CC BY-NC-ND 3.0)
160

Figure 9. Distribution of average deviation of each reviewer from the final score of the papers.
Figure 10. Accepted paper by score. Blue dots represents accepted papers, red dots, rejected papers.
ISSN 1929-7750 (online). The Journal of Learning Analytics works under a Creative Commons License, Attribution - NonCommercial -NoDerivs 3.0 Unported(CC BY-NC-ND 3.0)
161

Figure 11. Accepted papers per country. Node’s size and color represent the contribution of accepted papers for a givencountry. The edges represent papers co-authored by authors in two different countries. The width of the edges represents thenumber of international collaborative papers.
a node represents the ”age” of the author in LAK. Green nodes are new authors in LAK, while orange and red nodes areLAK veterans. As it can be seen in the figure, there is a giant component of interconnected authors. Instead of several groupscompeting with each other, there is a healthy dose of cross-pollination between groups (at least one author is shared amonggroups). It is also important to note that while there is interconnection between red, orange and yellow nodes, there is also aconnections between green and all the other colors. This reflect the openness of LAK contributors to new researchers. Instead ofisolated ”old” cliques, these older authors are the backbone of an age-independent collaboration networks. The numbers of linksbetween nodes is also a testament of the tendency at LAK of papers produced by bigger groups, reflecting the interdisciplinarityof the field and the need of a large set of expertise in order to tackle Learning Analytics problems.
References for LAK-18Analyzing the citations found in the accepted papers, the main references for LAK can be detected. As expected, the maintargets of references for accepted LAK-18 papers are the previous LAK conferences. Due to its temathic proximity, theEducational Data Mining (EDM) and Learning at Scale (L@S) conferences are also cited in LAK-18 papers. The Journalof Learning Analytics (JLA), although it is a relatively new and less massive venue, is one of the main references for LAKamong journals. Apart from JLA, journals that are more general for the area of Education and Education Technologies are alsohigh in the list, especially if they had a special issue on Learning Technologies. Example of these journals are the Journal ofEducational Psychology, Transactions on Learning Technologies and Computers and Education.
Qualitative Analysis of LAK-18To complement the quantitative analysis, a more subjective but valuable perspective is presented. This analysis is the result ofthe work of the Program Committee in the review, meta-review and selection of the program of LAK-18. The most importantaspect of this analysis is the identification of trends in the field represented by papers in the conferences and the present specialsection of JLA.
Trends in LAK-18LAK’18 shows a variety of trends in the accepted papers as illustrated by the session names of the conference. These trends arepresented in the following and the relation with topics introduced earlier is discussed at the end of this section. They followclosely, but not completely, the sessions of the conference. The reason for the difference is that sessions of the conference haveto follow a timely format to present papers in exactly 90 minutes. For example, four full papers with the same theme cannotbelong to the same session; another session has to be found for the fourth paper. Therefore, some sessions like Dashboards,
ISSN 1929-7750 (online). The Journal of Learning Analytics works under a Creative Commons License, Attribution - NonCommercial -NoDerivs 3.0 Unported(CC BY-NC-ND 3.0)
162

Figure 12. Co-authorship graph. Node’s size represents the number of papers submitted to LAK conferences. Node’s colorrepresent ’age’ in LAK, with green being new authors to LAK and red authors with more than have been accepted to more than5 conferences. The link represent that both authors collaborated in a LAK-18 paper.
ISSN 1929-7750 (online). The Journal of Learning Analytics works under a Creative Commons License, Attribution - NonCommercial -NoDerivs 3.0 Unported(CC BY-NC-ND 3.0)
163

Figure 13. References of accepted LAK-18 papers. Node’s size represent the number of citations from accepted LAK-18papers.
learning design video, group papers with different trends and this session is divided into three trends in the following. Asanother example, nine full papers with the same theme like Performance Prediction Retention would mean three sessions withthe same name. In the conference, this trend was divided into one session called Performance Prediction and two sessionscalled Retention I and Retention II. Note that some papers on MOOCs attend equally two trends and are counted in the two ofthem: a paper dealing with retention in MOOCs for example is counted in the trend MOOCs as well as in the trend PerformancePrediction Retention.
The first trend which continues to grow strong from the last conferences is Discourse Analysis which this year was declinedinto three session names: Discourse general, four papers, Discourse Analysis in MOOCs, two papers, and Discourse Analysis inWriting, two papers. Following are two trends both covered by seven papers. One trend is MOOCs, with two papers in a sessioncalled Discourse Analysis in MOOCs, and two papers in the session Evaluation Feedback and Retention respectively. Theother trend is Performance Prediction Retention, a trend present form the beginning in the LAK conferences. The followingtrend by the number of papers is User-Centered Design, which matches exactly the theme of LAK-18.
The next trends follow closely again when counting the number of papers addressing them: five or four papers. They arelisted here in alphabetical order: Academic Analytics, Dashboards, Evaluation Feedback, Infrastructure, rather classical trendsin the LAK conferences and Multimodal Analytics which continues growing. Finally, the following trends were covered by oneor two papers in the LAK-18 conference: Adaptive Learning, Institutional Adoption Policies, Learning Design, Self-regulation,Student Behavior, Theory (three papers) and Videos.
One notices that trends, as presented in this section, and topics, as presented in a previous section, match only partly. Anexample for matching is the trend infrastructure and the topic Learning Analytics infrastructure in the sense that all acceptedpapers in the trend infrastructure have also the topic Learning Analytics infrastructure selected by their authors. Anotherexample is the trend Institutional Adoption Policy that merges the two topics Adoption Strategies and Learning AnalyticsPolicies. The trend Performance Prediction Retention encompasses the topic Retention Students at Risk. Other trends arenot found as such in the topics. Topics have been defined a few years ago to reflect trends in the conference at that time.New themes like MOOCs or Multimodal Analytics are not included in the topics yet. Some topics like Use and Evaluationof Learning Analytics Tools appear now too general. For example, all accepted papers in the dashboard trend have Use andEvaluation of Learning Analytics Tools as a selected topic, and two have feedback systems, but otherwise no topic in common.The topic Understanding Discourse, associated with Natural Language Processing, is more narrow that the identified trendDiscourse Analysis. It might be worthwhile considering to realign trends, as found in the recent conferences, and topics asdefined in Easychair.
ISSN 1929-7750 (online). The Journal of Learning Analytics works under a Creative Commons License, Attribution - NonCommercial -NoDerivs 3.0 Unported(CC BY-NC-ND 3.0)
164

Selected PapersThis special issue contains eight papers. From these eight papers, three were originally submitted as short papers to theconference and the other as full papers. The top-five contributors of this special issue are: USA (7 authors), the UK (5) , theNetherlands (5), Australia (4) and Norway (3), which reflects to some extend the main trends in the submissions. Interestingly,five of these papers have authors coming from at least two countries, reflecting here again the internationality of LAK. Four ofthese papers had Use and Evaluation of Learning Analytics Tool and also four had Learning / Instructional Design as selectedtopics when submitted to LAK, these two most often selected topics.
The papers of this issue cover seven trends from the 15 listed in the preceding section. Following the order given above, thefirst trend to be covered is MOOCs with the paper:
• Scaling Effective Learning Strategies: Retrieval Practice and Long-Term Knowledge Retention in MOOCs by Dan Davis,Rene Kizilcec, Claudia Hauff, Geert-Jan Houben. This paper reports about deploying an Adaptive Retrieval PracticeSystem in a MOOC. Contrarily to their expectations, the authors observed no effect on the learning outcomes and discussthis issue.
Two papers address the trend Academic Analytics:
• Taken Together: Conceptualizing students’ concurrent course enrollment across the post-secondary curriculum usingtemporal analytics by Michael Brown, R. Matthew DeMonbrun, Stephanie Teasley. This paper analyze the impact ofco-enrollment in the academic risk of students and their chances to get out-of-risk.
• Learn From Your (Markov) Neighbor: Coenrollment, Assortativity, and Grade Prediction in Undergraduate Coursesby Joshua Patrick Gardner, Christopher Brooks, Warren Li. This paper also uses the the co-enrollment information toimprove the predition of student performance.
The next trend Dashboard is covered by the paper:
• Exploratory versus Explanatory Visual Learning Analytics: Driving Teachers’ Attention through Educational DataStorytelling by Vanessa Echeverria, Roberto Martinez-Maldonado, Simon Buckingham Shum, Katherine Chiluiza,Roger Granda, Cristina Conati. This paper proposes to use “Educational Data Storytelling” to enrich dashboards withexplanations in line with the intended learning design.
Evaluation Feedback is attended by two papers; the first one is mentioned above as it also addresses the trend MOOCs:
• Scaling Effective Learning Strategies: Retrieval Practice and Long-Term Knowledge Retention in MOOCs by Dan Davis,Rene Kizilcec, Claudia Hauff, Geert-Jan Houben.
• Topic Dependency Models: Graph-Based Visual Analytics for Communicating Assessment Data by Hassan Khosravi,Kendra Cooper. This paper proposes a collection of Topic Dependency Models as a graphical visualisation and explainstheir definition, calculation and potential for instructors in particular to visualize assessment data in courses.
The trend Multimodal Analytics is covered by the following paper:
• Gaze-Driven Design Insights to Amplify Debugging Skills: A Learner-Centered Analysis Approach by KaterinaMangaroska, Kshitij Sharma, Michail Giannakos, Hallvard Trætteberg, Pierre Dillenbourg. The authors of this paperanalyse data coming from two heterogeneous sources: gaze data and interactions data in a mirroring tool integrated in theeclipse programming environment. The analysis show that different patterns distinguish experts and novice students.
The trend Institutional Adoption Policies is covered by one paper:
• The SHEILA framework: informing institutional strategies and policy processes of learning analytics by Yi-Shan Tsai,Pedro Manuel Moreno-Marcos, Ioana Jivet, Maren Scheffel, Kairit Tammets, Kaire Kollom, Dragan Gasevic. This paperpresents a complete framework to develop Learning Analytics policies in Higher Education Institutions.
Finally, Learning Design is covered by:
• Using temporal analytics to detect inconsistencies between learning design and students’ behaviours by Quan Nguyen,Michal Huptych, Bart Rienties. This study investigates to what extent students’ timing of engagement aligned withinstructor learning design, and how engagement varied across different levels of performance.
ISSN 1929-7750 (online). The Journal of Learning Analytics works under a Creative Commons License, Attribution - NonCommercial -NoDerivs 3.0 Unported(CC BY-NC-ND 3.0)
165

ConclusionsThe Learning Analytics and Knowledge conference has become the main venue to observe and present the main advances inthe field of Learning Analytics. As such, it is the ideal point to measure the pulse of the field and its research community. Fromthe quantitative analysis performed with the conference data, it is clear that LAK is maturing and growing at a sustainablepace. The review process of the conference, while difficult due to its interdisciplinary nature, is possible due to a large set ofreviewers and senior reviewers. The inclusion of the meta-review phase as well as the double-blind review process this yearhas helped the conference selection process to be fairer than previous editions. The learning analytics community is growingrapidly due to its open and collaborative and international nature. Finally, citation analysis proves that LAK is creating its ownbody of knowledge that is references in the new papers each year. LAK is also one of the most cited venues in the EducationalTechnology field. The qualitative analysis performed by the chairs of the conference to assemble the program identified severaltrends, represented by exemplary articles in this special section. From Discourse to Multimodal Learning Analytics, the field isexpanding and specializing.
We wish you a pleasant and enriching read!
ReferencesSuthers, D., & Verbert, K. (2013). Learning analytics as a ”middle space”. In Proceedings of the third international conference on
learning analytics and knowledge (pp. 1–4). New York, NY, USA: ACM. https://dx.doi.org/10.1145/2460296.2460298
ISSN 1929-7750 (online). The Journal of Learning Analytics works under a Creative Commons License, Attribution - NonCommercial -NoDerivs 3.0 Unported(CC BY-NC-ND 3.0)
166