Embed Size (px)
Citation preview
Ohio Department of Education, March 2011 Page 1 of 94
Ohio Revised Science Standards and Model Curriculum
High School
INDEX
Introductory High School Sciences
Physical Science
Biology
Advanced Sciences
Chemistry
Environmental Science
Physical Geology
Physics
Ohio Department of Education, March 2011 Page 2 of 94
Biology
Syllabus and Model Curriculum
Course Description Biology is a high school level course, which satisfies the Ohio Core science graduation requirements of Ohio Revised Code Section 3313.603. This section of Ohio law requires a three-unit course with inquiry-based laboratory experience that engages students in asking valid scientific questions and gathering and analyzing information.
This course investigates the composition, diversity, complexity and interconnectedness of life on Earth. Fundamental concepts of heredity and evolution provide a framework through inquiry-based instruction to explore the living world, the physical environment and the interactions within and between them.
Students engage in investigations to understand and explain the behavior of living things in a variety of scenarios that incorporate scientific reasoning, analysis, communication skills and real-world applications.
Science Inquiry and Application During the years of grades 9 through 12, all students must use the following scientific processes with appropriate laboratory safety techniques to construct their knowledge and understanding in all science content areas:
• Identify questions and concepts that guide scientific investigations;
• Design and conduct scientific investigations;
• Use technology and mathematics to improve investigations and communications;
• Formulate and revise explanations and models using logic and evidence (critical thinking);
• Recognize and analyze explanations and models; and
• Communicate and support a scientific argument.
Course Content The following information may be taught in any order; there is no ODE-recommended sequence.
Heredity
• Cellular genetics
• Structure and function of DNA in cells
• Genetic mechanisms and inheritance
• Mutations
• Modern genetics Evolution
• Mechanisms
o Natural selection o Mutation o Genetic drift o Gene flow (immigration, emigration) o Sexual selection o History of life on Earth
• Diversity of Life
o Speciation and biological classification based on molecular evidence o Variation of organisms within a species due to population genetics and gene frequency
Back to the INDEX
Ohio Department of Education, March 2011 Page 3 of 94
Diversity and Interdependence of Life
• Classification systems are frameworks created by scientists for describing the vast diversity of organisms indicating the degree of relatedness between organisms.
• Ecosystems
o Homeostasis Carrying capacity Equilibrium and disequilibrium
Cells
• Cell structure and function
o Structure, function and interrelatedness of cell organelles o Eukaryotic cells and prokaryotic cells
• Cellular processes o Characteristics of life regulated by cellular processes o Photosynthesis, chemosynthesis, cellular respiration o Cell division and differentiation
Content Elaboration: Heredity Building on knowledge from elementary school (plants and animals have life cycles and offspring resemble their parents) and knowledge from middle school (reproduction, Mendelian Genetics, inherited traits and diversity of species), this topic focuses on the explanation of genetic patterns of inheritance. In middle school, students learn that living things are a result of one or two parents, and traits are passed on to the next generation through both asexual and sexual reproduction. In addition, they learn that traits are defined by instructions encoded in many discrete genes and that a gene may come in more than one form called alleles.
At the high school level, the explanation of genes is expanded to include the following concepts:
• Life is specified by genomes. Each organism has a genome that contains all of the biological
information needed to build and maintain a living example of that organism. The biological information contained in a genome is encoded in its deoxyribonucleic acid (DNA) and is divided into discrete units called genes.
• “Genes are segments of DNA molecules. The sequence of DNA bases in a chromosome determines the sequence of amino acids in a protein. Inserting, deleting or substituting segments of DNA molecules can alter genes.
• An altered gene may be passed on to every cell that develops from it. The resulting features may help, harm or have little or no effect on the offspring’s success in its environments.
• Gene mutations (when they occur in gametes) can be passed on to offspring.
• Genes code for protein. The sequence of DNA bases in a chromosome determines the sequence of amino acids in a protein.
• “The many body cells in an individual can be very different from one another, even though they
are all descended from a single cell and thus have essentially identical genetic instructions. Different genes are active in different types of cells, influenced by the cell’s environment and past history.” (AAAS)
In high school biology, Mendel’s laws of inheritance (introduced in grade 8) are interwoven with current knowledge of DNA and chromosome structure and function to build toward basic knowledge of modern genetics. Sorting and recombination of genes in sexual reproduction and meiosis specifically result in a variance in traits of the offspring of any two parents and explicitly connect the knowledge to evolution.
Back to the INDEX
Ohio Department of Education, March 2011 Page 4 of 94
The gene interactions described in middle school were limited primarily to dominance and co- dominance traits. In high school genetic mechanisms, both classical and modern including incomplete dominance, sex-linked traits, goodness of fit test (Chi-square) and dihybrid crosses are investigated through real-world examples. Genes that affect more than one trait (pleiotropy), traits affected by more than one gene (epistasis) and polygenetic traits can be introduced using simple real-world examples. Additionally, genes that modify or regulate the expression of another gene should be included in explorations at the high school level. Dihybrid crosses can be used to explore linkage groups. Modern genetics techniques, such as cloning must be explored in this unit.
It is imperative that the technological developments that lead to the current knowledge of heredity be included in the study of heredity. For example, the development of the model for DNA structure was the result of the use of technology and the studies and ideas of many scientists. Watson and Crick developed the final model, but did not do the original studies.
Expectations for Learning: Cognitive Demands This section provides definitions for Ohio’s science cognitive demands, which are intrinsically related to current understandings and research about how people learn. They provide a structure for teachers and assessment developers to reflect on plans for teaching science, to monitor observable evidence of student learning and to develop summative assessment of student learning of science.
Visions into Practice This section provides examples of tasks that students may perform; this includes guidance for developing classroom performance tasks. It is not an all-inclusive checklist of what should be done, but is a springboard for generating innovative ideas.
• Develop a timeline from Mendel’s, Darwin’s and Wallace’s work to the present day.
• Design and implement an investigation to test the affect of low doses of different common chemicals (e.g., boric acid, acetone or vinegar) on the development of a plant from seed to adult. Represent the data in a way that demonstrates the relationship, if any, between the chemical and changes in the development pattern. Explain how the investigation is similar to or different from the processes that occur in the natural environment.
Note: Only plants should be used in this experiment.
Instructional Strategies and Resources This section provides additional support and information for educators. These are strategies for actively engaging students with the topic and for providing hands-on, minds-on observation and exploration of the topic, including authentic data resources for scientific inquiry, experimentation and problem-based tasks that incorporate technology and technological and engineering design. Resources selected are printed or Web-based materials that directly relate to the particular Content Statement. It is not intended to be a prescriptive list of lessons.
• The National Institute of the Health provides a time line of the milestones in genetics. Stories,
archival images and original scientific publications tell the historical story of genetic discoveries. Students can trace how new understandings about the transmission of traits developed new questions that led to new discoveries. One major milestone is the Human Genome Project. DNA Learning Center features an interactive site that provides detailed background knowledge on how genomes are developed and used for research.
• Mendelian Genetics provides clear explanations for basic genetics; this link connects to an explanation and example of Chi-square.
• Cold Spring Harbor Laboratory’s Dolan DNA Learning Center provides DNA Molecules for models that help to illustrate some of the more abstract concepts associated with DNA. Scroll down the page to the More 3-D Animation Library.
Back to the INDEX

Ohio Department of Education, March 2011 Page 5 of 94
Common Misconceptions
• The University of Utah provides information about misconceptions related to cloning.
• Weber State University provides a list for misconceptions in biology. Scroll down to Standard II to address misconceptions about pattern of inheritance.
Diverse Learners Strategies for meeting the needs of all learners including gifted students, English Language Learners (ELL) and students with disabilities can be found at this site. Resources based on the Universal Design for Learning principles are available at www.cast.org.
Classroom Portals The Annenberg Media series “Teaching High School Science” is a six-video program that highlights a variety of classroom activities that foster inquiry-based learning.
Back to the INDEX

Ohio Department of Education, March 2011 Page 6 of 94
Content Elaboration: Evolution At the elementary school level, evolution concepts include the relationship between organisms and the environment, parent and offspring, and an introduction to the fossil record and extinction. At the middle school level, concepts include biodiversity (as part of biomes) and speciation, further exploration of the fossil record and Earth history, changing environmental conditions (abiotic factors), natural selection and biological evolution.
Biological evolution explains the natural origins for the diversity of life. Emphasis shifts from thinking in terms of selection of individuals with a particular trait to changing proportions of a trait in populations. The study of evolution must include Modern Synthesis, the unification of genetics and evolution and historical perspectives of evolutionary theory. The study of evolution must include gene flow, mutation, speciation, natural selection, genetic drift, sexual selection and Hardy Weinberg’s law.
The basic concept of biological evolution is that the Earth’s present-day species descended from earlier, common ancestral species. At the high school level, the term natural selection is used to describe the process by which traits become more or less common in a population due to consistent environmental effects upon the survival or reproduction of the individual with the trait. Mathematical reasoning must be applied to solve problems, (e.g., use Hardy Weinberg’s law to explain gene frequency patterns in a population).
Modern ideas about evolution provide a natural explanation for the diversity of life on Earth as represented in the fossil record, in the similarities of existing species and in modern molecular evidence. From a long-term perspective, evolution is the descent with modification of different lineages from common ancestors.
Different phenotypes result from new combinations of existing genes or from mutations of genes in reproductive cells. At the high school level, the expectation is to combine grade-8 knowledge with explanation of the internal structure and function of chromosomes. Natural selection works on the phenotype.
Populations evolve over time. Evolution is the consequence of the interactions of:
1. The potential for a population to increase its numbers; 2. The genetic variability of offspring due to mutation and recombination of genes; 3. A finite supply of the resources required for life; and 4. The differential survival and reproduction of individuals with the specific phenotype.
Mutations are described in the content elaboration for Heredity. Apply the knowledge of mutation and genetic drift to real-world examples.
Recent molecular-sequence data generally, but not always, support earlier hypotheses regarding lineages of organisms based upon morphological comparisons.
Heritable characteristics influence how likely an organism is to survive and reproduce in a particular environment. When an environment changes, the survival value of inherited characteristics may change. This may or may not cause a change in species that inhabit the environment. Formulate and revise explanations for gene flow and sexual selection based on real-world problems.
Expectations for Learning: Cognitive Demands This section provides definitions for Ohio’s science cognitive demands, which are intrinsically related to current understandings and research about how people learn. They provide a structure for teachers and assessment developers to reflect on plans for teaching science, to monitor observable evidence of
student learning and to develop summative assessment of student learning of science.
Back to the INDEX
Ohio Department of Education, March 2011 Page 7 of 94
Visions into Practice This section provides examples of tasks that students may perform; this includes guidance for developing classroom performance tasks. It is not an all-inclusive checklist of what should be done, but is a springboard for generating innovative ideas.
• Manipulate variables (e.g., distribution of traits, number of organisms and change in
environmental conditions) in a simulation that represents natural selection in terms of how changes in environmental conditions can result in selective pressure on a population of organisms. Analyze the data to determine the relationship, if any, between the environmental changes and the population. Explain how each part of the simulation is similar to or different from the process of natural selection.
Instructional Strategies and Resources This section provides additional support and information for educators. These are strategies for actively engaging students with the topic and for providing hands-on, minds-on observation and exploration of the topic, including authentic data resources for scientific inquiry, experimentation and problem-based tasks that incorporate technology and technological and engineering design. Resources selected are printed or Web-based materials that directly relate to the particular Content Statement. It is not intended to be a prescriptive list of lessons.
• University of Colorado’s PhET provides an interactive simulation of natural selection for a
population of rabbits. Environmental factors can be altered and mutations introduced to show how the population would change over time.
• Annenberg’s Rediscovering Biology: Molecular to Global Perspectives, Session 3, Evolution and Phylogenetics is a tutorial for teachers on some of the current advances in biology.
• The National Science Teachers Association offers a position paper on the Teaching of Evolution.
• Online course in evolutionary biology for teachers is provided by the Public Broadcasting System: Evolution.
Common Misconceptions
• The Southern Nevada Regional Professional Development Center provides a list of common student naïve conceptions about evolution.
Diverse Learners Strategies for meeting the needs of all learners including gifted students, English Language Learners (ELL) and students with disabilities can be found at this site. Resources based on the Universal Design for Learning principles are available at www.cast.org.
Classroom Portals The Annenberg Media series “Teaching High School Science” is a six-video program that highlights a variety of classroom activities that foster inquiry-based learning.
Back to the INDEX

Ohio Department of Education, March 2011 Page 8 of 94
Content Elaboration: Diversity and Interdependence of Life Building on knowledge from elementary school (interactions of organisms within their environment and the law of conservation of matter and energy, food webs) and from middle school (flow of energy through organisms, biomes and biogeochemical cycles), this topic focuses on the study of diversity and similarity at the molecular level of organisms. Additionally the effects of physical/chemical constraints on all biological relationships and systems are investigated.
The great diversity of organisms and ecological niches they occupy result from more than 3.5 billion years of evolution. Some ecosystems can be reasonably persistent over hundreds or thousands of years. Like many complex systems, ecosystems tend to have cyclic fluctuations around a state of rough equilibrium. In the long run, however, ecosystems always change as geological or biological conditions vary. Misconceptions about population growth capacity, interspecies and intra-species competition for resources, and what occurs when a species immigrates to or emigrates from ecosystems are included in this topic. Technology must be used to access real-time/authentic data to study population changes and growth in specific locations.
Classification systems are frameworks developed by scientists for describing the diversity of organisms, indicating the degree of relatedness between organisms. Recent molecular-sequence data generally support earlier hypotheses regarding lineages of organisms based upon morphological comparisons. Both morphological comparisons and molecular evidence must be used to describe biodiversity (cladograms can be used to address this).
Organisms transform energy (flow of energy) and matter (cycles of matter) as they survive and reproduce. The cycling of matter and flow of energy occurs at all levels of biological organization, from molecules to ecosystems. At the high school level, the concept of energy flow as unidirectional in ecosystems is explored.
Mathematical graphing and algebraic knowledge (at the high school level) must be used to explain concepts of carrying capacity and homeostasis within biomes. Use real-time data to investigate population changes that occur locally or regionally. Mathematical models can include exponential growth model and the logistic growth model. The simplest version of the logistic growth model is dN/dt = rN (K-N/K); the only new variable added to the exponential model is K for carrying capacity.
Note 1: Exponential growth equation in simplest form, change in population size N per unit time t is a
product of r (the per capita reproductive rate) and N (population size. Note 2: Carrying capacity is defined as the population equilibrium sized when births and deaths are
equal; hence dN/dt = zero. Note 3: Constructing food webs/food chains to show interactions between organisms within
ecosystems was covered in upper elementary school and middle school; constructing them as a way to demonstrate content knowledge is not appropriate for this grade. Students may use these diagrams to help explain real-world relationships or events within an ecosystem, but not to identify simple trophic levels, consumers, producers, predator-prey and symbiotic relations.
Expectations for Learning: Cognitive Demands This section provides definitions for Ohio’s science cognitive demands, which are intrinsically related to current understandings and research about how people learn. They provide a structure for teachers and assessment developers to reflect on plans for teaching science, to monitor observable evidence of student learning and to develop summative assessment of student learning of science.
Back to the INDEX
Ohio Department of Education, March 2011 Page 9 of 94
Visions into Practice This section provides examples of tasks that students may perform; this includes guidance for developing classroom performance tasks. It is not an all-inclusive checklist of what should be done, but is a springboard for generating innovative ideas.
• Construct a model to exemplify biomagnification in an ecosystem such as mercury in Lake
Erie. Include a quantification of the distribution and buildup of the potentially damaging molecule that was introduced into the ecosystem. Within the model, predict and explain why the consequences occur at each trophic level as the relative concentration of the chemical increases. Include in your justification the changes in the number of organisms at each trophic level, matter cycling and energy transfer from one level to another.
Instructional Strategies and Resources This section provides additional support and information for educators. These are strategies for actively engaging students with the topic and for providing hands-on, minds-on observation and exploration of the topic, including authentic data resources for scientific inquiry, experimentation and problem-based tasks that incorporate technology and technological and engineering design. Resources selected are printed or Web-based materials that directly relate to the particular Content Statement. It is not intended to be a prescriptive list of lessons.
• Examine wildlife populations in Ohio like bald eagles, beavers or white-tailed deer. The Ohio
Department of Natural Resources provides population data over the years. Examine the factors that have impacted the carrying capacity.
• The Southern Nevada Regional Professional Development Center provides a tutorial, which explains the links between classification systems and evolution.
Common Misconceptions
• Binghamton University provides a general list for of naïve concepts for life science called Overcoming Ecological Misconceptions.
Diverse Learners Strategies for meeting the needs of all learners including gifted students, English Language Learners (ELL) and students with disabilities can be found at this site. Resources based on the Universal Design for Learning principles are available at www.cast.org.
Classroom Portals The Annenberg Media series “Teaching High School Science” is a six-video program that highlights a variety of classroom activities that foster inquiry-based learning.
Back to the INDEX
Ohio Department of Education, March 2011 Page 10 of 94
Content Elaboration: Cells Building on knowledge from middle school (cell theory), this topic focuses on the cell as a system itself (single-celled organism) and as part of larger systems (multicellular organism), sometimes as part of a multicellular organism, always as part of an ecosystem. The cell is a system that conducts a variety of functions associated with life. Details of cellular processes such as photosynthesis, chemosynthesis, cellular respiration, cell division and differentiation are studied at this grade level. Additionally, cellular organelles studied are cytoskeleton, Golgi complex and endoplasmic reticulum.
From about 4 billion years ago to about 2 billion years ago, only simple, single-celled microorganisms are found in the fossil record. Once cells with nuclei developed about a billion years ago, increasingly complex multicellular organisms evolved.
Every cell is covered by a membrane that controls what can enter and leave the cell. In all but quite primitive cells, a complex network of proteins provides organization and shape. Within the cell are specialized parts for the transport of materials, energy transformation, protein building, waste disposal, information feedback and movement. In addition to these basic cellular functions, most cells in multicellular organisms perform some specific functions that others do not.
A living cell is composed of a small number of elements, mainly carbon, hydrogen, nitrogen, oxygen, phosphorous and sulfur. Carbon, because of its small size and four available bonding electrons, can join to other carbon atoms in chains and rings to form large and complex molecules. The essential functions of cells involve chemical reactions that involve water and carbohydrates, proteins, lipids and nucleic acids. A special group of proteins, enzymes, enables chemical reactions to occur within living systems.
Cell functions are regulated. Complex interactions among the different kinds of molecules in the cell cause distinct cycles of activities, such as growth and division. Most cells function within a narrow range of temperature and pH. At very low temperatures, reaction rates are slow. High temperatures and/or extremes of pH can irreversibly change the structure of most protein molecules. Even small changes in pH can alter how molecules interact.
The sequence of DNA bases on a chromosome determines the sequence of amino acids in a protein. Proteins catalyze most chemical reactions in cells. Protein molecules are long, usually folded chains made from combinations of the 20 typical amino-acid sub-units found in the cell. The function of each protein molecule depends on its specific sequence of amino acids and the shape the chain takes as a result of that sequence.
Note 1: The idea that protein molecules assembled by cells conduct the work that goes on inside and
outside the cells in an organism can be learned without going into the biochemical details. It is sufficient for students to know that the molecules involved are different configurations of a few amino acids and that the different shapes of the molecules influence what they do.
Note 2: The concept of the cell and its parts as a functioning system is more important than memorizing parts of the cell.
Expectations for Learning: Cognitive Demands This section provides definitions for Ohio’s science cognitive demands, which are intrinsically related to current understandings and research about how people learn. They provide a structure for teachers and assessment developers to reflect on plans for teaching science, to monitor observable evidence of student learning and to develop summative assessment of student learning of science.
Back to the INDEX

Ohio Department of Education, March 2011 Page 11 of 94
Visions into Practice This section provides examples of tasks that students may perform; this includes guidance for developing classroom performance tasks. It is not an all-inclusive checklist of what should be done, but is a springboard for generating innovative ideas.
• Investigate the effect of different chemicals on the growth of algal colonies. Use mathematics
to explain why even under ideal situations the colonies cannot continue exponential growth.
• Plan and design an investigation to determine the factors that affect the activity of enzymes on their substrates.
• Research and provide a written explanation of how unicellular organisms are used for industrial purposes.
Instructional Strategies and Resources This section provides additional support and information for educators. These are strategies for actively engaging students with the topic and for providing hands-on, minds-on observation and exploration of the topic, including authentic data resources for scientific inquiry, experimentation and problem-based tasks that incorporate technology and technological and engineering design. Resources selected are printed or Web-based materials that directly relate to the particular Content Statement. It is not intended to be a prescriptive list of lessons.
• Optical enhancements can be used to alter the image produced by a light microscope to show
greater detail. Compare cells using unaltered Compound Light Microscopes with the same cells using Darkfield, Rheinberg and Polarization techniques.
• Examine the role of bacteria in food production. Determine what types of bacteria are used and how it impacts (pH levels, gases produced, impact on proteins) the production of the product (yogurt, cheese).
• Determine the limitations of and uses of DNA in a criminal investigation.
Common Misconceptions
• The Annenberg Media series Minds of Our Own offers Lessons From Thin Air, which illustrates
the misconceptions that students have about photosynthesis and plant growth, at http://www.learner.org/resources/series26.html.
Diverse Learners Strategies for meeting the needs of all learners including gifted students, English Language Learners (ELL) and students with disabilities can be found at this site. Resources based on the Universal Design
for Learning principles are available at www.cast.org.
Classroom Portals The Annenberg Media series “Teaching High School Science” is a six-video program that highlights a variety of classroom activities that foster inquiry-based learning.
Back to the INDEX

Ohio Department of Education, March 2011 Page 12 of 94
Chemistry
Syllabus and Model Curriculum
Course Description Chemistry is a high school level course, which satisfies the Ohio Core science graduation requirements of Ohio Revised Code Section 3313.603. This section of Ohio law requires a three-unit course with inquiry-based laboratory experience that engages students in asking valid scientific questions and gathering and analyzing information.
This course introduces students to key concepts and theories that provide a foundation for further study in other sciences as well as advanced science disciplines. Chemistry comprises a systematic study of the predictive physical interactions of matter and subsequent events that occur in the natural world. The study of matter through the exploration of classification, its structure and its interactions is how this course is organized.
Investigations are used to understand and explain the behavior of matter in a variety of inquiry and design scenarios that incorporate scientific reasoning, analysis, communication skills and real-world applications. An understanding of leading theories and how they have informed current knowledge prepares students with higher order cognitive capabilities of evaluation, prediction and application.
Science Inquiry and Application During the years of grades 9 through 12, all students must use the following scientific processes with appropriate laboratory safety techniques to construct their knowledge and understanding in all science content areas:
• Identify questions and concepts that guide scientific investigations;
• Design and conduct scientific investigations;
• Use technology and mathematics to improve investigations and communications;
• Formulate and revise explanations and models using logic and evidence (critical thinking);
• Recognize and analyze explanations and models; and
• Communicate and support a scientific argument.
Course Content The following topics may be taught in any order. There is no ODE-recommended sequence.
Structure and Properties of Matter
• Atomic structure
o Evolution of atomic models/theory o Electrons o Electron configurations
• Periodic table
o Properties
o Trends
• Intramolecular chemical bonding
o Ionic o Polar/covalent
• Representing compounds
o Formula writing o Nomenclature o Models and shapes (Lewis structures, ball and stick, molecular geometries)
• Quantifying matter
Back to the INDEX
Ohio Department of Education, March 2011 Page 13 of 94
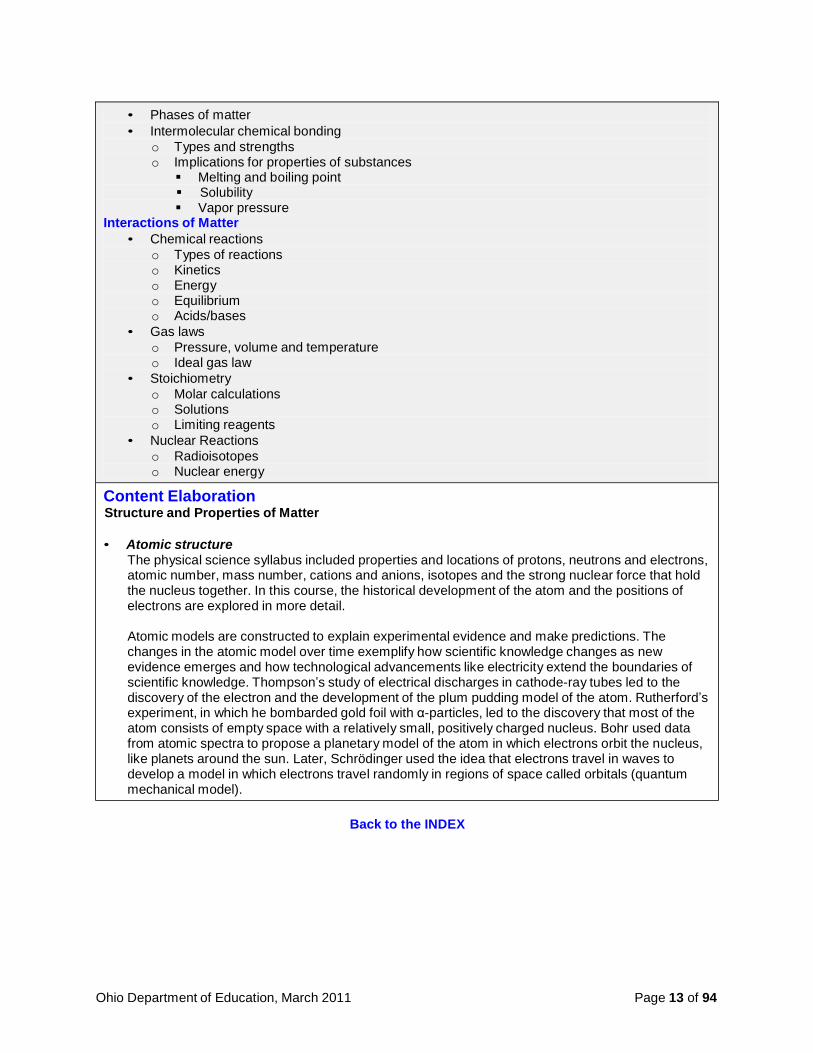
• Phases of matter
• Intermolecular chemical bonding
o Types and strengths o Implications for properties of substances
Melting and boiling point Solubility Vapor pressure
Interactions of Matter
• Chemical reactions
o Types of reactions o Kinetics o Energy o Equilibrium o Acids/bases
• Gas laws
o Pressure, volume and temperature o Ideal gas law
• Stoichiometry
o Molar calculations o Solutions o Limiting reagents
• Nuclear Reactions
o Radioisotopes o Nuclear energy
Content Elaboration Structure and Properties of Matter
• Atomic structure
The physical science syllabus included properties and locations of protons, neutrons and electrons, atomic number, mass number, cations and anions, isotopes and the strong nuclear force that hold the nucleus together. In this course, the historical development of the atom and the positions of electrons are explored in more detail.
Atomic models are constructed to explain experimental evidence and make predictions. The changes in the atomic model over time exemplify how scientific knowledge changes as new evidence emerges and how technological advancements like electricity extend the boundaries of scientific knowledge. Thompson’s study of electrical discharges in cathode-ray tubes led to the discovery of the electron and the development of the plum pudding model of the atom. Rutherford’s experiment, in which he bombarded gold foil with α-particles, led to the discovery that most of the atom consists of empty space with a relatively small, positively charged nucleus. Bohr used data from atomic spectra to propose a planetary model of the atom in which electrons orbit the nucleus, like planets around the sun. Later, Schrödinger used the idea that electrons travel in waves to develop a model in which electrons travel randomly in regions of space called orbitals (quantum mechanical model).
Back to the INDEX

Ohio Department of Education, March 2011 Page 14 of 94
Based on the quantum mechanical model, it is not possible to predict exactly where electrons are located but there is a region of space surrounding the nucleus in which there is a high probability of finding an electron (electron cloud or orbital). Data from atomic spectra (emission and absorption) gives evidence that electrons can only exist at certain discrete energy levels and not at energies between these levels. Atoms are usually in the ground state where the electrons occupy orbitals with the lowest available energy. However, the atom can become excited when the electrons absorb a photon with the precise amount of energy (indicated by the frequency of the photon) to move to an orbital with higher energy. Any photon without this precise amount of energy will be ignored by the electron. The atom exists in the excited state for a very short amount of time. When an electron drops back down to the lower energy level, it emits a photon that has energy equal to the energy difference between the levels. The amount of energy is indicated by the frequency of the light that is given off and can be measured. Each element has a unique emission and absorption spectrum due to its unique electron configuration and specific electron energy jumps that are possible for that element. Being aware of the quantum mechanical model as the currently accepted model for the atom is important for science literacy as it explains and predicts subatomic interactions, but details should be reserved for more advanced study.
Electron energy levels consist of sublevels (s, p, d and f), each with a characteristic number and shape of orbitals. The shapes of d and f orbitals will not be assessed in high school. Orbital diagrams and electron configurations can be constructed to show the location of the electrons in an atom using established rules. However, the names of these rules will not be assessed. Valence electrons are responsible for most of the chemical properties of elements. In this course, electron configurations (extended and noble gas notation) and orbital diagrams can be shown for any element in the first three periods.
Although the quantum mechanical model of the atom explains the most experimental evidence, other models can still be helpful. Thinking of atoms as indivisible spheres is useful in explaining many physical properties of substances, such as the state (solid, liquid or gas) of a substance at room temperature. Bohr’s planetary model is useful to explain and predict periodic trends in the properties of elements.
Note: Quantum numbers and equations of de Broglie, Schrödinger and Plank are beyond the
scope of this course.
[Back to Chemistry Outline]
• Periodic Table
In the physical science syllabus, elements are placed in order of increasing atomic number in the periodic table such that elements with similar properties are placed in the same column. How the periodic table is divided into groups, families, periods, metals, nonmetals and metalloids also was in the physical science syllabus. In chemistry, with more information about the electron configuration of elements, similarities in the configuration of the valence electrons for a particular group can be observed. The electron configuration of an atom can be written from the position on the periodic table. The repeating pattern in the electron configurations for elements on the periodic table explain many of the trends in the properties observed. Atomic theory and bonding must be used to explain trends in properties across periods or down columns including atomic radii, ionic radii, first ionization energies, electronegativities and whether the element is a solid or gas at room temperature. Additional ionization energies, electron affinities and periodic properties of the transition elements, lanthanide and actinide series is reserved for more advanced study.
[Back to Chemistry Outline]
Back to the INDEX

Ohio Department of Education, March 2011 Page 15 of 94
• Intramolecular Chemical Bonding
In the physical science syllabus, atoms with unpaired electrons tend to form ionic and covalent bonds with other atoms forming molecules, ionic lattices or network covalent structures. In this course, electron configurations, electronegativity values and energy considerations will be applied to bonding and the properties of materials with different types of bonding.
Atoms of many elements are more stable as they are bonded to other atoms. In such cases, as atoms bond, energy is released to the surroundings resulting in a system with lower energy. An atom’s electron configuration, particularly the valence elections, determines how an atom interacts with other atoms. Molecules, ionic lattices and network covalent structures have different, yet predictable, properties that depend on the identity of the elements and the types of bonds formed.
Differences in electronegativity values can be used to predict where a bond fits on the continuum between ionic and covalent bonds. The polarity of a bond depends on the electronegativity difference and the distance between the atoms (bond length). Polar covalent bonds are introduced as an intermediary between ionic and pure covalent bonds. The concept of metallic bonding also is introduced to explain many of the properties of metals (e.g., conductivity). Since most compounds contain multiple bonds, a substance may contain more than one type of bond. Compounds containing carbon are an important example of bonding, since carbon atoms can bond together and with other atoms, especially hydrogen, oxygen, nitrogen and sulfur, to form chains, rings and branching networks that are present in a variety of compounds, including synthetic polymers, fossil fuels and the large molecules essential to life. Detailed study of the structure of molecules responsible for life is reserved for more advanced courses.
[Back to Chemistry Outline]
• Representing Compounds
Using the periodic table, formulas of ionic compounds containing specific elements can be predicted. This can include ionic compounds made up of elements from groups 1, 2, 17, hydrogen and oxygen and polyatomic ions if given the formula and charge of the polyatomic ion. Given the formula, a compound can be named using conventional systems that include Greek prefixes and Roman numerals where appropriate. Given the name of an ionic or covalent substance, formulas can be written.
Many different models can be used to represent compounds including chemical formulas, Lewis structures, and ball and stick models. These models can be used to visualize atoms and molecules and to predict the properties of substances. Each type of representation provides unique information about the compound. Different representations are better suited for particular substances. Lewis structures can be drawn to represent covalent compounds using a simple set of rules and can be combined with valence shell electron pair repulsion (VSEPR) theory to predict the three-dimensional electron pair and molecular geometry of compounds. Lewis structures and molecular geometries will only be constructed for the following combination of elements: hydrogen, carbon, nitrogen, oxygen, phosphorus, sulfur and the halogens. Organic nomenclature is reserved for more advanced courses.
[Back to Chemistry Outline]
• Quantifying matter
In earlier grades, properties of materials were quantified with measurements that were always associated with some error. In this course, scientific protocols for quantifying the properties of matter accurately and precisely are studied. Using metric measuring systems, significant digits or figures, scientific notation, error analysis and dimensional analysis are vital to scientific communication.
Back to the INDEX
Ohio Department of Education, March 2011 Page 16 of 94
There are three domains of magnitude in size and time: the macroscopic (human) domain, the cosmic domain and the submicroscopic (atomic and subatomic) domain. Measurements in the cosmic domain and submicroscopic domains require complex instruments and/or procedures.
Matter can be quantified in a way that macroscopic properties such as mass can reflect the number of particles present. Elemental samples are a mixture of several isotopes with different masses. The atomic mass of an element is calculated given the mass and relative abundance of each isotope of the element as it exists in nature. Because the mass of an atom is very small, the mole is used to translate between the atomic and macroscopic levels. A mole is used as a counting number, like a dozen. It is equal to the number of particles in exactly 12 grams of carbon – 12 atoms. The mass of one mole of a substance is equal to its formula mass in grams. The formula mass for a substance can be used in conjunction with Avogadro’s number and the density of a substance to convert between mass, moles, volume and number of particles of a sample.
[Back to Chemistry Outline]
• Phases of Matter
In middle school, solids, liquids and gases were explored in relation to the spacing of the particles, motion of the particles and strength of attraction between the particles that make up the substance. In this course, plasmas and Bose-Einstein condensates also are included. Plasmas occur when gases have so much energy that the electrons are stripped away; therefore, they are electrically charged. In Bose-Einstein condensation the atoms, when subjected to temperatures a few billionths of a degree above absolute zero, all coalesce to lose individual identity and become a “super atom.” Just as plasmas are super-hot atoms, Bose-Einstein condensates are the opposite – super-cold atoms (see Note). The forces of attraction between particles that determine whether a substance is a solid, liquid or gas at room temperature are addressed in greater detail with intermolecular chemical bonding later in the course.
Note: The advancement of technology makes it possible to extend the boundaries of current
knowledge and understanding. Consequently, Bose-Einstein condensates were only recently created in the laboratory (1995), although predicted more than 80 years ago. Detailed instruction of Bose-Einstein condensates or plasmas is not required at this grade level. This information is strictly for recognition that new discoveries are continually occurring, extending the realm of current understanding in science.
[Back to Chemistry Outline]
• Intermolecular Chemical Bonding
In middle school, the concept of attractions between separate particles that hold molecules together in liquids and solids was introduced. These forces, called intermolecular attractions, are addressed in more detail in chemistry. Intermolecular attractions are generally weak when compared to intramolecular bonds, but span a wide range of strengths. The composition of a substance and the shape and polarity of a molecule are particularly important in determining the type and strength of bonding and intermolecular interactions. Types of intermolecular attractions include London dispersion forces (present between all molecules), dipole-dipole forces (present between polar molecules) and hydrogen bonding (a special case of dipole-dipole where hydrogen is bonded to a highly electronegative atom such as fluorine, oxygen or nitrogen), each with its own characteristic relative strengths.
Back to the INDEX
Ohio Department of Education, March 2011 Page 17 of 94
The configuration of atoms in a molecule determines the strength of the forces (bonds or intermolecular forces) between the particles and therefore the physical properties (e.g., melting point, boiling point, solubility, vapor pressure) of a material. For a given substance, the average kinetic energy (and therefore the temperature) needed for a change of state to occur depends upon the strength of the intermolecular forces between the particles. Therefore, the melting point and boiling point depend upon the amount of energy that is needed to overcome the attractions between the particles. Substances that have strong intermolecular forces or are made up of three- dimensional networks of ionic or covalent bonds tend to be solids at room temperature and have high melting and boiling points. Nonpolar organic molecules are held together by weak London dispersion forces. However, substances with longer chains provide more opportunities for these attractions and tend to have higher melting and boiling points. Increased branching of organic molecules interferes with the intermolecular attractions that lead to lower melting and boiling points.
Substances will have a greater solubility when dissolving in a solvent with similar intermolecular forces. If the substances have different intermolecular forces, they are more likely to interact with themselves than the other substance and remain separated from each other. Water is a polar molecule and it is often used as a solvent since most ionic and polar covalent substances will dissolve in it. In order for an ionic substance to dissolve in water, the attractive forces between the ions must be overcome by the dipole-dipole interactions with the water. Dissolving of a solute in water is an example of a process that is difficult to classify as a chemical or physical change and it is not appropriate to have students classify it one way or another.
Evaporation occurs when the particles with enough kinetic energy to overcome the attractive forces separate from the rest of the sample to become a gas. The pressure of these particles is called vapor pressure. Vapor pressure increases with temperature. Particles with larger intermolecular forces have lower vapor pressures at a given temperature since the particles require more energy to overcome the attractive forces between them. Molecular substances often evaporate more due to the weak attractions between the particles and can often be detected by their odor. Ionic or network covalent substances have stronger forces and are not as likely to volatilize. These substances often have little if any odor. Liquids boil when their vapor pressure is equal to atmospheric pressure.
In solid water, there is a network of hydrogen bonds between the particles that gives it an open structure. This is why water expands as it freezes and why solid water has a lower density than liquid water. This has important implications for life (e.g., ice floating on water acts as an insulator in bodies of water to keep the temperature of the rest of the water above freezing.)
[Back to Chemistry Outline]
Expectations for Learning: Cognitive Demands This section provides definitions for Ohio’s science cognitive demands, which are intrinsically related to current understandings and research about how people learn. They provide a structure for teachers and assessment developers to reflect on plans for teaching science, to monitor observable evidence of student learning and to develop summative assessment of student learning of science.
Visions into Practice This section provides examples of tasks that students may perform; this includes guidance for developing classroom performance tasks. It is not an all-inclusive checklist of what should be done, but is a springboard for generating innovative ideas.
• Design an investigation to show that the volume of any liquid sample is constant when divided
by its mass (ref. ACS resource below).
• Devise an investigation to show that the addition of a solute affects the density of a liquid (ref.
ACS resource below).
Back to the INDEX

Ohio Department of Education, March 2011 Page 18 of 94
• Investigate the volume of one drop of liquid from a Beral-type pipet. Devise a method. Defend the method with data and present it to a wider audience using multiple formats (ref. ACS resource below).
• Investigate the variations and similarities between regular table sugar, high fructose corn
syrup, Stevia, Aspartame (Equal®), saccharin (Sweet n’ Low
®), sucralose (Splenda
®) and
Agave. Draw a conclusion, based on data analysis regarding which compound is the most damaging for human consumption. Present your findings in multiple formats. Variation for this project could be made with oils (e.g., canola, coconut, olive, vegetable).
• Determine the percent by mass of water content in popcorn. Correlate its effect on the amount
of popcorn produced (or time it takes to start the batch popping). Compare three brands, isolate other variables (e.g., popping method, use of different types of oil) and present findings in multiple formats (http://faculty.coloradomtn.edu/jeschofnig/popcorn.htm).
• Design an investigation to substantiate or negate the claims of a commercial product (e.g., ionic-tourmaline, a mineral that is said to emit quick-drying ions; a hair dryer; a shake weight dumbbell; a type of strong-bond glue). Determine function of, intent of and any potential bias with the product. Present findings in multiple formats.
Instructional Strategies and Resources This section provides additional support and information for educators. These are strategies for actively engaging students with the topic and for providing hands-on, minds-on observation and exploration of the topic, including authentic data resources for scientific inquiry, experimentation and problem-based tasks that incorporate technology and technological and engineering design. Resources selected are printed or Web-based materials that directly relate to the particular Content Statement. It is not intended to be a prescriptive list of lessons.
• Chem4Kids, University of Colorado at Boulder, and Scientific American have articles and
websites devoted to providing more information about Bose-Einstein condensates.
• “Ultra Cold Atoms” is an interview with a scientist who studies Bose-Einstein condensates. He
describes the process needed to form Bose-Einstein condensates and the unusual properties of super-cooled matter.
• “How Low Can You Go” is an interactive simulation of the process by which substances can be cooled to absolute zero.
• ACS Small-Scale Laboratory Assessment Activities were prepared by Robert G. Silberman
and Lucy T. Eubanks in association with the American Chemical Society Division of Chemical Education Examinations Institute in 1996 and provide excellent inquiry laboratory assessments. The Visions into Practice examples referenced above have been adapted from activities presented in this book.
• “Alkali metals” Discover the explosive results when water and alkali metals come together - and the science behind the reaction. Video.
• The Periodic Table of Data is an interactive periodic table. Students can select the properties they wish to view.
• Atoms and Molecules is a program produced by Annenberg that deals with teaching the very
first steps of chemistry. It introduces the basic building blocks – the atoms – which, through their properties, periodicity and binding, form molecules.
• Masterminding Molecules seeks to develop logic and reinforce the principles of fair testing. It
introduces the importance of concepts such as size, polarity and drug-like properties in the discovery of new medicines.
Back to the INDEX
Ohio Department of Education, March 2011 Page 19 of 94
Common Misconceptions
• Students think volume and mass measure the same thing. (Minstrell, J., & Krause, P., n.d.)
• Students think big means the same thing as heavy. (Horton, 2007)
• Students think there are 100 cm3
in 1 m3.Horton, 2007)
Students often think that:
• Every different substance (e.g., CO2, H2O, salt) is made from atoms of that substance, not
understanding that all substances come from the same set of elements assembled in different combinations.
• There is only one correct model of the atom.
• Electrons in an atom orbit nuclei like planets orbit the sun.
• Electron clouds are pictures of orbits.
• Electrons can be in any orbit they wish.
• Hydrogen is a typical atom.
• Electrons are physically larger than protons.
• Electrons and protons are the only fundamental particles.
• Physicists currently have the “right” model of the atom.
• Atoms can disappear (decay).
• Substances that are not hard and rigid cannot be solids (Stavy & Stachel, 1985).
• Chemists do not agree on how the “mole” should be defined: three meanings are that a mole is an individual unit of mass, a mole is a portion of substance and a mole is a number. Suggested (Kind, 2004) is that students be shown elements in a whole-number mass ratio, show that the ratio remains fixed regardless of the number of atoms, introduce the masses in grams, then introduce Avogadro’s number while reinforcing atom size.
• Compounds with ionic bonds behave as simple molecules; instead, explore students’ understanding of simple events like water boiling, sodium chloride and sugar dissolving, and ice melting. Make the events explicit by carrying them out in the students’ presence and using molecular models to probe thinking about which bonds break and form (Kind, 2004).
• The first element in a formula is responsible for bond formation; instead, use cognitive conflict to show why atoms form different types of bonds and that atoms form compounds in the most energetically favorable way (Kind, 2004).
• Atoms “want” to form bonds; instead, use electrostatics to explain bond formation (Kind, 2004).
• There are only two types of bonds – covalent and ionic; instead, be consistent in using bonding
terminology like “induced dipole-dipole bonds” and “permanent dipole-permanent dipole bonds because it is much more descriptive and clearly explains the kind of interaction involved (Kind, 2004).
Diverse Learners Strategies for meeting the needs of all learners including gifted students, English Language Learners (ELL) and students with disabilities can be found at this site. Resources based on the Universal Design for Learning principles are available at www.cast.org.
Classroom Portals Macro to Micro Structures is a program produced by Annenberg that deals with the conceptualization of micro processes and environments. It involves teaching chemistry through macro phenomena, which can be observed, and micro processes, which occur on the molecular level and can only be imagined.
Back to the INDEX
Ohio Department of Education, March 2011 Page 20 of 94
Course Content The following information may be taught in any order; there is no ODE-recommended sequence.
Interactions of Matter
• Chemical reactions
o Types of reactions o Kinetics o Energy o Equilibrium o Acids/bases
• Gas laws
o Pressure, volume and temperature o Ideal gas law
• Stoichiometry o Molar calculations o Solutions o Limiting reagents
• Nuclear Reactions o Radioisotopes o Nuclear energy
Content Elaboration Interactions of Matter
• Chemical Reactions
In the physical science syllabus, coefficients were introduced to balance simple equations. Other representations including Lewis structures and three-dimensional models also were used and manipulated to demonstrate the conservation of matter in chemical reactions. In this course, more complex reactions will be studied, classified and represented with chemical equations and three- dimensional models. Classifying reactions into types can be a helpful organizational tool in recognizing patterns of what may happen when two substances are mixed (see Note). Some general types of chemical reactions are oxidation/reduction, synthesis, decomposition, single- replacement, double replacement (including precipitation reactions and some acid-base neutralizations) and combustion reactions. Some reactions can fit into more than one category. For example, a single replacement reaction also can be classified as an oxidation/reduction reaction. Identification of reactions involving oxidation and reduction as well as indicating what substance is being oxidized and what is being reduced are appropriate in this course. However, balancing complex oxidation/reduction reactions will be reserved for more advanced study.
Organic molecules release energy when undergoing combustion reactions and are used to meet the energy needs of society (e.g., oil, gasoline, natural gas) and to provide the energy needs of biological organisms (e.g., cellular respiration). When a reaction between two ionic compounds in aqueous solution results in the formation of a precipitate or molecular compound, the reaction often occurs because the new ionic or covalent bonds are stronger than the original ion-dipole interactions of the ions in solution. Laboratory experiences (3-D or virtual) with different types of chemical reactions must be provided.
Note: Teachers should be aware that the common reaction classifications that are often used in
high school chemistry courses often lead to misconceptions because they are not based on the actual chemistry, but on surface features that may be similar from one system to another (e.g., exchanging partners), even though the underlying chemistry is not the same. However, they may be useful in making predictions about what may happen when two substances are mixed.
Back to the INDEX

Ohio Department of Education, March 2011 Page 21 of 94
Reactions occur when reacting particles collide in an appropriate orientation and with sufficient energy. Not all collisions are effective. Stable reactants require the input of energy, the activation energy, to initiate a reaction. A catalyst provides an alternate pathway for a reaction, usually with a lower activation energy. With this lower energy threshold, more collisions will have enough energy to result in a reaction. An enzyme is a large organic molecule that folds into a unique shape by forming intermolecular bonds with itself. The enzyme’s shape allows it to hold a substrate molecule in the proper orientation to result in an effective collision. The rate of a chemical reaction is the change in the amount of reactants or products in a specific period of time. Increasing the probability or effectiveness of the collisions between the particles increases the rate of the reaction. Therefore, changing the concentration of the reactants, the temperature or the pressure of gaseous reactants can change the reaction rate. Likewise, the collision theory can be applied to dissolving solids in a liquid solvent and can be used to explain why reactions are more likely to occur between reactants in the aqueous or gaseous state than between solids. The rate at which a substance dissolves should not be confused with the amount of solute that can dissolve in a given amount of solvent (solubility). Mathematical treatment of reaction rates are reserved for later study. Computer simulations can help visualize reactions from the perspective of the kinetic-molecular theory.
In middle school, the differences between potential and kinetic energy and the particle nature of thermal energy were introduced. For chemical systems, potential energy is in the form of chemical energy and kinetic energy is in the form of thermal energy. The total amount of chemical energy and/or thermal energy in a system is impossible to measure. However, the energy change of a system can be calculated from measurements (mass and change in temperature) from calorimetry experiments in the laboratory. Conservation of energy is an important component of calorimetry equations. Thermal energy is the energy of a system due to the movement (translational, vibrational and rotational) of its particles. The thermal energy of an object depends upon the amount of matter present (mass), temperature and chemical composition. Some materials require little energy to change their temperature and other materials require a great deal to change their temperature by the same amount. Specific heat is a measure of how much energy is needed to change the temperature of a specific mass of material a specific amount. Specific heat values can be used to calculate the thermal energy change, the temperature (initial, final or change in) or mass of a material in calorimetry. Water has a particularly high specific heat capacity, which is important in regulating Earth’s temperature.
As studied in middle school, chemical energy is the potential energy associated with chemical systems. Chemical reactions involve valence electrons forming bonds to yield more stable products with lower energies. Energy is required to break interactions and bonds between the reactant atoms and energy is released when an interaction or bond is formed between the atoms in the products. Molecules with weak bonds (e.g., ATP) are less stable and tend to react to produce more stable products, releasing energy in the process. Generally, energy is transferred out of the system (exothermic) when the products have stronger bonds than the reactants and is transferred into the system (endothermic) when the reactants have stronger bonds than the products. Predictions of the energy requirements (endothermic or exothermic) of a reaction can be made given a table of bond energies. Graphic representations can be drawn and interpreted to represent the energy changes during a reaction, including the activation energy. The roles of energy and entropy in determining the spontaneity of chemical reactions are dealt with conceptually in this course. Avoid describing entropy as the amount of disorder since this leads to persistent misconceptions. Mathematical treatment of entropy and its influence on the spontaneity of reactions is reserved for advanced study.
Back to the INDEX

Ohio Department of Education, March 2011 Page 22 of 94
3
All reactions are reversible to a degree and many reactions do not proceed completely toward products but appear to stop progressing before the reactants are all used up. At this point, the amounts of the reactants and the products appear to be constant and the reaction can be said to have reached dynamic equilibrium. In fact, the reaction has stopped because the rate of the reverse reaction is equal to the rate of the forward reaction so there is no apparent change in the reaction. If given a graph showing the concentration of the reactants and products over the time of reaction, the equilibrium concentrations and the time at which equilibrium was established can be determined. Some reactions appear to proceed only in one direction. In these cases, the reverse reaction can occur but is highly unlikely (e.g., combustion reactions). Such reactions usually release a large amount of energy and require a large input of energy to go in the reverse direction. If a chemical system at equilibrium is disturbed by a change in the conditions of the system (e.g., increase or decrease in the temperature, pressure on gaseous equilibrium systems, concentration of a reactant or product), then the equilibrium system will respond by shifting to a new equilibrium state, reducing the effect of the change (Le Chatelier’s Principle). If products are removed as they are formed during a reaction, then the equilibrium position of the system is forced to shift to favor the products. In this way, an otherwise unfavorable reaction can be made to occur. Mathematical treatment of equilibrium reactions is reserved for advanced study. Computer simulations can help visualize the progression of a reaction to dynamic equilibrium and the continuation of both the forward and reverse reactions after equilibrium has been attained.
Properties of acids and bases and the ranges of the pH scale were introduced in middle school. In chemistry, the structural features of molecules are explored to further understand acids and bases. Acids often result when hydrogen is covalently bonded to an electronegative element and is easily
dissociated from the rest of the molecule to bind with water to form a hydronium ion (H O+). The
acidity of an aqueous solution can be expressed as pH, where pH can be calculated from the concentration of the hydronium ion. Bases are likely to dissociate in water to form a hydroxide ion. Acids can react with bases to form a salt and water. Such neutralization reactions can be studied quantitatively by performing titration experiments. Detailed instruction about the equilibrium of acids and bases and the concept of Brønsted-Lowry and Lewis acids and bases will not be assessed at this level.
[Back to Interactions of Matter Outline] [Back to Chemistry Outline]
• Gas laws
The kinetic-molecular theory can be used to explain the macroscopic properties of gases (pressure, temperature and volume) through the motion and interactions of its particles. When one of the three properties is kept constant, the relationship between the other two properties can be quantified, described and explained using the kinetic-molecular theory. Real-world phenomena (e.g., why tire pressure increases in hot weather, why a hot air balloon rises) can be explained using this theory. Problems also can be solved involving the changes in temperature, pressure and volume of a gas. When solving gas problems, the Kelvin temperature scale must be used since only in this scale is the temperature directly proportional to the average kinetic energy. The Kelvin temperature is based on a scale that has its minimum temperature at absolute zero, a temperature at which all motion theoretically stops. Since equal volumes of gases at the same temperature and pressure contain an equal number of particles (Avogadro’s law), problems can be solved for an unchanging gaseous system using the ideal gas law (PV = nRT) where R is the ideal gas constant (e.g., represented in multiple formats, 8.31 Joules / (mole K). The specific names of the gas laws are not addressed in this course. Deviations from ideal gaseous behavior are reserved for more advanced study. Explore the relationships between the volume, temperature and pressure in the laboratory or through computer simulations or virtual experiments.
[Back to Interactions of Matter Outline] [Back to Chemistry Outline]
Back to the INDEX
Ohio Department of Education, March 2011 Page 23 of 94
• Stoichiometry A stoichiometric calculation involves the conversion from the amount of one substance in a chemical reaction to the amount of another substance. The coefficients of the balanced equation indicate the ratios of the substances involved in the reaction in terms of both particles and moles. Once the number of moles of a substance is known, amounts can be changed to mass, volume of a gas, volume of solutions and/or number of particles. Molarity is a measure of the concentration of a solution that can be used in stoichiometric calculations. When performing a reaction in the lab, the experimental yield can be compared to the theoretical yield to calculate percent yield. The concept of limiting reagents is treated conceptually and not mathematically. Molality and Normality are concepts reserved for more advanced study.
[Back to Interactions of Matter Outline] [Back to Chemistry Outline]
• Nuclear Reactions
The basics of nuclear forces, isotopes, radioactive decay, fission and fusion were addressed in the physical science syllabus. In chemistry, specific types of radioactive decay and using nuclear reactions as a source of energy are addressed. Radioactive decay can result in the release of different types of radiation (alpha, beta, gamma, positron) each with a characteristic mass, charge and potential to ionize and penetrate the material it strikes. Beta decay results from the decay of a neutron and positron decay results from the decay of a proton. When a radioisotope undergoes alpha, beta or positron decay, the resulting nucleus can be predicted and the balanced nuclear equation can be written.
Nuclear reactions, such as fission and fusion, are accompanied by large energy changes that are much greater than those that accompany chemical reactions. These nuclear reactions can theoretically be used as a controlled source of energy in a nuclear power plant. There are advantages and disadvantages of generating electricity from fission and fusion.
[Back to Interactions of Matter Outline] [Back to Chemistry Outline]
Expectations for Learning: Cognitive Demands This section provides definitions for Ohio’s science cognitive demands, which are intrinsically related to current understandings and research about how people learn. They provide a structure for teachers and assessment developers to reflect on plans for teaching science, to monitor observable evidence of student learning and to develop summative assessment of student learning of science.
Visions into Practice This section provides examples of tasks that students may perform; this includes guidance for developing classroom performance tasks. It is not an all-inclusive checklist of what should be done, but is a springboard for generating innovative ideas.
• Devise an investigation, given five numbered samples of either acidic or basic solution and a
sixth solution sample of phenolphthalein. Rank the samples in order of their concentration. Present methodology and results in multiple formats (adapted, Silberman, 1996).
• Design an investigation to determine the most effective antacid per gram for neutralizing stomach acid (HCl), baking soda (NaHCO3) or magnesium hydroxide (Mg (OH)2).
• No nuclear waste generated over the last 40 years has been permanently disposed. Determine
the time required for a rock (uranium-238) with a rate constant for decay (4.5 x 10 9
years) to decompose to safe levels. Propose a method for containing this material until safe levels are achieved.
Back to the INDEX

Ohio Department of Education, March 2011 Page 24 of 94
Instructional Strategies and Resources This section provides additional support and information for educators. These are strategies for actively engaging students with the topic and for providing hands-on, minds-on observation and exploration of the topic, including authentic data resources for scientific inquiry, experimentation and problem-based tasks that incorporate technology and technological and engineering design. Resources selected are printed or Web-based materials that directly relate to the particular Content Statement. It is not intended to be a prescriptive list of lessons.
• Teaching Entropy Analysis in the First Year Chemistry Class and Beyond is an article that
appeared in the Journal of Chemistry Education that discusses scientifically accurate ways to teach entropy to high school students. The sections from the beginning of the article to the bottom of page 1586, ending at Advanced Students is appropriate for the level of this chemistry course.
• Indicators in Chemistry is a video that shows how the content of acids and bases can be integrated into a technological design activity.
• The Design Studio introduces the concepts of shape, enzyme inhibition, potency, drug-like properties and the need to achieve a balance of properties to discover effective medicines.
• Oil strike is an interactive, chemistry-themed game. Try and maximize your profits as you build your own refineries.
Common Misconceptions
• Acids can burn and eat material away (Kind, 2004); introduce acids and bases alongside each other.
• Neutralization means an acid breaking down (Kind, 2004); show the difference between “strong” and “weak” and diluted and concentrated.
• A base/alkali inhibits the burning properties of an acid (Kind, 2004); introduce neutralization as a reaction involving an acid and a base reacting together.
Diverse Learners Strategies for meeting the needs of all learners including gifted students, English Language Learners (ELL) and students with disabilities can be found at this site. Resources based on the Universal Design for Learning principles are available at www.cast.org.
Classroom Portals Energetics and Dynamics is a video-on-demand produced by Annenberg that emphasizes the importance of learning about energetics and dynamics in order to improve students’ understanding of basic principles of chemistry.
Back to the INDEX
Ohio Department of Education, March 2011 Page 25 of 94
Environmental Science
Syllabus and Model Curriculum
Course Description Environmental science is a high school level course, which satisfies the Ohio Core science graduation requirements of Ohio Revised Code Section 3313.603. This section of Ohio law requires a three-unit course with inquiry-based laboratory experience that engages students in asking valid scientific questions and gathering and analyzing information.
Environmental science incorporates biology, chemistry, physics and physical geology and introduces students to key concepts, principles and theories within environmental science.
Investigations are used to understand and explain the behavior of nature in a variety of inquiry and design scenarios that incorporate scientific reasoning, analysis, communication skills and real-world applications. It should be noted that there are classroom examples in the model curriculum that can be developed to meet multiple sections of the syllabus, so one well-planned long-term project can be used to teach multiple topics.
Science Inquiry and Application During the years of grades 9 through 12, all students must use the following scientific processes with appropriate laboratory safety techniques to construct their knowledge and understanding in all science content areas:
• Identify questions and concepts that guide scientific investigations;
• Design and conduct scientific investigations;
• Use technology and mathematics to improve investigations and communications;
• Formulate and revise explanations and models using logic and evidence (critical thinking);
• Recognize and analyze explanations and models; and
• Communicate and support a scientific argument.
Course Content The following information may be taught in any order; there is no ODE-recommended sequence.
Earth Systems: Interconnected Spheres of Earth
• Biosphere
o Evolution and adaptation in populations o Biodiversity o Ecosystems (equilibrium, species interactions, stability) o Population dynamics
• Atmosphere o Atmospheric properties and currents
• Lithosphere
o Geologic events and processes • Hydrosphere
o Oceanic currents and patterns (as they relate to climate) o Surface and ground water flow patterns and movement o Cryosphere
• Movement of matter and energy through the hydrosphere, lithosphere, atmosphere and biosphere
o Energy transformations on global, regional and local scales o Biogeochemical cycles o Ecosystems o Climate and weather
Back to the INDEX
Ohio Department of Education, March 2011 Page 26 of 94
Content Elaboration This topic builds upon both the physical science and biology courses as they relate to energy transfer and transformation, conservation of energy and matter, evolution, adaptation, biodiversity, population studies, and ecosystem composition and dynamics. In grades 6-8, geologic processes, biogeochemical cycles, climate, the composition and properties of the atmosphere, lithosphere and hydrosphere (including the hydrologic cycle) are studied.
The focus for this topic is on the connections and interactions between Earth’s spheres (the hydrosphere, atmosphere, biosphere and lithosphere). Both natural and human-made interactions must be studied. This includes an understanding of causes and effects of climate, global climate (including el Niño/la Niña patterns and trends) and changes in climate through Earth’s history, geologic events (e.g., a volcanic eruption or mass wasting) that impact Earth’s spheres, biogeochemical cycles and patterns, the effect of abiotic and biotic factors within an ecosystem, and the understanding that each of Earth’s spheres is part of the dynamic Earth system. Ground water and surface water velocities and patterns are included as the movement of water (either at the surface, in the atmosphere or beneath the surface) can be a mode of transmission of contamination. This builds upon previous hydrologic cycle studies in earlier grades. Geomorphology and topography are helpful in determining flow patterns and pathways for contamination.
The connections and interactions of energy and matter between Earth’s spheres must be researched and investigated using actual data. The emphasis is on the interconnectedness of Earth’s spheres and the understanding of the complex relationships between each, including both abiotic and biotic factors. One event, such as a petroleum release or a flood, can impact each sphere. Some impacts are long- term, others are short-term and most are a combination of both long- and short-term. It is important to use real, quantifiable data to study the interactions, patterns and cycles between Earth’s spheres.
Expectations for Learning: Cognitive Demands This section provides definitions for Ohio’s science cognitive demands, which are intrinsically related to current understandings and research about how people learn. They provide a structure for teachers and assessment developers to reflect on plans for teaching science, to monitor observable evidence of student learning and to develop summative assessment of student learning of science.
Visions into Practice This section provides examples of tasks that students may perform; this includes guidance for developing classroom performance tasks. It is not an all-inclusive checklist of what should be done, but is a springboard for generating innovative ideas.
• Choose a specific location in the United States. Research and analyze the patterns of climate
change throughout the geologic record, historic data (human records) and present-day data for the location. Be able to explain the interpretation and analysis of the data. Create a graphical representation of the pattern and discuss with the class.
• Research or investigate an actual environmental/geologic event (e.g., a specific release of a toxin/contaminant, hurricane, earthquake, flood, fire or landslide) and determine how each of Earth’s spheres was impacted. Long-term and short-term impacts must be included. Provide scientific evidence and data to support conclusions and trace movement of contamination or energy through each sphere. Use a multimedia presentation to share findings with the class.
• Research an actual contamination event (that has quantitative data available). Use a
computer-modeling program (many are available through freeware sites, fate and transport modeling) to model and predict the movement of the contamination through Earth’s spheres. Develop and evaluate solutions for the cleanup, containment or reduction of the contamination. Include consequences and/or alternatives for the proposed solution. Present findings to the class or an authentic audience.
Back to the INDEX
Ohio Department of Education, March 2011 Page 27 of 94
• Plan and implement an experiment or demonstration to illustrate the factors that lead to
changing oceanic currents (both deep and shallow, can be 3-D or virtual). Document all steps and prepare a presentation or a poster session for the class. Defend the process and the results.
• Plan and implement an investigation to explore biomagnification or bioaccumulation within a specific Ohio ecosystem (existing public case studies can be used, such as a local Brownfields case – see resource listed below). Document the steps and process to collect or research, evaluate or test and analyze the data. Research should include the possible impact to humans. Present the process and results to the class verbally or in writing.
• Choose a specific living species. Using scientific data, trace the history of that species. Show existing, proven evolutionary relationships, environmental (both biotic and abiotic) requirements, global locations, ecosystem characteristics and sustainability predictions. Use quantifiable data to support findings and present findings to the class orally, through demonstration/explanation or a poster session.
• Plan and implement a population study of a specific area (over a period of time) or critique/analyze an existing population study. Document changes in weather, food availability and any change to the population. Prepare a scientific analysis and conclusion (in writing) for the study.
• Research or conduct a field investigation for a specific invasive species that is present in the local community or in Ohio. Examples of research questions include: How did the organism get into Ohio? What is being done to control the spread of the species? What is the impact of the species on the native population? Use quantifiable data to draw conclusions and present research results in writing or orally.
• Investigate and research the effect that climate change is having or has had on a specific living or extinct species, such as the harp seal or elkhorn coral, or on an ecosystem, such as the Great Barrier Reef or the Arctic Circle.
• Research and analyze quantifiable scientific data pertaining to food availability, reproductive requirements and changes, adaptations or population changes to draw conclusions. Students present data and conclusions to the class.
Instructional Strategies and Resources This section provides additional support and information for educators. These are strategies for actively engaging students with the topic and for providing hands-on, minds-on observation and exploration of the topic, including authentic data resources for scientific inquiry, experimentation and problem-based tasks that incorporate technology and technological and engineering design. Resources selected are printed or Web-based materials that directly relate to the particular Content Statement. It is not intended to be a prescriptive list of lessons.
• The University of Maine offers a scientific case study of a specific glacier, including
quantifiable data that documents measurable changes each year, at http://climatechange.umaine.edu/Research/projects/byrdglacier.html.
• The OSU Byrd Polar Research site offers numerous educational resources that are related to glacial geology and climate change at http://bprc.osu.edu/.
• The Ohio EPA provides a map of all regional Brownfields projects, a resource to provide data
and documentation for local case studies involving a variety of hazardous releases into the environment and quantifiable data and monitoring data at http://www.epa.state.oh.us/derr/SABR/brown_dtb/browndtb.aspx.
• The National Ground Water Association offers information, data and resources to support teachers in teaching all aspects of ground water at http://www.ngwa.org/.
• The North Carolina Department of Environment and Natural Resources offers basic hydrology background information, including ways to calculate ground water velocity and outlining different types of aquifers, to help in teaching about ground water at http://www.ncwater.org/Education_and_Technical_Assistance/Ground_Water/Hydrogeology/.
Back to the INDEX

Ohio Department of Education, March 2011 Page 28 of 94
• Intellicast.com offers real-time data for the jet stream (updated daily), including velocities and patterns on an isometric map at http://www.intellicast.com/National/Wind/JetStream.aspx.
• The College Board provides enduring understandings recommended for AP environmental science, which can help to form discussion questions and research for this topic at http://professionals.collegeboard.com/profdownload/cbscs-science-standards-2009.pdf. Appendix A (page 175) of this document contains the environmental science information.
• The Digital Library for Earth Systems Education offers resources from a number of sources,
such as National Geographic, government agencies and other scientific agencies. Grade 9-12 resources are provided at http://www.dlese.org/library/query.do?q=&s=0&gr=02.
• NOAA provides real-time data for many of its projects and research missions, including real- time ocean current data collected from free-floating buoys, at http://www.noaa.gov/sciencemissions/bpoilspill.html.
• The Ohio Department of Natural Resources’ Project Wet offers training and resources for K-12 teachers that promote deep understanding about all aspects of water and the interconnectedness of all of Earth’s spheres (Earth Systems). Training and workshop opportunities can be found at http://www.dnr.state.oh.us/tabid/3501/Default.aspx.
• Project Wet’s Healthy Water, Healthy People water quality educators guide offers ideas and resources for teaching all aspects of water and water contamination issues. Ideas for field monitoring, research projects and student investigations as well as teacher training are available at http://www.projectwet.org/water-resources-education/water-quality-education/.
• EarthComm offers a program that uses many different strategies to reach students of all learning levels at http://www.agiweb.org/earthcomm/. The teaching of environmental science through relating the classroom to the real world is essential for many learners.
• The National Academy of Science provides a number of resources related to climate change and greenhouse gases at http://www.nationalacademies.org/education/tsresources.html. Some of the options include Web quests, virtual/digital learning, virtual fieldtrips and field research ideas. By providing alternate options and choices that can be completed by students at different paces, all students can benefit.
Common Misconceptions
• The NSTA offers a position paper which is helpful in addressing concerns and misconceptions from students regarding evolution at http://www.nsta.org/about/positions/evolution.aspx.
• Students may have difficulty separating science from non-science factors as they relate to the
different parts of the environment. It is important to distinguish “what is science” and therefore, what will be included in an environmental science class, especially as it relates to climate change and evolution. Identifying and understanding personal bias and ethical issues are an important step in recognizing science. Wheaton College offers Teaching Ethical Analysis in Environmental Management Decisions: A Process-Oriented Approach at http://www.wheaton.edu/Biology/faculty/fvd/Teachingethical.pdf.
• The EPA provides support for teachers that are teaching about climate change. To address student misconceptions regarding this issue, it is important to use real-time data and research, which can be found through the EPA at http://www.epa.gov/teachers/climate.html.
• Misconceptions regarding all aspects of environmental science must be addressed through
scientific data analysis, investigation and research. Discussing the conclusions and findings through a professional “gallery walk” can be a very useful way to determine possible misconceptions that exist for the class and address them. Carleton College offers a gallery walk website at http://serc.carleton.edu/introgeo/gallerywalk/misconceptions.html.
Diverse Learners Strategies for meeting the needs of all learners including gifted students, English Language Learners (ELL) and students with disabilities can be found at this site. Resources based on the Universal Design for Learning principles are available at www.cast.org.
Back to the INDEX

Ohio Department of Education, March 2011 Page 29 of 94
Classroom Portals Annenberg offers ideas about teaching high school level environmental science using an integrated Earth systems approach at http://www.learner.org/resources/series209.html.
Course Content The following information may be taught in any order; there is no ODE-recommended sequence.
Earth’s Resources
• Energy resources
o Renewable and nonrenewable energy sources and efficiency o Alternate energy sources and efficiency o Resource availability o Mining and resource extraction
• Air and air pollution
o Primary and secondary contaminants o Greenhouse gases o Clean Air Act
• Water and water pollution
o Potable water and water quality o Hypoxia, eutrophication o Clean Water Act o Point source and non-point source contamination
• Soil and land o Desertification o Mass wasting and erosion o Sediment contamination o Land use and land management (including food production, agriculture and zoning) o Solid and hazardous waste
• Wildlife and wilderness
o Wildlife and wilderness management o Endangered species
Content Elaboration This topic explores the availability of Earth’s resources, extraction of the resources, contamination problems, remediation techniques and the storage/disposal of the resources or by-products. Conservation, protection and sustainability of Earth’s resources also are included. This builds upon grades 6-8 within the Earth and Space Science strand (sections pertaining to energy and Earth’s resources) and the biology and physical science (in particular chemistry and energy topics) courses at the high school level.
To understand the effects that certain contaminants may have on the environment, scientific investigations and research must be conducted on a local, national and global level. Water, air, land, and biotic field and lab sampling/testing equipment and methods must be utilized with real-world application. Quantifiable field and/or lab data must be used to analyze and draw conclusions regarding air, water or land quality. Examples of types of water-quality testing include: hydraulic conductivity, suspended and dissolved solids, dissolved oxygen, biochemical oxygen demand, temperature, pH, fecal coliform and macro-invertebrate studies. Wetland or woodland delineations and analysis, land use analysis and air monitoring (e.g., particulate matter sizes/amount) are all appropriate field study investigations. Comparative analysis of scientific field or lab data should be used to quantify the environmental quality or conditions. Local data also can be compared to national and international data.
Back to the INDEX
Ohio Department of Education, March 2011 Page 30 of 94
The study of relevant, local problems can be a way to connect the classroom to the real world. Within Ohio, there are numerous environmental topics that can be investigated. Examples include wetland loss or mitigation, surface or ground water contamination (including sediment, chemical or thermal contamination), acid rain, septic system or sewage overflows/failures, landfill seepage, underground storage tank/pipe releases, deforestation, invasive species, air pollution (e.g., photochemical smog or particulate matter), soil loss/erosion or acid mine drainage.
At the advanced science level, renewable and nonrenewable energy resources topics investigate the effectiveness, risk and efficiency for differing types of energy resources at a local, state, national and global level. This builds upon grades 6-8 within both Earth and Space Science, and physical science at the high school level. Nuclear and geothermal energy are included in this topic.
Feasibility, availability, remediation and environmental cost are included in the extraction, storage, use and disposal of both abiotic and biotic resources. Environmental impact must be evaluated as it pertains to both the environmental and human risk. Examples include chemical hazards, radiation, biological hazards, toxicology and risk analysis studies. Learning about conservation and protection of the environment also requires an understanding of laws and regulations that exist to preserve resources and reduce and/or remediate contamination, but the emphasis should be on the science behind the laws and regulations.
Relating Earth’s resources to a global scale and using technology to collect global resource data for comparative classroom study is recommended. In addition, it is important to connect the industry and the scientific community to the classroom to increase the depth of understanding. Critical thinking and problem-solving skills are important in evaluating resource use, management and conservation. New discoveries and research are important parts of this topic.
Expectations for Learning: Cognitive Demands This section provides definitions for Ohio’s science cognitive demands, which are intrinsically related to current understandings and research about how people learn. They provide a structure for teachers and assessment developers to reflect on plans for teaching science, to monitor observable evidence of student learning and to develop summative assessment of student learning of science.
Visions into Practice This section provides examples of tasks that students may perform; this includes guidance for developing classroom performance tasks. It is not an all-inclusive checklist of what should be done, but is a springboard for generating innovative ideas.
• Choose a specific environmental problem, such as the effect of herbicides in water (e.g.,
Atrizine), an invasive species (e.g., purple loosestrife or the Asian carp) or carbon monoxide in the atmosphere, and research the history, the scientific data before and after relevant laws were passed, and how this problem is being addressed in other countries/globally. Computer models or programs can be used to predict/analyze the problem or the movement of the contamination. Present scientific evidence and quantifiable data orally, through a poster session or in written form (scientific research paper).
• Design and conduct a field investigation that concentrates on a specific environmental problem (e.g., sediment contamination or acid mine drainage) and how the problem can be remediated. Compare results to similar communities, recommended limits, permit requirements or other published results. Analyze the data and make specific recommendations to limit, remediate, reduce or prevent the problem. Present findings to an authentic audience from the community.
• Research and document land-use planning or management in the community or at a specific
location. Attend community meetings pertaining to land-use, land-management or zoning plans. Research questions should include: What factors are used in determining use? What data is collected and analyzed? What changes are on the horizon? Discuss in class.
Back to the INDEX
Ohio Department of Education, March 2011 Page 31 of 94
• Take a field trip to visit the water treatment facility or watch the drilling of a water well.
Document observations, including information about how water is treated prior to and after use, specific issues that may impact the source, the location of the original water source, specific tests conducted (materials and methods needed to test and how the tests are conducted, results of the tests), and the steps taken to monitor the water at the source and throughout the process (including from the facility/well into the residence). Discuss with the class.
• Using real-time data, research the most severe environmental problems (and the root causes for the problems) that face the local community, Ohio, the United States or the world. Present evidence (quantitative data) and conclusions orally, through a poster session or in written form (scientific research paper).
• Research and collect specific data for a mass wasting or desertification event (can be present day or historical). Research questions should include: What factors led to the event? What was the result of the event (how was each of Earth’s spheres impacted)? What data is present (analyze the data and draw conclusions)? What laws are related to the event? How can this be prevented in the future? Record the results graphically or in a scientific report.
Instructional Strategies and Resources This section provides additional support and information for educators. These are strategies for actively engaging students with the topic and for providing hands-on, minds-on observation and exploration of the topic, including authentic data resources for scientific inquiry, experimentation and problem-based tasks that incorporate technology and technological and engineering design. Resources selected are printed or Web-based materials that directly relate to the particular Content Statement. It is not intended to be a prescriptive list of lessons.
• The National Ground Water Association offers information, data and resources to support
teachers in teaching all aspects of ground water at http://www.ngwa.org/.
• The U.S. Geological Survey outlines current surface water projects within the state of Ohio.
Surface water-quality data (including stream gauge and volume data) can be found and used to support local field investigations. There also are links to provide historic surface and ground water data for analysis, at http://oh.water.usgs.gov/projects.htm?Category=Surface+Water.
• The U.S. Environmental Protection Agency offers a risk-assessment information system with specific Ohio risk assessments that can be used to provide background data or specific case studies. This information helps illustrate the types of tests that are included in a risk assessment and also provides different risk levels for specific contaminants. Find it at http://rais.ornl.gov/.
• The U.S. EPA houses an online SCREEN3 computer-modeling program for air pollutants. There also are resources and data explaining the use of computer modeling and air pollution that may be helpful in student research and investigation projects. Find it at http://www.epa.gov/scram001/aqmindex.htm.
• ODNR’s website discusses acid mine drainage issue in Ohio. There also are specific links to
Ohio watersheds (including maps of the watershed locations) that are in the abatement program and water quality data to study changes within a local area. Find it at http://www.ohiodnr.com/mineral/acid/tabid/10421/Default.aspx.
• The Ohio EPA offers a discussion about Ohio wetlands and the delineation, and qualitative analysis of Ohio wetlands at http://www.epa.state.oh.us/portals/47/facts/ohio_wetlands.pdf.
• The National Park Service provides information about Ohio woodlands and the types of data required to determine woodland quality. Find information addressing riparian woodlands at http://www.oardc.ohio-state.edu/ferel/riparian_home.htm.
Back to the INDEX

Ohio Department of Education, March 2011 Page 32 of 94
• The Ohio EPA outlines federal and state environmental laws at http://www.epa.state.oh.us/Rules_and_Laws.aspx.
• The Digital Library for Earth Systems Education offers resources from a number of sources, such as National Geographic, government agencies and other scientific agencies. Grade 9-12 resources are provided at http://www.dlese.org/library/query.do?q=&s=0&gr=02.
• The Solid Waste Authority of Central Ohio resource section offers ideas about landfill tours, information about waste management and specific problems facing Ohio at http://www.swaco.org/SmartKids/Resources.aspx.
• Science News and Science Daily offer information highlighting science in the news that can be
used for class discussions. The information is updated weekly or bi-weekly and provides references and resource sites for more in-depth discussion. Visit http://www.sciencenews.org/ and http://www.sciencedaily.com/.
• NOAA provides real-time data for many of its projects and research missions at http://www.noaa.gov/sciencemissions/bpoilspill.html.
• For an index page for numerous environmental educational resources available through the Ohio EPA and associated agencies, visit http://www.epa.state.oh.us/oeef/ee_resources.aspx.
• Geology.com provides information on current events in all topic areas of geology, including resources and uses of resources, at http://geology.com/.
• The Ohio Department of Natural Resources provides data regarding sustainable water programs that are conducted in Ohio (monitoring programs, water quality testing information and contact information for the ODNR scientists that work in these areas) at http://ohiodnr.com/tabid/18951/Default.aspx.
• NSTA provides learning modules called “SciPacks” that are designed to increase teacher content knowledge through inquiry-based modules. Find a module addressing Earth’s resources and humans at http://learningcenter.nsta.org/product_detail.aspx?id=10.2505/5/SG- 27.
• The Ohio Department of Natural Resources’ Project Wet offers training and resources for K-12
teachers that promote deep understanding about all aspects of water and the interconnectedness of all of Earth’s spheres (Earth systems). Training and workshop opportunities can be found at http://www.dnr.state.oh.us/tabid/3501/Default.aspx.
• The College Board provides enduring understandings recommended for AP environmental science which can help to form discussion questions and research for this topic at http://professionals.collegeboard.com/profdownload/cbscs-science-standards-2009.pdf. Appendix A (page 175) of this document contains the environmental science information.
• Project Wet’s Healthy Water, Healthy People water quality educators guide offers ideas and resources for teaching all aspects of water and water contamination issues. Ideas for field monitoring, research projects and student investigations as well as teacher training are available at http://www.projectwet.org/water-resources-education/water-quality-education/.
Common Misconceptions
• Common misconceptions dealing with renewable energy efficiency along with suggestions to overcome these misconceptions through exploration and investigation are available on the website of California State University, Northridge, at http://www.csun.edu/~ml727939/coursework/690/Miha’s%20misconception%20report.doc.
• Misconceptions regarding all aspects of environmental science must be addressed through
scientific data analysis, investigation and research. Discussing the conclusions and findings through a professional “gallery walk” can be a very useful way to determine possible misconceptions that exist for the class and address them. Carleton College offers a gallery walk website at http://serc.carleton.edu/introgeo/gallerywalk/misconceptions.html.
Back to the INDEX

Ohio Department of Education, March 2011 Page 33 of 94
Diverse Learners Strategies for meeting the needs of all learners including gifted students, English Language Learners (ELL) and students with disabilities can be found at this site. Resources based on the Universal Design for Learning principles are available at www.cast.org.
Classroom Portals Annenberg offers ideas about teaching high school level environmental science using an integrated Earth systems approach at http://www.learner.org/resources/series209.html.
Course Content The following information may be taught in any order; there is no ODE-recommended sequence.
Global Environmental Problems and Issues
• Human population
• Potable water quality, use and availability
• Climate change
• Sustainability
• Species depletion and extinction
• Air quality
• Food production and availability
• Deforestation and loss of biodiversity
• Waste management (solid and hazardous)
Content Elaboration This topic is a culminating section that incorporates the previous topics and applies them to a global or international scale. Case studies, developing and using models, collecting and analyzing water and/or air quality data, conducting or researching population studies and methods of connecting to the real world must be emphasized for this topic. Technology can be used for comparative studies to share local data internationally so that specific, quantifiable data can be compared and used in understanding the impact of some of the environmental problems that exist on a global scale. Researching and investigating environmental factors on a global level contributes to the depth of understanding by applying the environmental science concepts to problem solving and design. Examples of global topics that can be explored include building water or air filtration models, investigating climate change data, monitoring endangered or invasive species, and studying the environmental effects of increasing human population. Researching contemporary discoveries, new technology and new discoveries can lead to improvement in environmental management.
Expectations for Learning: Cognitive Demands This section provides definitions for Ohio’s science cognitive demands, which are intrinsically related to current understandings and research about how people learn. They provide a structure for teachers and assessment developers to reflect on plans for teaching science, to monitor observable evidence of student learning and to develop summative assessment of student learning of science.
Visions into Practice This section provides examples of tasks that students may perform; this includes guidance for developing classroom performance tasks. It is not an all-inclusive checklist of what should be done, but is a springboard for generating innovative ideas.
• Investigate and research global human population patterns and changes over time. Example
research questions include: What countries have marked changes in populations at present, in the past? What are the factors that affect population change? What are verifiable relationships related to population (e.g., economic indicators, education levels, laws, resource availability, environmental conditions)? Provide evidence and data to support conclusions. Document the research in a scientific research paper.
Back to the INDEX

Ohio Department of Education, March 2011 Page 34 of 94
• Investigate and/or research (using quantifiable data and evidence) the relationship between
deforestation and changing weather or, in some cases, climate, at a specific location (like the Amazon region of South America). Analyze the data and draw a conclusion based upon the analysis. Discuss the conclusion with the class.
• Plan and implement an investigation to determine the water quality of a section of a local stream. This includes researching and conducting standard water-quality tests and how to analyze the results. Compare the results to known data from a different country (with a similar setting). Compare and contrast the data and analyze the results. Example research questions include: What are the reasons for any statistically significant differences? What comparisons can be made about the topography or geomorphology of the location? What testing methods, materials and/or equipment are used? What are the testing dates/times/locations? What are the existing, applicable, environmental laws or requirements? Document all results and present to an authentic audience.
• Develop a risk assessment for a specific company. Research one particular toxin or hazardous
chemical used by the company (e.g., diesel fuel) to determine possible risks and pathways to the environment and humans. The assessment should include: nature of the toxin/chemical (e.g., is the material flammable, does is react when wet), on-site use and handling (including existing safety practices) of the toxin/chemical, by-products (e.g., vapors or dilution processes), storage, transportation of the toxin/chemical, required documentation, emergency plans/guidelines, topography and geology of the area. Use a computer-modeling program (many are available through freeware sites) to model and predict the movement of the possible pathways of the toxin/chemical and recommendations of methods to contain the release of the toxin/chemical. Present the findings to the class or an authentic audience.
Instructional Strategies and Resources This section provides additional support and information for educators. These are strategies for actively engaging students with the topic and for providing hands-on, minds-on observation and exploration of the topic, including authentic data resources for scientific inquiry, experimentation and problem-based tasks that incorporate technology and technological and engineering design. Resources selected are printed or Web-based materials that directly relate to the particular Content Statement. It is not intended to be a prescriptive list of lessons.
• The Ohio Department of Natural Resources provides data regarding sustainable water
programs that are conducted in Ohio (monitoring programs, water quality testing information and contact information for the ODNR scientists that work in these areas) at http://ohiodnr.com/tabid/18951/Default.aspx.
• The U.S. Environmental Protection Agency offers a risk-assessment information system with
specific Ohio risk assessments that can be used to provide background data or specific case studies. This information helps illustrate the types of tests that are included in a risk assessment and also provides different risk levels for specific contaminants. Find it at http://rais.ornl.gov/.
• The Ohio EPA provides guidance for a full risk assessment, including all types of monitoring and data requirements, that can be used to provide an authentic learning experience for students. Parts of the requirements can be modified and simplified for high school students, including examples of the level of detail required to determine human risk and site evaluation. Find this information at http://www.epa.ohio.gov/portals/30/rules/RR-031.pdf.
• The Environmental Protection Agency provides helpful information about conducting risk assessments at http://www.epa.gov/risk/.
• For information about the use of fate and transport modeling in tracing the movement of
hazardous materials/contamination, including links to educational fate and transport programs and some freeware that may assist in demonstrations or small student investigations, visit http://ceenve3.civeng.calpoly.edu/cota/enve436/fate.html.
Back to the INDEX
Ohio Department of Education, March 2011 Page 35 of 94
• The U.S. Geological Survey provides a list of free software downloads that apply directly to modeling of surface and/or groundwater at http://water.usgs.gov/software/lists/general/.
• Science News and Science Daily offer information highlighting science in the news that can be
used for class discussions. The information is updated weekly or bi-weekly and provides references and resource sites for more in-depth discussion. Visit http://www.sciencenews.org/ and http://www.sciencedaily.com/.
• NOAA provides real-time data for many of its projects and research missions at http://www.noaa.gov/sciencemissions/bpoilspill.html.
• The College Board provides enduring understandings recommended for AP environmental
science that can help to form discussion questions and research at http://professionals.collegeboard.com/profdownload/cbscs-science-standards-2009.pdf. Appendix A (page 175) of this document contains the environmental science information.
• The Ohio Department of Natural Resources’ Project Wet offers training and resources for K-12 teachers that promote deep understanding about all aspects of water and the interconnectedness of all of Earth’s spheres (Earth systems). Training and workshop opportunities can be found at http://www.dnr.state.oh.us/tabid/3501/Default.aspx.
• Project Wet’s Healthy Water, Healthy People water quality educators guide offers ideas and
resources for teaching all aspects of water and water contamination issues. Ideas for field monitoring, research projects and student investigations as well as teacher training are available at http://www.projectwet.org/water-resources-education/water-quality-education/.
Common Misconceptions
• Students may have misinformation and misconceptions that pertain to climate change. To
address this, it is important to provide evidence of climate change throughout Earth’s history and current data to document temperature changes (surface and oceanic). Data and other resources to help with teaching climate change can be found at http://www.epa.gov/climatechange/index.html.
• Misconceptions regarding all aspects of environmental science must be addressed through scientific data analysis, investigation and research. Discussing the conclusions and findings through a professional “gallery walk” can be a very useful way to determine possible misconceptions that exist for the class and address them. Carleton College offers a gallery walk website at http://serc.carleton.edu/introgeo/gallerywalk/misconceptions.html.
Diverse Learners Strategies for meeting the needs of all learners including gifted students, English Language Learners (ELL) and students with disabilities can be found at this site. Resources based on the Universal Design for Learning principles are available at www.cast.org.
Classroom Portals Annenberg offers ideas about teaching high school level environmental science using an integrated Earth systems approach at http://www.learner.org/resources/series209.html.
Back to the INDEX

Ohio Department of Education, March 2011 Page 36 of 94
Physical Geology
Syllabus and Model Curriculum
Course Description Physical geology is a high school level course, which satisfies the Ohio Core science graduation requirements of Ohio Revised Code Section 3313.603. This section of Ohio law requires a three-unit course with inquiry-based laboratory experience that engages students in asking valid scientific questions and gathering and analyzing information.
Physical geology incorporates chemistry, physics and environmental science and introduces students to key concepts, principles and theories within geology.
Investigations are used to understand and explain the behavior of nature in a variety of inquiry and design scenarios that incorporate scientific reasoning, analysis, communication skills and real-world applications.
Science Inquiry and Application During the years of grades 9 through 12, all students must use the following scientific processes with appropriate laboratory safety techniques to construct their knowledge and understanding in all science content areas:
• Identify questions and concepts that guide scientific investigations;
• Design and conduct scientific investigations;
• Use technology and mathematics to improve investigations and communications;
• Formulate and revise explanations and models using logic and evidence (critical thinking);
• Recognize and analyze explanations and models; and
Communicate and support a scientific argument.
Course Content The following information may be taught in any order; there is no ODE-recommended sequence.
Minerals
• Atoms and elements
• Chemical bonding (ionic, covalent, metallic)
• Crystallinity (crystal structure)
• Criteria of a mineral (crystalline solid, occurs in nature, inorganic, defined chemical composition)
• Properties of minerals (hardness, luster, cleavage, streak, crystal shape. fluorescence, flammability, density/specific gravity, malleability)
Content Elaboration This unit builds upon the middle school Earth and Space Science strand (beginning in grade 6), where common minerals are tested, minerals are defined and minerals are classified. In addition, the chemistry sections of the physical science syllabus support both mineral properties and crystalline structures (chemical compositions and bonding).
The emphasis at the high school level is to relate the chemical and physical components of minerals to the properties of the minerals. This requires extensive mineral testing, investigations, experimentation, observation, use of technology and models/modeling. The focus must be learning the ways to research, test and evaluate minerals, not in memorization of mineral names or types.
Back to the INDEX

Ohio Department of Education, March 2011 Page 37 of 94
Properties such as cleavage and hardness must be connected to the chemical structure and bonding of the mineral. In addition, the environment in which minerals form should be part of the classification of the mineral, using mineral data to help interpret the environmental conditions that existed during the formation of the mineral.
Expectations for Learning: Cognitive Demands This section provides definitions for Ohio’s science cognitive demands, which are intrinsically related to current understandings and research about how people learn. They provide a structure for teachers and assessment developers to reflect on plans for teaching science, to monitor observable evidence of student learning and to develop summative assessment of student learning of science.
Visions into Practice This section provides examples of tasks that students may perform; this includes guidance for developing classroom performance tasks. It is not an all-inclusive checklist of what should be done, but is a springboard for generating innovative ideas.
• Use crystal or atomic models to illustrate the crystal structure of common minerals. Relate the
structure of the model to a specific quantifiable property (e.g., cleavage or hardness). Demonstrate and explain results to the class.
• Demonstrate (through specific testing, data collection, analysis and research) the relationship between mineral use, chemical formula, chemical bonds and the properties of the mineral. Document findings in writing.
• Research a specific mineral. Research questions should include: Where can the mineral be found (globally)? What environmental conditions must exist? How long does it take to form crystals? How is the mineral extracted? What is the mineral used for? What hazards, precautions, safety issues pertaining to the mineral or the extraction of the mineral exist? What is the economic value of the mineral? Are there any laws that may pertain to the mineral or the extraction of the mineral? Document the data in a scientific research paper or a poster session.
• Design and conduct an experiment to test specific properties of a mineral that has a unique
use (e.g., a quartz battery or gypsum wallboard). Document process and findings in a scientific lab report.
Instructional Strategies and Resources This section provides additional support and information for educators. These are strategies for actively engaging students with the topic and for providing hands-on, minds-on observation and exploration of the topic, including authentic data resources for scientific inquiry, experimentation and problem-based tasks that incorporate technology and technological and engineering design. Resources selected are printed or Web-based materials that directly relate to the particular Content Statement. It is not intended to be a prescriptive list of lessons.
• Geology.com provides information on current events in all topic areas of geology, including
resources and uses of resources, including minerals, at http://geology.com/.
• The U.S. Geological Survey provides mineral resources and information that can support the teaching of minerals at the high school and college level at http://minerals.usgs.gov/minerals/.
• The Mineralogical Society of America offers training, workshops, data and resources to support learning about minerals and geology. Find out more at http://www.minsocam.org/.
• The Digital Library for Earth Systems Education offers resources from a number of sources, such as National Geographic, government agencies and other scientific agencies. Grade 9-12 resources are provided at http://www.dlese.org/library/query.do?q=&s=0&gr=02.
• The College Board provides a document with Earth science recommendations for grades 6-12 (beginning on page 21). Essential questions and scientific applications are included in this document to encourage investigation and scientific inquiry. In addition, connections to other topics and subjects are suggested to add relevancy and interest for the student. Find it at http://professionals.collegeboard.com/profdownload/cbscs-science-standards-2009.pdf.
Back to the INDEX
Ohio Department of Education, March 2011 Page 38 of 94
Common Misconceptions
• Carleton College lists a number of geologic misconceptions for high school and college-age students at http://serc.carleton.edu/NAGTWorkshops/intro/misconception_list.html.
• NASA provides common misconceptions for all ages about the Earth and geology at http://www-istp.gsfc.nasa.gov/istp/outreach/sunearthmiscons.html.
• Misconceptions regarding all aspects of environmental science must be addressed through
scientific data analysis, investigation and research. Discussing the conclusions and findings through a professional “gallery walk” can be a very useful way to determine possible misconceptions that exist for the class and address them. Carleton College offers a gallery walk website at http://serc.carleton.edu/introgeo/gallerywalk/misconceptions.html.
Diverse Learners Strategies for meeting the needs of all learners including gifted students, English Language Learners (ELL) and students with disabilities can be found at this site. Resources based on the Universal Design for Learning principles are available at www.cast.org.
Classroom Portals Annenberg offers ideas about teaching high school level environmental science using an integrated Earth systems approach at http://www.learner.org/resources/series209.html.
Course Content The following information may be taught in any order; there is no ODE-recommended sequence.
Igneous, Metamorphic and Sedimentary Rocks
Igneous
• Mafic and felsic rocks and minerals
• Intrusive (igneous structures: dikes, sills, batholiths, pegmatites)
• Earth’s interior (inner core, outer core, lower mantle, upper mantle, Mohorovicic discontinuity, crust)
• Magnetic reversals and Earth’s magnetic field
• Thermal energy within the Earth
• Extrusive (volcanic activity, volcanoes: cinder cones, composite, shield)
• Bowen’s Reaction Series (continuous and discontinuous branches) Metamorphic
• Pressure, stress, temperature and compressional forces
• Foliated (regional), non-foliated (contact)
• Parent rock and degrees of metamorphism
• Metamorphic zones (where metamorphic rocks are found) Sedimentary
• The ocean
o Tides (daily, neap and spring) o Currents (deep and shallow, rip and longshore) o Thermal energy and water density o Waves o Ocean features (ridges, trenches, island systems, abyssal zone, shelves, slopes, reefs,
island arcs)
o Passive and active continental margins
• Division of sedimentary rocks and minerals (chemical, clastic/physical, organic)
• Depositional environments
• Streams (channels, streambeds, floodplains, cross-bedding, alluvial fans, deltas)
• Transgressing and regressing sea levels
Back to the INDEX
Ohio Department of Education, March 2011 Page 39 of 94
Content Elaboration This unit builds upon the middle school Earth and Space Science strand (beginning in grade 6). Sedimentary, igneous and metamorphic rocks are introduced, rocks and minerals are tested and classified, plate tectonics, seismic waves and the structure of Earth are studied, and the geologic record is found (including the evidence of climatic variances through Earth’s history). In the middle school Life Science strand, fossils and depositional environments are included as they relate to the documented history of life in the geologic record. In the physical science syllabus, support for waves, thermal energy, currents, pressure and gravity are presented.
At the high school level, geologic, topographic, seismic and aerial maps must be used to locate and recognize igneous, metamorphic and sedimentary structures and features. Technological advances permit the investigation of intrusive structures and the interior of Earth. Connections between the minerals present within each type of rock and the environment formed are important. The processes and environmental conditions that lead to fossil fuel formation (Note: this links to the energy resources section below) must include the fossil fuels found in Ohio, nationally and globally.
Bowen’s Reaction Series must be used to develop an understanding of the relationship of cooling temperature, formation of specific igneous minerals and the resulting igneous environment. The focus is on knowing how to use Bowen’s Reaction Series, not to memorize it. Virtual demonstrations and simulations of cooling magma and crystallization of the igneous minerals found on the series can be helpful in conceptualizing the chart.
The magnetic properties of Earth must be examined through the study of real data and evidence. The relationship of polar changes, magnetic stripping, grid north, true north and the north pole must be included in the study of Earth’s magnetic properties.
While the ocean is included within the sedimentary topic, it can be incorporated into other topics. Features found in the ocean must include all types of environments (igneous, metamorphic or sedimentary). Using models (3-D or virtual) with real-time data to simulate waves, tides, currents, feature formation and changing sea levels to explore and investigate the ocean fully is recommended. Interpreting sections of the geologic record to determine sea level changes and depositional environments, including relative age is also recommended.
Technological advances must be used to illustrate the physical features of the Earth, including the ocean floor. Interpreting geologic history using maps of local cross-sections of bedrock can be related to the geologic history of Ohio, the United States and the Earth.
Expectations for Learning: Cognitive Demands This section provides definitions for Ohio’s science cognitive demands, which are intrinsically related to current understandings and research about how people learn. They provide a structure for teachers and assessment developers to reflect on plans for teaching science, to monitor observable evidence of student learning and to develop summative assessment of student learning of science.
Visions into Practice This section provides examples of tasks that students may perform; this includes guidance for developing classroom performance tasks. It is not an all-inclusive checklist of what should be done, but is a springboard for generating innovative ideas.
• Use a geologic cross-section (or conduct a field investigation) for a specific location to
analyze/interpret geologic history (rock type, formation, fossils or minerals present) and environmental conditions (including volcanic activity and/or transgressing and regressing sea levels). Share findings (can be a model, presentation or graphic) with the class.
Back to the INDEX

Ohio Department of Education, March 2011 Page 40 of 94
• Identify specific geologic features using LANDSAT or other remote sensing data. Identify the factors required to create the specific features. Document findings graphically and in writing in a scientific journal, portfolio or e-portfolio.
• Create a map, model or lab investigation to illustrate a specific ocean current using real-time data. Relate the oceanic current to the Coriolis effect, density changes and physical features that exist. Present or demonstrate the product to the class. Defend and explain process and result.
• Design an investigation or experiment to demonstrate the magnetic reversals and the resulting magnetic striping that occurs at oceanic ridges. Document the process and result in writing, discuss or present to the class.
• Create a topographic, soil or geologic map of the school or community using actual data collected from the field (can use GPS/GIS readings, field studies/investigation, aerial maps or other available data to generate the map). Present final map in a poster session, with data used in the development of the map and the analysis of the data.
• Design and conduct a field study in a local area to locate fossil evidence that can help interpret
the geologic history of the area (when combined with other rock evidence). Document the fieldwork and steps of the investigation in a scientific journal. Share the analysis of the data and the interpretation of the geologic history with the class through a presentation, portfolio, e- portfolio or poster session.
Instructional Strategies and Resources This section provides additional support and information for educators. These are strategies for actively engaging students with the topic and for providing hands-on, minds-on observation and exploration of the topic, including authentic data resources for scientific inquiry, experimentation and problem-based tasks that incorporate technology and technological and engineering design. Resources selected are printed or Web-based materials that directly relate to the particular Content Statement. It is not intended to be a prescriptive list of lessons.
• The Digital Library for Earth Systems Education offers resources from a number of sources,
such as National Geographic, government agencies and other scientific agencies. Grade 9-12 resources are provided at http://www.dlese.org/library/query.do?q=&s=0&gr=02.
• The Ohio Department of Natural Resources’ Project Wet offers training and resources for K-12 teachers that promote deep understanding about all aspects of water and the interconnectedness of all of Earth’s spheres (Earth Systems). Training and workshop opportunities can be found at http://www.dnr.state.oh.us/tabid/3501/Default.aspx.
• The College Board provides a document with Earth Science recommendations for grades 6-12 (beginning on page 21). Essential questions and scientific applications are included in this document to encourage investigation and scientific inquiry. In addition, connections to other topics and subjects are suggested to add relevancy and interest for the student. Find it at http://professionals.collegeboard.com/profdownload/cbscs-science-standards-2009.pdf.
Common Misconceptions
• Carleton College lists a number of geologic misconceptions for high school and college-age students at http://serc.carleton.edu/NAGTWorkshops/intro/misconception_list.html.
• Misconceptions regarding all aspects of environmental science must be addressed through
scientific data analysis, investigation and research. Discussing the conclusions and findings through a professional “gallery walk” can be a very useful way to determine possible misconceptions that exist for the class and address them. Carleton College offers a gallery walk website at http://serc.carleton.edu/introgeo/gallerywalk/misconceptions.html.
• NASA provides common misconceptions for all ages about the Earth and geology at http://www-istp.gsfc.nasa.gov/istp/outreach/sunearthmiscons.html.
Back to the INDEX
Ohio Department of Education, March 2011 Page 41 of 94
Diverse Learners Strategies for meeting the needs of all learners including gifted students, English Language Learners (ELL) and students with disabilities can be found at this site. Resources based on the Universal Design for Learning principles are available at www.cast.org.
Classroom Portals Annenberg offers ideas about teaching high school level environmental science using an integrated Earth systems approach at http://www.learner.org/resources/series209.html.
Course Content The following information may be taught in any order; there is no ODE-recommended sequence.
Earth’s History
• The geologic rock record
o Relative and absolute age o Principles to determine relative age
Original horizontality Superposition Cross-cutting relationships
o Absolute age Radiometric dating (isotopes, radioactive decay) Correct uses of radiometric dating
o Combining relative and absolute age data o The geologic time scale
Comprehending geologic time Climate changes evident through the rock record Fossil record
Content Elaboration This unit builds upon the middle school Earth and Space Science strand (beginning in grade 6), sedimentary, igneous and metamorphic rocks are introduced, rocks and minerals are tested and classified, plate tectonics, seismic waves and the structure of Earth are studied, and the geologic record is found (including uniformitarianism, superposition, cross-cutting relationships and the evidence of climatic variances through Earth’s history). In the middle school Life Science strand, fossils and depositional environments are included as they relate to the documented history of life in the geologic record. In the physical science syllabus support for radiometric dating, seismic waves, thermal energy, pressure and gravity are presented.
At the high school level, the long-term history of Earth and the analysis of the evidence from the geologic record (including fossil evidence) must be investigated. Using actual sections of the geologic record to interpret, compare and analyze can demonstrate the changes that have occurred in Ohio, in North America and globally.
The emphasis for this unit is to explore the geologic record and the immensity of the geologic record. The analysis of data and evidence found in the variety of dating techniques (both absolute and relative), the complexity of the fossil record, and the impact that improving technology has had on the interpretation and continued updating of what is known about the history of Earth must be investigated. Geologic principles are essential in developing this level of knowledge. These principles must be tested and experienced through modeling, virtually, field studies, research and in-depth investigation.
Back to the INDEX
Ohio Department of Education, March 2011 Page 42 of 94
Expectations for Learning: Cognitive Demands This section provides definitions for Ohio’s science cognitive demands, which are intrinsically related to current understandings and research about how people learn. They provide a structure for teachers and assessment developers to reflect on plans for teaching science, to monitor observable evidence of student learning and to develop summative assessment of student learning of science.
Visions into Practice This section provides examples of tasks that students may perform; this includes guidance for developing classroom performance tasks. It is not an all-inclusive checklist of what should be done, but is a springboard for generating innovative ideas.
• Research a specific geologic time period. Document, using specific evidence and data, the
environmental conditions, climate organisms that existed (through fossil evidence), orogenies, continental placement, etc. Present findings orally or in writing.
• Investigate the geologic history beneath the school or community using field data, geologic research (published by scientists or through a government agency) and/or bedrock geology maps and reports. Represent findings in a scientific research paper that includes graphics and data analysis or a 3-D model (can be virtual).
• Create a chart or table (can be virtual) to document the pattern of climate change that has occurred throughout geologic time using evidence from the rock record. Use published scientific data (that can be verified and validated) to document periods of climate fluctuation. Evaluate patterns and cause and effect that may be evident in the research. Share the graphic with the class. Discuss and defend the analysis and interpretation.
• Calculate, given the half-life and relative amounts of original isotope and daughter product in a rock sample, the estimated age of the sample (College Board Standards, 2010).
Instructional Strategies and Resources This section provides additional support and information for educators. These are strategies for actively engaging students with the topic and for providing hands-on, minds-on observation and exploration of the topic, including authentic data resources for scientific inquiry, experimentation and problem-based tasks that incorporate technology and technological and engineering design. Resources selected are printed or Web-based materials that directly relate to the particular Content Statement. It is not intended to be a prescriptive list of lessons.
• The University of Maine offers a scientific case study of a specific glacier, including quantifiable
data that documents measurable changes each year, at http://climatechange.umaine.edu/Research/projects/byrdglacier.html.
• The OSU Byrd Polar Research site offers numerous educational resources that are related to glacial geology and climate change at http://bprc.osu.edu/.
• The College Board provides a document with Earth Science recommendations for grades 6-12 (beginning on page 21). Essential questions and scientific applications are included in this document to encourage investigation and scientific inquiry. In addition, connections to other topics and subjects are suggested to add relevancy and interest for the student. Find it at http://professionals.collegeboard.com/profdownload/cbscs-science-standards-2009.pdf.
Common Misconceptions
• Students may have misinformation and misconceptions that pertain to climate change. To
address this, it is important to provide evidence of climate change throughout Earth’s history and current data to document temperature changes (surface and oceanic). Data and other resources to help with teaching climate change can be found at http://www.epa.gov/climatechange/index.html.
Back to the INDEX

Ohio Department of Education, March 2011 Page 43 of 94
• Misconceptions regarding all aspects of environmental science must be addressed through scientific data analysis, investigation and research. Discussing the conclusions and findings through a professional “gallery walk” can be a very useful way to determine possible misconceptions that exist for the class and address them. Carleton College offers a gallery walk website at http://serc.carleton.edu/introgeo/gallerywalk/misconceptions.html.
• Carleton College lists a number of geologic misconceptions for high school and college-age students at http://serc.carleton.edu/NAGTWorkshops/intro/misconception_list.html.
• There are numerous misconceptions regarding Earth’s history. Providing scientific data and
research for students is essential in addressing them. Carleton College offers a number of strategies and resources that can be used to address Earth history misconceptions at http://serc.carleton.edu/introgeo/earthhistory/geotime.html.
• NASA provides common misconceptions for all ages about the Earth and geology at http://www-istp.gsfc.nasa.gov/istp/outreach/sunearthmiscons.html.
Diverse Learners Strategies for meeting the needs of all learners including gifted students, English Language Learners (ELL) and students with disabilities can be found at this site. Resources based on the Universal Design for Learning principles are available at www.cast.org.
Classroom Portals Annenberg offers ideas about teaching high school level environmental science using an integrated Earth systems approach at http://www.learner.org/resources/series209.html.
Course Content The following information may be taught in any order; there is no ODE-recommended sequence.
Plate Tectonics
• Internal Earth
o Seismic waves S and P waves Velocities, reflection, refraction of waves
o Structure of Earth (Note: specific layers were part of grade 8) Asthenosphere Lithosphere Mohorovicic boundary (Moho) Composition of each of the layers of Earth Gravity, magnetism and isostasy Thermal energy (geothermal gradient and heat flow)
• Historical review (Note: this would include a review of continental drift and sea-floor spreading found in grade 8) o Paleomagnetism and magnetic anomalies o Paleoclimatology
• Plate motion (Note: introduced in grade 8) o Causes and evidence of plate motion o Measuring plate motion o Characteristics of oceanic and continental plates o Relationship of plate movement and geologic events and features o Mantle plumes
Back to the INDEX

Ohio Department of Education, March 2011 Page 44 of 94
Content Elaboration This unit builds upon the middle school Earth and Space Science strand (beginning in grade 6). Sedimentary, igneous and metamorphic rocks are introduced, rocks and minerals are tested and classified, plate tectonics (including the history and evidence for plate tectonics), seismic waves and the interior structure of Earth and the geologic record are found. In the middle school Life Science strand, fossils and depositional environments are included. In the physical science syllabus, support for density, convection, conductivity, motion, kinetic energy, radiometric dating, seismic waves, thermal energy, pressure and gravity are presented.
At the high school level, Earth’s interior and plate tectonics must be investigated at greater depth using models, simulations, actual seismic data, real-time data, satellite data and remote sensing. Relationships between energy, tectonic activity levels and earthquake or volcano predictions, and calculations to obtain the magnitude, focus and epicenter of an earthquake must be included. Evidence and data analysis is the key in understanding this part of the Earth system. For example, GIS/GPS and/or satellite data provide data and evidence for moving plates and changing landscapes (due to tectonic activity).
The causes for plate motion, the evidence of moving plates and the results of plate tectonics must be related to Earth’s past, present and future. The use of evidence to support conclusions and predictions pertaining to plate motion is an important part of this unit.
Expectations for Learning: Cognitive Demands This section provides definitions for Ohio’s science cognitive demands, which are intrinsically related to current understandings and research about how people learn. They provide a structure for teachers and assessment developers to reflect on plans for teaching science, to monitor observable evidence of student learning and to develop summative assessment of student learning of science.
Visions into Practice This section provides examples of tasks that students may perform; this includes guidance for developing classroom performance tasks. It is not an all-inclusive checklist of what should be done, but is a springboard for generating innovative ideas.
• Research and investigate a specific area of ongoing plate movement. Create a presentation
(can be virtual) that uses graphics and/or a 3-D model to document the evidence of movement, rate of movement, prediction for future movement and hazards that may exist due to movement. Collect and analyze authentic scientific data for each part of the research/investigation. Data and data analysis must be included in the documentation.
• Investigate contemporary methods of evaluating risk from plate movement (including earthquake and volcanic eruptions). Analyze earthquake and volcano data to identify patterns that can lead to predictability. Document the research in a scientific journal, portfolio or e- portfolio.
• Collect real-time data to document tectonic activity in the United States. Highlight the areas of greatest activity and compare to Ohio activity. Determine ways to harness energy from these areas (research and document existing methods in these areas). Present or discuss findings to the class.
• Construct representations of Earth’s systems where convection currents occur, identifying areas of uneven heating and movement of matter (College Board Standards, 2010). Use remote sensing or real-time data to determine these zones. Document findings in a scientific report or journal.
Back to the INDEX
Ohio Department of Education, March 2011 Page 45 of 94
Instructional Strategies and Resources This section provides additional support and information for educators. These are strategies for actively engaging students with the topic and for providing hands-on, minds-on observation and exploration of the topic, including authentic data resources for scientific inquiry, experimentation and problem-based tasks that incorporate technology and technological and engineering design. Resources selected are printed or Web-based materials that directly relate to the particular Content Statement. It is not intended to be a prescriptive list of lessons.
• The Digital Library for Earth Systems Education offers resources from a number of sources,
such as National Geographic, government agencies and other scientific agencies. Grade 9-12 resources are provided at http://www.dlese.org/library/query.do?q=&s=0&gr=02.
• The College Board provides a document with Earth Science recommendations for grades 6-12 (beginning on page 21). Essential questions and scientific applications are included in this document to encourage investigation and scientific inquiry. In addition, connections to other topics and subjects are suggested to add relevancy and interest for the student. Find it at http://professionals.collegeboard.com/profdownload/cbscs-science-standards-2009.pdf.
Common Misconceptions
• Carleton College lists a number of geologic misconceptions for high school and college-age students at http://serc.carleton.edu/NAGTWorkshops/intro/misconception_list.html.
• Misconceptions regarding all aspects of environmental science must be addressed through
scientific data analysis, investigation and research. Discussing the conclusions and findings through a professional “gallery walk” can be a very useful way to determine possible misconceptions that exist for the class and address them. Carleton College offers a gallery walk website at http://serc.carleton.edu/introgeo/gallerywalk/misconceptions.html.
Diverse Learners Strategies for meeting the needs of all learners including gifted students, English Language Learners (ELL) and students with disabilities can be found at this site. Resources based on the Universal Design for Learning principles are available at www.cast.org.
• EarthComm offers a program that uses many different strategies to reach students of all
learning levels at http://www.agiweb.org/earthcomm/. The teaching of environmental science through relating the classroom to the real world is essential for many learners.
Classroom Portals Annenberg offers ideas about teaching high school level environmental science using an integrated Earth systems approach at http://www.learner.org/resources/series209.html.
Course Content The following information may be taught in any order; there is no ODE-recommended sequence.
Earth’s Resources
• Energy resources
o Renewable and nonrenewable energy sources and efficiency o Alternate energy sources and efficiency o Resource availability o Mining and resource extraction
• Air
o Primary and secondary contaminants o Greenhouse gases
Back to the INDEX

Ohio Department of Education, March 2011 Page 46 of 94
• Water
o Potable water and water quality o Hypoxia, eutrophication
• Soil and sediment
o Desertification o Mass wasting and erosion o Sediment contamination
Content Elaboration This unit builds on the Earth and Space Science content from elementary school, when renewable/nonrenewable energy, soils, the atmosphere and water are introduced, to grades 6-8 when Earth’ spheres, Earth’s resources and energy resources are found and then to biology and physical science (in particular water, air, chemistry and energy topics) syllabi at the high school level.
At the high school science level, renewable and nonrenewable energy resources topics investigate the effectiveness and efficiency for differing types of energy resources at a local, state, national and global level. Feasibility, availability and environmental cost are included in the extraction, storage, use and disposal of both abiotic and biotic resources. Modeling (3-D or virtual), simulations and real-world data must be used to investigate energy resources and exploration. The emphasis must be on current, actual data, contemporary science and technological advances in the field of energy resources.
Relating Earth’s resources (energy, air, water, soil) to a global scale and using technology to collect global resource data for comparative classroom study is recommended. In addition, it is important to connect industry and the scientific community to the classroom to increase the depth of understanding. Critical thinking and problem-solving skills are important in evaluating resource use and conservation.
Smaller scale investigations, such as a field study to monitor stream quality, construction mud issues, stormwater management, nonpoint source-contamination problems (e.g., road-salt runoff, agricultural runoff, parking lot runoff) or thermal water contamination can be useful in developing a deeper understanding of Earth’s resources.
Earth Systems must be used to illustrate the interconnectedness of each of Earth’s spheres (the hydrosphere, lithosphere, atmosphere and biosphere) and the relationship between each type of Earth’s resources.
Expectations for Learning: Cognitive Demands This section provides definitions for Ohio’s science cognitive demands, which are intrinsically related to current understandings and research about how people learn. They provide a structure for teachers and assessment developers to reflect on plans for teaching science, to monitor observable evidence of student learning and to develop summative assessment of student learning of science.
Visions into Practice This section provides examples of tasks that students may perform; this includes guidance for developing classroom performance tasks. It is not an all-inclusive checklist of what should be done, but is a springboard for generating innovative ideas.
• Design and build (virtual, blueprint or 3-D model) an Eco-House that uses green technology
and allows the house to be off-grid. Designate a specific location and research/evaluate the different options that would be efficient and effective for that area. Present the final product (with complete explanation and defense of choices/options) to the class.
Back to the INDEX
Ohio Department of Education, March 2011 Page 47 of 94
• Design an experiment to determine the amount and size of particulate matter in the air at the
school or community. Analyze the results using information from the Environmental Protection Agency and the Department of Health (e.g., lung diseases, including emphysema and asthma). Locate specific Ohio data for comparative analysis. Report class findings and recommendations orally or in written form to school administrators.
• Investigate local contamination issues. Research existing laws that apply, recommend ways to reduce or prevent contamination (based on scientific data and research), invite community speakers/professionals and collect samples (water, soil, air) to test. Document findings, determine a way to share findings with the community and present to an authentic audience.
• Research and collect specific data for a mass wasting or desertification event (can be present day or historical). Research questions should include: What factors led to the event? What was the result of the event (how was each of Earth’s spheres impacted)? What data is present (analyze data and draw conclusions)? What laws are related to the event? How can this be prevented in the future? Record the results graphically or in a scientific report.
Instructional Strategies and Resources This section provides additional support and information for educators. These are strategies for actively engaging students with the topic and for providing hands-on, minds-on observation and exploration of the topic, including authentic data resources for scientific inquiry, experimentation and problem-based tasks that incorporate technology and technological and engineering design. Resources selected are printed or Web-based materials that directly relate to the particular Content Statement. It is not intended to be a prescriptive list of lessons.
• The National Ground Water Association offers information, data and resources to support
teachers in teaching all aspects of ground water at http://www.ngwa.org/.
• NOAA provides real-time data for many of its projects and research missions at http://www.noaa.gov/sciencemissions/bpoilspill.html.
• Science News and Science Daily offer information highlighting science in the news that can be
used for class discussions. The information is updated weekly or bi-weekly and provides references and resource sites for more in-depth discussion. Visit http://www.sciencenews.org/ and http://www.sciencedaily.com/.
• Geology.com provides information on current events in all topic areas of geology, including resources and uses of resources, at http://geology.com/.
• NSTA provides learning modules called “SciPacks” that are designed to increase teacher content knowledge through inquiry-based modules. Find a module addressing Earth’s resources and humans at http://learningcenter.nsta.org/product_detail.aspx?id=10.2505/5/SG- 27.
• The Ohio Department of Natural Resources’ Project Wet offers training and resources for K-12 teachers that promote deep understanding about all aspects of water and the interconnectedness of all of Earth’s spheres (Earth Systems). Training and workshop opportunities can be found at http://www.dnr.state.oh.us/tabid/3501/Default.aspx.
• The College Board provides a document with Earth Science recommendations for grades 6-12 (beginning on page 21). Essential questions and scientific applications are included in this document to encourage investigation and scientific inquiry. In addition, connections to other topics and subjects are suggested to add relevancy and interest for the student. Find it at http://professionals.collegeboard.com/profdownload/cbscs-science-standards-2009.pdf.
• Project Wet’s Healthy Water, Healthy People water quality educators guide offers ideas and
resources for teaching all aspects of water and water contamination issues. Ideas for field monitoring, research projects and student investigations as well as teacher training are available at http://www.projectwet.org/water-resources-education/water-quality-education/.
Back to the INDEX
Ohio Department of Education, March 2011 Page 48 of 94
Common Misconceptions
• Common misconceptions dealing with renewable energy efficiency along with suggestions to
overcome these misconceptions through exploration and investigation are available on the website of California State University, Northridge, at http://www.csun.edu/~ml727939/coursework/690/Miha’s%20misconception%20report.doc.
• Carleton College lists a number of geologic misconceptions for high school and college-age students at http://serc.carleton.edu/NAGTWorkshops/intro/misconception_list.html.
• Misconceptions regarding all aspects of environmental science must be addressed through scientific data analysis, investigation and research. Discussing the conclusions and findings through a professional “gallery walk” can be a very useful way to determine possible misconceptions that exist for the class and address them. Carleton College offers a gallery walk website at http://serc.carleton.edu/introgeo/gallerywalk/misconceptions.html.
Diverse Learners Strategies for meeting the needs of all learners including gifted students, English Language Learners (ELL) and students with disabilities can be found at this site. Resources based on the Universal Design for Learning principles are available at www.cast.org.
Classroom Portals Annenberg offers ideas about teaching high school level environmental science using an integrated Earth systems approach at http://www.learner.org/resources/series209.html.
Course Content The following information may be taught in any order; there is no ODE-recommended sequence.
Glacial Geology
• Glaciers and glaciation
o Evidence of past glaciers (including features formed through erosion or deposition) o Glacial deposition and erosion (including features formed through erosion or deposition) o Data from ice cores
Historical changes (glacial ages, amounts, locations, particulate matter, correlation to fossil evidence)
Evidence of climate changes throughout Earth’s history
o Glacial distribution and causes of glaciation o Types of glaciers – continental (ice sheets, ice caps), alpine/valley (piedmont, valley,
cirque, ice caps)
o Glacial structure, formation and movement
Content Elaboration This unit builds upon the fourth-grade introduction of Earth’s surface (landforms and features, including glacial geology) and the middle school Earth and Space Science strand, with sedimentary, igneous and metamorphic rocks, sediment and soils, the geologic record and Earth’s history, the cryosphere and the relationship of the analysis of ice cores in understanding changes in climate over thousands of years. Fossils and fossil evidence within the geologic record is found in the Life Science strand, building from second grade through high school biology.
Tracing and tracking glacial history and present-day data for Ohio, the United States and globally is an emphasis for this unit. Scientific data found in the analysis of the geologic record, ice cores and surficial geology should be used to provide the evidence for changes that have occurred over the history of Earth and are observable in the present day. New discoveries, mapping projects, research, contemporary science and technological advances must be included in the study of glacial geology.
Back to the INDEX
Ohio Department of Education, March 2011 Page 49 of 94
Modeling and simulations (3-D or virtual) can be used to illustrate glacial movement and the resulting features. The focus should be on the geologic processes and the criteria for movement, not on memorizing the names of types of glaciers.
Field investigations to map and document evidence of glaciers in the local area (if applicable) or virtual investigations can help demonstrate the resulting glacial features and the impact that ice has had on the surface of Earth throughout history. Real-time data (using remote sensing, satellite, GPS/GIS, aerial photographs/maps) can help support this topic.
Expectations for Learning: Cognitive Demands This section provides definitions for Ohio’s science cognitive demands, which are intrinsically related to current understandings and research about how people learn. They provide a structure for teachers and assessment developers to reflect on plans for teaching science, to monitor observable evidence of student learning and to develop summative assessment of student learning of science.
Visions into Practice This section provides examples of tasks that students may perform; this includes guidance for developing classroom performance tasks. It is not an all-inclusive checklist of what should be done, but is a springboard for generating innovative ideas.
• Create a cross-section (virtual or drawn) or a 3-D model of a specific type of glacier and use
the model or graphic to explain how the glacier moves to the class. Explain and defend data and evidence in the demonstration.
• Take a field trip to an area of Ohio that has visible glacial features. (Check the Ohio Department of Natural Resources, state parks and/or metro parks that have access to view glacial features throughout the state.) Compare the area to maps or satellite data or visit a scientific center that studies glaciers or glacial formation (e.g., the Byrd Polar Research Center) to see glacial core data and learn about glaciers from experts (what kind of data is collected and how it is analyzed). Document observations in a scientific journal or paper (including graphics where appropriate).
• Research the glacial history of a specific location using data from the rock record, contemporary field data (research conducted and published by scientists) and/or glacial features that can be documented (maps, virtual/aerial documentation, remote sensing data). Relate the history to contemporary evidence of changing climate. Present or discuss findings with the class.
• Design and conduct a field study in a local or a specific area within Ohio to collect and/or map evidence of glacial activity (e.g., collection of glacial erratics, photographic evidence of striations from glacial movement or glacial features). Using specific data, share and defend findings with the class.
• Using aerial photographs, LANDSAT data, surficial geology maps or topographic maps, recognize and identify different types of glaciers and glacier features. Document the types of glaciers graphically and in writing in a scientific journal, portfolio or e-portfolio.
Back to the INDEX
Ohio Department of Education, March 2011 Page 50 of 94
Instructional Strategies and Resources This section provides additional support and information for educators. These are strategies for actively engaging students with the topic and for providing hands-on, minds-on observation and exploration of the topic, including authentic data resources for scientific inquiry, experimentation and problem-based tasks that incorporate technology and technological and engineering design. Resources selected are printed or Web-based materials that directly relate to the particular Content Statement. It is not intended to be a prescriptive list of lessons.
• The OSU Byrd Polar Research site offers numerous educational resources that are related to
glacial geology and climate change at http://bprc.osu.edu/.
• The College Board provides a document with Earth Science recommendations for grades 6-12
(beginning on page 21). Essential questions and scientific applications are included in this document to encourage investigation and scientific inquiry. In addition, connections to other topics and subjects are suggested to add relevancy and interest for the student. Find it at http://professionals.collegeboard.com/profdownload/cbscs-science-standards-2009.pdf.
• The Ohio Department of Natural Resources’ Project Wet offers training and resources for K-12 teachers that promote deep understanding about all aspects of water and the interconnectedness of all of Earth’s spheres (Earth Systems). Training and workshop opportunities can be found at http://www.dnr.state.oh.us/tabid/3501/Default.aspx.
Common Misconceptions
• Students may have misinformation and misconceptions that pertain to climate change. To
address this, it is important to provide evidence of climate change throughout Earth’s history and current data to document temperature changes (surface and oceanic). Data and other resources to help with teaching climate change can be found at http://www.epa.gov/climatechange/index.html.
• Carleton College lists a number of geologic misconceptions for high school and college-age students at http://serc.carleton.edu/NAGTWorkshops/intro/misconception_list.html.
• Misconceptions regarding all aspects of environmental science must be addressed through
scientific data analysis, investigation and research. Discussing the conclusions and findings through a professional “gallery walk” can be a very useful way to determine possible misconceptions that exist for the class and address them. Carleton College offers a gallery walk website at http://serc.carleton.edu/introgeo/gallerywalk/misconceptions.html.
Diverse Learners Strategies for meeting the needs of all learners including gifted students, English Language Learners (ELL) and students with disabilities can be found at this site. Resources based on the Universal Design for Learning principles are available at www.cast.org.
Classroom Portals Annenberg offers ideas about teaching high school level environmental science using an integrated Earth systems approach at http://www.learner.org/resources/series209.html.
Back to the INDEX

Ohio Department of Education, March 2011 Page 51 of 94
Physical Science
Syllabus and Model Curriculum
Course Description Physical science is a high school level course, which satisfies the Ohio Core science graduation requirements of Ohio Revised Code Section 3313.603. This section of Ohio law requires a three-unit course with inquiry-based laboratory experience that engages students in asking valid scientific questions and gathering and analyzing information.
Physical science introduces students to key concepts and theories that provide a foundation for further study in other sciences and advanced science disciplines. Physical science comprises the systematic study of the physical world as it relates to fundamental concepts about matter, energy and motion. A unified understanding of phenomena in physical, living, Earth and space systems is the culmination of all previously learned concepts related to chemistry, physics, and Earth and space science, along with historical perspective and mathematical reasoning.
Science Inquiry and Application During the years of grades 9 through 12, all students must use the following scientific processes with appropriate laboratory safety techniques to construct their knowledge and understanding in all science content areas:
• Identify questions and concepts that guide scientific investigations;
• Design and conduct scientific investigations;
• Use technology and mathematics to improve investigations and communications;
• Formulate and revise explanations and models using logic and evidence (critical thinking);
• Recognize and analyze explanations and models; and
• Communicate and support a scientific argument.
Course Content The following information may be taught in any order; there is no ODE-recommended sequence.
Study of Matter
• Classification of matter
o Heterogeneous vs. homogeneous o Properties of matter o States of matter and its changes
• Atoms
o Models of the atom (components) o Ions (cations and anions) o Isotopes
• Periodic trends of the elements
o Periodic law o Representative groups
• Bonding and compounds
o Bonding (ionic and covalent) o Nomenclature
• Reactions of matter
o Chemical reactions o Nuclear reactions
Back to the INDEX

Ohio Department of Education, March 2011 Page 52 of 94
Energy and Waves
• Conservation of energy
o Quantifying kinetic energy o Quantifying gravitational potential energy o Energy is relative
• Transfer and transformation of energy (including work)
• Waves
o Refraction, reflection, diffraction, absorption, superposition o Radiant energy and the electromagnetic spectrum o Doppler shift
• Thermal energy
• Electricity
o Movement of electrons o Current o Electric potential (voltage) o Resistors and transfer of energy
Forces and Motion
• Motion
o Introduction to one-dimensional vectors o Displacement, velocity (constant, average and instantaneous) and acceleration o Interpreting position vs. time and velocity vs. time graphs
• Forces o Force diagrams o Types of forces (gravity, friction, normal, tension) o Field model for forces at a distance
• Dynamics (how forces affect motion) o Objects at rest o Objects moving with constant velocity o Accelerating objects
The Universe
• History of the universe
• Galaxy formation
• Stars
o Formation; stages of evolution o Fusion in stars
Content Elaboration • Classification of Matter
Matter was introduced in the elementary grades and the learning progression continued through middle school to include differences in the physical properties of solids, liquids and gases, elements, compounds, mixtures, molecules, kinetic and potential energy and the particulate nature of matter. Content in the chemistry syllabus (e.g., electron configuration, molecular shapes, bond angles) will be developed from concepts in this course.
Matter can be classified in broad categories such as homogeneous and heterogeneous or classified according to its composition or by its chemical (reactivity) and physical properties (e.g., color solubility, odor, hardness, density, melting point and boiling point, viscosity and malleability).
Back to the INDEX
Ohio Department of Education, March 2011 Page 53 of 94
Solutions are homogenous mixtures of a solute dissolved in a solvent. The amount of a solid solute that can dissolve in a solvent generally increases as the temperature increases since the particles have more kinetic energy to overcome the attractive forces between them. Water is often used as a solvent since so many substances will dissolve in water. Physical properties can be used to separate the substances in mixtures, including solutions.
Phase changes can be represented by graphing the temperature of a sample vs. the time it has been heated. Investigations must include collecting data during heating, cooling and solid-liquid- solid phase changes. At times, the temperature will change steadily, indicating a change in the motion of the particles and the kinetic energy of the substance. However, during a phase change, the temperature of a substance does not change, indicating there is no change in kinetic energy. Since the substance continues to gain or lose energy during phase changes, these changes in energy are potential and indicate a change in the position of the particles. When heating a substance, a phase change will occur when the kinetic energy of the particles is great enough to overcome the attractive forces between the particles; the substance then melts or boils. Conversely, when cooling a substance, a phase change will occur when the kinetic energy of the particles is no longer great enough to overcome the attractive forces between the particles; the substance then condenses or freezes. Phase changes are examples of changes that can occur when energy is absorbed from the surroundings (endothermic) or released into the surroundings (exothermic).
When thermal energy is added to a solid, liquid or gas, most substances increase in volume because the increased kinetic energy of the particles causes an increased distance between the particles. This results in a change in density of the material. Generally, solids have greater density than liquids, which have greater density than gases due to the spacing between the particles. The density of a substance can be calculated from the slope of a mass vs. volume graph. Differences in densities can be determined by interpreting mass vs. volume graphs of the substances.
[Back to Physical Science Outline]
• Atoms
Content introduced in middle school, where the atom was introduced as a small, indestructible sphere, is further developed in the physical science syllabus. Over time, technology was introduced that allowed the atom to be studied in more detail. The atom is composed of protons, neutrons and electrons that have measurable properties, including mass and, in the case of protons and electrons, a characteristic charge. When bombarding thin gold foil with atomic-sized, positively charged, high-speed particles, a few of the particles were deflected slightly from their straight-line path. Even fewer bounced back toward the source. This evidence indicates that most of an atom is empty space with a very small positively charged nucleus. This experiment and other evidence indicate the nucleus is composed of protons and neutrons, and electrons that move about in the empty space that surrounds the nucleus. Additional experimental evidence that led to the development of other historic atomic models will be addressed in the chemistry syllabus.
All atoms of a particular element have the same atomic number; an element may have different isotopes with different mass numbers. Atoms may gain or lose electrons to become anions or cations. Atomic number, mass number, charge and identity of the element can be determined from the numbers of protons, neutrons and electrons. Each element has a unique atomic spectrum that can be observed and used to identify an element. Atomic mass and explanations about how atomic spectra are produced are addressed in the chemistry syllabus.
[Back to Physical Science Outline]
Back to the INDEX
Ohio Department of Education, March 2011 Page 54 of 94
• Periodic Trends of the Elements
Content from the middle school level, specifically the properties of metals and nonmetals and their positions on the periodic table, is further expanded in this course. When elements are listed in order of increasing atomic number, the same sequence of properties appears over and over again; this is the periodic law. The periodic table is arranged so that elements with similar chemical and physical properties are in the same group or family. Metalloids are elements that have some properties of metals and some properties of nonmetals. Metals, nonmetals, metalloids, periods and groups or families including the alkali metals, alkaline earth metals, halogens and noble gases can be identified by their position on the periodic table. Elements in Groups 1, 2 and 17 have characteristic ionic charges that will be used in this course to predict the formulas of compounds. Other trends in the periodic table (e.g., atomic radius, electronegativity, ionization energies) are found in the chemistry syllabus.
[Back to Physical Science Outline]
• Bonding and Compounds
Middle school content included compounds are composed of atoms of two or more elements joined together chemically. In this course, the chemical joining of atoms is studied in more detail. Atoms may be bonded together by losing, gaining or sharing electrons to form molecules or three- dimensional lattices. An ionic bond involves the attraction of two oppositely charged ions, typically a metal cation and a nonmetal anion formed by transferring electrons between the atoms. An ion attracts oppositely charged ions from every direction, resulting in the formation of a three- dimensional lattice. Covalent bonds result from the sharing of electrons between two atoms, usually nonmetals. Covalent bonding can result in the formation of structures ranging from small individual molecules to three-dimensional lattices (e.g., diamond). The bonds in most compounds fall on a continuum between the two extreme models of bonding: ionic and covalent.
Using the periodic table to determine ionic charge, formulas of ionic compounds containing elements from groups 1, 2, 17, hydrogen and oxygen can be predicted. Given a chemical formula, a compound can be named using conventional systems that include Greek prefixes where appropriate. Prefixes will be limited to represent values from one to 10. Given the name of an ionic or covalent substance, formulas can be written. Naming organic molecules is beyond this grade level and is reserved for an advanced chemistry course. Prediction of bond types from electronegativity values, polar covalent bonds, writing formulas and naming compounds that contain polyatomic ions or transition metals will be addressed in the chemistry syllabus.
[Back to Physical Science Outline]
• Reactions of Matter
In middle school, the law of conservation of matter was expanded to chemical reactions, noting that the number and type of atoms and the total mass are the same before and after the reaction. In this course, conservation of matter is expressed by writing balanced chemical equations. At this level, reactants and products can be identified from an equation and simple equations can be written and balanced given either the formulas of the reactants and products or a word description of the reaction. Stoichiometric relationships beyond the coefficients in a balanced equation and classification of types of chemical reactions are addressed in the chemistry syllabus.
Back to the INDEX
Ohio Department of Education, March 2011 Page 55 of 94
During chemical reactions, thermal energy is either transferred from the system to the surroundings (exothermic) or transferred from the surroundings to the system (endothermic). Since the environment surrounding the system can be large, temperature changes in the surroundings may not be detectable.
While chemical changes involve changes in the electrons, nuclear reactions involve changes to the nucleus and involve much larger energies than chemical reactions. The strong nuclear force is the attractive force that binds protons and neutrons together in the nucleus. While the nuclear force is extremely weak at most distances, over the very short distances present in the nucleus the force is greater than the repulsive electrical forces among protons. When the attractive nuclear forces and repulsive electrical forces in the nucleus are not balanced, the nucleus is unstable. Through radioactive decay, the unstable nucleus emits radiation in the form of very fast-moving particles and energy to produce a new nucleus, thus changing the identity of the element. Nuclei that undergo this process are said to be radioactive. Radioactive isotopes have several medical applications. The radiation they release can be used to kill undesired cells (e.g., cancer cells). Radioisotopes can be introduced into the body to show the flow of materials in biological processes.
For any radioisotope, the half-life is unique and constant. Graphs can be constructed that show the amount of a radioisotope that remains as a function of time and can be interpreted to determine the value of the half-life. Half-life values are used in radioactive dating.
Other examples of nuclear processes include nuclear fission and nuclear fusion. Nuclear fission involves splitting a large nucleus into smaller nuclei, releasing large quantities of energy. Nuclear fusion is the joining of smaller nuclei into a larger nucleus accompanied by the release of large quantities of energy. Nuclear fusion is the process responsible for formation of all the elements in the universe beyond helium and the energy of the sun and the stars.
Further details about nuclear processes including common types of nuclear radiation, predicting the products of nuclear decay, mass-energy equivalence and nuclear power applications are addressed in the chemistry and physics syllabi.
[Back to Physical Science Outline]
Expectations for Learning: Cognitive Demands This section provides definitions for Ohio’s science cognitive demands, which are intrinsically related to current understandings and research about how people learn. They provide a structure for teachers and assessment developers to reflect on plans for teaching science, to monitor observable evidence of student learning and to develop summative assessment of student learning of science.
Visions into Practice This section provides examples of tasks that students may perform; this includes guidance for developing classroom performance tasks. It is not an all-inclusive checklist of what should be done, but is a springboard for generating innovative ideas.
• Visually compare the inside structure of various balls (tennis ball, golf ball, baseball,
basketball/kickball and soccer ball). Determine what makes the ball bounce the highest (and/or travel farthest), compare, analyze the data, draw conclusions and present findings in multiple formats.
Back to the INDEX
Ohio Department of Education, March 2011 Page 56 of 94
• Explore the benefits of radiation and how it can be used as a tool to sustain life (sterilization and food irradiation processes, nuclear medicine). Include details about how the radiation works to accomplish the benefit and the extent (limit or range) that the benefit will continue as opposed to becoming a harm to life (plants, animals or human beings) on Earth. Draw conclusions and present an argument based on supporting data as to when radiation poses a threat as opposed to being beneficial. Present findings in multiple formats.
Instructional Strategies and Resources This section provides additional support and information for educators. These are strategies for actively engaging students with the topic and for providing hands-on, minds-on observation and exploration of the topic, including authentic data resources for scientific inquiry, experimentation and problem-based tasks that incorporate technology and technological and engineering design. Resources selected are printed or Web-based materials that directly relate to the particular Content Statement. It is not intended to be a prescriptive list of lessons.
• The Rutherford experiment is a simulation that shows high-speed particles bombarding a thin
foil. While the simulation is not to scale, it does provide a dynamic visual to help students understand what is happening at the atomic level that explains the experimental evidence.
Common Misconceptions
• Students may think that models are physical copies of the real thing, failing to recognize models as conceptual representations. (AAAS, 1993)
• Students know models can be changed, but at the high school level, they may be limited by thinking that a change in a model means adding new information or that changing a model means replacing a part that was wrong. (AAAS, 1993)
• Students often do not believe models can duplicate reality. (AAAS, 1993)
• Students often think that breaking bonds releases energy. (Ross, 1993)
• When multiple models are presented, they tend to think there is one “right one”. (AAAS, 1993)
Diverse Learners Strategies for meeting the needs of all learners including gifted students, English Language Learners (ELL) and students with disabilities can be found at this site. Resources based on the Universal Design for Learning principles are available at www.cast.org.
Classroom Portals “Teaching High School Science” is a series of videos-on-demand produced by Annenberg that show classroom strategies for implementing inquiry into the high school classroom. While not all of the content is aligned to physical science, the strategies can be applied to any content.
Course Content The following information may be taught in any order; there is no ODE-recommended sequence.
Energy and Waves
• Conservation of energy
o Quantifying kinetic energy o Quantifying gravitational potential energy o Energy is relative
• Transfer and transformation of energy (including work)
• Waves
o Refraction, reflection, diffraction, absorption, superposition o Radiant energy and the electromagnetic spectrum o Doppler shift
Back to the INDEX
Ohio Department of Education, March 2011 Page 57 of 94
k g
• Thermal energy
• Electricity
o Movement of electrons o Current o Electric potential (voltage) o Resistors and transfer of energy
Content Elaboration Energy and Waves Building upon knowledge gained in elementary and middle school, major concepts about energy and waves are further developed. Conceptual knowledge will move from qualitative understandings of energy and waves to ones that are more quantitative using mathematical formulas, manipulations and graphical representations.
• Conservation of Energy
Energy content learned in middle school, specifically conservation of energy and the basic differences between kinetic and potential energy, is elaborated on and quantified in this course. Energy has no direction and has units of Joules (J). Kinetic energy, Ek, can be mathematically represented by E = ½mv
2. Gravitational potential energy, E , can be mathematically represented
by Eg = mgh,. The amount of energy of an object is measured relative to a reference that is
considered to be at a point of zero energy. The reference may be changed to help understand different situations. Only the change in the amount of energy can be measured absolutely. The conservation of energy and equations for kinetic and gravitational potential energy can be used to calculate values associated with energy (i.e., height, mass, speed) for situations involving energy transfer and transformation. Opportunities to quantify energy from data collected in experimental situations (e.g., a swinging pendulum, a car travelling down an incline) must be provided.
[Back to Energy and Waves Outline] [Back to Physical Science Outline]
• Transfer and Transformation of Energy
In middle school, concepts of energy transfer and transformation were addressed, including conservation of energy, conduction, convection and radiation, the transformation of electrical energy, and the dissipation of energy into thermal energy. Work also was introduced as a method of energy transfer into or out of the system when an outside force moves an object over a distance. In this course, these concepts are further developed. As long as the force, F, and displacement, Δx, are in the same direction, work, W, can be calculated from the equation W = FΔx. Energy transformations for a phenomenon can be represented through a series of pie graphs or bar graphs. Equations for work, kinetic energy and potential energy can be combined with the law of conservation of energy to solve problems. When energy is transferred from one system to another, some of the energy is transformed to thermal energy. Since thermal energy involves the random movement of many trillions of subatomic particles, it is less able to be organized to bring about further change. Therefore, even though the total amount of energy remains constant, less energy is available for doing useful work.
[Back to Energy and Waves Outline] [Back to Physical Science Outline]
• Waves
As addressed in middle school, waves transmit energy from one place to another, can transfer energy between objects and can be described by their speed, wavelength, frequency and amplitude. The relationship between speed, wavelength and frequency also was addressed in middle school Earth and Space Science as the motion of seismic waves through different materials is studied.
Back to the INDEX
Ohio Department of Education, March 2011 Page 58 of 94
In elementary and middle school, reflection and refraction of light were introduced, as was absorption of radiant energy by transformation into thermal energy. In this course, these processes are addressed from the perspective of waves and expanded to include other types of energy that travel in waves. When a wave encounters a new material, the new material may absorb the energy of the wave by transforming it to another form of energy, usually thermal energy. Waves can be reflected off solid barriers or refracted when a wave travels form one medium into another medium. Waves may undergo diffraction around small obstacles or openings. When two waves traveling through the same medium meet, they pass through each other then continue traveling through the medium as before. When the waves meet, they undergo superposition, demonstrating constructive and destructive interference. Sound travels in waves and undergoes reflection, refraction, interference and diffraction. In the physics syllabus, many of these wave phenomena will be studied further and quantified.
Radiant energy travels in waves and does not require a medium. Sources of light energy (e.g., the sun, a light bulb) radiate energy continually in all directions. Radiant energy has a wide range of frequencies, wavelengths and energies arranged into the electromagnetic spectrum. The electromagnetic spectrum is divided into bands: radio (lowest energy), microwaves, infrared, visible light, X-rays and gamma rays (highest energy) that have different applications in everyday life. Radiant energy of the entire electromagnetic spectrum travels at the same speed in a vacuum. Specific frequency, energy or wavelength ranges of the electromagnetic spectrum are not required. However, the relative positions of the different bands, including the colors of visible light, are important (e.g., ultraviolet has more energy than microwaves). Radiant energy exhibits wave behaviors including reflection, refraction, absorption, superposition and diffraction, depending in part on the nature of the medium. For opaque objects (e.g., paper, a chair, an apple), little if any radiant energy is transmitted into the new material. However the radiant energy can be absorbed, usually increasing the thermal energy of the object and/or the radiant energy can be reflected. For rough objects, the reflection in all directions forms a diffuse reflection and for smooth shiny objects, reflections can result in clear images. Transparent materials transmit most of the energy through the material but smaller amounts of energy may be absorbed or reflected.
Changes in the observed frequency and wavelength of a wave can occur if the wave source and the observer are moving relative to each other. When the source and the observer are moving toward each other, the wavelength is shorter and the observed frequency is higher; when the source and the observer are moving away from each other, the wavelength is longer and the observed frequency is lower. This phenomenon is called the Doppler shift and can be explained using diagrams. This phenomenon is important to current understanding of how the universe was formed and will be applied in later sections of this course. Calculations to measure the apparent change in frequency or wavelength are not appropriate for this course.
[Back to Energy and Waves Outline] [Back to Physical Science Outline]
• Thermal Energy
In middle school, thermal energy is introduced as the energy of movement of the particles that make up matter. Processes of heat transfer, including conduction, convection and radiation, are studied. In other sections of this course, the role of thermal energy during heating, cooling and phase changes is explored conceptually and graphically. In this course, rates of thermal energy transfer and thermal equilibrium are introduced.
Back to the INDEX
Ohio Department of Education, March 2011 Page 59 of 94
Thermal conductivity depends on the rate at which thermal energy is transferred from one end of a material to another. Thermal conductors have a high rate of thermal energy transfer and thermal insulators have a slow rate of thermal energy transfer. The rate at which thermal radiation is absorbed or emitted by a system depends on its temperature, color, texture and exposed surface area. All other things being equal, in a given amount of time, black rough surfaces absorb more thermal energy than smooth white surfaces. An object or system is continually absorbing and emitting thermal radiation. If the object or system absorbs more thermal energy than it emits and there is no change in phase, the temperature increases. If the object or system emits more thermal energy than is absorbed and there is no change in phase, the temperature decreases. For an object or system in thermal equilibrium, the amount of thermal energy absorbed is equal to the amount of thermal energy emitted; therefore, the temperature remains constant. In chemistry, changes in thermal energy are quantified for substances that change their temperature.
[Back to Energy and Waves Outline] [Back to Physical Science Outline]
• Electricity
In earlier grades, these concepts were introduced: electrical conductors and insulators; and a complete loop is needed for an electrical circuit that may be parallel or in a series. In this course, circuits are explained by the flow of electrons, and current, voltage and resistance are introduced conceptually to explain what was observed in middle school. The differences between electrical conductors and insulators can be explained by how freely the electrons flow throughout the material due to how firmly electrons are held by the nucleus.
By convention, electric current is the rate at which positive charge flows in a circuit. In reality, it is the negatively charged electrons that are actually moving. Current is measured in amperes (A), which is equal to one coulomb of charge per second (C/s). In an electric circuit, the power source supplies the electrons already in the circuit with electric potential energy by doing work to separate opposite charges. For a battery, the energy is provided by a chemical reaction that separates charges on the positive and negative sides of the battery. This separation of charge is what causes the electrons to flow in the circuit. These electrons then transfer energy to other objects and transform electrical energy into other forms (e.g., light, sound, heat) in the resistors. Current continues to flow, even after the electrons transfer their energy. Resistors oppose the rate of charge flow in the circuit. The potential difference or voltage across an energy source is a measure of potential energy in Joules supplied to each coulomb of charge. The volt (V) is the unit of potential difference and is equal to one Joule of energy per coulomb of charge (J/C). Potential difference across the circuit is a property of the energy source and does not depend upon the devices in the circuit. These concepts can be used to explain why current will increase as the potential difference increases and as the resistance decreases. Experiments, investigations and testing (3-D or virtual) must be used to construct a variety of circuits, and measure and compare the potential difference (voltage) and current. Electricity concepts are dealt with conceptually in this course. Calculations with circuits will be addressed in the physics syllabus.
[Back to Energy and Waves Outline] [Back to Physical Science Outline]
Expectations for Learning: Cognitive Demands This section provides definitions for Ohio’s science cognitive demands, which are intrinsically related to current understandings and research about how people learn. They provide a structure for teachers and assessment developers to reflect on plans for teaching science, to monitor observable evidence of student learning and to develop summative assessment of student learning of science.
Back to the INDEX

Ohio Department of Education, March 2011 Page 60 of 94
Visions into Practice This section provides examples of tasks that students may perform; this includes guidance for developing classroom performance tasks. It is not an all-inclusive checklist of what should be done, but is a springboard for generating innovative ideas.
• Design, build and test a ramp system onto which a ball can be placed so that it rolls down a
ramp and continues a specific distance on the table. Describe what properties of the system were important (and those not important) in the design. Provide different target distances for the launched ball to travel on the designed course and hit a given target within three trials.
• Investigate the relationship between speed, frequency and wavelength for a transverse wave
traveling through a Slinky®. Make claims about what happens to the speed and the wavelength
of the wave as the frequency is increased and give evidence to support any claims. For example, use information from the investigation to explore the implications of cell phone usage. Include beneficial and harmful aspects of the use of this technology for a modern convenience. Present findings and draw a conclusion using data and research in multiple formats.
Instructional Strategies and Resources This section provides additional support and information for educators. These are strategies for actively engaging students with the topic and for providing hands-on, minds-on observation and exploration of the topic, including authentic data resources for scientific inquiry, experimentation and problem-based tasks that incorporate technology and technological and engineering design. Resources selected are printed or Web-based materials that directly relate to the particular Content Statement. It is not intended to be a prescriptive list of lessons.
• “Energy: Misconceptions and Models” is a downloadable document from the U.K. Department
for Education that gives strategies for teaching different models of energy and addressing misconceptions about energy.
• “Waves, Light, and Sound” from The Physics Zone links to many animations of waves that can
be used with absent students or students who need more reinforcement. Simulations also may be good to slow down some of the phenomena that students observe in class so they can make observations that are more detailed. Some of the simulations can only be accessed by members, but many of the simulations have unrestricted access.
• Modeling workshops are available nationally that help teachers develop a framework for using guided inquiry in their instruction.
Common Misconceptions Students often think that:
• Potential energy is a thing that objects hold (like cereal stored in a closet).
• The only type of potential energy is gravitational.
• Doubling the velocity of a moving object will double its kinetic energy.
• Stored energy is something that causes energy later; it is not energy until it has been released.
• Objects do not have any energy if they are not moving.
• Energy is a thing that can be created and destroyed.
• Energy is literally lost in many energy transformations.
• Gravitational potential energy depends only upon the height of an object.
• Energy can be changed completely from one form to another with no loss of useful energy.
Diverse Learners Strategies for meeting the needs of all learners including gifted students, English Language Learners (ELL) and students with disabilities can be found at this site. Resources based on the Universal Design for Learning principles are available at www.cast.org.
Back to the INDEX
Ohio Department of Education, March 2011 Page 61 of 94
Classroom Portals “Teaching High School Science” is a series of videos-on-demand produced by Annenberg that show classroom strategies for implementing inquiry into the high school classroom. While not all of the content is aligned to physical science, the strategies can be applied to any content.
Course Content The following information may be taught in any order; there is no ODE-recommended sequence.
Forces and Motion
• Motion
o Introduction to one-dimensional vectors o Displacement, velocity (constant, average and instantaneous) and acceleration o Interpreting position vs. time and velocity vs. time graphs
• Forces
o Force diagrams o Types of forces (gravity, friction, normal, tension) o Field model for forces at a distance
• Dynamics (how forces affect motion)
o Objects at rest o Objects moving with constant velocity o Accelerating objects
Content Elaboration Forces and Motion
Building upon content in elementary and middle school, major concepts of motion and forces are further developed. In middle school, speed has been dealt with conceptually, mathematically and graphically. The concept that forces have both magnitude and direction can be represented with a force diagram, that forces can be added to find a net force and that forces may affect motion has been addressed in middle school. At the high school level, mathematics (including graphing) is used when describing these phenomena, moving from qualitative understanding to one that is more quantitative. For the physical science course, all motion is limited to objects moving in a straight line either horizontally, vertically, up an incline or down an incline, that can be characterized in a single step (e.g., at rest, constant velocity, constant acceleration). Motions of two objects may be compared or addressed simultaneously (e.g., when or where would they meet).
• Motion
The motion of an object depends on the observer’s frame of reference and is described in terms of distance, position, displacement, speed, velocity, acceleration and time. Position, displacement, velocity and acceleration are all vector properties (magnitude and direction). All motion is relative to whatever frame of reference is chosen, for there is no motionless frame from which to judge all motion. The relative nature of motion will be addressed conceptually, not mathematically. Non- inertial reference frames are excluded. Motion diagrams can be drawn and interpreted to represent the position and velocity of an object. Showing the acceleration on motion diagrams will be reserved for physics.
The displacement or change in position of an object is a vector quantity that can be calculated by subtracting the initial position from the final position (Δx = xf – xi). Displacement can be positive or
negative depending upon the direction of motion. Displacement is not always equal to the distance travelled. Examples should be given where the distance is not the same as the displacement.
Back to the INDEX

Ohio Department of Education, March 2011 Page 62 of 94
Velocity is a vector property that represents the rate at which position changes. Average velocity can be calculated by dividing displacement (change in position) by the elapsed time (vavg = (xf –
xi)/(tf – ti)). Velocity may be positive or negative depending upon the direction of motion and is not
always equal to the speed. Provide examples of when the average speed is not the same as the average velocity. Objects that move with constant velocity have the same displacement for each successive time interval. While speeding up or slowing down and/or changing direction, the velocity of an object changes continuously, from instant to instant. The speed of an object at any instant (clock reading) is called instantaneous speed. An object may not travel at this instantaneous speed for any period of time or cover any distance with that particular speed, especially if the speed is continually changing.
Acceleration is a vector property that represents the rate at which velocity changes. Average acceleration can be calculated by dividing the change in velocity divided by elapsed time (aavg = (vf
– vi)/(tf – ti)). At this grade level, it should be noted that acceleration can be positive or negative,
but specifics about what kind of motions produce positive or negative accelerations will be addressed in the physics syllabus. The word “deceleration” should not be used because students tend to associate a negative sign of acceleration only with slowing down. Objects that have no acceleration can either be standing still or be moving with constant velocity (speed and direction). Constant acceleration occurs when the change in an object’s instantaneous velocity is the same for equal successive time intervals.
Motion can be represented by position vs. time and velocity vs. time graphs. Specifics about the speed, direction and change in motion can be determined by interpreting such graphs. For physical science, graphs will be limited to positive x-values and show only uniform motion involving constant velocity or constant acceleration. Motion must be investigated by collecting and analyzing data in the laboratory. Technology can enhance motion exploration and investigation through video analysis, the use of motion detectors and graphing data for analysis.
Objects that move with constant velocity and have no acceleration form a straight line (not necessarily horizontal) on a position vs. time graph. Objects that are at rest will form a straight horizontal line on a position vs. time graph. Objects that are accelerating will show a curved line on a position vs. time graph. Velocity can be calculated by determining the slope of a position vs. time graph. Positive slopes on position vs. time graphs indicate motion in a positive direction. Negative slopes on position vs. time graphs indicate motion in a negative direction. While it is important that students can construct graphs by hand, computer graphing programs or graphing calculators also can be used so more time can be spent on graph interpretation and analysis.
Constant acceleration is represented by a straight line (not necessarily horizontal) on a velocity vs. time graph. Objects that have no acceleration (at rest or moving at constant velocity) will have a straight horizontal line for a velocity vs. time graph. Average acceleration can be by determining the slope of a velocity vs. time graph. The details about motion graphs should not be taught as rules to memorize, but rather as generalizations that can be developed from interpreting the graphs.
[Back to Forces and Motion Outline] [Back to Physical Science Outline]
Back to the INDEX

Ohio Department of Education, March 2011 Page 63 of 94
• Forces Force is a vector quantity, having both magnitude and direction. The (SI) unit of force is a Newton.
One Newton of net force will cause a 1 kg object to experience an acceleration of 1 m/s2. A Newton
also can be represented as kg·m/s2. The opportunity to measure force in the lab must be provided
(e.g., with a spring scale or a force probe). Normal forces and tension forces are introduced conceptually at this level. These forces and other forces are introduced in prior grades (friction, drag, contact, gravitational, electric and magnetic) and can be used as examples of forces that affect motion. Gravitational force (weight) can be calculated from mass, but all other forces will only be quantified from force diagrams that were introduced in middle school. In physical science, only forces in one dimension (positive and negative) will be addressed. The net force can be determined by one-dimensional vector addition. More quantitative study of friction forces, universal gravitational forces, elastic forces and electrical forces will be addressed in the physics syllabus.
Friction is a force that opposes sliding between two surfaces. For surfaces that are sliding relative to each other, the force on an object always points in a direction opposite to the relative motion of the object. In physical science, friction will only be calculated from force diagrams. Equations for static and kinetic friction are found in the physics syllabus.
A normal force exists between two solid objects when their surfaces are pressed together due to other forces acting on one or both objects (e.g., a solid sitting on or sliding across a table, a magnet attached to a refrigerator). A normal force is always a push directed at right angles from the surfaces of the interacting objects. A tension force occurs when a non-slack rope, wire, cord or similar device pulls on another object. The tension force always points in the direction of the pull.
In middle school, the concept of a field as a region of space that surrounds objects with the appropriate property (mass for gravitational fields, charge for electric fields, a magnetic object for magnetic fields) was introduced to explain gravitational, magnetic and electrical forces that occur over a distance. The field concept is further developed in physical science. The stronger the field, the greater the force exerted on objects placed in the field. The field of an object is always there, even if the object is not interacting with anything else. The gravitational force (weight) of an object is proportional to its mass. Weight, Fg, can be calculated from the equation Fg = m g, where g is the gravitational field strength of an object which is equal to 9.8 N/kg (m/s
2) on the surface of Earth.
[Back to Forces and Motion Outline] [Back to Physical Science Outline]
• Dynamics
An object does not accelerate (remains at rest or maintains a constant speed and direction of motion) unless an unbalanced net force acts on it. The rate at which an object changes its speed or direction (acceleration) is proportional to the vector sum of the applied forces (net force, Fnet)
and inversely proportional to the mass (a = Fnet/m). When the vector sum of the forces (net force)
acting on an object is zero, the object does not accelerate. For an object that is moving, this means the object will remain moving without changing its speed or direction. For an object that is not moving, the object will continue to remain stationary. These laws will be applied to systems consisting of a single object upon which multiple forces act. Vector addition will be limited to one dimension. While both horizontal and vertical forces can be acting on an object simultaneously,
one of the dimensions must have a net force of zero.
Back to the INDEX
Ohio Department of Education, March 2011 Page 64 of 94
A force is an interaction between two objects. Both objects in the interaction experience an equal amount of force, but in opposite directions. Interacting force pairs are often confused with balanced forces. Interacting force pairs can never cancel each other out because they always act on different objects. Naming the force (e.g., gravity, friction) does not identify the two objects involved in the interacting force pair. Objects involved in an interacting force pair can be easily identified by using the format “A acts on B so B acts on A.” For example, the truck hits the sign therefore the sign hits the truck with an equal force in the opposite direction. Earth pulls the book down so the book pulls Earth up with an equal force. The focus of the content is to develop a conceptual understanding of the laws of motion to explain and predict changes in motion, not to name or recite a memorized definition. In the physics syllabus, all laws will be applied to systems of many objects.
[Back to Forces and Motion Outline] [Back to Physical Science Outline]
Expectations for Learning: Cognitive Demands This section provides definitions for Ohio’s science cognitive demands, which are intrinsically related to current understandings and research about how people learn. They provide a structure for teachers and assessment developers to reflect on plans for teaching science, to monitor observable evidence of student learning and to develop summative assessment of student learning of science.
Visions into Practice This section provides examples of tasks that students may perform; this includes guidance for developing classroom performance tasks. It is not an all-inclusive checklist of what should be done, but is a springboard for generating innovative ideas.
• Research the ranges of human reaction time and braking accelerations. Design a traffic light
pattern (e.g., how long the light should stay yellow) for a particular intersection, given the speed limits. Present the design and rationale to the class. Compare the results for different speed limits. Explain any patterns and trends observed.
• Investigate the relationship between position and time for a cart that rolls down a ramp from rest. Graph the results. Make a claim about how position and time are related and use evidence to support the claim. Present the findings to the class. Based on the presentations of other investigations, propose sources of error and provide suggestions for how the experiments can be improved.
Instructional Strategies and Resources This section provides additional support and information for educators. These are strategies for actively engaging students with the topic and for providing hands-on, minds-on observation and exploration of the topic, including authentic data resources for scientific inquiry, experimentation and problem-based tasks that incorporate technology and technological and engineering design. Resources selected are printed or Web-based materials that directly relate to the particular Content Statement. It is not intended to be a prescriptive list of lessons.
• “Forces in 1 Dimension” is an interactive simulation that allows students to explore the forces
at work when trying to push a filing cabinet. An applied force is created and the resulting friction force and total force acting on the cabinet are then shown. Forces vs. time, position vs. time, velocity vs. time, and acceleration vs. time graphs can be shown as can force diagrams representing all the forces (including gravitational and normal forces).
• “Motion Diagrams” is a tutorial from Western Kentucky University that shows how to draw motion diagrams for a variety of motions. It includes an animated physlet. Motion diagrams in physical science will only show position and velocity and will not show acceleration.
Back to the INDEX
Ohio Department of Education, March 2011 Page 65 of 94
• The Physics Classroom supports this tutorial on one-dimensional motion that gives a thorough explanation of acceleration, including an animation to use with students who may still be having difficulties with acceleration.
• Modeling workshops are available nationally that help teachers develop a framework for incorporating guided inquiry in their instruction.
Common Misconceptions It is often thought that the exertion of a force requires a conscious decision by a thinking entity. Using the common terms “action” and “reaction” when designating forces from the perspective of Newton’s third law can reinforce this misconception. Using the descriptor “interacting force pair” does not perpetuate this misconception and honors the fact that the two forces are mutually important.
Students often think that:
• If the speed is constant, then there is no acceleration.
• High velocities coincide with large accelerations and low velocities coincide with small accelerations.
Diverse Learners Strategies for meeting the needs of all learners including gifted students, English Language Learners (ELL) and students with disabilities can be found at this site. Resources based on the Universal Design for Learning principles are available at www.cast.org.
Classroom Portals “Teaching High School Science” is a series of videos-on-demand produced by Annenberg that show classroom strategies for implementing inquiry into the high school classroom. While not all of the content is aligned to physical science, the strategies can be applied to any content.
Course Content The following information may be taught in any order; there is no ODE-recommended sequence.
The Universe
• History of the universe
• Galaxy formation
• Stars
o Formation, stages of evolution o Fusion in stars
Content Elaboration The Universe
In early elementary school, observations of the sky and space are the foundation for developing a deeper knowledge of the solar system. In late elementary school, the parts of the solar system are introduced, including characteristics of the sun and planets, orbits and celestial bodies. At the middle school level, energy, waves, gravity and density are emphasized in the physical sciences, and characteristics and patterns within the solar system are found.
In the physical science course, the universe and galaxies are introduced, building upon the previous knowledge about space and the solar system in the earlier grades.
Back to the INDEX
Ohio Department of Education, March 2011 Page 66 of 94
• History of the Universe The Big Bang Model is a broadly accepted theory for the origin and evolution of our universe. It postulates that 12 to 14 billion years ago, the portion of the universe seen today was only a few millimeters across (NASA).
According to the “big bang” theory, the contents of the known universe expanded explosively into
existence from a hot, dense state 13.7 billion years ago (NAEP 2009). After the big bang, the universe expanded quickly (and continues to expand) and then cooled down enough for atoms to form. Gravity pulled the atoms together into gas clouds that eventually became stars, which comprise young galaxies. Foundations for the big bang model can be included to introduce the supporting evidence for the expansion of the known universe (e.g., Hubble’s law and red shift or cosmic microwave background radiation). A discussion of Hubble’s law and red shift is found in the Galaxy formation section, below.
Technology provides the basis for many new discoveries related to space and the universe. Visual, radio and x-ray telescopes collect information from across the entire electromagnetic spectrum; computers are used to manage data and complicated computations; space probes send back data and materials from remote parts of the solar system; and accelerators provide subatomic particle energies that simulate conditions in the stars and in the early history of the universe before stars formed.
[Back to Earth and the Universe Outline] [Back to Physical Science Outline]
• Galaxy formation
A galaxy is a group of billions of individual stars, star systems, star clusters, dust and gas bound together by gravity. There are billions of galaxies in the universe, and they are classified by size and shape. The Milky Way is a spiral galaxy. It has more than 100 billion stars and a diameter of more than 100,000 light years. At the center of the Milky Way is a bulge of stars, from which are spiral arms of gas, dust and most of the young stars. The solar system is part of the Milky Way galaxy.
Hubble’s law states that galaxies that are farther away have a greater red shift, so the speed at which a galaxy is moving away is proportional to its distance from the Earth. Red shift is a phenomenon due to Doppler shifting, so the shift of light from a galaxy to the red end of the spectrum indicates that the galaxy and the observer are moving farther away from one another. Doppler shifting also is found in the Energy and Waves section of this course.
[Back to Earth and the Universe Outline] [Back to Physical Science Outline]
• Stars
Early in the formation of the universe, stars coalesced out of clouds of hydrogen and helium and clumped together by gravitational attraction into galaxies. When heated to a sufficiently high temperature by gravitational attraction, stars begin nuclear reactions, which convert matter to energy and fuse the lighter elements into heavier ones. These and other fusion processes in stars have led to the formation of all the other elements. (NAEP 2009). All of the elements, except for hydrogen and helium, originated from the nuclear fusion reactions of stars (College Board Standards for College Success, 2009).
Stars are classified by their color, size, luminosity and mass. A Hertzprung-Russell diagram must be used to estimate the sizes of stars and predict how stars will evolve. Most stars fall on the main sequence of the H-R diagram, a diagonal band running from the bright hot stars on the upper left to the dim cool stars on the lower right.
Back to the INDEX

Ohio Department of Education, March 2011 Page 67 of 94
A star’s mass determines the star’s place on the main sequence and how long it will stay there. Patterns of stellar evolution are based on the mass of the star. Stars begin to collapse as the core energy dissipates. Nuclear reactions outside the core cause expansion of the star, eventually leading to the collapse of the star.
Note: Names of stars and naming the evolutionary stage of a star from memory will not be
assessed. The emphasis is on the interpretation of data (using diagrams and charts) and the criteria and processes needed to make those determinations.
[Back to Earth and the Universe Outline] [Back to Physical Science Outline]
Expectations for Learning: Cognitive Demands This section provides definitions for Ohio’s science cognitive demands, which are intrinsically related to current understandings and research about how people learn. They provide a structure for teachers and assessment developers to reflect on plans for teaching science, to monitor observable evidence of student learning and to develop summative assessment of student learning of science.
Visions into Practice This section provides examples of tasks that students may perform; this includes guidance for developing classroom performance tasks. It is not an all-inclusive checklist of what should be done, but is a springboard for generating innovative ideas.
• Investigate features of a solid planetary body using the WorldWide Telescope. Identify features
that are oldest verses those that are youngest and draw conclusions about the reasons for the differences using current theory to support the conclusions.
• Investigate the relative ages of star clusters by plotting data and analyzing the results of the graph created (creating an H-R diagram). Draw conclusions based on the results of the graph and discuss possible implications of the information learned (see Student Instructions and Star Gauge).
• Evaluate data analyzing the penetration ability of Gamma radiation, X-rays, UV, visible light,
infrared and radio wavelengths in Earth’s atmosphere. Based on the analysis and pertinent wavelength-study considerations (e.g., certain wavelengths of light are blocked from reaching Earth’s surface by the atmosphere; how efficiently telescopes work at different wavelengths; telescopes in space are much more expensive to construct than Earth-based telescopes) recommend to a federal funding agency which telescope project should receive funds for construction. The two projects to consider are: o Project 1 – A UV wavelength telescope, placed high atop Mauna Kea in Hawaii at 14,000
ft. above sea level, which will be used to look at distant galaxies.
o Project 2 – A visible wavelength telescope, placed on a satellite in orbit around Earth,
which will be used to observe a pair of binary stars located in the constellation Ursa Major (Big Dipper). (Prather, Slater, Adams, & Brissenden, 2008)
• Use real-time data from the NASA Hubble Mission to research and document the history of the
mission, marking the time, discoveries and impact to humans. There are links at the NASA site to connect students to astronauts and scientists to allow for primary and secondary resources in the research. Present a final product (can be an e-portfolio, presentation or formal poster session) to an authentic audience.
Instructional Strategies and Resources This section provides additional support and information for educators. These are strategies for actively engaging students with the topic and for providing hands-on, minds-on observation and exploration of the topic, including authentic data resources for scientific inquiry, experimentation and problem-based tasks that incorporate technology and technological and engineering design. Resources selected are printed or Web-based materials that directly relate to the particular Content Statement. It is not intended to be a prescriptive list of lessons.
Back to the INDEX
Ohio Department of Education, March 2011 Page 68 of 94
• A collection of videos is provided by NASA about the James Webb Telescope – the largest space-based observatory ever built to date. From galaxy evolution to planetary formation, the Webb telescope will equip scientists to see far beyond previous endeavors.
• Investigate the star life cycle with interactive media or gain an overview of astronomical spectroscopy in studies of stellar spectra.
• It is important to keep the evidence supporting the big bang model at the grade 9-10 level.
Students should understand where the evidence for the theory is found and the importance of data that support the expansion of the universe. This article provides a higher level of detail than is required for this course, but sections of the article are helpful and appropriate in understanding the foundational support.
• NASA provides science modules to support teaching about red shift and Doppler effects from a
cosmology viewpoint. There also are NASA documents that can assist in teaching about stellar evolution.
• Use an interactive HR Diagram to explore different patterns that can exist on the chart and the evolution of specific types of stars.
• Astronomy: Eliciting Student Ideas is a workshop produced by Annenberg that uses constructivism by examining student beliefs on what causes the seasons and their explanations for the phases of the moon that are explored in the video-on-demand “A Private Universe.”
• The Quantum Mechanical Universe is a video produced by Annenberg about a current look at where we have been and a peek into the future.
• Dying stars and Birth of Elements is a computer-based exercise where high school students
analyze realistically simulated X-ray spectra of a supernova remnant and determine the abundances of various elements in them. In the end, they will find that the elements necessary for life on Earth – the iron in their blood, the calcium in their bones – are created in these distant explosions.
• “A Star is Born... but How?” and “Stars” are two tutorials on the Windows to the Universe from the National Earth Science Teachers Association that give details about star formation.
• Exploring Mars is a video produced by Annenberg that shows students in a grade 11 integrated science class who explore how the Mars landscape may have formed.
Common Misconceptions
• NASA provides general student misconceptions pertaining to the universe and the big bang theory.
• Students’ understanding of the magnitude of the universe needs to developed where they can
make sense of how large is a billion or a million. Keely, Eberle & Tugel (2005) suggests teaching the notion of scale with familiar objects that students can see, like the moon and sun. Gradually introduce the nearby planets and then planets further away.(p.182)
Diverse Learners Strategies for meeting the needs of all learners including gifted students, English Language Learners (ELL) and students with disabilities can be found at this site. Resources based on the Universal Design for Learning principles are available at www.cast.org.
Classroom Portals “Teaching High School Science” is a series of videos-on-demand produced by Annenberg that show classroom strategies for implementing inquiry into the high school classroom. While not all of the content is aligned to physical science, the strategies can be applied to any content.
Back to the INDEX

Ohio Department of Education, March 2011 Page 69 of 94
Physics
Syllabus and Model Curriculum
Course Description Physics is a high school level course, which satisfies the Ohio Core science graduation requirements of Ohio Revised Code Section 3313.603. This section of Ohio law requires a three-unit course with inquiry-based laboratory experience that engages students in asking valid scientific questions and gathering and analyzing information.
Physics elaborates on the study of the key concepts of motion, forces and energy as they relate to increasingly complex systems and applications that will provide a foundation for further study in science and scientific literacy.
Students engage in investigations to understand and explain motion, forces and energy in a variety of inquiry and design scenarios that incorporate scientific reasoning, analysis, communication skills and real-world applications.
Science Inquiry and Application During the years of grades 9 through 12, all students must use the following scientific processes with appropriate laboratory safety techniques to construct their knowledge and understanding in all science content areas:
• Identify questions and concepts that guide scientific investigations;
• Design and conduct scientific investigations;
• Use technology and mathematics to improve investigations and communications;
• Formulate and revise explanations and models using logic and evidence (critical thinking);
• Recognize and analyze explanations and models; and
• Communicate and support a scientific argument.
Course Content The following information may be taught in any order; there is no ODE-recommended sequence.
Motion
• Graph interpretations o Position vs. time o Velocity vs. time o Acceleration vs. time
• Problem solving
o Using graphs (average velocity, instantaneous velocity, acceleration, displacement, change in velocity)
o Uniform acceleration including free fall (initial velocity, final velocity, time, displacement, acceleration, average velocity)
• Projectiles
o Independence of horizontal and vertical motion o Problem-solving involving horizontally launched projectiles
Back to the INDEX

Ohio Department of Education, March 2011 Page 70 of 94
Forces, momentum and motion
• Newton’s laws applied to complex problems
• Gravitational force and fields
• Elastic forces
• Friction force (static and kinetic)
• Air resistance and drag
• Forces in two dimensions o Adding vector forces
o Motion down inclines o Centripetal forces and circular motion
• Momentum, impulse and conservation of momentum Energy
• Gravitational potential energy
• Energy in springs
• Nuclear energy
• Work and power
• Conservation of energy Waves
• Wave properties
o Conservation of energy o Reflection o Refraction o Interference o Diffraction
• Light phenomena
o Ray diagrams (propagation of light) o Law of reflection (equal angles) o Snell’s law o Diffraction patterns o Wave – particle duality of light o Visible spectrum and color
Electricity and magnetism
• Charging objects (friction, contact and induction)
• Coulomb’s law
• Electric fields and electric potential energy
• DC circuits
o Ohm’s law o Series circuits o Parallel circuits o Mixed circuits o Applying conservation of charge and energy (junction and loop rules)
• Magnetic fields and energy
• Electromagnetic interactions
Content Elaboration Motion
In physical science, the concepts of position, displacement, velocity and acceleration were introduced and straight-line motion involving either uniform velocity or uniform acceleration was investigated and represented in position vs. time graphs, velocity vs. time graphs, motion diagrams and data tables.
Back to the INDEX
Ohio Department of Education, March 2011 Page 71 of 94
In this course, acceleration vs. time graphs are introduced and more complex graphs are considered that have both positive and negative displacement values and involve motion that occurs in stages (e.g., an object accelerates then moves with constant velocity). Symbols representing acceleration are added to motion diagrams and mathematical analysis of motion becomes increasingly more complex. Motion must be explored through investigation and experimentation. Motion detectors and computer graphing applications can be used to collect and organize data. Computer simulations and video analysis can be used to analyze motion with greater precision.
• Motion Graphs
Instantaneous velocity for an accelerating object can be determined by calculating the slope of the tangent line for some specific instant on a position vs. time graph. Instantaneous velocity will be the same as average velocity for conditions of constant velocity, but this is rarely the case for accelerating objects. The position vs. time graph for objects increasing in speed will become steeper as they progress and the position vs. time graph for objects decreasing in speed will become less steep.
On a velocity vs. time graph, objects increasing in speed will slope away from the x-axis and objects decreasing in speed will slope toward the x-axis. The slope of a velocity vs. time graph indicates the acceleration so the graph will be a straight line (not necessarily horizontal) when the acceleration is constant. Acceleration is positive for objects speeding up in a positive direction or objects slowing down in a negative direction. Acceleration is negative for objects slowing down in a positive direction or speeding up in a negative direction. These are not concepts that should be memorized, but can be developed from analyzing the definition of acceleration and the conditions under which acceleration would have these signs. The word “deceleration” should not be used since it provides confusion between slowing down and negative acceleration. The area under the curve for a velocity vs. time graph gives the change in position (displacement) but the absolute position cannot be determined from a velocity vs. time graph.
Objects moving with uniform acceleration will have a horizontal line on an acceleration vs. time graph. This line will be at the x-axis for objects that are either standing still or moving with constant velocity. The area under the curve of an acceleration vs. time graph gives the change in velocity for the object, but the displacement, position and the absolute velocity cannot be determined from an acceleration vs. time graph. The details about motion graphs should not be taught as rules to memorize, but rather as generalizations that can be developed from interpreting the graphs.
[Back to Physics Outline]
• Problem Solving
Many problems can be solved from interpreting graphs and charts as detailed in the motion graphs section. In addition, when acceleration is constant, average velocity can be calculated by taking the
average of the initial and final instantaneous velocities (��𝒂𝒗𝒈 = (𝒗𝒇 + 𝒗𝒊 )/2). This relationship does
not hold true when the acceleration changes. The equation can be used in conjunction with other kinematics equations to solve increasingly complex problems, including those involving free fall with negligible air resistance in which objects fall with uniform acceleration. Near the surface of Earth, in
the absence of other forces, the acceleration of freely falling objects is 9.81 m/s2. Assessments of
motion problems, including projectile motion, will not include problems that require the quadratic equation to solve.
[Back to Physics Outline]
Back to the INDEX
Ohio Department of Education, March 2011 Page 72 of 94
• Projectile Motion When an object has both horizontal and vertical components of motion, as in a projectile, the components act independently of each other. For a projectile in the absence of air resistance, this means that horizontally, the projectile will continue to travel at constant speed just like it would if there were no vertical motion. Likewise, vertically the object will accelerate just as it would without any horizontal motion. Problem solving will be limited to solving for the range, time, initial height, initial velocity or final velocity of horizontally launched projectiles with negligible air resistance. While it is not inappropriate to explore more complex projectile problems, it must not be done at the expense of other parts of the curriculum.
[Back to Physics Outline]
Expectations for Learning: Cognitive Demands This section provides definitions for Ohio’s science cognitive demands, which are intrinsically related to current understandings and research about how people learn. They provide a structure for teachers and assessment developers to reflect on plans for teaching science, to monitor observable evidence of student learning and to develop summative assessment of student learning of science.
Visions into Practice This section provides examples of tasks that students may perform; this includes guidance for developing classroom performance tasks. It is not an all-inclusive checklist of what should be done, but is a springboard for generating innovative ideas.
• A buggy moving at constant velocity is released from the top of a ramp 1.0 second before a cart
that starts from rest and accelerates down the ramp. At what position on the ramp will the buggy and the cart collide? All data, graphs, calculations and explanations must be clearly represented and annotated to explain how the answer was determined. The cart and the buggy may be checked out one at a time to collect data, but may not be used together until the prediction is ready to be tested.
• Investigate the motion of a freely falling body using either a ticker timer or a motion detector. Use mathematical analysis to determine a value for “g.” Compare the experimental value to known values of “g.” Suggest sources of error and possible improvements to the experiment.
Instructional Strategies and Resources This section provides additional support and information for educators. These are strategies for actively engaging students with the topic and for providing hands-on, minds-on observation and exploration of the topic, including authentic data resources for scientific inquiry, experimentation and problem-based tasks that incorporate technology and technological and engineering design. Resources selected are printed or Web-based materials that directly relate to the particular Content Statement. It is not intended to be a prescriptive list of lessons.
• “Moving man” is an interactive simulation from PhET that allows students to set position,
velocity and acceleration, watch the motion of the man and see the position vs. time, velocity vs. time and acceleration vs. time graphs.
• “Motion in 2-D” is an interactive simulation from PhET that shows the magnitude and direction of the velocity and accelerations for different types of motion.
• “Motion Diagrams” is a tutorial from Western Kentucky University that shows how to draw motion diagrams for a variety of motions. It includes an animated physlet.
• “Projectile Motion” is a physlet from High Point University that illustrates the independence of
horizontal and vertical motion in projectile motion. The projectile motion is shown in slow motion so the horizontal and vertical positions of the ball can be clearly tracked and analyzed. While it shows a projectile launched at an angle, it emphasizes the conceptual aspects of projectile motion that are appropriate for physics students.
• Modeling workshops are available nationally that help teachers develop a framework for incorporating guided inquiry in their instruction.
Back to the INDEX
Ohio Department of Education, March 2011 Page 73 of 94
Common Misconceptions Students often think that:
• Two objects side by side must have the same speed.
• Acceleration and velocity are always in the same direction.
• Velocity is a force.
• If velocity is zero, then acceleration must be zero, too.
• Heavier objects fall faster than light ones.
• Acceleration is the same as velocity.
• The acceleration of a falling object depends upon its mass.
• Freely falling bodies can only move downward.
• There is no gravity in a vacuum.
• Gravity only acts on things when they are falling.
• When the velocity is constant, so is the acceleration. Students do not realize that the acceleration is zero. If the speed is constant, there is no acceleration. A positive acceleration is always associated with speeding up and a negative acceleration is always associated with slowing down.
Diverse Learners Strategies for meeting the needs of all learners including gifted students, English Language Learners (ELL) and students with disabilities can be found at this site. Resources based on the Universal Design for Learning principles are available at www.cast.org.
Classroom Portals “Teaching High School Science” is a series of videos-on-demand produced by Annenberg that show classroom strategies for implementing inquiry into the high school classroom. While not all of the content is aligned to physical science, the strategies can be applied to any content.
Course Content The following information may be taught in any order; there is no ODE-recommended sequence.
Forces, Momentum and Motion
• Newton’s laws applied to complex problems
• Gravitational force and fields
• Elastic forces
• Friction forces (static and kinetic)
• Air resistance and drag
• Forces in two dimensions o Adding vector forces
o Motion down inclines o Centripetal forces and circular motion
• Momentum, impulse and conservation of momentum
Content Elaboration Forces, Momentum and Motion
In earlier grades, Newton’s laws of motion were introduced; gravitational forces and fields were described conceptually; the gravitational force (weight) acting on objects near Earth’s surface was calculated; friction forces and drag were addressed conceptually and quantified from force diagrams; and forces required for circular motion were introduced conceptually. In this course, Newton’s laws of motion are applied to mathematically describe and predict the effects of forces on more complex systems of objects and to analyze objects in free fall that experience significant air resistance.
Back to the INDEX

Ohio Department of Education, March 2011 Page 74 of 94
g 1 2
Gravitational forces are studied as a universal phenomenon and gravitational field strength is quantified. Elastic forces and a more detailed look at friction are included. At the atomic level, “contact” forces are actually due to the forces between the charged particles of the objects that appear to be touching. These electric forces are responsible for friction forces, normal forces and other “contact” forces. Air resistance and drag are explained using the particle nature of matter. Projectile motion is introduced and circular motion is quantified. The vector properties of momentum and impulse are introduced and used to analyze elastic and inelastic collisions between objects. Analysis of experimental data collected in laboratory investigations must be used to study forces and momentum. This can include the use of force probes and computer software to collect and analyze data.
• Newton’s laws
Newton’s laws of motion, especially the third law, can be used to solve complex problems that involve systems of many objects that move together as one (e.g., an Atwood’s machine). The equation a = Fnet/m that was introduced in physical science can be used to solve more
complex problems involving systems of objects and situations involving forces that must themselves be quantified (e.g., gravitational forces, elastic forces, friction forces).
[Back to Forces and Momentum Outline] [Back to Physics Outline]
• Gravitational Forces and Fields
Gravitational interactions are very weak compared to other interactions and are difficult to observe unless one of the objects is extremely massive (e.g., the sun, planets, moons). The force law for gravitational interaction states that the strength of the gravitational force is proportional to the product of the two masses and inversely proportional to the square of the distance between the centers of the masses, F = (G·m ·m )/r
2). The proportionality constant,
G, is called the universal gravitational constant. Problem solving may involve calculating the net force for an object between two massive objects (e.g., Earth-moon system, planet-sun system) or calculating the position of such an object given the net force.
The strength of an object’s (i.e., the source’s) gravitational field at a certain location, g, is given by the gravitational force per unit of mass experienced by another object placed at that location, g = Fg / m. Comparing this equation to Newton’s second law can be used to explain
why all objects on Earth’s surface accelerate at the same rate in the absence of air resistance. While the gravitational force from another object can be used to determine the field strength at a particular location, the field of the object is always there, even if the object is not interacting with anything else. The field direction is toward the center of the source. Given the gravitational field strength at a certain location, the gravitational force between the source of that field and any object at that location can be calculated. Greater gravitational field strengths result in larger gravitational forces on masses placed in the field. Gravitational fields can be represented by field diagrams obtained by plotting field arrows at a series of locations. Field line diagrams are excluded from this course. Distinctions between gravitational and inertial masses are excluded.
A scale indicates weight by measuring the normal force between the object and the surface supporting it. The reading on the scale accurately measures the weight if the system is not accelerating and the net force is zero. However, if the scale is used in an accelerating system as in an elevator, the reading on the scale does not equal the actual weight. The scale reading can be referred to as the “apparent weight.” This apparent weight in accelerating elevators can be explained and calculated using force diagrams and Newton’s laws.
[Back to Forces and Momentum Outline] [Back to Physics Outline]
Back to the INDEX
Ohio Department of Education, March 2011 Page 75 of 94
• Elastic Forces Elastic materials stretch or compress in proportion to the load they support. The mathematical model for the force that a linearly elastic object exerts on another object is Felastic = kΔx, where
Δx is the displacement of the object from its relaxed position. The direction of the elastic force is always toward the relaxed position of the elastic object. The constant of proportionality, k, is
the same for compression and extension and depends on the “stiffness” of the elastic object.
[Back to Forces and Momentum Outline] [Back to Physics Outline]
• Friction Forces
The amount of kinetic friction between two objects depends on the electric forces between the atoms of the two surfaces sliding past each other. It also depends upon the magnitude of the normal force that pushes the two surfaces together. This can be represented mathematically as Fk = µkFN, where µk is the coefficient of kinetic friction that depends upon the materials of
which the two surfaces are made.
Sometimes friction forces can prevent objects from sliding past each other, even when an external force is applied parallel to the two surfaces that are in contact. This is called static friction, which is mathematically represented by Fs ≤ µsFN. The maximum amount of static
friction possible depends on the types of materials that make up the two surfaces and the magnitude of the normal force pushing the objects together, Fsmax = µsFN. As long as the
external net force is less than or equal to the maximum force of static friction, the objects will not move relative to one another. In this case, the actual static friction force acting on the object will be equal to the net external force acting on the object, but in the opposite direction. If the external net force exceeds the maximum static friction force for the object, the objects will move relative to each other and the friction between them will no longer be static friction, but will be kinetic friction.
[Back to Forces and Momentum Outline] [Back to Physics Outline]
• Air Resistance and Drag
Liquids have more drag than gases like air. When an object pushes on the particles in a fluid, the fluid particles can push back on the object according to Newton’s third law and cause a change in motion of the object. This is how helicopters experience lift and how swimmers propel themselves forward. Forces from fluids will only be quantified using Newton’s second law and force diagrams.
[Back to Forces and Momentum Outline] [Back to Physics Outline]
• Forces in Two Dimensions
Net forces will be calculated for force vectors with directions between 0° and 360° or a certain angle from a reference (e.g., 37° above the horizontal). Vector addition can be done with trigonometry or by drawing scaled diagrams. Problems can be solved for objects sliding down inclines. The net force, final velocity, time, displacement and acceleration can be calculated. Inclines will either be frictionless or the force of friction will already be quantified. Calculations of friction forces down inclines from the coefficient of friction and the normal force will not be addressed in this course.
Back to the INDEX

Ohio Department of Education, March 2011 Page 76 of 94
c
An object moves at constant speed in a circular path when there is a constant net force that is always directed at right angles to the direction in motion toward the center of the circle. In this case, the net force causes an acceleration that shows up as a change in direction. If the force is removed, the object will continue in a straight-line path. The nearly circular orbits of planets and satellites result from the force of gravity. Centripetal acceleration is directed toward the center of the circle and can be calculated by the equation a = v
2/r, where v is the speed of the
object and r is the radius of the circle. This expression for acceleration can be substituted into Newton’s second law to calculate the centripetal force. Since the centripetal force is a net force, it can be equated to friction (unbanked curves), gravity, elastic force, etc., to perform more complex calculations.
[Back to Forces and Momentum Outline] [Back to Physics Outline]
• Momentum, Impulse and Conservation of Momentum
Momentum, p, is a vector quantity that is directly proportional to the mass, m, and the velocity, v, of the object. Momentum is in the same direction the object is moving and can be mathematically represented by the equation p = mv. The conservation of linear momentum states that the total (net) momentum before an interaction in a closed system is equal to the total momentum after the interaction. In a closed system, linear momentum is always conserved for elastic, inelastic and totally inelastic collisions. While total energy is conserved for any collision, in an elastic collision, the kinetic energy also is conserved. Given the initial motions of two objects, qualitative predictions about the change in motion of the objects due to a collision can be made. Problems can be solved for the initial or final velocities of objects involved in inelastic and totally inelastic collisions. For assessment purposes, momentum may be dealt with in two dimensions conceptually, but calculations will only be done in one dimension. Coefficients of restitution are beyond the scope of this course.
Impulse, Δp, is the total momentum transfer into or out of a system. Any momentum transfer is the result of interactions with objects outside the system and is directly proportional to both the average net external force acting on the system, Favg, and the time interval of the interaction,
Δt. It can mathematically be represented by Δp = pf – pi = Favg Δt. This equation can be used
to justify why momentum changes due to the external force of friction can be ignored when the time of interaction is extremely short. Average force, initial or final velocity, mass or time interval can be calculated in multi-step word problems. For objects that experience a given impulse (e.g., a truck coming to a stop), a variety of force/time combinations are possible. The time could be small, which would require a large force (e.g., the truck crashing into a brick wall to a sudden stop). Conversely, the time could be extended which would result in a much smaller force (e.g., the truck applying the breaks for a long period of time).
[Back to Forces and Momentum Outline] [Back to Physics Outline]
Expectations for Learning: Cognitive Demands This section provides definitions for Ohio’s science cognitive demands, which are intrinsically related to current understandings and research about how people learn. They provide a structure for teachers and assessment developers to reflect on plans for teaching science, to monitor observable evidence of student learning and to develop summative assessment of student learning of science.
Back to the INDEX

Ohio Department of Education, March 2011 Page 77 of 94
Visions into Practice This section provides examples of tasks that students may perform; this includes guidance for developing classroom performance tasks. It is not an all-inclusive checklist of what should be done, but is a springboard for generating innovative ideas.
• Given two spring-loaded dynamic carts with different masses that are located on a table
between two wooden blocks, determine where the carts must be placed so that they hit the blocks simultaneously. Measurements may be taken of the model set up at the front of the room, but the carts may not be released prior to determination. Clearly justify the answer and state any assumptions that were made. Test your prediction with the model set up at the front of the room.
• Plan and conduct a scientific investigation to determine the relationship between the force
exerted on a spring and the amount it stretches. Represent the data graphically. Analyze the data to determine patterns and trends and model the relationship with a mathematical equation. Describe the relationship in words and support the conclusion with experimental evidence.
Instructional Strategies and Resources This section provides additional support and information for educators. These are strategies for actively engaging students with the topic and for providing hands-on, minds-on observation and exploration of the topic, including authentic data resources for scientific inquiry, experimentation and problem-based tasks that incorporate technology and technological and engineering design. Resources selected are printed or Web-based materials that directly relate to the particular Content Statement. It is not intended to be a prescriptive list of lessons.
• “Collision Lab” is an interactive simulation that allows students to Investigate collisions on an
air hockey table. Students can vary the number of discs, masses, elasticity and initial conditions to see if momentum and kinetic energy are conserved.
• “Forces and Motion” is an interactive simulation that allows students to explore the forces present when a filing cabinet is pushed. Students can create an applied force and see the resulting friction force and total force acting on the cabinet. Graphs show forces vs. time, position vs. time, velocity vs. time, and acceleration vs. time. A force diagram of all the forces (including gravitational and normal forces) is shown.
Common Misconceptions Students often think that:
• Forces are required for motion with constant velocity.
• Inertia deals with the state of motion (at rest or in motion).
• All objects can be moved with equal ease in the absence of gravity.
• All objects eventually stop moving when the force is removed.
• Inertia is the force that keeps objects in motion.
• If two objects are both at rest, they have the same amount of inertia.
• Velocity is absolute and not dependent on the frame of reference.
• Action-reaction forces act on the same body.
• There is no connection between Newton’s laws and kinematics.
• The product of mass and acceleration, ma, is a force.
• Friction cannot act in the direction of motion.
Back to the INDEX

Ohio Department of Education, March 2011 Page 78 of 94
• The normal force on an object is equal to the weight of the object by the third law.
• The normal force on an object always equals the weight of the object.
• Equilibrium means that all the forces on an object are equal.
• Equilibrium is a consequence of the third law.
• Only animate things (people, animals) exert forces; passive ones (tables, floors) do not exert forces.
• Once an object is moving, heavier objects push more than lighter ones.
• Newton’s third law can be overcome by motion (e.g., by a jerking motion).
• A force applied by an object, like a hand, still acts on an object after the object leaves the hand.
• The moon is not falling.
• The moon is not in free fall. The force that acts on an apple is not the same as the force that acts on the moon.
• The gravitational force is the same on all falling bodies.
• There are no gravitational forces in space.
• The gravitational force acting on the Space Shuttle is nearly zero.
• The gravitational force acts on one mass at a time.
• The moon stays in orbit because the gravitational force on it is balanced by the centrifugal force acting on it.
• Weightlessness means there is no gravity.
• The Earth’s spinning motion causes gravity.
• Momentum is not a vector.
• Conservation of momentum applies only to collisions.
• Momentum is the same as force.
• Moving masses in the absence of gravity do not have momentum.
• Momentum is not conserved in collisions with “immovable” objects.
• Momentum and kinetic energy are the same.
• Circular motion does not require a force.
• Centrifugal forces are real.
• An object moving in circle with constant speed has no acceleration.
• An object moving in a circle will continue in circular motion when released.
• An object in circular motion will fly out radially when released.
Diverse Learners Strategies for meeting the needs of all learners including gifted students, English Language Learners (ELL) and students with disabilities can be found at this site. Resources based on the Universal Design for Learning principles are available at www.cast.org.
Classroom Portals “Teaching High School Science” is a series of videos-on-demand produced by Annenberg that show classroom strategies for implementing inquiry into the high school classroom. While not all of the content is aligned to physical science, the strategies can be applied to any content.
Course Content The following information may be taught in any order; there is no ODE-recommended sequence.
Energy
• Gravitational potential energy
• Energy in springs
• Nuclear energy
• Work and power
• Conservation of energy
Back to the INDEX

Ohio Department of Education, March 2011 Page 79 of 94
Content Elaboration Energy
In physical science, the role of strong nuclear forces in radioactive decay, half-lives, fission and fusion, and mathematical problem solving involving kinetic energy, gravitational potential energy, energy conservation and work (when the force and displacement were in the same direction) were introduced. In this course, the concept of gravitational potential energy is understood from the perspective of a field, elastic potential energy is introduced and quantified, nuclear processes are explored further, the concept of mass-energy equivalence is introduced, the concept of work is expanded, power is introduced, and the principle of conservation of energy is applied to increasingly complex situations. Energy must be explored by analyzing data gathered in scientific investigations. Computers and probes can be used to collect and analyze data.
• Gravitational Potential Energy
When two attracting masses interact, the kinetic energies of both objects change but neither is acting as the energy source or the receiver. Instead, the energy is transferred into or out of the gravitational field around the system as gravitational potential energy. A single mass does not have gravitational potential energy. Only the system of attracting masses can have gravitational potential energy. When two masses are moved farther apart, energy is transferred into the field as gravitational potential energy. When two masses are moved closer together, gravitational potential energy is transferred out of the field.
[Back to Energy Outline] [Back to Physics Outline]
• Energy in Springs
The approximation for the change in the potential elastic energy of an elastic object (e.g., a 2
spring) is ΔE elastic = ½ k Δx where Δx is the distance the elastic object is stretched or compressed from its relaxed length.
[Back to Energy Outline] [Back to Physics Outline]
• Nuclear Energy
Alpha, beta, gamma and positron emission each have different properties and result in different changes to the nucleus. The identity of new elements can be predicted for radioisotopes that undergo alpha or beta decay. During nuclear interactions, the transfer of energy out of a system is directly proportional to the change in mass of the system as expressed by E = mc
2, which is known as the equation for mass-energy equivalence. A very
small loss in mass is accompanied by a release of a large amount of energy. In nuclear processes such as nuclear decay, fission and fusion, the mass of the product is less than the mass of the original nuclei. The missing mass appears as energy. This energy can be calculated for fission and fusion when given the masses of the particle(s) formed and the masses of the particle(s) that interacted to produce them.
[Back to Energy Outline] [Back to Physics Outline]
• Work and Power
Work can be calculated for situations in which the force and the displacement are at angles to one another using the equation W = FΔx(cosθ) where W is the work, F is the force, Δx is the displacement, and θ is the angle between the force and the displacement. This means when
the force and the displacement are at right angles, no work is done and no energy is transferred between the objects. Such is the case for circular motion.
Back to the INDEX

Ohio Department of Education, March 2011 Page 80 of 94
The rate of energy change or transfer is called power (P) and can be mathematically represented by P = ΔE / Δt or P = W / Δt. Power is a scalar property. The unit of power is the watt (W), which is equivalent to one Joule of energy transferred in one second (J/s).
[Back to Energy Outline] [Back to Physics Outline]
• Conservation of Energy
The total initial energy of the system and the energy entering the system are equal to the total final energy of the system and the energy leaving the system. Although the various forms of energy appear very different, each can be measured in a way that makes it possible to keep track of how much of one form is converted into another. Situations involving energy transformations can be represented with verbal or written descriptions, energy diagrams and mathematical equations. Translations can be made between these representations.
The conservation of energy principle applies to any defined system and time interval within a situation or event in which there are no nuclear changes that involve mass-energy equivalency. The system and time interval may be defined to focus on one particular aspect of the event. The defined system and time interval may then be changed to obtain information about different aspects of the same event.
[Back to Energy Outline] [Back to Physics Outline]
Expectations for Learning: Cognitive Demands This section provides definitions for Ohio’s science cognitive demands, which are intrinsically related to current understandings and research about how people learn. They provide a structure for teachers and assessment developers to reflect on plans for teaching science, to monitor observable evidence of student learning and to develop summative assessment of student learning of science.
Visions into Practice This section provides examples of tasks that students may perform; this includes guidance for developing classroom performance tasks. It is not an all-inclusive checklist of what should be done, but is a springboard for generating innovative ideas.
• Design and build a mousetrap car that will travel across the floor. Test and calibrate the vehicle
so that the distance it travels can be controlled. After calibrating the cars, each group will be given a different target distance for each of the cars to reach. Designs will be compared and evaluated to determine the most effective design factors.
• Release a cart from several different positions on a ramp and let it travel to the bottom of the ramp and across the table until it slows to a stop. Investigate the relationship between the height of release and the distance it travels before stopping. From the data, determine the average friction force acting on the rolling cart. Identify the assumptions used to determine the friction force.
Instructional Strategies and Resources This section provides additional support and information for educators. These are strategies for actively engaging students with the topic and for providing hands-on, minds-on observation and exploration of the topic, including authentic data resources for scientific inquiry, experimentation and problem-based tasks that incorporate technology and technological and engineering design. Resources selected are printed or Web-based materials that directly relate to the particular Content Statement. It is not intended to be a prescriptive list of lessons.
• “Masses and Springs” is an interactive simulation from PhET that allows students to hang
masses from springs and adjust the spring stiffness and damping, and transport the apparatus to different planets. The resulting motion can be shown in slow motion. A chart shows the kinetic, potential and thermal energy for each spring.
Back to the INDEX

Ohio Department of Education, March 2011 Page 81 of 94
• This tutorial from The Physics Classroom demonstrates the strategy of using energy bar graphs to solve conservation of energy problems.
• Constructing energy bar graphs is a way for students to conceptually organize the energy
changes involved in a problem. Once such a diagram is completed, the appropriate equation for a specific problem can be written using an understanding of conservation of matter. Some methods show work done on and by the system as energy flowing into and out of the system. Other methods show work done on and by the system as a part of the bar graph. The second reference shows the equation first, then the diagram. However, students have an easier time drawing the diagram, then writing the equation from the diagram.
• Energy flow diagrams picture energy transformations in an accurate, quantitative and conceptually transparent manner. Energy Flow Diagrams for Teaching Physics Concepts is a paper that was published in The Physics Teacher that outlines how to use these tools in the classroom. It proceeds from simple processes to complex socially significant processes such as global warming.
Common Misconceptions Students often think that:
• Energy gets used up or runs out.
• Something not moving cannot have any energy.
• Force acting on an object does work even if the object does not move.
• Energy is destroyed in transformations from one type to another.
• Energy can be recycled.
• Gravitational potential energy is the only type of potential energy.
• When an object is released to fall, the gravitational potential energy immediately becomes all kinetic energy.
• Energy is not related to Newton’s laws.
• Energy is a force.
Diverse Learners Strategies for meeting the needs of all learners including gifted students, English Language Learners (ELL) and students with disabilities can be found at this site. Resources based on the Universal Design for Learning principles are available at www.cast.org.
Classroom Portals “Teaching High School Science” is a series of videos-on-demand produced by Annenberg that show classroom strategies for implementing inquiry into the high school classroom. While not all of the content is aligned to physical science, the strategies can be applied to any content.
Course Content The following information may be taught in any order; there is no ODE-recommended sequence.
Waves
• Wave properties
o Conservation of energy o Reflection o Refraction o Interference o Diffraction
Back to the INDEX
Ohio Department of Education, March 2011 Page 82 of 94
• Light phenomena
o Ray diagrams (propagation of light) o Law of reflection (equal angles) o Snell’s law o Diffraction patterns o Wave – Particle duality of light o Visible spectrum and color
Content Elaboration Waves
In earlier grades, the electromagnetic spectrum and basic properties (wavelength, frequency, amplitude) and behaviors of waves (absorption, reflection, transmission, refraction, interference, diffraction) were introduced. In this course, conservation of energy is applied to waves and the measurable properties of waves (wavelength, frequency, amplitude) are used to mathematically describe the behavior of waves (index of refraction, law of reflection, single- and double-slit diffraction). The wavelet model of wave propagation and interactions is not addressed in this course. Waves must be explored experimentally in the laboratory. This may include, but is not limited to, water waves, waves in springs, the interaction of light with mirrors, lenses, barriers with one or two slits, and diffraction gratings.
• Wave Properties
When a wave reaches a barrier or a new medium, a portion of its energy is reflected at the boundary and a portion of the energy passes into the new medium. Some of the energy that passes to the new medium may be absorbed by the medium and transformed to other forms of energy, usually thermal energy, and some continues as a wave in the new medium. Some of the energy also may be dissipated, no longer part of the wave since it has been transformed into thermal energy or transferred out of the system due to the interaction of the system with surrounding objects. Usually all of these processes occur simultaneously, but the total amount of energy must remain constant.
When waves bounce off barriers (reflection), the angle at which a wave approaches the barrier (angle of incidence) equals the angle at which the wave reflects off the barrier (angle of reflection). When a wave travels from a two-dimensional (e.g., surface water, seismic waves) or three- dimensional (e.g., sound, electromagnetic waves) medium into another medium in which the wave travels at a different speed, both the speed and the wavelength of the transferred wave change. Depending on the angle between the wave and the boundary, the direction of the wave also can change resulting in refraction. The amount of bending of waves around barriers or small openings (diffraction) increases with decreasing wavelength. When the wavelength is smaller than the obstacle or opening, no noticeable diffraction occurs. Standing waves and interference patterns between two sources are included in this topic. As waves pass through a single or double slit, diffraction patterns are created with alternating lines of constructive and destructive interference. The diffraction patterns demonstrate predictable changes as the width of the slit(s), spacing between the slits and/or the wavelength of waves passing through the slits changes.
[Back to Waves Outline] [Back to Physics Outline]
Back to the INDEX

Ohio Department of Education, March 2011 Page 83 of 94
• Light phenomena
The path of light waves can be represented with ray diagrams to show reflection and refraction through converging lenses, diverging lenses and plane mirrors. Since light is a wave, the law of reflection applies. Snell’s law, n1sinθ1 = n2sinθ2, quantifies refraction in which n is the index of
refraction of the medium and θ is the angle the wave enters or leaves the medium, when measured from the normal line. The index of refraction of a material can be calculated by the equation n = c/v, where n is the index of refraction of a material, v is the speed of light through the material, and c is the speed of light in a vacuum. Diffraction patterns of light must be addressed, including patterns from diffraction gratings.
There are two models of how radiant energy travels through space at the speed of light. One model is that the radiation travels in discrete packets of energy called photons that are continuously emitted from an object in all directions. The energy of these photons is directly proportional to the frequency of the electromagnetic radiation. This particle-like model is called the photon model of light energy transfer. A second model is that radiant energy travels like a wave that spreads out in all directions from a source. This wave-like model is called the electromagnetic wave model of light energy transfer. Strong scientific evidence supports both the particle-like model and wave-like model. Depending on the problem scientists are trying to solve, either the particle- like model or the wave-like model of radiant energy transfer is used. Students are not required to know the details of the evidence that supports either model at this level.
Humans can only perceive a very narrow portion of the electromagnetic spectrum. Radiant energy from the sun or a light bulb filament is a mixture of all the colors of light (visible light spectrum). The different colors correspond to different radiant energies. When white light hits an object, the pigments in the object reflect one or more colors in all directions and absorb the other colors.
[Back to Waves Outline] [Back to Physics Outline]
Expectations for Learning: Cognitive Demands This section provides definitions for Ohio’s science cognitive demands, which are intrinsically related to current understandings and research about how people learn. They provide a structure for teachers and assessment developers to reflect on plans for teaching science, to monitor observable evidence of student learning and to develop summative assessment of student learning of science.
Visions into Practice This section provides examples of tasks that students may perform; this includes guidance for developing classroom performance tasks. It is not an all-inclusive checklist of what should be done, but is a springboard for generating innovative ideas.
• Design a system involving three refraction tanks and three different lenses so that a beam of
light entering the system at a given angle can pass through all three tanks of liquid and leave the other side at a different angle.
• Investigate the refraction of light as it passes from air into a new liquid medium. Draw incident
and refracted rays for many different angles and measure the angles of both. Present the material graphically to determine the index of refraction for the liquid.
Back to the INDEX

Ohio Department of Education, March 2011 Page 84 of 94
Instructional Strategies and Resources This section provides additional support and information for educators. These are strategies for actively engaging students with the topic and for providing hands-on, minds-on observation and exploration of the topic, including authentic data resources for scientific inquiry, experimentation and problem-based tasks that incorporate technology and technological and engineering design. Resources selected are printed or Web-based materials that directly relate to the particular Content Statement. It is not intended to be a prescriptive list of lessons.
• “Radio waves and electromagnetic fields” is an interactive simulation from PhET that allows
students to explore how electromagnetic radiation is produced. Students can wiggle the transmitter electron manually or have it oscillate automatically and display the field as a curve or as vectors. There is a strip chart that shows the electron positions at the transmitter and at the receiver.
• “Geometric Optics” is an interactive simulation from PhET that illustrates how light rays are refracted by a lens. Students can adjust the focal length of the lens, move the object, move the lens or move the screen and see how the image changes.
Common Misconceptions Students often think that:
• Waves transport matter.
• There must be a medium for a wave to travel through.
• Waves do not have energy.
• All waves travel the same way.
• Frequency is connected to loudness for all amplitudes.
• Big waves travel faster than small waves in the same medium.
• Different colors of light are different types of waves.
• Pitch is related to intensity.
• Light just is and has no origin.
• Light is a particle.
• Light is a mixture of particles and waves.
• Light waves and radio waves are not the same thing.
• In refraction, the characteristics of light change.
• The speed of light never changes.
• Rays and wave fronts are the same thing.
• There is no interaction between light and matter.
• The addition of all colors of light yields black.
• Double slit interference shows light wave crest and troughs.
• Light exits in the crest of a wave and dark in the trough.
• In refraction, the frequency (color) of light changes.
• Refraction is the bending of waves.
Diverse Learners Strategies for meeting the needs of all learners including gifted students, English Language Learners (ELL) and students with disabilities can be found at this site. Resources based on the Universal Design for Learning principles are available at www.cast.org.
Classroom Portals “Teaching High School Science” is a series of videos-on-demand produced by Annenberg that show classroom strategies for implementing inquiry into the high school classroom. While not all of the content is aligned to physical science, the strategies can be applied to any content.
Back to the INDEX

Ohio Department of Education, March 2011 Page 85 of 94
Course Content The following information may be taught in any order; there is no ODE-recommended sequence.
Electricity and Magnetism
• Charging objects (friction, contact and induction)
• Coulomb’s law
• Electric fields and electric potential energy
• DC circuits
o Ohm’s law o Series circuits o Parallel circuits o Mixed circuits o Applying conservation of charge and energy (junction and loop rules)
• Magnetic fields and energy
• Electromagnetic interactions
Content Elaboration Electricity and Magnetism
In earlier grades, the following concepts were addressed: conceptual treatment of electric and magnetic potential energy; the relative number of subatomic particles present in charged and neutral objects; attraction and repulsion between electrical charges and magnetic poles; the concept of fields to conceptually explain forces at a distance; the concepts of current, potential difference (voltage) and resistance to explain circuits conceptually; and connections between electricity and magnetism as observed in electromagnets, motors and generators. In this course, the details of electrical and magnetic forces and energy are further explored and can be used as further examples of energy and forces affecting motion.
• Charging Objects (friction, contact and induction)
For all methods of charging neutral objects, one object/system ends up with a surplus of positive charge and the other object/system ends up with the same amount of surplus of negative charge. This supports the law of conservation of charge that states that charges cannot be created or destroyed. Tracing the movement of electrons for each step in different ways of charging objects (rubbing together two neutral materials to charge by friction; charging by contact and by induction) can explain the differences between them. When an electrical conductor is charged, the charge “spreads out” over the surface. When an electrical insulator is charged, the excess or deficit of electrons on the surface is localized to a small area of the insulator.
There can be electrical interactions between charged and neutral objects. Metal conductors have a lattice of fixed positively charged metal ions surrounded by a “sea” of negatively charged electrons that flow freely within the lattice. If the neutral object is a metal conductor, the free electrons in the metal are attracted toward or repelled away from the charged object. As a result, one side of the conductor has an excess of electrons and the opposite side has an electron deficit. This separation of charges on the neutral conductor can result in a net attractive force between the neutral conductor and the charged object. When a charged object is near a neutral insulator, the electron cloud of each insulator atom shifts position slightly so it is no longer centered on the nucleus. The separation of charge is very small, much less than the diameter of the atom. Still, this small separation of charges for billions of neutral insulator particles can result in a net attractive force between the neutral insulator and the charged object.
[Back to Electricity and Magnetism Outline] [Back to Physics Outline]
Back to the INDEX

Ohio Department of Education, March 2011 Page 86 of 94
• Coulomb’s law
Two charged objects, which are small compared to the distance between them, can be modeled as point charges. The forces between point charges are proportional to the product of the charges and inversely proportional to the square of the distance between the point charges [Fe = ke q1 q2) / r2]. Problems may be solved for the electric force, the amount of charge on one of the two objects
or the distance between the two objects. Problems also may be solved for three- or four-point charges in a line if the vector sum of the forces is zero. This can be explored experimentally through computer simulations. Electric forces acting within and between atoms are vastly stronger than the gravitational forces acting between the atoms. However, gravitational forces are only attractive and can accumulate in massive objects to produce a large and noticeable effect whereas electric forces are both attractive and repulsive and tend to cancel each other out.
[Back to Electricity and Magnetism Outline] [Back to Physics Outline]
• Electric Fields and Electric Potential Energy
The strength of the electrical field of a charged object at a certain location is given by the electric force per unit charge experienced by another charged object placed at that location, E = Fe / q.
This equation can be used to calculate the electric field strength, the electric force or the electric charge. However, the electric field is always there, even if the object is not interacting with anything else. The direction of the electric field at a certain location is parallel to the direction of the electrical force on a positively charged object at that location. The electric field caused by a collection of charges is equal to the vector sum of the electric fields caused by the individual charges (superposition of charge). This topic can be explored experimentally through computer simulations. Greater electric field strengths result in larger electric forces on electrically charged objects placed in the field. Electric fields can be represented by field diagrams obtained by plotting field arrows at a series of locations. Electric field diagrams for a dipole, two-point charges (both positive, both negative, one positive and one negative) and parallel capacitor plates are included. Field line diagrams are excluded from this course.
The concept of electric potential energy can be understood from the perspective of an electric field. When two attracting or repelling charges interact, the kinetic energies of both objects change but neither is acting as the energy source or the receiver. Instead, the energy is transferred into or out of the electric field around the system as electric potential energy. A single charge does not have electric potential energy. Only the system of attracting or repelling charges can have electric potential energy. When the distance between the attracting or repelling charges changes, there is a change in the electric potential energy of the system. When two opposite charges are moved farther apart or two like charges are moved close together, energy is transferred into the field as electric potential energy. When two opposite charges are moved closer together or two like charges are moved far apart, electric potential energy is transferred out of the field. When a charge is transferred from one object to another, work is required to separate the positive and negative charges. If there is no change in kinetic energy and no energy is transferred out of the system, the work increases the electric potential energy of the system.
[Back to Electricity and Magnetism Outline] [Back to Physics Outline]
• DC circuits
Once a circuit is switched on, the current and potential difference are experienced almost instantaneously in all parts of the circuit even though the electrons are only moving at speeds of a few centimeters per hour in a current-carrying wire. It is the electric field that travels instantaneously through all parts of the circuit, moving the electrons that are already present in the wire. Since electrical charge is conserved, in a closed system such as a circuit, the current flowing into a branch point junction must equal the total current flowing out of the junction (junction rule).
Back to the INDEX

Ohio Department of Education, March 2011 Page 87 of 94
Resistance is measured in ohms and has different cumulative effects when added to series and parallel circuits. The potential difference, or voltage (ΔV), across an energy source is the potential energy difference (ΔE) supplied by the energy source per unit charge (q) (ΔV = ΔE/q). The electric potential difference across a resistor is the product of the current and the resistance (ΔV = I R). In physics, only ohmic resistors will be studied. When potential difference vs. current is plotted for an ohmic resistor, the graph will be a straight line and the value of the slope will be the resistance. Since energy is conserved for any closed loop, the energy put into the system by the battery must equal the energy that is transformed by the resistors (loop rule). For circuits with resistors in series, this means that ΔVbattery = ΔV1 + ΔV2 + ΔV3 +…. The rate of energy transfer (power) across each
resistor is equal to the product of the current through and the voltage drop across each resistor (P = ΔV I) and Pbattery = I ΔV1 + I ΔV2 + I ΔV3 +… = I∆Vbattery. Equations should be understood
conceptually and used to calculate the current or potential difference at different locations of a parallel, series or mixed circuit. However, the names of the laws (e.g., Ohm’s law, Kirchoff’s loop law) will not be assessed. Measuring and analyzing current, voltage and resistance in parallel, series and mixed circuits must be provided. This can be done with traditional laboratory equipment and through computer simulations.
[Back to Electricity and Magnetism Outline] [Back to Physics Outline]
• Magnetic Fields and Energy
The direction of the magnetic field at any point in space is the equilibrium direction of the north end of a compass placed at that point. Magnetic fields can be represented by field diagrams obtained by plotting field arrows at a series of locations. Field line diagrams are excluded from this course. Calculations for the magnetic field strength are not required at this grade level, but it is important to note that greater magnetic fields result in larger magnetic forces on magnetic objects or moving charges placed in the field. The concept of magnetic potential energy can be understood from the perspective of a magnetic field. When two attracting or repelling magnetic poles interact, the kinetic energies of both objects change but neither is acting as the energy source or the receiver. Instead, the energy is transferred into or out of the magnetic field around the system as magnetic potential energy. A single magnetic pole does not have magnetic potential energy. Only the system of attracting or repelling poles can have magnetic potential energy. When the distance between the attracting or repelling poles changes, there is a change in the magnetic potential energy of the system. When two magnetically attracting objects are moved farther apart or two magnetically repelling objects are moved close together, energy is transferred into the field as magnetic potential energy. When two magnetically attracting objects are moved closer together or two magnetically repelling objects are moved far apart, magnetic potential energy is transferred out of the field. Work is required to separate two magnetically attracting objects. If there is no change in kinetic energy and no energy is transferred out of the system, the work done on the system increases the magnetic potential energy of the system. In this course, the concepts of magnetic fields and magnetic potential energy will not be addressed mathematically.
[Back to Electricity and Magnetism Outline] [Back to Physics Outline]
Back to the INDEX
Ohio Department of Education, March 2011 Page 88 of 94
• Electromagnetic Interactions
Magnetic forces are very closely related to electric forces. Even though they appear to be distinct from each other, they are thought of as different aspects of a single electromagnetic force. A flow of charged particles (including an electric current) creates a magnetic field around the moving particles or the current carrying wire. Motion in a nearby magnet is evidence of this field. Electric currents in Earth’s interior give Earth an extensive magnetic field, which is detected from the orientation of compass needles. The motion of electrically charged particles in atoms produces magnetic fields. Usually these magnetic fields in an atom are randomly oriented and therefore cancel each other out. In magnetic materials, the subatomic magnetic fields are aligned, adding to give a macroscopic magnetic field.
A moving charged particle interacts with a magnetic field. The magnetic force that acts on a moving charged particle in a magnetic field is perpendicular to both the magnetic field and to the direction of motion of the charged particle. The magnitude of the magnetic force depends on the speed of the moving particle, the magnitude of the charge of the particle, the strength of the magnetic field, and the angle between the velocity and the magnetic field. There is no magnetic force on a particle moving parallel to the magnetic field. Calculations of the magnetic force acting on moving particles are not required at this grade level. Moving charged particles in magnetic fields typically follow spiral trajectories since the force is perpendicular to the motion.
A changing magnetic field creates an electric field. If a closed conducting path, such as a wire, is in the vicinity of a changing magnetic field, a current may flow through the wire. A changing magnetic field can be created in a closed loop of wire if the magnet and the wire move relative to one another. This can cause a current to be induced in the wire. The strength of the current depends upon the strength of the magnetic field, the velocity of the relative motion and the number of loops in the wire. Calculations for current induced in a wire or coil of wire is not required at this level. A changing electric field creates a magnetic field and a changing magnetic field creates an electric field. Thus, radiant energy travels in electromagnetic waves produced by changing the motion of charges or by changing magnetic fields. Therefore, electromagnetic radiation is a pattern of changing electric and magnetic fields that travel at the speed of light.
The interplay of electric and magnetic forces is the basis for many modern technologies that convert mechanical energy to electrical energy (generators) or electrical energy to mechanical energy (electric motors) as well as devices that produce or receive electromagnetic waves. Therefore, coils of wire and magnets are found in many electronic devices including speakers, microphones, generators and electric motors. The interactions between electricity and magnetism must be explored in the laboratory setting. Experiments with the inner workings of motors, generators and electromagnets must be conducted. Current technologies using these principles must be explored.
[Back to Electricity and Magnetism Outline] [Back to Physics Outline]
Expectations for Learning: Cognitive Demands This section provides definitions for Ohio’s science cognitive demands, which are intrinsically related to current understandings and research about how people learn. They provide a structure for teachers and assessment developers to reflect on plans for teaching science, to monitor observable evidence of student learning and to develop summative assessment of student learning of science.
Back to the INDEX

Ohio Department of Education, March 2011 Page 89 of 94
Visions into Practice This section provides examples of tasks that students may perform; this includes guidance for developing classroom performance tasks. It is not an all-inclusive checklist of what should be done, but is a springboard for generating innovative ideas.
• Design and build a generator that will convert mechanical energy into electrical energy. Draw a
labeled design plan and write a paper explaining in detail and in terms of electromagnetic induction how the details of the design allow the generator to work. Test the generator in an electric circuit. If it cannot supply the electrical energy to light three flashlight bulbs in a series, redesign the generator.
• Use a source of constant voltage to plan and conduct an experiment to determine the relationship between the current and the resistor in a simple DC circuit. Analyze the results mathematically and graphically. Form a claim about the relationship between the current and resistance and support the claim with evidence from the investigation.
Instructional Strategies and Resources This section provides additional support and information for educators. These are strategies for actively engaging students with the topic and for providing hands-on, minds-on observation and exploration of the topic, including authentic data resources for scientific inquiry, experimentation and problem-based tasks that incorporate technology and technological and engineering design. Resources selected are printed or Web-based materials that directly relate to the particular Content Statement. It is not intended to be a prescriptive list of lessons.
• The equations for gravitational force and electrostatic force can be compared to determine
similarities and differences between them.
• “Circuit Construction Kit” is interactive simulation produced by PhET that allows students to design and build circuits with resistors, light bulbs, batteries and switches; take measurements with the realistic ammeter and voltmeter; and view the circuit as a schematic diagram or a life- like view.
• “Battery-Resistor Circuit” is an interactive simulation produced by PhET that allows students to
look inside a resistor to see how it works. The battery voltage can be increased to make more electrons flow though the resistor. The resistance can be increased to inhibit the flow of electrons. The current and resistor temperature change with changing voltage and resistance.
• “5 Types of Microphones” from Discovery Company’s How Things Work describes how different kinds of microphones are built and how they convert sound to electrical signals.
• “How Speakers Work” from Discovery Company’s How Things Work describes how speakers are built and how they convert electrical signals to sound.
• “How Electric Motors Work” from Discovery Company’s How Things Work describes how motors can use magnets to convert electrical energy to mechanical energy.
• “Direct Current Electric Motor” by Walter Fendt is an animation that shows the construction of a simple DC electric motor that can be shown to students to explain how it works.
• “Generator“ by Walter Fendt is an animation that shows the construction of a simple generator that can be shown to students to explain how it works.
Common Misconceptions Students often think that:
• A moving charge will always follow a field line as it accelerates.
• If a charge is not on a field line, it feels no force.
• Field lines are real.
• Coulomb’s law applies to charge systems consisting of something other than point charges.
Back to the INDEX
Ohio Department of Education, March 2011 Page 90 of 94
• A charged body has only one type of charge.
• The electric field and force are the same thing and in the same direction.
• Forces at a point exist without a charge there.
• Field lines are paths of a charges motion.
• The electric force is the same as the gravitational force.
• Charge is continuous and can occur in any amount.
• An electron is pure negative charge with no mass.
• Voltage flows through a circuit.
• There is no connection between voltage and electric field.
• Voltage is energy.
• High voltage by itself is dangerous.
• Charges move by themselves.
• Designations of (+) and (-) are absolute.
• Resistors consume charge.
• Electrons move quickly (near the speed of light) through a circuit.
• Charges slow down as they go through a resistor.
• Current is the same thing as voltage.
• There is no current between the terminals of a battery.
• The bigger the container, the larger the resistance.
• A circuit does not have form a closed loop for current to flow.
• Current gets “used up” as it flows through a circuit.
• A conductor has no resistance.
• The resistance of a parallel combination is larger than the largest resistance.
• Current is an excess charge.
• Charges that flow in circuit are from the battery.
• The bigger the battery, the more voltage.
• Power and energy are the same thing.
• Batteries create energy out of nothing.
• North and south magnetic poles are the same as positive and negative charges.
• Poles can be isolated.
• Magnetic fields are the same as electric fields.
• Charges at rest can experience magnetic forces.
• Magnetic fields from magnets are not caused by moving charges.
• Generating electricity requires no work.
• When generating electricity only the magnet can move.
• Voltage can only be induced in a closed circuit.
• Water in dams causes electricity.
Diverse Learners Strategies for meeting the needs of all learners including gifted students, English Language Learners (ELL) and students with disabilities can be found at this site. Resources based on the Universal Design for Learning principles are available at www.cast.org.
Classroom Portals “Teaching High School Science” is a series of videos-on-demand produced by Annenberg that show classroom strategies for implementing inquiry into the high school classroom. While not all of the content is aligned to physical science, the strategies can be applied to any content.
Back to the INDEX

Ohio Department of Education, March 2011 Page 91 of 94
Description of a Scientific Model
A scientific model is a mental construct that represents a large-scale system or process. The model may be abstract, conceptual, mathematical, graphical and/or computer-based. Scientific models are valuable to promote understanding of interactions within and between systems and to explain and predict observed phenomena as simply as possible. It is important to note that scientific models are incomplete representations of the actual systems and phenomena. They can change over time as new evidence is discovered that cannot be explained using the old model. Since the goal of a model is to promote understanding, simpler, less complete models can still be used when more advanced and complex models do little to contribute to the understanding of the phenomenon considered. For example, the quantum model of the atom would not necessarily be the best model to use to understand the behavior of gases.
Back to the INDEX

Ohio Department of Education, March 2011 Page 92 of 94
Ohio’s Cognitive Demands for Science
As with all other frameworks and cognitive demand systems, Ohio’s revised system has overlap between the categories. Recalling Accurate Science is a part of the other three cognitive demands included in Ohio’s framework because science knowledge is required for students to demonstrate scientific literacy.
These definitional paragraphs are used to describe the cognitive demand and are the prerequisite conditions that must be met before secondary conditions are considered.
Cognitive Demand Description
Designing Technological/ Engineering Solutions Using Science Concepts (T)
Requires students to solve science-based engineering or technological problems through application of scientific inquiry. Within given scientific constraints, propose or critique solutions, analyze and interpret technological and engineering problems, use science principles to anticipate effects of technological or engineering design, find solutions using science and engineering or technology, consider consequences and alternatives and/or integrate and synthesize scientific information.
Demonstrating Science Knowledge (D)
Requires students to use scientific inquiry and develop the ability to think and act in ways associated with inquiry, including asking questions, planning and conducting investigations, using appropriate tools and techniques to gather and organize data, thinking critically and logically about relationships between evidence and explanations, constructing and analyzing alternative explanations, and communicating scientific arguments. (Slightly altered from National Science Education Standards)
Note: Procedural knowledge (knowing how) is included in
Recalling/Identifying Accurate Science.
Interpreting and Communicating Science Concepts (C)
Requires students to use subject-specific conceptual knowledge to interpret and explain events, phenomena, concepts and experiences using grade-appropriate scientific terminology, technological knowledge and mathematical knowledge. Communicate with clarity, focus and organization using rich, investigative scenarios, real-world data and valid scientific information.
Recalling Accurate Science (R) Requires students to provide accurate statements about scientifically valid facts, concepts and relationships. Recall only requires students to provide a rote response, declarative knowledge or perform routine mathematical task. This cognitive demand refers to students’ knowledge of science fact, information, concepts, tools, procedures and basic principles.
Back to the INDEX

Ohio Department of Education, March 2011 Page 93 of 94
Definitions for the Revised Science Standards and Model Curriculum
Strands: These are the science disciplines: Earth and space sciences, physical sciences, life science. Overlaying all the content standards and embedded in each discipline are science inquiry and applications.
Grade Band Themes: These are the overarching ideas that connect the strands and the topics within the grades. Themes illustrate a progression of increasing complexity from grade to grade that is applicable to all the strands.
Strand Connections: These are the overarching ideas that connect the strands and topics within an individual grade. Connections help illustrate the integration of the content statements from the different strands.
Topics: These are the main focus for content for each strand at a particular grade level. Topics are the
foundation for specific content statements.
Content Statements: These state the science content to be learned. They are the “what” of science that should be accessible to students at each grade level to prepare them to learn about and use scientific knowledge, principles and processes with increasing complexity in subsequent grades.
Note: The content statements and associated model curriculum may be taught in any order.
The sequence provided here does not represent the ODE-recommended sequence as there is no ODE-recommended sequence.
Model Curriculum: The Model Curriculum is a Web-based resource that will incorporate information on
“how” the material in the Content Statement may be taught. It will include Content Elaboration, Learning Expectations, and Instructional Strategies and Resources (described below).
Content Elaboration: This section provides anticipated grade-level depth of content knowledge and examples of science process skills that should be integrated with the content. Content Elaboration also provides information to help identify what prior knowledge students should have and to what future knowledge the content will build.
Expectations for Learning: This section provides definitions for Ohio’s science cognitive demands, which are intrinsically related to current understandings and research about how people learn. Expectations for Learning provides a structure for teachers and assessment developers to reflect on plans for teaching science, to monitor observable evidence of student learning and to develop summative assessment of student learning of science. Ohio’s cognitive demands for science include designing technological and engineering solutions using scientific concepts, demonstrating scientific knowledge, interpreting and communicating scientific concepts and recalling accurate science.
Vision into Practice: This section provides optional examples of tasks that students may perform; these tasks are not mandated. Vision into Practice includes designing technological and engineering solutions using scientific concepts, demonstrating scientific knowledge, interpreting and communicating scientific concepts and recalling accurate science. This section provides guidance for developing classroom performance tasks. These are examples, not an all-inclusive checklist of what should be done, but a springboard for generating innovative ideas.
Ohio Department of Education, March 2011 Page 94 of 94
Instructional Strategies and Resources: This section provides additional support and information for educators. The strategies are for actively engaging students with the topic and for providing hands-on, minds-on observation and exploration of the topic, including authentic data resources for scientific inquiry, experimentation and problem-based tasks that incorporate technology and technological and engineering design. Resources selected are printed or Web-based materials that directly relate to the particular Content Statement. This section is not intended to be a prescriptive list of lessons. Subcategories of Instructional Strategies and Resources include:
Common Misconceptions: This section identifies misconceptions that students often have about the particular Content Statement. When available, links to resources are provided that describe the misconception and that offer suggestions for helping students overcome them.
Diverse Learners: This section will include ideas about different ways of approaching a topic to take into consideration diverse learning styles. It will contain a variety of instructional methods designed to engage all students to help them gain deep understanding of content through scientific inquiry, technology and technological and engineering design.
Classroom Portals: This section provides windows into the classroom through webcasts,
podcasts or video clips to exemplify and model classroom methods of teaching science using inquiry and technological design.
Back to the INDEX