Embed Size (px)
Citation preview

TRR 1473 - Strength and Deformation Characteristics of Pavement Sections and PavementRehabilitation
National Study of Asphalt Pavement Rutting in Saudi Arabia
H. I. Al-Abdul Wahhab, M. N. Fatani, A. S. Noureldin, A. Bubshait, and I. A. Al-DubabeH. I. Al-Abdul Wahhab and A. Bubshait, Civil Engineering Department, King Fahd University of Petroleum andMinerals, Dhahran 31261, Saudi Arabia. M. N. Fatani, King Abdulaziz University, Jeddah, Saudi Arabia. A. S.Noureldin, Ministry of Communications, Riyadh, Saudi Arabia. I. A. Al-Dubabe, Saudi Aramco, Saudi Arabia.
Premature rutting has occurred on a number of recently built highways in Saudi Arabia. The Ministry ofCommunications, in an effort to solve the problem, has initiated a number of studies and has started to replace theaffected pavement. The aim of the present study was to identify possible factors that may relate to rutting and torecommend maintenance and repair criteria for existing rutted pavements. The study covers 19 sections of 11 majorhighways. Results indicate a direct relationship between rutting and the percentage of air voids, the percentage ofvoids in mineral aggregate, the percentage of voids filled with asphalt, the resilient modulus at 25癈 , and asphaltviscosity. These properties were used as bases for determination of maintenance criteria as well as the criteria formixes required to resist rutting on Saudi roads.
The Kingdom of Saudi Arabia has invested more than US $25 billion in road construction over the last 20 years. TheKingdom has undergone an extremely rapid rate of development in many directions. The construction of thousands ofkilometers of freeways, expressways, and low-volume roads has played an important role in such development.Growth in socioeconomic and industrial sectors has been encouraged, resulting in the generation of a great deal ofheavy vehicle transportation in cities and between cities.
These rapid development rates have generated extremely large traffic volumes, especially those of heavy trucks,on the roadway network. The roadway capacity can properly accommodate these volumes. However, noticeable ruttingproblems have appeared during the last 10 years.
In an attempt to avoid the spread of the rutting problem on the prestigious Saudi roadway network, a 5-yearNCHRP project entitled Evaluation of Permanent Deformation of Asphalt Concrete Pavements in Saudi Arabia wasinitiated in July 1987. The objectives of this research project were
1. To identify factors that may relate to rutting,
2. To recommend criteria for repairing existing rutted pavements,
3. To recommend ways and means of minimizing rutting in future constructions projects, and
4. To select a model for identifying rutting potential in different asphalt concrete mixes.This paper summarizes the results of some phases of the study and provides preliminary recommendations for
ways to obtain rut resistance on pavements bearing today's heavy traffic loads.
STUDY SECTIONSNineteen test sections located on 12 major highways (Table 1) were selected such that
1. Three regions of the Kingdom were represented (Eastern, Central, and Western),
2. Weigh stations were present to monitor truck weights,
3. Traffic characteristics and tire pressures could be monitored easily and accurately,
4. Sections on roads without rutting problems were represented, and
5. Nonrutted segments (rut depth less than 1 cm) of roads with rutting problems were represented.Each test section was 1 km in length and two to three standard traffic lanes wide (depending on road
classification). The rut depth measurements obtained on the selected rutted sections ranged from 1.5 to 7.0 cm.Field investigations and laboratory characterizations were conducted at each test section for both the truck lane
(outer right slow lane) and the passing lane (outer left passing lane).
RUTTING DISTRESS LOCATIONFull-depth, full-width saw-cut trenches together with full-depth, full-width continuous corings obtained from ruttedsections indicated that rutting distress was localized only in the top 10 cm of asphalt-bound layers on the truck laneunder the wheelpaths (Figure 1).

The occasional presence of rutting in the middle lane (six-lane dual carriageways) was observed when thepresence of severe rutting in the truck lane caused discomfort to the users of that lane. The middle lane in this casebecame, in practice, the truck lane.
The amount of rut depth under the left wheelpath was smaller than that under the right wheelpath (Figure 1). Thismay be attributed to the surface slope and the relatively low lateral support provided by the shoulder adjacent to theright wheelpath compared with the lateral support provided by the traffic lane adjacent to the left wheelpath.
TRAFFIC CHARACTERISTICSTraffic counters and weigh stations located on the selected study sections were used to monitor traffic characteristics.The monitoring process resulted in the following major observations:
1. Heavy truck (exceeding legal limits) traffic represented more than 25 percent of total traffic on all test sections.
2. Sixty percent of the truck traffic used the roadways between 9:00 a.m. and 4:00 p.m. During this time of day in thehot season (May to September), the air temperature regularly exceeds 40癈 (104癋 ) and pavement temperaturesexceed 60癈 (140癋 ).
3. Up to 20 percent of individual axles had loads in excess of limits set by the Ministry of Communications (Figure 2).
4. Almost all truck traffic used the slow lane except when passing.
5. More than 50 percent of the tires tested had tire air pressures in excess of 8.43 kg/cm2 (120 lb/in.2), and morethan 95 percent of the tires tested had tire pressures in excess of 4.92 kg/cm2 (70 lb/in.2). Some inflated tires hadpressures of up to 12 kg/cm2 (170 lb/in.2), as illustrated in Figure 3. It should be noted that the Asphalt Institutepavement design method (1) assumes that loads are transmitted to the pavement when the contact pressure is 4.92kg/cm2 (70 lb/in.2). In addition, the current 1993 AASHTO guide (2) also assumes that tire pressure is in the vicinity of5 kg/cm2.
6. A heavy truck classified as 2S2 was identified as the one associated with the most gross weight and axle loadlimit violations (Figure 2).

TABLE 1 Study Sections
CLIMATIC CHARACTERISTICSTemperature sensors were installed at various depths of the pavement sections to monitor air temperature, pavementsurface temperature, and pavement temperature at depths of 2, 4, 8, and 16 cm and at the bottom of the bituminouslayers. The monitoring process resulted in a data base of temperature measurements at the specified locations for 24hr a day for a period of 2 years. The following are the major observations from this temperature-monitoring process:
1. Roads in Saudi Arabia are generally exposed to extremely high temperatures for long periods of time.
2. The pavement temperature approaches 70癈 (158癋 ) in the hot summer months (May to September), duringwhich time the air temperature approaches 50癈 (122癋 ).
3. The highest temperature occurs at the middle of the bituminous wearing course (at a depth of 2 cm from thepavement surface).
4. The pavement surface temperature is slightly less than that of the middle of the bituminous wearing courseapparently because of surface winds (Figure 4).
Although nothing can be done to alter these harsh climatic conditions, allowing a slightly larger air void content inthe bituminous wearing course may help by providing more ventilation for the bituminous wearing course and hencereducing pavement temperature. Also, the end of construction and the opening of the road to traffic should not bescheduled during the summer months (May to September), when the pavement temperature is the highest and asphaltconsistency is the lowest.
Figure 5 shows the monthly average temperature distributions during the hours of the day for the months ofDecember (coldest) and July (hottest), respectively. Figures 6 and 7 illustrate the regression relationships betweenpavement surface temperature (or temperature at a depth of 4 cm) and air temperature during the months ofDecember and July, respectively. In addition, Figure 8 provides the monthly variation in air temperatures in the cities ofRiyadh (Central Region) and Dhahran (Eastern Region), respectively.
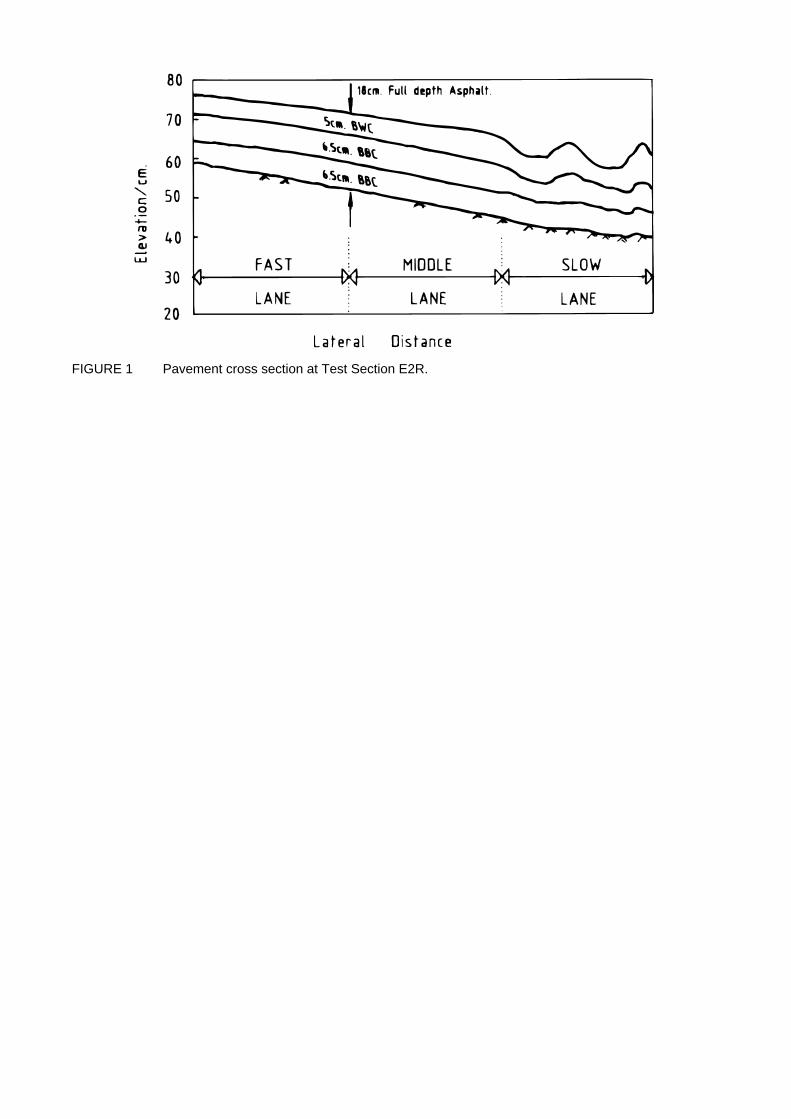
FIGURE 1 Pavement cross section at Test Section E2R.

FIGURE 2 Truck classification scheme.

FIGURE 3 Tire pressure data.

FIGURE 4 Temperature gradient during the hottest time of the year in a 25-cm, full-depth asphalt.

FIGURE 5 Average pavement temperatures during July in a 20-cm, full-depth asphalt.

FIGURE 6 Surface temperature-air temperature relationship during December.
ASPHALT CEMENT CHARACTERISTICSAsphalt cement samples were extracted from slabs obtained from the study sections by using ASTM D 2172 and wererecovered by using ASTM D 1856. Consistency characteristics [penetration (PEN), absolute viscosity (ABSVS),kinematic viscosity (KINVS), and softening point (SFT)] were tested according to ASTM D 5, ASTM D 2171, STM D2170, and ASTM D 36, respectively. This process was performed for the bituminous wearing course and thebituminous base course.
Asphalt cement consistency characteristics were statistically compared as follows:
1. Between the fast and slow lanes within the rutted sections,
2. Between the fast and slow lanes within the nonrutted sections, and
3. Between the fast lanes of the rutted sections and the fast lanes of the nonrutted sections.The first and second comparisons indicated no statistically significant differences. This generally means that the
asphalt cement consistency characteristics were statistically identical within the same section whether it was a ruttedsection or a nonrutted section.

FIGURE 7 Surface temperature-air temperature relationship during July.

FIGURE 8 Monthly variation in air temperature for Riyadh (Central Region).
However, the third comparison indicated that significant differences exist for the bituminous wearing course only(asphalt samples extracted from the bituminous base course did not indicate statistically significant differences).Asphalt cement extracted from cores obtained from the bituminous wearing course of the fast lanes of the ruttedsections was statistically softer than asphalt cement extracted from cores obtained from the bituminous wearing courseof the fast lanes of nonrutted sections (Table 2). The expression softer means a higher level of penetration, a lowersoftening point, a lower viscosity, and a lower stiffness (Table 2).
AGGREGATE CHARACTERISTICSAggregate samples were extracted from slabs obtained from the study sections by using ASTM D 2172. Gradationanalysis was conducted by using ASTM C-136 (Tables 3 and 4). The extracted aggregate, which was limestone for theEastern and Central Regions and granite for the Western Region, was also examined to determine the surface area,hump value, and amount passing No. 200. These characteristics were obtained for both the bituminous wearing courseand the bituminous base course.

TABLE 2 Asphalt Cement Consistency Characteristics for the Bituminous Wearing Course
These aggregate characteristics were statistically compared in exactly the same manner described previously forasphalt cement. The statistical comparisons indicated no significant differences.
MIX DESIGN PARAMETERSBulk specific gravities (GMB) of cores obtained from the study sections were obtained by using ASTM D 2726. Themaximum theoretical specific gravities (GMM) were determined by using ASTM D 2041. The asphalt content(extracted) was determined by using ASTM D 2172, and its specific gravity was determined by using ASTM D 70. Thebulk specific gravities (GSB) of the extracted aggregates were determined in accordance with ASTM C-127 and ASTMC-128. Percent voids in mineral aggregate (VMA), percent air voids (AV), and percent voids filled with bitumen (VFB)were computed in accordance with the Asphalt Institute Mix Design Manual (3).
The mix design parameters of the fast lanes of rutted sections (representing original construction conditions) werestatistically compared against those parameters of fast lanes nonrutted sections. The comparison was madeseparately for the bituminous wearing course (BWC) and the bituminous base course (BBC). The comparisonindicated (Tables 5 and 6) that
1. The GMB values of cores taken from fast lanes of rutted sections were significantly higher than the GMB values ofcores taken from fast lanes of nonrutted sections. This was true for BWC and BBC.
2. The in situ percent VMA and percent AV of fast lanes of rutted sections were significantly lower than the in situpercent VMA and percent AV of fast lanes of nonrutted sections. This was true for BWC. For BBC the percent AVfollowed the same trend, but the percent VMA showed no significant difference.
3. The percent VFB in cores obtained from fast lanes of rutted sections was significantly higher than the percentVFB in cores obtained from fast lanes of nonrutted sections. This was true for both BWC and BBC.
4. Other mix design parameters (asphalt content, maximum specific gravity, GMM, and GSB) did not show anysignificant differences.
5. The statistical risk of rutting is minimized (the probability of rutting becomes minimal) when
a. The in situ AV exceeds 5 percent, the in situ VMA exceeds 13 percent, or the in situ VFB is less than 60 percentfor BWC (19-mm top aggregate size) and
b. The in situ AV exceeds 5 percent, the in situ VMA exceeds 12.5 percent, or the in situ VFB is less than 50 percentfor BBC (39-mm top aggregate size).
STRENGTH AND STIFFNESS PARAMETERSStability, strength, and stiffness parameters [Hveem stability, diametral resilient modulus (0.1 Hz at 25癈 , 40癈 , and50癈 ), Marshall stability, Marshall flow, Shell creep at 40癈 and indirect tensile strength] were used to statisticallycompare the fast lanes of rutted sections and fast lanes of nonrutted sections (representing original constructionconditions). The diametral resilient modulus values of cores obtained from the fast lanes of nonrutted sections weresignificantly higher than the resilient modulus values of cores taken from the fast lanes of rutted sections (Table 7).Other parameters showed no statistically significant differences.

TABLE 3 Wearing Course Aggregate Gradations, Resilient Modulus, and Hveem Stability for NonruttedSections
IDENTIFICATION OF RUT-RESISTANT MIXESAsphalt mixes with a wide range of gradations, various binders [asphalt concrete (AC) 60/70, AC 40/50, and Novophaltand Polybelt modified asphalts], and various filler (limestone dust)-to-binder ratios were characterized by the FrenchCentral Bridge and Pavement Laboratory wheel tracking test as a pavement rutting simulator. Test procedures werethose described elsewhere (4,5). In addition to the wheel tracking test, the mixes were characterized by the Hveemstability, Marshall stability, resilient modulus at 25癈 , and indirect tensile strength tests.

TABLE 4 Wearing Course Aggregate Gradations, Resilient Modulus, and Hveem Stability for RuttedSections

TABLE 5 Mix Design Characteristics for Bituminous Wearing Course
Based on the assumption that rut-resistant mixes in the field will also be rut resistant during the wheel track test,the following results were obtained:
1. For the same asphalt binder and different aggregate characteristics, the Hveem stability test is the best indicatorof rut-resistant mixes (best correlated with the wheel tracking test in identifying rut-resistant mixes). This might explainwhy the Hveem stability test was not capable of distinguishing between rutted and nonrutted sections in the field (fastlane versus fast lane) whose aggregate characteristics were statistically identical.
2. For the same aggregate characteristics but different asphalt binders, the modulus of resilience test (followed bythe indirect tensile strength test) is the best indicator of rut-resistant mixes (best correlated with the wheel track test inidentifying rut-resistant mixes). This might also explain why the modulus of resilience test was capable of distinguishingbetween rutted and nonrutted sections in the field (fast lane versus fast lane) whose aggregate characteristics werestatistically identical and whose asphalt properties were different.
3. The arrangement described in Table 8 was suggested as a subjective identification of rut-resistant mixes.
4. Based on the criterion that the lower the rut depth measured by the wheel track test the better the rut resistance,
a. Mixes (surface or base) prepared us with AC 40/50 and then mixes prepared with AC 60/70 + 7 percent Polybelt,AC 60/70 + 4 percent Polybelt, and AC 60/70 only (control) were, respectively, the most rut-resistant mixes.b. The filler effect was statistically significant in improving the rut resistance of base course mixes. This was not thecase for wearing course mixes that showed little or no improvement.
SUBGRADE SOIL CHARACTERISTICSMany well-known pavement design methods assume that pavement rutting is a subgrade problem that is reflected onthe pavement surface. Among these are the Asphalt Institute method (1) and the AASHTO method (2). It was thereforeessential to investigate the subgrade characteristics of the study sections to detect correlations (if any) betweensubgrade strength (or weakness) and pavement rutting.

TABLE 6 Mix Design Characteristics for Bituminous Base Course
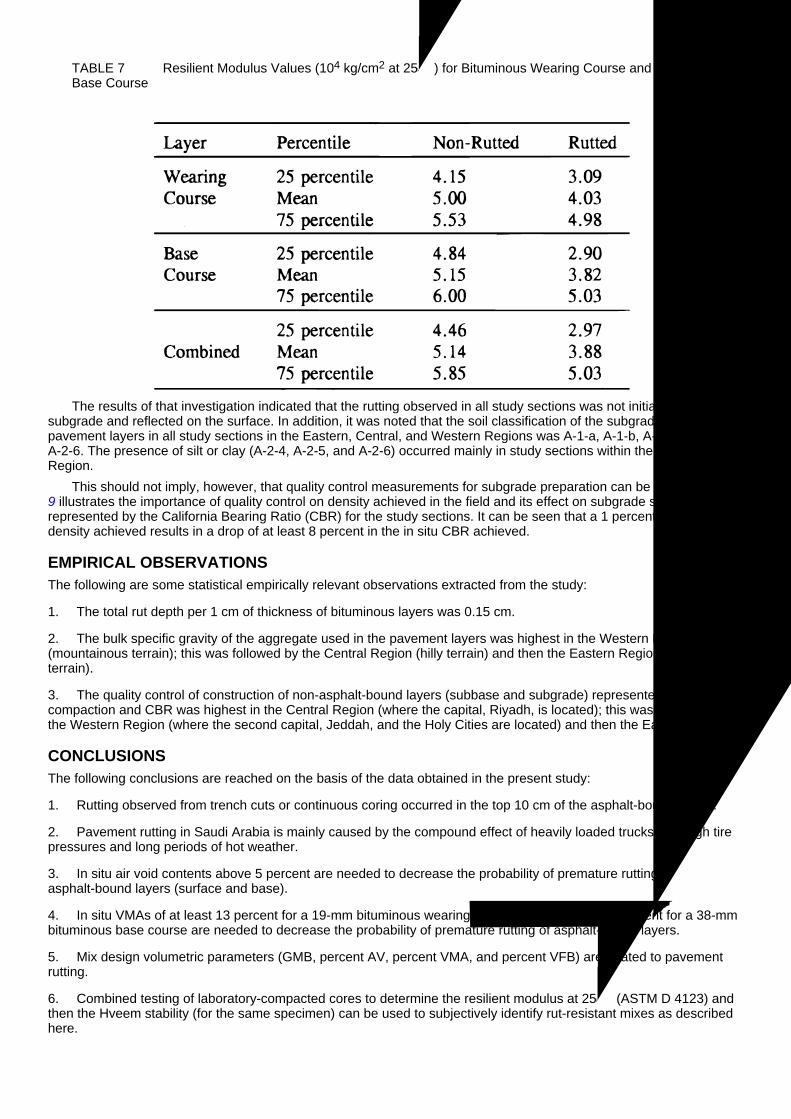
TABLE 7 Resilient Modulus Values (104 kg/cm2 at 25癈 ) for Bituminous Wearing Course and BituminousBase Course
The results of that investigation indicated that the rutting observed in all study sections was not initiated in thesubgrade and reflected on the surface. In addition, it was noted that the soil classification of the subgrades underpavement layers in all study sections in the Eastern, Central, and Western Regions was A-1-a, A-1-b, A-2-4, A-2-5, orA-2-6. The presence of silt or clay (A-2-4, A-2-5, and A-2-6) occurred mainly in study sections within the EasternRegion.
This should not imply, however, that quality control measurements for subgrade preparation can be eased. Figure9 illustrates the importance of quality control on density achieved in the field and its effect on subgrade strength asrepresented by the California Bearing Ratio (CBR) for the study sections. It can be seen that a 1 percent reduction indensity achieved results in a drop of at least 8 percent in the in situ CBR achieved.
EMPIRICAL OBSERVATIONSThe following are some statistical empirically relevant observations extracted from the study:
1. The total rut depth per 1 cm of thickness of bituminous layers was 0.15 cm.
2. The bulk specific gravity of the aggregate used in the pavement layers was highest in the Western Region(mountainous terrain); this was followed by the Central Region (hilly terrain) and then the Eastern Region (levelterrain).
3. The quality control of construction of non-asphalt-bound layers (subbase and subgrade) represented by percentcompaction and CBR was highest in the Central Region (where the capital, Riyadh, is located); this was followed bythe Western Region (where the second capital, Jeddah, and the Holy Cities are located) and then the Eastern Region.
CONCLUSIONSThe following conclusions are reached on the basis of the data obtained in the present study:
1. Rutting observed from trench cuts or continuous coring occurred in the top 10 cm of the asphalt-bound layers.
2. Pavement rutting in Saudi Arabia is mainly caused by the compound effect of heavily loaded trucks with high tirepressures and long periods of hot weather.
3. In situ air void contents above 5 percent are needed to decrease the probability of premature rutting ofasphalt-bound layers (surface and base).
4. In situ VMAs of at least 13 percent for a 19-mm bituminous wearing course and at least 12.5 percent for a 38-mmbituminous base course are needed to decrease the probability of premature rutting of asphalt-bound layers.
5. Mix design volumetric parameters (GMB, percent AV, percent VMA, and percent VFB) are related to pavementrutting.
6. Combined testing of laboratory-compacted cores to determine the resilient modulus at 25癈 (ASTM D 4123) andthen the Hveem stability (for the same specimen) can be used to subjectively identify rut-resistant mixes as describedhere.


TABLE 8 Subjective Identification of Rut-Resistant Mixes
RECOMMENDATIONSThe following recommendations can be made on the basis of the data obtained during the study phases:
1. Greater emphasis should be placed on the monitoring of truck gross weight and axle load limits, especially thosetrucks classified as 2S2, which have a history of violating load limits.
2. An approach to monitoring and controlling tire pressures and setting standards and penalties (similar to those forgross weight and axle load violations) is needed.
3. Whenever feasible the end of construction and the opening of new roads to traffic should not be scheduled during(or just before) the months of May to September.
4. Quality control of construction materials should include the monitoring of asphalt cement temperature versusconsistency characteristics.
5. Whenever possible, polymer-modified asphalt or hand asphalt grade (AC 40/50) is preferred over AC 60/70.
6. A minimum softening point for the asphalt mastic (asphalt + filler) of at least 65癈 should be specified.
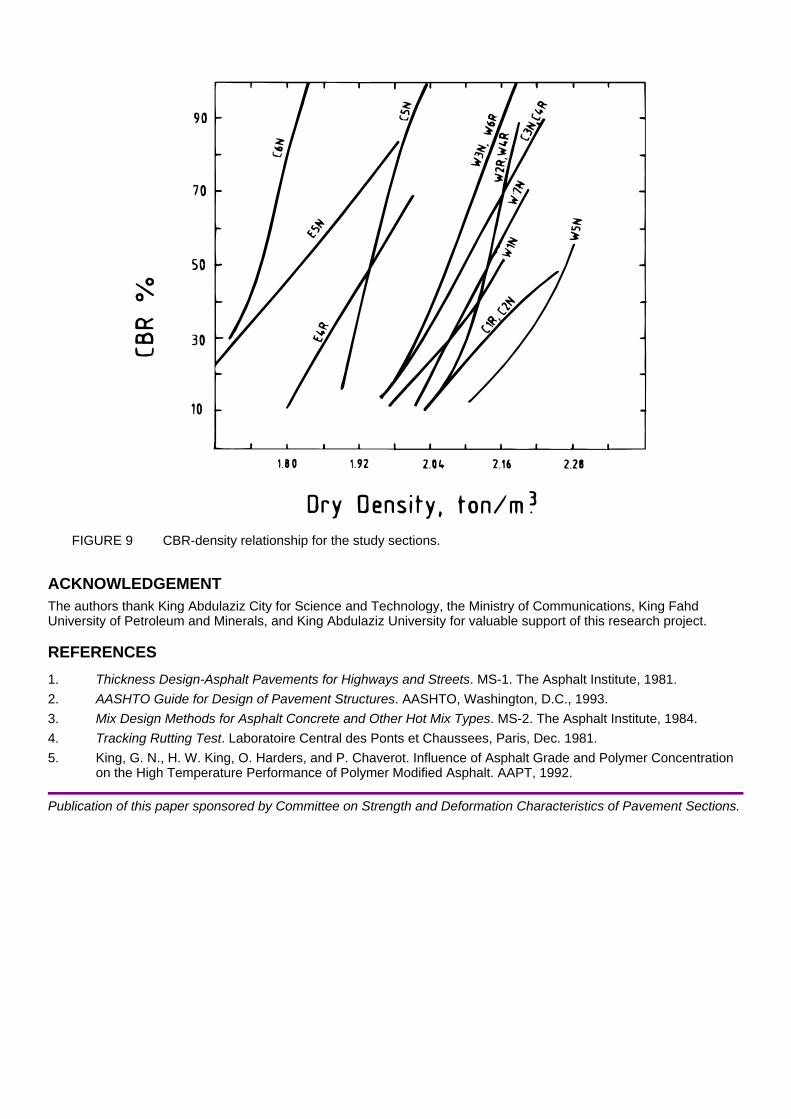
FIGURE 9 CBR-density relationship for the study sections.
ACKNOWLEDGEMENTThe authors thank King Abdulaziz City for Science and Technology, the Ministry of Communications, King FahdUniversity of Petroleum and Minerals, and King Abdulaziz University for valuable support of this research project.
REFERENCES1. Thickness Design-Asphalt Pavements for Highways and Streets. MS-1. The Asphalt Institute, 1981.2. AASHTO Guide for Design of Pavement Structures. AASHTO, Washington, D.C., 1993.3. Mix Design Methods for Asphalt Concrete and Other Hot Mix Types. MS-2. The Asphalt Institute, 1984.4. Tracking Rutting Test. Laboratoire Central des Ponts et Chaussees, Paris, Dec. 1981.5. King, G. N., H. W. King, O. Harders, and P. Chaverot. Influence of Asphalt Grade and Polymer Concentration
on the High Temperature Performance of Polymer Modified Asphalt. AAPT, 1992.
Publication of this paper sponsored by Committee on Strength and Deformation Characteristics of Pavement Sections.