Embed Size (px)
Citation preview
Rutting in Asphalt Pavement under Heavy Load and High Temperature
Zhang Qi-sen1, Chen Yu-liang2, Li Xue-lian3
1Professor and PhD supervisor. School of Communication and Transportation Engineering, Changsha University of Science and Technology, Chiling Road 45#, Changsha, Hunan, China, 410076.
E-mail: [email protected] 2Lecturer, School of Engineering & Architecture, East China Jiaotong University, Nanchang, Jiangxi,
China, 330013. E-mail: [email protected] 3Lecturer and PhD, School of Communication and Transportation Engineering, Changsha University
of Science and Technology, Chiling Road 45#, Changsha, Hunan, China, 410076. E-mail: [email protected]
ABSTRACT: Rutting is one of the main distresses in the asphalt pavements, especially in higher summer temperatures and/or under heavy loads. Efforts were made in this study to investigate rutting failures on Jing-Zhu expressway in China to determine the cause and the source of the rutting. The characteristic of the rutting on each asphalt pavement layer were analyzed by surveying the rutting depth, excavating transverse profile sections, and boring samples in the typical sections of expressways where different degrees of rutting damage were observed. It was found that 60% of the rutting was generated by the asphalt middle course layer and the remaining 40% came from the other surface layers, which was consistent with the mechanical analysis of the asphalt pavement that showed that the shear stress in middle asphalt course layer was the highest in magnitude, under load or temperature. With the combination of the indoor rutting tests on the samples from a corresponding location of the road shoulders, the influence of the high temperature stability of each asphalt pavement layer on rutting was analyzed using the method of ANOVA (Analysis Of Variance). The results indicated that the stability of the middle course layer impacted the rutting development the most. Finally, the relationship between the RD (rut depth) and the DS (dynamic stability) of each asphalt pavement layer was established using a nonlinear regression method. The governing criterion for the DS at the bottom course asphalt mixture was studied and recommendation made based on regression analysis. KEYWORDS: road engineering; asphalt pavement; variance analysis method; correlation analysis method; rutting; mechanical properties
39
Copyright ASCE 2009 GeoHunan International Conference 2009 Asphalt Material Characterization, Accelerated Testing, and Highway Management
Dow
nloa
ded
from
asc
elib
rary
.org
by
Mem
oria
l Uni
vers
ity o
f N
ewfo
undl
and
on 0
5/14
/13.
Cop
yrig
ht A
SCE
. For
per
sona
l use
onl
y; a
ll ri
ghts
res
erve
d.
INTRODUCTION
Rutting is the load-induced permanent deformation of asphalt pavements and may occur in any layer of a pavement structure (Witezak et al. 1997). It is one of the main distresses occurring in asphalt pavements and badly affects the comfort-ability, ride-ability, motorist safety, and general performance (Haas et al. 1994). The United States and other countries have taken rutting as one of the design criteria for asphalt pavements (AASHTO2002). In China, a large number of highway asphalt pavements have been constructed in recent years, while deflection is the only design criterion (Zu-kang Yao 2003). With the increase in both traffic volume and heavy overloading, the asphalt pavement rutting problem has become more and more serious. Under the function of such factors as heavy loading and bad weather that happened to some expressway asphalt pavements, serious damages in terms of rutting appeared shortly after opening to traffic (Qing-lin Sha 2001). With the combination of surveying the rutting on the southern section of Jing-Zhu Expressway, testing, and the statistical analysis, the impact of each asphalt pavement layer on the rutting formation were studied, and the relevant recommendations for improvement have been suggested in this paper. RUTTING SURVEY AND TRANSVERSE PROFILE ANALYSIS Rutting Investigation and Typical Section Selection
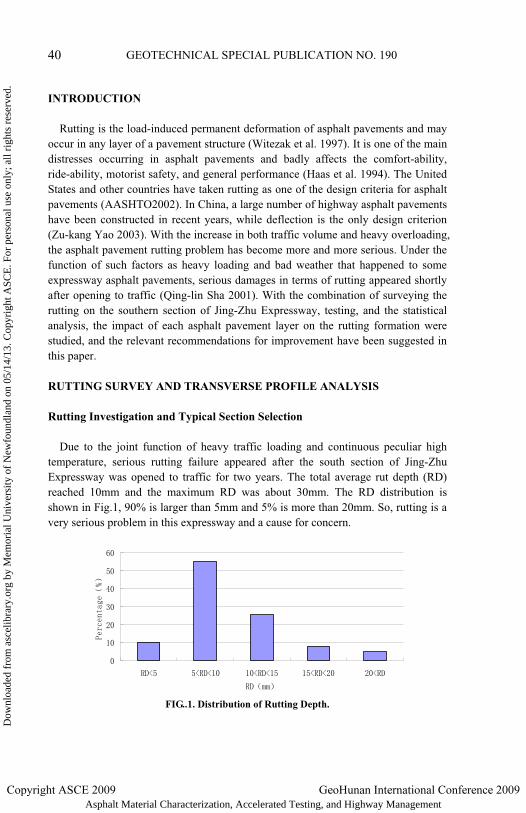
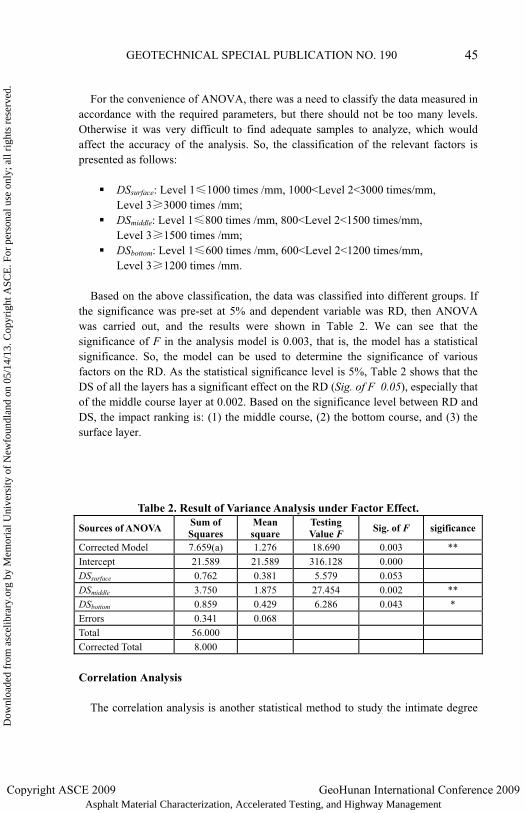
Due to the joint function of heavy traffic loading and continuous peculiar high temperature, serious rutting failure appeared after the south section of Jing-Zhu Expressway was opened to traffic for two years. The total average rut depth (RD) reached 10mm and the maximum RD was about 30mm. The RD distribution is shown in Fig.1, 90% is larger than 5mm and 5% is more than 20mm. So, rutting is a very serious problem in this expressway and a cause for concern.
FIG..1. Distribution of Rutting Depth.
GEOTECHNICAL SPECIAL PUBLICATION NO. 19040
Copyright ASCE 2009 GeoHunan International Conference 2009 Asphalt Material Characterization, Accelerated Testing, and Highway Management
Dow
nloa
ded
from
asc
elib
rary
.org
by
Mem
oria
l Uni
vers
ity o
f N
ewfo
undl
and
on 0
5/14
/13.
Cop
yrig
ht A
SCE
. For
per
sona
l use
onl
y; a
ll ri
ghts
res
erve
d.
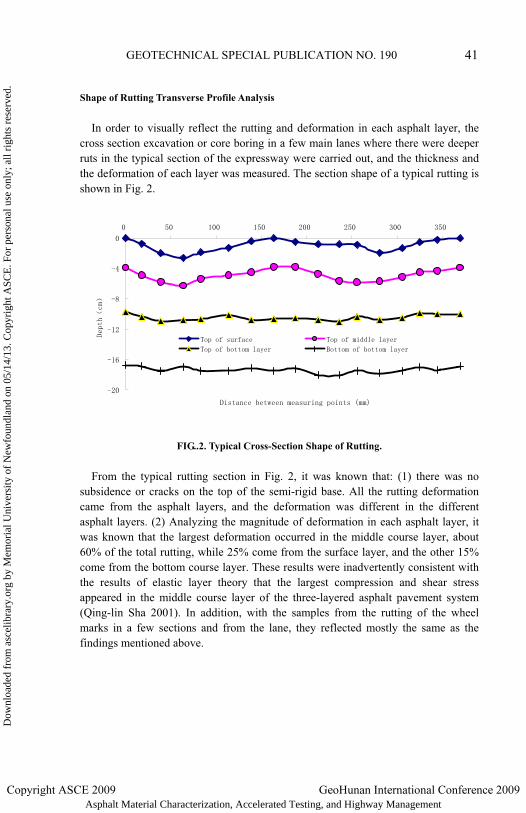
Shape of Rutting Transverse Profile Analysis In order to visually reflect the rutting and deformation in each asphalt layer, the
cross section excavation or core boring in a few main lanes where there were deeper ruts in the typical section of the expressway were carried out, and the thickness and the deformation of each layer was measured. The section shape of a typical rutting is shown in Fig. 2.
FIG..2. Typical Cross-Section Shape of Rutting.
From the typical rutting section in Fig. 2, it was known that: (1) there was no
subsidence or cracks on the top of the semi-rigid base. All the rutting deformation came from the asphalt layers, and the deformation was different in the different asphalt layers. (2) Analyzing the magnitude of deformation in each asphalt layer, it was known that the largest deformation occurred in the middle course layer, about 60% of the total rutting, while 25% come from the surface layer, and the other 15% come from the bottom course layer. These results were inadvertently consistent with the results of elastic layer theory that the largest compression and shear stress appeared in the middle course layer of the three-layered asphalt pavement system (Qing-lin Sha 2001). In addition, with the samples from the rutting of the wheel marks in a few sections and from the lane, they reflected mostly the same as the findings mentioned above.
GEOTECHNICAL SPECIAL PUBLICATION NO. 190 41
Copyright ASCE 2009 GeoHunan International Conference 2009 Asphalt Material Characterization, Accelerated Testing, and Highway Management
Dow
nloa
ded
from
asc
elib
rary
.org
by
Mem
oria
l Uni
vers
ity o
f N
ewfo
undl
and
on 0
5/14
/13.
Cop
yrig
ht A
SCE
. For
per
sona
l use
onl
y; a
ll ri
ghts
res
erve
d.
MECHANICAL ANALYSIS OF THE ASPHALT PAVEMENT
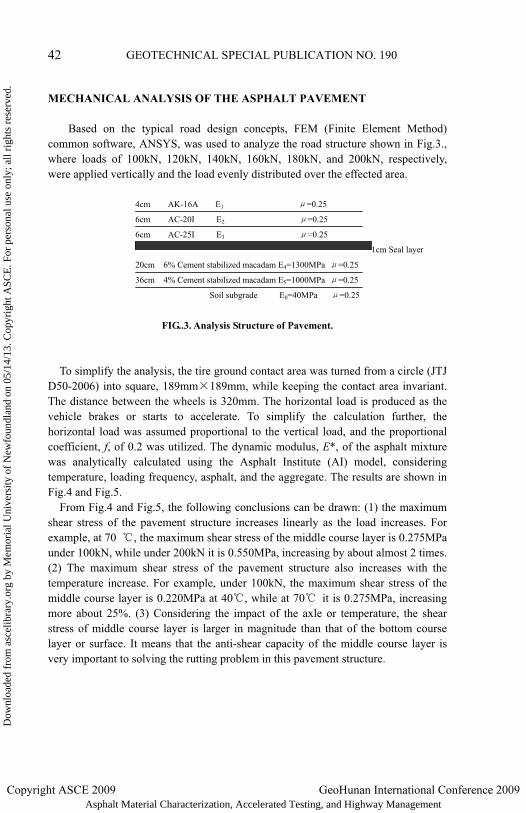
Based on the typical road design concepts, FEM (Finite Element Method) common software, ANSYS, was used to analyze the road structure shown in Fig.3., where loads of 100kN, 120kN, 140kN, 160kN, 180kN, and 200kN, respectively, were applied vertically and the load evenly distributed over the effected area.
4cm AK-16A E1 =0.25
6cm AC-20I E2 =0.25
6cm AC-25I E3 =0.25
1cm Seal layer
20cm 6% Cement stabilized macadam E4=1300MPa =0.25
36cm 4% Cement stabilized macadam E5=1000MPa =0.25
Soil subgrade E0=40MPa =0.25
FIG..3. Analysis Structure of Pavement.
To simplify the analysis, the tire ground contact area was turned from a circle (JTJ D50-2006) into square, 189mm 189mm, while keeping the contact area invariant. The distance between the wheels is 320mm. The horizontal load is produced as the vehicle brakes or starts to accelerate. To simplify the calculation further, the horizontal load was assumed proportional to the vertical load, and the proportional coefficient, f, of 0.2 was utilized. The dynamic modulus, E*, of the asphalt mixture was analytically calculated using the Asphalt Institute (AI) model, considering temperature, loading frequency, asphalt, and the aggregate. The results are shown in Fig.4 and Fig.5. From Fig.4 and Fig.5, the following conclusions can be drawn: (1) the maximum shear stress of the pavement structure increases linearly as the load increases. For example, at 70 , the maximum shear stress of the middle course layer is 0.275MPa under 100kN, while under 200kN it is 0.550MPa, increasing by about almost 2 times. (2) The maximum shear stress of the pavement structure also increases with the temperature increase. For example, under 100kN, the maximum shear stress of the middle course layer is 0.220MPa at 40 , while at 70 it is 0.275MPa, increasing more about 25%. (3) Considering the impact of the axle or temperature, the shear stress of middle course layer is larger in magnitude than that of the bottom course layer or surface. It means that the anti-shear capacity of the middle course layer is very important to solving the rutting problem in this pavement structure.
GEOTECHNICAL SPECIAL PUBLICATION NO. 19042
Copyright ASCE 2009 GeoHunan International Conference 2009 Asphalt Material Characterization, Accelerated Testing, and Highway Management
Dow
nloa
ded
from
asc
elib
rary
.org
by
Mem
oria
l Uni
vers
ity o
f N
ewfo
undl
and
on 0
5/14
/13.
Cop
yrig
ht A
SCE
. For
per
sona
l use
onl
y; a
ll ri
ghts
res
erve
d.
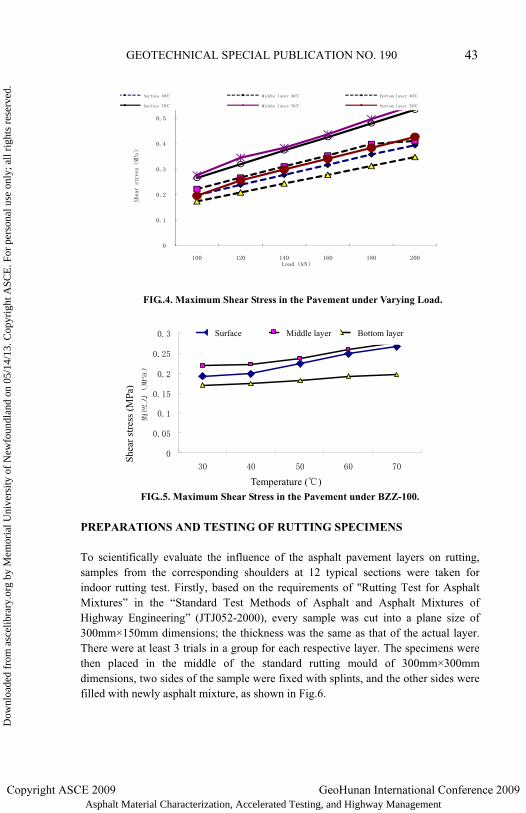
FIG..4. Maximum Shear Stress in the Pavement under Varying Load.
Surface Middle layer Bottom layer
Shea
r stre
ss (M
Pa)
FIG..5. Maximum Shear Stress in the Pavement under BZZ-100.
Temperature ( )
PREPARATIONS AND TESTING OF RUTTING SPECIMENS To scientifically evaluate the influence of the asphalt pavement layers on rutting, samples from the corresponding shoulders at 12 typical sections were taken for indoor rutting test. Firstly, based on the requirements of "Rutting Test for Asphalt Mixtures” in the “Standard Test Methods of Asphalt and Asphalt Mixtures of Highway Engineering” (JTJ052-2000), every sample was cut into a plane size of 300mm×150mm dimensions; the thickness was the same as that of the actual layer. There were at least 3 trials in a group for each respective layer. The specimens were then placed in the middle of the standard rutting mould of 300mm×300mm dimensions, two sides of the sample were fixed with splints, and the other sides were filled with newly asphalt mixture, as shown in Fig.6.
GEOTECHNICAL SPECIAL PUBLICATION NO. 190 43
Copyright ASCE 2009 GeoHunan International Conference 2009 Asphalt Material Characterization, Accelerated Testing, and Highway Management
Dow
nloa
ded
from
asc
elib
rary
.org
by
Mem
oria
l Uni
vers
ity o
f N
ewfo
undl
and
on 0
5/14
/13.
Cop
yrig
ht A
SCE
. For
per
sona
l use
onl
y; a
ll ri
ghts
res
erve
d.
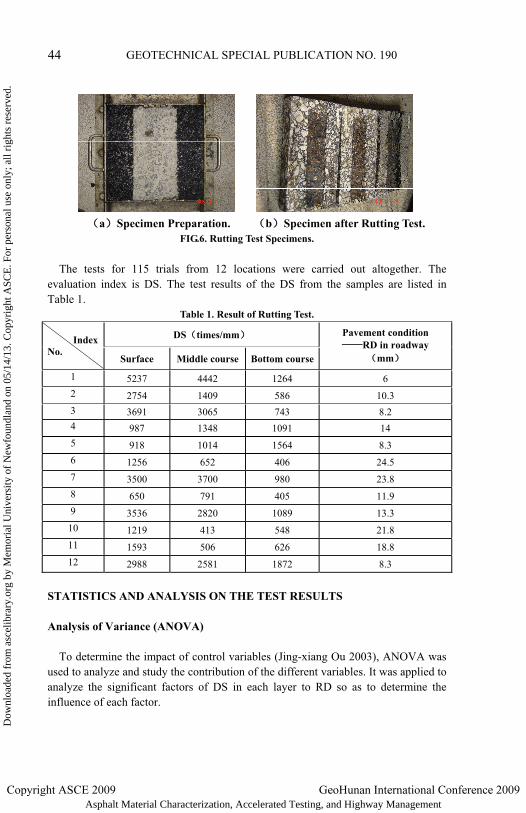
a Specimen Preparation. b Specimen after Rutting Test. FIG.6. Rutting Test Specimens.
The tests for 115 trials from 12 locations were carried out altogether. The
evaluation index is DS. The test results of the DS from the samples are listed in Table 1.
Table 1. Result of Rutting Test.
DS times/mm Index No.
Surface Middle course Bottom course
Pavement condition RD in roadway
mm
1 5237 4442 1264 6 2 2754 1409 586 10.3 3 3691 3065 743 8.2 4 987 1348 1091 14 5 918 1014 1564 8.3 6 1256 652 406 24.5 7 3500 3700 980 23.8 8 650 791 405 11.9 9 3536 2820 1089 13.3
10 1219 413 548 21.8 11 1593 506 626 18.8 12 2988 2581 1872 8.3
STATISTICS AND ANALYSIS ON THE TEST RESULTS Analysis of Variance (ANOVA)
To determine the impact of control variables (Jing-xiang Ou 2003), ANOVA was used to analyze and study the contribution of the different variables. It was applied to analyze the significant factors of DS in each layer to RD so as to determine the influence of each factor.
GEOTECHNICAL SPECIAL PUBLICATION NO. 19044
Copyright ASCE 2009 GeoHunan International Conference 2009 Asphalt Material Characterization, Accelerated Testing, and Highway Management
Dow
nloa
ded
from
asc
elib
rary
.org
by
Mem
oria
l Uni
vers
ity o
f N
ewfo
undl
and
on 0
5/14
/13.
Cop
yrig
ht A
SCE
. For
per
sona
l use
onl
y; a
ll ri
ghts
res
erve
d.
For the convenience of ANOVA, there was a need to classify the data measured in accordance with the required parameters, but there should not be too many levels. Otherwise it was very difficult to find adequate samples to analyze, which would affect the accuracy of the analysis. So, the classification of the relevant factors is presented as follows:
DSsurface: Level 1 1000 times /mm, 1000<Level 2<3000 times/mm,
Level 3 3000 times /mm; DSmiddle: Level 1 800 times /mm, 800<Level 2<1500 times/mm,
Level 3 1500 times /mm; DSbottom: Level 1 600 times /mm, 600<Level 2<1200 times/mm,
Level 3 1200 times /mm. Based on the above classification, the data was classified into different groups. If
the significance was pre-set at 5% and dependent variable was RD, then ANOVA was carried out, and the results were shown in Table 2. We can see that the significance of F in the analysis model is 0.003, that is, the model has a statistical significance. So, the model can be used to determine the significance of various factors on the RD. As the statistical significance level is 5%, Table 2 shows that the DS of all the layers has a significant effect on the RD (Sig. of F 0.05), especially that of the middle course layer at 0.002. Based on the significance level between RD and DS, the impact ranking is: (1) the middle course, (2) the bottom course, and (3) the surface layer.
Talbe 2. Result of Variance Analysis under Factor Effect.
Sources of ANOVA Sum of Squares
Mean square
Testing Value F Sig. of F sigificance
Corrected Model 7.659(a) 1.276 18.690 0.003 ** Intercept 21.589 21.589 316.128 0.000 DSsurface 0.762 0.381 5.579 0.053 DSmiddle 3.750 1.875 27.454 0.002 ** DSbottom 0.859 0.429 6.286 0.043 * Errors 0.341 0.068 Total 56.000 Corrected Total 8.000 Correlation Analysis
The correlation analysis is another statistical method to study the intimate degree
GEOTECHNICAL SPECIAL PUBLICATION NO. 190 45
Copyright ASCE 2009 GeoHunan International Conference 2009 Asphalt Material Characterization, Accelerated Testing, and Highway Management
Dow
nloa
ded
from
asc
elib
rary
.org
by
Mem
oria
l Uni
vers
ity o
f N
ewfo
undl
and
on 0
5/14
/13.
Cop
yrig
ht A
SCE
. For
per
sona
l use
onl
y; a
ll ri
ghts
res
erve
d.
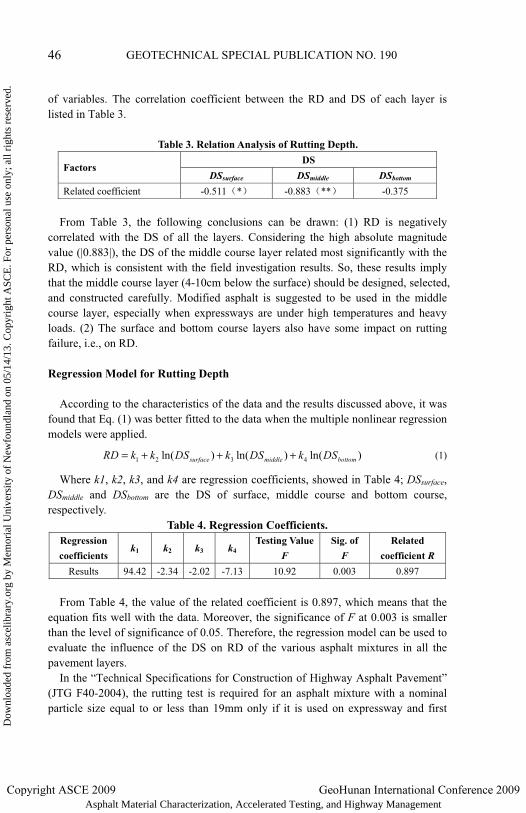
of variables. The correlation coefficient between the RD and DS of each layer is listed in Table 3.
Table 3. Relation Analysis of Rutting Depth.
DS Factors
DSsurface DSmiddle DSbottom Related coefficient -0.511 * -0.883 ** -0.375
From Table 3, the following conclusions can be drawn: (1) RD is negatively
correlated with the DS of all the layers. Considering the high absolute magnitude value (|0.883|), the DS of the middle course layer related most significantly with the RD, which is consistent with the field investigation results. So, these results imply that the middle course layer (4-10cm below the surface) should be designed, selected, and constructed carefully. Modified asphalt is suggested to be used in the middle course layer, especially when expressways are under high temperatures and heavy loads. (2) The surface and bottom course layers also have some impact on rutting failure, i.e., on RD.
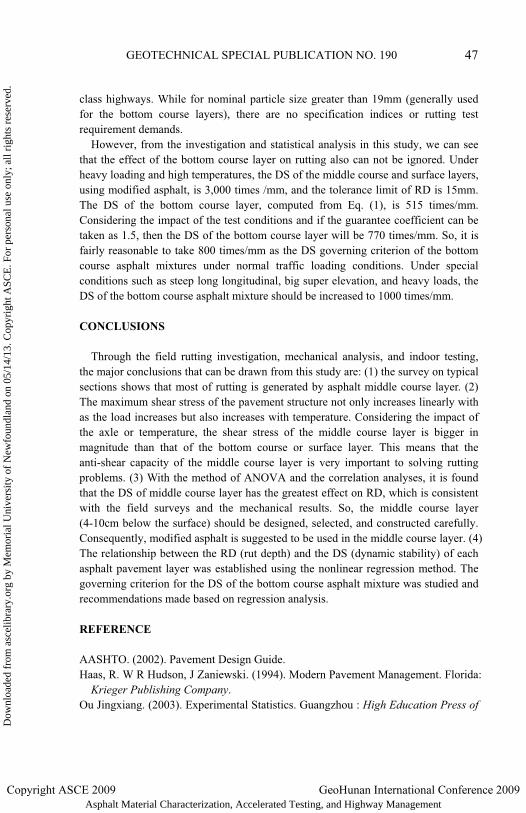
Regression Model for Rutting Depth
According to the characteristics of the data and the results discussed above, it was found that Eq. (1) was better fitted to the data when the multiple nonlinear regression models were applied.
1 2 3 4ln( ) ln( ) ln( )surface middle bottomRD k k DS k DS k DS= + + + (1)
Where k1, k2, k3, and k4 are regression coefficients, showed in Table 4; DSsurface, DSmiddle and DSbottom are the DS of surface, middle course and bottom course, respectively.
Table 4. Regression Coefficients. Regression coefficients
k1 k2 k3 k4 Testing Value
F Sig. of
F Related
coefficient R Results 94.42 -2.34 -2.02 -7.13 10.92 0.003 0.897
From Table 4, the value of the related coefficient is 0.897, which means that the
equation fits well with the data. Moreover, the significance of F at 0.003 is smaller than the level of significance of 0.05. Therefore, the regression model can be used to evaluate the influence of the DS on RD of the various asphalt mixtures in all the pavement layers.
In the “Technical Specifications for Construction of Highway Asphalt Pavement” (JTG F40-2004), the rutting test is required for an asphalt mixture with a nominal particle size equal to or less than 19mm only if it is used on expressway and first
GEOTECHNICAL SPECIAL PUBLICATION NO. 19046
Copyright ASCE 2009 GeoHunan International Conference 2009 Asphalt Material Characterization, Accelerated Testing, and Highway Management
Dow
nloa
ded
from
asc
elib
rary
.org
by
Mem
oria
l Uni
vers
ity o
f N
ewfo
undl
and
on 0
5/14
/13.
Cop
yrig
ht A
SCE
. For
per
sona
l use
onl
y; a
ll ri
ghts
res
erve
d.
class highways. While for nominal particle size greater than 19mm (generally used for the bottom course layers), there are no specification indices or rutting test requirement demands.
However, from the investigation and statistical analysis in this study, we can see that the effect of the bottom course layer on rutting also can not be ignored. Under heavy loading and high temperatures, the DS of the middle course and surface layers, using modified asphalt, is 3,000 times /mm, and the tolerance limit of RD is 15mm. The DS of the bottom course layer, computed from Eq. (1), is 515 times/mm. Considering the impact of the test conditions and if the guarantee coefficient can be taken as 1.5, then the DS of the bottom course layer will be 770 times/mm. So, it is fairly reasonable to take 800 times/mm as the DS governing criterion of the bottom course asphalt mixtures under normal traffic loading conditions. Under special conditions such as steep long longitudinal, big super elevation, and heavy loads, the DS of the bottom course asphalt mixture should be increased to 1000 times/mm.
CONCLUSIONS
Through the field rutting investigation, mechanical analysis, and indoor testing, the major conclusions that can be drawn from this study are: (1) the survey on typical sections shows that most of rutting is generated by asphalt middle course layer. (2) The maximum shear stress of the pavement structure not only increases linearly with as the load increases but also increases with temperature. Considering the impact of the axle or temperature, the shear stress of the middle course layer is bigger in magnitude than that of the bottom course or surface layer. This means that the anti-shear capacity of the middle course layer is very important to solving rutting problems. (3) With the method of ANOVA and the correlation analyses, it is found that the DS of middle course layer has the greatest effect on RD, which is consistent with the field surveys and the mechanical results. So, the middle course layer (4-10cm below the surface) should be designed, selected, and constructed carefully. Consequently, modified asphalt is suggested to be used in the middle course layer. (4) The relationship between the RD (rut depth) and the DS (dynamic stability) of each asphalt pavement layer was established using the nonlinear regression method. The governing criterion for the DS of the bottom course asphalt mixture was studied and recommendations made based on regression analysis. REFERENCE AASHTO. (2002). Pavement Design Guide. Haas, R. W R Hudson, J Zaniewski. (1994). Modern Pavement Management. Florida:
Krieger Publishing Company. Ou Jingxiang. (2003). Experimental Statistics. Guangzhou : High Education Press of
GEOTECHNICAL SPECIAL PUBLICATION NO. 190 47
Copyright ASCE 2009 GeoHunan International Conference 2009 Asphalt Material Characterization, Accelerated Testing, and Highway Management
Dow
nloa
ded
from
asc
elib
rary
.org
by
Mem
oria
l Uni
vers
ity o
f N
ewfo
undl
and
on 0
5/14
/13.
Cop
yrig
ht A
SCE
. For
per
sona
l use
onl
y; a
ll ri
ghts
res
erve
d.
Guangdong. SHA Qinglin. (2001). Premature Damage Phenomena and Preventive Techniques in Expressway Asphalt Pavement. Beijing: People's Transportation Press. Witczak, M. W., Von Quintas, H., and Schwartz, C. W. (1997). “Superpave support
and performance models management: Evaluation of the SHRP performancemodels system.” Proc., Eighth Int. Conf. on Asphalt Pavements, Vol. III, 175–195.
YAO Zukang. (2003). “A Review on Design Criteria of Asphalt Pavements” Highway, 43-49.
JTJ D50. (2006). Design Specifications of Highway Asphalt Pavement. Beijing: People's Transportation Press.
JTG F40-2004 Construction Specifications of Highway Asphalt Pavement[S]. Beijing: People's Transportation Press.
GEOTECHNICAL SPECIAL PUBLICATION NO. 19048
Copyright ASCE 2009 GeoHunan International Conference 2009 Asphalt Material Characterization, Accelerated Testing, and Highway Management
Dow
nloa
ded
from
asc
elib
rary
.org
by
Mem
oria
l Uni
vers
ity o
f N
ewfo
undl
and
on 0
5/14
/13.
Cop
yrig
ht A
SCE
. For
per
sona
l use
onl
y; a
ll ri
ghts
res
erve
d.