Embed Size (px)
Citation preview
Neethu Roy Department of Civil Engineering Mar Baselios College of
Engineering and TechnologyThiruvananthapuram, Kerala, Indiae-mail : [email protected]
—When flexible pavements are subjected to repeated traffic loading, the asphalt concrete (AC) mixture deforms. This, along with deformations in other layers of pavement, manifests in the form of rutting. Theoretical and laboratory investigations as well as field data and the results of accelerated performance tests by various researchers shows that asphalt concrete layer contributes largely to the total deformation. Recent advancements in material and distress characterisation use flow number test to estimate the rutting characteristics of asphalt concrete mixtures. Flow number (or repeated creep and recovery) test is in the developing stage and the test protocols and post-processing of data are not yet fully understood. On the other hand, simulative tests such as wheel tracking test are the so called “torture tests” which qualitatively ranks the binder in terms of their rut resistance. Correlations between flow number test and rut wheel test are scant. This study reports the recent investigations carried out at IIT Madras on flow number test and rut wheel testing and the possible correlations among them.
I. INTRODUCTIONThe rutting manifest on the surface of asphalt concrete
pavements is due to the sum total of the irrecoverable deformation in all the pavement layers. Each of the pavement layers contribute to such behaviour and due to the fact that all the layers are stacked one over the other, there is a strong inter–dependency when it comes to quantifying rutting. The two issues to be understood here are the structural response and the material response. The difference between asphalt pavement and other structures lies in the manner in which the structure is analysed and interpreted. The investigations related to rutting in pavements could be carried out by collection of large amount of data from the field or by simulating the axle load repetitions on a test stretch or slab in the laboratory. One could also carry out experimental investigation on asphalt concrete samples and relate their performance with the data collected from the field. The main idea however is to design and carry out experiments which are as closely related to the performance of the asphalt concrete mixture in the pavement structure. It is understood that rutting as seen from the field observation is a process which takes years of trafficking. However, one should be in a position to simulate a model pavement using appropriate material parameters determined from the experimental investigations.
The material response is typically characterised by an appropriate constitutive relationship and the input for such relationships or ‘models’ are the results of a wide variety of experimental investigations.
II. INDIAN SCENARIOAs per the current Indian specifications for asphalt
concrete mix characterisation, the binders are graded based on viscosity measured at 60oC and the mixture design is carried out using Marshall method [1]. Also, the code of practice for design of asphalt concrete pavements (IRC: 37-2012, 2012) lists resilient modulus values measured at 20, 25, 30, 35 and 40oC for asphalt concrete mixes, namely, Bituminous Concrete (BC), Bituminous Macadam (BM) and Dense Bituminous Macadam (DBM) fabricated with viscosity graded bitumen such as VG10, VG20, VG30, VG40 or modified binders [2]. As per IRC: 37-2012 (2012), the rutting distress could be controlled by limiting the vertical compressive strain on top of subgrade [2]. However, IRC:37-2012 (2012) guidelines ignores the rutting in the asphalt layers and recommends that rut resistant asphalt concrete mixes using higher viscosity grade binder or modified binder should be provided to limit the rutting in the asphalt concrete layer due to ‘secondary compaction’ and ‘shear deformation’. Factors such as air voids, amount of confinement pressure, grade of binder and temperature play a critical role on the permanent deformation of asphalt concrete mixtures. At this point of time, very little experimental data is available to quantify the densification and shear flow of asphalt mixtures independently.
III. RECENT DEVELOPMENTSTo address the issues associated with the material
characterisation, systematic research and development have been initiated throughout the world. In North America, these attempts have resulted in the Superpave method of mix design and analysis system [3]. The Superpave mix design and analysis method for hot mix asphalt (HMA) mixtures was developed under the aegis of Strategic Highway Research Program (SHRP) of United States of America to provide a rational basis for mix and structural design. It consists of three stages, namely, materials selection for the asphalt binder andaggregate, aggregate gradation design, and volumetric analysis on specimens compacted using the Superpave Gyratory
International Journal of Scientific & Engineering Research, Volume 5, Issue 7, July-2014 ISSN 2229-5518 593
IJSER © 2015 http://www.ijser.org
IJSER
Compactor (SGC) [4]. However it was found that such a volumetric mixture design method alone was insufficient to ensure reliable mixture performance in the pavement structure over a wide range of traffic and climatic conditions. The important requirement was in designing robust mechanical tests for asphalt concrete mixtures in the laboratory and relating the output of the same to the distress prediction models for the pavements. Such developments led to a variety of asphalt mixture tests and a review of current state of asphaltperformance tests can be found in Dave and Koktan (2011)[5]. The most important among these attempts was the Asphalt Mixture Performance Tests (AMPTs) developed as part of the National Cooperative Highway Research Program (NCHRP) project 9-19 [4]. Three parameters were identified to evaluate the response of asphalt concrete mixtures and they are dynamic modulus (|E*|) and flow number (Fn) as per AASHTO: TP-79, 2010 [6], and flow time (Ft) [4].
Asphalt concrete mixtures are laid and compacted to an air void content of 6 to 8%. This high air void content causes the material to densify under loading and this can lead to irrecoverable deformations on the surface. The material may also flow depending on various factors such as temperature,aggregate granular matrix, asphalt mastic and the state of stresses to which it is subjected. However, when the material has high air void content, deformations due to densification can be a predominant cause of rutting. Once the material reaches the so called 'refusal air void content’, any further loading may cause deformations predominantly due to shear flow. This process of deformation due to densification and shear flow generally follows a three stage creep response. In the primary stage, the material undergoes an increased strain with loading at a decreased rate. Then the material attains a stage of constant creep rate, which is termed as the secondary stage. At certain stage, the material starts deforming at an increased rate, and this eventually leads to complete collapse of the material. In pavement engineering, this stage when the material flows at an increased rate is considered critical and hence the point at which this happens is identified as flow point. Flow point is determined either for a constant creep test (flow time test) or a repeated creep and recovery test (flow number test). In a flow time test, an asphalt concrete mix specimen is subjected to a static uniaxial or triaxial load along with an axial contact load (approximately 5% of axial load). Here the accumulated deformation generally follows a three stage curve under certain conditions of loading duration and intensity, confinement pressure and temperature. However, a flow time test is less representative of the loading condition in the field as the material is not allowed to recover. A flow number test is a dynamic creep and recovery test where the specimen is subjected to repeated load cycles consisting of 0.1 s haversine pulse and 0.9 s rest time under confined or unconfined conditions [6]. Here also, it is hypothesised that the accumulated deformation follows a three stage creep curve. The number of load cycles corresponding to the onset of tertiary zone is defined as flow number and has been recommended as an indicator of rutting of asphalt concretemixtures [4].
The protocols for flow time and flow number tests are still in the development stage and their potential for evaluating
rutting has to be verified. The flow number test was designed to give failure criteria qualitatively for a variety of mixtures with no indication of individual test results correlated to field performance.
On the other hand, the wheel tracker test is being used by pavement engineers for several years as a ‘laboratory-accelerated loading facility’ to qualitatively rank a variety of mixtures. Correlations, if they exist, between flow number and the wheel tracker test data, can lead to the development of a proper analysis and design method of AC mixtures, considering the aspect of rutting. Hence the objective of this study is to analyse the applicability of flow number test in predicting the three stage creep behaviour of asphalt concrete mixture. Also, the work intends to verify the correlations of flow number test data with rut wheel testing.
IV. EXPERIMENTAL PLAN
A. Materials and Test Specimen
The mid-gradation of a wearing course called Bituminous Concrete Grade 1 (BC-Grade1) with nominal maximum aggregate size of 19 mm, as per the Indian specifications, MoRTH-2013 was chosen for the study [1]. An unmodified binder of Viscosity Grade (VG 30) provided by Chennai Petroleum Corporation Limited, India was used. A binder content of 5% was chosen for fabrication of specimens. The pertinent properties of the binder used in this investigation are listed in Table 1.
TABLE 1. PROPERTIES OF BINDER USED
Characteristics Value Specification Limits [7]
Method oftest, IndianStandards No.
Absolute viscosity at 60oC, Poise 2703 2400 - 3600 IS 1206 (Part 2)
Kinematic viscosity at 135oC, cSt 531 350 (Min.) IS 1206 (Part 3)
Penetration at 25oC, 100 g, 5 s, 0.1 mm 58 45 (Min.) IS 1203
Softening point (R & B), oC 55 47 (Min.) IS 1205
Ductility at 25oC after rolling thin film oven test, cm 100+ 40 (Min.) IS 1208
Viscosity ratio at 60oC after rolling thin film oven test 3.36 4.0 (Max.) IS 1206 (Part 2)
B. Specimen Preparation
The BC mixture was prepared in accordance with theAASHTO practice to attain Superpave Gyratory Compacted(SGC) specimens of height 170 mm [8]. The mixture was short-term aged at the mixing temperature for 4 hours ± 5minutes before casting [9]. The samples were fabricated at two air voids content, one at 7% and another at 2% air voids. These two air voids signify the initial in place air voids and the terminal "refusal" air voids. To achieve test specimenswith target air void contents of 7 ± 0.3 and 2 ± 0.3%, trial specimens were prepared by varying the number of gyrations. The SGC specimen of size 150 mm diameter and 170 mm height was then cored to get test specimen of 100 mm
International Journal of Scientific & Engineering Research, Volume 5, Issue 7, July-2014 ISSN 2229-5518 594
IJSER © 2015 http://www.ijser.org
IJSER
diameter. 10 mm was sawn from each end of the cored out portion using a twin-saw arrangement such that the end flatness was within the tolerance limit of 0.5 mm and end perpendicularity was 1.0 mm [10].
C. Test Scheme
The current test protocol for flow number suggests a testduration of 20,000 cycles. However from trial tests, it was observed that a dense mix such as Bituminous ConcreteGrade-1 will not undergo any tertiary stage of creep in 20,000 cycles unless the deviator stress applied is very high (of the order of 600 kPa). But, failure due to creep occurs by the build-up of deformation at sufficiently small rate and the laboratory experiments to mimic such failures should apply sufficiently small load levels. Hence in this study the flow number test was conducted for 100,000 cycles and the deviatoric stress chosen was 200 kPa. To study the effect of temperature, confinement condition and air void of the specimen, the experimental plan used for flow number test is shown in Table 2. Each identical sample was tested for repeatability. The test scheme thus resulted in testing 36 numbers of cylindrical specimens. Rut wheel testing was carried out on a dry wheel tracker for 2% and 7% air void specimens at two temperatures of 40 and 55oC.
TABLE 2. FLOW NUMBER TEST SCHEME
Attribute Value
Air voids of specimen, % 2 and 7
Test temperature, oC 20, 40 and 55
Confinement pressure, kPa 0, 100 and 200
V. TEST RESULTS AND DISCUSSION
A. Flow Number Test
The flow number test was carried out using an AsphaltMixture Performance Test (AMPT) equipment. The existing AMPT software could perform flow number test upto 20,000 cycles only. M/s IPC Global provided a beta version of the software which could run the experiment for 100,000 cycles. The data acquisition system captured the accumulated irrecoverable deformation at each cycle in the axial direction, maximum cyclic stress, pressure and cell temperature at every cycle. In this experimental study using 2 and 7% air void specimens, it was found that the, within laboratory repeatability was less than 20%.
B. Variation of Flow Data with Test Conditions
The flow number test results are analysed and some sample plots are shown here, across different confinement conditions and temperatures, for the 2% and 7% air void specimens (Figures 1 to 4).
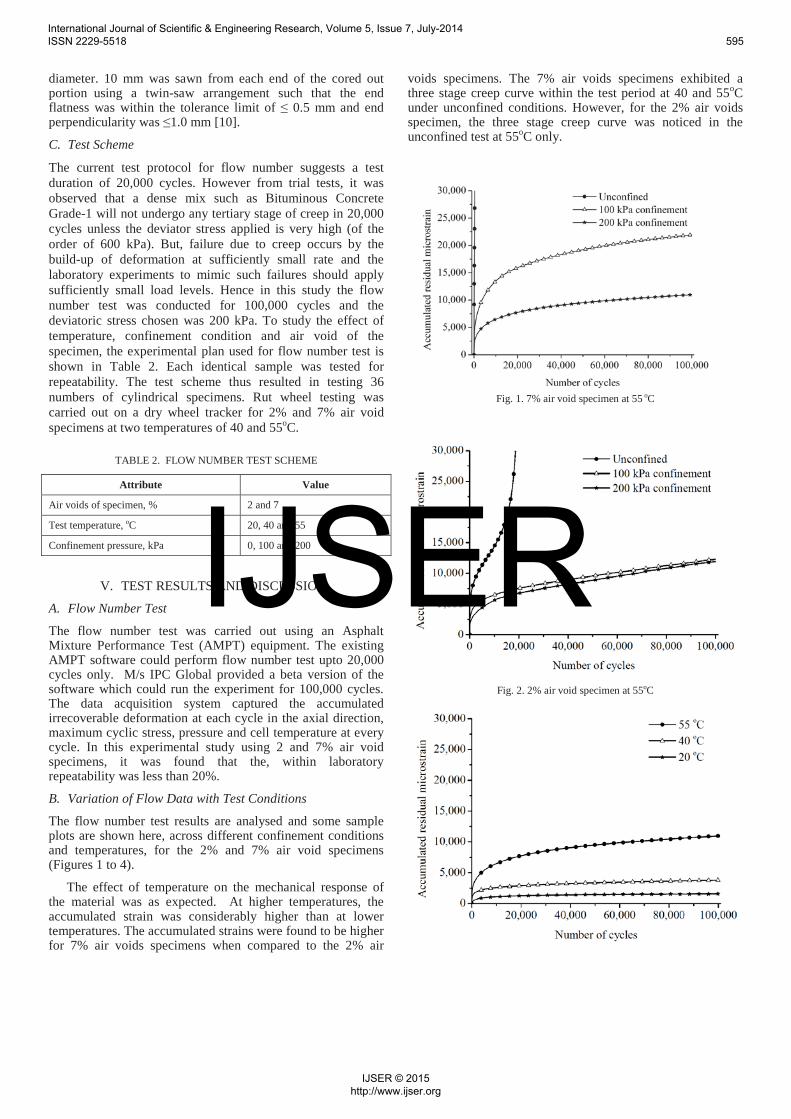
The effect of temperature on the mechanical response of the material was as expected. At higher temperatures, the accumulated strain was considerably higher than at lower temperatures. The accumulated strains were found to be higher for 7% air voids specimens when compared to the 2% air
voids specimens. The 7% air voids specimens exhibited a three stage creep curve within the test period at 40 and 55oCunder unconfined conditions. However, for the 2% air voids specimen, the three stage creep curve was noticed in the unconfined test at 55oC only.
Fig. 1. 7% air void specimen at 55 oC
Fig. 2. 2% air void specimen at 55oC
International Journal of Scientific & Engineering Research, Volume 5, Issue 7, July-2014 ISSN 2229-5518 595
IJSER © 2015 http://www.ijser.org
IJSER

Fig. 3. 7% air void specimen at 200 kPa confinement
Fig. 4. 2% air void specimen at 200 kPa confinement
The confinement conditions have a significant influence on the response of the mixtures. As the confining pressure increased, the strains were found to reduce drastically when compared with testing under unconfined conditions. Tertiary stage was not noticed in the 100 and 200 kPa confined tests. Hence, the strain at 100,000th cycle was used to study the significant difference in performance of mixtures, if any, when tested under 100 and 200 kPa confinement levels. It was observed that under 200 kPa confinement condition, the creep strain was less than the 100 kPa confinement condition, but no substantial difference was noticed. However, considerable difference was observed when 7% air voids specimen wastested at 55oC under 100 and 200 kPa confinement levels. Acomparison of the accumulated residual strain at the end of 100,000 test cycles is provided in Table 3.
TABLE 3: ACCUMULATED RESIDUAL STRAIN AT THE END OF 100,000 TEST CYCLES
Temperature, oC
Confinement, kPa
Accumulated residual microstrain
200 1490 3870100 920 1730200 740 1580
400 4950 --100 2360 5990200 1210 3800
550 -- --100 12290 21930200 11900 10970
A comparison of the response of the 2% and 7% air void specimens at certain test conditions is shown in Figures 5 and 6.
Fig. 5. Test at 55 oC under unconfined condition
Fig. 6. Test at 55 oC under 200 kPa confinement
The 7% air voids specimens exhibited higher strains duringthe entire test duration of 100,000 cycles than the 2% air voids specimen at all tests under unconfined condition. However, a different kind of response was noticed in the flow number test at 55oC under 200 kPa confinement, at around 70,000 test cycles. The accumulated strain in the 2% air voids specimen started increasing at a steeper rate than the 7% air voids specimen. This points out the issues regarding the test duration and the deviatoric load and confinement pressure to be adopted in the flow number test.
VI. IDENTIFICATION OF THREE STAGES OF CREEP INFLOW NUMBER DATA
To estimate the three stage of creep in the flow number data, an approach adopted by Zhou et al. (2004) was used[11]. The creep and recovery response of asphalt concrete mixtures (flow number test) is expected to show a three stage creep pattern. It can be hypothesized that the three stages, namely, primary, secondary and tertiary could be used to
International Journal of Scientific & Engineering Research, Volume 5, Issue 7, July-2014 ISSN 2229-5518 596
IJSER © 2015 http://www.ijser.org
IJSER
characterise the asphalt concrete layer of the pavement structure. One of the earliest attempts to model such creep behaviour of ‘materials possessing both viscous and elastic properties’ such as Stearine pitch and asphalt was carried out by Nutting (1921) [12]. In his paper a general relation for deformation, time and stress was given as s = atnFm. One can recover the elastic response by setting n = 0 and m = 1 and viscous response by setting n = 1 and m = 1. Many studies can be found in literature which uses Nutting’s equation to describe the creep response of viscoelastic materials [13, 14].To distinguish the three stage patterns, an approach similar to Nutting, as suggested by Zhou et al. (2004) was used. In this approach the three stage “permanent” strain behaviour is explained using three separate empirical models for each stage. The power law model as given by Eq. 1 is used to describe the primary stage of the permanent strain curve. For the secondary stage a linear model is used, as given by Eq. 2. The strain data after the secondary stage is modelled using an exponential relation given by Eq. 3. = (1)= + ( ) (2)
where == + ( ) (3)
where = + ( )where is the permanent strain, a, b, c, d and f are regression constants, N is number of test cycles, is the number of load repetition corresponding to the initiation of the secondary stage, is number of load repetition corresponding to the initiation of the tertiary stage and and are permanent strains corresponding to the initiation of secondary stage and tertiary stage respectively. In order to estimate the cycle corresponding to initiation of secondary and tertiary stage, the entire set (say K numbers) of permanent strain data was first fitted using the power law model (Eq. 1) and the regression coefficients (a and b) were estimated. The strain corresponding to the last load cycle (Kth cycle) was computed using the power law expression given by Eq. 1 using the estimated regression coefficients. This predicted permanent strain was compared with the measured accumulated strain at the same cycle and if the deviation between them was less than 3%, then it is understood that Eq. 1 can completely explain the data and hence the experimental data is still in the primary stage. If the variation was more than 3%, then (k-1) data sets were used for fitting the power law. The process was repeated and the number of cycle at which the difference between predicted and measured value became less than 3% was taken as the onset of secondary stage ( ). In a similar manner, the onset of tertiary stage was estimated by fitting a straight line (given by Eq. 2) for data beyond .
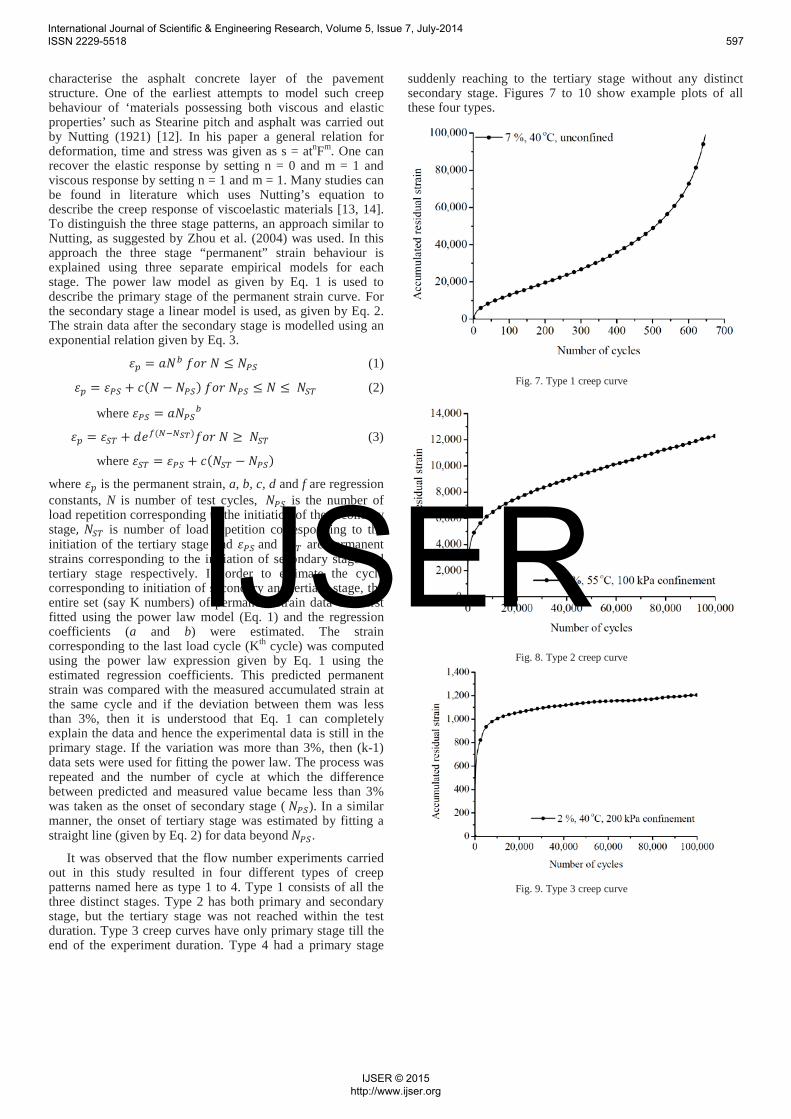
It was observed that the flow number experiments carried out in this study resulted in four different types of creep patterns named here as type 1 to 4. Type 1 consists of all the three distinct stages. Type 2 has both primary and secondary stage, but the tertiary stage was not reached within the test duration. Type 3 creep curves have only primary stage till the end of the experiment duration. Type 4 had a primary stage
suddenly reaching to the tertiary stage without any distinct secondary stage. Figures 7 to 10 show example plots of all these four types.
Fig. 7. Type 1 creep curve
Fig. 8. Type 2 creep curve
Fig. 9. Type 3 creep curve
International Journal of Scientific & Engineering Research, Volume 5, Issue 7, July-2014 ISSN 2229-5518 597
IJSER © 2015 http://www.ijser.org
IJSER
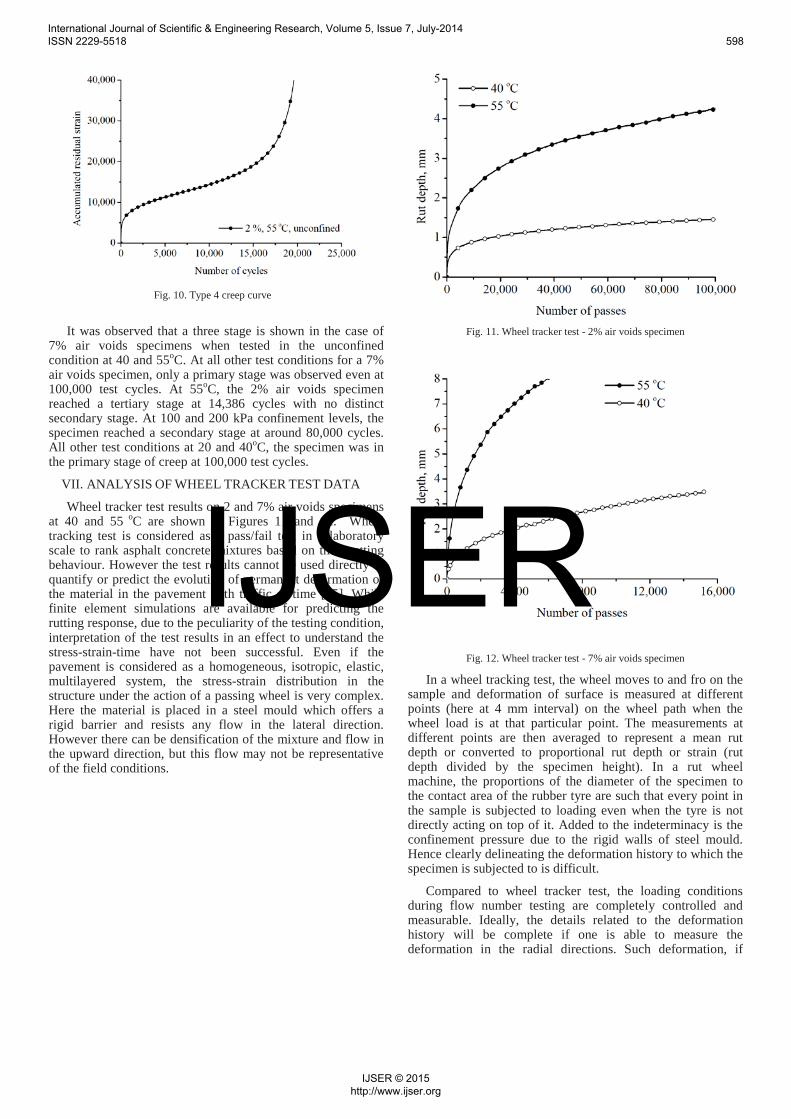
Fig. 10. Type 4 creep curve
It was observed that a three stage is shown in the case of 7% air voids specimens when tested in the unconfined condition at 40 and 55oC. At all other test conditions for a 7% air voids specimen, only a primary stage was observed even at 100,000 test cycles. At 55oC, the 2% air voids specimen reached a tertiary stage at 14,386 cycles with no distinct secondary stage. At 100 and 200 kPa confinement levels, the specimen reached a secondary stage at around 80,000 cycles. All other test conditions at 20 and 40oC, the specimen was in the primary stage of creep at 100,000 test cycles.
VII. ANALYSIS OF WHEEL TRACKER TEST DATA
Wheel tracker test results on 2 and 7% air voids specimens at 40 and 55 oC are shown in Figures 11 and 12. Wheel tracking test is considered as a pass/fail test in a laboratory scale to rank asphalt concrete mixtures based on their rutting behaviour. However the test results cannot be used directly to quantify or predict the evolution of permanent deformation of the material in the pavement with traffic or time [15]. While finite element simulations are available for predicting the rutting response, due to the peculiarity of the testing condition, interpretation of the test results in an effect to understand the stress-strain-time have not been successful. Even if the pavement is considered as a homogeneous, isotropic, elastic, multilayered system, the stress-strain distribution in the structure under the action of a passing wheel is very complex. Here the material is placed in a steel mould which offers arigid barrier and resists any flow in the lateral direction. However there can be densification of the mixture and flow in the upward direction, but this flow may not be representative of the field conditions.
Fig. 11. Wheel tracker test - 2% air voids specimen
Fig. 12. Wheel tracker test - 7% air voids specimen
In a wheel tracking test, the wheel moves to and fro on the sample and deformation of surface is measured at different points (here at 4 mm interval) on the wheel path when the wheel load is at that particular point. The measurements at different points are then averaged to represent a mean rut depth or converted to proportional rut depth or strain (rut depth divided by the specimen height). In a rut wheel machine, the proportions of the diameter of the specimen to the contact area of the rubber tyre are such that every point in the sample is subjected to loading even when the tyre is not directly acting on top of it. Added to the indeterminacy is the confinement pressure due to the rigid walls of steel mould. Hence clearly delineating the deformation history to which the specimen is subjected to is difficult.
Compared to wheel tracker test, the loading conditions during flow number testing are completely controlled and measurable. Ideally, the details related to the deformation history will be complete if one is able to measure the deformation in the radial directions. Such deformation, if
International Journal of Scientific & Engineering Research, Volume 5, Issue 7, July-2014 ISSN 2229-5518 598
IJSER © 2015 http://www.ijser.org
IJSER
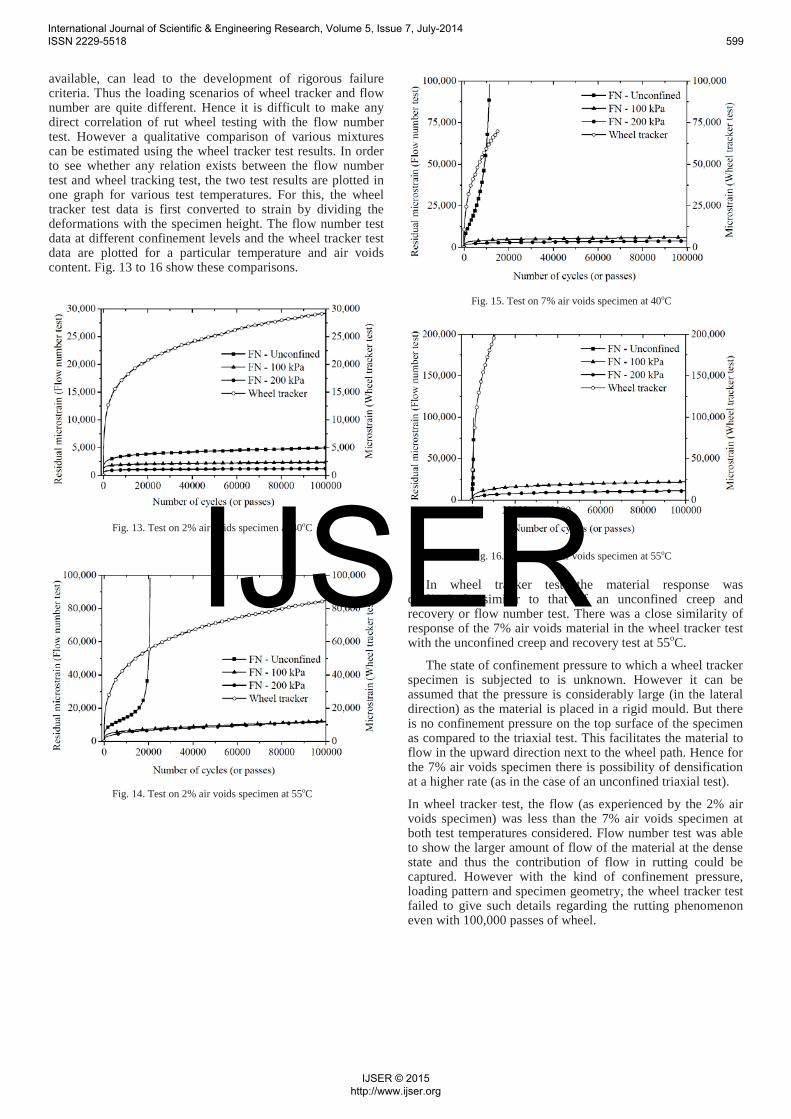
available, can lead to the development of rigorous failure criteria. Thus the loading scenarios of wheel tracker and flow number are quite different. Hence it is difficult to make any direct correlation of rut wheel testing with the flow number test. However a qualitative comparison of various mixtures can be estimated using the wheel tracker test results. In order to see whether any relation exists between the flow number test and wheel tracking test, the two test results are plotted in one graph for various test temperatures. For this, the wheel tracker test data is first converted to strain by dividing the deformations with the specimen height. The flow number test data at different confinement levels and the wheel tracker test data are plotted for a particular temperature and air voids content. Fig. 13 to 16 show these comparisons.
Fig. 13. Test on 2% air voids specimen at 40oC
Fig. 14. Test on 2% air voids specimen at 55oC
Fig. 15. Test on 7% air voids specimen at 40oC
Fig. 16. Test on 7% air voids specimen at 55oC
In wheel tracker test the material response was qualitatively similar to that of an unconfined creep and recovery or flow number test. There was a close similarity of response of the 7% air voids material in the wheel tracker test with the unconfined creep and recovery test at 55oC.
The state of confinement pressure to which a wheel tracker specimen is subjected to is unknown. However it can be assumed that the pressure is considerably large (in the lateral direction) as the material is placed in a rigid mould. But there is no confinement pressure on the top surface of the specimen as compared to the triaxial test. This facilitates the material to flow in the upward direction next to the wheel path. Hence for the 7% air voids specimen there is possibility of densification at a higher rate (as in the case of an unconfined triaxial test).
In wheel tracker test, the flow (as experienced by the 2% air voids specimen) was less than the 7% air voids specimen at both test temperatures considered. Flow number test was able to show the larger amount of flow of the material at the dense state and thus the contribution of flow in rutting could be captured. However with the kind of confinement pressure, loading pattern and specimen geometry, the wheel tracker test failed to give such details regarding the rutting phenomenon even with 100,000 passes of wheel.
International Journal of Scientific & Engineering Research, Volume 5, Issue 7, July-2014 ISSN 2229-5518 599
IJSER © 2015 http://www.ijser.org
IJSER
VIII.CONCLUSIONSThere are a wide variety of experimental procedures
available for quantifying the rutting behavior of asphalt concrete mixtures; some are plain torture tests while some of them depend on a model based framework. However, none of the current experimental protocols can properly identify the issues related to the laboratory quantification of rutting of asphalt mixtures.
This study focused on the capability of flow number test in estimating the three stage creep response and thereby, the rut resistance of asphalt concrete mixtures. To precisely delineate creep behaviour using flow number protocol, it is required that the material be subjected to considerably longer loading durations (more than 100,000 for all test conditions in the confined state). Also, if one needs to quantify the flow number value, it is necessary that the 7% air voids sample is tested under confinement conditions.
Wheel tracker test conditions vary highly between the creep and recovery test or the flow number test. In the existing equipment arrangement it is difficult to control theconfinement condition. The wheel tracker test can be considered as a pass/ fail test to make qualitative comparisons between the rutting characteristics of different mixtures.
Acknowledgment I thank M/s IPC, Australia for providing software support
for the AMPT at various stages of investigation. I thank Dept. of Civil Engineering, IIT Madras for providing the bestpossible environment for carrying out the research work reported here. I thank Dr. J. Murali Krishnan for proof-reading this paper. Also thanks to Prof. A.Veeraragavan for his motivation and support.
References
[1] MoRTH, Specifications for roads and bridge works. Indian Roads Congress, New Delhi, India, 2013.
[2] IRC: 37-2012, Guidelines for the design of flexible pavements. Indian Roads Congress, New Delhi, India, 2012.
[3] Superpave Series No. 2 (SP-02), Superpave mix design. Asphalt Institute, Lexington, KY, 2001.
[4] Witczak, M. W., K. Kaloush, T. Pellinen, M. El-Basyouny, and H. V. Quintus, NCHRP Report 465: Simple performance tests for superpave mix design. National Cooperative Highway Research Program, Transportation Research Board, Washington, D.C., USA, 2002.
[5] Dave, E. V. and P. Koktan, Synthesis of performance testing of asphalt concrete. Technical report, Minnesota department of transportation, Minnesota, 2011.
[6] AASHTO: TP-79, Determining the dynamic modulus and flow number for Hot Mix Asphalt (HMA) using the Asphalt Mixture Performance Tester (AMPT). American Association of State Highway and Transportation Officials, Washington D.C., USA, 2010.
[7] IS 73: 73-2013, Paving bitumen - specification. Bureau of Indian Standards, New Delhi, India, 2013.
[8] AASHTO: T-312, Preparing and determining density of Hot Mix Asphalt (HMA) specimens by means of the Superpave Gyratory Compactor (SGC). American Association of State Highway and Transportation Officials, Washington, D.C., USA, 2010.
[9] AASHTO: R-30, Standard practice for mixture conditioning of Hot Mix Asphalt. American Association of State Highway and Transportation Officials, Washington, D.C., USA, 2002.
[10] AASHTO: PP-60, Preparation of cylindrical performance test specimens using the Superpave Gyratory Compactor (SGC). American Association of State Highway and Transportation Officials, Washington, D.C., USA, 2010.
[11] Zhou, F., T. Scullion, and L. Sun, Verification and modeling of three-stage permanent deformation behavior of asphalt mixes. Journal of Transportation Engineering, 130(4), 486–494, 2004.
[12] Nutting, P. G., A study of elastic viscous deformation. Proceedings of the American Society for Testing Materials, 21, 1162–1171,1921.
[13] Buchdahl, R. and L. E. Nielsen, The application of Nutting’s equation to the viscoelastic behavior of certain polymeric systems. Journal of Applied Physics, 22(11), 1344–1349, 1951.
[14] Rees, D. W. A., Nutting creep in polymer composites. Journal of Materials Processing Technology, 143–144, 164–170, 2003.
[15] Perraton, D., H. D. Benedetto, C. Sauzet’at, C. D. L. Roche, W. Bankowski, M. Partl, and J. Grenfell, Rutting of bituminous mixtures: wheel tracking tests campaign analysis. Materials and Structures, 44, p. 969–986, 2011.
International Journal of Scientific & Engineering Research, Volume 5, Issue 7, July-2014 ISSN 2229-5518 600
IJSER © 2015 http://www.ijser.org
IJSER