Embed Size (px)
Citation preview
277 Technology Parkway • Auburn, AL 36830
NCAT Report 90-01
DESIGN OF LARGE STONEASPHALT MIXES TO MINIMIZERUTTING
By
Prithvi S. Kandhal
January 1990
Presented at the 69th Annual Meeting of the Transportation Research Boardin Washington, DC, January, 1990
DESIGN OF LARGE STONE ASPHALT MIXES TO MINIMIZE RUTTING
By
Prithvi S. KandhalAssistant Director
National Center for Asphalt TechnologyAuburn University, Alabama
NCAT Report 90-01
January 1990

i
DISCLAIMER
The contents of this report reflect the views of the authors who are solely responsible forthe facts and the accuracy of the data presented herein. The contents do not necessarily reflectthe official views and policies of the National Center for Asphalt Technology of AuburnUniversity. This report does not constitute a standard, specification, or regulation.

ii
ABSTRACT
Rutting of heavy duty asphalt pavements has been increasingly experienced in recent yearsprimarily due to high tire pressures and increased wheel loads. Many asphalt technologistsbelieve that the use of large size stone (maximum size of more than one inch) in the binder andbase courses will minimize or eliminate the rutting of heavy duty pavements.
The equipment specified in the Marshall procedure (ASTM D 1559) used by 76 percent of thestates in the United States consists of a 4-inch diameter compaction mold intended for mixescontaining aggregate up to l-inch maximum size only. This has inhibited the use of large stonemixes.
A standard method for preparing and testing 6-inch diameter specimens has been presented. Theproposed method has the following significant differences from ASTM D 1559: (a) hammerweighs 22.5 pounds, (b) specimen size is 6-inch diameter and 3-3/4 inch height, (c) specimenweighs about 4,050 grams, and (d) the number of blows needed is 1-1/2 times the number ofblows needed for a standard Marshall specimen to obtain equivalent compaction levels.
Comparative test data (4-inch versus 6-inch diameter specimens) obtained from various highwayagencies and producers indicates that the compaction levels are reasonably close. The averagestability ratio (stability of 6-inch specimen/stability of 4-inch specimen) and flow ratio (flow of6-inch specimen/flow of 4-inch specimen) were determined to be very close to the theoreticallyderived values of 2.25 and 1.50, respectively.
A typical mix design using 6-inch specimens along with limited field data is also given. It isbelieved that the proposed test method will be useful in determining the optimum asphalt contentof large stone asphalt mixes.

Kandhal
1
DESIGN OF LARGE STONE ASPHALT MIXES TO MINIMIZE RUTTING
Prithvi S. Kandhal
INTRODUCTION
Rutting of heavy duty asphalt pavements has been increasingly experienced in recent years. Thisphenomenon is primarily resulting from high tire pressures and increased wheel loads. Thedesign of Hot Mix Asphalt (HMA) which served reasonably well in the past needs to be re-examined to withstand the increased stresses. Various asphalt additives are being promoted toincrease the stability of HMA pavements at high temperatures However, most asphalttechnologists believe that fundamental changes in the aggregate component of the HMA (suchas, size, shape, texture and gradation) must be made first. There is a general agreement that theuse of large size stone in the binder and base courses will minimize or eliminate the rutting ofheavy duty asphalt pavements.
The use of large stone mixes is not new. Warren Brothers Company had a patent issued in 1903which specified the use of large size aggregate (1). Unfortunately, most paving companiesstarted to use small stone mixes to avoid infringement of the patent and such use is still prevalenttoday.
Marshall mix design procedures are used by 76 percent of the states in the United Statesaccording to a survey conducted in 1984 (2). The equipment specified in the Marshall procedure(ASTM D1559) consists of a 4-inch diameter compaction mold which is intended for mixturescontaining aggregate up to l-inch maximum size only. This has also inhibited the use of HMAcontaining aggregate larger than one inch because it cannot be tested by the standard Marshallmix design procedures. There are other test procedures such as gyratory compaction, TRRL(Transport and Road Research Laboratory, UK) refusal test and Minnesota DOT vibratinghammer which use 6-inch diameter molds accommodating 1-1/2 -2 inch maximum aggregatesize (3). However, most agencies are reluctant to buy new equipment because of cost and/orcomplexity. They tend to prefer and utilize the existing equipment and/or methodology (such asMarshall test) with some modifications. There are preliminary indications from the NCHRP’sAAMAS (Asphalt-Aggregate Mix Analysis System) research study that a laboratory gyratorycompactor better simulates the aggregate particle orientation obtained in the field compared to animpact type compactor used in the Marshall procedure (4). However, it will be a few yearsbefore many agencies start to implement AMMAS study’s recommendations and use gyratorycompactors. In the meantime there is an urgent need to start designing large stone hot mixasphalt using modified Marshall design procedures based on the current knowledge andexperience. It is expected that these procedures will be continually modified as more experienceis gained in the field. .
The term “large stone” is a relative one. For the purpose of this report large stone is defined as anaggregate with a maximum size of more than one inch which cannot be used in preparingstandard 4-inch diameter Marshall specimens.
BACKGROUND OF DEVELOPMENT
Pennsylvania Department of Transportation (PennDOT) implemented Marshall mix designprocedures in the early 1960s. The Marshall method was generally based on ASTM D1559(Standard Test Method for Resistance to Plastic Flow of Bituminous Mixtures Using MarshallApparatus). ASTM D1559 specifies the use of 4-inch diameter specimen mold for mixescontaining aggregate up to l-inch maximum size. The compaction hammer weighs 10 pounds anda free fall of 18 inches is used. It became apparent that ASTM D1559 could not be used for
Kandhal
2
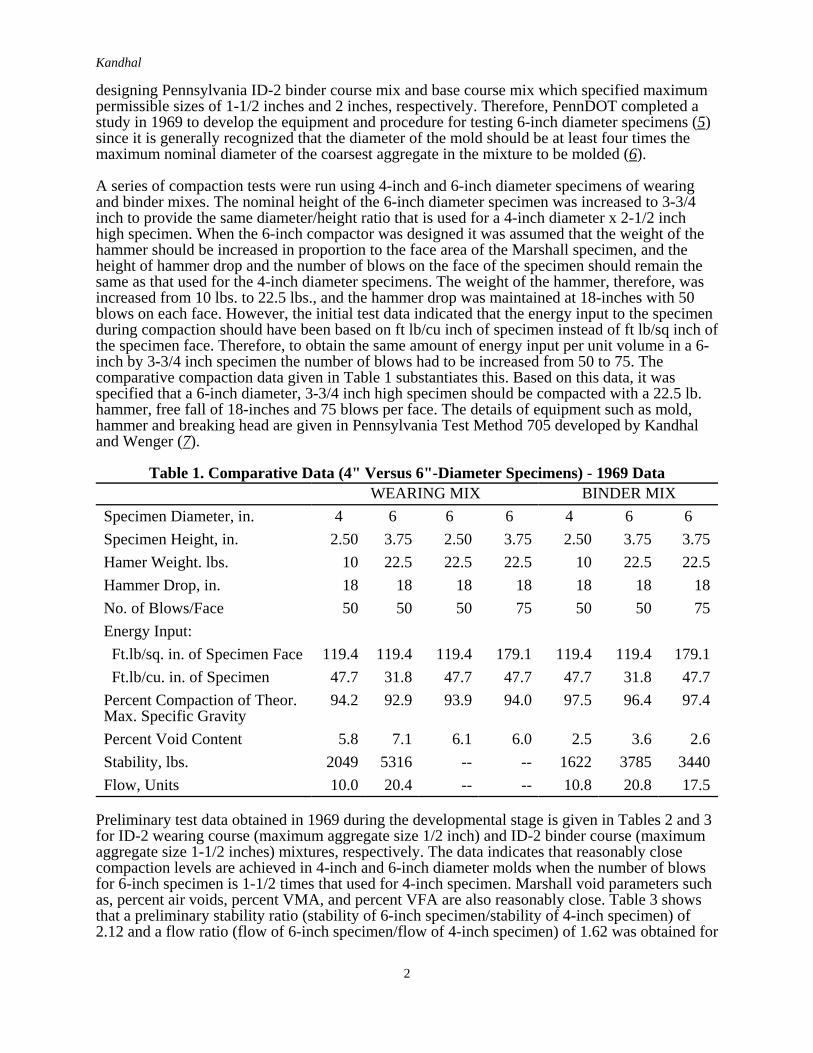
designing Pennsylvania ID-2 binder course mix and base course mix which specified maximumpermissible sizes of 1-1/2 inches and 2 inches, respectively. Therefore, PennDOT completed astudy in 1969 to develop the equipment and procedure for testing 6-inch diameter specimens (5)since it is generally recognized that the diameter of the mold should be at least four times themaximum nominal diameter of the coarsest aggregate in the mixture to be molded (6).
A series of compaction tests were run using 4-inch and 6-inch diameter specimens of wearingand binder mixes. The nominal height of the 6-inch diameter specimen was increased to 3-3/4inch to provide the same diameter/height ratio that is used for a 4-inch diameter x 2-1/2 inchhigh specimen. When the 6-inch compactor was designed it was assumed that the weight of thehammer should be increased in proportion to the face area of the Marshall specimen, and theheight of hammer drop and the number of blows on the face of the specimen should remain thesame as that used for the 4-inch diameter specimens. The weight of the hammer, therefore, wasincreased from 10 lbs. to 22.5 lbs., and the hammer drop was maintained at 18-inches with 50blows on each face. However, the initial test data indicated that the energy input to the specimenduring compaction should have been based on ft lb/cu inch of specimen instead of ft lb/sq inch ofthe specimen face. Therefore, to obtain the same amount of energy input per unit volume in a 6-inch by 3-3/4 inch specimen the number of blows had to be increased from 50 to 75. Thecomparative compaction data given in Table 1 substantiates this. Based on this data, it wasspecified that a 6-inch diameter, 3-3/4 inch high specimen should be compacted with a 22.5 lb.hammer, free fall of 18-inches and 75 blows per face. The details of equipment such as mold,hammer and breaking head are given in Pennsylvania Test Method 705 developed by Kandhaland Wenger (7).
Table 1. Comparative Data (4" Versus 6"-Diameter Specimens) - 1969 DataWEARING MIX BINDER MIX
Specimen Diameter, in. 4 6 6 6 4 6 6
Specimen Height, in. 2.50 3.75 2.50 3.75 2.50 3.75 3.75
Hamer Weight. lbs. 10 22.5 22.5 22.5 10 22.5 22.5
Hammer Drop, in. 18 18 18 18 18 18 18
No. of Blows/Face 50 50 50 75 50 50 75
Energy Input:
Ft.lb/sq. in. of Specimen Face 119.4 119.4 119.4 179.1 119.4 119.4 179.1
Ft.lb/cu. in. of Specimen 47.7 31.8 47.7 47.7 47.7 31.8 47.7
Percent Compaction of Theor.Max. Specific Gravity
94.2 92.9 93.9 94.0 97.5 96.4 97.4
Percent Void Content 5.8 7.1 6.1 6.0 2.5 3.6 2.6
Stability, lbs. 2049 5316 -- -- 1622 3785 3440
Flow, Units 10.0 20.4 -- -- 10.8 20.8 17.5
Preliminary test data obtained in 1969 during the developmental stage is given in Tables 2 and 3for ID-2 wearing course (maximum aggregate size 1/2 inch) and ID-2 binder course (maximumaggregate size 1-1/2 inches) mixtures, respectively. The data indicates that reasonably closecompaction levels are achieved in 4-inch and 6-inch diameter molds when the number of blowsfor 6-inch specimen is 1-1/2 times that used for 4-inch specimen. Marshall void parameters suchas, percent air voids, percent VMA, and percent VFA are also reasonably close. Table 3 showsthat a preliminary stability ratio (stability of 6-inch specimen/stability of 4-inch specimen) of2.12 and a flow ratio (flow of 6-inch specimen/flow of 4-inch specimen) of 1.62 was obtained for

Kandhal
3
the binder course mix. Additional comparative test data (4-inch versus 6-inch diameterspecimens) obtained by various agencies will be presented and discussed later in this report.
Table 2. Comparative Test Data (4" Versus 6"-Diameter Specimens)Source: Pennsylvania Dept. of Transportation (1969 Data) Mix type : ID-2 Wearing CourseAggregates: Limestone coarse aggregate and limestone fine aggregate.
Design Gradation (% Passing):
2" 1-1/2" 1" 3/4" 1/2" 3/8" #4 #8 #16 #30 #50 #100 #200
-- -- -- -- 100 95 63 43 28 18 12 8 4.5
4"Specimen
6"Specimen
4"Specimen
6"Specimen
No. of Blows 50 75 Stability, pounds 2049 --
% Compaction 94.2 94.0
% Air Voids 5.8 6.0 Flow, units 10.0 --
% VMA 18.8 18.9
% VFA 69.4 68.4Remarks: Data on stability and flow of 6" specimens is not available.
Table 3. Comparative Test Data (4" Versus 6"-Diameter Specimens)Source: Pennsylvania Dept. of Transportation (1969 Data) Mix type : ID-2 Binder CourseAggregates: Limestone coarse aggregate and limestone fine aggregate.
Design Gradation (% Passing):
2" 1-1/2" 1" 3/4" 1/2" 3/8" #4 #8 #16 #30 #50 #100 #200
100 100 95 -- 58 -- 34 25 20 15 10 7 3
4"Specimen
6"Specimen
4"Specimen
6"Specimen
No. of Blows 50 75 Stability, pounds 1622 3440
% Compaction 97.5 97.4 Flow, units 10.8 17.5
% Air Voids 2.5 2.6 Stability Ratio 2.12
% VMA 14.7 15.1 Flow Ratio 1.62
% VFA 83.2 83.0Remarks: Results are based on average of 3 specimens each.
Stability Ratio = Stability of 6" specimen/Stability of 4" specimen.Flow Ratio = Flow of 6" specimen/Flow of 4" specimen.
Kandhal
4
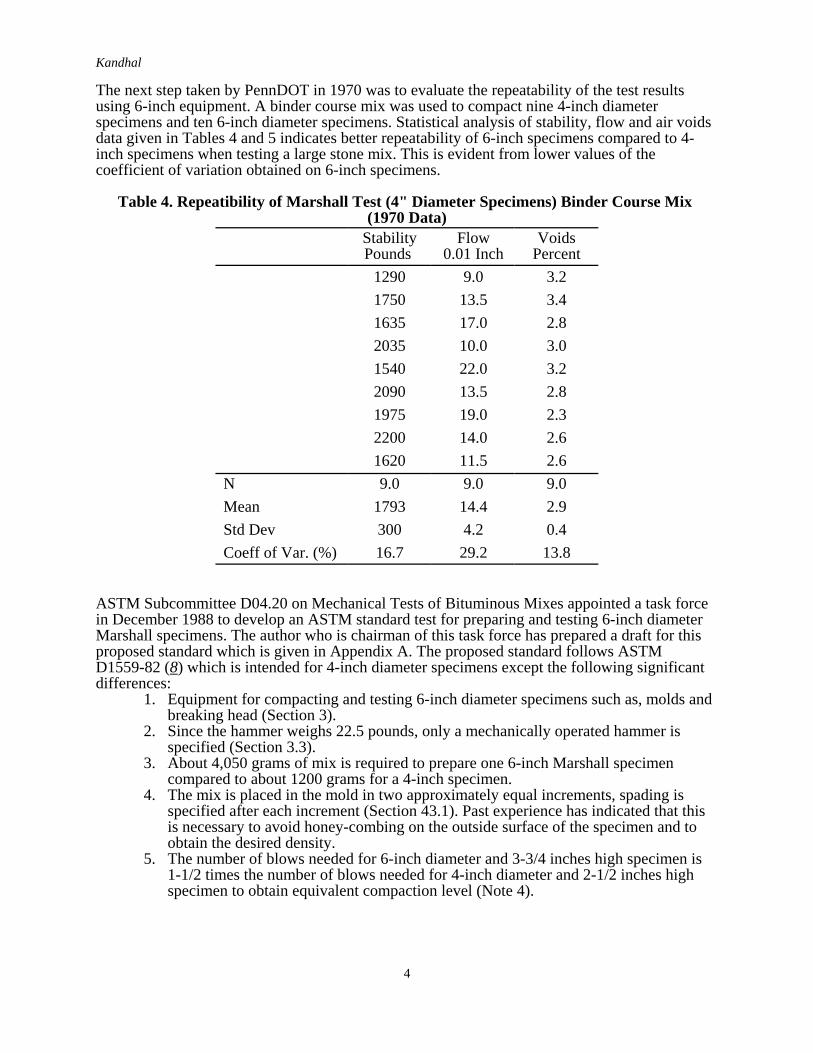
The next step taken by PennDOT in 1970 was to evaluate the repeatability of the test resultsusing 6-inch equipment. A binder course mix was used to compact nine 4-inch diameterspecimens and ten 6-inch diameter specimens. Statistical analysis of stability, flow and air voidsdata given in Tables 4 and 5 indicates better repeatability of 6-inch specimens compared to 4-inch specimens when testing a large stone mix. This is evident from lower values of thecoefficient of variation obtained on 6-inch specimens.
Table 4. Repeatibility of Marshall Test (4" Diameter Specimens) Binder Course Mix (1970 Data)
StabilityPounds
Flow0.01 Inch
VoidsPercent
1290 9.0 3.2
1750 13.5 3.4
1635 17.0 2.8
2035 10.0 3.0
1540 22.0 3.2
2090 13.5 2.8
1975 19.0 2.3
2200 14.0 2.6
1620 11.5 2.6
N 9.0 9.0 9.0
Mean 1793 14.4 2.9
Std Dev 300 4.2 0.4
Coeff of Var. (%) 16.7 29.2 13.8
ASTM Subcommittee D04.20 on Mechanical Tests of Bituminous Mixes appointed a task forcein December 1988 to develop an ASTM standard test for preparing and testing 6-inch diameterMarshall specimens. The author who is chairman of this task force has prepared a draft for thisproposed standard which is given in Appendix A. The proposed standard follows ASTMD1559-82 (8) which is intended for 4-inch diameter specimens except the following significantdifferences:
1. Equipment for compacting and testing 6-inch diameter specimens such as, molds andbreaking head (Section 3).
2. Since the hammer weighs 22.5 pounds, only a mechanically operated hammer isspecified (Section 3.3).
3. About 4,050 grams of mix is required to prepare one 6-inch Marshall specimencompared to about 1200 grams for a 4-inch specimen.
4. The mix is placed in the mold in two approximately equal increments, spading isspecified after each increment (Section 43.1). Past experience has indicated that thisis necessary to avoid honey-combing on the outside surface of the specimen and toobtain the desired density.
5. The number of blows needed for 6-inch diameter and 3-3/4 inches high specimen is1-1/2 times the number of blows needed for 4-inch diameter and 2-1/2 inches highspecimen to obtain equivalent compaction level (Note 4).
Kandhal
5
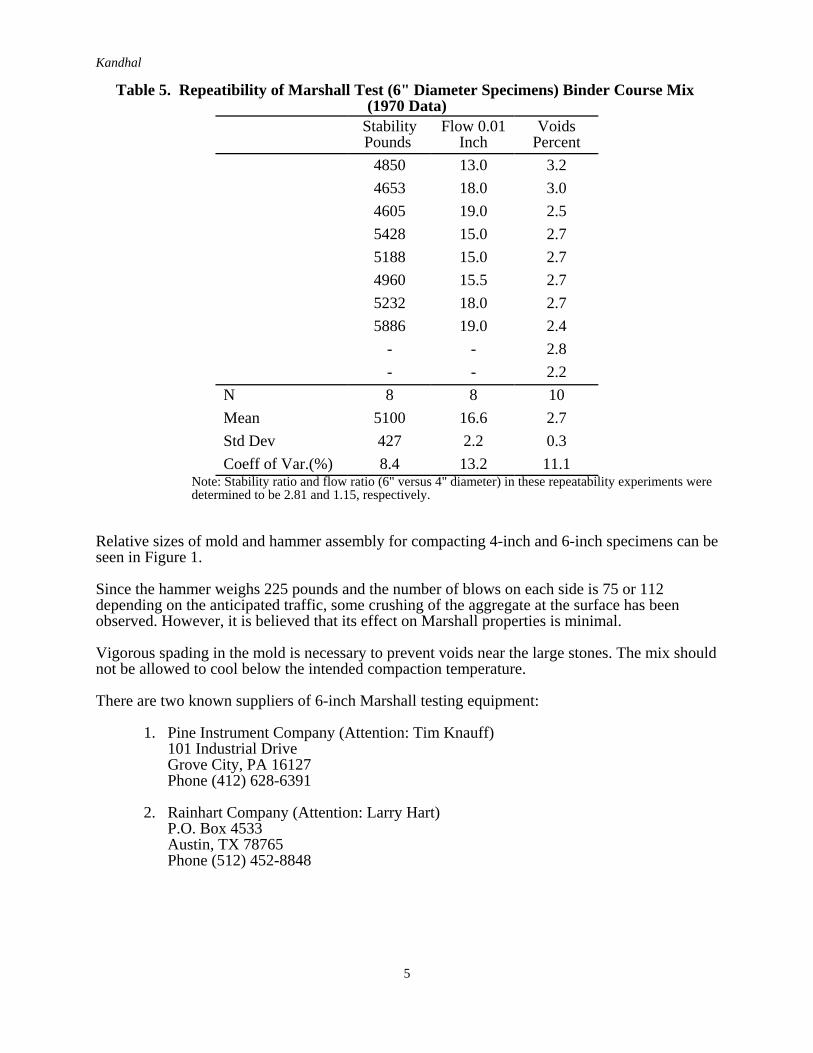
Table 5. Repeatibility of Marshall Test (6" Diameter Specimens) Binder Course Mix (1970 Data)
StabilityPounds
Flow 0.01Inch
VoidsPercent
4850 13.0 3.2
4653 18.0 3.0
4605 19.0 2.5
5428 15.0 2.7
5188 15.0 2.7
4960 15.5 2.7
5232 18.0 2.7
5886 19.0 2.4
- - 2.8
- - 2.2
N 8 8 10
Mean 5100 16.6 2.7
Std Dev 427 2.2 0.3
Coeff of Var.(%) 8.4 13.2 11.1Note: Stability ratio and flow ratio (6" versus 4" diameter) in these repeatability experiments weredetermined to be 2.81 and 1.15, respectively.
Relative sizes of mold and hammer assembly for compacting 4-inch and 6-inch specimens can beseen in Figure 1.
Since the hammer weighs 225 pounds and the number of blows on each side is 75 or 112depending on the anticipated traffic, some crushing of the aggregate at the surface has beenobserved. However, it is believed that its effect on Marshall properties is minimal.
Vigorous spading in the mold is necessary to prevent voids near the large stones. The mix shouldnot be allowed to cool below the intended compaction temperature.
There are two known suppliers of 6-inch Marshall testing equipment:
1. Pine Instrument Company (Attention: Tim Knauff)101 Industrial DriveGrove City, PA 16127Phone (412) 628-6391
2. Rainhart Company (Attention: Larry Hart)P.O. Box 4533Austin, TX 78765Phone (512) 452-8848

Kandhal
6
The same mechanical compactor is used for compacting 4-inch and 6-inch diameter Marshallspecimens. Therefore, if a mechanical compactor is already on hand, one needs to buy thefollowing additional equipment (estimated cost $1,800):
1. 6" complete mold assembly consisting of compaction mold, base plate and collar(three are recommended);
2. 6" additional compaction molds (six are recommended);3. 6" compaction hammer (two are recommended);4. 6" mold holder (ensure that the spring is strong);5. 6" breaking head assembly;6. Specimen extractor for 6" specimen; and7. 6" paper discs (box of 500).
4-INCH VERSUS 6-INCH DIAMETER SPECIMENS
After the preliminary developmental work done by PennDOT during 1969 and 1970 there wasminimal use of 6-inch Marshall equipment until 1987. Interest in this equipment was revivedbecause various agencies and producers wanted to test large stone mixes for minimizing oreliminating rutting of HMA pavements as discussed earlier. These agencies (includingPennDOT) and producers who procured the 6-inch Marshall testing equipment ran a limited
Figure 1. Compaction Assembly for 6-inch MarshallSpecimens

Kandhal
7
number of tests to verify the degree of compaction obtained in 6-inch mold compared to 4-inchmold. Also, a need was felt to verify the stability ratio (stability of 6-inch specimen/stability of4-inch specimen) and the flow ratio (flow of 6-inch specimen/flow of 4-inch specimen) obtainedin PennDOT’s preliminary work. This was necessary so that minimum stability values, and therange of flow for 6-inch specimens could be derived from the values specified for 4-inchspecimens.
Personal contacts were made with various agencies and producers, and the comparative data (4-inch versus 6-inch diameter specimens) was obtained. The discussion of data follows.
Kentucky Department of Highways (KY DOH)
KY DOH developed a large stone base course mix (Type K Base) containing a 2-inch maximumsize aggregate for heavier coal haul roads. his mix is designed and controlled using 6-inchMarhall testing equipment. This mix was tried in the field during 1987 construction season. KYDOH obtained comparative test data (4" versus 6") on their conventional Class I Base mix asshown in Table 6. The levels of compaction obtained in 4-inch and 6-inch molds using 75 and112 blows, respectively are reasonably close. Stability and flow ratios are 2.08 and 1.34,respectively.
Table 6. Comparative Test Data (4" Versus 6"-Diameter Specimens)Source: Kentucky Dept. of Highways (Johnson County) Mix type: Class I BaseAggregates: Limestone #57 (50%), limestone #8 (10%), and limestone sand (40%).Design Gradation (% Passing):2" 1-1/2" 1" 3/4" 1/2" 3/8" #4 #8 #16 #30 #50 #100 #200
100 100 -- 91 -- 64 44 34 24 18 14 7 3.5
4"Specimen
6"Specimen
4"Specimen
6"Specimen
% Asphalt Content 4.1 4.1 Stability, pounds (1) 2898 --
No. of Blows 75 112 (2) 2998 6430
Bulk Sp. Gr. (1) 2.439 2.441 (3) 2798 5629
(2) 2.428 2.450 Mean 2898 6030
(3) 2.430 2.437 Flow, units (1) 13.0 --
Mean 2.432 2.443 (2) 14.0 18.0
Max. Sp. Gr. 2.517 2.517 (3) 14.0 18.5
% Air Voids 3.4 3.0 Mean 13.7 18.3
% VMA 14.0 13.6 Stability Ratio 2.08
% VFA 76.0 78.3 Flow Ratio 1.34Remarks: AASHTO gradations #57 (1" to #4) and #8 (3/8" to #8) used.
Stability values adjusted for specimen thickness.
Kandhal
8
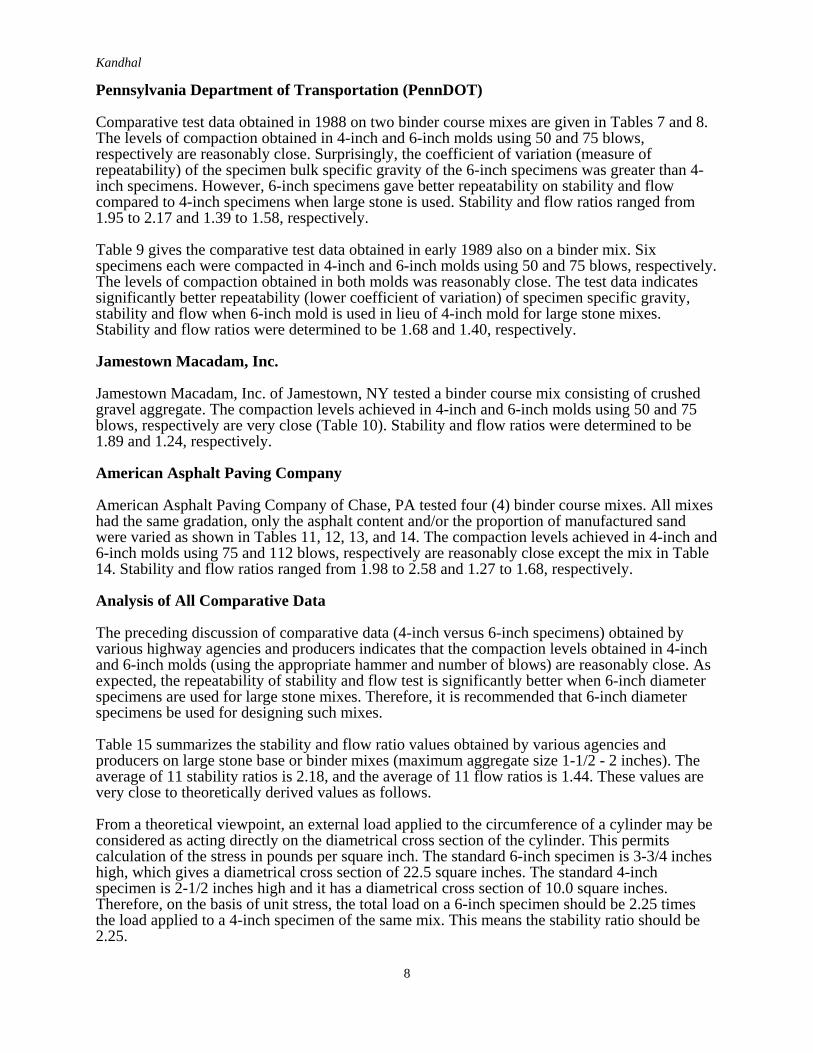
Pennsylvania Department of Transportation (PennDOT)
Comparative test data obtained in 1988 on two binder course mixes are given in Tables 7 and 8.The levels of compaction obtained in 4-inch and 6-inch molds using 50 and 75 blows,respectively are reasonably close. Surprisingly, the coefficient of variation (measure ofrepeatability) of the specimen bulk specific gravity of the 6-inch specimens was greater than 4-inch specimens. However, 6-inch specimens gave better repeatability on stability and flowcompared to 4-inch specimens when large stone is used. Stability and flow ratios ranged from1.95 to 2.17 and 1.39 to 1.58, respectively.
Table 9 gives the comparative test data obtained in early 1989 also on a binder mix. Sixspecimens each were compacted in 4-inch and 6-inch molds using 50 and 75 blows, respectively.The levels of compaction obtained in both molds was reasonably close. The test data indicatessignificantly better repeatability (lower coefficient of variation) of specimen specific gravity,stability and flow when 6-inch mold is used in lieu of 4-inch mold for large stone mixes.Stability and flow ratios were determined to be 1.68 and 1.40, respectively.
Jamestown Macadam, Inc.
Jamestown Macadam, Inc. of Jamestown, NY tested a binder course mix consisting of crushedgravel aggregate. The compaction levels achieved in 4-inch and 6-inch molds using 50 and 75blows, respectively are very close (Table 10). Stability and flow ratios were determined to be1.89 and 1.24, respectively.
American Asphalt Paving Company
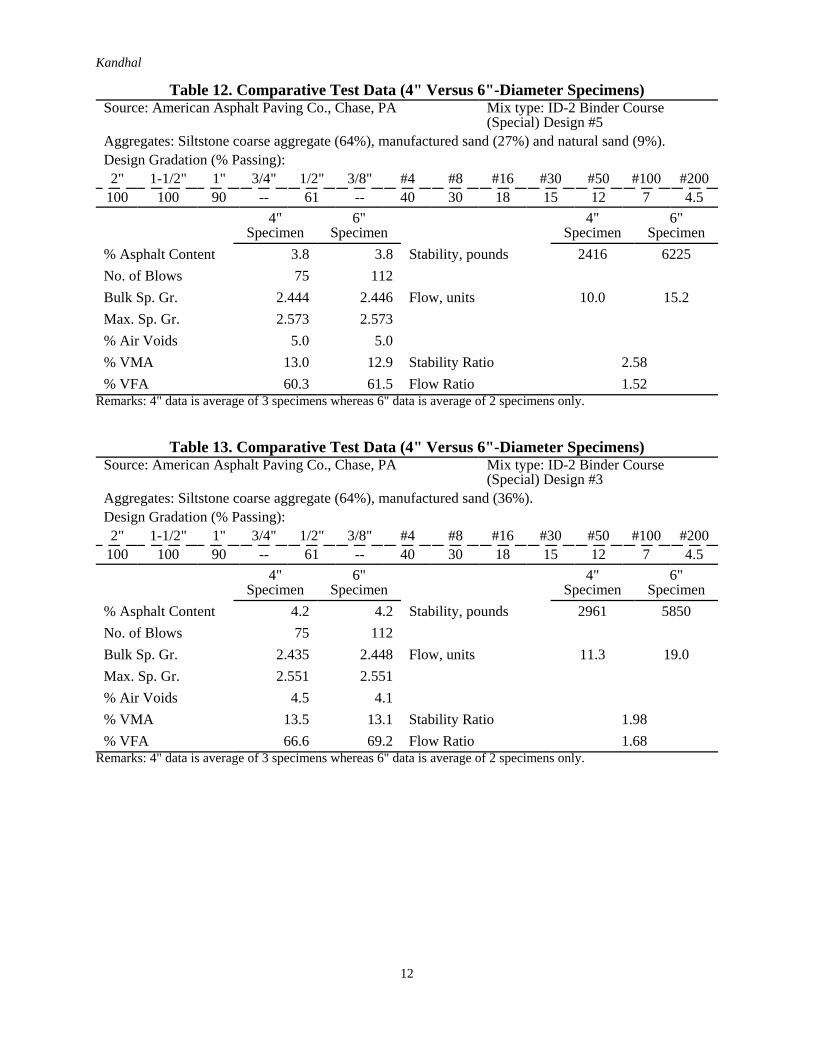
American Asphalt Paving Company of Chase, PA tested four (4) binder course mixes. All mixeshad the same gradation, only the asphalt content and/or the proportion of manufactured sandwere varied as shown in Tables 11, 12, 13, and 14. The compaction levels achieved in 4-inch and6-inch molds using 75 and 112 blows, respectively are reasonably close except the mix in Table14. Stability and flow ratios ranged from 1.98 to 2.58 and 1.27 to 1.68, respectively.
Analysis of All Comparative Data
The preceding discussion of comparative data (4-inch versus 6-inch specimens) obtained byvarious highway agencies and producers indicates that the compaction levels obtained in 4-inchand 6-inch molds (using the appropriate hammer and number of blows) are reasonably close. Asexpected, the repeatability of stability and flow test is significantly better when 6-inch diameterspecimens are used for large stone mixes. Therefore, it is recommended that 6-inch diameterspecimens be used for designing such mixes.
Table 15 summarizes the stability and flow ratio values obtained by various agencies andproducers on large stone base or binder mixes (maximum aggregate size 1-1/2 - 2 inches). Theaverage of 11 stability ratios is 2.18, and the average of 11 flow ratios is 1.44. These values arevery close to theoretically derived values as follows.
From a theoretical viewpoint, an external load applied to the circumference of a cylinder may beconsidered as acting directly on the diametrical cross section of the cylinder. This permitscalculation of the stress in pounds per square inch. The standard 6-inch specimen is 3-3/4 incheshigh, which gives a diametrical cross section of 22.5 square inches. The standard 4-inchspecimen is 2-1/2 inches high and it has a diametrical cross section of 10.0 square inches.Therefore, on the basis of unit stress, the total load on a 6-inch specimen should be 2.25 timesthe load applied to a 4-inch specimen of the same mix. This means the stability ratio should be2.25.
Kandhal
9
Table 7. Comparative Test Data (4" Versus 6"-Diameter Specimens)Source: Pennsylvania Dept. of Transportation (1988 Data) Mix type: ID-2 Binder Course
(Interstate Amiesite)Aggregates: Dolomite coarse aggregates #467 (48%), #8 (9%), and Dolomite fine aggregate (43%)Design Gradation (% Passing):2" 1-1/2" 1" 3/4" 1/2" 3/8" #4 #8 #16 #30 #50 #100 #200
100 100 90 -- 65 59 47 35 20 12 7 5 4
4"Specimen
6"Specimen
4"Specimen
6"Specimen
% Asphalt Content 4.6 4.6 Stability, pounds --
No. of Blows 50 75 Mean 2650 5169
Bulk Sp. Gr. Std. Dev. 319 530
Mean 2.541 2.549 Coeff. of Variation (%)
12.0 10.3
Std. Dev. 0.009 0.013 Flow, units
Coeff. of Var. (%) 0.35 0.51 Mean 21.0 29.1
Max. Sp. Gr. 2.606 2.606 Std. Dev. 3.2 0.9
% Air Voids 2.5 2.2 Coeff. of Var. (%) 15.2 3.1
% VMA 13.5 13.1 Stability Ratio 1.95
% VFA 81.4 83.4 Flow Ratio 1.39Remarks: Five (5) samples each of 4" and 6" diameter specimens were analyzed.
Table 8. Comparative Test Data (4" Versus 6"-Diameter Specimens)Source: Pennsylvania Dept. of Transportation (1988 Data) Mix type: ID-2 Binder Course
(Eastern Industries)Aggregates: Limestone coarse aggregate #467 (60%), and limestone fine aggregate (40%).Design Gradation (% Passing):2" 1-1/2" 1" 3/4" 1/2" 3/8" #4 #8 #16 #30 #50 #100 #200
100 100 90 73 63 54 44 30 17 10 7 5 4
4"Specimen
6"Specimen
4"Specimen
6"Specimen
% Asphalt Content 4.3 4.3 Stability, pounds --
No. of Blows 50 75 Mean 2524 5477
Bulk Sp. Gr. Std. Dev. 530 363
Mean 2.461 2.455 Coeff. of Variation (%)
21.0 6.6
Std. Dev. 0.009 0.031 Flow, units
Coeff. of Var. (%) 0.37 1.27 Mean 16.7 26.4
Max. Sp. Gr. 2.551 2.551 Std. Dev. 2.2 2.5
% Air Voids 3.5 3.8 Coeff. of Var. (%) 13.2 9.5
% VMA 13.9 14.1 Stability Ratio 2.17
% VFA 74.5 73.6 Flow Ratio 1.58Remarks: Seven (7) samples each of 4" and 6" diameter specimens were analyzed.

Kandhal
10
Table 9. Comparative Test Data (4" Versus 6"-Diameter Specimens)Source: Pennsylvania Dept. of Transportation (1989 Data) Mix type: ID-2 Binder CourseAggregates: Dolomite coarse and Dolomite fine aggregate.Design Gradation (% Passing):2" 1-1/2" 1" 3/4" 1/2" 3/8" #4 #8 #16 #30 #50 #100 #200
100 100 92 -- 62 -- 40 30 19 13 9 7 4.3
4"Specimen
6"Specimen
4"Specimen
6"Specimen
% Asphalt Content 4.4 4.4 Stability, pounds (1) 2730 5350
No. of Blows 50 75 (2) 3640 5450
Bulk Sp. Gr. (1) 2.494 2.494 (3) 2975 5500
(2) 2.504 2.491 (4) 3430 5550
(3) 2.514 2.492 (5) 2870 4700
(4) 2.530 2.502 (6) 3185 5100
(5) 2.506 2.495 Mean 3138 5275
(6) 2.511 2.483 Std. Dev. 348 324
Mean 2.510 2.493 Coeff. of Var. (%) 11.1 6.1
Std. Dev. 0.012 0.006 Flow, units (1) 13.3 25.0
Coeff. of Var. (%) 0.5 0.2 (2) 19.3 21.6
Max. Sp. Gr. 2.613 2.613 (3) 13.7 22.0
% Air Voids 3.9 4.6 (4) 16.3 24.0
% VMA 13.4 14.0 (5) 15.0 22.3
% VFA 70.8 67.3 (6) 22.5 25.3
Mean 16.7 23.4
Std. Dev. 3.7 1.6
Coeff. of Var. (%) 21.6 6.8
Stability Ratio 1.68
Flow Ratio 1.40Remarks: AASHTO gradations #57 (1" to #4) and #8 (3/8" to #8) used.
Stability values adjusted for specimen thickness.

Kandhal
11
Table 10. Comparative Test Data (4" Versus 6"-Diameter Specimens)Source: Jamestown Macadam, Inc., Jamestown, NY Mix type: ID-2 Binder CourseAggregates: Crushed gravel coarse aggregate (76%), gravel fine aggregate (12%), andconcrete sand (12%).Design Gradation (% Passing):2" 1-1/2" 1" 3/4" 1/2" 3/8" #4 #8 #16 #30 #50 #100 #200
100 100 98 -- 62 -- 24 20 16 11 7 5 3
4"Specimen
6"Specimen
4"Specimen
6"Specimen
% Asphalt Content 4.5 4.5 Stability, pounds (1) -- 2900
No. of Blows 50 75 (2) -- 3200
Bulk Sp. Gr. (1) 2.357 2.369 (3) -- 3400
(2) 2.350 2.340 Mean 1675 3167
(3) 2.346 2.355 Flow, units (1) -- 18.0
Mean 2.351 2.355 (2) -- 20.0
Max. Sp. Gr. 2.430 2.439 (3) -- 18.5
% Air Voids 3.3 3.4 Mean 15.2 18.8
% VMA 13.5 12.9 Stability Ratio 1.89
% VFA 76.0 73.3 Flow Ratio 1.24Remarks: Max. Sp. Gr. values of the mixes used in 4" and 6" specimens are different because the specimens were
compacted in different years.
Table 11. Comparative Test Data (4" Versus 6"-Diameter Specimens)Source: American Asphalt Paving Co., Chase, PA Mix type: ID-2 Binder Course
(Special) Design #2Aggregates: Siltstone coarse aggregate (64%), manufactured sand (27%) and natural sand (9%).Design Gradation (% Passing):2" 1-1/2" 1" 3/4" 1/2" 3/8" #4 #8 #16 #30 #50 #100 #200
100 100 90 -- 61 -- 40 30 18 15 12 7 4.5
4"Specimen
6"Specimen
4"Specimen
6"Specimen
% Asphalt Content 4.0 4.0 Stability, pounds 2723 6450
No. of Blows 75 112
Bulk Sp. Gr. 2.450 2.457 Flow, units 9.8 16.0
Max. Sp. Gr. 2.565 2.565
% Air Voids 4.5 4.3
% VMA 12.9 12.7 Stability Ratio 2.37
% VFA 65.1 66.6 Flow Ratio 1.63Remarks: 4" data is average of 3 specimens whereas 6" data is average of 2 specimens only.
Kandhal
12
Table 12. Comparative Test Data (4" Versus 6"-Diameter Specimens)Source: American Asphalt Paving Co., Chase, PA Mix type: ID-2 Binder Course
(Special) Design #5Aggregates: Siltstone coarse aggregate (64%), manufactured sand (27%) and natural sand (9%).Design Gradation (% Passing):2" 1-1/2" 1" 3/4" 1/2" 3/8" #4 #8 #16 #30 #50 #100 #200
100 100 90 -- 61 -- 40 30 18 15 12 7 4.5
4"Specimen
6"Specimen
4"Specimen
6"Specimen
% Asphalt Content 3.8 3.8 Stability, pounds 2416 6225
No. of Blows 75 112
Bulk Sp. Gr. 2.444 2.446 Flow, units 10.0 15.2
Max. Sp. Gr. 2.573 2.573
% Air Voids 5.0 5.0
% VMA 13.0 12.9 Stability Ratio 2.58
% VFA 60.3 61.5 Flow Ratio 1.52Remarks: 4" data is average of 3 specimens whereas 6" data is average of 2 specimens only.
Table 13. Comparative Test Data (4" Versus 6"-Diameter Specimens)Source: American Asphalt Paving Co., Chase, PA Mix type: ID-2 Binder Course
(Special) Design #3Aggregates: Siltstone coarse aggregate (64%), manufactured sand (36%).Design Gradation (% Passing):2" 1-1/2" 1" 3/4" 1/2" 3/8" #4 #8 #16 #30 #50 #100 #200
100 100 90 -- 61 -- 40 30 18 15 12 7 4.5
4"Specimen
6"Specimen
4"Specimen
6"Specimen
% Asphalt Content 4.2 4.2 Stability, pounds 2961 5850
No. of Blows 75 112
Bulk Sp. Gr. 2.435 2.448 Flow, units 11.3 19.0
Max. Sp. Gr. 2.551 2.551
% Air Voids 4.5 4.1
% VMA 13.5 13.1 Stability Ratio 1.98
% VFA 66.6 69.2 Flow Ratio 1.68Remarks: 4" data is average of 3 specimens whereas 6" data is average of 2 specimens only.

Kandhal
13
Table 14. Comparative Test Data (4" Versus 6"-Diameter Specimens)Source: American Asphalt Paving Co., Chase, PA Mix type: ID-2 Binder Course
(Special) Design #6Aggregates: Siltstone coarse aggregate (64%), manufactured sand (36%).Design Gradation (% Passing):2" 1-1/2" 1" 3/4" 1/2" 3/8" #4 #8 #16 #30 #50 #100 #200
100 100 90 -- 61 -- 40 30 18 15 12 7 4.5
4"Specimen
6"Specimen
4"Specimen
6"Specimen
% Asphalt Content 4.0 4.0 Stability, pounds 2791 6700
No. of Blows 75 112
Bulk Sp. Gr. 2.432 2.559 Flow, units 14.0 17.8
Max. Sp. Gr. 2.559 2.559
% Air Voids 5.0 3.9
% VMA 13.5 12.6 Stability Ratio 2.40
% VFA 63.3 68.9 Flow Ratio 1.27Remarks: 4" data is average of 3 specimens whereas 6" data is average of 2 specimens only.
Table 15. Summary of Stability and Flow Ratios for Large Stone MixesAgency (Year data obtained) No. of Blows Ratio
4" 6" Stability Flow
Penn. DOT (1969) 50 75 2.12 1.62
Penn. DOT (1970) 50 75 2.81 1.15
Penn. DOT (1988) 50 75 1.95 1.39
Penn. DOT (1988) 50 75 2.17 1.58
Penn. DOT (1989) 50 75 1.68 1.40
Jamestown Macadam (1989) 50 75 1.89 1.24
Kentucky DOH (1988)* 75 112 2.08 1.34
American Asphalt Paving (1989)* 75 112 2.37 1.63
American Asphalt Paving (1989)* 75 112 2.58 1.52
American Asphalt Paving (1989)* 75 112 1.98 1.68
American Asphalt Paving (1989)* 75 112 2.40 1.27
No. of Mixes (N) 11 11
Mean 2.18 1.44
Std. Dev. 0.33 0.18*Note: The average stability and flow ratio for these five mixes compacted with 75/112 blows are 2.28 and 1.49,respectively.
Kandhal
14
Flow units measured by the testing machine are the values for the total movement of thebreaking heads to the point of maximum stability. When flow is considered on a unit basis(inches per inch of diameter), the flow value for a 6-inch specimen will be 1.5 times that of a 4-inch diameter specimen. This means the flow ratio should be 15.
Surprisingly, the average stability and flow ratio of specimens compacted with 75 and 112 blows(4-inch and 6-inch mold, respectively) are 2.28 and 1.49 which are very close to the theoreticallyderived values of 2.25 and 1.50, respectively.
It is recommended that the minimum Marshall stability requirement for 6-inch diameterspecimens should be 2.25 times the requirement for 4-inch diameter specimens. For example, if1,000 pounds minimum stability is currently being specified using ASTM D1559 (4-inchspecimen), then 2,250 pounds minimum stability should be specified for large stone mixes usingthe 6-inch Marshall testing equipment.
Similarly, the range of flow values for 6-inch specimens should be adjusted to 1-1/2 times thevalues required for 4-inch specimens. For example, if the specified range for 4-inch is 8 - 18, itshould be adjusted to 12 - 27 for 6-inch specimens.
It should be noted that Pennsylvania DOT requires the flow value to be measured at the pointwhere the stability curve on the chart begins to level off, whereas other agencies measure theflow at the point where the stability starts to decrease. However, these differences in measuringmethods will not significantly affect the flow ratios because the same method is employed bothfor 4-inch and 6-inch specimens by an agency.
TYPICAL MIX DESIGN USING 6-INCH SPECIMENS
Kentucky DOH has completed a substantial number of large stone mix designs using the 6-inchMarshall testing equipment They require the contractor to buy the testing equipment for theproject so that proper quality control is maintained. Kentucky DOH Class K Base mix has beenused on coal haul roads carrying very heavy trucks (gross loads varying from 90,000 to 150,000pounds or more). Tire pressures are also higher than generally encountered ranging from 100 to130 psi (9).
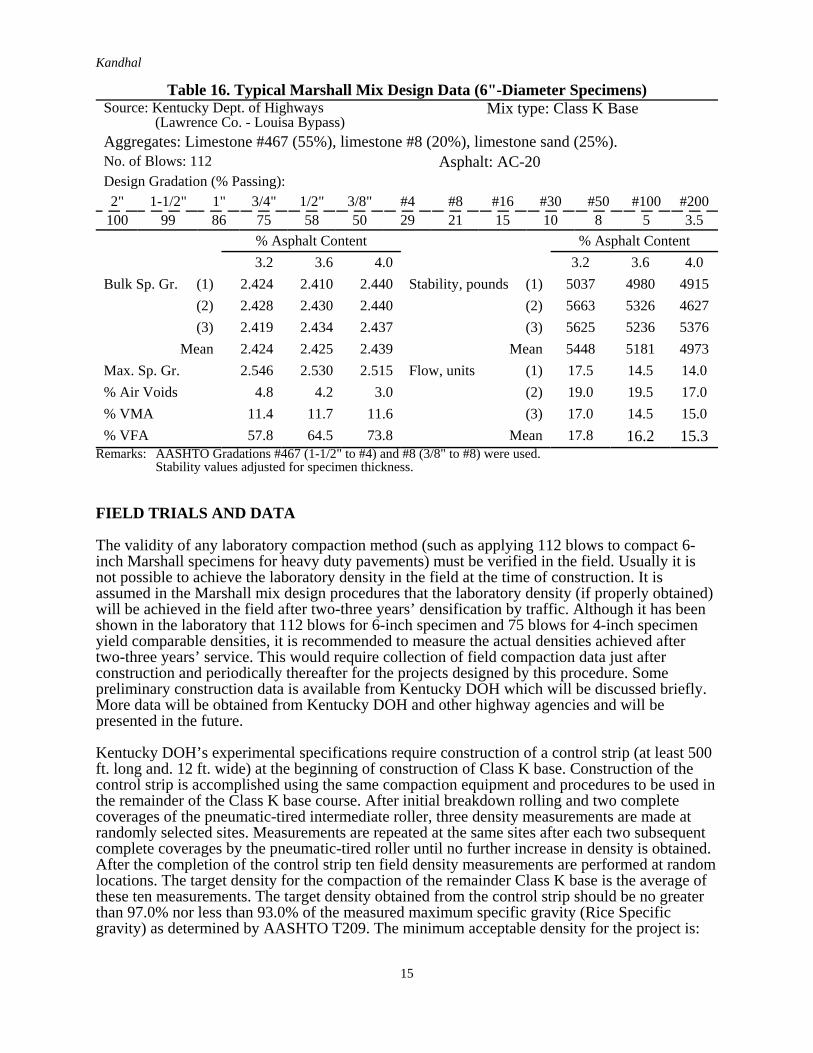
Table 16 gives the typical Marshall mix design data for one project along with the gradation usedfor Class K Base. The mix contains limestone aggregates and a maximum aggregate size of 2inches with a substantial amount of material retained on l-inch sieve. This results in substantial amount of l-inch - 3/4 inch material in the mix The mix design was developed using 6-inch mold and 112 blows on each side. Asphalt content was varied from 3.2 to 4.0 percent in 0.4 percentincrements. Either AASHTO Gradation #467 (1-1/2 inch to No. 4) or #4 (1-1/2 inch to 3/4 inch)is used for coarse aggregate to incorporate + l-inch material in the mix. The following designcriteria has been used by Kentucky DOH:
Stability 3000 lbs. minimumFlow 28 maximumAir Voids 4.5 ± 1.0 percentVMA 11.5 percent minimum
Kandhal
15
Table 16. Typical Marshall Mix Design Data (6"-Diameter Specimens)Source: Kentucky Dept. of Highways (Lawrence Co. - Louisa Bypass)
Mix type: Class K Base
Aggregates: Limestone #467 (55%), limestone #8 (20%), limestone sand (25%).No. of Blows: 112 Asphalt: AC-20Design Gradation (% Passing):2" 1-1/2" 1" 3/4" 1/2" 3/8" #4 #8 #16 #30 #50 #100 #200
100 99 86 75 58 50 29 21 15 10 8 5 3.5
% Asphalt Content % Asphalt Content
3.2 3.6 4.0 3.2 3.6 4.0
Bulk Sp. Gr. (1) 2.424 2.410 2.440 Stability, pounds (1) 5037 4980 4915
(2) 2.428 2.430 2.440 (2) 5663 5326 4627
(3) 2.419 2.434 2.437 (3) 5625 5236 5376
Mean 2.424 2.425 2.439 Mean 5448 5181 4973
Max. Sp. Gr. 2.546 2.530 2.515 Flow, units (1) 17.5 14.5 14.0
% Air Voids 4.8 4.2 3.0 (2) 19.0 19.5 17.0
% VMA 11.4 11.7 11.6 (3) 17.0 14.5 15.0
% VFA 57.8 64.5 73.8 Mean 17.8 16.2 15.3Remarks: AASHTO Gradations #467 (1-1/2" to #4) and #8 (3/8" to #8) were used.
Stability values adjusted for specimen thickness.
FIELD TRIALS AND DATA
The validity of any laboratory compaction method (such as applying 112 blows to compact 6-inch Marshall specimens for heavy duty pavements) must be verified in the field. Usually it isnot possible to achieve the laboratory density in the field at the time of construction. It isassumed in the Marshall mix design procedures that the laboratory density (if properly obtained)will be achieved in the field after two-three years’ densification by traffic. Although it has beenshown in the laboratory that 112 blows for 6-inch specimen and 75 blows for 4-inch specimenyield comparable densities, it is recommended to measure the actual densities achieved aftertwo-three years’ service. This would require collection of field compaction data just afterconstruction and periodically thereafter for the projects designed by this procedure. Somepreliminary construction data is available from Kentucky DOH which will be discussed briefly.More data will be obtained from Kentucky DOH and other highway agencies and will bepresented in the future.
Kentucky DOH’s experimental specifications require construction of a control strip (at least 500ft. long and. 12 ft. wide) at the beginning of construction of Class K base. Construction of thecontrol strip is accomplished using the same compaction equipment and procedures to be used inthe remainder of the Class K base course. After initial breakdown rolling and two completecoverages of the pneumatic-tired intermediate roller, three density measurements are made atrandomly selected sites. Measurements are repeated at the same sites after each two subsequentcomplete coverages by the pneumatic-tired roller until no further increase in density is obtained.After the completion of the control strip ten field density measurements are performed at randomlocations. The target density for the compaction of the remainder Class K base is the average ofthese ten measurements. The target density obtained from the control strip should be no greaterthan 97.0% nor less than 93.0% of the measured maximum specific gravity (Rice Specificgravity) as determined by AASHTO T209. The minimum acceptable density for the project is:

Kandhal
16
Single Test: 96.0 percent of the target density.
Moving average of last 10 tests: 98.0 percent of the target density.
Density measurements performed on Louisa Bypass indicate that the compaction wasconsistently within the required range. Average void content of the in-place pavement wasslightly less than 6 percent (9). Limited crushing of coarse surface particles occurred. Due to thecoarse surface texture nuclear densities were consistently lower than core densities taken at thesame spot. The average nuclear density was about one pound per cubic foot less than coredensity, indicating that calibration is necessary for determination of actual values. It should benoted that a double drum vibratory roller and a 25-ton pneumatic-tired roller (tire pressure up to125 psi) was used for principal compaction.
It is expected that the traffic will densify the pavement to reduce air void content from about 6percent as constructed to the design air void content (4.5 ± 1.0%). However, it will have to beverified from periodical measurements of the pavement density.
SUMMARY, CONCLUSIONS AND RECOMMENDATIONS
1. Since large stone mixes will be increasingly used to minimize rutting potential ofHMA pavements there is a need to standardize a Marshall design procedure whichcan test 6-inch diameter specimen. For the purpose of this report “large stone” isdefined as an aggregate with a maximum size of more than l-inch which cannot beused in preparing standard 4-inch diameter Marshall specimens.
2. Background and preliminary data obtained during the development of Marshalldesign procedures for preparing and testing 6-inch diameter specimen has beendiscussed.
3. A draft standard method has been prepared and is included in Appendix A. Thetesting equipment is available commercially from two suppliers.
4. Statistical analysis of stability, flow and air voids data indicates better repeatability of6-inch specimens compared to 4-inch specimens when testing a large stone mix.
5. The proposed method has the following significant differences from ASTM D1559-82 intended for testing 4-inch specimens.(a) Hammer weighs 22.5 pounds. Only a mechanically operated hammer is specified.(b) The specimen size is 6-inch diameter and 3-3/4 inch height.(c) The specimen usually weighs about 4050 grams.(d) The mix is placed in the mold in two approximately equal increments, spading is
specified after each increment.(e) The number of blows needed for 6-inch diameter and 3-3/4 inch high specimens
is 1-1/2 times the number of blows needed for 4-inch diameter and 2-1/2 inchhigh specimen to obtain equivalent compaction levels.
6. Comparative test data (4-inch versus 6-inch diameter specimens) obtained fromvarious highway agencies and producers indicates that the compaction levels arereasonably close.
7. Data obtained on stability ratio (stability of 6-inch specimen/stability of 4-inchspecimen) and flow ratio (flow of 6-inch specimen/flow of 4-inch specimen) byvarious agencies was obtained and analyzed. The average stability and flow ratioswere determined to be very close to the theoretically derived values of 2.25 and 1.50,respectively. Therefore it has been recommended that the minimum stabilityrequirement for 6-inch diameter specimens should be 2.25 times the requirement for4-inch diameter specimens. Similarly, the range of flow values for 6-inch specimensshould be adjusted to 1-1/2 time the values required for 4-inch specimen.
8. A typical mix design using 6-inch specimens is given.
Kandhal
17
9. The use of large stone mix in field trials in Kentucky has been described with limiteddata.
10. There is a need to correlate the compaction levels achieved in 6-inch mold with thefield densities obtained at the time of instruction and subsequently under trafficduring the first two-three years. Additional field data will be obtained and reported inthe future.
ACKNOWLEDGMENTS
Cooperation of the following persons in supplying the relevant data and information is gratefullyacknowledged:
Messrs. Larry Epley and Mike Anderson, Kentucky Department of HighwaysMr. David Allen, Transportation Center, University of KentuckyMr. Dean Maurer, Pennsylvania Department of TransportationMr. Ellis G. Williams, Consulting EngineerMr. Thomas Kerestes, American Asphalt Paving CompanyMr. Thomas Olson, Jamestown Macadam, Inc.
REFERENCES
1. David, Richard L., “Large Stone Mixes: A Historical Insight,” National AsphaltPavement Association Report IS 103/88, 1988.
2. Kandhal, P.S., “Marshall Mix Design Methods: Current Practices,” Proceedings,Association of Asphalt Paving Technologists, Vol. 54, 1985.
3. Acott, Mike, “The Design of Hot Mix Asphalt for Heavy Duty Pavements,” NationalAsphalt Pavement Association, QIS 111/86, October 1987.
4. Quintus, Harold Von, “AAMAS Mix properties Related to Pavement Performance,”Proceedings of the Association of Asphalt Paving Technologists in Nashville, TN,February 1989.
5. “Comparison of 4 and 6-Inch Diameter Molded Specimens,” Pennsylvania Department ofTransportation, Bureau of Materials, Testing and Research, Status Report, February 21,1969.
6. “Compressive Strength of Bituminous Mixtures,” ASTM D 1074-84, American Societyfor Testing and Materials, Vol. 04.03, 1984.
7. “Marshall Criteria for Compacted Bituminous Specimens,” Pennsylvania Test Method705, Pennsylvania Department of Transportation, Field Test Manual, March 1983.
8. “Resistance to Plastic Flow of Bituminous Mixtures Using Marshall Apparatus,” ASTMD1559-82, American Society for Testing and Materials, Vol. 04.03, 1988.
9. Williams, Ellis G., “Design and Construction of Large Stone HMA Bases in Kentucky,”Hot Mix Asphalt Technology, Winter 1988.

Kandhal
18
APPENDIX A
STANDARD TEST METHOD FORRESISTANCE TO PLASTIC FLOW OF BITUMINOUS MIXTURES USING
MARSHALL APPARATUS (6 INCH - DIAMETER SPECIMEN)
Kandhal
19
DRAFT NO. 4(July 26, 1989)
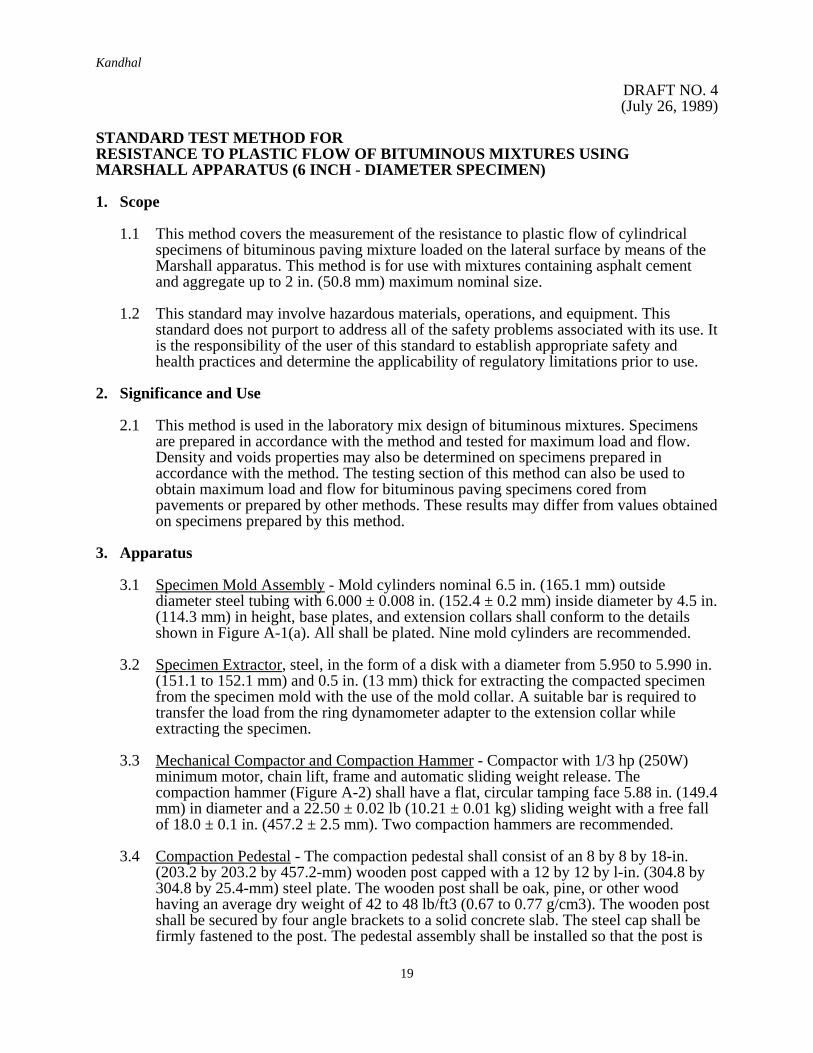
STANDARD TEST METHOD FORRESISTANCE TO PLASTIC FLOW OF BITUMINOUS MIXTURES USINGMARSHALL APPARATUS (6 INCH - DIAMETER SPECIMEN)
1. Scope
1.1 This method covers the measurement of the resistance to plastic flow of cylindricalspecimens of bituminous paving mixture loaded on the lateral surface by means of theMarshall apparatus. This method is for use with mixtures containing asphalt cementand aggregate up to 2 in. (50.8 mm) maximum nominal size.
1.2 This standard may involve hazardous materials, operations, and equipment. Thisstandard does not purport to address all of the safety problems associated with its use. Itis the responsibility of the user of this standard to establish appropriate safety andhealth practices and determine the applicability of regulatory limitations prior to use.
2. Significance and Use
2.1 This method is used in the laboratory mix design of bituminous mixtures. Specimensare prepared in accordance with the method and tested for maximum load and flow.Density and voids properties may also be determined on specimens prepared inaccordance with the method. The testing section of this method can also be used toobtain maximum load and flow for bituminous paving specimens cored frompavements or prepared by other methods. These results may differ from values obtainedon specimens prepared by this method.
3. Apparatus
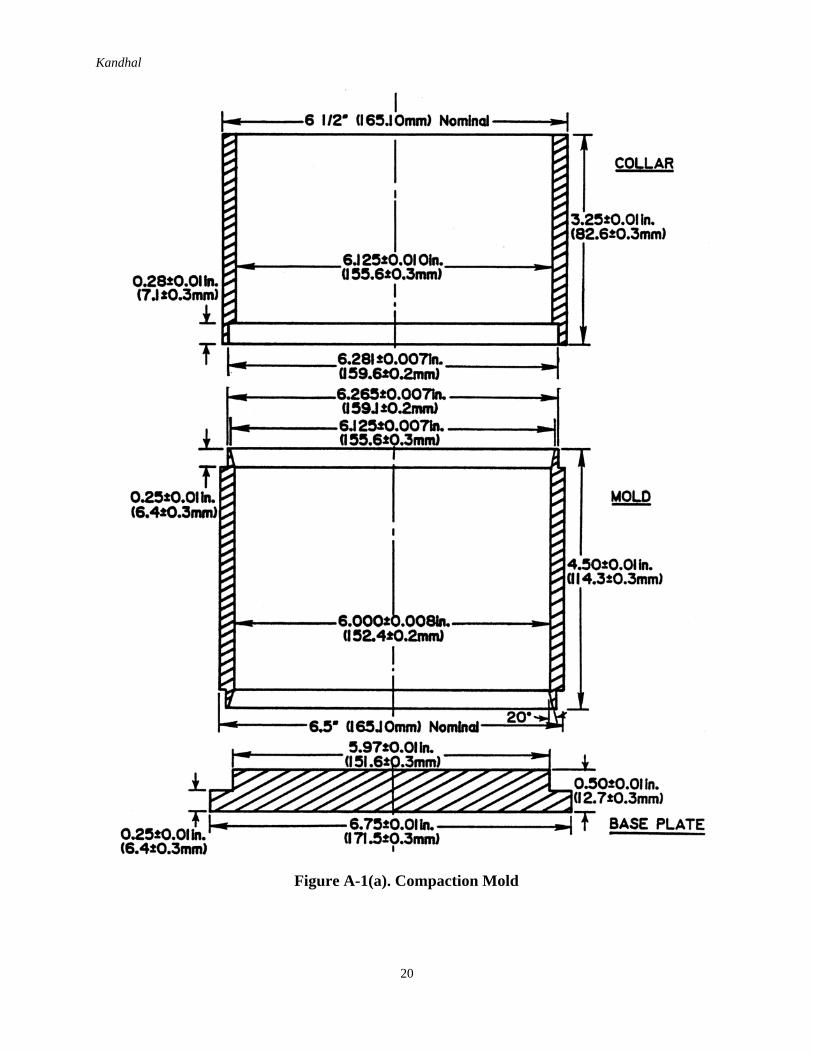
3.1 Specimen Mold Assembly - Mold cylinders nominal 6.5 in. (165.1 mm) outsidediameter steel tubing with 6.000 ± 0.008 in. (152.4 ± 0.2 mm) inside diameter by 4.5 in.(114.3 mm) in height, base plates, and extension collars shall conform to the detailsshown in Figure A-1(a). All shall be plated. Nine mold cylinders are recommended.
3.2 Specimen Extractor, steel, in the form of a disk with a diameter from 5.950 to 5.990 in.(151.1 to 152.1 mm) and 0.5 in. (13 mm) thick for extracting the compacted specimenfrom the specimen mold with the use of the mold collar. A suitable bar is required totransfer the load from the ring dynamometer adapter to the extension collar whileextracting the specimen.
3.3 Mechanical Compactor and Compaction Hammer - Compactor with 1/3 hp (250W)minimum motor, chain lift, frame and automatic sliding weight release. Thecompaction hammer (Figure A-2) shall have a flat, circular tamping face 5.88 in. (149.4mm) in diameter and a 22.50 ± 0.02 lb (10.21 ± 0.01 kg) sliding weight with a free fallof 18.0 ± 0.1 in. (457.2 ± 2.5 mm). Two compaction hammers are recommended.
3.4 Compaction Pedestal - The compaction pedestal shall consist of an 8 by 8 by 18-in.(203.2 by 203.2 by 457.2-mm) wooden post capped with a 12 by 12 by l-in. (304.8 by304.8 by 25.4-mm) steel plate. The wooden post shall be oak, pine, or other woodhaving an average dry weight of 42 to 48 lb/ft3 (0.67 to 0.77 g/cm3). The wooden postshall be secured by four angle brackets to a solid concrete slab. The steel cap shall befirmly fastened to the post. The pedestal assembly shall be installed so that the post is
Kandhal
20
Figure A-1(a). Compaction Mold
Kandhal
21
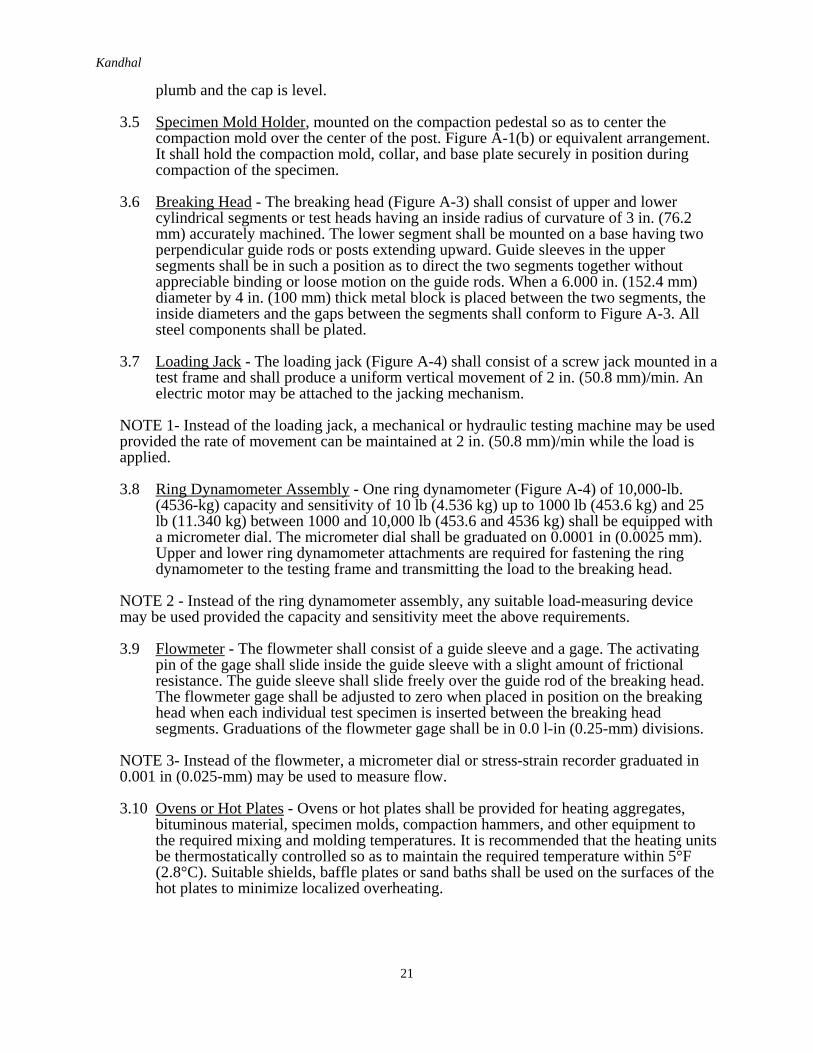
plumb and the cap is level.
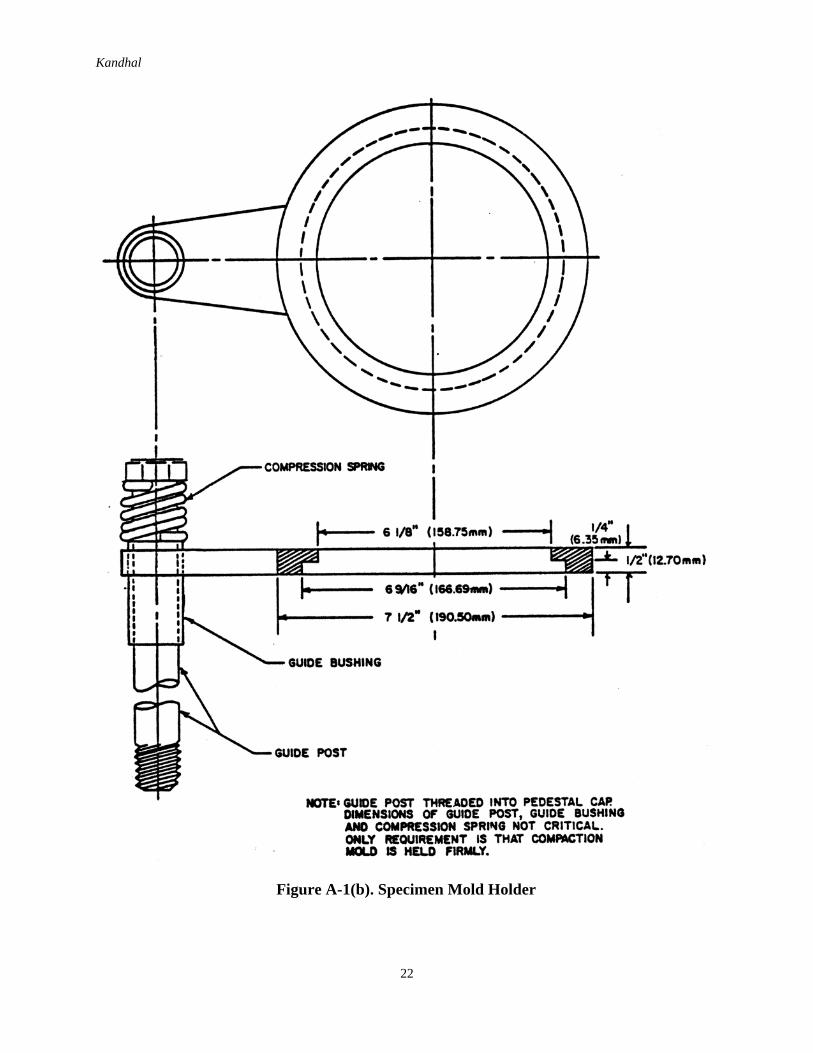
3.5 Specimen Mold Holder, mounted on the compaction pedestal so as to center thecompaction mold over the center of the post. Figure A-1(b) or equivalent arrangement.It shall hold the compaction mold, collar, and base plate securely in position duringcompaction of the specimen.
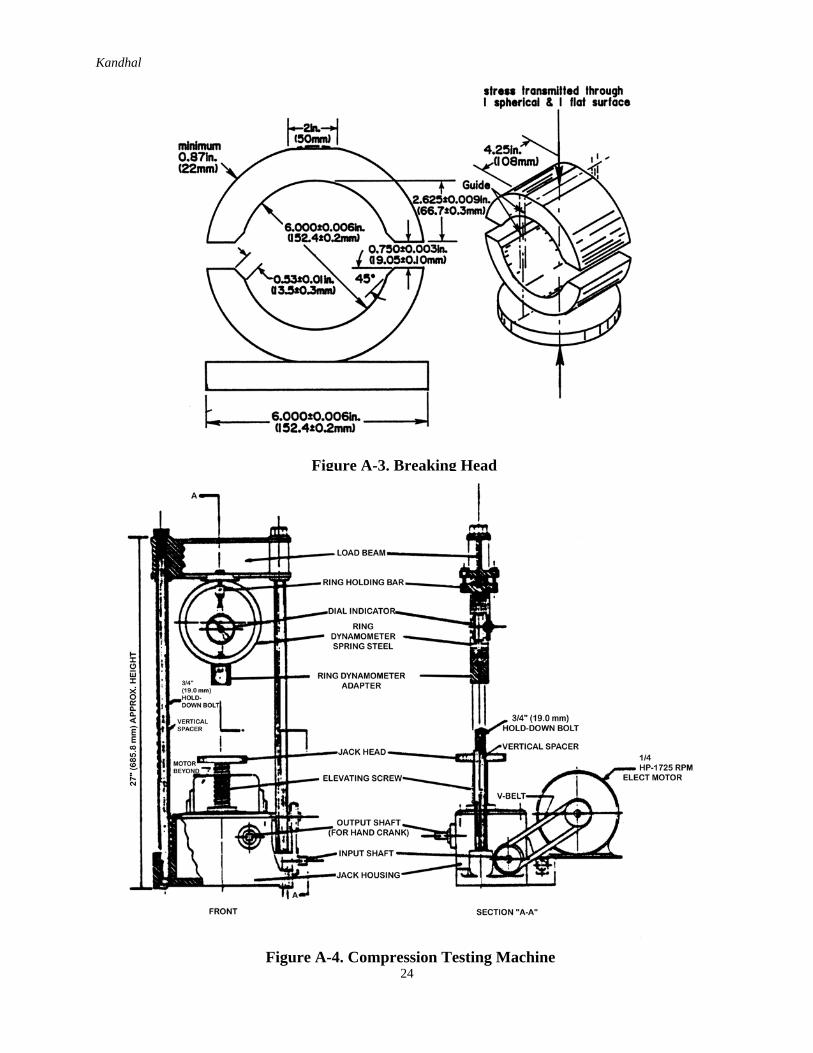
3.6 Breaking Head - The breaking head (Figure A-3) shall consist of upper and lowercylindrical segments or test heads having an inside radius of curvature of 3 in. (76.2mm) accurately machined. The lower segment shall be mounted on a base having twoperpendicular guide rods or posts extending upward. Guide sleeves in the uppersegments shall be in such a position as to direct the two segments together withoutappreciable binding or loose motion on the guide rods. When a 6.000 in. (152.4 mm)diameter by 4 in. (100 mm) thick metal block is placed between the two segments, theinside diameters and the gaps between the segments shall conform to Figure A-3. Allsteel components shall be plated.
3.7 Loading Jack - The loading jack (Figure A-4) shall consist of a screw jack mounted in atest frame and shall produce a uniform vertical movement of 2 in. (50.8 mm)/min. Anelectric motor may be attached to the jacking mechanism.
NOTE 1- Instead of the loading jack, a mechanical or hydraulic testing machine may be usedprovided the rate of movement can be maintained at 2 in. (50.8 mm)/min while the load isapplied.
3.8 Ring Dynamometer Assembly - One ring dynamometer (Figure A-4) of 10,000-lb.(4536-kg) capacity and sensitivity of 10 lb (4.536 kg) up to 1000 lb (453.6 kg) and 25lb (11.340 kg) between 1000 and 10,000 lb (453.6 and 4536 kg) shall be equipped witha micrometer dial. The micrometer dial shall be graduated on 0.0001 in (0.0025 mm).Upper and lower ring dynamometer attachments are required for fastening the ringdynamometer to the testing frame and transmitting the load to the breaking head.
NOTE 2 - Instead of the ring dynamometer assembly, any suitable load-measuring devicemay be used provided the capacity and sensitivity meet the above requirements.
3.9 Flowmeter - The flowmeter shall consist of a guide sleeve and a gage. The activatingpin of the gage shall slide inside the guide sleeve with a slight amount of frictionalresistance. The guide sleeve shall slide freely over the guide rod of the breaking head.The flowmeter gage shall be adjusted to zero when placed in position on the breakinghead when each individual test specimen is inserted between the breaking headsegments. Graduations of the flowmeter gage shall be in 0.0 l-in (0.25-mm) divisions.
NOTE 3- Instead of the flowmeter, a micrometer dial or stress-strain recorder graduated in0.001 in (0.025-mm) may be used to measure flow.
3.10 Ovens or Hot Plates - Ovens or hot plates shall be provided for heating aggregates,bituminous material, specimen molds, compaction hammers, and other equipment tothe required mixing and molding temperatures. It is recommended that the heating unitsbe thermostatically controlled so as to maintain the required temperature within 5°F(2.8°C). Suitable shields, baffle plates or sand baths shall be used on the surfaces of thehot plates to minimize localized overheating.
Kandhal
22
Figure A-1(b). Specimen Mold Holder

Kandhal
23
Figure A-2. Compaction Hammer
Kandhal
24
Figure A-3. Breaking Head
Figure A-4. Compression Testing Machine
Kandhal
25
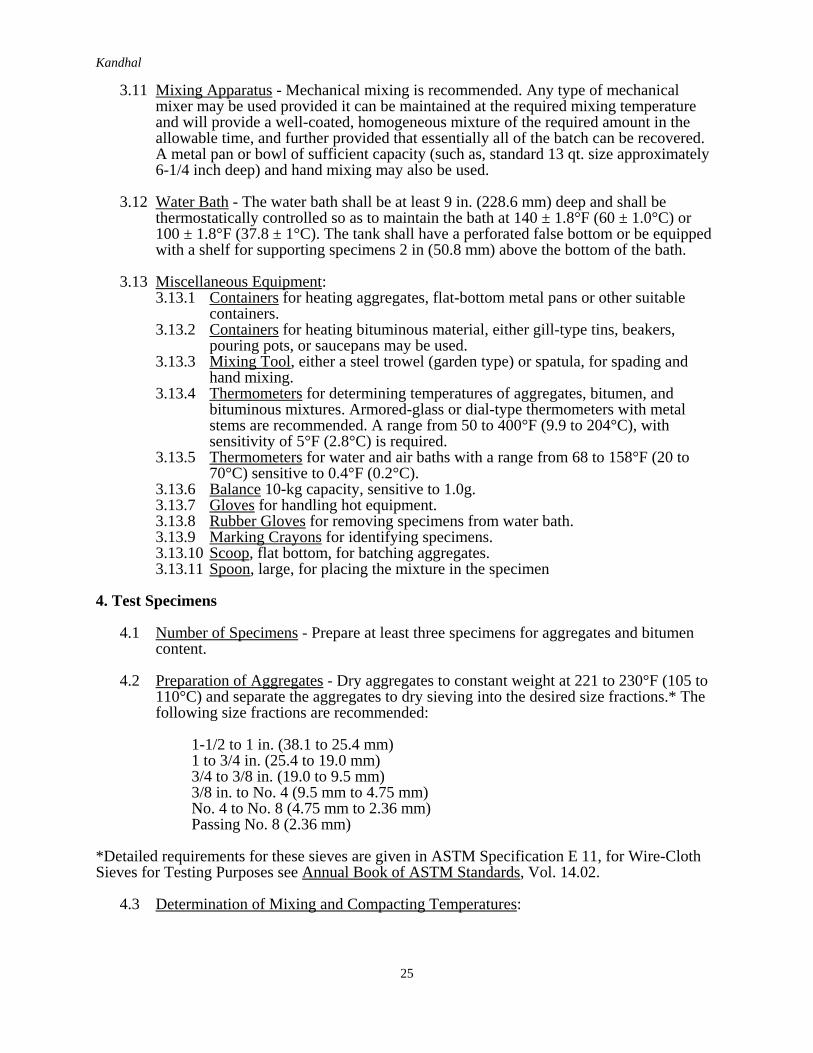
3.11 Mixing Apparatus - Mechanical mixing is recommended. Any type of mechanicalmixer may be used provided it can be maintained at the required mixing temperatureand will provide a well-coated, homogeneous mixture of the required amount in theallowable time, and further provided that essentially all of the batch can be recovered.A metal pan or bowl of sufficient capacity (such as, standard 13 qt. size approximately6-1/4 inch deep) and hand mixing may also be used.
3.12 Water Bath - The water bath shall be at least 9 in. (228.6 mm) deep and shall bethermostatically controlled so as to maintain the bath at 140 ± 1.8°F (60 ± 1.0°C) or100 ± 1.8°F (37.8 ± 1°C). The tank shall have a perforated false bottom or be equippedwith a shelf for supporting specimens 2 in (50.8 mm) above the bottom of the bath.
3.13 Miscellaneous Equipment:3.13.1 Containers for heating aggregates, flat-bottom metal pans or other suitable
containers.3.13.2 Containers for heating bituminous material, either gill-type tins, beakers,
pouring pots, or saucepans may be used.3.13.3 Mixing Tool, either a steel trowel (garden type) or spatula, for spading and
hand mixing.3.13.4 Thermometers for determining temperatures of aggregates, bitumen, and
bituminous mixtures. Armored-glass or dial-type thermometers with metalstems are recommended. A range from 50 to 400°F (9.9 to 204°C), withsensitivity of 5°F (2.8°C) is required.
3.13.5 Thermometers for water and air baths with a range from 68 to 158°F (20 to70°C) sensitive to 0.4°F (0.2°C).
3.13.6 Balance 10-kg capacity, sensitive to 1.0g.3.13.7 Gloves for handling hot equipment.3.13.8 Rubber Gloves for removing specimens from water bath.3.13.9 Marking Crayons for identifying specimens.3.13.10 Scoop, flat bottom, for batching aggregates.3.13.11 Spoon, large, for placing the mixture in the specimen
4. Test Specimens
4.1 Number of Specimens - Prepare at least three specimens for aggregates and bitumencontent.
4.2 Preparation of Aggregates - Dry aggregates to constant weight at 221 to 230°F (105 to110°C) and separate the aggregates to dry sieving into the desired size fractions.* Thefollowing size fractions are recommended:
1-1/2 to 1 in. (38.1 to 25.4 mm)1 to 3/4 in. (25.4 to 19.0 mm)3/4 to 3/8 in. (19.0 to 9.5 mm)3/8 in. to No. 4 (9.5 mm to 4.75 mm)No. 4 to No. 8 (4.75 mm to 2.36 mm)Passing No. 8 (2.36 mm)
*Detailed requirements for these sieves are given in ASTM Specification E 11, for Wire-ClothSieves for Testing Purposes see Annual Book of ASTM Standards, Vol. 14.02.
4.3 Determination of Mixing and Compacting Temperatures:

Kandhal
26
4.3.1 The temperatures to which the asphalt cement and asphalt cut-back must beheated to produce a viscosity of 170 ± 20 cSt shall be the mixing temperature.
4.3.2 The temperature to which asphalt cement must be heated to produce a viscosity of280 ± 30 cSt shall be the compacting temperature.
4.4 Preparation of Mixtures:
4.4.1 Weigh into separate pans for each test specimen the amount of each size fractionrequired to produce a batch that will result in a compacted specimen 3.75 ± 0.10in (95.2 ± 2.54 mm) in height (about 4050 g). Place the pans on the hot plate or inthe oven and heat to a temperature not exceeding the mixing temperatureestablished in 4.3 by more than approximately 50°F (28°C). Charge the mixingbowl with the heated aggregate and dry mix thoroughly. Form a crater in the dryblended aggregate and weigh the preheated required amount of bituminousmaterial into the mixture. Care must be exercised to prevent loss of the mixduring mixing and subsequent handling. At this point, the temperature of theaggregate and bituminous material shall be within the limits of the mixingtemperature established in 4.3. Mix the aggregate and bituminous material rapidlyuntil thoroughly coated.
4.5 Compaction of Specimens:
4.5.1 Thoroughly clean the specimen mold assembly and the face of the compactionhammer and heat them either in boiling water or on the hot plate to a temperaturebetween 200 and 300°F (93.3 and 148.9°C). Place a piece of filter paper or papertoweling cut to size in the bottom of the mold before the mixture is introduced.Place approximately one half of the batch in the mold, spade the mixturevigorously with a heated spatula or trowel 15 times around the perimeter and 10times over the interior. Place the second half of the batch in the mold and repeatthe foregoing procedure. Remove the collar and smooth the surface of the mixwith a trowel to a slightly rounded shape. Place a piece of filter paper or papertoweling cut to size on top of the mix. Temperatures of the mixtures immediatelyprior to compaction shall be within the limits of the compacting temperatureestablished in 4.3.
4.5.2 Replace the collar, place the mold assembly on the compaction pedestal in themold holder, and unless otherwise specified, apply 75 blows with the compactionhammer with a free fall of 18 in (457.2 mm). Remove the base plate and collar,and reverse and reassemble the mold. Apply the same number of compactionblows to the face of the reversed specimen.
NOTE 3 - It has been determined that 75 and 112 compaction blows applied to a 6-inch (38.1 mm) diameter specimen using the apparatus and procedure in this standard give densitiesequivalent to 50 and 75 compaction blows, respectively, applied to a 4-inch (101.6 mm)diameter specimen using ASTM D 1559.
4.5.3 After compaction, remove the base plate and place the sample extractor on thatend of the specimen. Place the assembly with the extension collar up in the testingmachine, apply pressure to the collar by means of the load transfer bar, and forcethe specimen into the extension collar. Lift the collar from the specimen.Carefully transfer the specimen to a smooth, flat surface and allow it to standovernight at room temperature. Weigh, measure, and test the specimen.

Kandhal
27
NOTE 4 - In general, specimens shall be cooled as specified in 4.5.3. When more rapidcooling is desired, table fans may be used. Mixtures that lack sufficient cohesion to result inthe required cylindrical shape on removal from the mold immediately after compaction maybe cooled in the mold in air until sufficient cohesion has developed to result in the propercylindrical shape.
5. Procedure
5.1 Bring the specimens to the specified temperature by immersing in the water bath 30 to40 min. or placing in the oven for 2 hr. Maintain the bath or oven temperature at 140 ±1.8°F (60 ± 1.0°C). Thoroughly clean the guide rods and the inside surfaces of the testheads prior to making the test, and lubricate the guide rods so that the upper test headslides freely over them. The testing-head temperature shall be maintained between 70to 100°F (21.1 to 37.8°C) using a water bath when required. Remove the specimenfrom the water bath, oven, or air bath, and place in the lower segment of the breakinghead. Place the upper segment of the breaking head on the specimen, and place thecomplete assembly in position on the testing machine. Place the flowmeter, where used,in position over one of the guide rods and adjust the flowmeter to zero while holdingthe sleeve firmly against the upper segment of the breaking head. Hold the flowmetersleeve firmly against the upper segment of the breaking head while the test load isbeing applied.
5.2 Apply the load to the specimen by means of the constant rate of movement of the loadjack or testing-machine head of 2 in. (50.8mm)/min. until the maximum load is reachedand the load decreases as indicated by the dial. Record the maximum load noted on thetesting machine or converted from the maximum micrometer dial reading. Release theflowmeter sleeve or note the micrometer dial reading where used, the instant themaximum load begins to decrease. Note and record the indicated flow value orequivalent units in hundredths of an inch (twenty-five hundredths of a millimeter) if amicrometer dial is used to measure the flow. The elapsed time for the test from removalof the test specimen from the water bath to the maximum load determination shall notexceed 30 s.
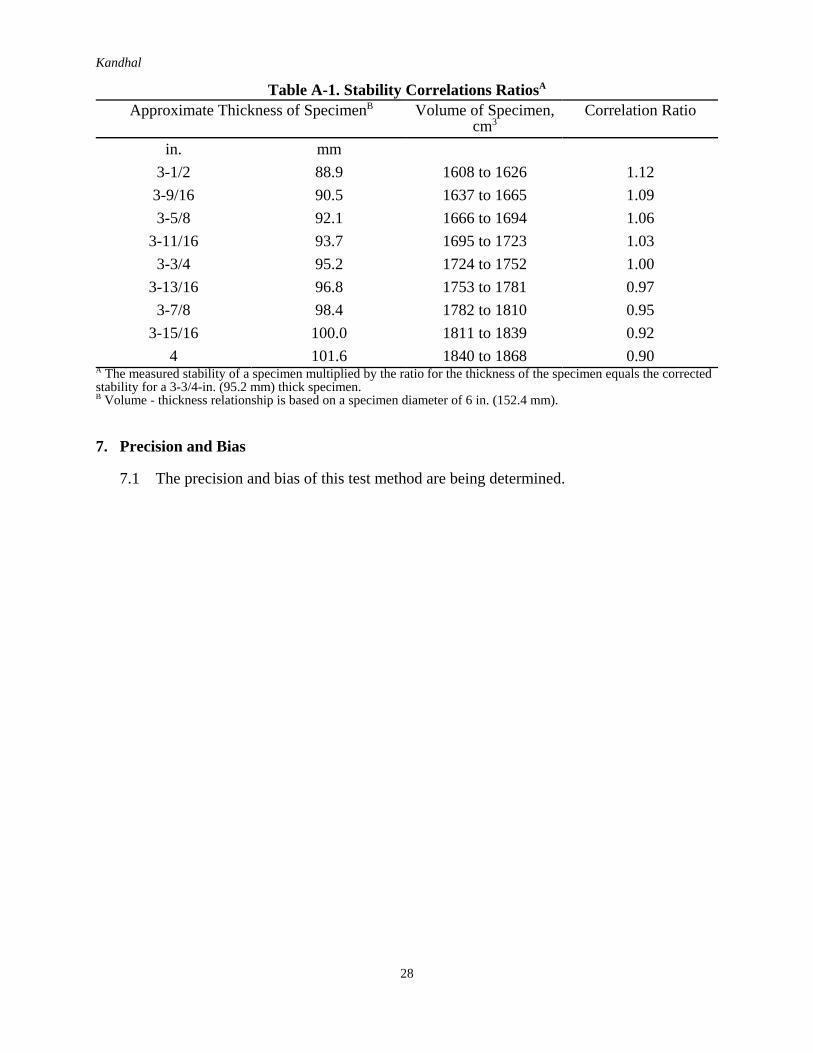
NOTE 5 - For core specimens, correct the load when thickness is other than 3.75 in. (95.2mm) by using the proper multiplying factor from Table A-1. This table has been developedafter Table 1 of ASTM D 1559 basing the correlation ratio on the percent change inspecimen volume from standard specimen volume.
6. Report
6.1 The report shall include the following information:
6.1.1 Type of sample tested (laboratory sample or pavement core specimen).
NOTE 6 - For core specimens, the height of each test specimen in inches (or millimeters)shall be reported.
6.1.2 Average maximum load in pounds-force (or newtons) of a least three specimens,corrected when required.
6.1.3 Average flow value, in hundredths of an inch; twenty-five hundredths of amillimeter, of three specimens, and
6.1.4 Test temperature.
Kandhal
28
Table A-1. Stability Correlations RatiosA
Approximate Thickness of SpecimenB Volume of Specimen,cm3
Correlation Ratio
in. mm
3-1/2 88.9 1608 to 1626 1.12
3-9/16 90.5 1637 to 1665 1.09
3-5/8 92.1 1666 to 1694 1.06
3-11/16 93.7 1695 to 1723 1.03
3-3/4 95.2 1724 to 1752 1.00
3-13/16 96.8 1753 to 1781 0.97
3-7/8 98.4 1782 to 1810 0.95
3-15/16 100.0 1811 to 1839 0.92
4 101.6 1840 to 1868 0.90A The measured stability of a specimen multiplied by the ratio for the thickness of the specimen equals the correctedstability for a 3-3/4-in. (95.2 mm) thick specimen.B Volume - thickness relationship is based on a specimen diameter of 6 in. (152.4 mm).
7. Precision and Bias
7.1 The precision and bias of this test method are being determined.