Embed Size (px)
Citation preview

Preventing Pre-mature Rutting
Dr Greg ArnoldEngineering Policy ManagerTransit New Zealand
Preventing Premature Rutting
• Rutting – where and why• Preventing rutting from compaction
– Strong construction platform– Changes to TNZ B2
• Preventing rutting from shear movement within materials
• Choosing the best pavement appropriate for traffic and environment
• Lowest initial cost or lowest whole of life costs, considering risk of failure
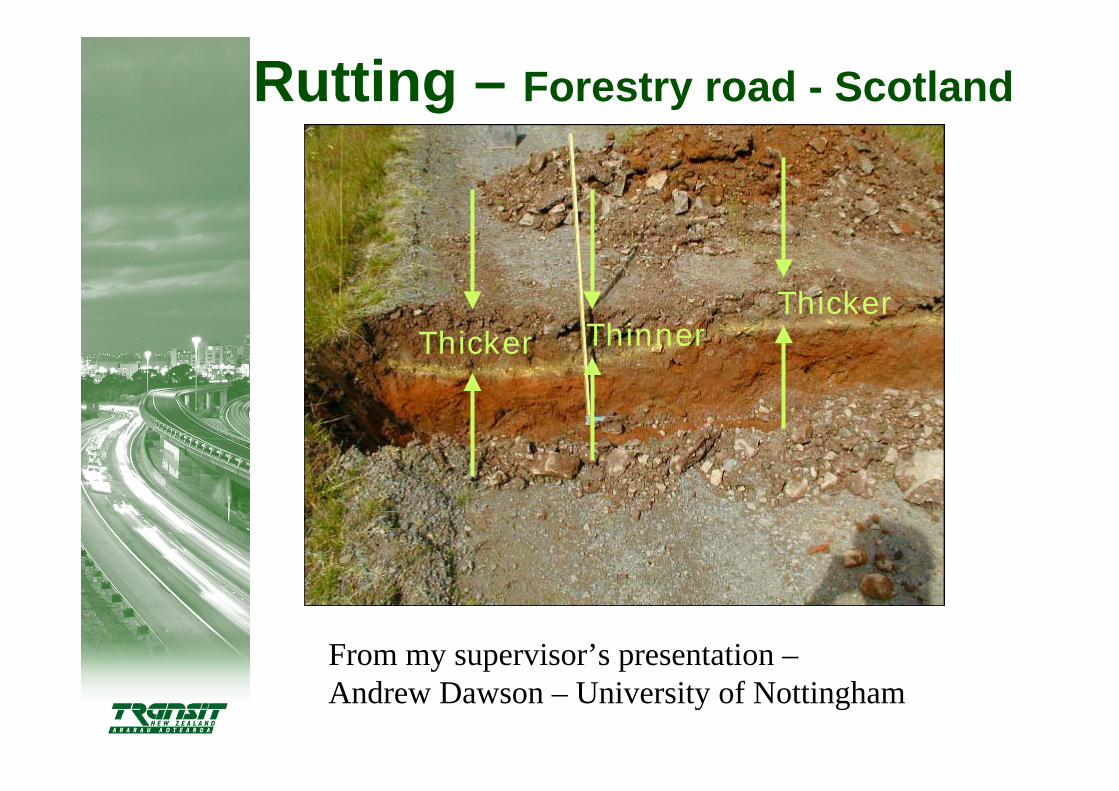
Rutting – Forestry road - Scotland
Thicker ThinnerThicker
From my supervisor’s presentation –Andrew Dawson – University of Nottingham
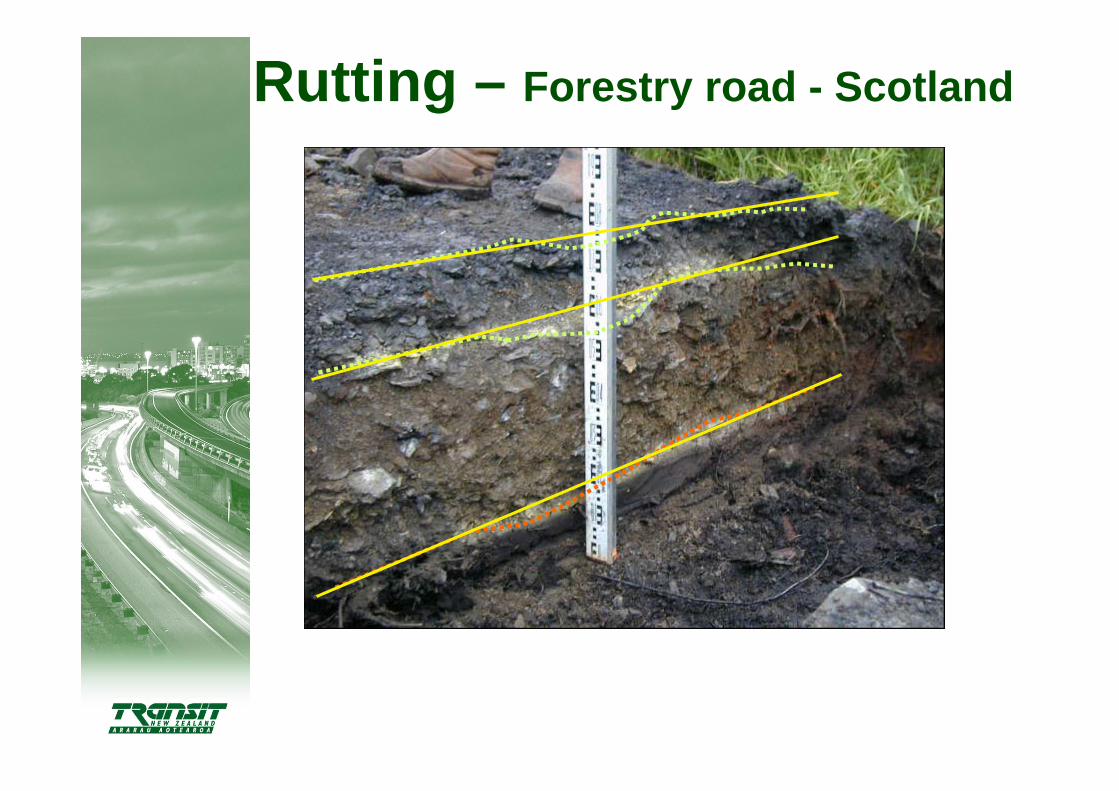
Rutting – Forestry road - Scotland
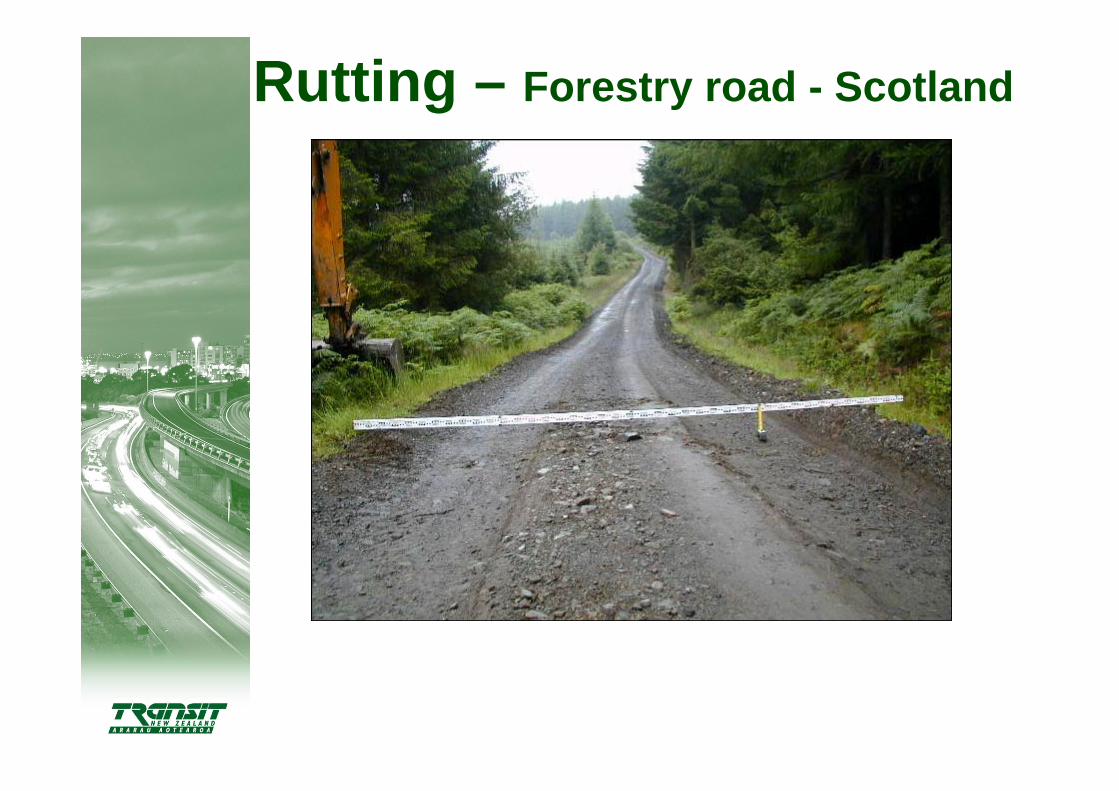
Rutting – Forestry road - Scotland
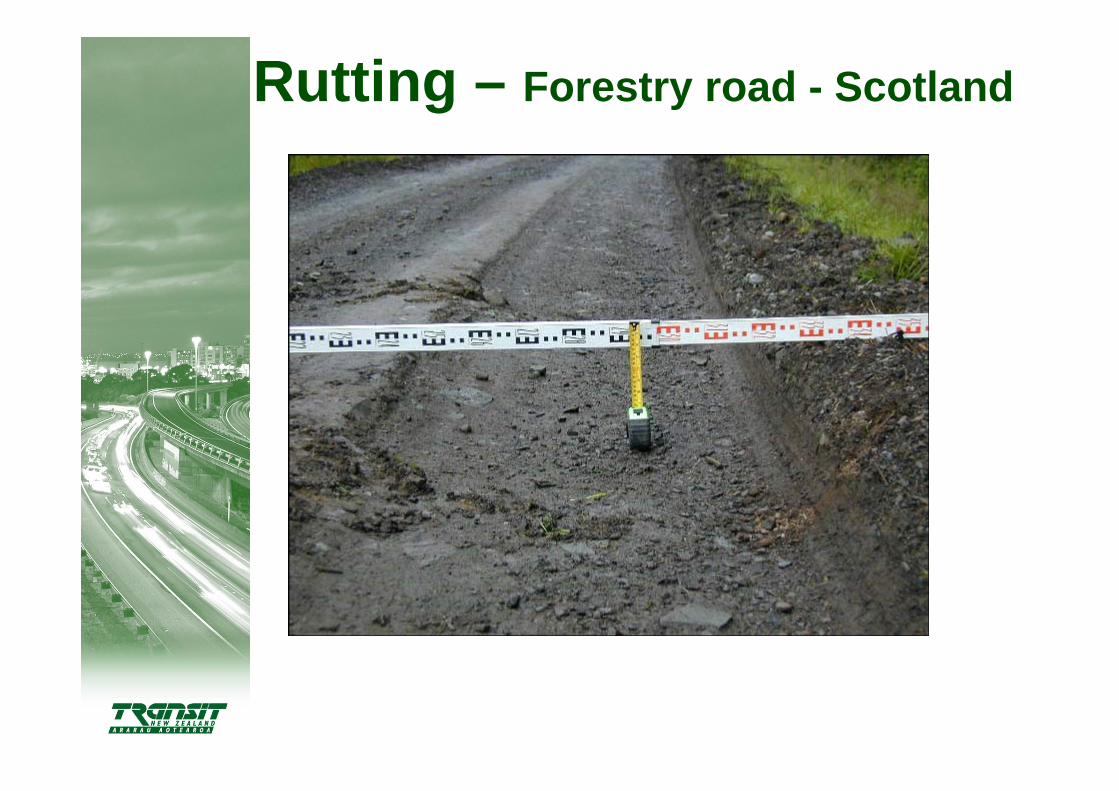
Rutting – Forestry road - Scotland
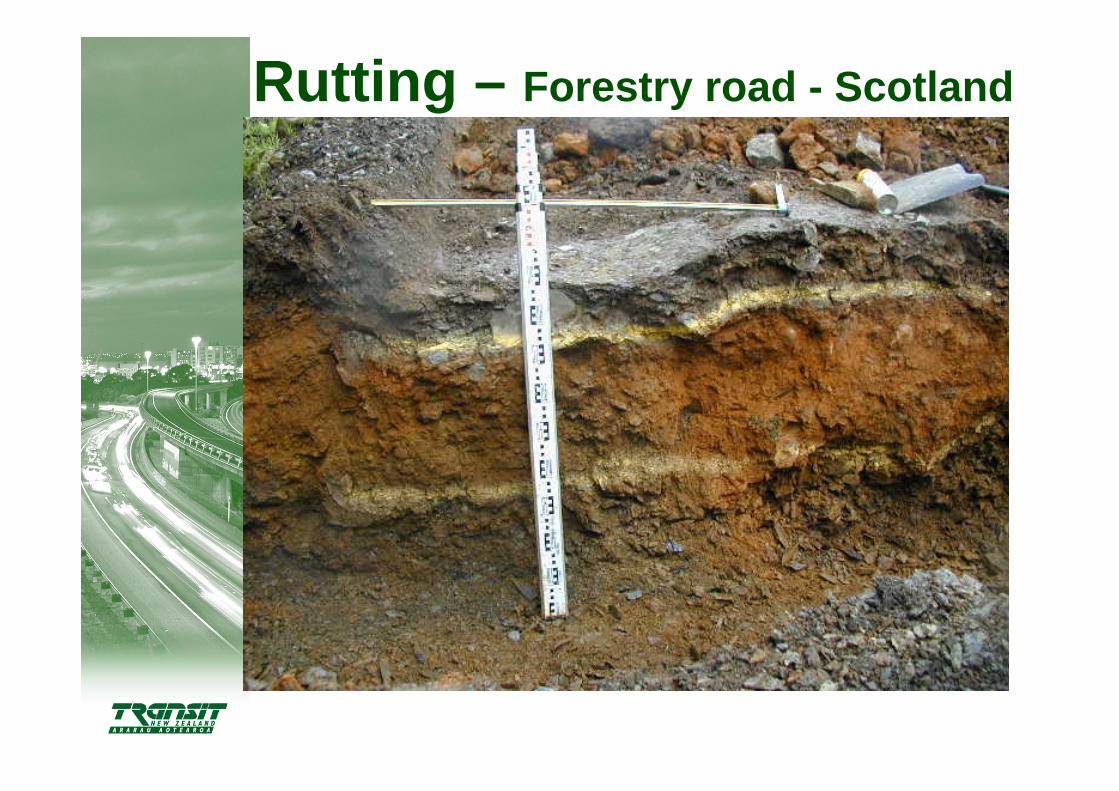
Rutting – Forestry road - Scotland
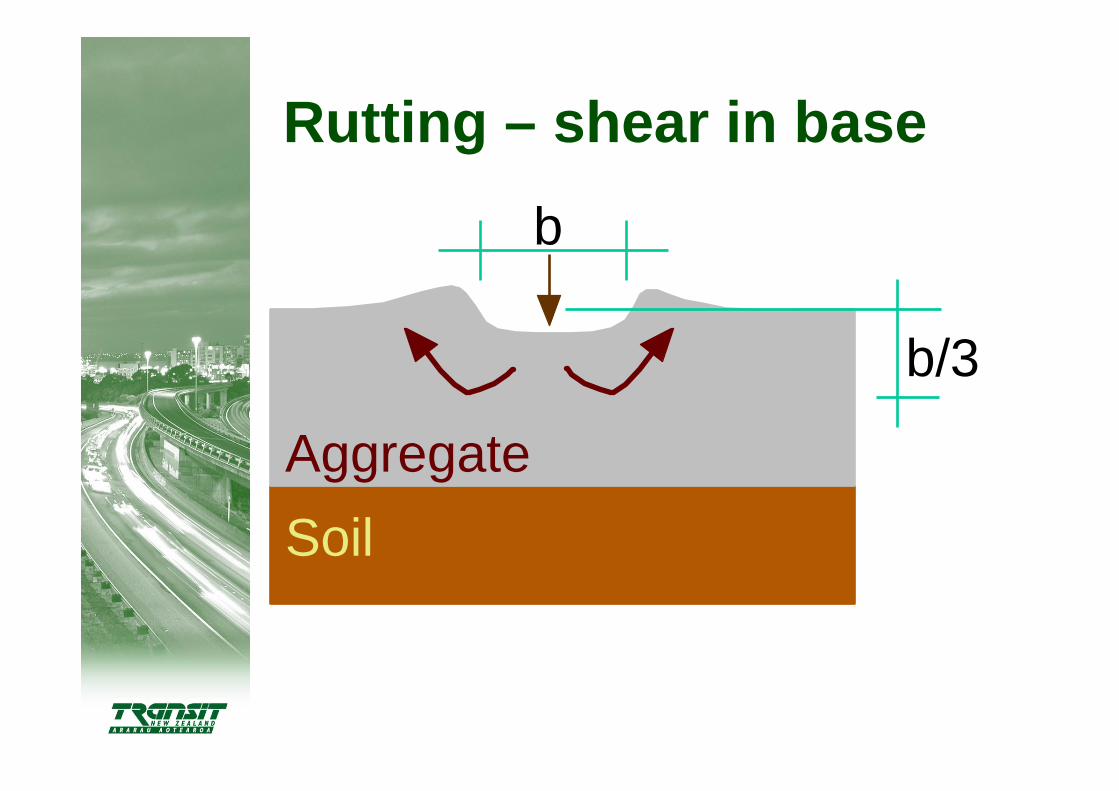
Rutting – shear in base
AggregateSoil
b
b/3
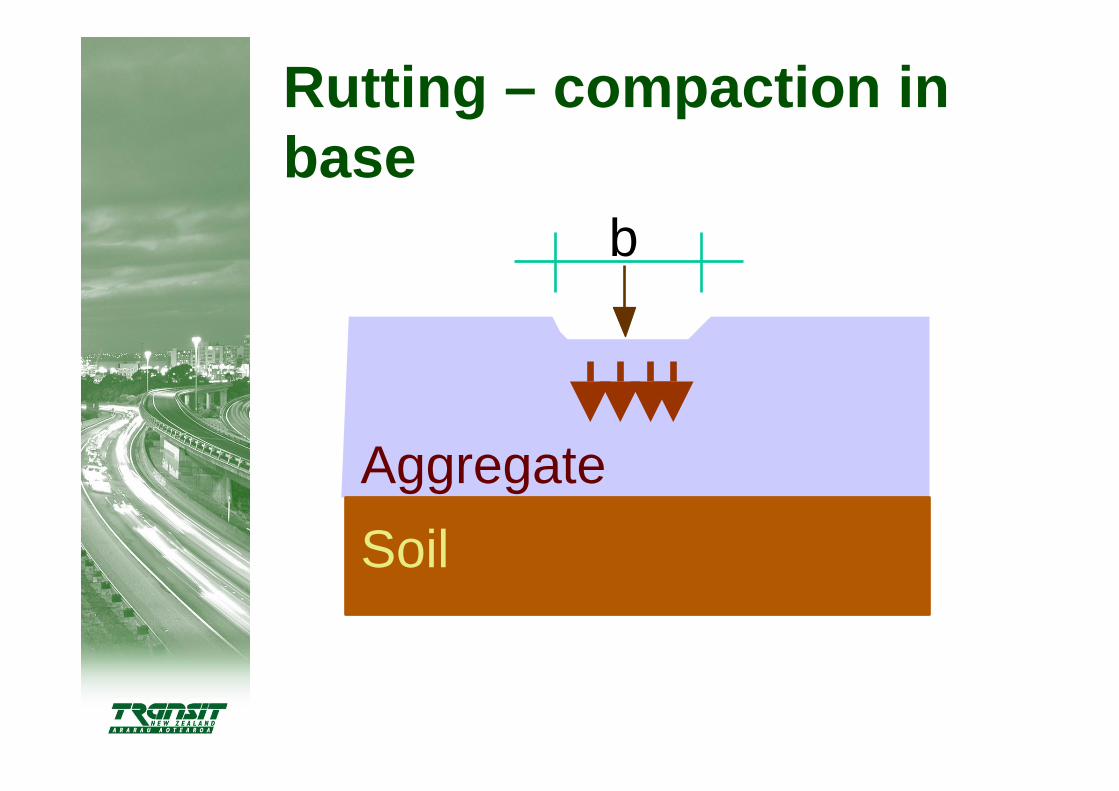
Rutting – compaction in base
AggregateSoil
b
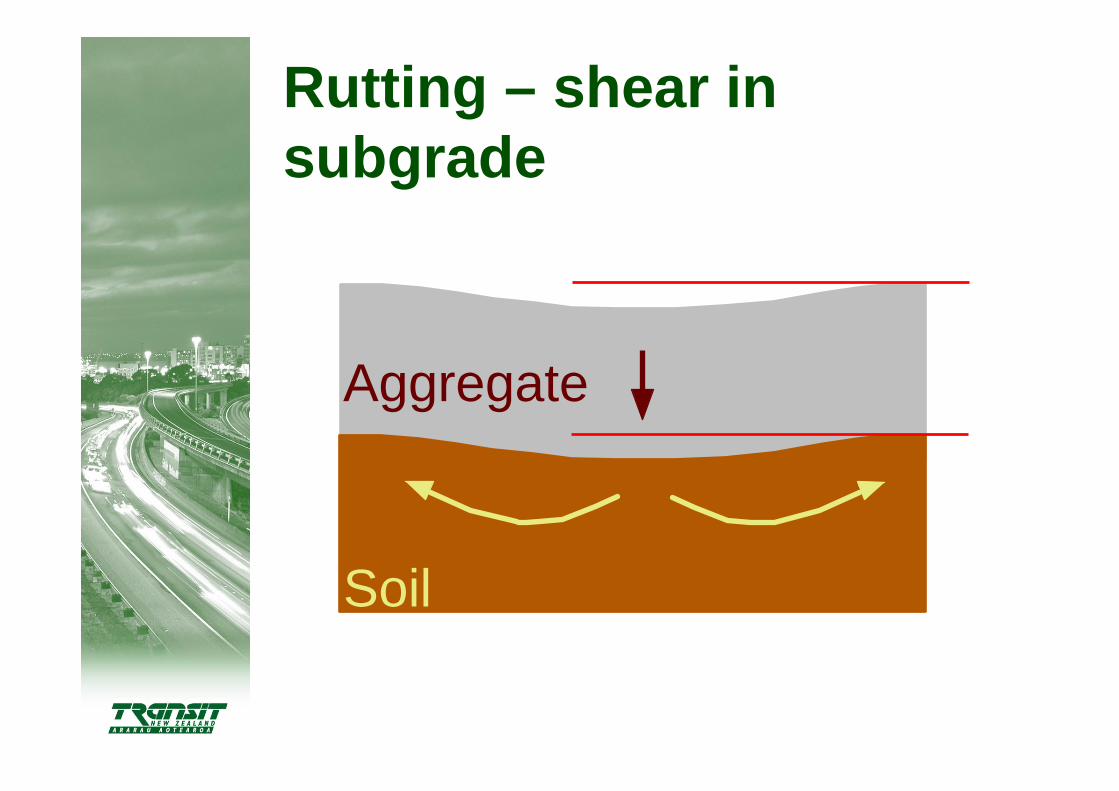
Rutting – shear in subgrade
Aggregate
Soil
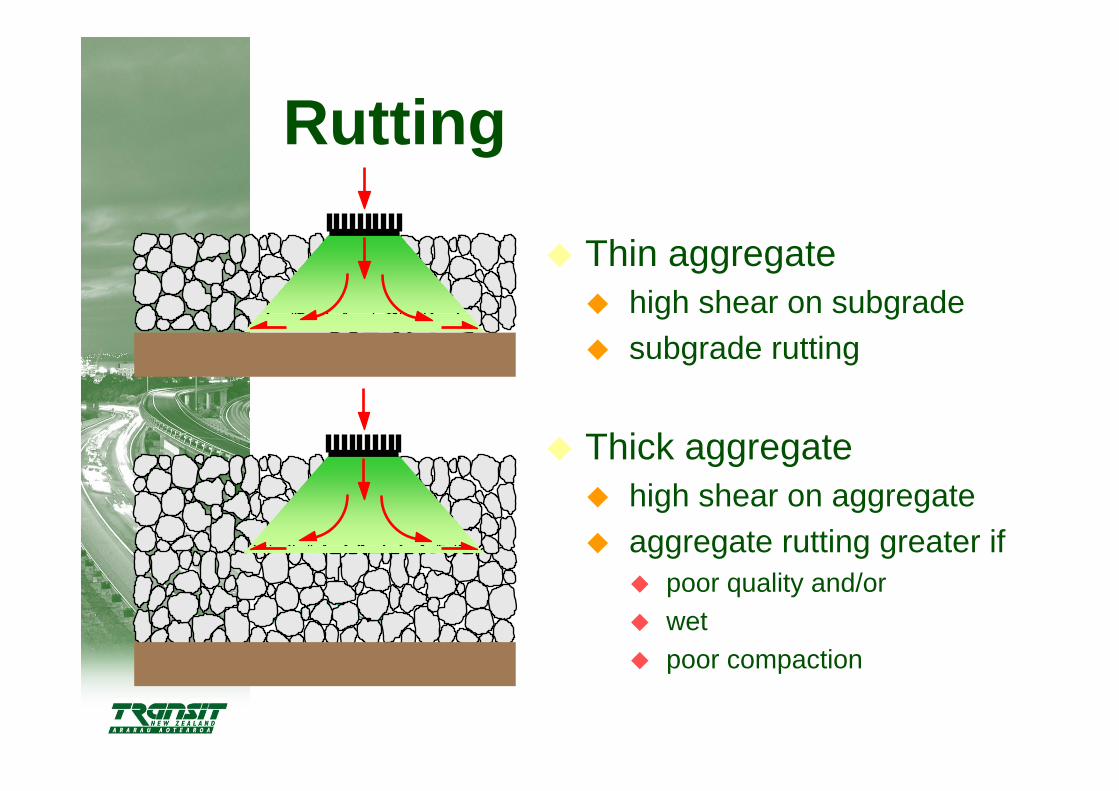
Rutting
Thin aggregatehigh shear on subgradesubgrade rutting
Thick aggregatehigh shear on aggregateaggregate rutting greater if
poor quality and/orwetpoor compaction
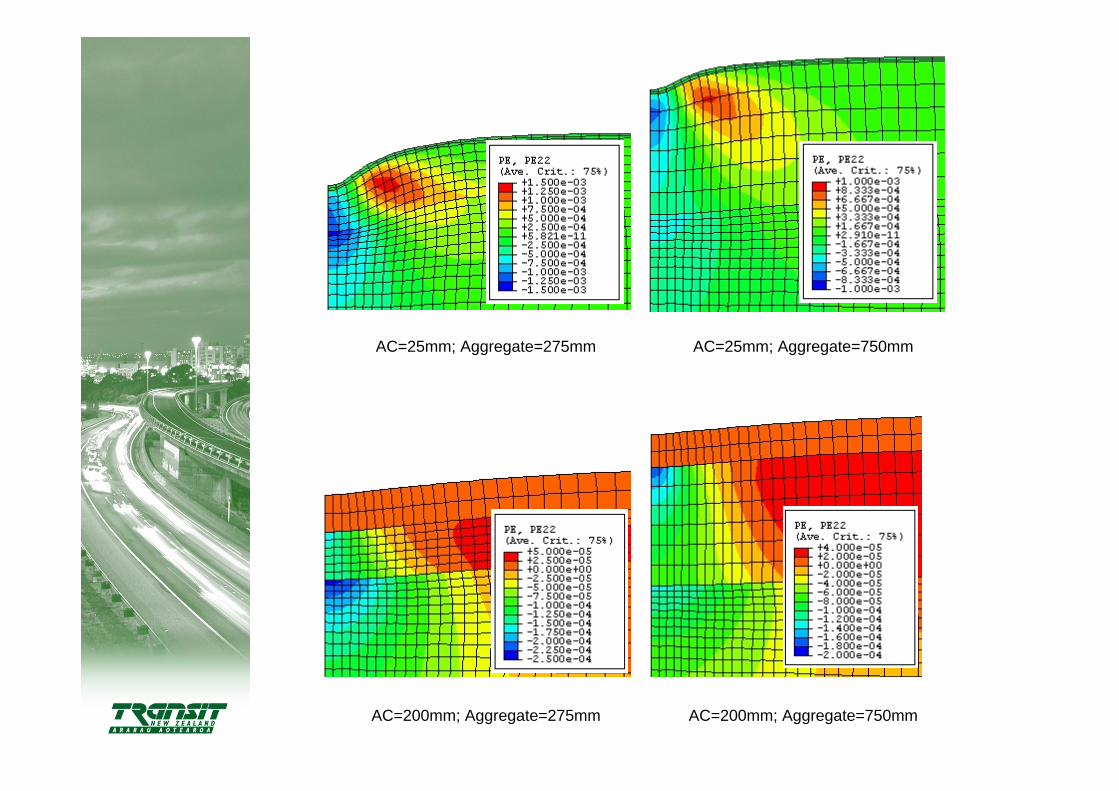
AC=25mm; Aggregate=275mm AC=25mm; Aggregate=750mm
AC=200mm; Aggregate=275mm AC=200mm; Aggregate=750mm
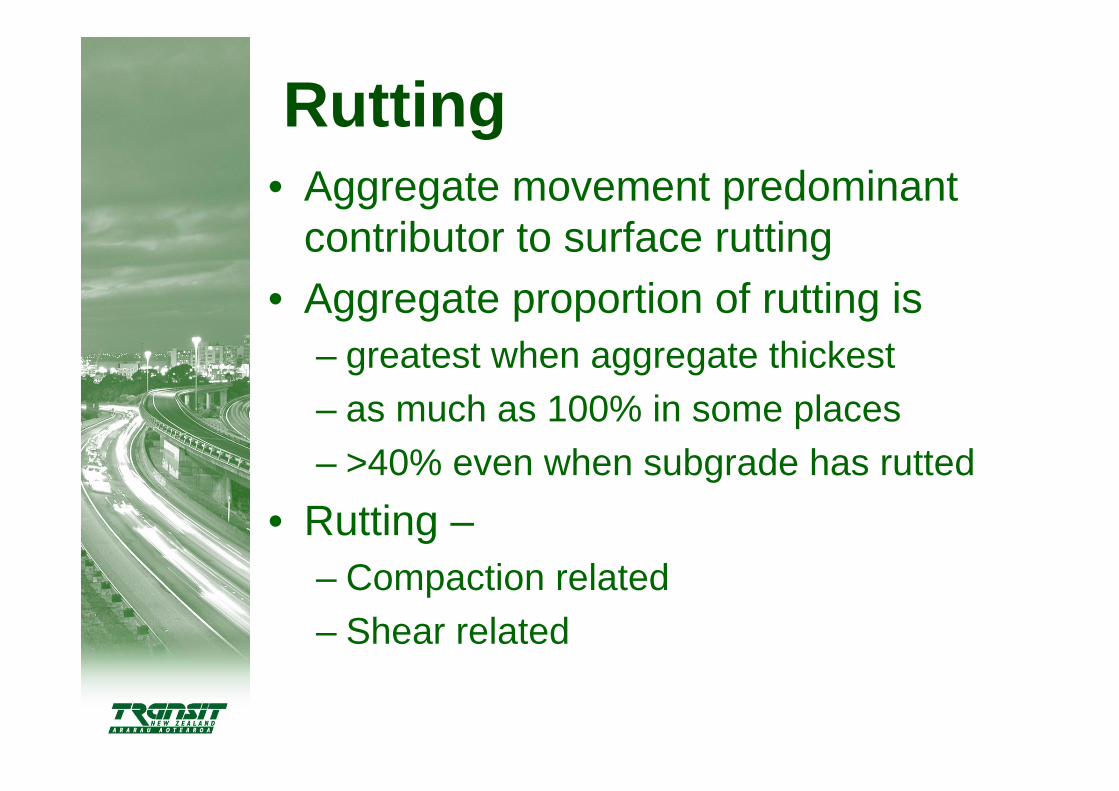
Rutting• Aggregate movement predominant
contributor to surface rutting• Aggregate proportion of rutting is
– greatest when aggregate thickest– as much as 100% in some places– >40% even when subgrade has rutted
• Rutting –– Compaction related– Shear related

Rutting
0
5
10
15
20
0 500 1000 1500 2000 2500 3000
Laps ('000's)
Rut
Dep
th (m
m)
Shear2mm per 1M
Compaction andConsolidation (build up of residual stresses
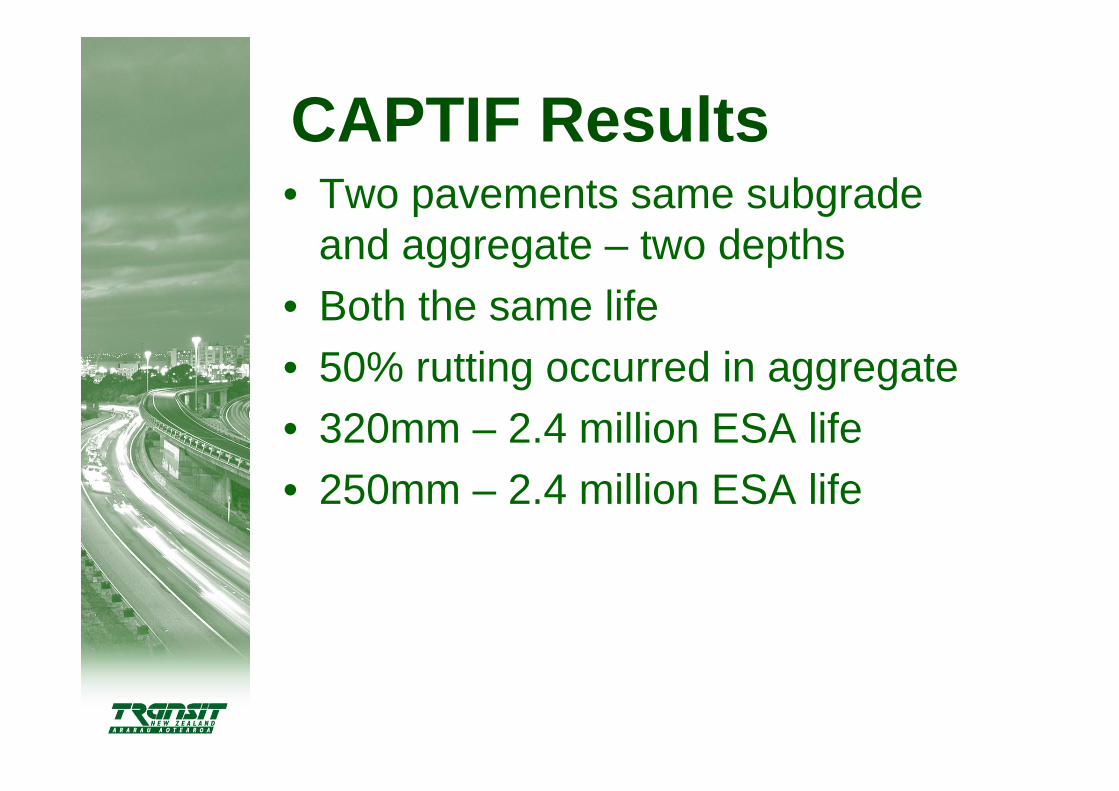
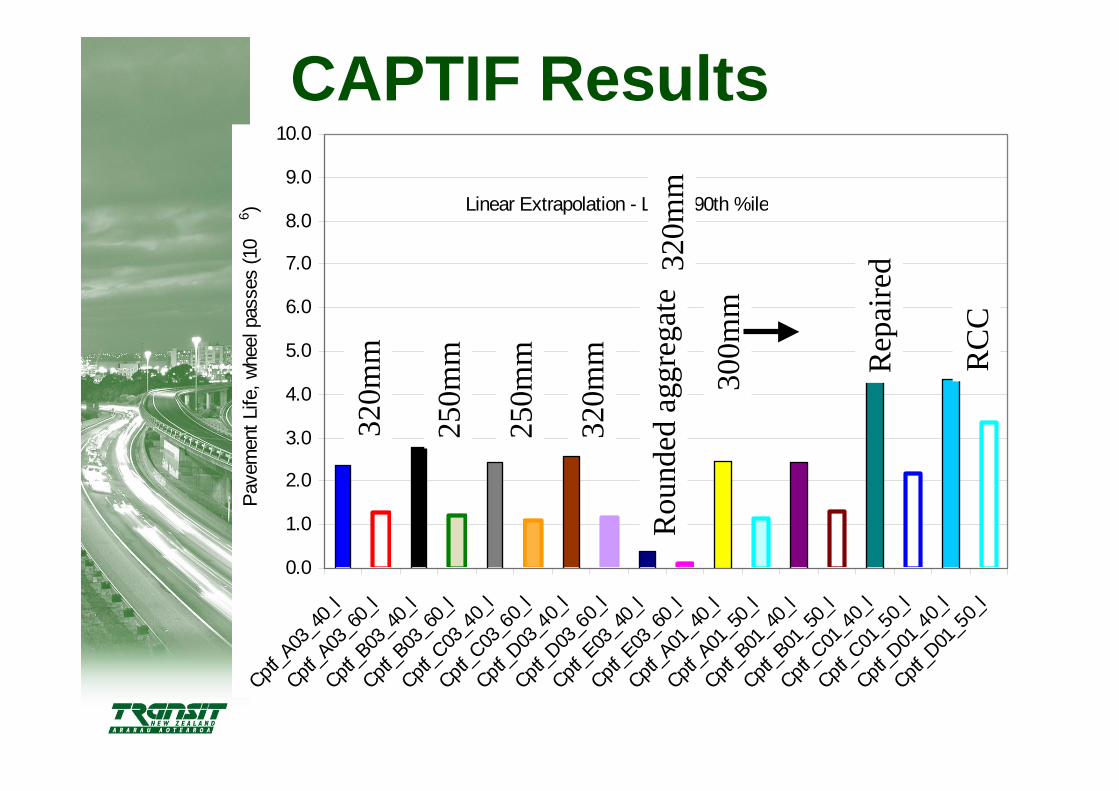
CAPTIF Results• Two pavements same subgrade
and aggregate – two depths• Both the same life• 50% rutting occurred in aggregate• 320mm – 2.4 million ESA life• 250mm – 2.4 million ESA life
0.0
1.0
2.0
3.0
4.0
5.0
6.0
7.0
8.0
9.0
10.0
Cptf_A
03_4
0_l
Cptf_A
03_6
0_l
Cptf_B
03_4
0_l
Cptf_B
03_6
0_l
Cptf_C
03_4
0_l
Cptf_C
03_6
0_l
Cptf_D
03_4
0_l
Cptf_D
03_6
0_l
Cptf_E
03_4
0_l
Cptf_E
03_6
0_l
Cptf_A
01_4
0_l
Cptf_A
01_5
0_l
Cptf_B
01_4
0_l
Cptf_B
01_5
0_l
Cptf_C
01_4
0_l
Cptf_C
01_5
0_l
Cptf_D
01_4
0_l
Cptf_D
01_5
0_l
Pave
men
t Life
, whe
el p
asse
s (1
06 ) Linear Extrapolation - Lower 90th %ile
RC
C
Rep
aire
d
Rou
nded
agg
rega
te
CAPTIF Results
320m
m
250m
m
250m
m
320m
m
320m
m
300m
m
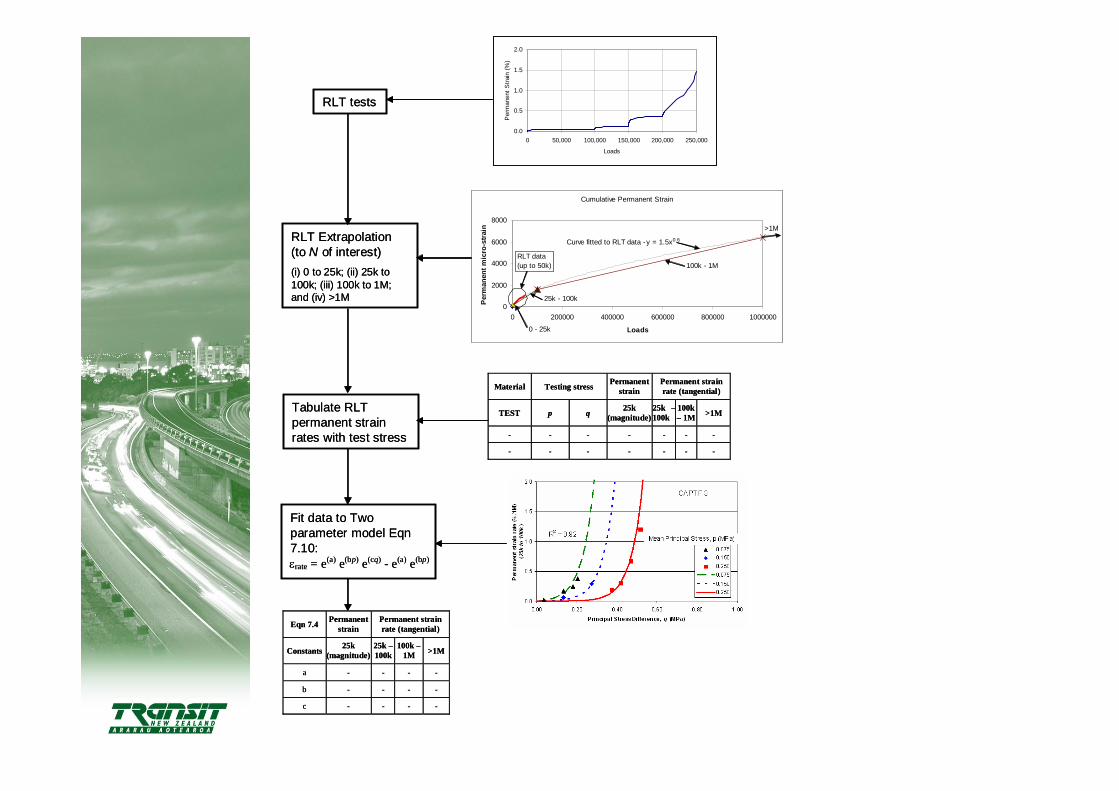
RLT tests
0.0
0.5
1.0
1.5
2.0
0 50,000 100,000 150,000 200,000 250,000
Loads
Per
man
ent S
train
(%)
RLT Extrapolation (to N of interest)(i) 0 to 25k; (ii) 25k to 100k; (iii) 100k to 1M; and (iv) >1M
Cumulative Permanent Strain
y = 1.5x0.6
0
2000
4000
6000
8000
0 200000 400000 600000 800000 1000000
Loads
Per
man
ent m
icro
-str
ain
100k - 1M
25k - 100k
RLT data(up to 50k)
>1M
0 - 25k
Curve fitted to RLT data -
Material Testing stress Permanent strain
Permanent strain rate (tangential)
TEST p q 25k (magnitude)
25k –100k
100k – 1M >1M
- - - - - - -
- - - - - - -
Tabulate RLT permanent strain rates with test stress
Fit data to Two parameter model Eqn7.10: εrate = e(a) e(bp) e(cq) - e(a) e(bp)
Eqn 7.4 Permanent strain
Permanent strain rate (tangential)
Constants 25k (magnitude)
25k –100k
100k –1M >1M
a - - - -
b - - - -
c - - - -

Transit NZ• Aim to develop a RLT test methodology
to classify basecoarse (those in top layer) aggregates for:
• High, medium or low traffic for both wet and dry conditions
• Currently favour Arnold simplified for this