Embed Size (px)
Citation preview

Analyses of Laboratory and Accelerated Pavement Testing Data for Warm-Mix Asphalt Using California Mechanistic-Empirical Design Method R. Wu1, D. Jones1, I. Basheer2, and Venkata Mandapaka2 1University of California Pavement Research Center, USA. 2California Department of Transportation, Sacramento, California Abstract: As part of the study to evaluate warm-mix asphalt performance for use in California, an extensive testing program has been conducted at University of California Pavement Research Center (UCPRC) on various warm-mix asphalt technologies along with their control mix. The program includes laboratory, field and accelerated pavement testing. The data generated provide all the necessary inputs for running the California Mechanistic-Empirical Design, which has been implemented in a software called CalME. This paper presents analysis of all related data and CalME simulations of various accelerated pavement testing sections on several warm-mix asphalt technologies and their control. CalME was found to provide simulation results that almost perfectly match the shape of the rut accumulation curves during accelerated pavement tests. CalME also predicted no fatigue cracking which matches the observation as well. CalME was then used to evaluate the effect of unbound layer stiffness on rutting performance and it was concluded that the effect was minor and did not affect general conclusion drawn from the accelerated pavement testing results.
Introduction The research presented in this paper is part of Partnered Pavement Research Center Strategic Plan Element 4.18 (PPRC SPE 4.18), titled “Warm-Mix Asphalt Study,” undertaken for the California Department of Transportation (Caltrans) by the University of California Pavement Research Center (UCPRC). The objective of this project is to determine whether and how warm-mix asphalt technologies influence mix production processes, construction procedures, and the short-, medium-, and/or long-term performance of hot-mix asphalt. Specifically, this research is focused on various warm-mix technologies available in 2007 that use additives intended to reduce the production and construction temperatures of asphalt concrete. UCPRC developed a detailed work plan for Heavy Vehicle Simulator (HVS) and laboratory testing in September 2007. Following the work plan, a test track was constructed at the Graniterock A.R. Wilson quarry near Aromas, California with four test cells:
1. Control Cell: conventional dense graded hot mix asphalt (HMA). 2. Advera Cell: HMA mix with Advera WMA® additive. 3. Evotherm Cell: HMA mix with Evotherm DAT™ additive. 4. Sasobit Cell: HMA mix with Sasobit® additive.
In Phase 1 of the study, HVS tests were conducted in each of the four cells to evaluate early rutting potential at elevated temperatures for WMAs. Laboratory tests were carried out on specimens taken from the test track. The results of the research can be found in the project report [1]. In a separate study, UCPRC is developing a mechanistic-empirical (M-E) simulation program called CalME for Caltrans. CalME is a generic program for predicting rutting and cracking performance of new flexible pavements and asphalt overlays. It takes into account the effect of different material, structure, environment and traffic. The models have been calibrated using HVS and WesTrack test results. For more information on CalME, see for example [2-3]. This paper presents analysis of laboratory and HVS test data under the CalME framework. Specifically, laboratory test data were used to develop model parameters for used in CalME. Then CalME is run to predict pavement rutting and fatigue cracking performance which is then compared with HVS test results. The objective of this paper is to validate CalME with data that was not used as part of the calibration.
Data Collection A number of tests were conducted to collect necessary data during the project such as beam bending frequency sweep tests to determine flexural stiffness master curve, bean bending fatigue tests to determine laboratory fatigue performance, and repeated simple shear test at constant height (RSST-CH) to determine permanent deformation. Some of the data were used to develop inputs for running CalME.
Laboratory Testing Laboratory testing was conducted on specimens taken from the test track. These are referred to as field-mixed field-compacted (FMFC) specimens. Samples were taken in the form of slabs 500 mm by 500 mm (20 in.) sawn from an area 20 m by 0.5 m (66 ft by 1.6 ft) along the edge of each cell in the test track as shown in Figure 1. Slabs were sawn to the bottom of the asphalt concrete layers, extracted, stored on pallets, and then transported to the UCPRC Richmond Field Station laboratory. A standard set (see Table 1) of laboratory tests were conducted for each of the four mixes.

Figure 1: Test track sammpling plan aand sample rremoval.
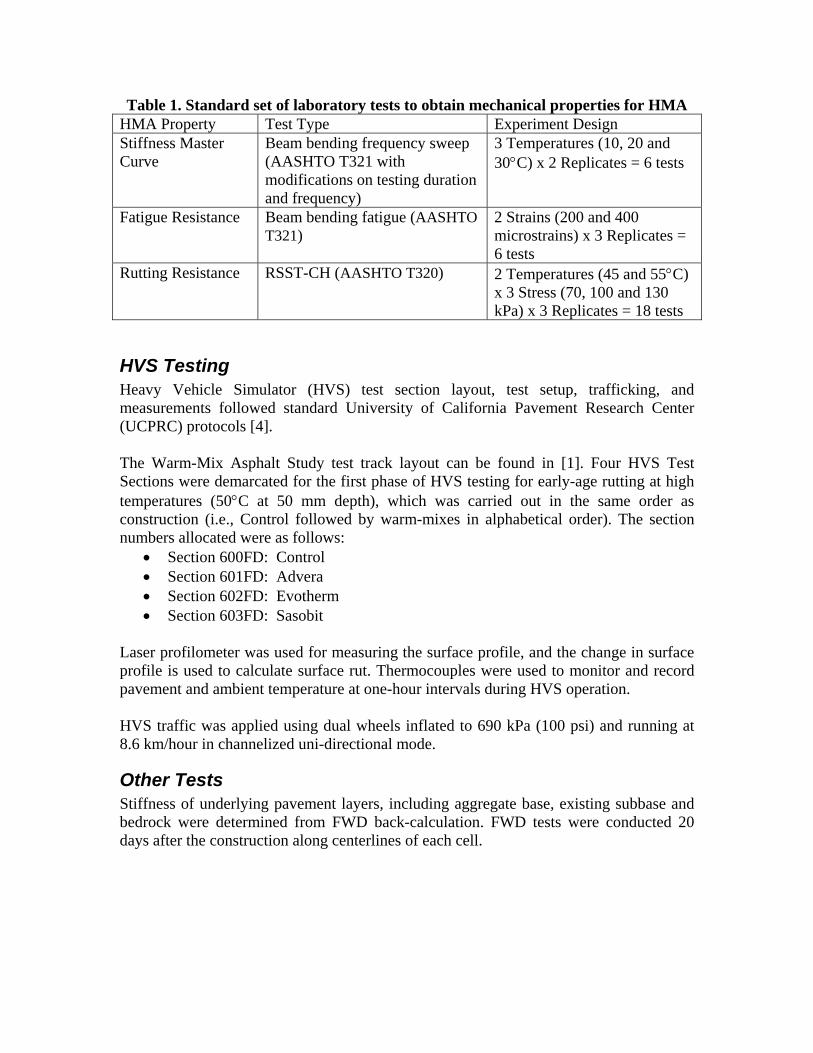
Table 1. Standard set of laboratory tests to obtain mechanical properties for HMA HMA Property Test Type Experiment Design Stiffness Master Curve
Beam bending frequency sweep (AASHTO T321 with modifications on testing duration and frequency)
3 Temperatures (10, 20 and 30C) x 2 Replicates = 6 tests
Fatigue Resistance Beam bending fatigue (AASHTO T321)
2 Strains (200 and 400 microstrains) x 3 Replicates = 6 tests
Rutting Resistance RSST-CH (AASHTO T320) 2 Temperatures (45 and 55C) x 3 Stress (70, 100 and 130 kPa) x 3 Replicates = 18 tests
HVS Testing Heavy Vehicle Simulator (HVS) test section layout, test setup, trafficking, and measurements followed standard University of California Pavement Research Center (UCPRC) protocols [4]. The Warm-Mix Asphalt Study test track layout can be found in [1]. Four HVS Test Sections were demarcated for the first phase of HVS testing for early-age rutting at high temperatures (50C at 50 mm depth), which was carried out in the same order as construction (i.e., Control followed by warm-mixes in alphabetical order). The section numbers allocated were as follows:
Section 600FD: Control Section 601FD: Advera Section 602FD: Evotherm Section 603FD: Sasobit
Laser profilometer was used for measuring the surface profile, and the change in surface profile is used to calculate surface rut. Thermocouples were used to monitor and record pavement and ambient temperature at one-hour intervals during HVS operation. HVS traffic was applied using dual wheels inflated to 690 kPa (100 psi) and running at 8.6 km/hour in channelized uni-directional mode.
Other Tests Stiffness of underlying pavement layers, including aggregate base, existing subbase and bedrock were determined from FWD back-calculation. FWD tests were conducted 20 days after the construction along centerlines of each cell.

Data Analysis and M-E Simulation
Stiffness Master Curves Stiffness of both HMA and WMA are temperature dependent. They are typically described by stiffness master curve [5]. At UCPRC, stiffness calculated from beam bending frequency sweep test were used to identify master curves. Flexural stiffness at 10Hz loading frequency and various temperatures are shown in Figure 1 for all four mixes. In general, WMAs are slightly softer than HMA control.
Figure 2. Flexural stiffness at 10Hz loading frequency and various temperatures for all four mixes
Rutting Model Parameters A shear-based approach developed by Deacon et al. [6] for predicting rutting of the asphalt layer is adopted in CalME. Rutting in the asphalt is assumed to be controlled by shear deformation. The rutting estimates use values of shear stress, , and elastic shear strain, e, at a depth of 50 mm (2 in.) beneath the edge of the tire. It is also assumed in this approach that rutting occurs solely in the top 100 mm (4 in.) of the HMA layer. Details about the exact form of equations can be found in [2]. The rutting model can be used to predict permanent shear strain accumulation during RSST-CH test in the laboratory. Model parameters were determined by minimizing the difference between predicted and measured laboratory shear deformation data. An example of the comparison between predicted and measured peramanent shear deformation is shown in Figure 3 for the Advera mix.
0 10 20 30 40 50 6010
2
103
104
105
Testing Temperature (C)
Fle
xura
l Stif
fne
ss a
t 10H
z (M
Pa)
ControlAdveraEvothermSasobit

Figure 3. Comparison of predicted and measured permanent shear deformation accumulation curves for Advera mix in RSST-CH tests
Unbound Layer Stiffness Unbound layer stiffness are back-calculated from FWD data following multi-layer elastic theory using the structure listed in Table 2. Note that the variation in existing subbase thickness will be reflected in the back-calculated equivalent thickness for the combined subbase and bedrock layer (denoted as SG layer).
Table 2. Structure used for FWD back-calculation
Layer No. Description Thickness (mm/in) 1 Asphalt bound layer, HMA/WMA 128/5 2 Aggregate base, AB 300/12 3 Existing subbase and bedrock, SG Semi-infinite
The back-calculated AB and SG layer stiffness variations are shown in Figure 4 and Figure 5 respectively. A summary of back-calculated unbound layer stiffnesses for drops within each test section is shown in Table 3. There are significantly differences between AB and SG stiffnesses for different cells.
Table 3. Summary of back-calculated unbound layer stiffnesses for each sections
Section AB Stiffness SG Stiffness
Average (MPa/ksi) C.O.V. (%) Average (MPa/ksi) C.O.V. (%) 600FD/Control 198/29 12 261/38 4 601FD/Advera 483/70 8 379/55 4
0
0.5
1
1.5
2
2.5
3
3.5
4
4.5
5
0 2 4 6 8 10 12
ln(Number of Load Repetitions)
ln(N
orm
aliz
ed P
erm
ane
nt
Sh
ea
r S
trai
n)
Model Prediction
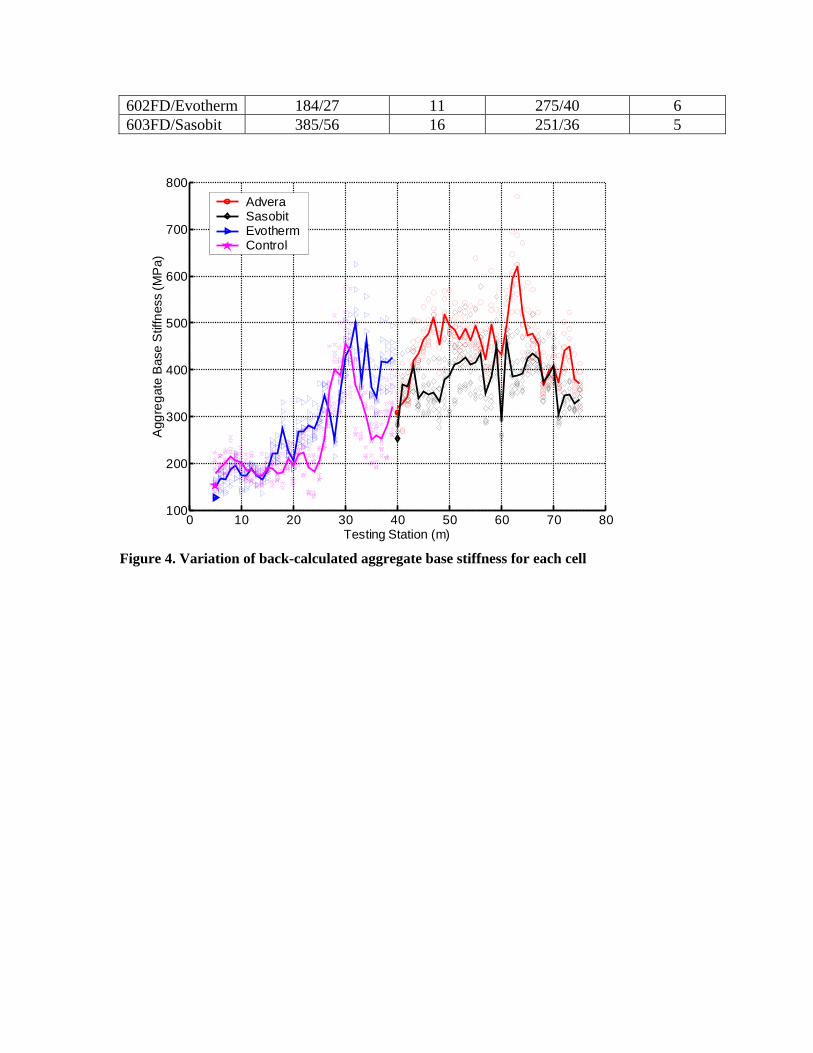
602FD/Evotherm 184/27 11 275/40 6 603FD/Sasobit 385/56 16 251/36 5
Figure 4. Variation of back-calculated aggregate base stiffness for each cell
0 10 20 30 40 50 60 70 80100
200
300
400
500
600
700
800
Testing Station (m)
Agg
reg
ate
Bas
e S
tiffn
ess
(MP
a)
AdveraSasobitEvothermControl

Figure 5. Variation of subbase+bedrock equivalent stiffness for each cell
HVS Testing and Results The target pavement temperature for 50-mm depth was 50C for first 165,000 repetitions and 55C afterwards. The actual pavement temperatures measured during HVS tests for each section are shown in Figure 6, which indicates that the actual pavement temperatures are within 3C of the target values most of the time. HVS trafficking was applied with 40kN load for the first 185,000 repetitions and 60kN afterwards. The accumulation of downward rut with load repetitions for each test section is shown in Figure 7. It appears that Sasobit section is demonstrating especially good rut resistance while the other two WMA mixes (Advera and Evotherm) showed comparable rutting performance to the control mix. There is however some question on whether this is a fair comparison given the fact that the stiffnesses of unbound layers are quite different among the four test sections. This question will be answered next with CalME simulation.
0 10 20 30 40 50 60 70 80150
200
250
300
350
400
450
Testing Station (m)
Sub
base
+B
edr
ock
Eq
uiva
lent
Stif
fne
ss (
MP
a)
AdveraSasobitEvothermControl

Figure 6. Pavement temperature at 50-mm (2 inch) depth during HVS testing for each section
Figure 7. Accumulation of average downward rut with load repetitions for each section
CalME Validation and Simulation With structure, material properties, traffic and pavement temperature all determined, CalME was used to predict in-situ rutting and fatigue cracking performance of the four
0
2
4
6
8
10
12
0 50 100 150 200 250 300 350 400
Number of Accumulated Load Repetitions (Thousand)
Ave
rage
Do
wnw
ard
Rut
(m
m)
600FD (Control)601FD (Advera)602FD (Evotherm)603FD (Sasobit)
40kN(50ºC)
40kN(55ºC)
60kN(55ºC)

HVS incremapplidownpredi
Figur(perm
Compin thethe csectioexactboth had le CalMobser
sections. Wment. It preed. A scree
nward rut foicts at the be
re 8. Screenmanent) defo
parison of pe figures, Caontrol mix. ons indicatet values maybecause it wead to more
ME predictedrved perform
When simulaedicts downen shot of or Section 6ginning but
n shot of Carmation, i.e.,
redicted andalME overprThe fact thas CalME is
y need calibrwas tested rirut in the co
d no fatiguemance.
ating HVS ward ruts aCalME sho
600FD (conalmost exac
alME showin, downward
d measured dredicts downat a very hig
capturing tration. It is pight after coontrol section
e cracking
tests, CalMEas a functionowing compntrol mix) ictly match th
ng comparisrut, for Sect
downward runward rut bygh R2 value the main trepossible that
onstruction an.
in all four
ME can be sn of the nuparison of is shown inhe final rut.
son of predition 600FD (c
ut is shown y 47% for W(0.90) can b
end of rut dt lack of agi
and because
HVS secti
etup to run umber of loa
predicted an Figure 8.
icted and mcontrol mix).
in Figure 9.WMA sectionbe obtained evelopment ing in the coit is shaded
ons, which
in one houad repetitionand measure
CalME ove
measured ma.
As indicatens and 6% fofor all WMAalthough th
ontrol sectiond by the shed
matches th
ur ns ed er
ax
ed or A he n, d,
he

CalME was used to evaluate the effect of unbound layer stiffness on rutting performance. For this purpose, Section 600FD (Control) is used as the reference. Three virtual HVS tests were simulated by putting HVS test 600FD on other sections. In other words, the AB and SG stiffnesses for 600FD were substituted by values for 601FD, 602FD and 603FD respectively. The normalized predicted downward rut for the three virtual sections are shown in Figure 10, which indicates that the ratio between CalME prediction for each virtual section and the value for the reference case (600FD) is practically constant throughout the HVS test. To account for the effect of AB and SG stiffnesses, HVS test results for 601FD, 602FD and 603FD need to be divided by 0.81, 1.01 and 0.86 respectively.
Figure 9. Comparison of calculated and measured downward rut
After accounting for the effects of AB and SG stiffnesses, the comparison of downward rut accumulation curves are shown in Figure 11. Based on Figure 11, the conclusions drawn from uncorrected HVS results (i.e., Figure 7) are still valid. Specifically, Advera and Evotherm mixes have comparable rutting performance as the control mix, while Sasobit mix demonstrated significantly better rutting performance. Note however, this paper does not address any material variability from mix production. It is possible that the low binder content for Sasobit mix may have led to the better rut resistance.
y = 1.4675x
R2 = 0.9036
y = 1.0606x
R2 = 0.7354
0
2
4
6
8
10
12
14
16
0 2 4 6 8 10 12
Measured Downward Rut (mm)
Pre
dic
ted
Do
wn
war
d R
ut
(mm
)
WMAControlLinear (WMA)Linear (Control)

Figure 10. Normalized predicted downward rut for different AB and SB combinations
Figure 11. Accumulation of average downward rut with load repetitions for each section after corrected for the effect of AB and SG stiffness
0
0.2
0.4
0.6
0.8
1
1.2
0 20000 40000 60000 80000 100000 120000 140000 160000 180000 200000
Number of Load Repetitions
Pre
dic
ted
Dow
nw
ard
Ru
t N
orm
aliz
ed b
y S
ect
ion
60
0FD
Re
sults
600FD on 601FD AB and SG
600FD on 602FD AB and SG
600FD on 603FD AB and SG
0
2
4
6
8
10
12
0 50 100 150 200 250 300 350 400
Number of Accumulated Load Repetitions (Thousand)
Cor
rect
ed A
vera
ge
Dow
nw
ard
Rut
(m
m)
600FD (Control)601FD (Advera)602FD (Evotherm)603FD (Sasobit)
40kN(50ºC)
40kN(55ºC)
60kN(55ºC)

Summary and Conclusions In this paper, laboratory and heavy vehicle simulator (HVS) test data were analyzed by using California Mechanistic-Empirical design method implemented in the CalME software. The analysis accounts for in-situ conditions such as unbound layer stiffness, asphalt bound material stiffness and rutting property, pavement temperature and loading. CalME was found to provide rut accumulation curves that match the shape of the measured results from HVS tests. Furthermore, applying a constant correction factor of 1.47 will allow CalME prediction to match measured results with a R2 of 0.90 for all WMA mixes. CalME was then used to evaluate the effect of aggregate base and subgrade stiffness on HVS test results. It was found that the difference in aggregate base and subgrade stiffness among various HVS sections can affect the results by up to 20%. This effect was found to be minor and would not affect the conclusion on rutting performance of various mixes. It should be pointed out that both the HVS and laboratory testing on rutting performance were conducted at elevated temperatures in this study. The study presented herein is not a comprehensive validation, which will involve field performance under larger variation of pavement temperature. CalME was calibrated using HVS tests conducted at both normal (around 20C) and elevated temperatures (around 50C), as well as data from WesTrack which was conducted at ambient temperature. The WMA study presented in this paper is only the first phase of California's effort to evaluate WMA technologies. The performance of WMA mixes under wet condition was evaluated in the second phase and was finished in June 2009. The performance of rubberized WMA mixes under dry condition is being investigated as Phase 3. All of the data collected will be used to validate or calibrate CalME models and improve the mechanistic-empirical design as well as provide valuable data to guide California's adoption of WMA technologies.
Disclaimer The contents of this paper reflect the views of the authors who are responsible for the facts and accuracy of the data presented herein. The contents do not necessarily reflect the official views or policies of the State of California or the Federal Highway Administration. This report does not constitute a standard, specification, or regulation. The uses of brand names in this paper are solely for identification purpose and do not constitute any endorsement for the corresponding products.
Acknowledgements The University of California Pavement Research Center acknowledges the following individuals and organizations who contributed to the project:
Ms. Terrie Bressette, Ms. Cathrina Barros, Mr. Glenn Johnson, and Dr. Joe Holland,
Caltrans

Mr. Mike Cook and Dr. Hongbin Xie, Graniterock Company
The management and staff, Graniterock Company and Pavex Construction
Ms. Annette Smith, PQ Corporation
Dr. Everett Crews, Meadwestvaco
Mr. John Shaw and Mr. Larry Michael, Sasol Wax Americas
Mr. Matthew Corrigan and Mr. Satish Bellaguti, Federal Highway Administration Turner
Fairbanks Highway Research Center
References 1. Jones, D., et al., Warm-Mix Asphalt Study: Test Track Construction and First-
Level Analysis of Phase 1 HVS and Laboratory Testing. 2008, Prepared by University of California Pavement Research Center for California Department of Transportation, Division of Research and Innovation, Office of Roadway Research.
2. Ullidtz, P., et al., Calibration of Incremental-Recursive Flexible Damage Models in CalME Using HVS Experiments., in Report prepared for the California Department of Transportation (Caltrans) Division of Research and Innovation. 2006, University of California Pavement Research Center, Davis and Berkeley.
3. Ullidtz, P., et al., Calibration of CalME models using WesTrack Performance Data, D. Spinner, Editor. 2007, California Department of Transportation Division of Research and Innovation Office of Roadway Research. p. 179.
4. Jones, D., Quality Management System for Site Establishment, Daily Operations, Instrumentation, Data Collection and Data Storage for APT Experiments. 2005, CSIR Transportek: Pretoria, South Africa.
5. ARA Inc., Guide for Mechanistic-Empirical Design of New and Rehabilitated Pavement Structures, ERES Consultants Division, ARA Inc. 2004, National Cooperative Highway Research Program, Transportation Research Board, National Research Council.
6. Deacon, J.A., et al., Analytically based approach to rutting prediction. Transportation Research Board, 2002. 1806.