Embed Size (px)
Citation preview

ii
DRAINAGE DESIGN AND RUTTING PERFORMANACE GUIDELINES FOR
PERMEABLE PAVEMENT
by
Su Ling Cao
Daryl Poduska Graduate Assistants
Dan G. Zollinger Associate Professor
Sponsored by The Uni-Group U.S.A.
The Department of Civil Engineering The Texas A&M University System College Station, Texas 77843-3135
January 21, 1998

iii
IMPLEMENTATION STATEMENT The information provided in this report serves as a guideline to the design of paver block pavement systems using the Uni Eco-Stone product. These guidelines are organized to give the reader brief review of basic hydrological concepts as they pertain to the design of pavements and the benefits of using the Uni Eco-Stone system in pavement construction projects. Information is provided on how runoff infiltration can be controlled in the pavement subsurface and its interaction with the performance of the pavement system. A method is provided to determine the amount of infiltration and the storage capacity of a permeable base relative to the time of retention and degree of saturation associated with the characteristics of the base. These guidelines contain a simple step by step process for the engineer to select the best pavement alternative in terms of base materials and gradations for the given drainage, subgrade strength conditions and the criteria for maximum allowable rutting.
iv
DISCLAIMER The design procedure and criteria contained in these design guidelines are intended to guide pavement design engineers or consultants in the design of paver block systems relative to drainage and rutting performance. It should be used to augment standards and specifications published by various municipal and government agencies. While every precaution has been taken to insure that all data and information furnished are as accurate as possible, Texas A&M University will not assume responsibility for errors or oversights in the use of this information or in the preparation of engineering plans. The information presented herein is based on the facts, tests, and authorities as stated and is intended for the use of professional personnel competent to evaluate the significance and limitations of the reported findings and who will accept responsibility of the application of the material it contains. The information in this guideline is not intended to replace the judgment of an experienced pavement engineer, or pavement designs that have demonstrated satisfactory performance. Texas A&M University also disclaims any and all responsibility for any other application of the stated principles or for the accuracy of any of the sources on which this report is based.

v
Table of Contents
Page List of Figures. . . . . . . . . . . . . . . . . . . . . . . . . . . . . . . . v List of Tables . . . . . . . . . . . . . . . . . . . . . . . . . . . vi Chapter 1. Introduction . . . . . . . . . . . . . . . . . . . . . . . . . . 1 Advantages of Using Uni Eco-Stone Pavement . . . . . . . . . . . . 3 The Considerations for Water . . . . . . . . . . . . . . . . . 3 The Purpose of This Report . . . . . . . . . . . . . . . . . . 5 Chapter 2. General Hydrology Concepts . . . . . . . . . . . . . . . . 6 Rainfall . . . . . . . . . . . . . . . . . . . . . . . . . . . . . . 6 Intensity-Frequency-Duration Curve. . . . . . . . . . . . . . . 6 The Depth of Rainfall . . . . . . . . . . . . . . . . . . . . . 6 Storm Water Runoff Volume . . . . . . . . . . . . . . . . . 7 Unit Hydrograph . . . . . . . . . . . . . . . . . . . . . . . . 7 Chapter 3. Surface Drainage System . . . . . . . . . . . . . . . . . . . 8 Computation of Runoff . . . . . . . . . . . . . . . . . . . . . . . . 8 Chapter 4. Subsurface Drainage Design . . . . . . . . . . . . . . . . . . 11 Introduction . . . . . . . . . . . . . . . . . . . . . . . . . . . . . . . . 11 General Considerations . . . . . . . . . . . . . . . . . . . . . . . . 11 Properties of Material . . . . . . . . . . . . . . . . . . 12 Design Alternatives . . . . . . . . . . . . . . . . . . . . . 15 Infiltration . . . . . . . . . . . . . . . . . . . . . .. . 17 Design Criteria . . . . . . . . . . . . . . . . . . . . . . . 20
Outflow Considerations . . . . . . . . . . . . . . . . . . . . . 21 Removal by Sub grade Percolation . . . . . . . . . . . 21 Removal by Subsurface Drainage . . . . . . . . . . . . 21 The Selection of Base Material . . . . . . . . . . . . . . . . . 24 Filter Criteria . . . . . . . . . . . . . . . . . . . . . . . . . . 25 Quantities of Water Stored in Pavement . . . . . . . . . . . . 28 Collection System . . . . . . . . . . . . . . . . . . . . . . . 28 Maintenance . . . . . . . . . . . . . . . . . . . . . . . . . . . 29

vi
Chapter 5. Performance of Permeable Block Pavement Systems . . . . . . 30 Permanent Deformation Characterization. . . . . . . . . . . . . . . . . . . 31 Permanent Deformation Prediction. . . . . . . . . . . . .. . . . . . . . . . 33 References . . . . . . . . . . . . . . . . . . . . . . . . . . . . . . . . . . 34 Appendix A Design Procedure for Drainage and Base Thickness for Eco-Stone
Paver Block Pavement Systems . . . . . . . . . . . . . . . . . A.1 Appendix B Eco Stone Pavement Design and Drainage Worksheet . . . . . B.1 Appendix C Storm Frequency Data . . . . . . . . . . . . . . . . . . . . . . C.1 Appendix D Permeability and Gradation Data . . . . . . . . . . . . . . . . . D.1

vii
List of Figures Figure Page 1 Cross-Section of Asphalt Pavement . . . . . . . . . . . . . . . . . 1 2 Cross-Section of Rigid Pavement . . . . . . . . . . . . . . . . . 1 3 Drainage voids in Uni Eco-Stone . . . . . . . . . . . . . . . . . 3 4 Components of Uni Eco-Stone . . . . . . . . . . . . . . . . . . . 3 5 Intensity-Frequency-Duration Curve . . . . . . . . . . . . . . . . . 6 6 Inflow Hydrography . . . . . . . . . . . . . . . . . . . . . . . . 7 7 Jointing Sands and Bedding Layer Gradations and Flow Rates. . . . 15 8 Collection and Disposal of Infiltration . . . . . . . . . . . . . . . 16 9 Double Base Drainage System . . . . . . . . . . . . . . . . . . . . 16 10 Protected Sub grade System . . . . . . . . . . . . . . . . . . . . 17 11 Permeable Sub grade System . . . . . . . . . . . . . . . . . . . . . 17 12 Relation between Coefficient of Permeability and Soil Type and Density. . . . . . . . . . . . . . . . . . . . . . 21 13 Time Dependent Drainage of Saturated Layer . . . . . . . . . . . . . 23 14 Sketch of Drainage of Water though Geotextile . . . . . . . . . . . . 26 15 Separation Mechanisms of Geotextile . . . . . . . . . . . . . . . . . 27 16 Various Types of Sub drainage Systems Using Geotextiles. . . . . . . 29 16 Various Types of Sub drainage Systems Using Geotextiles. . . . . . . 29 17 Relationship Between Permanent Strain and Loading Cycles . . . . . . 31 18 Permanent Deformation Permanent of the Surface Layer – TTI Annex Test Track . . . . . . . . . . . . . . . . . . . . . . . . . . . . . . . . . . . . . . . . . 32 A.1 Pavement Drainage and Design Flowchart . . . . . . . . . . . . . . . A.2 Chart 1: Storage vs. Base Thickness . . . . . . . . . . . . . . . . . . . . . . B.3 Chart 2: Permeability for 6 Hour, 50% Drainage Retention Time . . . . . . . B.4 Chart 3: Permeability for 12 Hour, 50% Drainage Retention Time . . . . . . B.5 Chart 4: Permeability for 18 Hour, 50% Drainage Retention Time . . . . . . B.6 Chart 5: Permeability for 24 Hour, 50% Drainage Retention Time . . . . . . B.7 Chart 6: Rutting for 2 Kip Vehicles . . . . . . . . . . . . . . . . . . . . . . B.8 Chart 7: Rutting for 6 Kip Vehicles . . . . . . . . . . . . . . . . . . . . . . B.9 Chart 8: Rutting for 10 Kip Vehicles . . . . . . . . . . . . . . . . . . . . . B.10 Chart 9: Rutting for 14 Kip Vehicles . . . . . . . . . . . . . . . . . . . . . B.11 Chart 10: Rutting for 18 Kip Vehicles . . . . . . . . . . . . . . . . . . . . . B.12 C.1 One-Hour/One-year Frequency Storm . . . . . . . . . . . . . . . . . C.1 C.2 One-Hour/two-Year Frequency Storm . . . . . . . . . . . . . . . . . C.1 C.3 One Hour/Ten-Year Frequency Storm . . . . . . . . . . . . . . . . . C.2 C.4 One-Hour/One Hundred Year Frequency Storm . . . . . . . . . . . . C.2

viii
List of Tables Table Page 1 Values C for Several Material Surfaces . . . . . . . . . . . . .. . . 9 2 The Value of Runoff Coefficient for Uni Eco-Stone Surface . . . .. . . . 9 3 Correlation Between Permeability and Unified Soil Classification . . . 13 D.1 Gradation and Permeability . . . . . . . . . . . . . . . . . . . . . . . D.1 D.2 Grain Size, Density and Permeability of Graded Aggregates . . . . . . . D.2

B.9
Figure 1 Cross-Section of Asphalt Pavement (3).
CHAPTER I INTRODUCTION
Traditional pavements are generally classified as either rigid or flexible pavement. Flexible pavement, also referred to as asphalt concrete pavement, is typically composed of an asphalt surface layer, base course, sub base course and sub grade as shown in Figure 1. A rigid
pavement, also referred to as concrete pavement, is typically composed of a concrete surface layer, sub base course and sub grade as shown in Figure 2. The base course is the layer of material immediately beneath the surface. Crushed stone, untreated or stabilized material, dense graded-material and open-graded material are most often used for base course material. The subbase course is the layer of material beneath the base course and above the subgrade, (which is the bottom layer). The subgrade may be natural soil or fill material that is compacted near the optimum moisture content. Asphalt concrete and Portland cement concrete are commonly the most used types of paving surface material in the United States. They have high durability and are appropriate for high volume, high traffic applications. Both of these pavement surfaces are for all practical purposes
impermeable. As more and more real estate is developed and covered with these two traditional pavement types, particularly in developing areas, several problems are magnified
Figure 2 Cross-Section of Rigid Pavement (3).

B.10
regarding runoff management and the control of downstream flooding. Use of impervious paving surfaces in urban areas eliminates natural water recharge of local ground water aquifers and causes an increase in the quantity and rate of storm runoff. Therefore, the result is an increase of incidences of flooding and potential down stream erosion. When storm water runoff moves from upstream to downstream, solid material and various contaminates on the street and parking area will flow into the water system resulting in water pollution. In order to combat the effects of urbanization and to solve problems associated with storm water runoff previously described, various local mandatory regulations have been implemented to manage storm water runoff (1). Various methods have been used to meet these storm water regulations such as use of on site detention basin, using permeable pavement for recharge purposes, etc. However, it is recognized that “using porous pavement has the potential for reducing overall quantity of runoff and water quality, without requiring the use of additional space on the (construction) site”(2).
Therefore, a great advantage exists in using permeable pavement surfaces to decrease the quantity of storm water runoff and potential water pollution. Several permeable pavement types have been recently suggested as alternative pavement systems. Uni Eco-stone pavement is one of these alternative permeable pavement surfaces. Uni Eco-Stone paver has been widely used in various paving projects in urban and municipal areas (1).
Uni Eco-Stone is a concrete paving block that is produced to a specific size and shape and, when installed, forms openings in
the surface of the pavement as shown in Figure 3. These openings in the surface are filled with unstabilized permeable material to allow water to pass through the surface pavement down to the layers below
A cross-section of a pavement section containing the Uni Eco-Stone paver block is shown on Figure 4. The pavement is composed of Uni Eco-Stone surface, a bedding sand layer, base course, and subgrade. The bedding layer placed immediately below the surface layer is usually one inch in thickness. The base layer must be carefully selected for accommodating storage water.
ADVANTAGES OF USING UNI ECO-STONE PAVEMENT
Figure 3 Drainage Voids in Uni Eco-Stone (2).
B.11
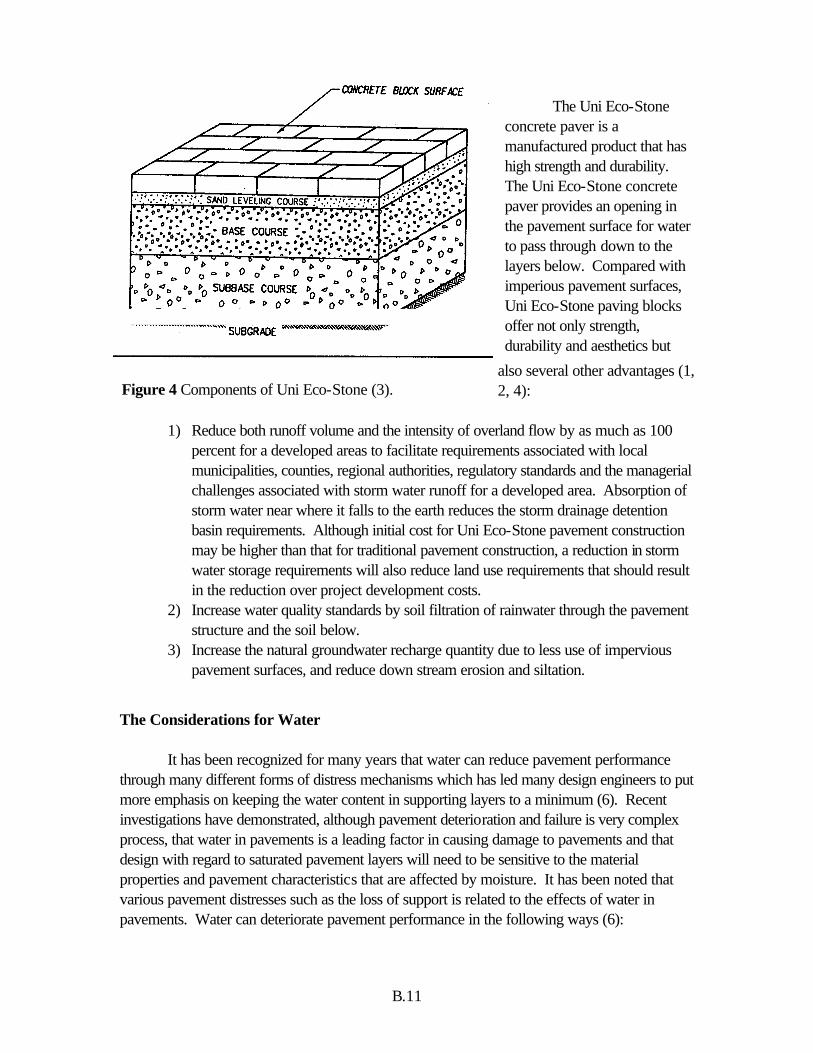
The Uni Eco-Stone concrete paver is a manufactured product that has high strength and durability. The Uni Eco-Stone concrete paver provides an opening in the pavement surface for water to pass through down to the layers below. Compared with imperious pavement surfaces, Uni Eco-Stone paving blocks offer not only strength, durability and aesthetics but
also several other advantages (1, 2, 4):
1) Reduce both runoff volume and the intensity of overland flow by as much as 100 percent for a developed areas to facilitate requirements associated with local municipalities, counties, regional authorities, regulatory standards and the managerial challenges associated with storm water runoff for a developed area. Absorption of storm water near where it falls to the earth reduces the storm drainage detention basin requirements. Although initial cost for Uni Eco-Stone pavement construction may be higher than that for traditional pavement construction, a reduction in storm water storage requirements will also reduce land use requirements that should result in the reduction over project development costs.
2) Increase water quality standards by soil filtration of rainwater through the pavement structure and the soil below.
3) Increase the natural groundwater recharge quantity due to less use of impervious pavement surfaces, and reduce down stream erosion and siltation.
The Considerations for Water It has been recognized for many years that water can reduce pavement performance through many different forms of distress mechanisms which has led many design engineers to put more emphasis on keeping the water content in supporting layers to a minimum (6). Recent investigations have demonstrated, although pavement deterioration and failure is very complex process, that water in pavements is a leading factor in causing damage to pavements and that design with regard to saturated pavement layers will need to be sensitive to the material properties and pavement characteristics that are affected by moisture. It has been noted that various pavement distresses such as the loss of support is related to the effects of water in pavements. Water can deteriorate pavement performance in the following ways (6):
Figure 4 Components of Uni Eco-Stone (3).

B.12
1) Strength of base and sub base decreases with the increase of water content, therefore resulting in reduction in sub base or base support and increase in the rate of permanent deformation and loss of serviceability of the pavement.
2) Under a heavy wheel loads, free water contained within the layers of the pavement
structure will build up water pressure. This water pressure will lead to erosion, ejection of base material, disintegration of base layer, and causes pumping in concrete pavements and serious damage to asphalt pavements.
Because water in the pavement is of particular concern, it is of interest to control water in the pavement and reduce maintenance. Current practices to accomplish this are:
1) Keeping surface water out of the pavement system, or
2) Minimize the presence of water in the pavement structure for extended periods of time.
In the past decade, in the design of pavement system, a belief has developed with respect to the minimization of the impact of water on pavement performance by waterproofing surface layer to reduce infiltration of water into the pavement structure. Maintenance efforts for asphalt and concrete pavement types have focused a great deal of effort in sealing the pavement surface layer. A seal coat has been used on top of asphalt pavement surfaces to prevent rainfall from infiltrating into the pavement. Several joint sealing technologies and methods have developed to minimize water infiltration into both asphalt and concrete pavement joints/cracks. But in practice, it is difficult to keep water completely out of the pavement system because of development of random cracking or other failures only a few years after construction (6). Pavement engineers have realized that proper drainage design is important for good pavement performance with respect to infiltrated water. Investigations by Cedergren (6) indicate that if properly designed drainage system is provided, even though infiltration is allowed, the presence of water in the structure for short period of time (i.e. 24 hours) should have little impact on pavement performance. Therefore, the ingress of water into the pavement structure by way of through the opening in the Uni Eco-Stone pavement surface should be acceptable in terms of pavement performance as long as special drainage design considerations are taken into account. It is important for Uni Eco-Stone pavement system to properly drain water from the pavement structure to minimize potential damage to the pavement structure. THE PURPOSE OF THIS REPORT This report is written in conjunction with current information and technology regarding drainable pavement systems. However its ultimate purpose is to provide guidance for design engineer to design both a pavement structure and a drainage system incorporating Uni Eco-

B.13
Stone paving pavement surface and to define the limits and conditions associated with the retention of water within the pavement system and long-term pavement performance. A Uni Eco-stone pavement drainage system, which allow water to infiltrate into pavement structure, provides the design engineer possibilities in pavement surface water control, but requires the engineer to properly design each component of the pavement system and to reduce the impact of water retention on the performance. It is well recognized that not only do base and sub grade strength decrease as water content increases but also pavement performance will be influenced by infiltrated water. In order to control runoff water so it will have little impact on pavement performance, the Uni Eco-Stone pavement system will need to be designed to accommodate the anticipated traffic for the expected infiltrated moisture conditions. The process to design the base layer thickness and drainage components and to select the base material gradation relative to the performance of the pavement is essential to the designer.

B.14
CHAPTER 2
GENERAL HYDROLOGY CONCEPT
Engineering Hydrology refers to broad subjects such as estimates of precipitation, characterization of runoff processes, and ground water and soil water infiltration movement. Many excellent references (9, 18, 19) cover the details for each subject however, the objective of this chapter is to introduce to the drainage engineer the general concept of precipitation and runoff process which is related to drainage design.
RAINFALL Precipitation, especially in form of rainfall, is an important input into the drainage design. Rainfall can be described on the basis of rate (inches per hour), on the basis of depth (inches of rainfall), on the basis of duration (rainfall event lasted 2 hours), and on the basis of frequency (2-hour rainfall event occurs about once every five years). All of these descriptions provide useful information regarding the design of the drainage system.
Intensity-Frequency-Duration Curve
An example of an Intensity-Frequency-Duration curve is shown in Figure 5, which displays the types of data, mentioned above. These curves are prepared data for a particular geographic location based on long-term rainfall records. For example, the rainfall event with a duration of 30 minutes that occurs approximately once in five years has an intensity of 3.5
inches. As indicated in the Intensity-Frequency-Duration Curve, the shorter the duration of rainfall the higher the intensity is likely to be. The data in Figure 5 also indicates that the more intense the rainfall event, the less frequent it is likely to occur.
Figure 5 Intensity-Frequency-Duration Curve (8).
B.15
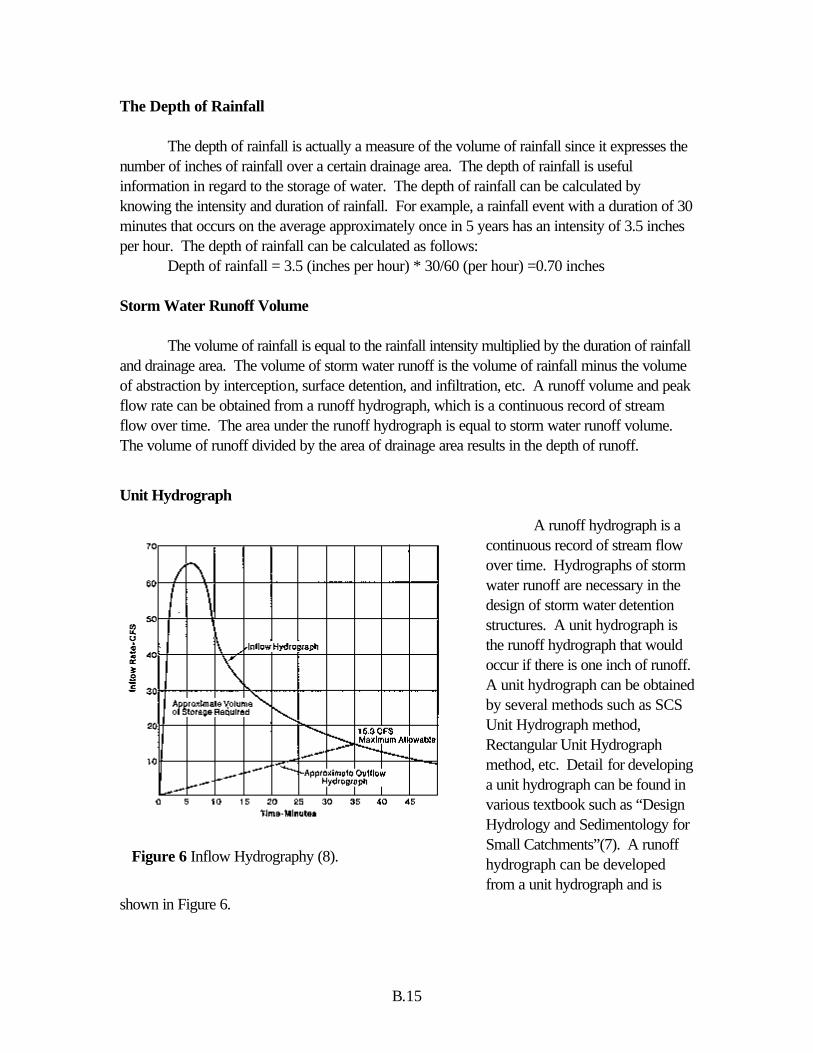
The Depth of Rainfall The depth of rainfall is actually a measure of the volume of rainfall since it expresses the number of inches of rainfall over a certain drainage area. The depth of rainfall is useful information in regard to the storage of water. The depth of rainfall can be calculated by knowing the intensity and duration of rainfall. For example, a rainfall event with a duration of 30 minutes that occurs on the average approximately once in 5 years has an intensity of 3.5 inches per hour. The depth of rainfall can be calculated as follows: Depth of rainfall = 3.5 (inches per hour) * 30/60 (per hour) =0.70 inches Storm Water Runoff Volume The volume of rainfall is equal to the rainfall intensity multiplied by the duration of rainfall and drainage area. The volume of storm water runoff is the volume of rainfall minus the volume of abstraction by interception, surface detention, and infiltration, etc. A runoff volume and peak flow rate can be obtained from a runoff hydrograph, which is a continuous record of stream flow over time. The area under the runoff hydrograph is equal to storm water runoff volume. The volume of runoff divided by the area of drainage area results in the depth of runoff.
Unit Hydrograph
A runoff hydrograph is a continuous record of stream flow over time. Hydrographs of storm water runoff are necessary in the design of storm water detention structures. A unit hydrograph is the runoff hydrograph that would occur if there is one inch of runoff. A unit hydrograph can be obtained by several methods such as SCS Unit Hydrograph method, Rectangular Unit Hydrograph method, etc. Detail for developing a unit hydrograph can be found in various textbook such as “Design Hydrology and Sedimentology for Small Catchments”(7). A runoff hydrograph can be developed from a unit hydrograph and is
shown in Figure 6.
Figure 6 Inflow Hydrography (8).

B.16
CHAPTER 3 SURFACE DRAINAGE SYSTEM DESIGN
Surface drainage should be designed to remove surface water from the pavement system. An important step in surface drainage design is the determination of the expected quantities and rate of runoff water. Commonly, in new developments, detention basins are used for storm water management to reduce peak flows. Whether or not a detention basin is needed with a pavement surfacing that incorporates Uni Eco-Stone paving blocks depends on the expected peak runoff rate, degree of infiltration, and local storm water regulation. Often, local regulations require that peak runoff rates for a design storm after development do not exceed peak runoff rates for the same design storm before development (7, 8). If the peak runoff rate using Uni Eco-Stone block paver exceeds the allowable release rate, a detention basin is needed and the amount of storage for the excess water must be provided. Otherwise, only an estimate of the peak flow is required. The amount of runoff and runoff rate can be obtained from a runoff hydrograph which is a continuous record of flow rate over time for a given area.
COMPUTATION OF RUNOFF A surface drainage system should be designed to remove surface water with certain time limits and physical constraints. The capacity of the surface drainage system depends on the amount of runoff that will occur on a given area. The runoff rate depends on a number of factors (1, 9). The following factors have a pronounced influence on the rate of runoff: (1). Intensity and duration of the rainfall. (2). Type and moisture condition of base and soil at the time of the rainfall. (3). Slope of the surface. (4). Permeability of fill material in drainage voids on the pavement surface. (5). Opening void of pavement surface.
There are several methods available to be used in calculating the runoff (peak runoff rate) such as the rational method or the SCS curve number method (7). The rational method for calculating runoff is most universally used and recommended (10). The rational method is based on the direct relationship between rainfall and runoff. It is expressed by the equation (9):
Qp = C x I x A (1)
where
Qp = The peak runoff rate (m3/ hr, or cfs) C = The runoff coefficient I = Mean rainfall intensity over a period equal to the time of concentration (m / hr or inch / hr) A = The area ( m2 or acres)

B.17
Runoff coefficients C for several materials are listed in Table 1. Value of C for Uni Eco-Stone pavement must be designed with respect to required drainage characteristic of the base and subgrade material, the slope of the pavement, and the fill material in the surface opening and the jointing material. The selection of fill material in the drainage void, jointing material and slope of the pavement can have significant influence on the value of runoff coefficient. It may also be possible to derive a C value from actual flow data as was suggested by Rollins (1) as listed in Table 2 based on flow data published by Muth (11).
Table 1. Values C for Several Material Surfaces (10).
Type of Surface Factor C
For all watertight roof surfaces
For asphalt runway pavements
For concrete runway pavements
For gravel or macadam pavements
0.75 to 0.95
0.80 to 0.95
0.70 to 0.90
0.35 to 0.70
Table 2. The Value of Runoff Coefficient for Uni Eco-Stone Surface (1).
Fill Slope I (in/hr) % Infiltration C
Muth Mix 2.5 % 4.2 75 % 0.25
Muth Mix 0 % 4.2 85 % 0.15
• Muth Mix comprised of 2-5 mm gravel chips and 2 mm clean sand.
Design engineers should anticipate considerable reduction in C values after a period of 5
to 6 years of service due to an accumulation of fine participles in the jointing sand and bedding layer material. Research results indicated that infiltration rates could be reduced by as much as 50 percent. Since infiltration is associated with the permeability (discussed in the following chapter), certain inferences can be made relative to the factors that influence infiltration. An increase in the amount of material finer than the #200 sieve size by ½ percent may reduce the infiltration coefficient by a factor of 15. However, it may be possible to offset this effect by using material gradations that yield void ratios greater than 0.40. Although more research data is needed, it is suggested void ratios be held to a minimum of 0.48 to 0.50 to minimize the effect of aging and the tendency for accumulation to develop in the drainage holes and bedding layers.

B.18
CHAPTER 4 SUBSURFACE DRAINAGE DESIGN
INTRODUCTION The process of subsurface drainage design focuses on the removal of water from within the pavement structure. Typical components of a subsurface drainage system are (a) an base drainage layer, (b) filter layer, (c) collector pipe, (d) and an outlet pipe. The base drainage layer has two purposes: first, the base drainage layer helps transmit the structural load from the pavement to the natural sub grade. Second, the base drainage layer transmits the drainage water from the pavement structure to the collector pipe. The filter layer primary function is to act as a filter and prevent the migration of the fine material into the permeable base or the collector pipe and, in some instances, it must allow the drainage water to freely flow through it with minor energy loss. The collector pipe intercepts infiltrated water from the base layer and transmits the water to the outlet pipe. The outlet pipe transmits the water to a natural drain or an open channel. Subsurface water generally comes from two sources:
a) Groundwater, which is defined as the water existing in the natural ground in the zone of saturation below the water table.
b) Infiltration water, which is defined as surface water that seeps down through voids
in the pavement surface to the pavement substructure. Because Uni Eco-Stone pavement surface contains openings on the surface, rainfall will infiltrate from the pavement surface to the pavement substructure. This paper focuses on the removal of infiltrated water by a subsurface drainage system.
GENERAL CONSIDERATIONS Silts and clays are classified as fine-grained soils because their particle size is smaller than the # 200 mesh sieve (particles smaller than the # 200 mesh sieve are at the boundary of visibility to the naked eye). Fine-grained soils are relatively impermeable, where their shear strength is relatively low and is reduced when saturated. Sands and gravels are classified according to their size and are, relatively speaking, course grained materials in comparison to silts and clays since the majority particle sizes are larger than the # 200 mesh sieve. For purpose of drainage design, soil layers comprised largely of silts and clays can be regarded as impermeable allowing infiltration in layers consisting of these types of soils to be ignored.
B.19
There are two basic approaches to the consideration of water in the design of a pavement system. One approach, which is the typical practice, is to attempt to keep the natural soil and the base material under the pavement dry by making the pavement surface waterproof. This results in high runoff rates from the pavement. An effect similar to this is achieved if the construction materials in the pavement base are well graded with more than 20 percent passing the #50 sieve size. The alternate approach applicable to the Uni Eco-Stone pavement system is to allow water to infiltrate into the pavement surface and to disperse throughout the pavement base layers. This reduces surface runoff from the pavement. Since the water is allowed to infiltrate into the pavement surface, designers should consider the potential impact of water on pavement performance. Each component of subsurface drainage system should be designed properly to maintain sufficient strength in the presence of water. Moisture retention must be balanced against pavement performance in that, base layers must be constructed of coarse materials with a sufficient permeability so that the strength of base material is limited to certain levels while infiltrated water is transmitted to the drain pipe or to the natural soil. If runoff water is stored in the pavement or the base material, then the materials of construction must be chosen to assure sufficient permeability and a high strength while these materials are in the presence of to minimize the loss of stability in the supporting layers. The pavement design procedure outlined in Appendix A takes these considerations into account in the prediction of rutting performance. Properties of Pavement Materials Permeability and stability of the base material are the important engineering characteristics that should be considered in the design of Uni Eco-Stone pavement systems. Factors which affect permeability such as grain size distribution and the percent of fines passing the #50 sieve size are important considerations and should be carefully selected by the engineer relative to retention time and the amount of desired storage capacity. Aggregate shape and texture affect base stability and is related to percent of fractured faces which is characteristic of crushed materials. As for fines grained soils and sub grade materials, plasticity characteristics in terms of Atterberg limits, and the soil classification (i.e. the Unified Soil Classification System) are indicators of material performance and permeability. Therefore, whenever it is possible, representative samples of material and natural soil should be subjected to the testing and classification. Base and materials that serve as a permeable layer that are typically used with Uni Eco-Stone consist of crushed aggregates, and combinations of rounded (or natural) and angular sands. Crushed aggregates and sands have less than 5 percent by weight of materials passing through the # 200 mesh sieve. These clean materials should be non-plastic (Liquid Limit and Plastic Limit will be zero). Crushed aggregates and sands can have a relatively high permeability (depending upon the gradation) and a relatively high shear strength that is largely independent of water content.
B.20
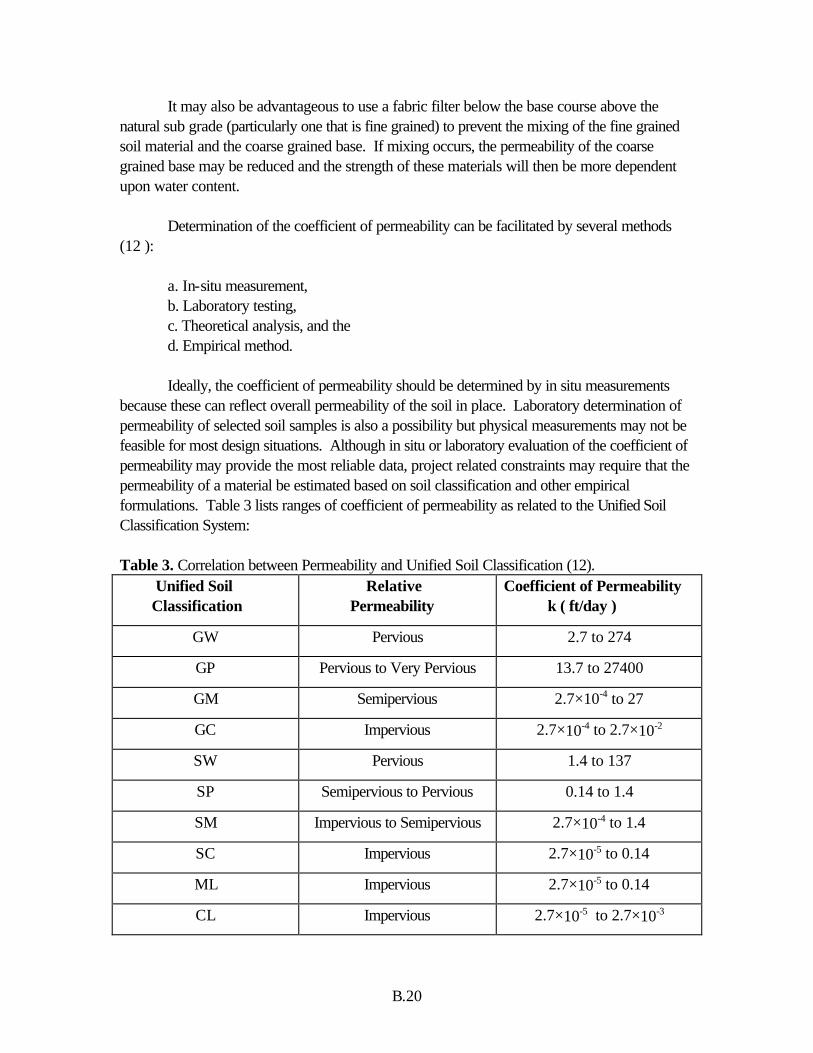
It may also be advantageous to use a fabric filter below the base course above the natural sub grade (particularly one that is fine grained) to prevent the mixing of the fine grained soil material and the coarse grained base. If mixing occurs, the permeability of the coarse grained base may be reduced and the strength of these materials will then be more dependent upon water content. Determination of the coefficient of permeability can be facilitated by several methods (12 ): a. In-situ measurement, b. Laboratory testing, c. Theoretical analysis, and the d. Empirical method. Ideally, the coefficient of permeability should be determined by in situ measurements because these can reflect overall permeability of the soil in place. Laboratory determination of permeability of selected soil samples is also a possibility but physical measurements may not be feasible for most design situations. Although in situ or laboratory evaluation of the coefficient of permeability may provide the most reliable data, project related constraints may require that the permeability of a material be estimated based on soil classification and other empirical formulations. Table 3 lists ranges of coefficient of permeability as related to the Unified Soil Classification System: Table 3. Correlation between Permeability and Unified Soil Classification (12). Unified Soil Classification
Relative Permeability
Coefficient of Permeability k ( ft/day )
GW Pervious 2.7 to 274
GP Pervious to Very Pervious 13.7 to 27400
GM Semipervious 2.7×10⁻⁴ to 27
GC Impervious 2.7×10⁻⁴ to 2.7×10⁻²
SW Pervious 1.4 to 137
SP Semipervious to Pervious 0.14 to 1.4
SM Impervious to Semipervious 2.7×10⁻⁴ to 1.4
SC Impervious 2.7×10⁻⁵ to 0.14
ML Impervious 2.7×10⁻⁵ to 0.14
CL Impervious 2.7×10⁻⁵ to 2.7×10⁻³
B.21
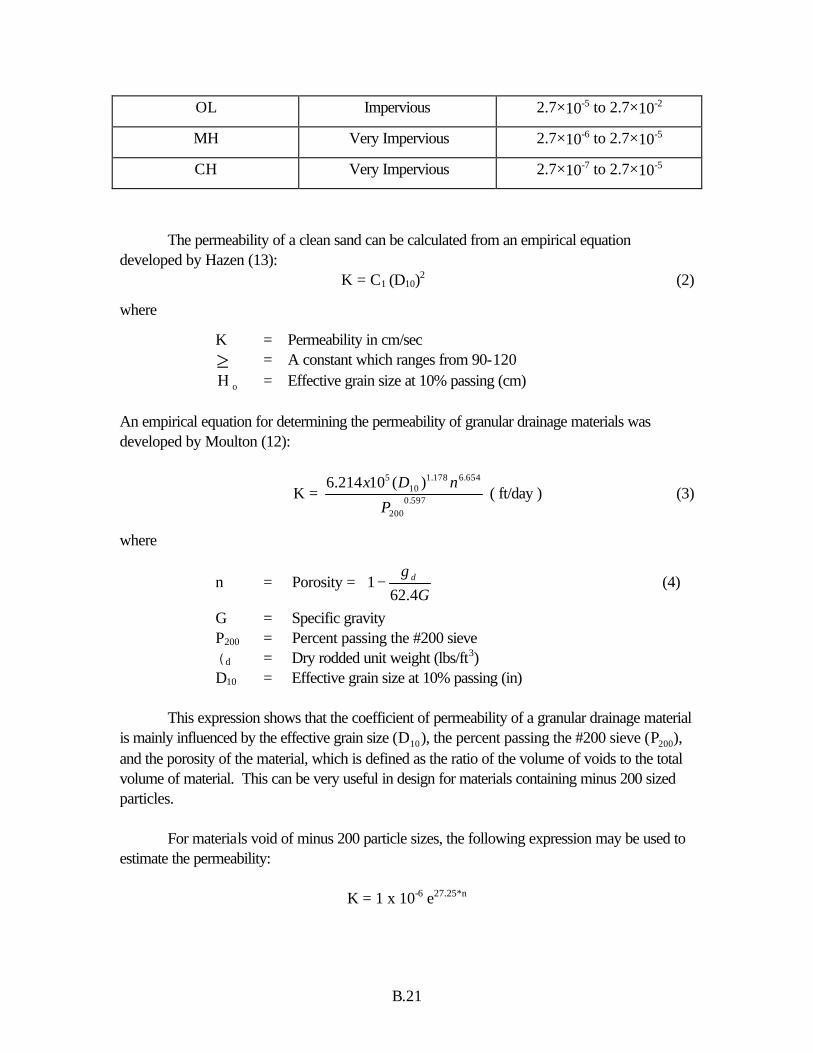
OL Impervious 2.7×10⁻⁵ to 2.7×10⁻²
MH Very Impervious 2.7×10⁻⁶ to 2.7×10⁻⁵
CH Very Impervious 2.7×10⁻⁷ to 2.7×10⁻⁵
The permeability of a clean sand can be calculated from an empirical equation developed by Hazen (13):
K = C1 (D10)2 (2)
where
K = Permeability in cm/sec ≥ = A constant which ranges from 90-120 H o = Effective grain size at 10% passing (cm) An empirical equation for determining the permeability of granular drainage materials was developed by Moulton (12):
K = 597.0200
654.6178.110
5 )(10214.6
P
nDx ( ft/day ) (3)
where
n = Porosity =
−
Gd
4.621
γ (4)
G = Specific gravity P200 = Percent passing the #200 sieve (d = Dry rodded unit weight (lbs/ft3) D10 = Effective grain size at 10% passing (in) This expression shows that the coefficient of permeability of a granular drainage material is mainly influenced by the effective grain size (D10), the percent passing the #200 sieve (P200), and the porosity of the material, which is defined as the ratio of the volume of voids to the total volume of material. This can be very useful in design for materials containing minus 200 sized particles. For materials void of minus 200 particle sizes, the following expression may be used to estimate the permeability:
K = 1 x 10⁻⁶ e27.25*n
B.22
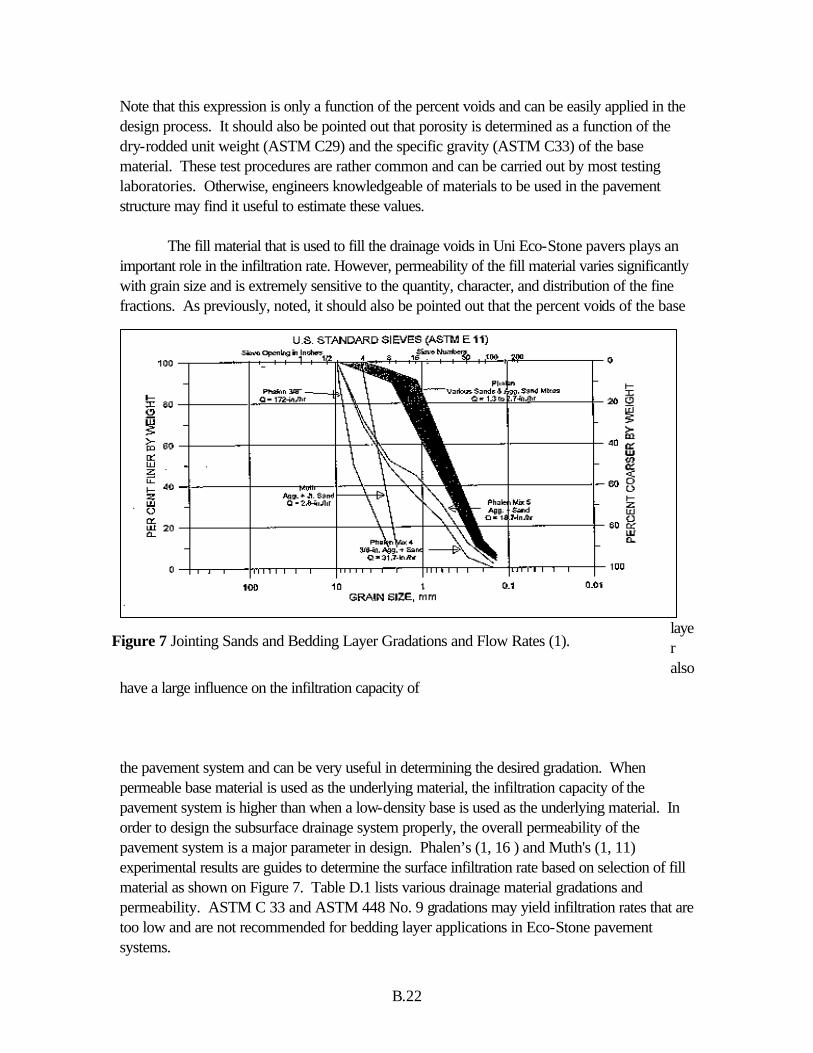
Note that this expression is only a function of the percent voids and can be easily applied in the design process. It should also be pointed out that porosity is determined as a function of the dry-rodded unit weight (ASTM C29) and the specific gravity (ASTM C33) of the base material. These test procedures are rather common and can be carried out by most testing laboratories. Otherwise, engineers knowledgeable of materials to be used in the pavement structure may find it useful to estimate these values. The fill material that is used to fill the drainage voids in Uni Eco-Stone pavers plays an important role in the infiltration rate. However, permeability of the fill material varies significantly with grain size and is extremely sensitive to the quantity, character, and distribution of the fine fractions. As previously, noted, it should also be pointed out that the percent voids of the base
layer also
have a large influence on the infiltration capacity of the pavement system and can be very useful in determining the desired gradation. When permeable base material is used as the underlying material, the infiltration capacity of the pavement system is higher than when a low-density base is used as the underlying material. In order to design the subsurface drainage system properly, the overall permeability of the pavement system is a major parameter in design. Phalen’s (1, 16 ) and Muth's (1, 11) experimental results are guides to determine the surface infiltration rate based on selection of fill material as shown on Figure 7. Table D.1 lists various drainage material gradations and permeability. ASTM C 33 and ASTM 448 No. 9 gradations may yield infiltration rates that are too low and are not recommended for bedding layer applications in Eco-Stone pavement systems.
Figure 7 Jointing Sands and Bedding Layer Gradations and Flow Rates (1).

B.23
Design Alternatives Water that is allowed into a pavement structure, eventually it must be drained out of the pavement structure. There are several ways remove infiltrated water from an Uni Eco-Stone pavement system. Most of them can be categorized as:

B.24 Figure 8 Collection and Disposal of Infiltration
(1).
a) Permeability of base, or
c) Permeability of the subgrade.
Examples of several design alternatives (1) are shown in the following figures. Figure 8 shows an example of a Uni Eco-Stone pavement over a natural low permeability subgrade with a high water table. In this case, the surface water passes through the Uni Eco-Stone through the bedding layer and flows downward into the permeable base. A drainage pipe is installed to facilitate moving infiltrated water out of the base layer. Water can be stored above the low permeability subgrade in the permeable base if required because of the high water table. The low permeability subgrade will always be wet because of the high water table so storing water on top of it should not affect subgrade strength significantly. Time for stored water to be discharged is dependent upon permeability of base and the slope of the base layer.
Figure 9 shows an example of a Uni Eco-Stone pavement over a natural low permeability sub grade using a two-layer base system. In this case it is of interest to store water in the upper permeable layer while protecting the strength of the
Figure 9 Double Base Drainage System (1).

B.25
natural sub grade with a low permeable base layer. This dense, low permeability layer has a steep slope so that the water will flow to the collection trench. The water percolates through the pavement through the bedding layer and into a permeable drainage layer for storage purposes.
From there the water flows to a collection trench and is discharged from the pavement system. This design is feasible when a low strength sub grade exists. Figure 10 provides another alternative to placement of a pavement over a low permeability sub grade. A dense, low permeability base is constructed in order to protect the low permeability or weak sub grade. A permeable base layer to a larger aggregate water storage area transmits infiltrated water. This larger aggregate
storage area can be placed directly under the pavement or it can be constructed adjacent to the pavement.
Figure 11 indicates the construction of a pavement over a permeable sub grade. In this case a permeable base is constructed over the natural permeable sub grade and the water simply infiltrates into the sub grade.
Infiltration
In a subsurface drainage system design, it is important to estimate the rate of water infiltration into the pavement system. The
sources of pavement infiltration water are:
Figure 10 Protected Sub grade System (1).
Figure 10 Permeable Subgrade System (1).

B.26
a) Rainfall, b) Groundwater, c) Melting ice, and d) Snow. The quantity of water that potentially can flow into a Uni Eco-Stone pavement system is controlled by the infiltration of water. Other sources such as groundwater and melting ice would provide minor quantities of water and are not a consideration in the design of the Uni Eco-Stone drainage. However, infiltration of rainfall runoff is an important consideration that depends on many factors (1, 12): a. Slope of the pavement surface, b. The rate at which water is applied to the pavement surface. c. Permeability and overall drainage capabilities of the underlying layers. d. Materials used to fill the drainage voids in the pavement surface, and the ambient
moisture conditions.
The infiltration rate of rainfall into a pavement system will not only vary with age and condition of the pavement surface, gradation of the bedding layer, and the fill material in the drainage voids but also with the intensity of rainfall as previously as pointed out. In order to design the subsurface drainage and storage system, the surface water infiltration rate may be estimated based on the infiltration coefficient and of the design precipitation rate (design storm). Cedergren (6, 12) recommends the one-hour/one year frequency storm to be the design storm for designing the subsurface drainage. This is the maximum rainfall in one hour that can be expected to occur on the average of one time each year. The U.S. Army Corps of Engineers (17) recommends one hour/two year frequency storm for design purposes. The one-hour/one year frequency and one-hour/two year frequency storm maps are shown in Appendix C. If the drainage design requirements call for more severe conditions in order to meet local storm water control regulations, one-hour/10 year or one-hour/100 year frequency storm maps are also shown in Appendix C. The infiltration rate of rainfall into the pavement is controlled the infiltration capacity of the pavement system and should be less than the intensity of the design storm. (For instance, if the design storm is 1.8 in/hour, and the infiltration capacity of the pavement is 2.4 in/hour, the infiltration rate of rainfall into pavement would be 1.8 in/hour.) Considering this, the infiltration rate of the rainfall into the pavement can be expressed relative to the infiltration coefficient (F). If the design storm is less than the infiltration capacity of the pavement, the infiltration coefficient is equal to 1 and the infiltration rate is equal to design storm. Muth (1, 11) has shown that a one-hour/one year frequency storm can fully infiltrate into Uni Eco-Stone pavement (assuming drainage hole gradation consists of void ratios greater than 0.40). So for 1 hour/ 1 year frequency design storm, infiltration rate of for Uni Eco-Stone pavement can be justified as being equal to a 1 hour/ 1 year frequency design storm. If the design storm is larger than the infiltration capacity of pavement, infiltration rate may be determined by multiplying an infiltration coefficient by design storm. The infiltration coefficient will typically be a certain value between 0.3 and 0.6 and will vary according to fill material, slope of pavement and design storm.
B.27
Once the infiltration rate has been estimated, the inflow or quantity of water entering the pavement is determined by applying Darcy's law as follows:
Q = K*i*A (5)
where
Qent = Quantity of water entering the pavement surface (cubic feet per day) K = Permeability or infiltration rate (feet/day) i = Hydraulic gradient; a hydraulic gradient of unit for rain falling on a surface is suggested (20) A = area (square feet) Equation 5 can be expressed relative to the infiltration coefficient, if k is replaced by L x R and i is set to 1, then the rate of water inflow per foot width of drainage is computed by following equation (17): qent = 2*L*F*R (6)
where
qent = In cubic feet per foot width of drainage path per day F = Infiltration coefficient R = Design storm in inches per hour L = Length of the drainage path in feet
The length of the drainage path can be computed by following equation:
L = t
t
SSSX l
22 + (7)
where X = The length in feet of the transverse slope of the drainage layer Se= The longitudinal slope of the drainage layer St = The transverse slope of the drainage layer
The slope of the drainage path may be computed by the equation:
S = +S St e2 2 (8)

B.28
Design Criteria The pavement subsurface drainage system is primarily used to remove free water that enters into the pavement. The base layer is usually considered to be the best location for the drainage layer. Whether infiltrated water will accumulate in a pavement depends on the outflow capacity of the drainage layer. When outflow capacity of drainage layer is less than the infiltration rate, infiltrated water will accumulate in pavement. In some cases, the outflow rate may be designed less than the infiltration rate in order to control storm water runoff. Sometimes, outflow capacity of drainage layer may be designed to be equal to the inflow rate in order to remove water as quickly as possible to minimize the impact of water on pavement performance. Design criteria for the Uni Eco-Stone pavement subsurface drainage layer are:
1) Outflow less than inflow criterion where outflow must be delayed. It has been suggested that a retention time of 6-12 hours for 50 percent of drainage from the base layer is suitable for many applications. 2) An inflow = outflow criterion where the base or sub base should be capable of draining the water at a rate equal to the inflow rate without becoming completely saturated or flooded (21).
The selection of criteria will depend upon storm runoff water regulations, traffic conditions and the conditions under which the pavement must perform. When heavy traffic is applied to an Eco-Stone pavement system, water that enters into the pavement may be required to be removed as fast as possible from the subsurface drainage system to prevent loss of sub grade stiffness and excessive rutting. The inflow = outflow criterion may be selected to design the subsurface drainage system in this instance. If it is necessary to store water in the pavement to reduce peak runoff discharge and meet storm water regulation, Criterion 1 may be selected to design the subsurface drainage system however, restrictions may need to be applied to the categories of traffic allowed to use the roadway. Under criterion 1, the inflow rate and the outflow rate influence the quantity of free water retained in the pavement structure. The time required to drain water from the base is controlled by the out flow rate. Rate of outflow depends on the subsurface drainage design. If free water is required to be removed vertically through sub grade, permeability of sub grade controls the outflow rate as shown Figure 10. If a lateral drain is incorporated to remove free water as shown on Figures 7 and 8, the outflow rate is controlled by the geometry and permeability of the base layer. The thickness, percent voids or porosity, and permeability of the drainage layer plays an important role in controlling the amount of storage and the time of retention of the runoff water within the base layer. If this information along with the pavement section drainage geometry and amount of infiltration is known, the required thickness and permeability of the base layer can be

B.29
determined. Details of how to determine permeability and thickness of the drainage layer are discussed below.
Outflow Considerations
Water can be removed from a pavement section in the following ways (6): 1) Surface evaporation. 2) Removal by sub grade percolation. 3) Removal by a subsurface drainage system.
Since surface evaporation, in most cases, is insignificant (6) further discussion will focus only on the removal of water by sub grade percolation or by a subsurface drainage system.
Removal by Subgrade Percolation Removal by sub grade percolation will in most instances be insignificant due to high clay content. However, if the sub grade of a pavement consists of highly permeable sands or gravel where permeability is greater than 500 ft/day (17), water may be assumed to drain directly through the sub grade to recharge the water table as shown in Figure 11. But rates of drainage
into the sub grade of this magnitude may be rare as noted in Figure 12 indicating the permeability of various soil types at different densities. Infiltration into the sub grade can be estimated using equation 5.
Removal by subsurface drainage If the sub grade consists of low permeable silts or clays, downward drainage will be very slow as
noted above. Free water may accumulate in the pavement over a long period of time, which may be detrimental to the performance of the pavement. Therefore, a lateral drain may need to be considered to remove the water in a shorter rime period. The slope of the drainage layer is generally designed to be
Figure 12 Relation between Coefficient of Permeability and Soil Type and Density (log Scale) (22) (1 cm/sec = 2835 ft/day).
B.30
1-3 % to facilitate water draining to a collector pipe. The geometry and porosity of the base controls the storage capacity of drainage layer. Based on the degree of drainage (i.e. percentage of water removed from a saturated layer), thickness or permeability of base can be determined to meet specific storage requirements. The relationship between the amount of time for 50 % of the water to drain and the thickness and permeability of the base is given by following equation (21):
K = )(2 50
2
SLHtLne
+ (9)
where t 50 = The time for 50 % drainage (days), ne = The effective porosity, H = Thickness of drainage layer (ft), S = Slope of drainage layer, L = Length of drainage path (ft), K = Permeability (ft/day),
Permeability for any degree of drainage can be determined graphically in Figure 13. In this figure, the degree of drainage U depends on two factors which are time factor Tf and slope factor SF, which are defined as:
T
KHtn Lf
e
=2
(10)
SLSHf = (11)
where
t = The time since the rain stopped and drainage began, and K, H, L S and ne were previously defined.
After the permeability of base layer has been calculated, the amount of storage in the pavement that occurs over a certain period of time can be estimated as follows: Amount of storage = quantity water entered into the pavement - quantity water drained out of the pavement = (2 L F R) – (K I H) (12)

B.31
The amount and length of water storage in a pavement will depend on the infiltration rate
and the outflow rate. When the outflow rate is less than the inflow rate, water infiltrating into the pavement will be stored in the pavement. The maximum volume of water that per unit surface area can be stored in the underlying layers and be calculated as:
Figure 13 Time Dependent Drainage of a Saturated Base Layer (5).
B.32
Vr
G rhd
s wii= −
×
×∑ 1 (13)
where
V = Volume of water in one cubic foot of soil or aggregate γd = Dry density of in place soil or aggregate
Gs = Specific gravity of soil or aggregate D10 = Unit weight of water i = Number of layer hi = Thickness of each layer
As mentioned before, surface infiltration, largely from rainfall, is often the major source in all possible inflow (6 and it is calculated from equation (6). If the inflow rate is equal to the outflow rate, the permeability of the drainage layer is obtained by:
K=2 L F R
H i× × ×
× (14)
where L , F, R, H, i and K are previously defined. It is noted for a given drainage layer slope, an outflow rate can be obtained for various combinations of the base thickness and permeability. So designers may 1) try several thickness and calculate the required permeability of the material for each. 2) select one or more permeability of the drainable layer which is representative of local materials with acceptable grading and calculate their required thickness from the above equation. Whatever combination, a variety of choices are available in terms of available materials, economy and construction feasibility. Table 5 gives the general relationship between gradation and permeability, which can be information useful in the selection of a base material. Also if the quantity water to be removed by the drainage layer is known, then the quantity of KH in Darcy’s equation ( KH =Q/i) allows for the permeability of the drainage layer to be obtained from Figure 18. The Selection of Base Material
The design of the base layer is essential to the designer because the base course is not only the major structural load carrying element, but also the medium of water transmission. It plays an important role in facilitating drainage capacity and in carrying traffic load. Several factors should be considered in selecting base material selection: 1) Performance of the pavement, 2) Stability, and 3) Storage capacity.
B.33
In order to enhance the stability of the base in the presence of water, base material should consist of non-plastic material and contain less than 3-5 percent passing the #200 sieve (1). Reducing the percentage of fine materials increases permeability but may decrease the stability of the base. An investigation of the influence of base permeability on pavement performance (23) found higher pavement deflections in pavements consisting of high permeability sub base sections than those consisting of lower permeability base sections. However, there was lower distress development using permeable base (24, 25). Because optimum permeability and good stability cannot always be compatible, high permeability material would appear to be the best from a drainage aspect. But stability may be of concern in such a material. Conversely, a very dense and stable material would most likely produce poor drainage conditions. It is necessary to strike a balance between drain ability and stability in the design of the sub base/base systems. This can be facilitated by stabilizing the drainage layer by a small amount of asphalt (2-2.5% by weight) or Portland cement (200 to 300 lb. per cu yd) (26). Investigations have shown that a certain percent of asphalt or cement added to a base material improves the stability of drainage layer without significantly affecting the layer's permeability (27). Examples of base material gradations are provided in Table D.2. Filter Criteria
When water flows from one soil or aggregate material into another of different gradation, fine particles from the first material may wash into the second, especially when a lower permeable bedding layer material is placed directly on a higher permeable base layer. Fine particle may tend to migrate into the high permeable material resulting in clogging pore spaces of permeable material and an over all reduction of permeability of the permeable base layer. In order to eliminate the fine soil movement, certain filter criteria must be satisfied between two different gradation layers, otherwise a protective filter layer should be used. Filter material should meet the following criteria to prevent the adjacent finer material from piping or migrating into the filter material and still be coarse enough to carry water without any significant resistance. Criteria recommended by Moulton (12) is: Clogging Criteria:
D filterD soil
515
85
≤ (15)
Permeability Criteria:
D filterD soil
15
15
5≥ (16)
Additional Criteria:
B.34
D filterD soil
50
50
25≤ (17)
Cu =D filterD filter
60
10
20≤ (18)
where
D15 = Grain diameter at 15% passing D85 = Grain diameter at 85 % passing D50 = Grain diameter at 50 % passing D10 = Grain diameter at 10 % passing D60 = Grain diameter at 60 % passing Cu is the coefficient of uniformity
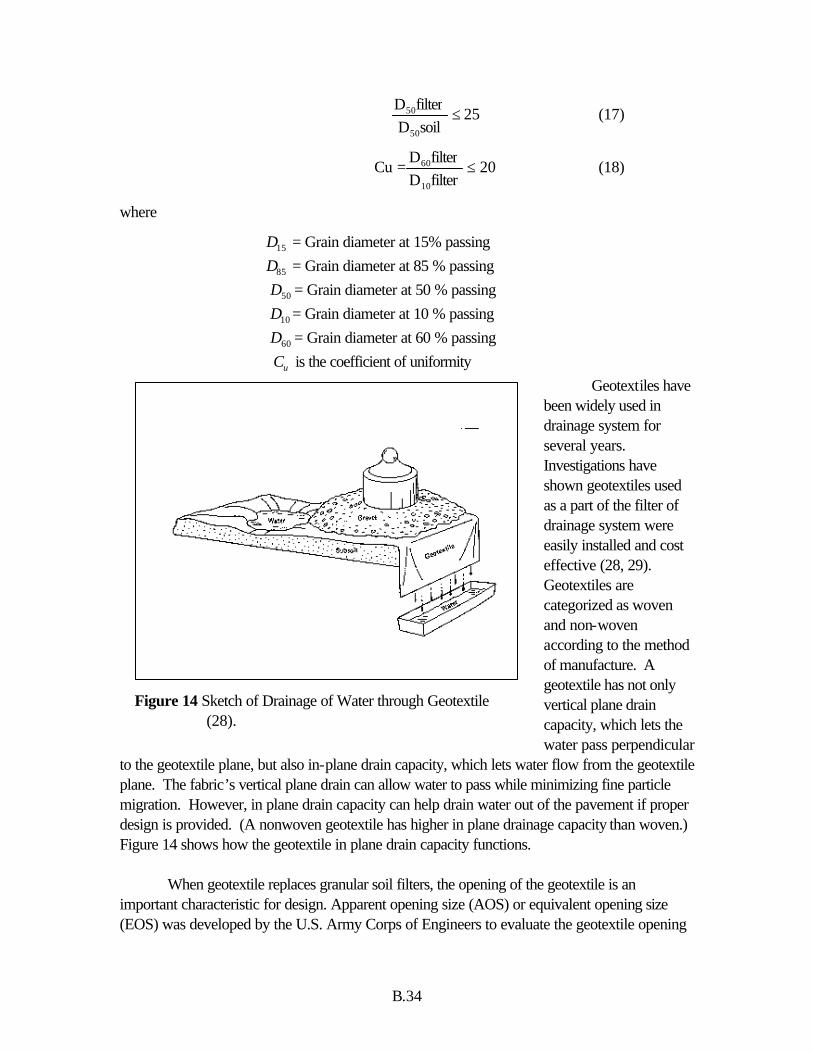
Geotextiles have been widely used in drainage system for several years. Investigations have shown geotextiles used as a part of the filter of drainage system were easily installed and cost effective (28, 29). Geotextiles are categorized as woven and non-woven according to the method of manufacture. A geotextile has not only vertical plane drain capacity, which lets the water pass perpendicular
to the geotextile plane, but also in-plane drain capacity, which lets water flow from the geotextile plane. The fabric’s vertical plane drain can allow water to pass while minimizing fine particle migration. However, in plane drain capacity can help drain water out of the pavement if proper design is provided. (A nonwoven geotextile has higher in plane drainage capacity than woven.) Figure 14 shows how the geotextile in plane drain capacity functions. When geotextile replaces granular soil filters, the opening of the geotextile is an important characteristic for design. Apparent opening size (AOS) or equivalent opening size (EOS) was developed by the U.S. Army Corps of Engineers to evaluate the geotextile opening
Figure 14 Sketch of Drainage of Water through Geotextile (28).

B.35
(28). AOS or EOS is defined as the number of standard beads at 5% passing though the geotextile. The design of a geotextile filter has three parameters to be considered: a. Adequate permeability, b. Proper soil retention, and c. Long-term performance
There are various design criterion to meet these three requirements. But the Christopher and Holtz criteria (30) is currently used by the Federal Highway Administration. Criteria for geotextile filter for soil retention:
(1) For fine-grained soils with more than 50% passing though a #200 sieve:
Woven: AOS D≤ 85 Nonwoven: AOS#1.8D85
AOS # 0.3 mm or $ No. 50 sieve
(2) For granular material with 50 % or less passing though a # 200 sieve:
AOS # B x D85
where
B = 1 for 2 8≥ ≥CU B = 0.5 for 2<CU#4 B = 8/CU for 4 < CU < 8 CU is the coefficient of uniformity = D D60 10/
Permeability Criteria:
K (fabric) ≥ K (soil)
Clogging Criteria:
Woven: percent open area ≥ 4 % Nonwoven: porosity $ 30 %
The use of a geotextile between the base and the subgrade was investigated by Anderson and Killeavy (31). The result showed that the use of a geotextile between the base and the sub grade improves the modulus of base and sub grade, decreases the deflection of the pavement, and improves pavement performance. Actually placing a geotextile between the base and the sub grade provides not only filtration, but also serves as a reinforcement and separation function as shown in Figure 15. As a separator, a geotextile prevents mixing of the base and weak underlying soil, this allows the original thickness of the granular base to be maintained. A geotextile, as reinforcement, increases the whole system modulus. The loss of stiffness due to

B.36
the presence of water in a pavement system may be compensated to some extend from the use of a geotextile.
Collection System
A collection system is used to collect water from the drainage layer, then convey it to suitable outlets outside of the pavement. The design of collection system includes (12): a. Collection system drainage capacity. b. The location and depth of collector and their outlets. c. Type of collection system to be utilized. d. Filter protection to provide sufficient drainage capacity and to prevent flushing of
drainage aggregate into the collection system.
Various types of edge drain are available. There are traditional perforated or slotted pipe under drains, prefabricated geocomposite fin drains, geotextile wrapped under drains, and geotextile socked perforated pipes as shown in Figure 16. In contrast to the edge drain made of perforated pipe and natural soil, the prefabricated edge drain has a lower cost, less excavated soil to be removed, and is easy to install (32). A prefabricated geocomposite fin drain is made of two components, which are the drainage core and the geotextile filters which
Figure 15 Separation Mechanisms of Geotextile (28).

B.37
are wrapped around the drainage core. Investigation of the prefabricated edge drain showed that the placement of prefabricated edge drain is important. When prefabricated edge drain is placed on the opposite side of the drainage layer, it alleviated the problem of soil loss through the geotextile filters better than when it is placed on side next to the drainage layer (27). The selection of the type of collection system depends on specific soil conditions at the site, the function of the collection system (i.e. to be temporary storage or to be a medium for water to pass through) construction feasibility, and economy considerations.

B.38
Maintenance
The prime function of a surface drainage void inherent in the Uni Eco-stone pavement system (filled with clear sand filling) is to allow rain water penetrate into the pavement. However various contaminants like oil, dust and other fine road debris will be carried into the voids. Therefore, the infiltration capacity of Uni Eco-Stone pavement decreases with time. In order to maintain the permeability of surface drainage, routine inspection of the permeability of pavement is necessary. If the permeability of the pavement has reduced significantly, conventional street sweepers equipped with vacuums, water and brushes could be used for restoring the permeability capacity of the pavement (1).
Figure 16 Various Types of Subdrainage System Using Geotextiles (29).
B.39
CHAPTER 5 PERFORMANCE OF PERMEABLE BLOCK PAVEMENT SYSTEMS
Although the concept of storing water in a pavement system for short periods of time may appear to transverse conventional pavement design wisdom, European experience has clearly demonstrated, at increasing frequency, that permeable concrete paving systems can reliably perform within limits relative to applied traffic levels (35, 37). Certain factors key to the performance of permeable pavement systems, discussed below, should be a focus in the design process and evident in related construction specifications. Prior to elucidating these factors, it is important to understand the performance behavior of concrete block pavements. Under load, a concrete block will tend to rock, rotate, and slid horizontally to the extent it is restrained by adjacent blocks and the bedding layer material. As a result, the stresses in the bedding layer can become very high unless the paving blocks work together as an “stiffened” layer to distribute the load stresses beyond those blocks which are immediately below or within the boundaries of the tire print. In this sense, the jointing sand plays an important role in providing aggregate interlock and the transfer of load between adjacent blocks. Under this type of loading action, the support base materials (and particularly the bedding materials) will have a tendency to displace laterally away from the vicinity of the loading pattern due to the lack of shear resistance within the joints of the paving blocks. This displacement is referred to as “rutting” and, if the loads are frequent and severe enough, will accumulate to several millimeters. Experience and research have clearly indicated that the most critical layer in the permeable pavement structure is the bedding layer and improper placement carries a high probability of premature failure. Along with the development of rutting, is distortion of the longitudinal profile of the pavement surface. This distortion is largely due to variability in the development of rutting from point to point along the longitudinal alignment of the pavement surface. The variation in rutting can be due to variation in layer thickness, level of compaction, particle shape characteristics, gradation, and undulations in the initial, constructed surface (37). Any initial variation tends to exacerbate the negative impact of dynamic wheel effects on the development of longitudinal distortion. For this purpose the longitudinal profile needs to be as smooth as possible. In light of this, recent research (35, 36, 37) identifies key performance factors as being related to:
(1) Width of joints (2 – 3 mm) between blocks and the proper placement of the sand within them.
(2) Use of edge restraint to facilitate development of shear between concrete blocks. (3) Minimal roughness in the initially constructed longitudinal profile. (4) Adequate compaction and uniformity (maintaining thicknesses 5 mm or less).
Improperly designed and placed bedding layers may result in premature rutting. (5) Quality of materials (gradation, shape, etc.) should be as uniform as possible.
B.40
(6) Relative to (4) above, proper balance between void ratio and gradation limits and material stability and strength to simultaneously meet both the drainage and structural requirements of the design.
Sub grade strength and stiffness affects soil deformation properties, which significantly
influences pavement performance. Recent studies of fine-grained soil have demonstrated that the major factors that influence its strength and stiffness are water content and soil type (14, 15). Studies have also shown that permanent deformation increases with the increase in water content (under the same load strain), and that the moduli of soils consisting of high clay contents and high plasticity indexes are less sensitive to changes in moisture content than soils containing higher silt contents and demonstrating lower plasticity indexes. However, the moisture content of soil is influenced by soil drainage capacity. Therefore, it is important to have adequate soil characteristic data and soil permeability data for consideration of limited sub grade stiffness and drainage design. In order to ensure sufficient sub grade support, a minimum CBR (California Bearing Ratio) of 8 to 10 is needed (14). CBR is the ratio of load required to force piston (consisting of a 3 square inch area) into a soil to the load required to obtain similar penetration into a standard high quality crushed stone. When soil has less than a CBR of 6, stabilization is typically used to improve subgrade strength.
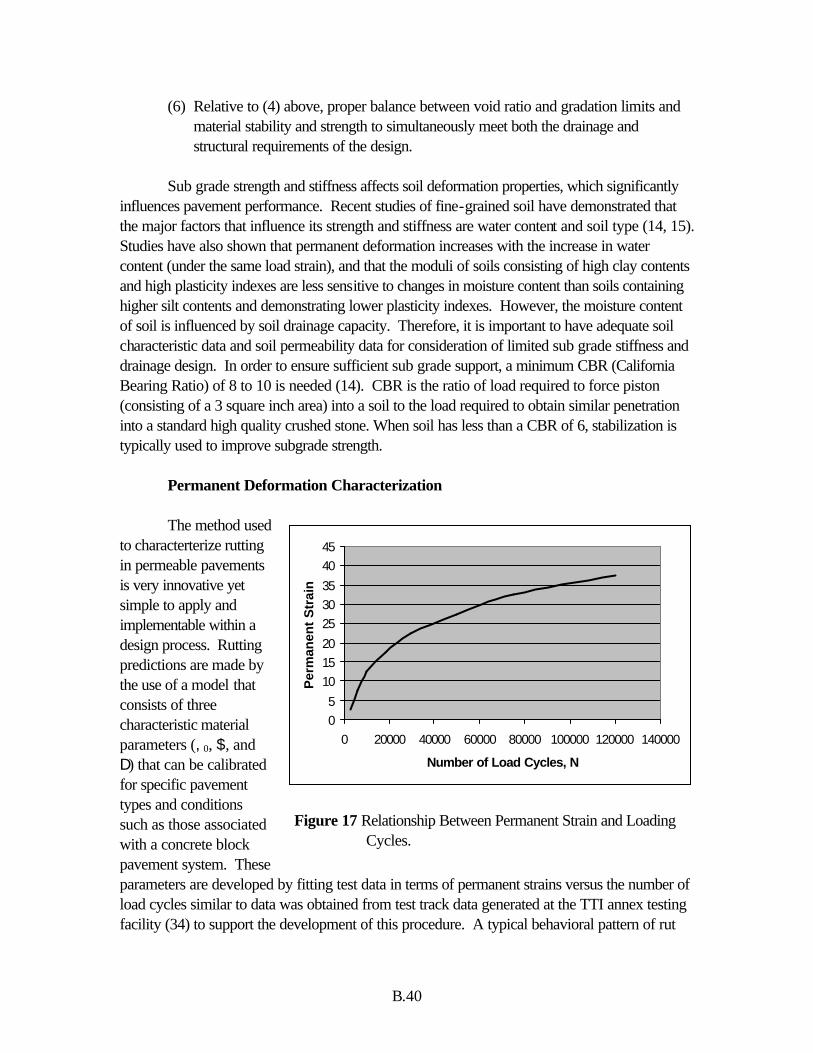
Permanent Deformation Characterization The method used
to characterterize rutting in permeable pavements is very innovative yet simple to apply and implementable within a design process. Rutting predictions are made by the use of a model that consists of three characteristic material parameters (,0, $, and D) that can be calibrated for specific pavement types and conditions such as those associated with a concrete block pavement system. These parameters are developed by fitting test data in terms of permanent strains versus the number of load cycles similar to data was obtained from test track data generated at the TTI annex testing facility (34) to support the development of this procedure. A typical behavioral pattern of rut
Figure 17 Relationship Between Permanent Strain and Loading Cycles.
05
101520
253035
4045
0 20000 40000 60000 80000 100000 120000 140000
Number of Load Cycles, N
Per
man
ent
Str
ain

B.41
development with load cycles is shown in Figure 17. The curve illustrated in this figure is represented by:
ε ε ρ β
aNe= −
0( / )
where ,z = permanent strain N = number of load cycles, and ,0, $, and D = material parameters. The values of $, and D are different for each soil type and moisture content. The ,0 term is also used to adjust the model to represent the behavior of permeable, concrete block pavements. As noted above, the parameter can be determined from loading data by re-arranging the derivation of the above expression as (38):
Log [∆(ln ,a)/∆(ln N)] = log ($D$) - $ log N in which $ is the slope of line relating rutting accumulation and number of load cycles. Once $ is determined, D can be found from the first term on the right hand side of the above equation and ,0 serves as a scaling factor which shifts the curve up and down the vertical scale. The data shown in Figure 18 illustrates some of the loading and permanent deformation data collected from the permeable pavement test track at the TTI research annex site used to calibrate the FLEXPASS model and the design charts provided in Appendix A.
Permanent Deformation Prediction The development of permanent deformation in a permeable, concrete block pavement system occurs in the wheel paths due to the accumulation of permanent strains caused by repetitive traffic loads. The model of permanent deformation was originally developed from using the finite element method of analysis to evaluate the resilient stain in the vertical direction in
0
0.05
0.1
0.15
0.2
0.25
0.3
0.35
0 100 200 300 400 500 600 700
Number of Passes (13,420 lb. Load)
Per
man
ent
Def
orm
atio
n (
in)
4" Base (PE-4); Low Perm. 4" Base (PE-2); Low Perm.
8" Base (PE-5); High Perm. 8" Base (PE-1); Low Perm.
Figure 18 Permanent Deformation of the Surface Layer - TTI Annex Test Track.
B.42
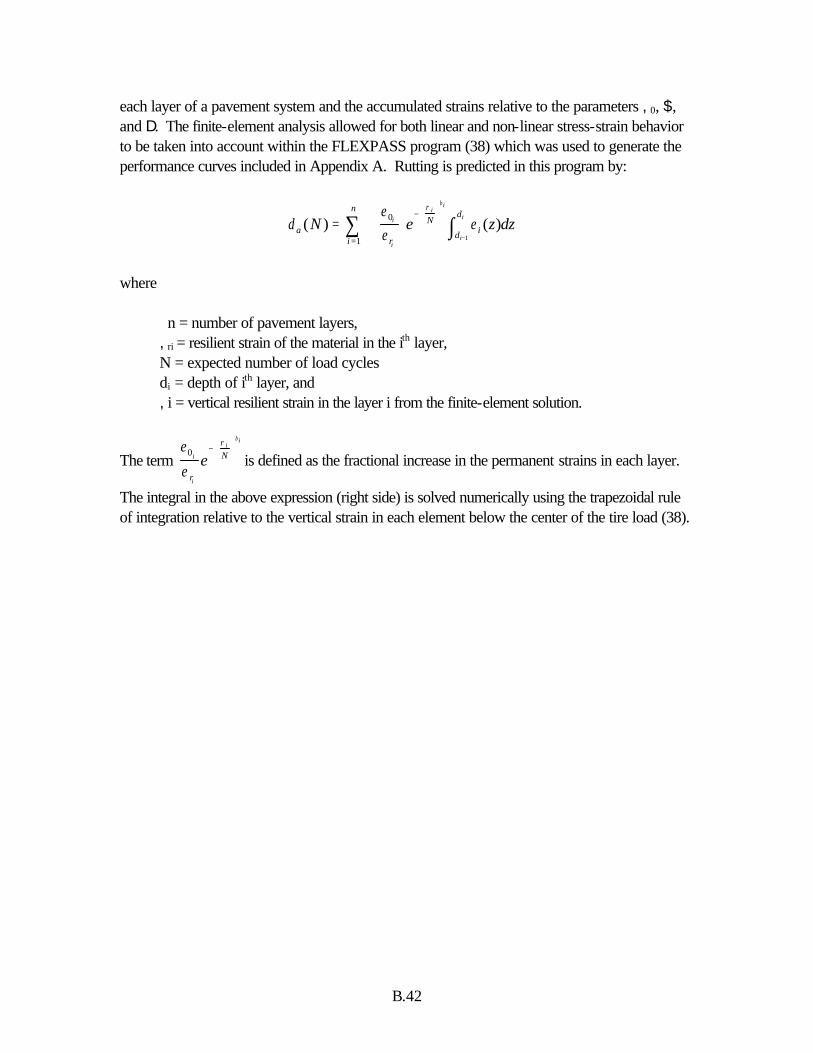
each layer of a pavement system and the accumulated strains relative to the parameters ,0, $, and D. The finite-element analysis allowed for both linear and non-linear stress-strain behavior to be taken into account within the FLEXPASS program (38) which was used to generate the performance curves included in Appendix A. Rutting is predicted in this program by:
δεε
ερ β
ar
Nid
d
i
n
N e z dzi
i
ii
i
i( ) ( )=
−
= −∫∑ 0
1 1
where n = number of pavement layers,
,ri = resilient strain of the material in the ith layer, N = expected number of load cycles di = depth of ith layer, and ,i = vertical resilient strain in the layer i from the finite-element solution.
The term ε
ε
ρ β
0i
i
ii
r
Ne−
is defined as the fractional increase in the permanent strains in each layer.
The integral in the above expression (right side) is solved numerically using the trapezoidal rule of integration relative to the vertical strain in each element below the center of the tire load (38).

B.43
REFERENCES 1. Rollings, R. S. and M. P. Rollings. Design Consideration for Uni Eco-Stone Concrete
Paver, Uni - Group U.S.A. Palm Beach Gardens, Florida, 1993. 2. Nichols, D., Exploring Alternatives to Porous Asphalt. Landscape Design,
November/December 1993. 3. R. S. Rollings and M. P. Rollings., Applications for Concrete Paving Blocks in the
United States Market, Uni-Group U.S.A., Palm Beach Gardens, Florida, 1992. 4. Sorving, K., “Porous Paving, Landscape Architecture,” Vol. 83, No. 2, Feb. 1993, p. 66-
69. 5. Liu, Shang J. and Robert L. Lytton, “Volume4: Environmental Effects on Pavements-
Drainage Manual,” U.S. DOT, Report No. FHWA/RD-84/116, Texas Transportation Institute, Texas A&M University Systems, College Station, TX, Feb. 1985.
6. Cedergren,H. R., Drainage of Highway and Airfield Pavements, Robert E. Krieger
Publishing Company, Inc., Florida, 1987. 7. Haan,C. T., B. J. Barfield and J. C. Hayes, Design Hydrology and Sedimentology for
Small Catchments, Academic Press, Inc., San Diego, California, 1994. 8. American Iron and Steel Institute. “Modern sewer Design,” Johnson Design Group, Inc.,
Falls Church, Virginia. 9. Airport Drainage, Federal Highway Administration, Washington, D. C., 1970. 10. Handbook of Steel Drainage and Highway Construction Products, American Iron and
Steel Institute. 11. Muth W., “Drainage with Interlocked Paving Bricks,” Research Institute for Water
Resources, Karlsruhe University of Engineering, Karlsruhe, Germany, 1988. 12. Moulton, L. K., “Highway Subdrainage Design,” Report No. FHWA-TS-80-224, Aug.
1980. 13. Hazen, A., “Discussion of 'Dam on Sand Foundations',” by A. C. Koening Transactions,
ASCE, Vol. 73, P.199. 14. Thompson, M. R., “Subgrade Stability,” Transportation Research Record 705, TRB,
National Research Council, Washington, D. C. 1979.
B.44
15. Edil, T. B., “Soil-Water Potential and Resilient Behavior of Subgrade Soils,” Transportation Research Record 705, TRB, National Research Council, Washington, D. C. 1979.
16. Phalen, T., “Development of Design Criteria for Flood Control and Ground Water
Recharge Utilizing Uni Eco-Stone and Ecoloc Paving Units,” NortheasternUniversity, Boston, Massachusetts
17. Engineering and Design Drainage Layers for Pavement, U.S. Army Corps of
Engineers, Engineer Technical Letter 1110-3-435, Washington, D.C., May 1992. 18. Luthin, J.N., Drainage Engineering, Robert E. Krieger Publishing Company, Huntington,
N.Y. 1978. 19. Louis, B., Controlled Storm Water Drainage, Industrial Press Inc., New York, N.Y. 20. Gerke, R. J., “Subsurface Drainage of Road Structure,” Specical Report No. 35,
Australian Road Research Board, April 1987. 21. Ridgeway, H. H., “Pavement Subsurface Drainage Systems”, Transportation Research
Record 96, TRB, National Research Council, Washington, D. C., 1982. 22. Cedergren, H. R., Seepage, Drainage and Flow Nets, Third Edition, John Wiley & Sons,
Inc., New York, 1989 23. Highlands, K. L. and G. L. Hoffman, “Subbase Permeability and Pavement Performance,”
Transportation Research Record 1159, TRB, National Research Council, Washington, D.C. 1988.
24. Kozeliski, F. A., “Permeable Bases Help Solve Pavement Drainage Problems,”
Aberdeen’s Concrete Construction, Vol. 37, No. 9, Sept. 1992, p. 660-662. 25. Baldwin, J. S. and D. C. Long, “Design, Construction and Evaluation of West Virginia's
First Free-Draining Pavement System,” Transportation Research Record 1159, TRB, National Research Council, Washington, D.C. 1988.
26. Subgrades and Subbases for Concrete Pavements, Portland Cement Association,
TS029.02p, 1971. 27. Kazmierowski, T. J. A Bradbury, and J. Hajek, “Field Evaluation of Various Types of
Open-graded Drainage Layers,” Transportation Research Record 1434, TRB. National Research Council, Washington, D.C. 1994.

B.45
28. Koerner, R. M., Design with Geosynthetics, Prentice Hall Inc., Englewood Cliffs, N. J. 1990.
29. Koerner, R. M., G. R. Koerner, A. K. Fahim, and R. F. Wilson-Fahmy, “Long-Term
Performance of Geosynthetics in Drainage Applications,” NCHRP Report 367, TBR, National Research Council, Washington, D. C. 1994.
30. Christopher, B.R. and R.D.Holtz, “Geotextile Engineering Manual,” Report No. FHWA-
TS-86/203, U.S. Federal Highway Administration, Washington, D.C., 1989 31. Anderson, P. and M. Killeavy, “Geotextiles and Geogrids: Cost Effective Alternative
Materials for Pavement Design and Construction, Geosynthetics Conference Proceedings, Town & County Hotel, San Diego, California, February 21-23, 1989.
32. Koerner and Bao-Lin Hwu, “Prefabricated Highway Edge Drains,” Transportation
Research Record 1329, TRB, National Research Council, Washington, D.C., 1991. 33. Tseng, Kuo-Hung, “A Finite Element Method for the Performance Analysis of Flexible
Pavements, Ph.D. Dissertation, Texas A&M University, College Station, Texas, August 1988.
34. Hughes, Stephen W., “Development and Construction of the Alternative Pavement Test
Track at the Texas A&M University Riverside Campus,” Department of Civil Engineering, Texas A&M University, College Station, Texas.
35. Borgwardt, S`nke, “Performance and Fields of Application for Permeable Paving
Systems,” Concrete Precasting Plant and Technology, Issue 2/1997. 36. Shackel, B., J.O. Kaligis, Y. Muktiarto, Pamudji, “Infiltration and Structural Tests of
Permeable Eco-Paving, Proceeding PaveIsrael 96, The Fifth International Conference on Concrete Block Paving, 23-27 June 1996, Tel Avia, Israel, pp. 623-632.
37. Huurman, M., “Permanent Deformation in Concrete Block Pavements,” Thesis, Delft
University of Technology, The Netherlands, 1997. 38. Tseng, Kuo-Hung and Robert L. Lytton, “Prediction of Permanent Deformantion I Flexible
Pavement Materials, Implication of Aggregates in the Design, Construction, and Performance of Flexible Pavements, ASTM STP 1016, H. G. Schreuders and C. R. Marek, Eds, American Society for Testing and Materials, Philadelphia, 1989, pp. 154-172.
B.46
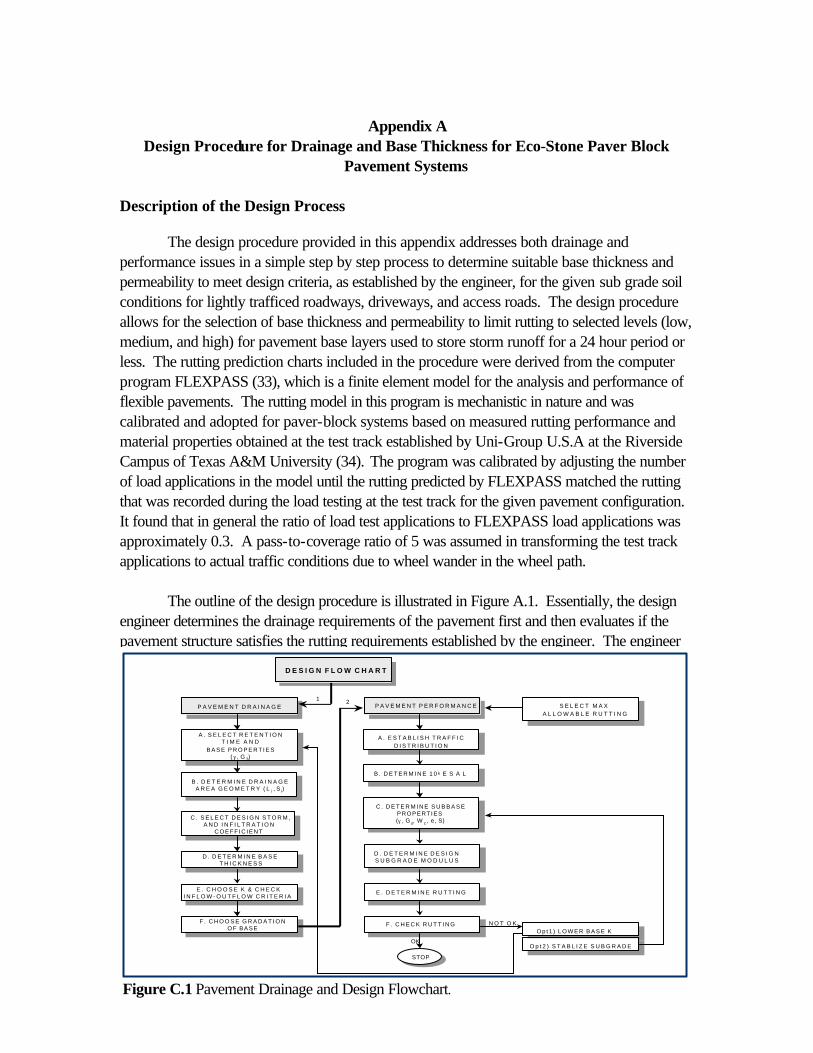
Appendix A
Design Procedure for Drainage and Base Thickness for Eco-Stone Paver Block Pavement Systems
Description of the Design Process The design procedure provided in this appendix addresses both drainage and performance issues in a simple step by step process to determine suitable base thickness and permeability to meet design criteria, as established by the engineer, for the given sub grade soil conditions for lightly trafficed roadways, driveways, and access roads. The design procedure allows for the selection of base thickness and permeability to limit rutting to selected levels (low, medium, and high) for pavement base layers used to store storm runoff for a 24 hour period or less. The rutting prediction charts included in the procedure were derived from the computer program FLEXPASS (33), which is a finite element model for the analysis and performance of flexible pavements. The rutting model in this program is mechanistic in nature and was calibrated and adopted for paver-block systems based on measured rutting performance and material properties obtained at the test track established by Uni-Group U.S.A at the Riverside Campus of Texas A&M University (34). The program was calibrated by adjusting the number of load applications in the model until the rutting predicted by FLEXPASS matched the rutting that was recorded during the load testing at the test track for the given pavement configuration. It found that in general the ratio of load test applications to FLEXPASS load applications was approximately 0.3. A pass-to-coverage ratio of 5 was assumed in transforming the test track applications to actual traffic conditions due to wheel wander in the wheel path. The outline of the design procedure is illustrated in Figure A.1. Essentially, the design engineer determines the drainage requirements of the pavement first and then evaluates if the pavement structure satisfies the rutting requirements established by the engineer. The engineer has several design options if the structure fails to meet the rutting criteria. One option includes lowering the permeability of the base material by increasing the number of fines in the gradation to provide a greater degree of protection to the subgrade soil. This can also be achieved by providing a two layer base structure that has a less permeable layer at the bottom and a higher permeability layer at the top. A second option is to strengthen the subgrade layer directly by stabilization methods. The engineer can reasonably assume the subgrade stiffness can be increased by a factor of 1.5 for design purposes when it is stabilized. In highly trafficked areas such as entryways to parking lots or in areas where rutting needs to be kept to a minimum, it is recommended that stabilized, drainable bases be considered. The design process entails the use of a variety of charts and worksheets that are provided in Appendix B. The worksheets are to assist the engineer in organizing the data from the charts. Chart 1 is used to determine base thickness given the storage requirements – which is a function of the design storm. Charts 2-5 are used to obtain base permeability to drain the base layer to 50% saturation over either 6, 12, 18, or 24 hours. Charts 6-10 provides rutting
D E S I G N F L O W C H A R T
C . D E T E R M I N E S U B B A S EPROPERTIES (γ , G s, W c , e, S)
A . E S T A B L I S H T R A F F I CD I S T R I B U T I O N
B . D E T E R M I N E 1 0 k E S A L
D . D E T E R M I N E D E S I G NS U B G R A D E M O D U L U S
E . D E T E R M I N E R U T T I N G
F . C H E C K R U T T I N G
STOP
O p t 1 ) L O W E R B A S E K
O p t 2 ) S T A B L I Z E S U B G R A D E
S E L E C T M A X A L L O W A B L E R U T T I N G
B . D E T E R M I N E D R A I N A G EA R E A G E O M E T R Y ( L i , S i)
C . S E L E C T D E S I G N S T O R M ,A N D I N F I L T R A T I O N
C O E F F I C I E N T
E . C H O O S E K & C H E C KI N F L O W - O U T F L O W C R I T E R I A
A . S E L E C T R E T E N T I O NT I M E A N D
B A S E P R O P E R T I E S( γ , G s)
D . D E T E R M I N E B A S ET H I C K N E S S
F . C H O O S E G R A D A T I O NO F B A S E
P A V E M E N T P E R F O R M A N C E
N O T O K
OK
1 2P A V E M E N T D R A I N A G E
Figure C.1 Pavement Drainage and Design Flowchart.

B.47
as a function of vehicle (i.e. axle) weight, quantity, and sub grade stiffness. The design charts represent a 50 percent reliability design and for a pass-to-coverage ratio of 5. Other pass-to-coverage ratios may be considered for other types of facilities (different than those noted above) such as cargo storage areas by applying a multiplying factor to the design chart traffic level (i.e. a factor of 0.5 times the number of axles/yr column).
It should also be pointed out the this design procedure is predicated upon quality
construction and compaction being achieved in the sub grade and base materials used in the Eco-Stone pavement system and that rutting in the bedding and jointing sand materials does not exceed 0.10 inches. Description of the Design Steps As previously noted, the design flow chart shown in Figure A.1 outlines the variety steps that are needed in the design process. Example worksheets are provided on pages A.9 and A.10 to illustrate the design steps and the exaction of information from the design charts in working through the design process. Prior to working an example using the worksheet, the design steps are described below: Pavement Drainage
Step A. Select the retention time to achieve 50% drainage of the base and determine the properties of the base.
It is common to require pavement layers to drain from 100% saturation to 50% saturation within 24 hours. Therefore, the design has been based on a retention time of 6, 12, 18, or 24 hours to achieve 50% drainage. List the dry unit weight and the specific gravity of the base materials and calculate its porosity using the formula provided in the worksheet.
Step B. Input the drainage area geometry parameters: drainage path length (Li) and slope (Si) and calculate the effective drainage length (Le) and slope (Se).
Longitudinal and transverse lengths (L1 and L2, respectively) of the drainage area and the associate slopes are used to calculate the length and slope according the formulas provided in the worksheet. The effective drainage path length should be adjusted if necessary to fit within the limits of the drainage area.
Step C. Select the design storm, the infiltration coefficient, and determine the amount of storage needed in the base layer.
It will be necessary to base the amount of storage needed on the design storm that is used to determine the amount of water that will fall on the paved area. The user can then select
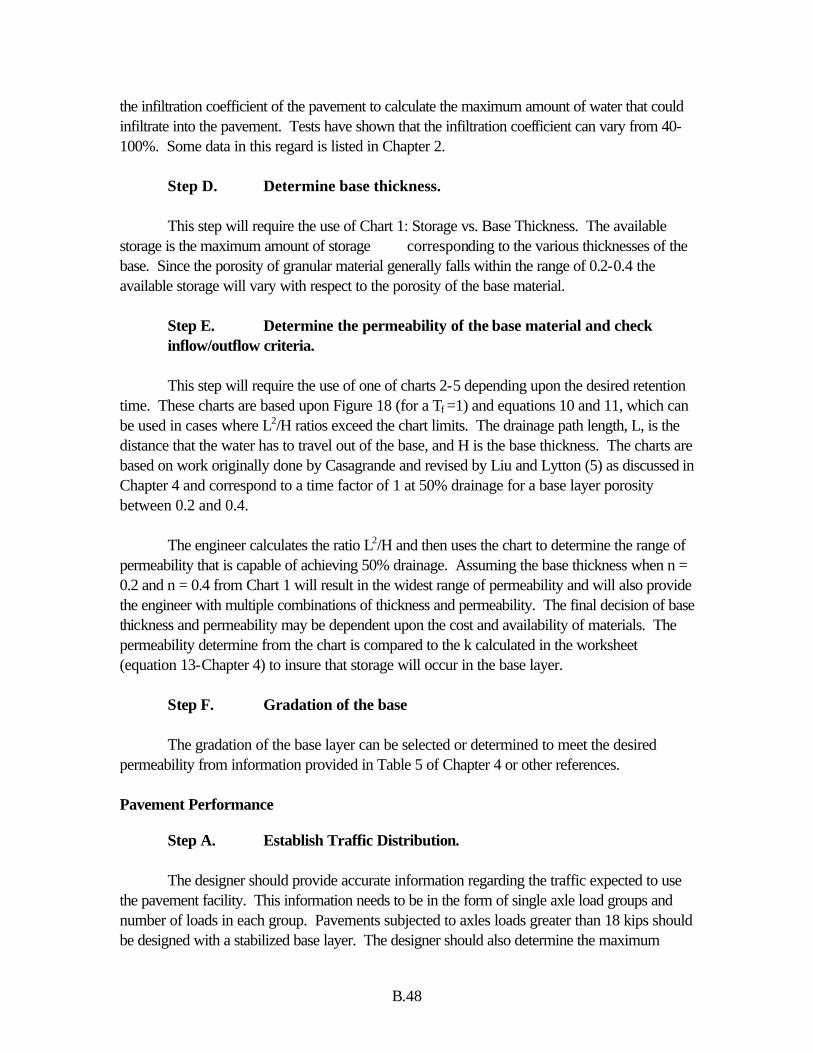
B.48
the infiltration coefficient of the pavement to calculate the maximum amount of water that could infiltrate into the pavement. Tests have shown that the infiltration coefficient can vary from 40-100%. Some data in this regard is listed in Chapter 2.
Step D. Determine base thickness. This step will require the use of Chart 1: Storage vs. Base Thickness. The available storage is the maximum amount of storage corresponding to the various thicknesses of the base. Since the porosity of granular material generally falls within the range of 0.2-0.4 the available storage will vary with respect to the porosity of the base material.
Step E. Determine the permeability of the base material and check inflow/outflow criteria.
This step will require the use of one of charts 2-5 depending upon the desired retention time. These charts are based upon Figure 18 (for a Tf =1) and equations 10 and 11, which can be used in cases where L2/H ratios exceed the chart limits. The drainage path length, L, is the distance that the water has to travel out of the base, and H is the base thickness. The charts are based on work originally done by Casagrande and revised by Liu and Lytton (5) as discussed in Chapter 4 and correspond to a time factor of 1 at 50% drainage for a base layer porosity between 0.2 and 0.4. The engineer calculates the ratio L2/H and then uses the chart to determine the range of permeability that is capable of achieving 50% drainage. Assuming the base thickness when n = 0.2 and n = 0.4 from Chart 1 will result in the widest range of permeability and will also provide the engineer with multiple combinations of thickness and permeability. The final decision of base thickness and permeability may be dependent upon the cost and availability of materials. The permeability determine from the chart is compared to the k calculated in the worksheet (equation 13-Chapter 4) to insure that storage will occur in the base layer.
Step F. Gradation of the base The gradation of the base layer can be selected or determined to meet the desired permeability from information provided in Table 5 of Chapter 4 or other references. Pavement Performance
Step A. Establish Traffic Distribution. The designer should provide accurate information regarding the traffic expected to use the pavement facility. This information needs to be in the form of single axle load groups and number of loads in each group. Pavements subjected to axles loads greater than 18 kips should be designed with a stabilized base layer. The designer should also determine the maximum

B.49
allowable rutting and enter it in the worksheet. Lower rutting is considered to be 0.25 inches or less, medium up to 0.5 inches and severe 0.75 inches.
Step B. Determine 10 kip ESAL.
If the traffic distribution contains more than one load group, then the axle groups should be converted, as a matter of convenience, to an equivalent load group such as the 10 kip axle load group. Equivalency factors (which is the ratio between the load group in question and the 10 kip axle load group) are determined for each load group by selecting the life (number of load repetitions for that group) at the same sub grade modulus and level of rutting (i.e. maximum allowable) from charts 6-10. The factors are calculated by dividing the life for each load group by the 10 kip load group life. The equivalency factor for the 10 kip load group is 1.0. Other load groups can be chosen as the base equivalent load group if desired. The 10 kip ESAL is determined by multiplying the number of axles in each load group by the 10 kip ESAL factor and summing across each load group. Rutting is then simply determined for a 10 kip axle load.
Step C. Determine sub grade properties. Provide the type, unit weight, specific gravity, and water content of the sub grade and calculate the void ratio (e) and the degree of saturation (S). The void ratio of the sub grade can be calculated using the following formula. e = Gsγw(1+w)/γ - 1 Gs = specific gravity, 2.6-2.8 γw = unit weight of water, 62.4 lb/ft3 w = water content of sub grade γ = unit weight of sub grade, lb/ft3 The degree of saturation is calculated using the following equation. S = wGs/e Step D. Determine design sub grade modulus, E. Depending upon the classification of the sub grade, the following equations should be used the calculate E0. CL, ML-CL: E = 32.0 - 0.312 S (units of ksi) CH: E = 22.5 - 0.155 S ML, MH: E = 30.2 - 0.308 S

B.50
Since the base of the pavement will allow water to reach the sub grade, the sub grade will inevitably increase in saturation, which will decrease the modulus of the sub grade. The equation to calculate the actual modulus of the sub grade is the following: E = Eoe(-0.07 SDIF) Eo = initial modulus value calculated in step 10 SDIF = change in pF from initial to present state It is reasonable to assume that the sub grade at its optimum water content is very close to its plastic limit that corresponds to a pF of 3.5. We can also assume that as the soil increases in water content it reaches a limit that corresponds to a pF of 2.5. Therefore, the maximum value of SDIF will be 1.0 that will result in the minimum modulus value.
Step F. Determining the amount of rutting
Step F will again require the use of one of the Charts numbered 6 through 10 depending upon the critical load category of the vehicles. The level of rutting is determined at the design sub grade modulus and vehicle axle load. If the level of rutting is unacceptable, then one of several options may be considered-a few of which are suggest here. Option 1 is the decrease the permeability of the base layer which will in effective maintain the sub grade at a lower moisture content. For this condition set SDIF to 0.5 and re-determine the amount of rutting. If the level of rutting is still unacceptable, stabilization of the sub grade should be considered. This will in effect increase the sub grade modulus by a factor of 1.5. A final option would be to consider the use of a stabilized base layer or a two layer base system as previously described.
The design charts are based on the results of the load testing performed at the Riverside test track at Texas A&M University and the predicted rutting using the computer program FLEXPASS. Example Design The follow example is described below and provided in the form of a completed worksheet shown in Figure A.2. This example illustrates a design for a 40 by 100 foot parking lot that will be subjected to 20,000, 10 kip vehicles per year. Pavement Drainage Step A Retention time is to be 12 hours
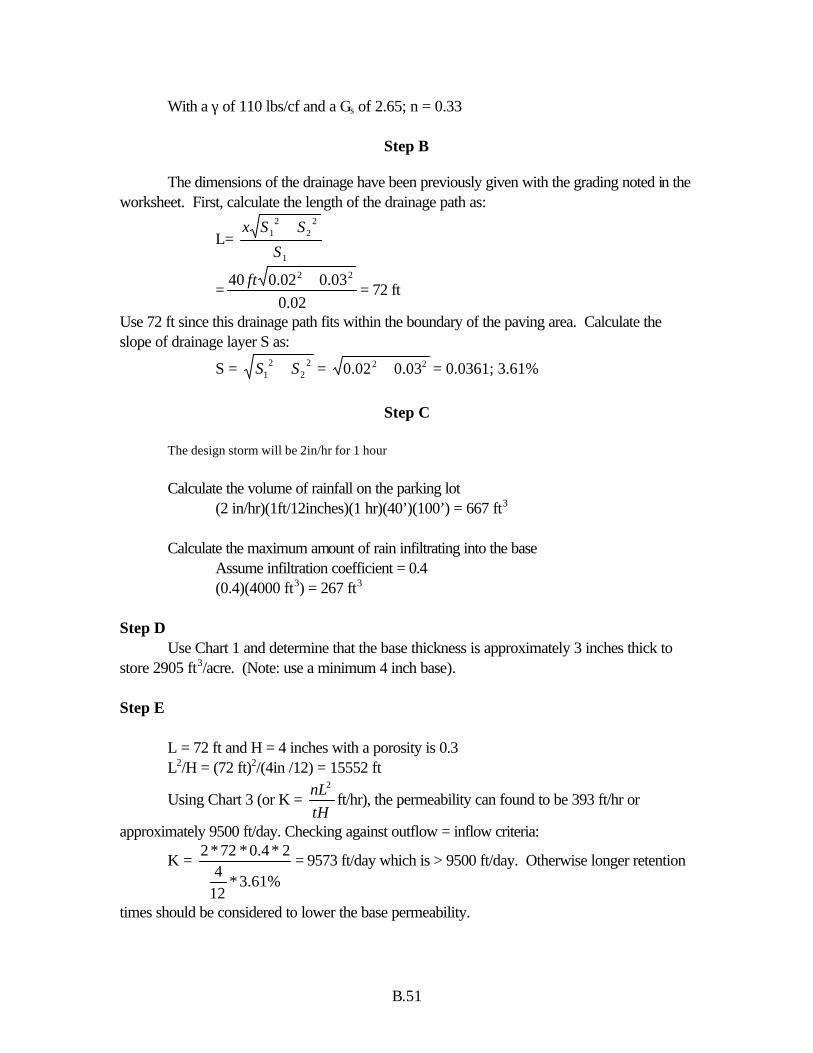
B.51
With a γ of 110 lbs/cf and a Gs of 2.65; n = 0.33
Step B
The dimensions of the drainage have been previously given with the grading noted in the worksheet. First, calculate the length of the drainage path as:
L= 1
22
21
S
SSx +
=02.0
03.002.040 22 +ft= 72 ft
Use 72 ft since this drainage path fits within the boundary of the paving area. Calculate the slope of drainage layer S as:
S = 22
21 SS + = 0 02 0 032 2. .+ = 0.0361; 3.61%
Step C
The design storm will be 2in/hr for 1 hour Calculate the volume of rainfall on the parking lot (2 in/hr)(1ft/12inches)(1 hr)(40’)(100’) = 667 ft3 Calculate the maximum amount of rain infiltrating into the base Assume infiltration coefficient = 0.4 (0.4)(4000 ft3) = 267 ft3 Step D Use Chart 1 and determine that the base thickness is approximately 3 inches thick to store 2905 ft3/acre. (Note: use a minimum 4 inch base). Step E L = 72 ft and H = 4 inches with a porosity is 0.3 L2/H = (72 ft)2/(4in /12) = 15552 ft
Using Chart 3 (or K = tHnL2
ft/hr), the permeability can found to be 393 ft/hr or
approximately 9500 ft/day. Checking against outflow = inflow criteria:
K = =∗
∗∗∗
%61.3124
24.07229573 ft/day which is > 9500 ft/day. Otherwise longer retention
times should be considered to lower the base permeability.

B.52
Step F A gradation of material ranging in size from a 1 inch to #8 sieve will have a K greater than 9500 ft/day Pavement Performance Step A Traffic for this example is as previously noted: 20,000-10 kip axle loads. A medium level of rutting will be acceptable.
Step B
Since only one load group is involved in this example, no determination of an ESAL factor is necessary. However, an example where the traffic distribution consists of a mix of axle group is shown in page A.10.
Step C The sub grade is a high plastic clay, CH, with unit weight of 115 lb/ft3 and water content of 22 percent. Assume the specific gravity, Gs, is 2.7 e = (2.7)(62.4 lb/ft3)(1+.22)/115lb/ft3 - 1 = 78.7%
S = (.22)(2.7)/(.787) = 75.5% The sub grade was classified as a CH so use the following equation: E0 = 22.5 - 0.155 S = 22.5 - 0.155(75.5) = 10.8 ksi Assume that the sub grade goes from it plastic limit (PL) to a condition that approaches a moisture condition that is midway between the PL and the liquid limit. Therefore, SDIF = 1.0 E = (10800 psi)e(-0.07(1.0))
= 10070 psi Step E

B.53
Use Chart 8 to determine the amount of rutting with a sub grade modulus value of 10070 psi and 20000, 10 kip vehicles. The amount of rutting is approximately 0.4 inches
Step F
0.4 inches of rutting is in the medium range. A rutting calculation is also provided for a case where the traffic mix consists of multiple axle load groups.

B.54
Eco-Stone Pavement Design and Drainage Worksheet
Drainage Retention Time: 12 hrs Base Properties
Unit Wt (γ): 110 1b/cf ws
d
Gn
γγ
−= 1 = 0.33
Specific Gravity (Gs): 2.65 Drainage Area Data Drainage Length
Slope Design Storm
F Drain Area
Base Infiltration
Base Thickness*
L1= 40’ S1= 2%
L2= 100’ S2= 3% 2”/hr 0.40 4000
ft2 267 ft3 3 (4 is min)
* Note: Use Chart 1 22
21 SSSe += = 3.61% Le =
i
ei
SSL
= 72 ft K = 393 ft/hr (Charts 2-5)
Outflow = Inflow Criteria
K = iH
RFL*
***2= 9573 ft/day or 399 ft/hr > 393 ft/hr O.K.
Base Gradation Particle Size %P Particle Size %P
2” #10 1-½” #16
1” 100 #30 ¾” 90-100 #40 ½” #50 3/8” 20-55 #100 #4 0-10 #200 #8 0-5
Drainage Area Layout L1 =100 ft
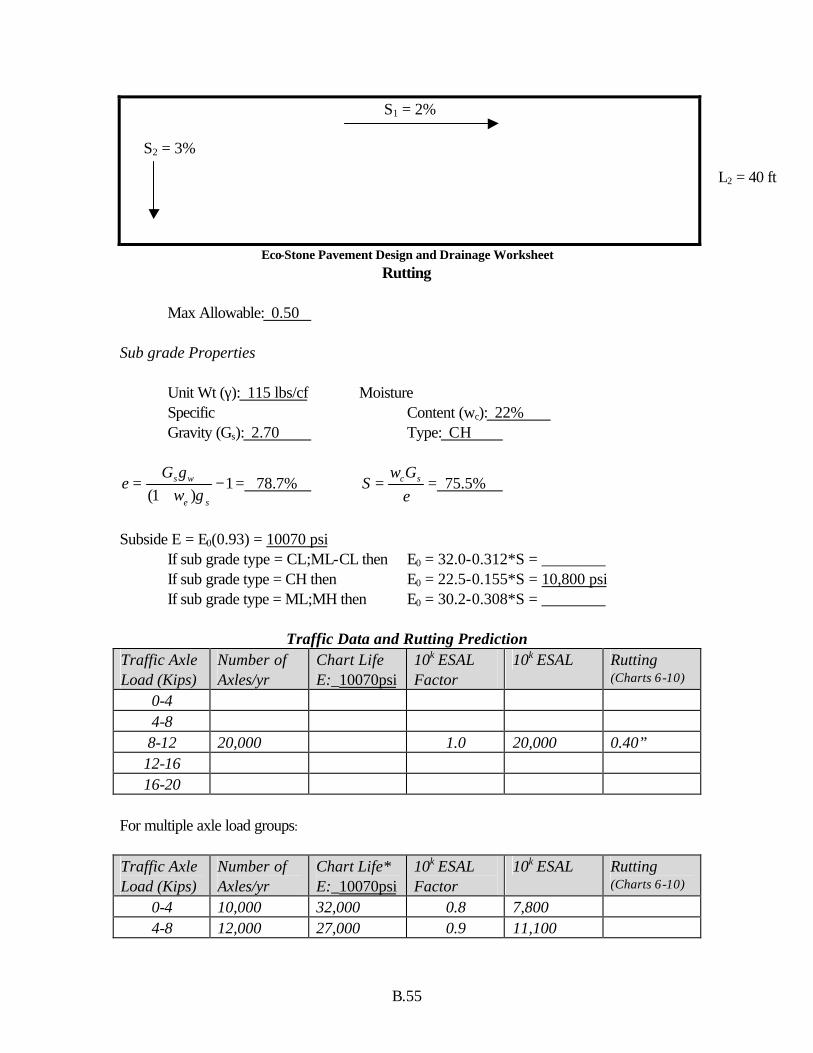
B.55
S1 = 2%
Eco-Stone Pavement Design and Drainage Worksheet Rutting
Max Allowable: 0.50 Sub grade Properties Unit Wt (γ): 115 lbs/cf Moisture
Specific Content (wc): 22% Gravity (Gs): 2.70 Type: CH
1)1(
−+
=se
ws
wG
eγ
γ= 78.7%
eGw
S sc= = 75.5%
Subside E = E0(0.93) = 10070 psi If sub grade type = CL;ML-CL then E0 = 32.0-0.312*S = ________
If sub grade type = CH then E0 = 22.5-0.155*S = 10,800 psi If sub grade type = ML;MH then E0 = 30.2-0.308*S = ________
Traffic Data and Rutting Prediction Traffic Axle Load (Kips)
Number of Axles/yr
Chart Life E:_10070psi
10k ESAL Factor
10k ESAL Rutting (Charts 6-10)
0-4 4-8 8-12 20,000 1.0 20,000 0.40” 12-16 16-20
For multiple axle load groups:
Traffic Axle Load (Kips)
Number of Axles/yr
Chart Life* E:_10070psi
10k ESAL Factor
10k ESAL Rutting (Charts 6-10)
0-4 10,000 32,000 0.8 7,800 4-8 12,000 27,000 0.9 11,100
S2 = 3%
L2 = 40 ft

B.56
8-12 5,000 25,000 1.0 5,000 12-16 2000 19,000 1.3 2600 16-20 1000 16,500 1.5 1500
*Note: Determined at 0.5 inches of rutting. Total = 28,000 Rutting = 0.55”
Appendix B Eco-Stone Pavement Design and Drainage Worksheet
Drainage
Retention Time:_________ Base Properties
Unit Wt (γ):_______ ws
d
Gn
γγ
−= 1 =_________
Specific Gravity (Gs):______ Drainage Area Data
Drainage Length
Slope Design Storm
F Drain Area
Base Infiltration
Base Thickness*
L1= S1=
L2= S2=
* Note: Use Chart 1 22
21 SSSe += =__________ Le =
i
ei
SSL
=___________ K = ________ (Charts 2-5)
Outflow = Inflow Criteria
k = iH
RFL*
***2=________
Base Gradation
Particle Size %P Particle Size %P 2” #10
1-½” #16 1” #30

B.57
¾” #40 ½” #50 3/8” #100 #4 #200 #8
Drainage Area Layout L1
S1
Eco-Stone Pavement Design and Drainage Worksheet
Rutting Max Allowable:______ Sub grade Properties Unit Wt (γ):_________ Moisture
Specific Content (wc):________ Gravity (Gs):________ Type:______
1)1(
−+
=se
ws
wG
eγ
γ=_________
eGw
S sc= =_________
Sub grade E = E0(0.93) = __________ If sub grade type = CL;ML-CL then E0 = 32.0-0.312*S = _________
If sub grade type = CH then E0 = 22.5-0.155*S = _________ If sub grade type = ML;MH then E0 = 30.2-0.308*S = _________
Traffic Data and Rutting Prediction
Traffic Axle Load (Kips)
Number of Axles/yr
Chart Life E:_______
10k ESAL Factor
10k ESAL Rutting (Charts 6-10)
0-4 4-8 8-12 1.0 12-16 16-20
S2
L2

B.58

C59
Chart 1: Storage vs. Base Thickness
0
5000
10000
15000
20000
25000
0 2 4 6 8 10 12 14 16 18
Base Thickness, inches
Ava
ilab
le S
tora
ge,
ft/a
cre
n = 0.2
n = 0.4

C60
Chart 2: Permeability for 6 Hour, 50% Drainage Retention Time
0
100
200
300
400
500
600
700
800
0 2000 4000 6000 8000 10000 12000
L2/H, ft
Per
mea
bilit
y, ft
/hr
n = .4
n = 0.2

C61
Chart 3: Permeability for 12 hour, 50% Drainage Retention Time
0
50
100
150
200
250
300
350
0 2000 4000 6000 8000 10000 12000
L2/H, ft
Per
mea
bilit
y, ft
/hr
n = 0.2
n = 0.4

C62
Chart 4: Permeability for 18 Hour, 50% Drainage Retention Time
0
50
100
150
200
250
0 2000 4000 6000 8000 10000 12000
L2/H, ft
Per
mea
bilit
y, ft
/hr
n = 0.2
n = 0.4
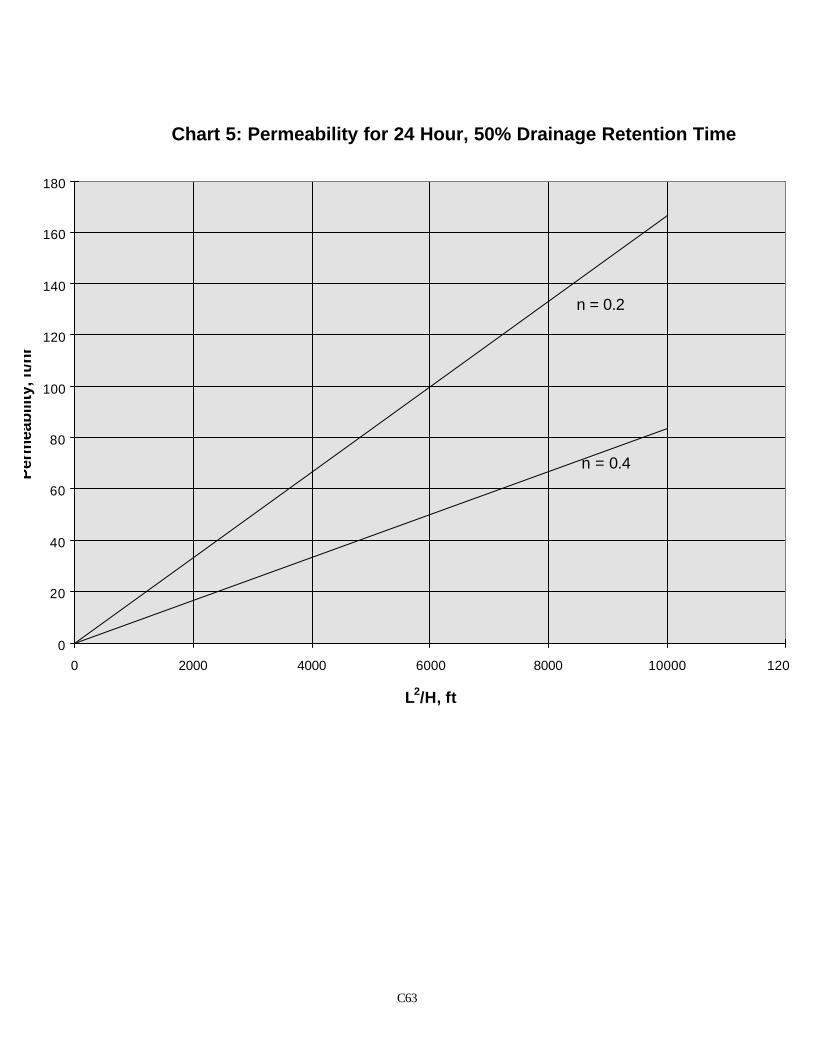
C63
Chart 5: Permeability for 24 Hour, 50% Drainage Retention Time
0
20
40
60
80
100
120
140
160
180
0 2000 4000 6000 8000 10000 12000
L2/H, ft
Per
mea
bilit
y, ft
/hr
n = 0.2
n = 0.4

C64
Chart 6: Rutting for 2 Kip Vehicles
2000
3000
4000
5000
6000
7000
8000
9000
10000
11000
12000
0 10000 20000 30000 40000 50000 60000 70000
Number of Loads per Year
E, p
si
Rut Depth = 0.25" Rut Depth = 0.5"
Rut Depth = 0.75"

C65
Chart 7: Rutting for 6 Kip Vehicles
3000
5000
7000
9000
11000
13000
15000
0 10000 20000 30000 40000 50000 60000
Number of Loads per Year
E, p
si
Rut Depth = 0.25"
Rut Depth = 0.5"
Rut Depth = 0.75"

C66
Chart 8: Rutting for 10 Kip Vehicles
4000
5000
6000
7000
8000
9000
10000
11000
12000
0 5000 10000 15000 20000 25000 30000 35000 40000 45000 50000
Number of Loads per Year
E, p
si
Rut Depth = 0.25" Rut Depth = 0.5" Rut Depth = 0.75"

C67
Chart 9: Rutting for 14 Kip Vehicles
4000
5000
6000
7000
8000
9000
10000
11000
12000
0 5000 10000 15000 20000 25000 30000 35000 40000 45000
Number of Loads per Year
E, p
si
Rut Depth = 0.25" Rut Depth = 0.5" Rut Depth = 0.75"

C68
Chart 10: Rutting for 18 Kip Vehicles
4000
5000
6000
7000
8000
9000
10000
11000
12000
0 5000 10000 15000 20000 25000 30000 35000 40000
Number of Loads per Year
E, p
si
Rut Depth = 0.25" Rut Depth = 0.5"
Rut Depth = 0.75"

C69
Appendix C
Storm Frequency Data
Figure C2 One-Hour/Two-Year Frequency Storm (17).
Figure C1 One-Hour/One-Year Frequency Storm (1).
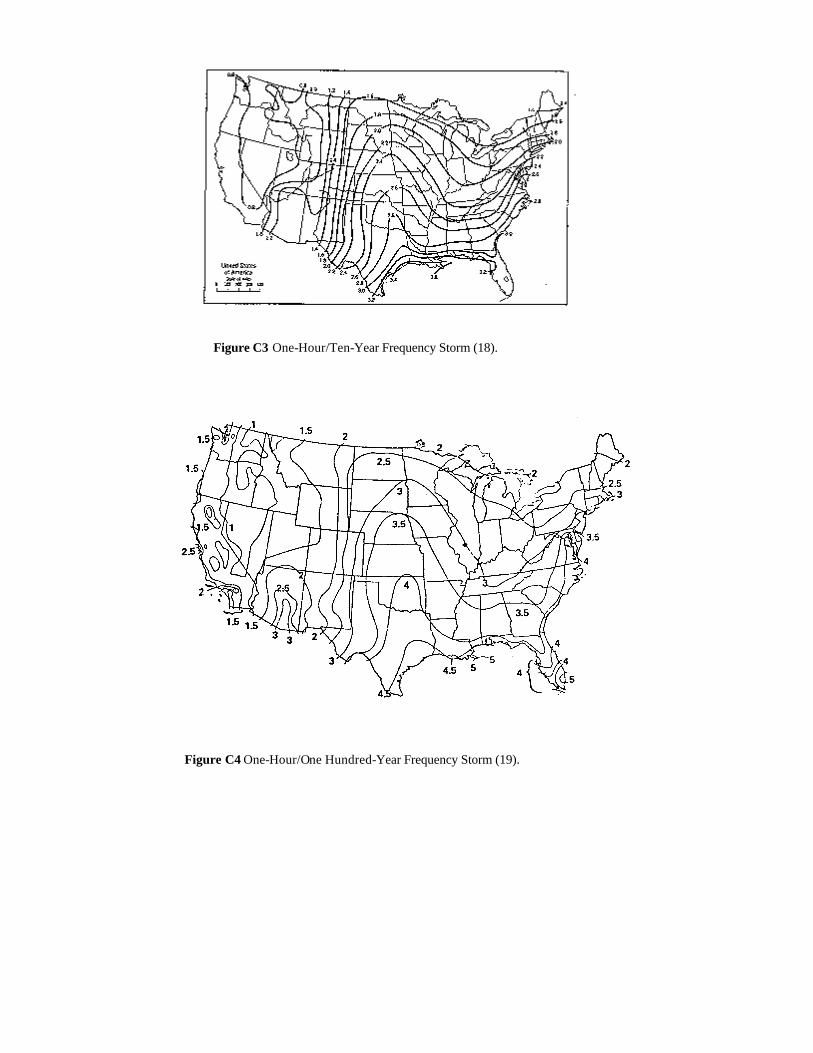
Figure C3 One-Hour/Ten-Year Frequency Storm (18).
Figure C4 One-Hour/One Hundred-Year Frequency Storm (19).
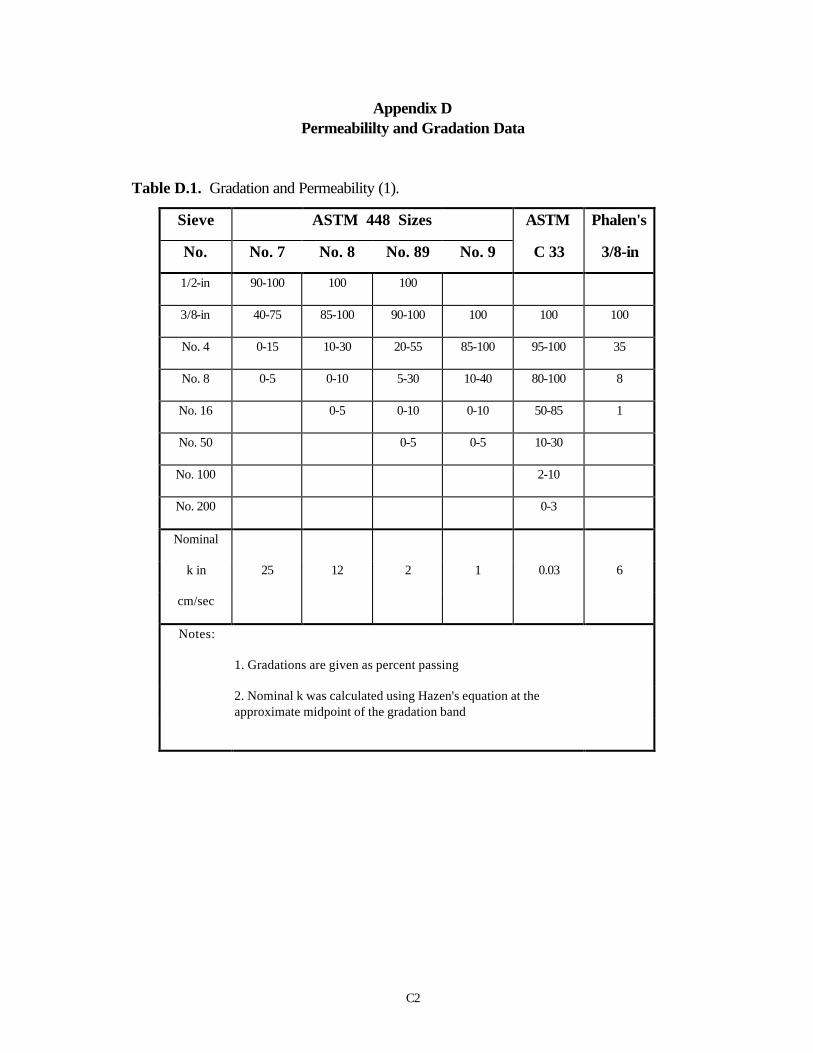
C2
Appendix D
Permeabililty and Gradation Data
Table D.1. Gradation and Permeability (1).
Sieve ASTM 448 Sizes ASTM Phalen's
No. No. 7 No. 8 No. 89 No. 9 C 33 3/8-in
1/2-in 90-100 100 100
3/8-in 40-75 85-100 90-100 100 100 100
No. 4 0-15 10-30 20-55 85-100 95-100 35
No. 8 0-5 0-10 5-30 10-40 80-100 8
No. 16 0-5 0-10 0-10 50-85 1
No. 50 0-5 0-5 10-30
No. 100 2-10
No. 200 0-3
Nominal
k in 25 12 2 1 0.03 6
cm/sec
Notes:
1. Gradations are given as percent passing
2. Nominal k was calculated using Hazen's equation at the approximate midpoint of the gradation band

C3
Table D.2. Grain Size, Density, and Permeability of Graded Aggregates (12)
% Passing Sample 1 Sample 2 Sample 3 Sample 4 Sample 5 Sample 6
3/4 in. 100 100 100 100 100 100
1/2 in. 85 84 83 81.5 79.5 75
3/8 in. 77.5 76 74 772.5 69.5 63
No. 4 58.5 56 52.5 49 43.5 32
No. 8 42.5 39 34 9.5 22 5.8
No. 10 39 35 30 25 17 0
No. 20 26.5 22 15.5 9.8 0 0
No. 40 18.5 13.3 6.3 0 0 0
No. 60 13 7.5 0 0 0 0
No. 140 6 0 0 0 0 0
No. 200 0 0 0 0 0 0
Dry Density (pcf) 121 117 115 111 104 101
k (ft./day) 10 110 320 1000 2600 3000