Embed Size (px)
Citation preview
8/9/2019 Potential of Asphalt Pavement Analyzer to Predict Rutting of Hot Mix Asphalt
http://slidepdf.com/reader/full/potential-of-asphalt-pavement-analyzer-to-predict-rutting-of-hot-mix-asphalt 1/27
POTENTIALOFASPHALTPAVEMENTANALYZERTOPREDICTRUTTINGOFHOTMIXASPHALT
By
PrithviS.Kandhal
RajibB.Mallick
PaperpublishedintheProceedingsoftheInternationalConferenceonAcceleratedPavementTesting,Reno,Nevada,October1999
277TechnologyParkway •Auburn,AL36830
8/9/2019 Potential of Asphalt Pavement Analyzer to Predict Rutting of Hot Mix Asphalt
http://slidepdf.com/reader/full/potential-of-asphalt-pavement-analyzer-to-predict-rutting-of-hot-mix-asphalt 2/27
POTENTIALOFASPHALTPAVEMENTANALYZERTOPREDICTRUTTINGOFHOTMIXASPHALT
By
PrithviS.Kandhal
AssociateDirectorNationalCenterforAsphaltTechnology
AuburnUniversity,Alabama
RajibB.Mallick
AssistantProfessorWorcesterPolytechnicUniversity
Worcester,Massachusetts
PaperpublishedintheProceedingsoftheInternationalConferenceonAcceleratedPavementTesting,Reno,Nevada,October1999

8/9/2019 Potential of Asphalt Pavement Analyzer to Predict Rutting of Hot Mix Asphalt
http://slidepdf.com/reader/full/potential-of-asphalt-pavement-analyzer-to-predict-rutting-of-hot-mix-asphalt 3/27
DISCLAIMER
Thecontentsofthisreportreflecttheviewsoftheauthorswhoaresolelyresponsibleforthefactsandtheaccuracyofthedatapresentedherein.ThecontentsdonotnecessarilyreflecttheofficialviewsandpoliciesoftheNationalCenterforAsphaltTechnologyofAuburnUniversity.Thisreportdoesnotconstituteastandard,specification,orregulation.
i
8/9/2019 Potential of Asphalt Pavement Analyzer to Predict Rutting of Hot Mix Asphalt
http://slidepdf.com/reader/full/potential-of-asphalt-pavement-analyzer-to-predict-rutting-of-hot-mix-asphalt 4/27
ABSTRACT
Ruttingisacommonprobleminhotmixasphaltpavements,particularlyinhotclimatesandat
intersections.TheAsphaltPavementAnalyzer(APA)isalaboratoryacceleratedloadingequipmentthatcanbeusedtoevaluateruttingpotentialofHMA.ThisstudywascarriedouttoevaluatethepotentialofAPAtopredictrutting.Specifically,theobjectivesweretofindthesensitivityoftheequipmenttochangesinaggregatetypeandgradation,performancegrade(PG)ofasphaltbinder,andevaluatetheequipmentbycomparingthetestresultswiththetestresultsfromSuperpavesheartester(SST).Mixesfrompoor,fairandgoodperformingpavementswerealsotestedwiththeAPAtodeveloparutdepthcriteriaforevaluationofmixes.
Binderandsurfacecoursemixesweremadewithgranite,limestoneandgravelaggregates,with
gradationsabovethemaximumdensityline,gradationsthroughtheSuperpaverestrictedzoneincloseproximityofthemaximumdensityline,andgradationsbelowthemaximumdensityline.
Resultsfromtestswithdifferentaggregates,gradations,andbindertypesshowthattheAPAis
sensitivetothesefactorsand,therefore,hasapotentialtopredictrelativeruttingofhotmixasphaltmixtures.TheAPAhadafaircorrelationwiththerepeatedshearconstantheighttestconductedwiththeSuperpavesheartester.
KEYWORDS:asphaltpavementanalyzer,APA,loadedwheeltester,rutting,hotmixasphalt,
restrictedzone,Superpavesheartester
ii
8/9/2019 Potential of Asphalt Pavement Analyzer to Predict Rutting of Hot Mix Asphalt
http://slidepdf.com/reader/full/potential-of-asphalt-pavement-analyzer-to-predict-rutting-of-hot-mix-asphalt 5/27
8/9/2019 Potential of Asphalt Pavement Analyzer to Predict Rutting of Hot Mix Asphalt
http://slidepdf.com/reader/full/potential-of-asphalt-pavement-analyzer-to-predict-rutting-of-hot-mix-asphalt 6/27
Kandhal&Mallick
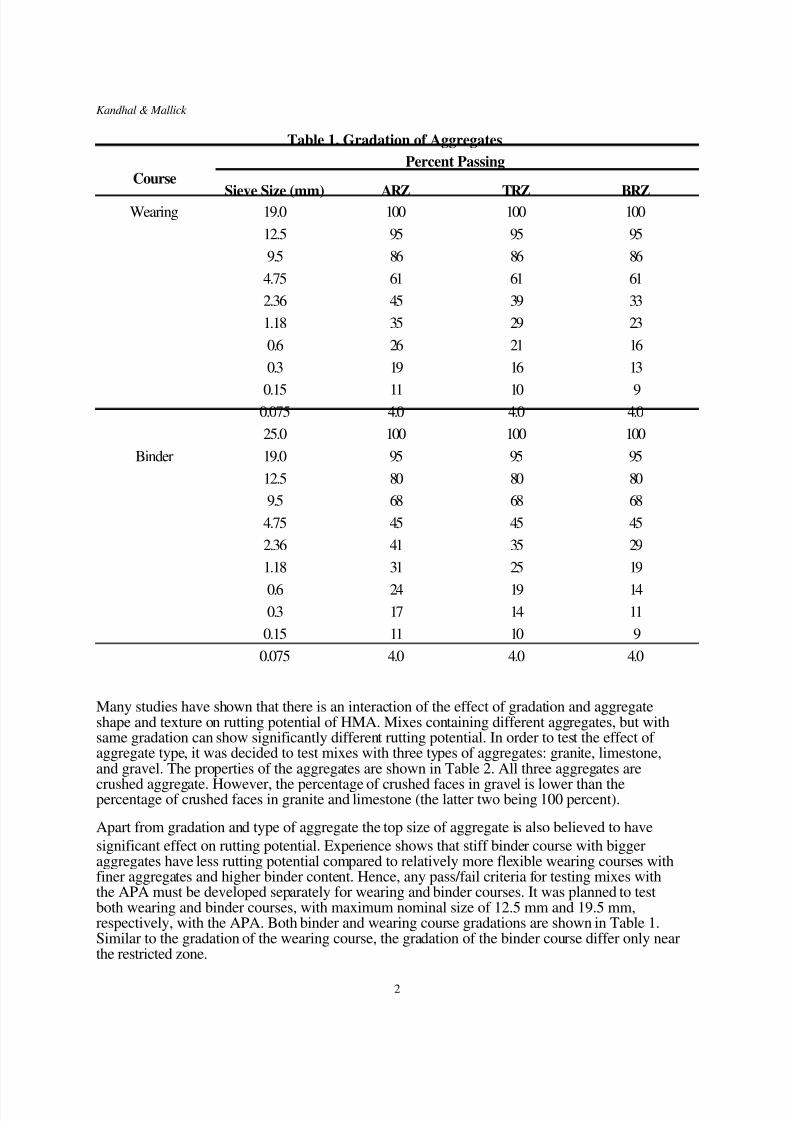
Table1.GradationofAggregates
PercentPassingCourse
SieveSize(mm) ARZ TRZ BRZWearing 19.0 100 100 100
12.5 95 95 95
9.5 86 86 86
4.75 61 61 61
2.36 45 39 33
1.18 35 29 23
0.6 26 21 16
0.3 19 16 13
0.15 11 10 90.075 4.0 4.0 4.0
25.0 100 100 100
Binder 19.0 95 95 95
12.5 80 80 80
9.5 68 68 68
4.75 45 45 45
2.36 41 35 29
1.18 31 25 19
0.6 24 19 140.3 17 14 11
0.15 11 10 9
0.075 4.0 4.0 4.0
ManystudieshaveshownthatthereisaninteractionoftheeffectofgradationandaggregateshapeandtextureonruttingpotentialofHMA.Mixescontainingdifferentaggregates,butwithsamegradationcanshowsignificantlydifferentruttingpotential.Inordertotesttheeffectofaggregatetype,itwasdecidedtotestmixeswiththreetypesofaggregates:granite,limestone,andgravel.ThepropertiesoftheaggregatesareshowninTable2.Allthreeaggregatesare
crushedaggregate.However,thepercentageofcrushedfacesingravelislowerthanthepercentageofcrushedfacesingraniteandlimestone(thelattertwobeing100percent).
Apartfromgradationandtypeofaggregatethetopsizeofaggregateisalsobelievedtohave
significanteffectonruttingpotential.Experienceshowsthatstiffbindercoursewithbiggeraggregateshavelessruttingpotentialcomparedtorelativelymoreflexiblewearingcourseswithfineraggregatesandhigherbindercontent.Hence,anypass/failcriteriafortestingmixeswiththeAPAmustbedevelopedseparatelyforwearingandbindercourses.Itwasplannedtotestbothwearingandbindercourses,withmaximumnominalsizeof12.5mmand19.5mm,respectively,withtheAPA.BothbinderandwearingcoursegradationsareshowninTable1.Similartothegradationofthewearingcourse,thegradationofthebindercoursedifferonlyneartherestrictedzone.
2
8/9/2019 Potential of Asphalt Pavement Analyzer to Predict Rutting of Hot Mix Asphalt
http://slidepdf.com/reader/full/potential-of-asphalt-pavement-analyzer-to-predict-rutting-of-hot-mix-asphalt 7/27
Kandhal&Mallick
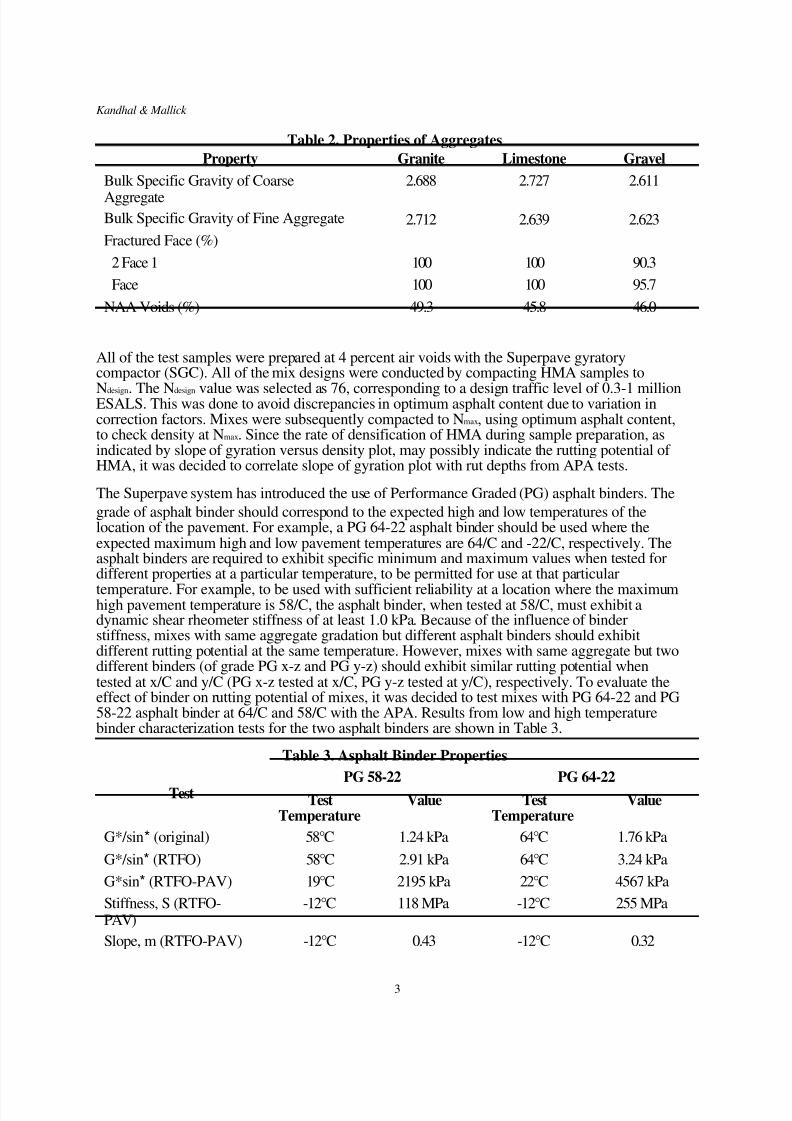
Table2.PropertiesofAggregates
Property
BulkSpecificGravityofCoarse
AggregateBulkSpecificGravityofFineAggregate
FracturedFace(%)
2Face1
Face
NAAVoids(%)
Granite
2.6882.712
100
100
49.3
Limestone
2.7272.639
100
100
45.8
Gravel
2.6112.623
90.3
95.7
46.0
Allofthetestsampleswerepreparedat4percentairvoidswiththeSuperpavegyratorycompactor(SGC).AllofthemixdesignswereconductedbycompactingHMAsamplesto
Ndesign.TheNdesignvaluewasselectedas76,correspondingtoadesigntrafficlevelof0.3-1millionESALS.Thiswasdonetoavoiddiscrepanciesinoptimumasphaltcontentduetovariationincorrectionfactors.MixesweresubsequentlycompactedtoNmax,usingoptimumasphaltcontent,tocheckdensityatNmax.SincetherateofdensificationofHMAduringsamplepreparation,asindicatedbyslopeofgyrationversusdensityplot,maypossiblyindicatetheruttingpotentialofHMA,itwasdecidedtocorrelateslopeofgyrationplotwithrutdepthsfromAPAtests.
TheSuperpavesystemhasintroducedtheuseofPerformanceGraded(PG)asphaltbinders.The
gradeofasphaltbindershouldcorrespondtotheexpectedhighandlowtemperaturesofthelocationofthepavement.Forexample,aPG64-22asphaltbindershouldbeusedwheretheexpectedmaximumhighandlowpavementtemperaturesare64/Cand-22/C,respectively.Theasphaltbindersarerequiredtoexhibitspecificminimumandmaximumvalueswhentestedfordifferentpropertiesataparticulartemperature,tobepermittedforuseatthatparticular
temperature.Forexample,tobeusedwithsufficientreliabilityatalocationwherethemaximumhighpavementtemperatureis58/C,theasphaltbinder,whentestedat58/C,mustexhibitadynamicshearrheometerstiffnessofatleast1.0kPa.Becauseoftheinfluenceofbinderstiffness,mixeswithsameaggregategradationbutdifferentasphaltbindersshouldexhibitdifferentruttingpotentialatthesametemperature.However,mixeswithsameaggregatebuttwodifferentbinders(ofgradePGx-zandPGy-z)shouldexhibitsimilarruttingpotentialwhentestedatx/Candy/C(PGx-ztestedatx/C,PGy-ztestedaty/C),respectively.Toevaluatetheeffectofbinderonruttingpotentialofmixes,itwasdecidedtotestmixeswithPG64-22andPG58-22asphaltbinderat64/Cand58/CwiththeAPA.ResultsfromlowandhightemperaturebindercharacterizationtestsforthetwoasphaltbindersareshowninTable3.
Table3.AsphaltBinderProperties
Test
Test
PG58-22
Value
Test
PG64-22
Value
Temperature Temperature
G*/sin*(original) 58°C 1.24kPa 64°C 1.76kPa
G*/sin*(RTFO) 58°C 2.91kPa 64°C 3.24kPa
G*sin*(RTFO-PAV) 19°C 2195kPa 22°C 4567kPa
Stiffness,S(RTFO- -12°C 118MPa -12°C 255MPaPAV)
Slope,m(RTFO-PAV) -12°C 0.43 -12°C 0.32
3
8/9/2019 Potential of Asphalt Pavement Analyzer to Predict Rutting of Hot Mix Asphalt
http://slidepdf.com/reader/full/potential-of-asphalt-pavement-analyzer-to-predict-rutting-of-hot-mix-asphalt 8/27
Kandhal&MallickTheSuperpavemixdesignandanalysissystemrecommendstheuseofSuperpaveShearTester(SST)todeterminetheruttingpotentialofHMA.TheSSTisbelievedtobeaverysensitive,sophisticatedmaterialcharacterizationequipmentwiththecapabilityofidentifyingthefundamentalpropertiesofHMA.TocomparetheresultsofAPAwiththeresultsfromtheSST,itwasdecidedtotestsomeselectedmixeswiththeSSTaswell.TwoSSTtestswereselectedfortheirusefulnessandsimplicity:therepeatedshearatconstantheight(RSCH)andrepeatedshearatconstantstressratio(RSCSR).TheRSCHcangiveanestimateofrutdepth,whereastheRSCSRiscapableofidentifyingmixessusceptibletoruttingatlowairvoids.
Anylaboratoryruttester,howeversensitiveitmightbe,isboundtohavescaleeffectsontest
results.Becauseofthedifferenceinlayerthickness,underlyingsupport,confiningpressure,andstressdistribution,amongotherthings,theresultsofruttestsinalaboratoryruttesterwillbedifferentfromactualrutdepthsinpavement.However,torecommendaspecificrutdepthforacceptance/rejectionofHMA,thereisaneedtocorrelatetheresultsfromtheAPAtestandactualrutdepthsinpavements.MixeswereobtainedbytheAlabamaDepartmentofTransportation(ALDOT)frompavementswithmajor,intermediateandminorrutting.Itwas
decidedtotestthesemixeswiththeAPA,andcorrelatetheresultswithactualrutdepths.Inthisway,laboratoryrutdepthscorrespondingtomajor,intermediateandminorruttingcanbeusedasbasisforspecificationofacceptance/rejectioncriteria.
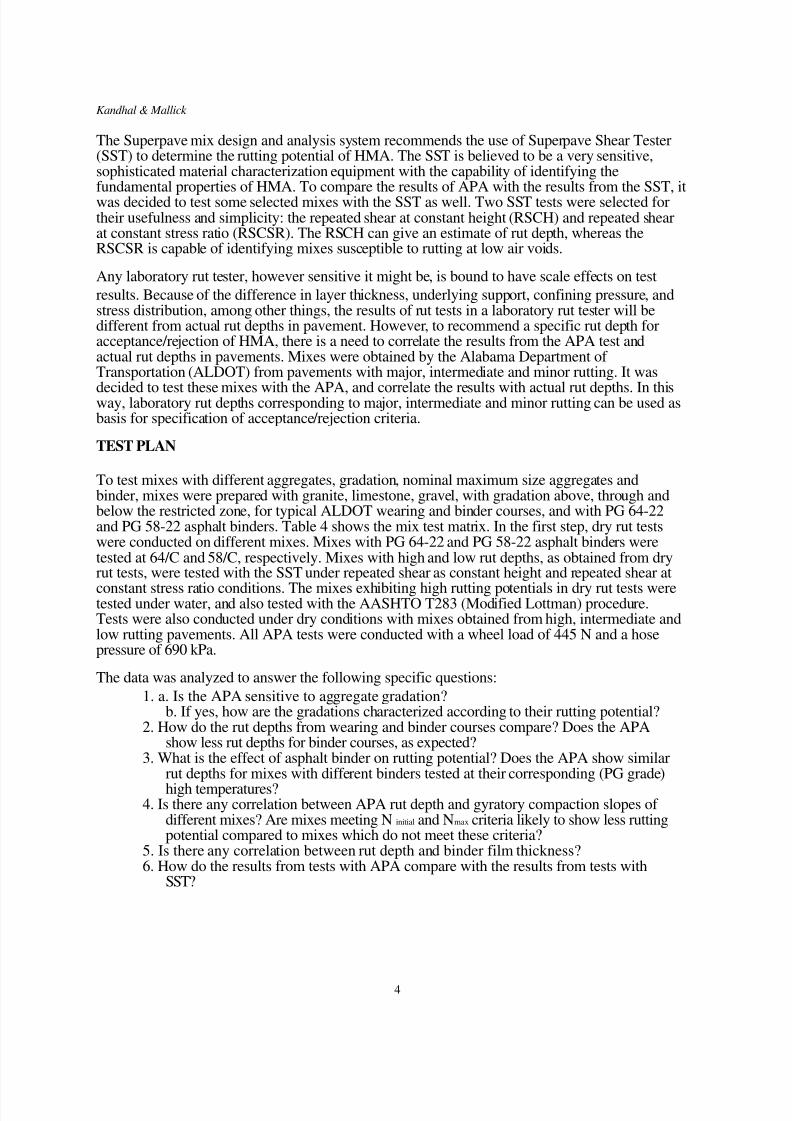
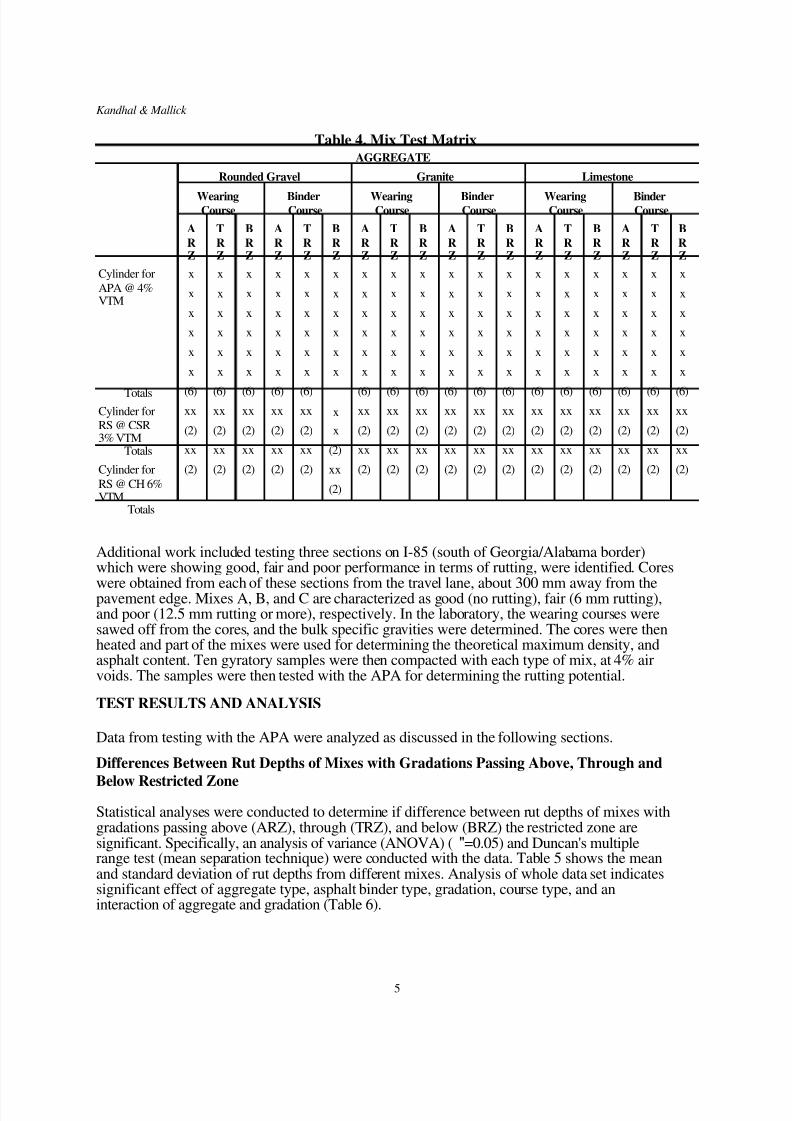
TESTPLAN
Totestmixeswithdifferentaggregates,gradation,nominalmaximumsizeaggregatesandbinder,mixeswerepreparedwithgranite,limestone,gravel,withgradationabove,throughandbelowtherestrictedzone,fortypicalALDOTwearingandbindercourses,andwithPG64-22andPG58-22asphaltbinders.Table4showsthemixtestmatrix.Inthefirststep,dryruttestswereconductedondifferentmixes.MixeswithPG64-22andPG58-22asphaltbindersweretestedat64/Cand58/C,respectively.Mixeswithhighandlowrutdepths,asobtainedfromdryruttests,weretestedwiththeSSTunderrepeatedshearasconstantheightandrepeatedshearat
constantstressratioconditions.Themixesexhibitinghighruttingpotentialsindryruttestsweretestedunderwater,andalsotestedwiththeAASHTOT283(ModifiedLottman)procedure.Testswerealsoconductedunderdryconditionswithmixesobtainedfromhigh,intermediateandlowruttingpavements.AllAPAtestswereconductedwithawheelloadof445Nandahosepressureof690kPa.
Thedatawasanalyzedtoanswerthefollowingspecificquestions:
1.a.IstheAPAsensitivetoaggregategradation?b.Ifyes,howarethegradationscharacterizedaccordingtotheirruttingpotential?
2.Howdotherutdepthsfromwearingandbindercoursescompare?DoestheAPAshowlessrutdepthsforbindercourses,asexpected?
3.Whatistheeffectofasphaltbinderonruttingpotential?DoestheAPAshowsimilarrutdepthsformixeswithdifferentbinderstestedattheircorresponding(PGgrade)
hightemperatures?4.IsthereanycorrelationbetweenAPArutdepthandgyratorycompactionslopesof
differentmixes?AremixesmeetingN initialandNmaxcriterialikelytoshowlessruttingpotentialcomparedtomixeswhichdonotmeetthesecriteria?
5.Isthereanycorrelationbetweenrutdepthandbinderfilmthickness?6.HowdotheresultsfromtestswithAPAcomparewiththeresultsfromtestswith
SST?
4
8/9/2019 Potential of Asphalt Pavement Analyzer to Predict Rutting of Hot Mix Asphalt
http://slidepdf.com/reader/full/potential-of-asphalt-pavement-analyzer-to-predict-rutting-of-hot-mix-asphalt 9/27
Kandhal&Mallick
Table4.MixTestMatrixAGGREGATE
RoundedGravel Granite Limestone
Wearing Binder Wearing Binder Wearing BinderCourse Course Course Course Course Course
A T B A T B A T B A T B A T B A T BR R R R R R R R R R R R R R R R R RZ Z Z Z Z Z Z Z Z Z Z Z Z Z Z Z Z Z
CylinderforAPA@4%VTM
TotalsCylinderforRS@CSR3%VTM
Totals
CylinderforRS@CH6%VTM
Totals
x
x
x
x
x
x
(6)xx
(2)
xx
(2)
x
x
x
x
x
x
(6)xx
(2)
xx
(2)
x
x
x
x
x
x
(6)xx
(2)
xx
(2)
x
x
x
x
x
x
(6)xx
(2)
xx
(2)
x
x
x
x
x
x
(6)xx
(2)
xx
(2)
x
x
x
x
x
x
x
x
(2)
xx
(2)
x
x
x
x
x
x
(6)xx
(2)
xx
(2)
x
x
x
x
x
x
(6)xx
(2)
xx
(2)
x
x
x
x
x
x
(6)xx
(2)
xx
(2)
x
x
x
x
x
x
(6)xx
(2)
xx
(2)
x
x
x
x
x
x
(6)xx
(2)
xx
(2)
x
x
x
x
x
x
(6)xx
(2)
xx
(2)
x
x
x
x
x
x
(6)xx
(2)
xx
(2)
x
x
x
x
x
x
(6)xx
(2)
xx
(2)
x
x
x
x
x
x
(6)xx
(2)
xx
(2)
x
x
x
x
x
x
(6)xx
(2)
xx
(2)
x
x
x
x
x
x
(6)xx
(2)
xx
(2)
x
x
x
x
x
x
(6)xx
(2)
xx
(2)
AdditionalworkincludedtestingthreesectionsonI-85(southofGeorgia/Alabamaborder)whichwereshowinggood,fairandpoorperformanceintermsofrutting,wereidentified.Cores
wereobtainedfromeachofthesesectionsfromthetravellane,about300mmawayfromthepavementedge.MixesA,B,andCarecharacterizedasgood(norutting),fair(6mmrutting),andpoor(12.5mmruttingormore),respectively.Inthelaboratory,thewearingcoursesweresawedofffromthecores,andthebulkspecificgravitiesweredetermined.Thecoreswerethenheatedandpartofthemixeswereusedfordeterminingthetheoreticalmaximumdensity,andasphaltcontent.Tengyratorysampleswerethencompactedwitheachtypeofmix,at4%airvoids.ThesampleswerethentestedwiththeAPAfordeterminingtheruttingpotential.
TESTRESULTSANDANALYSIS
DatafromtestingwiththeAPAwereanalyzedasdiscussedinthefollowingsections.
DifferencesBetweenRutDepthsofMixeswithGradationsPassingAbove,Throughand
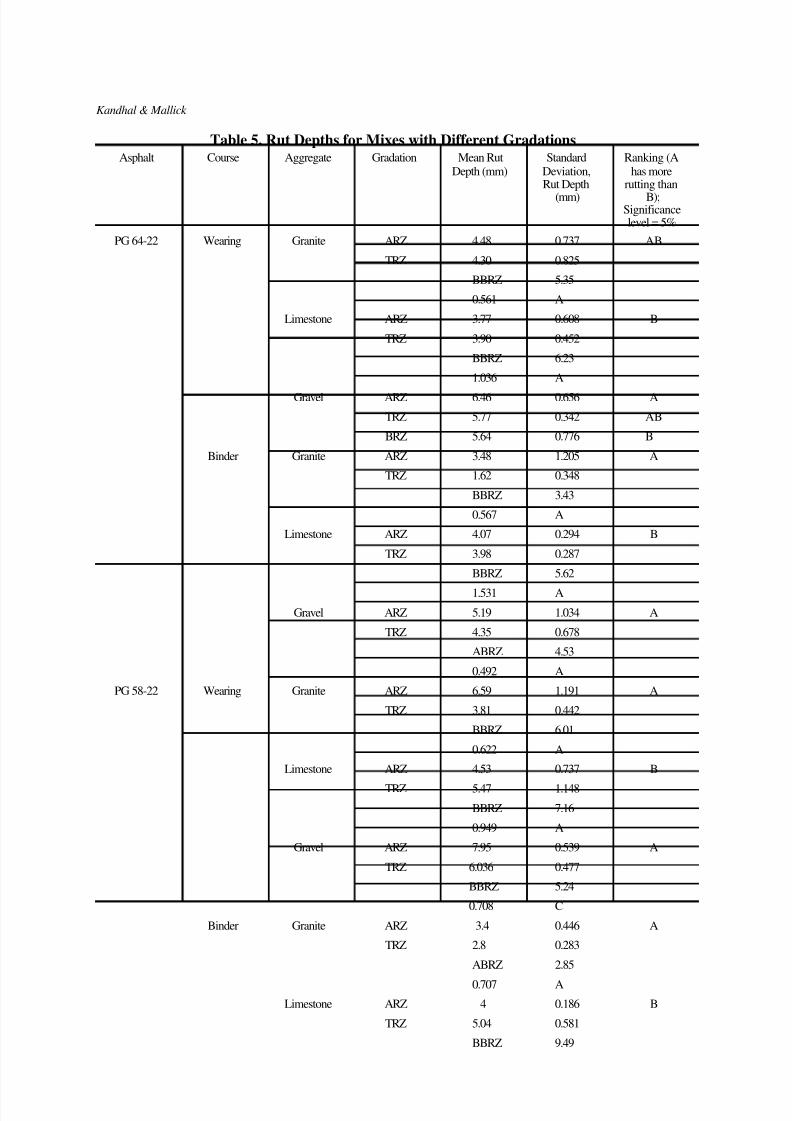
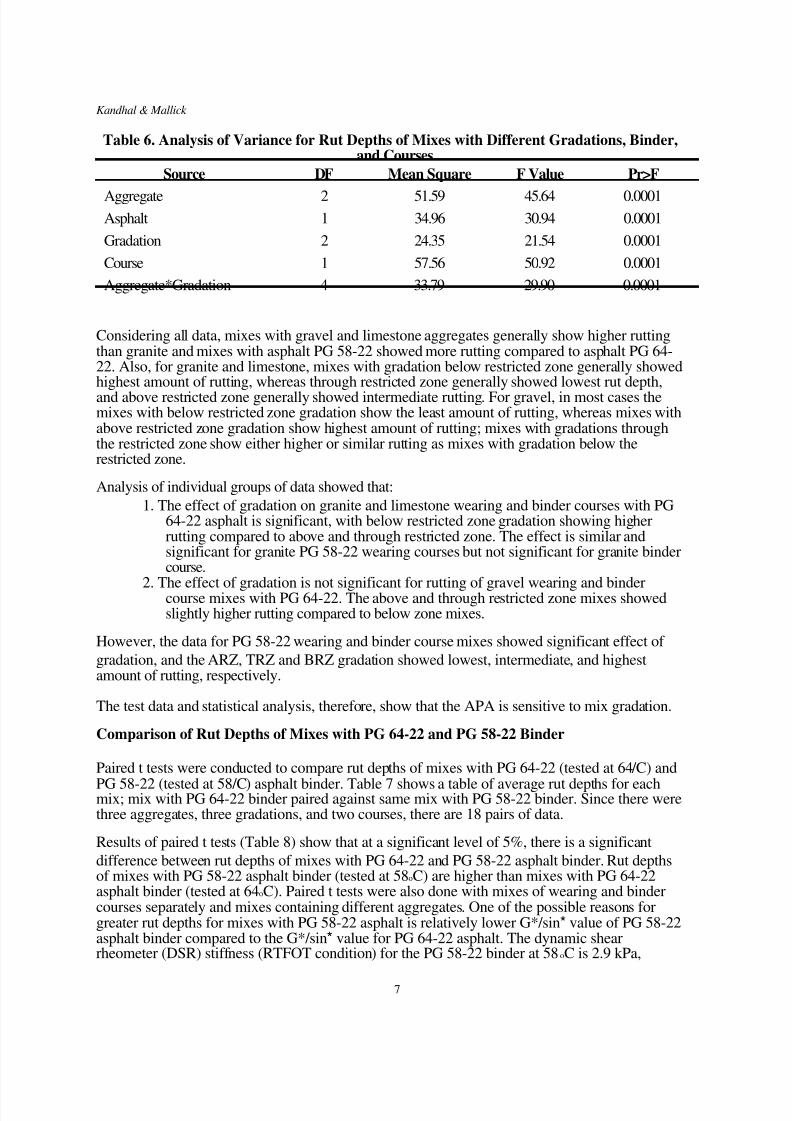
BelowRestrictedZoneStatisticalanalyseswereconductedtodetermineifdifferencebetweenrutdepthsofmixeswithgradationspassingabove(ARZ),through(TRZ),andbelow(BRZ)therestrictedzonearesignificant.Specifically,ananalysisofvariance(ANOVA)( "=0.05)andDuncan'smultiplerangetest(meanseparationtechnique)wereconductedwiththedata.Table5showsthemeanandstandarddeviationofrutdepthsfromdifferentmixes.Analysisofwholedatasetindicatessignificanteffectofaggregatetype,asphaltbindertype,gradation,coursetype,andaninteractionofaggregateandgradation(Table6).
5
8/9/2019 Potential of Asphalt Pavement Analyzer to Predict Rutting of Hot Mix Asphalt
http://slidepdf.com/reader/full/potential-of-asphalt-pavement-analyzer-to-predict-rutting-of-hot-mix-asphalt 10/27
Kandhal&Mallick
Table5.RutDepthsforMixeswithDifferentGradationsAsphalt Course Aggregate Gradation MeanRut Standard Ranking(A
Depth(mm) Deviation, hasmoreRutDepth ruttingthan(mm) B);
Significancelevel=5%
PG64-22 Wearing Granite ARZ 4.48 0.737 AB
TRZ 4.30 0.825
BBRZ 5.35
0.561 A
Limestone ARZ 3.77 0.608 B
TRZ 3.90 0.452
BBRZ 6.23
1.036 A
Gravel ARZ 6.46 0.656 ATRZ 5.77 0.342 AB
BRZ 5.64 0.776 B
Binder Granite ARZ 3.48 1.205 A
TRZ 1.62 0.348
BBRZ 3.43
0.567 A
Limestone ARZ 4.07 0.294 B
TRZ 3.98 0.287
BBRZ 5.62
1.531 AGravel ARZ 5.19 1.034 A
TRZ 4.35 0.678
ABRZ 4.53
0.492 A
PG58-22 Wearing Granite ARZ 6.59 1.191 A
TRZ 3.81 0.442
BBRZ 6.01
0.622 A
Limestone ARZ 4.53 0.737 B
TRZ 5.47 1.148
BBRZ 7.16
0.949 A
Gravel ARZ 7.95 0.539 A
TRZ 6.036 0.477
BBRZ 5.24
0.708 C
Binder Granite ARZ 3.4 0.446 A
TRZ 2.8 0.283
ABRZ 2.85
0.707 ALimestone ARZ 4 0.186 B
TRZ 5.04 0.581
BBRZ 9.49

8/9/2019 Potential of Asphalt Pavement Analyzer to Predict Rutting of Hot Mix Asphalt
http://slidepdf.com/reader/full/potential-of-asphalt-pavement-analyzer-to-predict-rutting-of-hot-mix-asphalt 11/27
2.021 A
Gravel ARZ 6.41 1.005 A
TRZ 5.23 0.621
BBRZ 4.65
0.375 B6
8/9/2019 Potential of Asphalt Pavement Analyzer to Predict Rutting of Hot Mix Asphalt
http://slidepdf.com/reader/full/potential-of-asphalt-pavement-analyzer-to-predict-rutting-of-hot-mix-asphalt 12/27
Kandhal&MallickTable6.AnalysisofVarianceforRutDepthsofMixeswithDifferentGradations,Binder,
andCourses
Source DF MeanSquare FValue Pr>F
Aggregate 2 51.59 45.64 0.0001Asphalt 1 34.96 30.94 0.0001
Gradation 2 24.35 21.54 0.0001
Course 1 57.56 50.92 0.0001
Aggregate*Gradation 4 33.79 29.90 0.0001
Consideringalldata,mixeswithgravelandlimestoneaggregatesgenerallyshowhigherruttingthangraniteandmixeswithasphaltPG58-22showedmoreruttingcomparedtoasphaltPG64-22.Also,forgraniteandlimestone,mixeswithgradationbelowrestrictedzonegenerallyshowedhighestamountofrutting,whereasthroughrestrictedzonegenerallyshowedlowestrutdepth,andaboverestrictedzonegenerallyshowedintermediaterutting.Forgravel,inmostcasesthemixeswithbelowrestrictedzonegradationshowtheleastamountofrutting,whereasmixeswithaboverestrictedzonegradationshowhighestamountofrutting;mixeswithgradationsthroughtherestrictedzoneshoweitherhigherorsimilarruttingasmixeswithgradationbelowtherestrictedzone.
Analysisofindividualgroupsofdatashowedthat:
1.TheeffectofgradationongraniteandlimestonewearingandbindercourseswithPG64-22asphaltissignificant,withbelowrestrictedzonegradationshowinghigherruttingcomparedtoaboveandthroughrestrictedzone.TheeffectissimilarandsignificantforgranitePG58-22wearingcoursesbutnotsignificantforgranitebindercourse.
2.TheeffectofgradationisnotsignificantforruttingofgravelwearingandbindercoursemixeswithPG64-22.Theaboveandthroughrestrictedzonemixesshowedslightlyhigherruttingcomparedtobelowzonemixes.
However,thedataforPG58-22wearingandbindercoursemixesshowedsignificanteffectof
gradation,andtheARZ,TRZandBRZgradationshowedlowest,intermediate,andhighestamountofrutting,respectively.Thetestdataandstatisticalanalysis,therefore,showthattheAPAissensitivetomixgradation.
ComparisonofRutDepthsofMixeswithPG64-22andPG58-22Binder
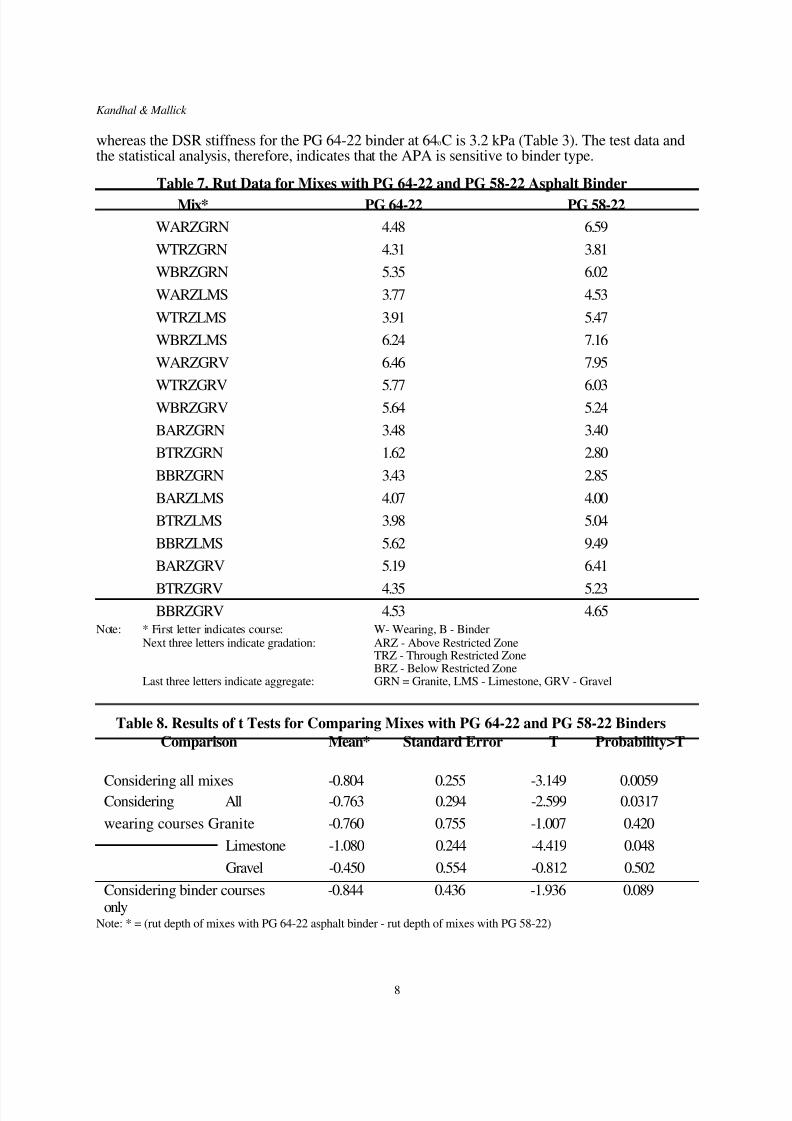
PairedttestswereconductedtocomparerutdepthsofmixeswithPG64-22(testedat64/C)and
PG58-22(testedat58/C)asphaltbinder.Table7showsatableofaveragerutdepthsforeachmix;mixwithPG64-22binderpairedagainstsamemixwithPG58-22binder.Sincetherewerethreeaggregates,threegradations,andtwocourses,thereare18pairsofdata.
Resultsofpairedttests(Table8)showthatatasignificantlevelof5%,thereisasignificant
differencebetweenrutdepthsofmixeswithPG64-22andPG58-22asphaltbinder.RutdepthsofmixeswithPG58-22asphaltbinder(testedat58oC)arehigherthanmixeswithPG64-22asphaltbinder(testedat64oC).Pairedttestswerealsodonewithmixesofwearingandbindercoursesseparatelyandmixescontainingdifferentaggregates.OneofthepossiblereasonsforgreaterrutdepthsformixeswithPG58-22asphaltisrelativelylowerG*/sin*valueofPG58-22asphaltbindercomparedtotheG*/sin*valueforPG64-22asphalt.Thedynamicshearrheometer(DSR)stiffness(RTFOTcondition)forthePG58-22binderat58oCis2.9kPa,
7
8/9/2019 Potential of Asphalt Pavement Analyzer to Predict Rutting of Hot Mix Asphalt
http://slidepdf.com/reader/full/potential-of-asphalt-pavement-analyzer-to-predict-rutting-of-hot-mix-asphalt 13/27
Kandhal&MallickwhereastheDSRstiffnessforthePG64-22binderat64oCis3.2kPa(Table3).Thetestdataandthestatisticalanalysis,therefore,indicatesthattheAPAissensitivetobindertype.
Table7.RutDataforMixeswithPG64-22andPG58-22AsphaltBinder
Mix*
WARZGRN
WTRZGRN
WBRZGRN
WARZLMS
WTRZLMS
WBRZLMS
WARZGRV
WTRZGRVWBRZGRV
BARZGRN
BTRZGRN
BBRZGRN
BARZLMS
BTRZLMS
BBRZLMS
BARZGRV
BTRZGRVBBRZGRV
PG64-22
4.48
4.31
5.35
3.77
3.91
6.24
6.46
5.775.64
3.48
1.62
3.43
4.07
3.98
5.62
5.19
4.354.53
PG58-22
6.59
3.81
6.02
4.53
5.47
7.16
7.95
6.035.24
3.40
2.80
2.85
4.00
5.04
9.49
6.41
5.234.65
Note: *Firstletterindicatescourse:Nextthreelettersindicategradation:
Lastthreelettersindicateaggregate:
W-Wearing,B-BinderARZ-AboveRestrictedZoneTRZ-ThroughRestrictedZoneBRZ-BelowRestrictedZoneGRN=Granite,LMS-Limestone,GRV-Gravel
Table8.ResultsoftTestsforComparingMixeswithPG64-22andPG58-22Binders
Comparison Mean* StandardError T Probability>T
Consideringallmixes -0.804 0.255 -3.149 0.0059Considering All -0.763 0.294 -2.599 0.0317
wearingcoursesGranite -0.760 0.755 -1.007 0.420
Limestone -1.080 0.244 -4.419 0.048
Gravel -0.450 0.554 -0.812 0.502
Consideringbindercourses -0.844 0.436 -1.936 0.089onlyNote:*=(rutdepthofmixeswithPG64-22asphaltbinder-rutdepthofmixeswithPG58-22)
8
8/9/2019 Potential of Asphalt Pavement Analyzer to Predict Rutting of Hot Mix Asphalt
http://slidepdf.com/reader/full/potential-of-asphalt-pavement-analyzer-to-predict-rutting-of-hot-mix-asphalt 14/27
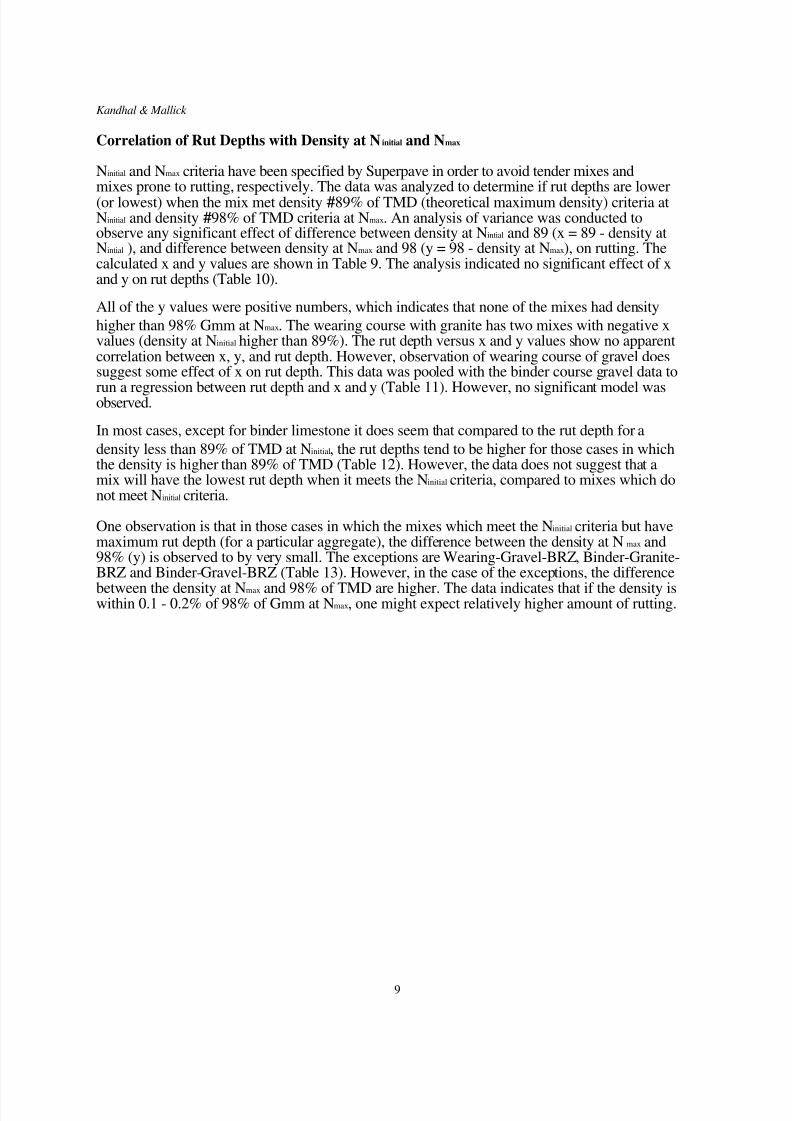
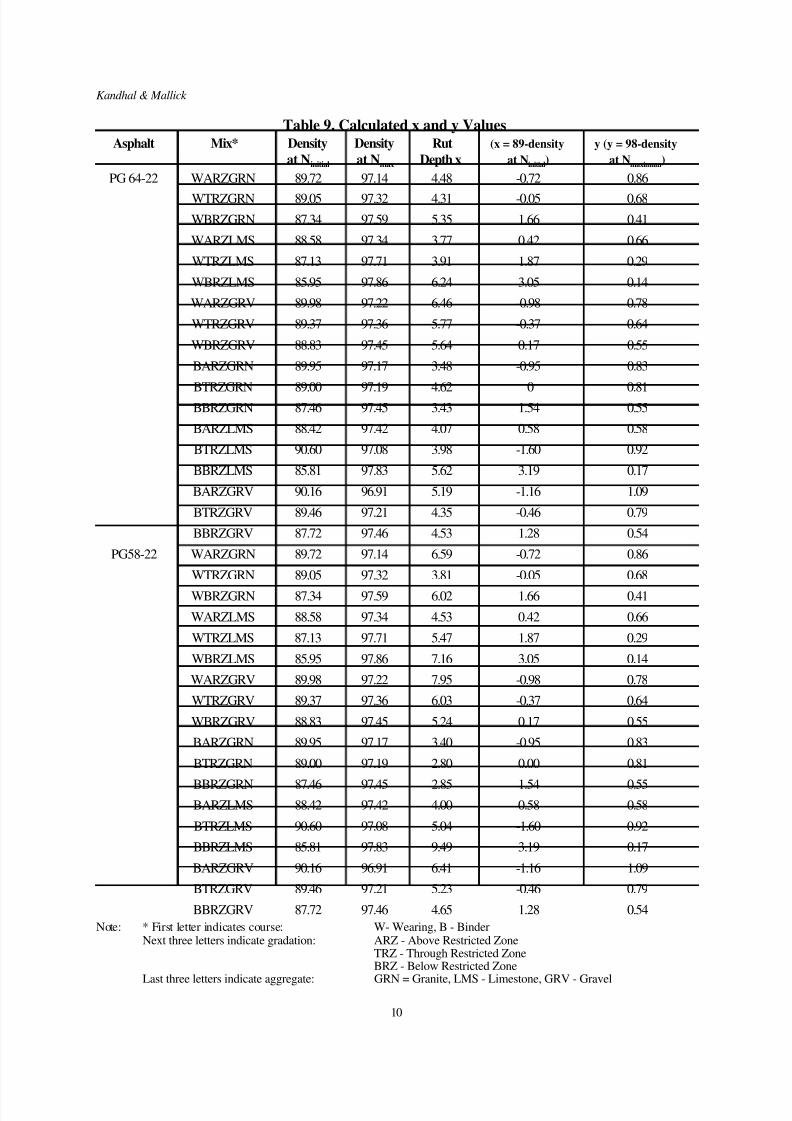
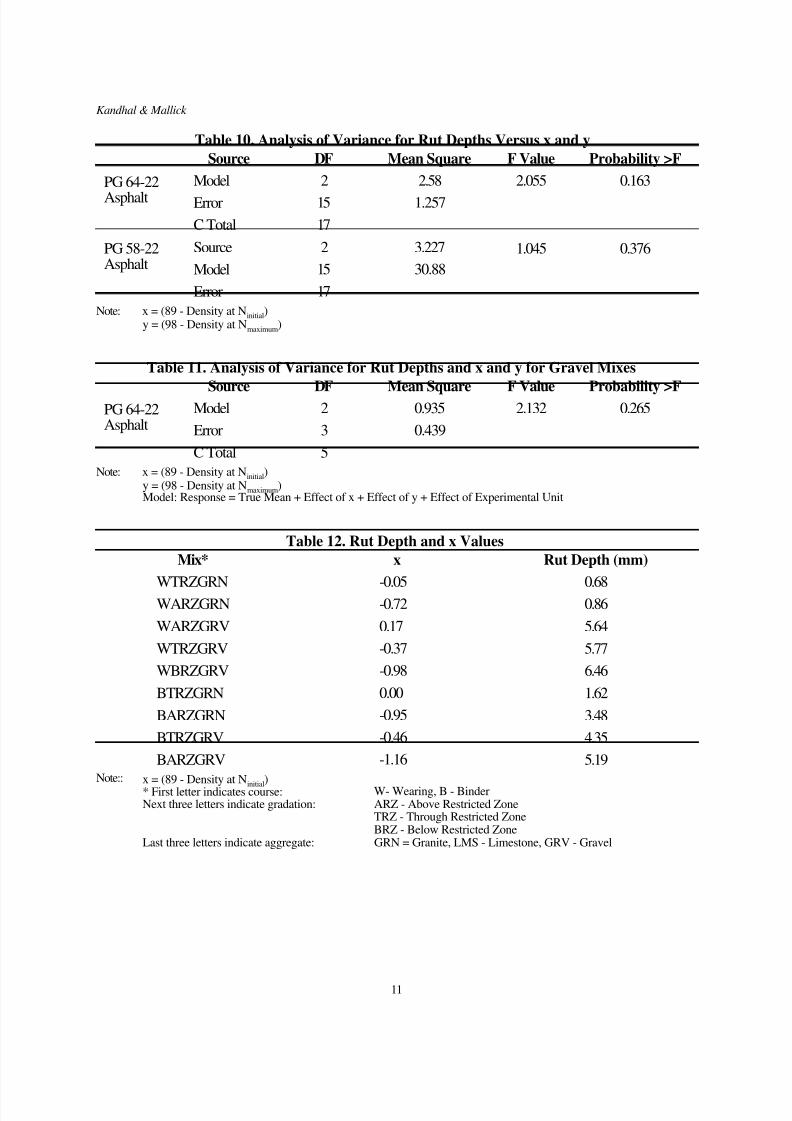
Kandhal&MallickCorrelationofRutDepthswithDensityatN initialandNmaxNinitialandNmaxcriteriahavebeenspecifiedbySuperpaveinordertoavoidtendermixesandmixespronetorutting,respectively.Thedatawasanalyzedtodetermineifrutdepthsarelower(orlowest)whenthemixmetdensity#89%ofTMD(theoreticalmaximumdensity)criteriaatNinitialanddensity#98%ofTMDcriteriaatNmax.AnanalysisofvariancewasconductedtoobserveanysignificanteffectofdifferencebetweendensityatNintialand89(x=89-densityatNintial),anddifferencebetweendensityatNmaxand98(y=98-densityatNmax),onrutting.ThecalculatedxandyvaluesareshowninTable9.Theanalysisindicatednosignificanteffectofxandyonrutdepths(Table10).
Alloftheyvalueswerepositivenumbers,whichindicatesthatnoneofthemixeshaddensity
higherthan98%GmmatNmax.Thewearingcoursewithgranitehastwomixeswithnegativexvalues(densityatNinitialhigherthan89%).Therutdepthversusxandyvaluesshownoapparentcorrelationbetweenx,y,andrutdepth.However,observationofwearingcourseofgraveldoessuggestsomeeffectofxonrutdepth.Thisdatawaspooledwiththebindercoursegraveldatato
runaregressionbetweenrutdepthandxandy(Table11).However,nosignificantmodelwasobserved.
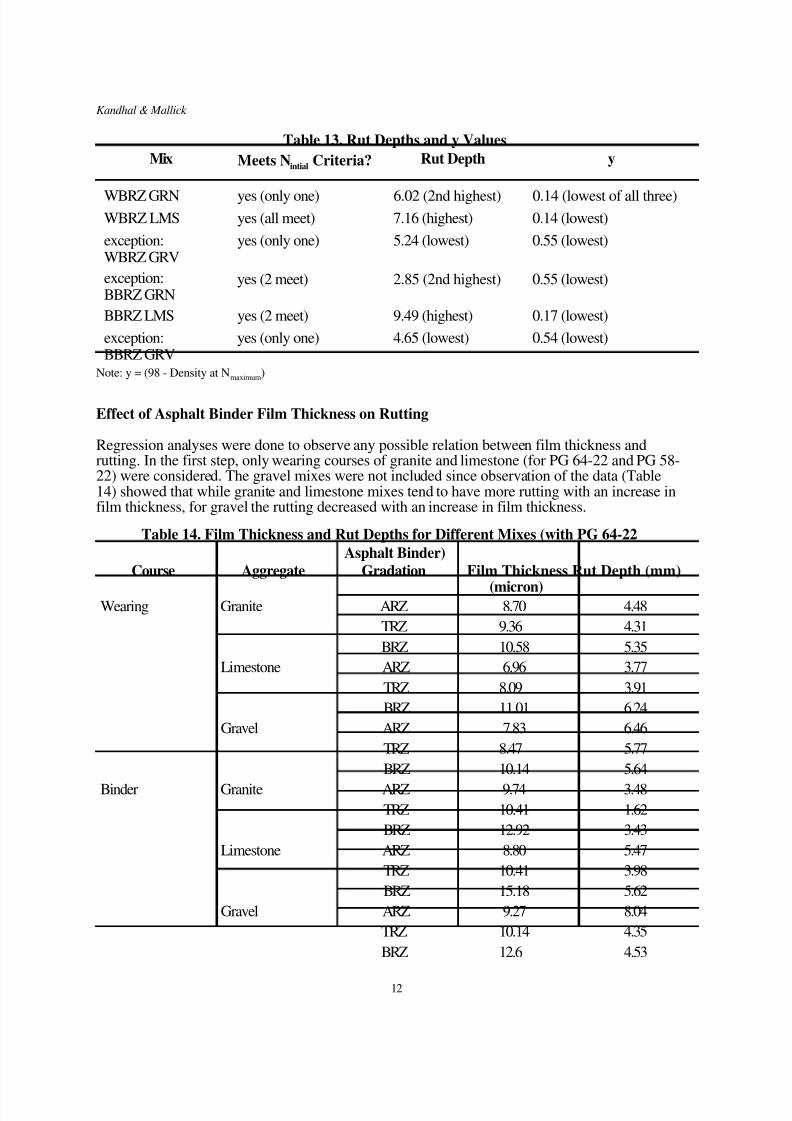
Inmostcases,exceptforbinderlimestoneitdoesseemthatcomparedtotherutdepthfora
densitylessthan89%ofTMDatNinitial,therutdepthstendtobehigherforthosecasesinwhichthedensityishigherthan89%ofTMD(Table12).However,thedatadoesnotsuggestthatamixwillhavethelowestrutdepthwhenitmeetstheNinitialcriteria,comparedtomixeswhichdonotmeetNinitialcriteria.OneobservationisthatinthosecasesinwhichthemixeswhichmeettheNinitialcriteriabuthavemaximumrutdepth(foraparticularaggregate),thedifferencebetweenthedensityatNmaxand98%(y)isobservedtobyverysmall.TheexceptionsareWearing-Gravel-BRZ,Binder-Granite-BRZandBinder-Gravel-BRZ(Table13).However,inthecaseoftheexceptions,thedifference
betweenthedensityatNmaxand98%ofTMDarehigher.Thedataindicatesthatifthedensityiswithin0.1-0.2%of98%ofGmmatNmax,onemightexpectrelativelyhigheramountofrutting.
9
8/9/2019 Potential of Asphalt Pavement Analyzer to Predict Rutting of Hot Mix Asphalt
http://slidepdf.com/reader/full/potential-of-asphalt-pavement-analyzer-to-predict-rutting-of-hot-mix-asphalt 15/27
Kandhal&Mallick
Table9.CalculatedxandyValues
Asphalt Mix* Density Density Rut (x=89-density y(y=98-densityatNinitial atNmax Depthx atNinitial) atNmaximum)
PG64-22 WARZGRN 89.72 97.14 4.48 -0.72 0.86
WTRZGRN 89.05 97.32 4.31 -0.05 0.68WBRZGRN 87.34 97.59 5.35 1.66 0.41
WARZLMS 88.58 97.34 3.77 0.42 0.66
WTRZLMS 87.13 97.71 3.91 1.87 0.29
WBRZLMS 85.95 97.86 6.24 3.05 0.14
WARZGRV 89.98 97.22 6.46 -0.98 0.78
WTRZGRV 89.37 97.36 5.77 -0.37 0.64
WBRZGRV 88.83 97.45 5.64 0.17 0.55
BARZGRN 89.95 97.17 3.48 -0.95 0.83
BTRZGRN 89.00 97.19 4.62 0 0.81BBRZGRN 87.46 97.45 3.43 1.54 0.55
BARZLMS 88.42 97.42 4.07 0.58 0.58
BTRZLMS 90.60 97.08 3.98 -1.60 0.92
BBRZLMS 85.81 97.83 5.62 3.19 0.17
BARZGRV 90.16 96.91 5.19 -1.16 1.09
BTRZGRV 89.46 97.21 4.35 -0.46 0.79
BBRZGRV 87.72 97.46 4.53 1.28 0.54
PG58-22 WARZGRN 89.72 97.14 6.59 -0.72 0.86
WTRZGRN 89.05 97.32 3.81 -0.05 0.68
WBRZGRN 87.34 97.59 6.02 1.66 0.41
WARZLMS 88.58 97.34 4.53 0.42 0.66
WTRZLMS 87.13 97.71 5.47 1.87 0.29
WBRZLMS 85.95 97.86 7.16 3.05 0.14
WARZGRV 89.98 97.22 7.95 -0.98 0.78
WTRZGRV 89.37 97.36 6.03 -0.37 0.64
WBRZGRV 88.83 97.45 5.24 0.17 0.55
BARZGRN 89.95 97.17 3.40 -0.95 0.83
BTRZGRN 89.00 97.19 2.80 0.00 0.81
BBRZGRN 87.46 97.45 2.85 1.54 0.55BARZLMS 88.42 97.42 4.00 0.58 0.58
BTRZLMS 90.60 97.08 5.04 -1.60 0.92
BBRZLMS 85.81 97.83 9.49 3.19 0.17
BARZGRV 90.16 96.91 6.41 -1.16 1.09
BTRZGRV 89.46 97.21 5.23 -0.46 0.79
BBRZGRV 87.72 97.46 4.65 1.28 0.54
Note: *Firstletterindicatescourse:Nextthreelettersindicategradation:
Lastthreelettersindicateaggregate:
W-Wearing,B-BinderARZ-AboveRestrictedZoneTRZ-ThroughRestrictedZoneBRZ-BelowRestrictedZone
GRN=Granite,LMS-Limestone,GRV-Gravel
10
8/9/2019 Potential of Asphalt Pavement Analyzer to Predict Rutting of Hot Mix Asphalt
http://slidepdf.com/reader/full/potential-of-asphalt-pavement-analyzer-to-predict-rutting-of-hot-mix-asphalt 16/27
Kandhal&Mallick
Table10.AnalysisofVarianceforRutDepthsVersusxandy
PG64-22
AsphaltPG58-22Asphalt
Source
Model
Error
CTotal
Source
Model
Error
DF
2
15
17
2
15
17
MeanSquare
2.58
1.257
3.227
30.88
FValue
2.055
1.045
Probability>F
0.163
0.376
Note: x=(89-DensityatNinitial)y=(98-DensityatNmaximum)Table11.AnalysisofVarianceforRutDepthsandxandyforGravelMixes
PG64-22Asphalt
SourceModel
Error
CTotal
DF2
3
5
MeanSquare0.935
0.439
FValue2.132
Probability>F0.265
Note: x=(89-DensityatNinitial)y=(98-DensityatNmaximum)Model:Response=TrueMean+Effectofx+Effectofy+EffectofExperimentalUnit
Table12.RutDepthandxValues
Mix*
WTRZGRNWARZGRN
WARZGRV
WTRZGRV
WBRZGRV
BTRZGRN
BARZGRN
BTRZGRV
BARZGRV
x
-0.05-0.72
0.17
-0.37
-0.98
0.00
-0.95
-0.46
-1.16
RutDepth(mm)
0.680.86
5.64
5.77
6.46
1.62
3.48
4.35
5.19Note::
x=(89-DensityatNinitial)*Firstletterindicatescourse:Nextthreelettersindicategradation:
Lastthreelettersindicateaggregate:
W-Wearing,B-BinderARZ-AboveRestrictedZoneTRZ-ThroughRestrictedZoneBRZ-BelowRestrictedZoneGRN=Granite,LMS-Limestone,GRV-Gravel
11
8/9/2019 Potential of Asphalt Pavement Analyzer to Predict Rutting of Hot Mix Asphalt
http://slidepdf.com/reader/full/potential-of-asphalt-pavement-analyzer-to-predict-rutting-of-hot-mix-asphalt 17/27
Kandhal&Mallick
Table13.RutDepthsandyValues
Mix
WBRZGRNWBRZLMS
exception:WBRZGRV
exception:BBRZGRN
BBRZLMS
exception:BBRZGRV
MeetsNintialCriteria?
yes(onlyone)yes(allmeet)
yes(onlyone)
yes(2meet)
yes(2meet)
yes(onlyone)
RutDepth
6.02(2ndhighest)7.16(highest)
5.24(lowest)
2.85(2ndhighest)
9.49(highest)
4.65(lowest)
y
0.14(lowestofallthree)0.14(lowest)
0.55(lowest)
0.55(lowest)
0.17(lowest)
0.54(lowest)
Note:y=(98-DensityatNmaximum)
EffectofAsphaltBinderFilmThicknessonRuttingRegressionanalysesweredonetoobserveanypossiblerelationbetweenfilmthicknessandrutting.Inthefirststep,onlywearingcoursesofgraniteandlimestone(forPG64-22andPG58-22)wereconsidered.Thegravelmixeswerenotincludedsinceobservationofthedata(Table14)showedthatwhilegraniteandlimestonemixestendtohavemoreruttingwithanincreaseinfilmthickness,forgraveltheruttingdecreasedwithanincreaseinfilmthickness.
Table14.FilmThicknessandRutDepthsforDifferentMixes(withPG64-22
AsphaltBinder)
Course Aggregate Gradation FilmThicknessRutDepth(mm)
(micron)Wearing Granite ARZ 8.70 4.48
TRZ 9.36 4.31
BRZ 10.58 5.35
Limestone ARZ 6.96 3.77
TRZ 8.09 3.91
BRZ 11.01 6.24
Gravel ARZ 7.83 6.46
TRZ 8.47 5.77
BRZ 10.14 5.64
Binder Granite ARZ 9.74 3.48
TRZ 10.41 1.62
BRZ 12.92 3.43
Limestone ARZ 8.80 5.47
TRZ 10.41 3.98
BRZ 15.18 5.62
Gravel ARZ 9.27 8.04
TRZ 10.14 4.35
BRZ 12.6 4.53
12
8/9/2019 Potential of Asphalt Pavement Analyzer to Predict Rutting of Hot Mix Asphalt
http://slidepdf.com/reader/full/potential-of-asphalt-pavement-analyzer-to-predict-rutting-of-hot-mix-asphalt 18/27
Kandhal&Mallick
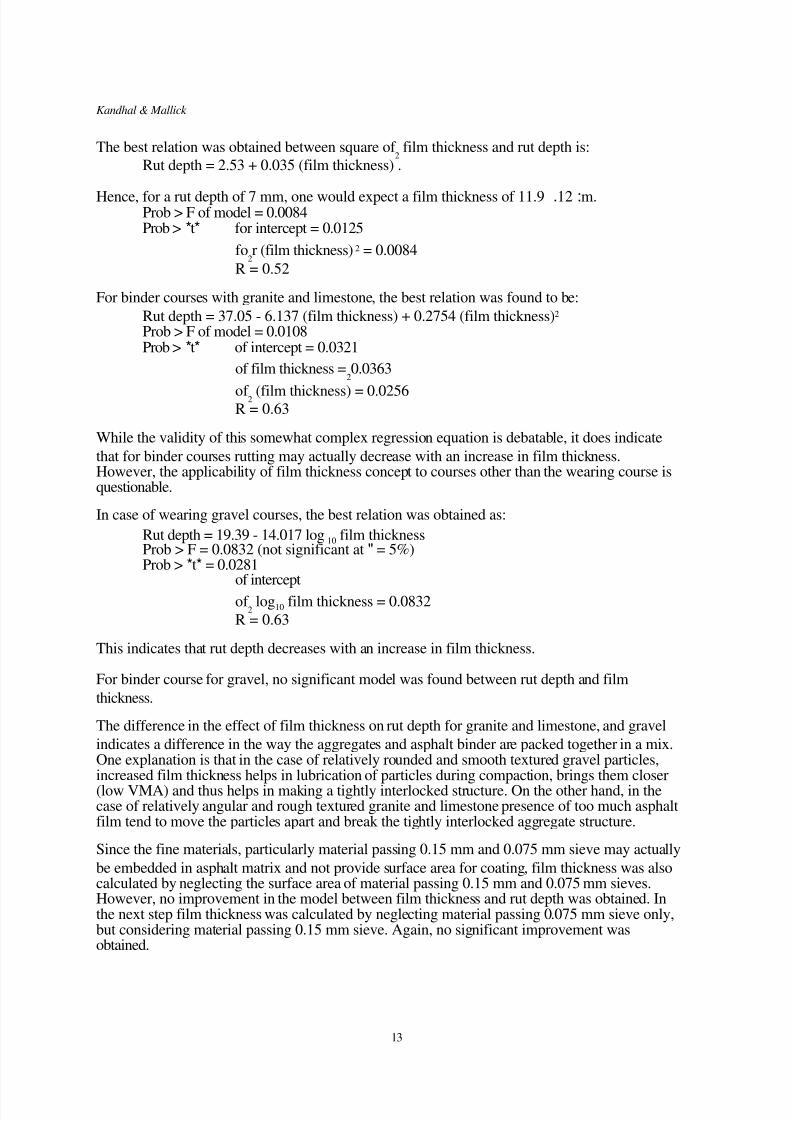
Thebestrelationwasobtainedbetweensquareof 2filmthicknessandrutdepthis:
Rutdepth=2.53+0.035(filmthickness).
Hence,forarutdepthof7mm,onewouldexpectafilmthicknessof11.9 .12:m.Prob>Fofmodel=0.0084Prob>*t* forintercept=0.0125
fo2r(filmthickness)2=0.0084
R=0.52
Forbindercourseswithgraniteandlimestone,thebestrelationwasfoundtobe:
Rutdepth=37.05-6.137(filmthickness)+0.2754(filmthickness)2Prob>Fofmodel=0.0108Prob>*t* ofintercept=0.0321
offilmthickness=20.0363
of 2(filmthickness)=0.0256R=0.63
Whilethevalidityofthissomewhatcomplexregressionequationisdebatable,itdoesindicate
thatforbindercoursesruttingmayactuallydecreasewithanincreaseinfilmthickness.However,theapplicabilityoffilmthicknessconcepttocoursesotherthanthewearingcourseisquestionable.
Incaseofwearinggravelcourses,thebestrelationwasobtainedas:
Rutdepth=19.39-14.017log 10filmthicknessProb>F=0.0832(notsignificantat"=5%)Prob>*t*=0.0281
ofintercept
of 2log10filmthickness=0.0832
R=0.63
Thisindicatesthatrutdepthdecreaseswithanincreaseinfilmthickness.
Forbindercourseforgravel,nosignificantmodelwasfoundbetweenrutdepthandfilm
thickness.
Thedifferenceintheeffectoffilmthicknessonrutdepthforgraniteandlimestone,andgravel
indicatesadifferenceinthewaytheaggregatesandasphaltbinderarepackedtogetherinamix.Oneexplanationisthatinthecaseofrelativelyroundedandsmoothtexturedgravelparticles,increasedfilmthicknesshelpsinlubricationofparticlesduringcompaction,bringsthemcloser(lowVMA)andthushelpsinmakingatightlyinterlockedstructure.Ontheotherhand,inthecaseofrelativelyangularandroughtexturedgraniteandlimestonepresenceoftoomuchasphaltfilmtendtomovetheparticlesapartandbreakthetightlyinterlockedaggregatestructure.
Sincethefinematerials,particularlymaterialpassing0.15mmand0.075mmsievemayactually
beembeddedinasphaltmatrixandnotprovidesurfaceareaforcoating,filmthicknesswasalsocalculatedbyneglectingthesurfaceareaofmaterialpassing0.15mmand0.075mmsieves.However,noimprovementinthemodelbetweenfilmthicknessandrutdepthwasobtained.Inthenextstepfilmthicknesswascalculatedbyneglectingmaterialpassing0.075mmsieveonly,butconsideringmaterialpassing0.15mmsieve.Again,nosignificantimprovementwasobtained.
13
8/9/2019 Potential of Asphalt Pavement Analyzer to Predict Rutting of Hot Mix Asphalt
http://slidepdf.com/reader/full/potential-of-asphalt-pavement-analyzer-to-predict-rutting-of-hot-mix-asphalt 19/27
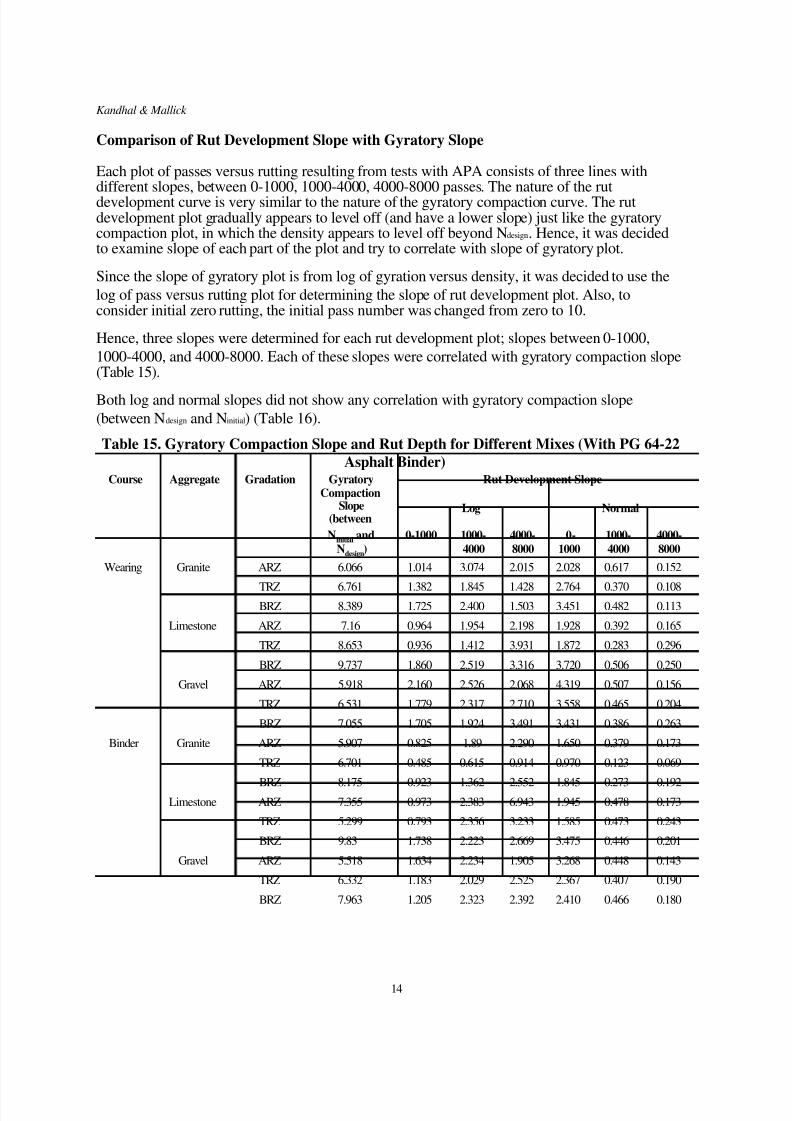
Kandhal&MallickComparisonofRutDevelopmentSlopewithGyratorySlopeEachplotofpassesversusruttingresultingfromtestswithAPAconsistsofthreelineswithdifferentslopes,between0-1000,1000-4000,4000-8000passes.Thenatureoftherutdevelopmentcurveisverysimilartothenatureofthegyratorycompactioncurve.Therutdevelopmentplotgraduallyappearstoleveloff(andhavealowerslope)justlikethegyratorycompactionplot,inwhichthedensityappearstoleveloffbeyondNdesign.Hence,itwasdecidedtoexamineslopeofeachpartoftheplotandtrytocorrelatewithslopeofgyratoryplot.
Sincetheslopeofgyratoryplotisfromlogofgyrationversusdensity,itwasdecidedtousethe
logofpassversusruttingplotfordeterminingtheslopeofrutdevelopmentplot.Also,toconsiderinitialzerorutting,theinitialpassnumberwaschangedfromzeroto10.
Hence,threeslopesweredeterminedforeachrutdevelopmentplot;slopesbetween0-1000,
1000-4000,and4000-8000.Eachoftheseslopeswerecorrelatedwithgyratorycompactionslope(Table15).
Bothlogandnormalslopesdidnotshowanycorrelationwithgyratorycompactionslope
(betweenNdesignandNinitial)(Table16).
Table15.GyratoryCompactionSlopeandRutDepthforDifferentMixes(WithPG64-22
AsphaltBinder)Course Aggregate Gradation Gyratory
CompactionSlope
(between
Log
RutDevelopmentSlope
Normal
Ninitialand 0-1000 1000- 4000- 0- 1000- 4000-Ndesign) 4000 8000 1000 4000 8000
Wearing Granite ARZ 6.066 1.014 3.074 2.015 2.028 0.617 0.152
TRZ 6.761 1.382 1.845 1.428 2.764 0.370 0.108BRZ 8.389 1.725 2.400 1.503 3.451 0.482 0.113
Limestone ARZ 7.16 0.964 1.954 2.198 1.928 0.392 0.165
TRZ 8.653 0.936 1.412 3.931 1.872 0.283 0.296
BRZ 9.737 1.860 2.519 3.316 3.720 0.506 0.250
Gravel ARZ 5.918 2.160 2.526 2.068 4.319 0.507 0.156
TRZ 6.531 1.779 2.317 2.710 3.558 0.465 0.204
BRZ 7.055 1.705 1.924 3.491 3.431 0.386 0.263
Binder Granite ARZ 5.907 0.825 1.89 2.290 1.650 0.379 0.173
TRZ 6.701 0.485 0.615 0.914 0.970 0.123 0.069
BRZ 8.175 0.923 1.362 2.552 1.845 0.273 0.192Limestone ARZ 7.355 0.973 2.383 6.943 1.945 0.478 0.173
TRZ 5.299 0.793 2.356 3.233 1.585 0.473 0.243
BRZ 9.83 1.738 2.223 2.669 3.475 0.446 0.201
Gravel ARZ 5.518 1.634 2.234 1.905 3.268 0.448 0.143
TRZ 6.332 1.183 2.029 2.525 2.367 0.407 0.190
BRZ 7.963 1.205 2.323 2.392 2.410 0.466 0.180
14
8/9/2019 Potential of Asphalt Pavement Analyzer to Predict Rutting of Hot Mix Asphalt
http://slidepdf.com/reader/full/potential-of-asphalt-pavement-analyzer-to-predict-rutting-of-hot-mix-asphalt 20/27
Kandhal&MallickTable16.RegressionEquationsforRutDevelopmentSlopeVersusGyratoryCompaction
SlopeforDifferentMixes(WithPG64-22AsphaltBinder)
RutDevelopmentSlope Course Modela R2
Log 0-1000 Wearing y=-0.0063x+1.55 0.00031000-4000 y=-0.1057x+2.99 0.08
4000-8000 y=0.3185x+0.1725 0.21
Normal 0-1000 y=-0.0125x+3.1001 0.0003
1000-4000 y=-0.0212x+0.6016 0.08
4000-8000 y=0.024x+0.013 0.21
Log 0-1000 Binder y=0.105x+0.3481 0.15
1000-4000 y=-0.0061x+1.9775 0.0002
4000-8000 y=-0.6841x+8.6716 0.09
Normal 0-1000 y=0.21x+0.6962 0.15
1000-4000 y=-0.0012x+0.3969 0.0002
4000-8000 y=0.003x+0.1524 0.009a"x"isslopeofgyratorycompactioncurve
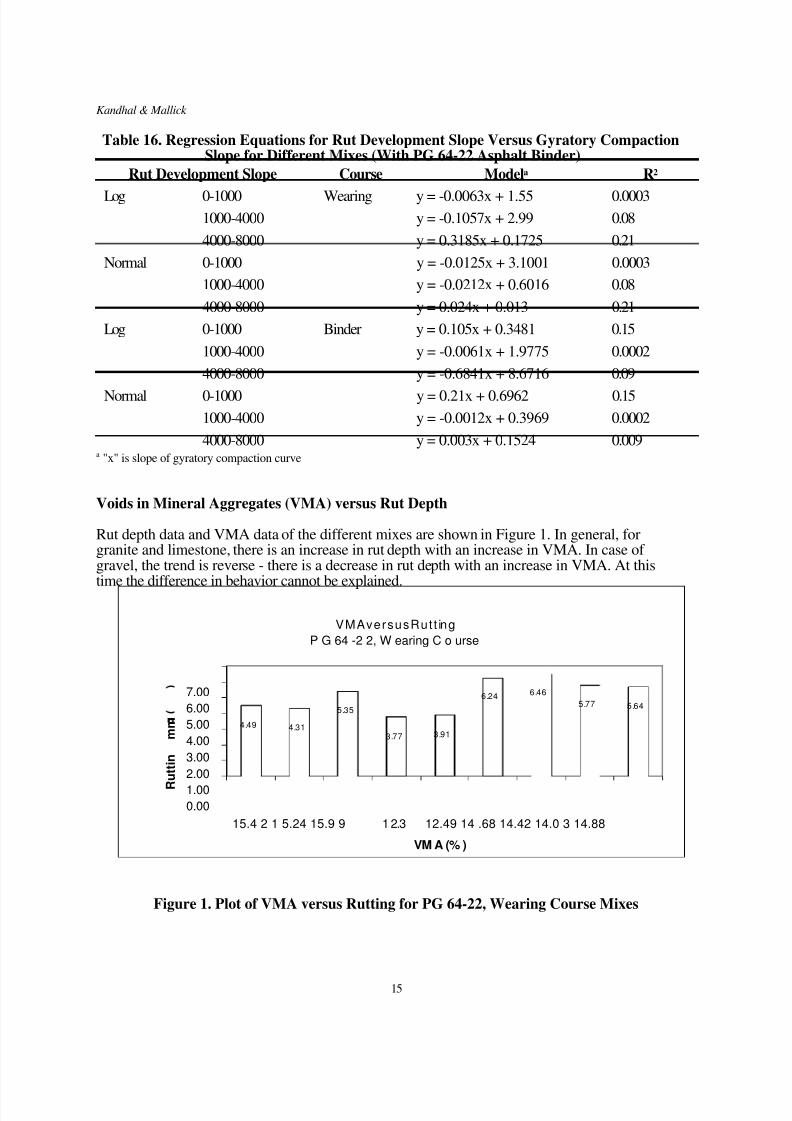
VoidsinMineralAggregates(VMA)versusRutDepthRutdepthdataandVMAdataofthedifferentmixesareshowninFigure1.Ingeneral,forgraniteandlimestone,thereisanincreaseinrutdepthwithanincreaseinVMA.Incaseofgravel,thetrendisreverse-thereisadecreaseinrutdepthwithanincreaseinVMA.Atthistimethedifferenceinbehaviorcannotbeexplained.
VMAversusRutting
PG64-22,WearingCourse
7.00
6.005.004.00
3.00
2.001.000.00
4.49
4.31
5.35
3.77
3.91
6.24
6.46
5.77
5.64
15.4215.2415.99 12.3 12.4914.6814.4214.0314.88
VMA(%)
Figure1.PlotofVMAversusRuttingforPG64-22,WearingCourseMixes
15
R
u t t i n
m m
8/9/2019 Potential of Asphalt Pavement Analyzer to Predict Rutting of Hot Mix Asphalt
http://slidepdf.com/reader/full/potential-of-asphalt-pavement-analyzer-to-predict-rutting-of-hot-mix-asphalt 21/27
Kandhal&MallickComparisonofresultsfromtestswithSuperpaveShearTester(SST)andAPA Table17showstheresultsoftestswithRSCH.TheaveragepeakstrainvaluesshowthataccordingtotheSSTtest,forwearingcourse,theTRZmixesshowthelowestruttingpotential.
Table17.RSCHPeakShearStrainforDifferentMixes
Course AggregateGradation Strain AverageStrain
Sample1 Sample2
Wearing Granite ARZ 0.02676 0.01795 0.022355
TRZ 0.01892 0.0251 0.02201
BRZ 0.02294 0.02614 0.02454
Limestone ARZ 0.03824 0.03437 0.036305
TRZ 0.00954 0.0291 0.01932
BRZ 0.0511 -- 0.0511
Gravel ARZ 0.07194 -- 0.07194
TRZ 0.04932 0.05166 0.05049
BRZ 0.05049 0.08057 0.06553
Binder Granite ARZ 0.0064 0.02084 0.01362
TRZ 0.01269 0.02632 0.019505
BRZ 0.0144 0.02322 0.01881
Limestone ARZ 0.0405 0.02379 0.032145
TRZ 0.03399 0.0445 0.039245
BRZ 0.04854 0.07685 0.062695
Gravel ARZ 0.07154 0.06071 0.066125
TRZ 0.03779 -- 0.03779
BRZ 0.03634 0.07214 0.05424
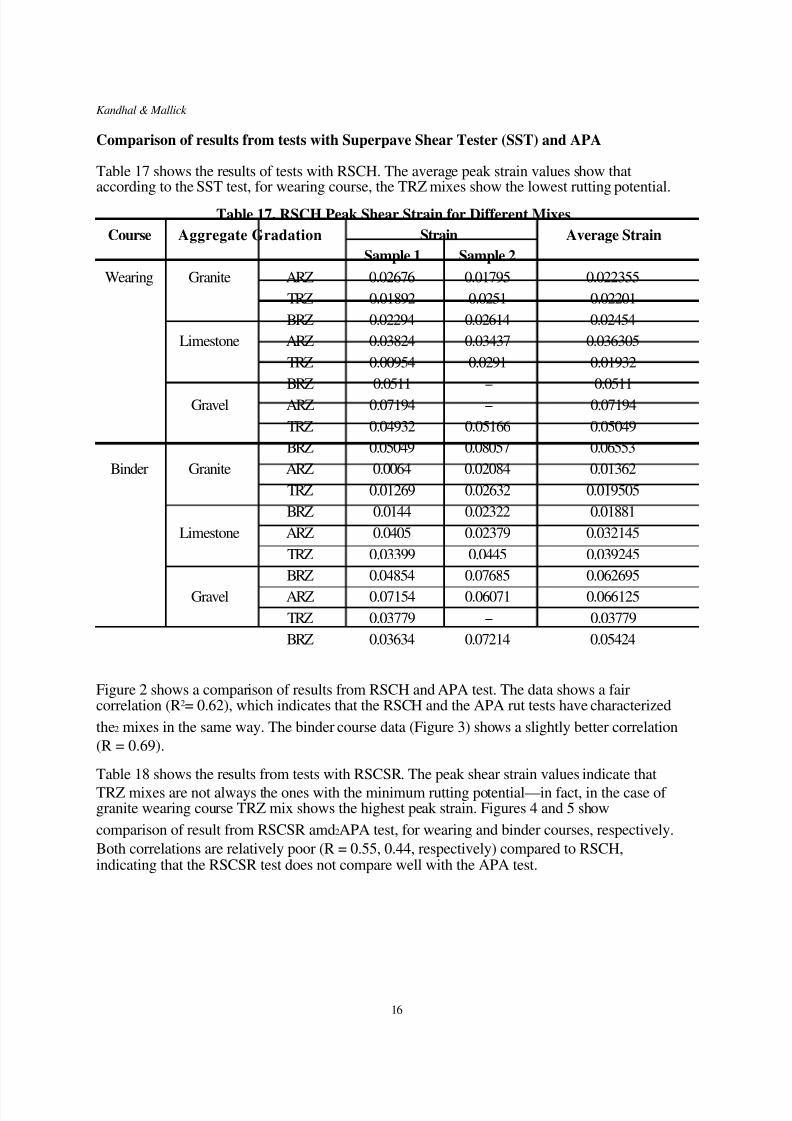
Figure2showsacomparisonofresultsfromRSCHandAPAtest.Thedatashowsafaircorrelation(R2=0.62),whichindicatesthattheRSCHandtheAPAruttestshavecharacterized
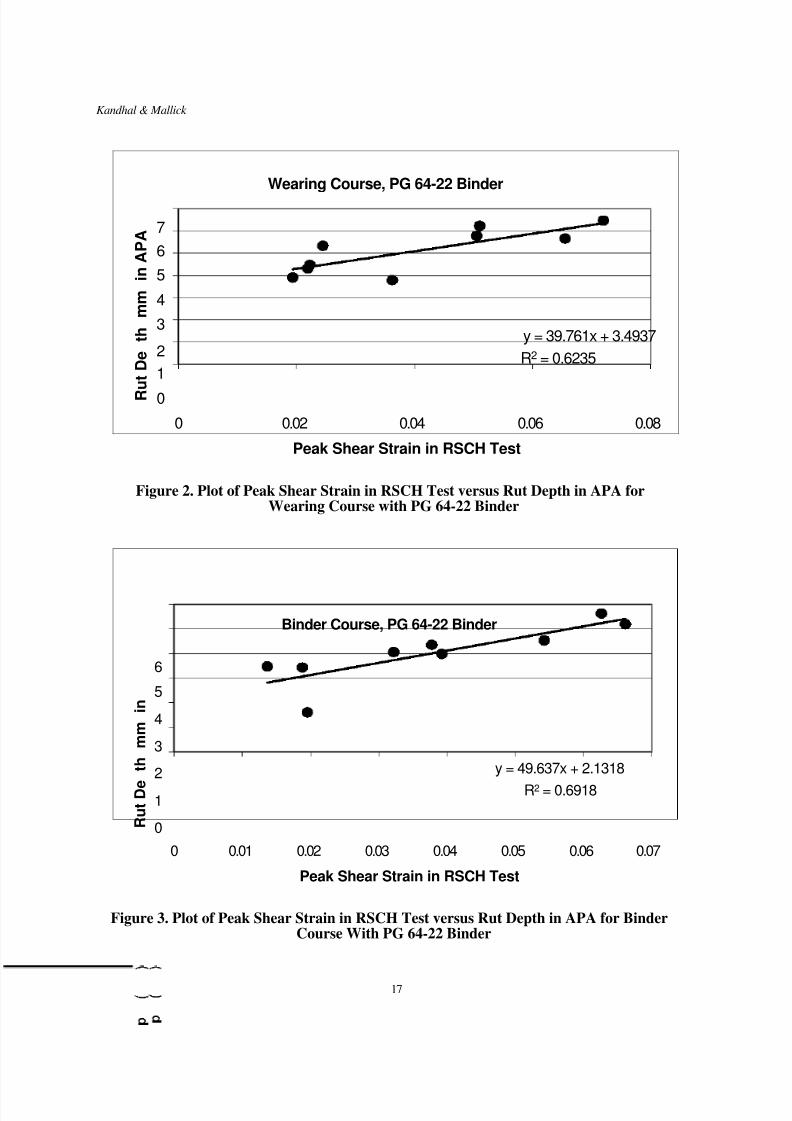
the2mixesinthesameway.Thebindercoursedata(Figure3)showsaslightlybettercorrelation
(R=0.69).
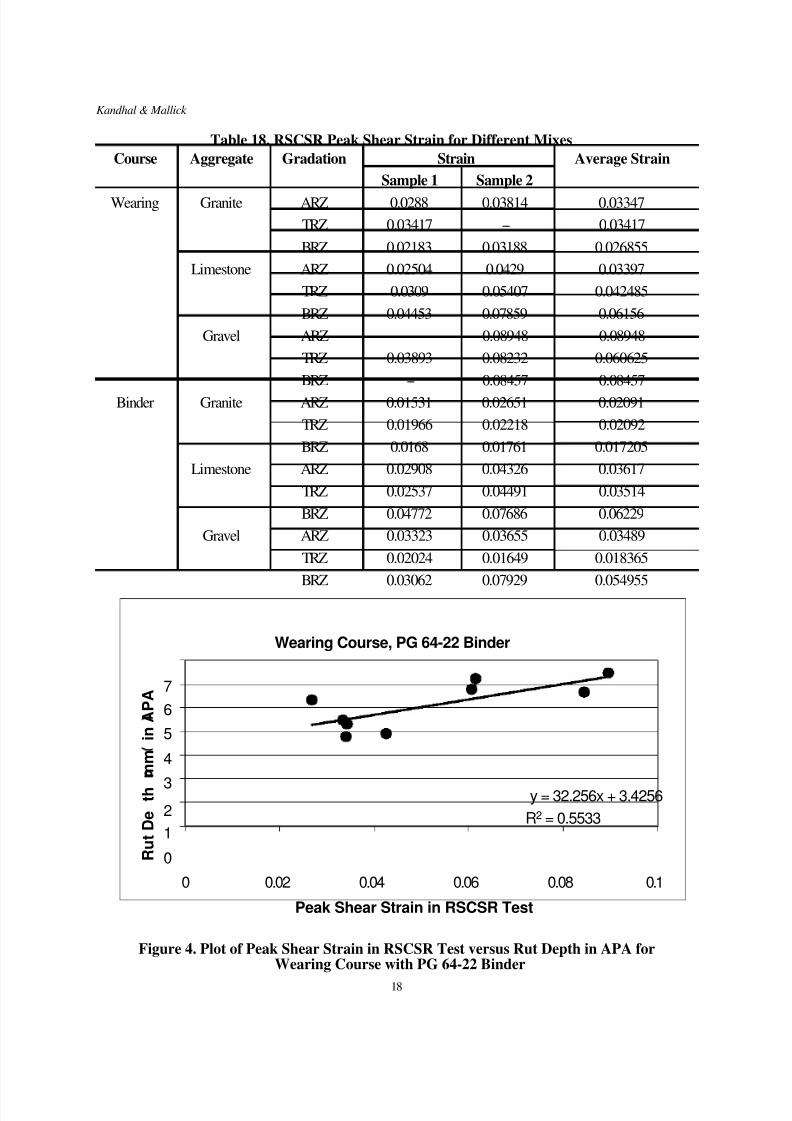
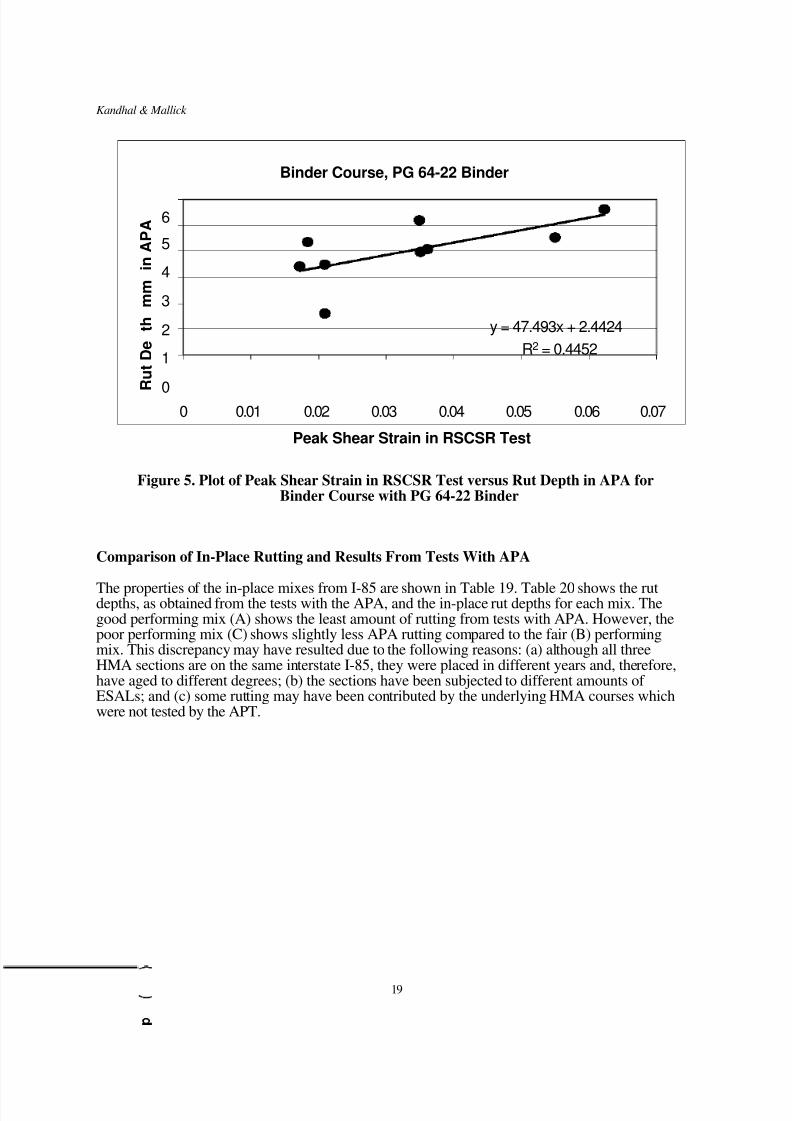
Table18showstheresultsfromtestswithRSCSR.Thepeakshearstrainvaluesindicatethat
TRZmixesarenotalwaystheoneswiththeminimumruttingpotential—infact,inthecaseofgranitewearingcourseTRZmixshowsthehighestpeakstrain.Figures4and5show
comparisonofresultfromRSCSRamd2APAtest,forwearingandbindercourses,respectively.
Bothcorrelationsarerelativelypoor(R=0.55,0.44,respectively)comparedtoRSCH,indicatingthattheRSCSRtestdoesnotcomparewellwiththeAPAtest.
16
8/9/2019 Potential of Asphalt Pavement Analyzer to Predict Rutting of Hot Mix Asphalt
http://slidepdf.com/reader/full/potential-of-asphalt-pavement-analyzer-to-predict-rutting-of-hot-mix-asphalt 22/27
Kandhal&Mallick
7
6
5
4
3
WearingCourse,PG64-22Binder
y=39.761x+3.4937
2
1
0
0
0.02
0.04
R2=0.6235
0.06
0.08
PeakShearStraininRSCHTest
Figure2.PlotofPeakShearStraininRSCHTestversusRutDepthinAPAfor
WearingCoursewithPG64-22Binder
6
5
4
3
2
1
0
BinderCourse,PG64-22Binder
y=49.637x+2.1318
R2=0.6918
0 0.01 0.02 0.03 0.04 0.05 0.06 0.07
PeakShearStraininRSCHTest
Figure3.PlotofPeakShearStraininRSCHTestversusRutDepthinAPAforBinder
CourseWithPG64-22Binder
17
R u t D e
t h
m m
i n A P A
R u t D e
t h
m m
i n
8/9/2019 Potential of Asphalt Pavement Analyzer to Predict Rutting of Hot Mix Asphalt
http://slidepdf.com/reader/full/potential-of-asphalt-pavement-analyzer-to-predict-rutting-of-hot-mix-asphalt 23/27
Kandhal&Mallick
Table18.RSCSRPeakShearStrainforDifferentMixes
Course Aggregate Gradation Strain AverageStrain
Sample1 Sample2
Wearing Granite ARZ 0.0288 0.03814 0.03347
TRZ 0.03417 -- 0.03417
BRZ 0.02183 0.03188 0.026855
Limestone ARZ 0.02504 0.0429 0.03397
TRZ 0.0309 0.05407 0.042485
BRZ 0.04453 0.07859 0.06156
Gravel ARZ -- 0.08948 0.08948
TRZ 0.03893 0.08232 0.060625
BRZ -- 0.08457 0.08457
Binder Granite ARZ 0.01531 0.02651 0.02091
TRZ 0.01966 0.02218 0.02092
BRZ 0.0168 0.01761 0.017205
Limestone ARZ 0.02908 0.04326 0.03617
TRZ 0.02537 0.04491 0.03514
BRZ 0.04772 0.07686 0.06229
Gravel ARZ 0.03323 0.03655 0.03489
TRZ 0.02024 0.01649 0.018365
BRZ 0.03062 0.07929 0.054955
7
6
5
4
3
WearingCourse,PG64-22Binder
y=32.256x+3.42562
1
0
0
0.02
0.04
0.06
R2=0.5533
0.08
0.1
PeakShearStraininRSCSRTest
Figure4.PlotofPeakShearStraininRSCSRTestversusRutDepthinAPAfor
WearingCoursewithPG64-22Binder
18
R u t D e
t h
m m
i n A P A
8/9/2019 Potential of Asphalt Pavement Analyzer to Predict Rutting of Hot Mix Asphalt
http://slidepdf.com/reader/full/potential-of-asphalt-pavement-analyzer-to-predict-rutting-of-hot-mix-asphalt 24/27
Kandhal&Mallick
6
5
4
3
2
1
0
BinderCourse,PG64-22Binder
y=47.493x+2.4424
R2=0.4452
0 0.01 0.02 0.03 0.04 0.05 0.06 0.07
PeakShearStraininRSCSRTest
Figure5.PlotofPeakShearStraininRSCSRTestversusRutDepthinAPAfor
BinderCoursewithPG64-22Binder
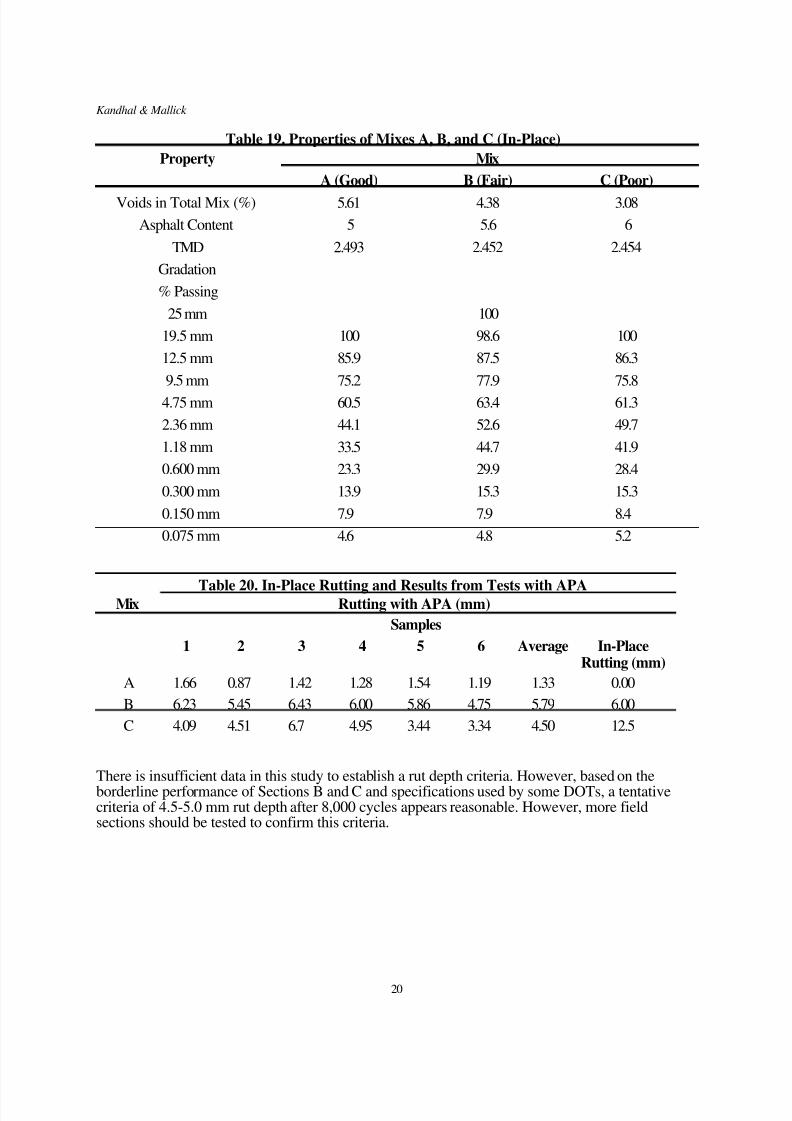
ComparisonofIn-PlaceRuttingandResultsFromTestsWithAPA
Thepropertiesofthein-placemixesfromI-85areshowninTable19.Table20showstherutdepths,asobtainedfromthetestswiththeAPA,andthein-placerutdepthsforeachmix.Thegoodperformingmix(A)showstheleastamountofruttingfromtestswithAPA.However,thepoorperformingmix(C)showsslightlylessAPAruttingcomparedtothefair(B)performingmix.Thisdiscrepancymayhaveresultedduetothefollowingreasons:(a)althoughallthreeHMAsectionsareonthesameinterstateI-85,theywereplacedindifferentyearsand,therefore,haveagedtodifferentdegrees;(b)thesectionshavebeensubjectedtodifferentamountsofESALs;and(c)someruttingmayhavebeencontributedbytheunderlyingHMAcourseswhichwerenottestedbytheAPT.
19
R u t D e
t h
m m
i n A P A
8/9/2019 Potential of Asphalt Pavement Analyzer to Predict Rutting of Hot Mix Asphalt
http://slidepdf.com/reader/full/potential-of-asphalt-pavement-analyzer-to-predict-rutting-of-hot-mix-asphalt 25/27
Kandhal&Mallick
Table19.PropertiesofMixesA,B,andC(In-Place)
Property Mix
VoidsinTotalMix(%)
AsphaltContent
TMD
Gradation
%Passing
25mm
19.5mm
12.5mm
9.5mm
4.75mm
2.36mm
1.18mm
0.600mm
0.300mm
0.150mm
0.075mm
A(Good)
5.61
5
2.493
100
85.9
75.2
60.5
44.1
33.5
23.3
13.9
7.9
4.6
B(Fair)
4.38
5.6
2.452
100
98.6
87.5
77.9
63.4
52.6
44.7
29.9
15.3
7.9
4.8
C(Poor)
3.08
6
2.454
100
86.3
75.8
61.3
49.7
41.9
28.4
15.3
8.4
5.2
Table20.In-PlaceRuttingandResultsfromTestswithAPAMix RuttingwithAPA(mm)
Samples
1 2 3 4 5 6 Average In-PlaceRutting(mm)
A 1.66 0.87 1.42 1.28 1.54 1.19 1.33 0.00
B 6.23 5.45 6.43 6.00 5.86 4.75 5.79 6.00
C 4.09 4.51 6.7 4.95 3.44 3.34 4.50 12.5
Thereisinsufficientdatainthisstudytoestablisharutdepthcriteria.However,basedontheborderlineperformanceofSectionsBandCandspecificationsusedbysomeDOTs,atentativecriteriaof4.5-5.0mmrutdepthafter8,000cyclesappearsreasonable.However,morefieldsectionsshouldbetestedtoconfirmthiscriteria.
20
8/9/2019 Potential of Asphalt Pavement Analyzer to Predict Rutting of Hot Mix Asphalt
http://slidepdf.com/reader/full/potential-of-asphalt-pavement-analyzer-to-predict-rutting-of-hot-mix-asphalt 26/27
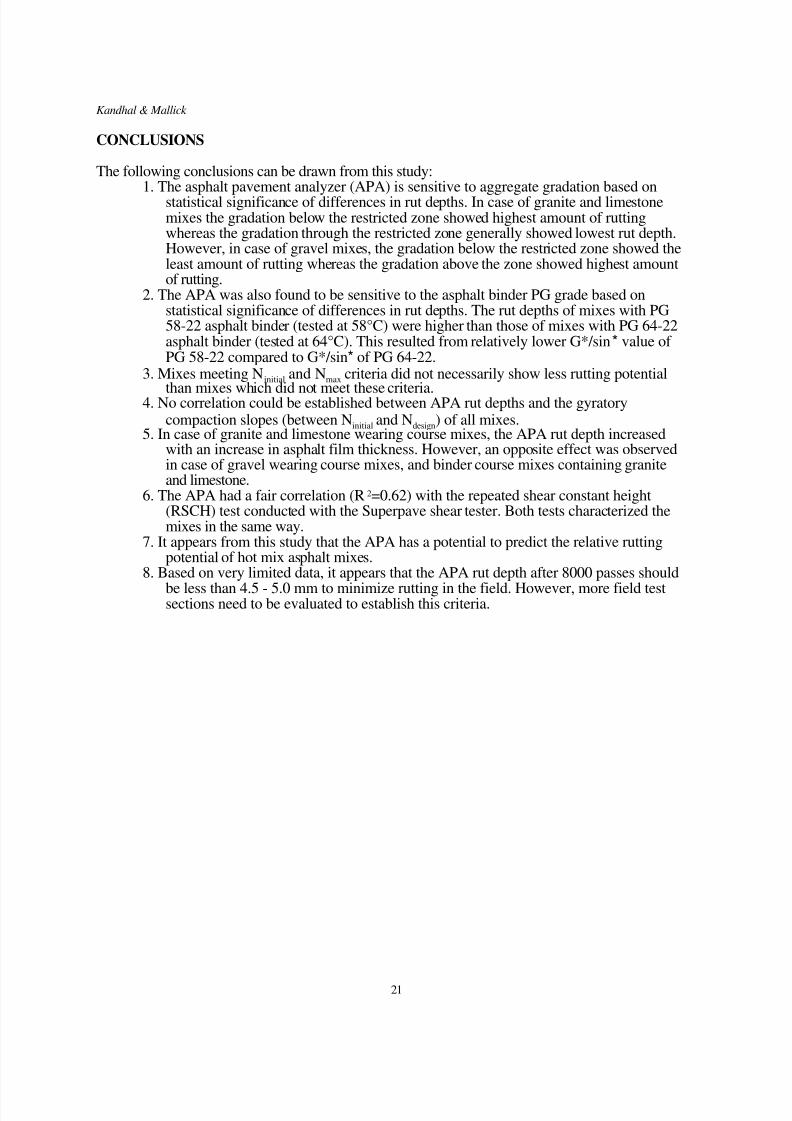
Kandhal&MallickCONCLUSIONSThefollowingconclusionscanbedrawnfromthisstudy:
1.Theasphaltpavementanalyzer(APA)issensitivetoaggregategradationbasedonstatisticalsignificanceofdifferencesinrutdepths.Incaseofgraniteandlimestonemixesthegradationbelowtherestrictedzoneshowedhighestamountofruttingwhereasthegradationthroughtherestrictedzonegenerallyshowedlowestrutdepth.However,incaseofgravelmixes,thegradationbelowtherestrictedzoneshowedtheleastamountofruttingwhereasthegradationabovethezoneshowedhighestamountofrutting.
2.TheAPAwasalsofoundtobesensitivetotheasphaltbinderPGgradebasedonstatisticalsignificanceofdifferencesinrutdepths.TherutdepthsofmixeswithPG58-22asphaltbinder(testedat58°C)werehigherthanthoseofmixeswithPG64-22asphaltbinder(testedat64°C).ThisresultedfromrelativelylowerG*/sin*valueofPG58-22comparedtoG*/sin*ofPG64-22.
3.MixesmeetingNinitialandNmaxcriteriadidnotnecessarilyshowlessruttingpotential
thanmixeswhichdidnotmeetthesecriteria.4.NocorrelationcouldbeestablishedbetweenAPArutdepthsandthegyratorycompactionslopes(betweenNinitialandNdesign)ofallmixes.
5.Incaseofgraniteandlimestonewearingcoursemixes,theAPArutdepthincreasedwithanincreaseinasphaltfilmthickness.However,anoppositeeffectwasobservedincaseofgravelwearingcoursemixes,andbindercoursemixescontaininggraniteandlimestone.
6.TheAPAhadafaircorrelation(R2=0.62)withtherepeatedshearconstantheight(RSCH)testconductedwiththeSuperpavesheartester.Bothtestscharacterizedthemixesinthesameway.
7.ItappearsfromthisstudythattheAPAhasapotentialtopredicttherelativeruttingpotentialofhotmixasphaltmixes.
8.Basedonverylimiteddata,itappearsthattheAPArutdepthafter8000passesshould
belessthan4.5-5.0mmtominimizeruttinginthefield.However,morefieldtestsectionsneedtobeevaluatedtoestablishthiscriteria.
21
8/9/2019 Potential of Asphalt Pavement Analyzer to Predict Rutting of Hot Mix Asphalt
http://slidepdf.com/reader/full/potential-of-asphalt-pavement-analyzer-to-predict-rutting-of-hot-mix-asphalt 27/27
Kandhal&MallickREFERENCES1.
2.3.4.5.6.
7.8.
Lai,J.S.EvaluationofRuttingCharacteristicsofAsphaltmixesUsingLoaded-WheelTester.FinalReport,GaDOTProjectNo.8609,August1986.Lai,J.S.EvaluationoftheEffectofGradationofAggregateonRuttingCharacteristicsofAsphaltMixes.FinalReport,GaDOTProjectNo.8706,August1988.West,R.D.,G.C.Page,andK.H.Murphy.EvaluationoftheLoadedWheelTester. ResearchReportFL/DOT/SMO/91-391.StateofFloridaDept.ofTransportationDecember1991.Miller,T.,K.Ksaibati,andM.Farrar.UtilizingtheGeorgiaLoaded-WheelTestertoPredictRutting.Paperpresentedatthe73rdAnnualMeetingoftheTransportationResearchBoard,1995.Collins,R.,D.E.Watson,andB.Campbell.DevelopmentandUseoftheGeorgiaLoadedWheelTester.InTransportationResearchRecord 1492,TRB,NationalResearchCouncil,Washington,DC,1995,pp.202-207.Collins,R.,H.Shami,andJ.S.Lai.UseofGeorgiaLoadedWheelTestertoEvaluate
RuttingofAsphaltSamplesPreparedbySuperpaveGyratoryCompactor.InTransportationResearchRecord 1545,TRB,NationalResearchCouncil,Washington,DC,1996,pp.161-168.Shami,H.I.,J.S.Lai,J.A.D'Angelo,andT.P.Harmon.DevelopmentofTemperatureEffectModelforPredictingRuttingofAsphaltMixturesUsingGeorgiaLoadedWheelTester.InTransportationResearchRecord 1590,TRB,NationalResearchCouncil,Washington,DC,1997,pp.17-22.MissouriDepartmentofTransportation.RuttingSusceptibilityofBituminousMixturesbytheGeorgiaLoadedWheelTester .ReportNo.RDT98-01.May1,1998.
22