Embed Size (px)
Citation preview

This document is downloaded at: 2018-06-28T20:31:20Z
Title Relationship between monoclonal gammopathy of undeterminedsignificance and radiation exposure in Nagasaki atomic bomb survivors.
Author(s)
Iwanaga, Masako; Tagawa, Masuko; Tsukasaki, Kunihiro; Matsuo,Tatsuki; Yokota, Ken-ichi; Miyazaki, Yasushi; Fukushima, Takuya; Hata,Tomoko; Imaizumi, Yoshitaka; Imanishi, Daisuke; Taguchi, Jun; Momita,Sabro; Kamihira, Shimeru; Tomonaga, Masao
Citation Blood, 113(8), pp.1639-1650; 2009
Issue Date 2009-02-19
URL http://hdl.handle.net/10069/21637
Right
This research was originally published in Blood. Masako Iwanaga and et.al.Relationship between monoclonal gammopathy of undeterminedsignificance and radiation exposure in Nagasaki atomic bomb survivors.Blood. 2009;113(8): 1639-1650. (c) by the American Society ofHematology
NAOSITE: Nagasaki University's Academic Output SITE
http://naosite.lb.nagasaki-u.ac.jp

1
Scientific Category
Clinical trials and observations
Relationship between Monoclonal Gammopathy of Undetermined Significance
and Radiation Exposure in Nagasaki Atomic Bomb Survivors
Short title
MGUS and Radiation exposure
Masako Iwanaga, MD, MPH,1 Masuko Tagawa, MD,2 Kunihiro Tsukasaki, MD,1
Tatsuki Matsuo, MD,2 Ken-ichi Yokota, PhD,3 Yasushi Miyazaki, MD,1
Takuya Fukushima, MD,1 Tomoko Hata, MD,1 Yoshitaka Imaizumi, MD,1
Daisuke Imanishi, MD,1 Jun Taguchi, MD,1 Sabro Momita, MD, 1
Shimeru Kamihira, MD, 4 Masao Tomonaga, MD.1
Author Affiliation 1Department of Hematology and Molecular Medicine, Atomic Bomb Disease Institute, Nagasaki
University Graduate School of Biomedical Sciences, Nagasaki, Japan 2Department of Internal Medicine, Nagasaki Atomic Bomb Casualty Council Health Management
Center, Nagasaki, Japan 3Biostatistics Section, Division of Scientific Data Registry, Atomic Bomb Disease Institute,
Nagasaki University Graduate School of Biomedical Sciences, Nagasaki, Japan
4Department of Laboratory Medicine, Nagasaki University Graduate School of Biomedical Science,
Nagasaki, Japan
Corresponding author
Masako Iwanaga, M.D., M.P.H., Department of Hematology and Molecular Medicine, Atomic
Bomb Disease Institute, Nagasaki University Graduate School of Biomedical Sciences, 1-12-4
Sakamoto, Nagasaki, 852-8523, Japan, Tel.: +81-95-819-7111, Fax: +81-95-819-7113,
E-mail: [email protected]

2
Abstract
Radiation exposure is a possible predisposing factor for monoclonal gammopathy of undetermined
significance (MGUS), but the association has been uncertain. We investigated the relationship
between radiation exposure and MGUS prevalence by using data from the M-protein screening for
Nagasaki atomic bomb survivors during 1988-2004. Radiation exposure was assessed by exposure
distance from the hypocenter and exposure radiation dose. We computed prevalence ratios (PRs)
and the 95% confidence intervals (CIs) adjusting for exposure age and sex. A total of 1082 MGUS
were identified from 52525 participants. MGUS prevalence was significantly higher in people
exposed at distance within 1.5 km than beyond 3.0 km (PR, 1.4; 95%CI, 1.1-1.9) among those
exposed at ages 20 years or younger, but it was not found among those exposed at ages 20 years or
older. MGUS prevalence was also significantly higher in people exposed to more than 0.1Gy than
those exposed to less than 0.01Gy (PR, 1.7; 95%CI, 1.0-2.8) among those exposed at ages 20 years
or younger. Thus, people exposed at younger age exhibited significantly high risk of MGUS when
exposed to high radiation dose. There was no clear association between radiation exposure and the
malignant progression of MGUS. Further detailed analysis is needed.
Key words
Monoclonal gammopathy of undetermined significance, Multiple myeloma, Cancer epidemiology,
Radiation exposure, Atomic Bomb Survivors
3
Introduction
Monoclonal gammopathy of undetermined significance (MGUS) is a premalignant plasma cell
disorder, which is defined by a serum monoclonal-protein (M-protein) concentration of 3 g/dL or
less, 10% or fewer plasma cells in bone marrow, and the absence of anemia, osteolytic lesions,
hypercalcemia, and renal dysfunction.1 Although the majority of MGUS remain stable for
prolonged periods, malignant transformation to multiple myeloma occurs at a constant rate of 1%
per year.2 Given that myeloma is an incurable hematological malignancy, it is important to elucidate
etiology and predisposing factor of MGUS.
Etiologic factors for MGUS have not been investigated fully.3-5 There are currently no
consistent risk predictors, beyond age, sex, and race, for developing MGUS. Although radiation
exposure is well known to initiate leukemogenesis, there have been conflicting reports about the
association between radiation exposure and plasma cell disorders.6-11 An Italian case-reference
study reported an increased risk of MGUS among people suffered by occupational radiation
exposure.12 However, a small survey for atomic bomb survivors showed no association between
radiation dose and the relative risk of MGUS.13 Sample sizes of these previous studies were too
small to obtain reliable results for association between radiation exposure and incidence of the
disease.
We have recently reported that the age-specific MGUS prevalence in Japanese population,
indicating 2.4% in those older than 50 years.14 The report used a M-protein screening data from
approximately 52000 atomic bomb survivors but did not yet report the relationship between
radiation exposure and MGUS risk. The large number of study participants from the
radiation-exposed population could provide a great opportunity to investigate the relationship
between radiation exposure and the risk of MGUS. Our preliminary analysis observed that MGUS
risk was higher in those exposed to higher radiation among young age.15 However, the preliminary
observation lacked detailed analyses for the relationship and did not include clinical characteristics.
In the present study, we performed comprehensive analyses for the screening data by considering
distance from the hypocenter of the nuclear explosion, radiation dose, age at exposure, age at
diagnosis, and monoclonal protein level to elucidate whether radiation exposure is related with the
development of MGUS and the progression.

4
Materials and Methods
Data source
Screening for M-protein was initiated in October 1988 for atomic bomb survivors at the Health
Management Center of Nagasaki Atomic Bomb Casualty Council where a comprehensive medical
check-up has been offered twice a year since 1968, and several cancer screenings have been offered
once a year since 1988. All examinations are free of charge and supported by the Nagasaki City
Government based on the Law Concerning the Relief for Atomic Bomb Survivors. Data of all
medical check-ups and cancer screenings were stored by online into the computer database at the
Data Center in the Atomic Bomb Disease Institute at Nagasaki University Graduate School of
Biomedical Sciences since 1977. The ongoing database keeps data from approximately 120000
atomic bomb survivors who have Atomic Bomb Victim’s Handbook, including fundamental
information, age at exposure, city at the time of the bombings, exposure categories, exposure
distance from the hypocenter in km, date of the certificate handbook acquisition, date of
examination, date of death, and date of moving-in or -away from Nagasaki City, and all laboratory
results.16 Data of participants underwent the M-protein screening were extracted as anonymous data
from the computer database in the Data Center of Atomic Bomb Disease Institute. Use of the
database for this study was approved by the Atomic Bomb Disease Institute on June 2004 (No.224).
Screening procedure
Screening procedures were described in detail previously.14 Briefly, routine laboratory tests
including the first-step M-protein screening were offered every year for atomic bomb survivors who
visited the Health Management Center. Results of the first-step M-protein screening were evaluated
on the sheet in the double-checking system by hematologists of Nagasaki University Medical
Hospital regardless of exposure condition. Subjects with the presence of possible M-protein or low
gammaglobulinemia were informed by mail or telephone to take the second-step screening. The
second-step screening procedure consisted of physical examination by hematologists,
immunoelecrophoresis of serum and urine, a qualitative test for Bence-Jones (BJ) protein, and a

5
quantitative determination of serum concentration of immunoglobulins using nephelometry.
Subjects with a high level of M-protein or with other abnormal laboratory data were referred to the
tertiary hospitals to undergo further examination with bone marrow aspiration, bone surveys, and
other investigations. Skilled hematologists made a final diagnosis comprehensively based on
screening data, routine laboratory data, physical examinations, and feedback letters from the
reference hospitals. The diagnostic criteria used for MGUS were based on an M-protein level less
than 3.0 g/dl in serum Igs, no symptom of multiple myeloma or Waldenström's macroglobulinemia
(WM), no anemia, no hypercalcemia, no osteolytic lesion, and less than 10% marrow plasma cells if
done.1 Cases with high M-protein level more than 3.0 g/dl at the first-time detection day but
showing the “reconfirmed” M-protein levels of less than 3.0 g/dL were also treated as MGUS.
Radiation exposure
Radiation exposure was assessed by exposure distance and exposure dose. In the database,
exposure categories were divided into 4 categories; “directly exposed” indicates those who were
exposed to atomic bomb radiation within 10 km from the hypocenter at the time of the bombing,
“early entrants” indicates those who entered the city within approximately 2 km from the
hypocenter within two weeks of the explosion, “relief” indicates those who were engaged in
disposal of the dead or relief works for atomic bomb victims, and “exposed In-utero” indicates
children who were exposed prenatally at the time of the bombing. Although information of
exposure distance was available for “directly exposed” and “exposed In-utero”, we used only
“directly exposed” people for the analysis to investigated relationship between radiation exposure
and MGUS risk. Information of whole-body radiation dose estimate by the Atomic Bomb Survivors
1993 Dose (ABS93D) were available for a limited number of Nagasaki atomic bomb survivors.17
The ABS93D was calculated according to three parameters, free-in-air kerma, shielded kerma, and
organ kerma, same as Dosimetry System (DS) 86,18 which was used for the Life Span Study (LSS)
cohort of the Radiation Effects Research Foundation (RERF).11 As a strong correlation between
DS86 and ABS93D was fully documented,19 we used ABS93D as a substitute of DS series to
estimate radiation-dose response.
Participants

6
The target population for the M-protein screening was 74411 atomic bomb survivors exposed
in Nagasaki City, consisting of 71675 people who were alive at the time of the start of the
M-protein screening in October 1988 and 2736 people who were included in the database after 1988
to 2004 because some obtained newly Atomic Bomb Victim’s Handbook and others moved in
Nagasaki City from elsewhere. Those exposed in Hiroshima City moving-in Nagasaki City were
excluded. Among 74411 people, ABS93D dose information was available for 6837 (9.2%). Table 1
presents the breakdown of participants and non-participants by demographic characteristics. The
participant rates were around 70% in all categorized groups except in those 30 years or older age at
exposure (36%). Finally, a total of 52525 Nagasaki atomic bomb survivors were underwent the
M-protein screening during 1988-2004 (the overall participation rate, 70.6%) and were used for
analyses to examine the relationship between MGUS risk and exposure distance from the
hypocenter. Among those having radiation dose, 4758 (the participation rate, 69.6%) underwent the
screening and were used for the dose-response analyses.
Follow-up procedure
Subjects who were once diagnosed as having MGUS also underwent annually the M-protein
screening in the same way as described in the screening procedure. They were followed to check
the change of size of M-protein on individual M-protein chart, which was reviewed by skilled
hematologists in the Health Management Center. Subjects with a high level of M-protein or with
other abnormal laboratory data were referred to the tertiary hospitals to undergo further examination.
Diagnoses of multiple myeloma or other related diseases were obtained from the tertiary hospitals.
Statistical analysis
Statistical analyses for prevalence were performed using all the screening data accumulated
during the period from October 1, 1988, to March 31, 2004. Patients who were diagnosed as having
multiple myeloma or WM at the first-time screening were excluded from the analyses. MGUS
patients diagnosed during the period above were also analyzed the risk of the malignant progression
during the period from the date of diagnosis to July 31, 2008. All statistical analyses were
performed using SAS 8.2 software (SAS Japan Institute, Tokyo, Japan). All tests were 2-tailed, and
the level of statistical significance was .05.

7
Age at exposure was treated as a continuous data or stratified into four categories (0-9, 10-19,
20-29, 30 yr or older). Exposure distance from the hypocenter in km was treated as a continuous
data or stratified into three categories (within 1.5, 1.5-3.0, and 3.0 up to 10.0 km). The cut-off
values for exposure distance were chosen based on previous reports.20,21 Among those in the
exposure category of “directly exposed”, subjects with no information of distance position were
treated as those exposed at unknown distance. The ABS93D dose estimate in Gy was treated as
continuous data or stratified into three categories (lower than 0.01, 0.01-0.1, and 0.1 or higher). Age
at diagnosis of MGUS was stratified into five categories (< 50, 50-60, 60-70, 70-80, >80 yr). Basic
demographic analyses were assessed using Chi-square test or trend test for categorical variables and
nonparametric test for continuous variables, if necessary. Simple prevalence (%) of MGUS and the
95% confidence intervals (CI) were calculated using the exact binomial method in each category.
Exposure-response analyses were performed for two data sets, one for people with assured exposure
distance from the hypocenter to examine the relationship between MGUS risk and the exposure
distance, and another for people with assured ABS93D dose to examine the relationship between
MGUS risk and exposure dose. To evaluate the relationship between MGUS risk and exposure
distance or exposure dose, we calculated prevalence ratios (PR) and the 95% CI by using the
log-binomial regression model using PROC GENMOD in SAS.22,23 Univariate and multivariate
analyses were performed including relevant factors and/or interaction terms to test
effect-modification. To obtain the best-fit model for dose-response effect, we ran additional
analyses including sex, continuous age at exposure per year, continuous radiation dose (linear or
quadratic term), and interaction terms between covariates. The most appropriate model was selected
on the basis of Akaike’s Information Criterion (AIC).24 The cumulative probability of developing
multiple myeloma or other lymphoid malignancy among MGUS was calculated using the
Kaplan-Meier method and compared using the log-rank test. Patients who died or were lost to
follow-up were censored in the analysis.
Results
Of 52525 participants, 1103 were confirmed as having monoclonal immunoglobulin, in which
1082 were diagnosed as having MGUS, 19 were multiple myeloma, and 2 were WM. The 21

8
patients with multiple myeloma or WM were excluded from analyses. Therefore, a total of 52504
participants were used for analyses by exposure distance. Of the 21 patients excluded, 3 had
ABS93D dose information. Therefore, a total of 4755 participants with ABS93D dose were used for
dose-response analyses.
Clinical characteristics of MGUS at diagnosis
Table 2 shows the clinical characteristics of 1082 MGUS patients. The median age at
diagnosis was 68.5 years (ranges, 45.0 to 100.9). Age at diagnosis was significantly older than in
female (median; 68.3 yr) than male (median; 66.3 yr) (P=.003). The distribution of age at diagnosis
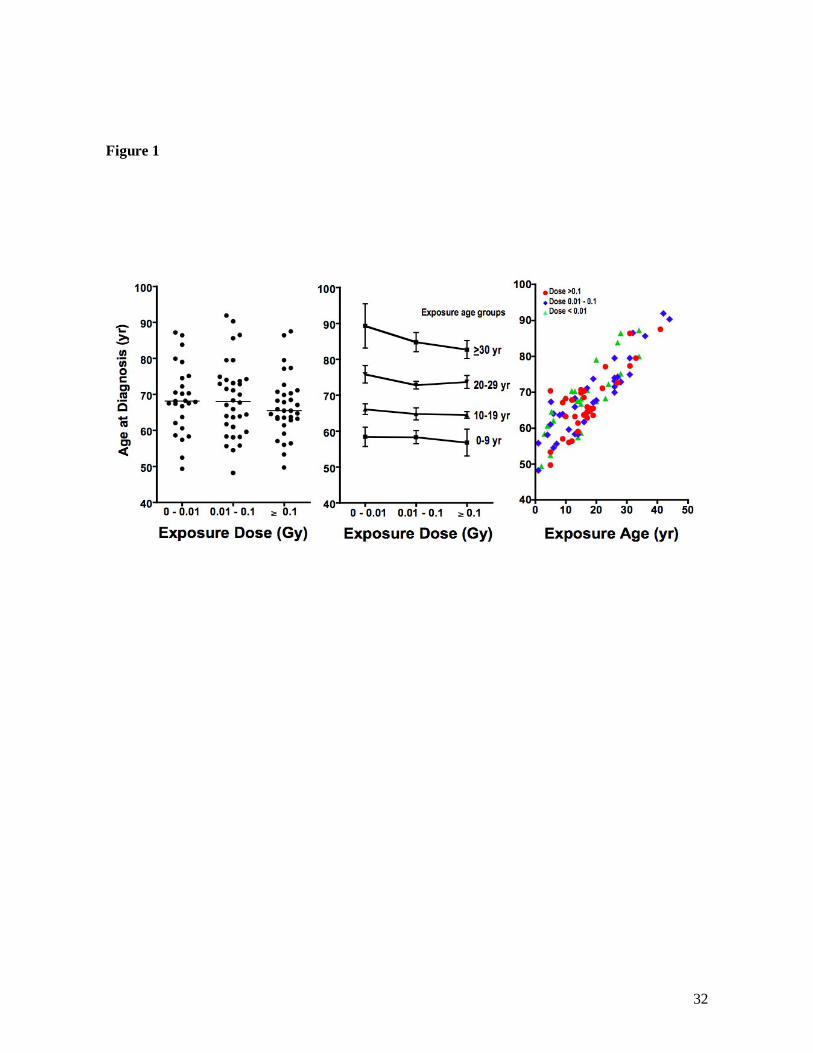
by exposure categories was presented in Table 3. Although patients exposed at younger age tended
to be younger age at diagnosis (Figure 1C), there was no difference in age at diagnosis across
exposure distance groups (P=.65) but was some tendency for age at diagnosis to be younger in
those exposed to the higher dose (>0.1Gy) than those exposed to the lower dose in each exposure
age group, though the differences were not statistically significant (P=.46 among three dose
categories and P=.23 between dose group of 0-0.01 and >0.1Gy) (Figure 1A,1B). Median serum
M-protein level at diagnosis was 1.5 g/dL (range 0.1 to 3.4 g/dL). The distribution of serum
M-protein level by demographic characteristics was summarized in Table 4 (and see a
supplemental Table). MGUS with M-protein level greater than 1.5 g/dL were highly frequent those
exposed at 20 yr or older. However, the level was not different among age at diagnosis, exposure
distance, or exposure dose.
Prevalence of MGUS by exposure distance from the hypocenter
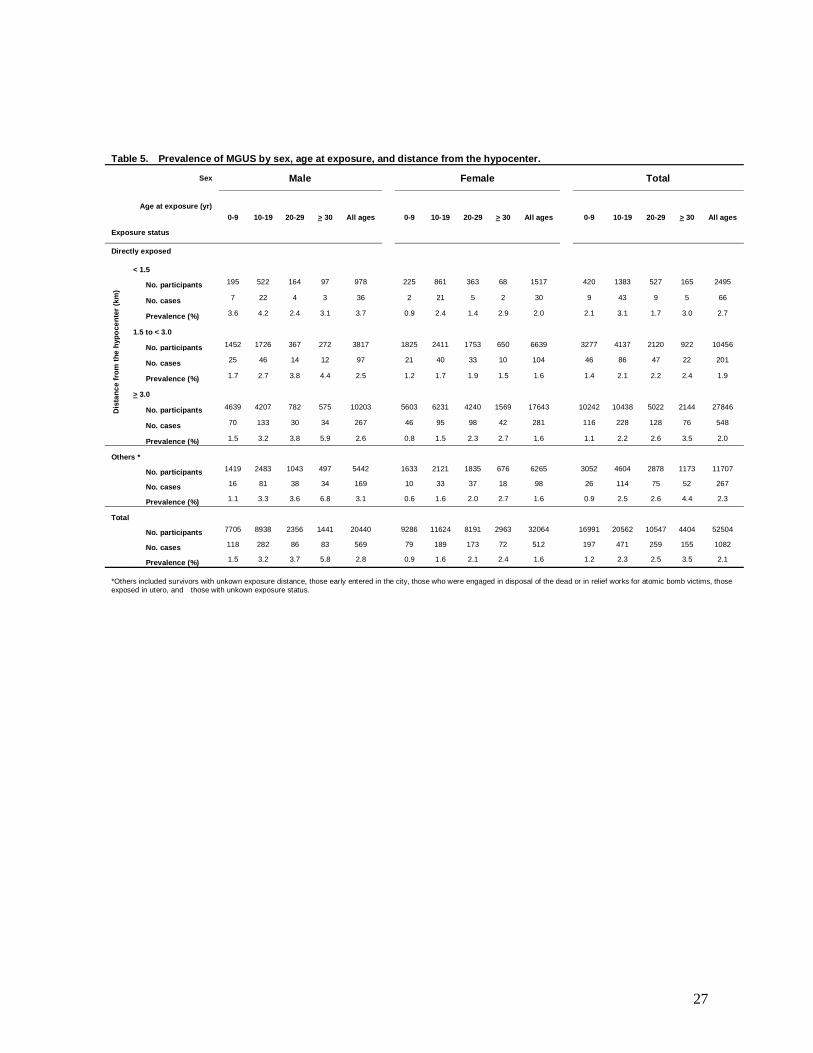
MGUS prevalence in 52504 participants by sex and exposure status was shown in Table 5.
The over all prevalence of MGUS in participants was 2.1% (95%CI, 1.9 to 2.2), 2.8% (95%CI, 2.6
to 3.0) in male, and 1.6% (95%CI, 1.5 to 1.7) in female. MGUS prevalence was 2.7% (95%CI 2.1
to 3.4) in those directly exposed at within 1.5km from the hypocenter, 1.9% (95%CI 1.7 to 2.2) at
1.5-3.0km, 2.0% (95%CI 1.8 to 2.1) at over 3.0km, and 2.3% (95%CI 2.0 to 2.6) in other exposure
categories. Table 6 summarizes results of univariate and multivariate regression analyses. The
unadjusted PR was significantly higher in male, in those of older age at exposure, and in those
exposed at within 1.5 km compared to those exposed at over 3.0km. A multivariate analysis

9
including interaction terms among all variables showed a significant interaction (P<.03) between
age at exposure and the exposure distance, but no significant interaction between sex and age at
exposure (P<.7) or exposure distance (P<.9), suggesting that the effect of exposure distance on
MGUS prevalence might be different by age at exposure. Therefore, we analyzed data by dividing
into two age categories; those exposed in age younger than 20 years and 20 years or older. Because
age function is a strong risk factor for MGUS, we included age at exposure as a continuous variable
into both stratified multivariate analyses. In the multivariate analysis for those of age at exposure
younger than 20 years, the adjusted PR of MGUS showed 40% increase per every 5-year increase
of age at exposure (adjusted PR, 1.4; 95%CI, 1.3-1.5) and the probability of MGUS among subjects
who were exposed at within 1.5 km was overall 40 % higher than among those exposed at far from
1.5km (adjusted PR, 1.4; 95%CI, 1.1-1.9). The adjusted PR of MGUS showed no difference among
exposure distance categories in those of age at exposure older than 20 years.
Prevalence of MGUS by radiation dose
Table 7 presents the breakdown of MGUS prevalence in people with information of ABS93D
dose. Among dose categories, the prevalence was 2.5% (95%CI, 1.7-3.5) in those exposed at 0.1Gy
or more, 2.0% (95%CI; 1.4-2.8) in those at 0.01-0.1Gy, and 1.6% (95%CI, 1.1-2.3) in those at
0.01Gy or lower. Before applying dose as continuous data, doses are truncated to correspond to the
4 Gy level according to previous RERF studies.11,25 Table 8 summarizes results of univariate and
multivariate regression analyses for PRs. For those exposed when younger than 20 years, univariate
analyses showed significantly higher PR in those exposed to 0.1Gy or more compared to those
exposed to lower dose category. However, no significant dose-effect was observed when dose was
treated as continuous variables. After adjusting sex and age at exposure, the PR of MGUS in those
exposed to 0.1Gy or more was estimated 1.66, suggesting that radiation exposure over 0.1Gy had
1.66 times higher risk of MGUS compared to the dose of lower than 0.1Gy. However, the
linear-dose model failed to find a clear dose-response effect even after controlling sex and age at
exposure (multivariate analysis-1 in Table 8). We performed additional models, including dose as
treated quadratic transformation. The AIC value in each multivariate analysis was 587.7646 for a
model using a linear term (the parameter estimate [beta] for dose; 0.2179, standard error [SE];
0.1651, P=.2), 588.0652 for a simple quadratic term (dose squared) (beta; 0.0569, SE; 0.0469,
P=.2), and 589.7468 for a quadratic term (beta; 0.2794, SE; 0.4867, P=.5). For those exposed when

10
older than 20 years, both univariate and multivariate analyses showed no effect of radiation dose on
MGUS prevalence even after controlling other covariates. Figure 2A shows PR of MGUS by
exposure dose squared adjusting for sex and age at exposure. Prevalence ratio at 1 Gy was 1.06
(95%CI, 0.97 to 1.16, P=.2) among those of age at exposure younger than 20 yr. Figure 2B shows
PR of MGUS by age at exposure adjusting for sex and exposure dose square. Advanced age was
significantly associated with increased prevalence of MGUS among those of age at exposure
younger than 20 yr (PR, 2.24 for 10-year increase; 95% CI, 1.39-3.62; P=.001) and those older than
20 yr (PR, 1.77 for 10-year increase; 95% CI, 1.03-3.03; P =.04).
Risk of progression
MGUS patients were followed for a total of 8822.5 person-years (median, 7.4 years; range, 0
to 19.6 years). There were 365 patients (33.7%) who were followed until death. During this period
of observation, 44 (4.1%) patients experienced the progression to multiple myeloma (41 cases) and
WM (3 cases). All of myeloma cases were developed from IgG or IgA MGUS. Among 3 WM, two
were developed from IgM MGUS and one was developed from IgG MGUS.26 The median latent
period between the diagnosis of MGUS and the development of multiple myeloma or WM was 5.3
years (range, 0.1 to 15.9 years). The overall cumulative probability of the progression was 6.9%
(95%CI, 4.9% to 9.6%) at 10 years and 8.0% (95%CI, 5.4 to 11.9) at the latest follow-up (Figure
3A). Among the 44 patients, 36 had information of exposure distance, and only 2 had information
of exposure dose. Therefore, risk analyses were performed by only exposure distance. The
frequency of malignant progression by factors was summarized in Table 9. The cumulative
probability of the progression was greater in those exposed at within 1.5 km distance than those
exposed at 1.5-3.0 km and 3.0 km or more distance, but the difference was not statistically
significant (13.9% vs. 6.7% vs. 7.7%, log-rank test P=.34) (Figure 3B). The probability was
significantly higher in age at exposure 20 years or older than younger than 20 years (18.1% vs.
5.4%, P=.04) (Figure 3C). Among those age at exposure 20 years or older, there was no difference
in the progression between those exposed within 3km and over 3km distance from the hypocenter
(P=.90), but among those age at exposure younger than 20 years, the probability was a tendency to
be high in those exposed at within 3 km than those exposed distantly (7.4% vs. 4.2%, P=.17)
(Figure 3D). Among those age at exposure 20 years or older, those diagnosed in younger than the
median age 68.5 yr was significantly progressed to myeloma than those in older than 68.5 yr

11
(35.4% vs. 7.6%, P=.02) (Figure 3E). The cumulative probability was significantly higher in those
of the higher M-protein level at diagnosis (>1.5g/dL) than the lower level (<1.5g/dL) (12.5% vs.
2.0%, P=.0002) (Figure 3F). The older age at exposure showed the greater risk of progression
among those with the higher M-protein level at diagnosis (P=.06) but there was no different risk in
age categories among those with the lower M-protein level (P=.80) (Figure 3G). There was no risk
difference between the exposure distance categories among those with the higher M-protein level at
diagnosis (P=.60) but there was a tendency to be greater risk in those exposed at within 3 km
among those with the lower M-protein level (P=.0007) (Figure 3H).
Discussion
The present study is the first comprehensive evaluation of the effects of radiation exposure on
MGUS prevalence using a large number of atomic bomb survivors. We observed that, among those
exposed at younger than 20 years, the probability of MGUS was 1.4 times greater in those exposed
at near hypocenter than those exposed at far from the hypocenter and 1.7 times greater in those
exposed to radiation dose of 0.1Gy or more than less than the level. We also observed that the
strongest factor on the progression of MGUS was the high level of M-protein at diagnosis beyond
the effect of the higher radiation exposure.
Only a few epidemiological studies reported an effect of radiation exposure on MGUS.
Pasqualetti et al. observed that occupational exposure to radiation was significantly associated with
an increasing risk of MGUS.12 However, the result was based on only 13 cases and no
dose-response analysis was performed. Neriishi et al. reported no association between radiation
dose (DS86) and the incidence of 112 MGUS (1.7%) among 6737 atomic bomb survivors who were
members of the Adult Health Study (AHS) of RERF.13 The study found that the MGUS risk was not
different between those exposed more than 0.01Gy and those exposed less than 0.01Gy (relative
risk [RR]=1.35, 95%CI 0.9-2.0). There were several differences between the AHS study and the
present study in terms of analytic method and observed results. The overall prevalence was lower in
the AHS study than our result (1.7% vs. 2.1%) in spite of same study periods. The cut-off value to
compare MGUS risk by dichotomized dose category was also different as the present study used
0.1Gy but the AHS study used 0.01Gy. This difference might affect the different interpretation of
12
the results. In addition, the AHS study did not observe the significant interaction between age at
exposure and dose, and neither demonstrated dose-response analysis by age at exposure.
Nevertheless, they realized marginally significant increase of MGUS risk in those less than 80 years
old of onset age, which might support our result that a significantly higher prevalence risk of
MGUS was observed in only participants who were exposed in younger age. Even though there
were some differences between the AHS study and our present study, the estimated MGUS risk was
similar as the RR was 1.603 (P=.05) in less than 80 years old age at diagnosis in the AHS study, and
the PR was 1.66 (P=.05) in less than 20 years age at exposure in our study. This suggests that it is
consistent that there exists a significant weak association between radiation exposure and MGUS
risk among those exposed when young.
Although we found that only younger age at exposure had a significant association between
the higher dose radiation exposure and the higher MGUS risk, the result does not necessarily deny
the association in those of older exposure age. As shown in Table 1, the participation rate was lower
in older ages, which suggests less representative of the actual MGUS prevalence among the older
target population. As known well, older atomic bomb survivors, especially exposed at the higher
radiation dose, had the higher mortality due to both cancers and non-cancer diseases.21,27 Therefore,
results among those exposed in 20 years or older in our study might be strongly affected by
detection loss.
For the association between radiation and myeloma, a number of epidemiological studies
analyzed people exposed to environmental, occupational, and medical radiation.5,28,29 A series of
reports from Hanford nuclear workers in the US and Sellafield workers of British Nuclear Fuels
indicated a significant dose-response trend between myeloma death and cumulative external
radiation dose.30-35 A recent international report of the 15-Country collaborative study of nuclear
workers also found a borderline significant association with radiation dose and 87 myeloma deaths
(RR 1.61 at 100 mSv).36 The age effect in most of nuclear worker studies reported that a significant
dose-response was observed in those of older ages at exposure, which differs from findings in the
experiences of atomic bomb survivors including our study that significant dose-response were
observed more likely in those younger ages at exposure. For this discrepancy, Wing et al. discussed
that selection bias and basic differences in the characteristics of the study populations may be
considered.7 Another difference might be due to the differences in way of exposure to radiation that

13
nuclear workers received chronic exposures to cumulative lower doses over lifetime in contrast with
atomic bomb survivors who received acute exposure to high doses radiation.
Unlike nuclear workers, there is no epidemiological evidence supporting an increased risk of
myeloma among atmospheric nuclear test participants.8,9,37-40 All of these studies had less power to
evaluate dose-response association because the observed number of myeloma cases was too small,
less than 8. A mixed association has been observed between risk of myeloma and diagnostic or
therapeutic radiation.41-43 In a large international study of radiation treatment for cervical cancer,
there was no difference in risk of myeloma between those who were received less than 2Gy and
2Gy or greater, however, increased risks were observed among patients followed long-term and
those irradiated at relatively younger ages.44 The observation supports our result that the higher
MGUS risk was observed in those exposed to the higher radiation in younger age.
Among atomic bomb survivors, the relationship between exposed radiation dose and myeloma
has been also inconsistent. Ichimaru et al. analyzed 29 cases of myeloma accumulated between
1950 and 1976, and found a statistically significant increase in the incidence among the higher dose
group (over 0.5 Gy) since 1965, suggesting a prolonged latency period for radiation-induced
myeloma.10 The study also indicated a different dose effect by exposed age that the positive effect
was seen only in those exposed age 20-59 years old, which was very similar to our present study.
Shimizu et al. also reported a statistically significant excess risk for myeloma during from
1950-1985.45 However, the latest report did not observe a significant dose response (P=.12) when
analyses were limited to first-primary myeloma cases, though a statistically significant increase was
observed when excluded cases were included the analysis (P=.02).11 In the latest report, only 59
among 94 cases were used for the analysis because many cases were excluded due to a variety of
reasons. The report explained the discrepancy within the same cohort might be affected by
differences in the inclusion criteria of case and dosimetry system.
The majority of MGUS patients will never develop MM. So far, the size of serum M protein,
the IgA isotype, an abnormal serum free light chain ratio, detectable BJ protein excretion, and more
than 5% of plasma cells in BM have been identified as predictors of MM progression.46-48
Nevertheless, precise predictors to define high-risk MGUS cases should be identified. In the present
study, we confirmed that the strongest factor on the progression of MGUS was the high level of

14
M-protein at diagnosis beyond the effect of radiation exposure. Exposure age and age at diagnosis
showed complicated effects on the prognosis. Those exposed at 20 years or older progressed greater
than the younger (Figure 3C), but those diagnosed younger than 68.5yr more likely progressed to
myeloma in both exposure age categories (Figure 3E). These results might be affected by the
competing cause of death, thus the older patients would die before the progression of MGUS, which
could introduce the underestimate of the progression risk among older patients. Although the
present study did not find confident evidence that radiation exposure was related with the malignant
progression of MGUS, there was a tendency to be a greater risk of progression among patients
exposed proximally. Neriishi et al. also reported that MM mortality rate was higher among the
exposed group (>0.01Gy, 10 cases) than the non-exposed group (0-0.01Gy, 4 cases), though the
difference was not significant.13 Both studies suggested a potential adverse effect of radiation
exposure on the progression from MGUS to MM.
The present study has several limitations. Dose analyses were performed for a limited number
of subjects. A healthy screenee bias49 might affect the results especially in older age group. Indeed,
the participation rate decreased by age (Table 1). Over-diagnosis bias surly exists because of the
long-term prognosis of MGUS in nature. Potential factors including in analyses were also
insufficient. These limitations would have introduced over or under estimate of the association.
Further researches including other potential factors as covariate together are needed to confirm the
effect of radiation on MGUS.
The mechanism how radiation exposure affects the increasing risk of MGUS has been still
unknown. As known well, radiation exposure induces chromosomal and genomic instabilities by
direct and indirect ways.50 Meanwhile, a variety of chromosome abnormalities have been reported
even though MGUS is a benign hematological disorder.51,52 These facts might explain that MGUS
risk increase when exposed to the higher level of radiation dose through radiation-induced
chromosomal and genomic instabilities. Beyond the effect of radiation on MGUS risk, recent
epidemiological studies provided clear evidences of a significant racial disparity in MGUS
prevalence3,4,14 and familial aggregation for MM/MGUS,53 both of which suggest a role for genetic
susceptibility as MGUS etiology. More recently, Brown et al. reported a possible role for
immune-related and inflammatory conditions in the causation of MGUS.54 This report may also
suggest another perspective on radiation-induced MGUS because recent molecular studies have

15
revealed that radiation-induced inflammatory reaction and radiation-induced genomic instability
may be interrelated with a predisposition to radiation carcinogenesis.50,55
We previously reported that, even allowing for atomic bomb survivors, our Japanese
population had a lower prevalence of MGUS compared to whites.14 Although the conclusion is solid
evidence, the present findings suggest that the prevalence data of atomic bomb survivors may not
be generalizable to other Japanese population, but rather suggest that MGUS prevalence in a
general Japanese population might be lower than our population because the present study showed
that those who were exposed to lower radiation had a significantly low prevalence. Further
population-based epidemiological studies using general population are needed to estimate more
reliable MGUS prevalence in Japanese and other Asians.
In conclusion, the present study suggests that atomic bomb survivors exposed at high level of
radiation at young ages are at high risk of the evolution of MGUS even many years after radiation
exposure. During the screening period from 1988 to 2004, the population of atomic bomb survivors
becomes older. The youngest atomic bomb survivors reach around 60 years old. Unlike leukemia,
the risk of solid cancers following exposure to ionizing radiation becomes manifest after a relatively
long latency period,27 after which the excess risk persist for decades. MGUS and myeloma is also
one of such diseases with a long latency. Further investigations of MGUS and myeloma are needed
for this large- and long-followed population, especially people exposed at younger ages.

16
Acknowledgements
This study was supported by a research grant of the Ministry of Education, Culture, Sports, Science
and Technology of Japan for the Radiation Medicine Program of Nagasaki University 21st Century
Research Centers of Excellence (No. 17301, E-17, Project Grant to M. Tomonaga).
We are grateful to many hematologists of the Nagasaki University Medical Hospital and staffs at the
Health Management Center of Nagasaki Atomic Bomb Casualty Council involved in the daily
M-protein screening procedures. The sponsors had no role in the analysis, the interpretation of the
results, the preparation of the manuscripts, or the decision to submit the manuscripts for the
publication.
Authorship and Conflict of Interest Statements
M. Iwanaga was involved in the screening procedure, analyzed data, and wrote the manuscript. M.
Tagawa established and managed the screening procedure. T. Matsuo managed the screening
procedure. K. Yokota administrated and extracted data from the Data Center in the Atomic Bomb
Disease Institute. Y. Miyazaki, T. Fukushima, T. Hata, Y. Imaizumi, D. Imainishi, J. Taguchi were
responsible for the first screening procedure. S. Kamihira, S. Momita, and K. Tsukasaki were
responsible for the final diagnosis of the screening procedures. M. Tomonaga established the
screening procedure and managed the database of the Atomic bomb survivors. All authors revised
the article critically and approved the final version.
There was no conflict of interest for this study. All medical examinations for A-bomb survivors are
charge-free based on support of the medical aid by the Nagasaki City Government.

17
References
1. Kyle RA. Monoclonal gammopathy of undetermined significance: natural history in 241 cases.
Am J Med 1978; 64:814-826.
2. Kyle RA, Therneau TM, Rajkumar SV, et al. A long-term study of prognosis of monoclonal
gammopathy of undetermined significance. N Engl J Med. 2002; 346: 564-569
3. Munshi NC. Monoclonal gammopathy of undetermined significance: genetic vs environmental
etiologies. Mayo Clin Proc. 2007;82:1457-1459.
4. Landgren O, Gridley G, Turesson I, et al. Risk of monoclonal gammopathy of undetermined
significance (MGUS) and subsequent multiple myeloma among African American and white
veterans in the United States. Blood. 2006;107:904-906.
5. Alexander DD, Mink PJ, Adami HO, et al. Multiple myeloma: a review of the epidemiologic
literature. Int J Cancer. 2007;120:40-61.
6. Cardis E, Gilbert ES, Carpenter L, et al. Effects of low doses and low dose rates of external
ionizing radiation: cancer mortality among nuclear industry workers in three countries. Radiat
Res. 1995;142:117-132
7. Wing S, Richardson D, Wolf S, et al. A case control study of multiple myeloma at four nuclear
facilities. Ann Epidemiol. 2000;10:144-153.
8. Muirhead CR, Bingham D, Haylock RG, et al. Follow up of mortality and incidence of cancer
1952-98 in men from the UK who participated in the UK's atmospheric nuclear weapon tests
and experimental programmes. Occup Environ Med. 2003;60:165-172.
9. Pearce N, Prior I, Methven D, et al. Follow up of New Zealand participants in British
atmospheric nuclear weapons tests in the Pacific. BMJ. 1990; 300:1161-1166.
10. Ichimaru M, Ishimaru T, Mikami M, Matsunaga M. Multiple myeloma among atomic bomb
survivors in Hiroshima and Nagasaki, 1950-76: relationship to radiation dose absorbed by
marrow. J Natl Cancer Inst. 1982;69:323-328.
11. Preston DL, Kusumi S, Tomonaga M, et.al. Cancer incidence in atomic bomb survivors. Part
III. Leukemia, lymphoma and multiple myeloma, 1950-1987. Radiat Res. 1994; 137:S68-97
12. Pasqualetti P, Collacciani A, Casale R. Risk of monoclonal gammopathy of undetermined
significance: a case-referent study. Am J Hematol. 1996, 52:217-20.
13. Neriishi K, Nakashima E, Suzuki G. Monoclonal gammopathy of undetermined significance in
atomic bomb survivors: incidence and transformation to multiple myeloma. Brit J Haematol.

18
2003; 121: 405-410
14. Iwanaga M, Tagawa M, Tsukasaki K, Kamihira S, Tomonaga M. Prevalence of monoclonal
gammopathy of undetermined significance: study of 52,802 persons in Nagasaki City, Japan.
Mayo Clin Proc. 2007;82:1474-1479.
15. Tsukasaki K, Iwanaga M, Tomonaga M. Late hematological effects in the atomic bomb
survivors. In: Shibata S, Yamashita S, Tomonaga M. eds. Radiation Risk Perspectives.
Elsevier: Tokyo, Japan; 2007:67-72. International Congress Series 1299.
16. Mori H, Mine M, Kondo H, Okumura Y. Medical database for the atomic bomb survivors at
Nagasaki University. Acta Med Nagasaki. 1992; 37:52-65.
17. Hoshi M, Matsuura M, Hayakawa N, Ito C, Kamada N. Estimation of radiation dose for
atomic-bomb survivors in the Hiroshima University Registry. Health Phys 1996; 70: 735-740.
18. Roesch WC, Editor, US-Japan Joint Reassessment of Atomic bomb Radiation Dosimetry in
Hiroshima and Nagasaki, Final Report Vols 1 and 2, Radiation Effects Research Foundation,
Hiroshima, Japan, 1987.
19. Hayakawa N, Hoshi M, Matsuura M, et al. Comparison between DS86 and ABS93D. Studies
on radiation effects for atomic bomb survivors. Proceedings of the Cooperative Committee of
Atomic Bomb Casualties. Shigematsu group, Radiation Effects Research Foundation: 1994; pp.
119- 123.
20. Preston DL, Cullings H, Suyama A, et al. Solid cancer incidence in atomic bomb survivors
exposed in utero or as young children. J Natl Cancer Inst. 2008;100:428-36.
21. Preston DL, Shimizu Y, Pierce DA, et al. Studies of Mortality of Atomic Bomb Survivors.
Report 13: Solid Cancer and Noncancer Disease Mortality: 1950–1997. Radiat Res. 2003;
160:381-407.
22. Spiegelman D, Hertzmark, E. Easy SAS calculations for risk or prevalence ratios and
differences. American Journal of Epidemiology, 2005; 162: 199-200.
23. Petersen MR, Deddens JA. A comparison of two methods for estimating prevalence ratios.
BMC Med Res Methodol, 2008;8:9.
24. Akaike H. A new look at the statistical model identification. IEEE Trend, 1974;
AC-19:716–723
25. Pierce DA, Stram DO, Vaeth M. Allowing for random errors in radiation dose estimates for the
atomic bomb survivor data. Radiat Res. 1990;123:275-284.
26. Iwanaga M, Yoshida Y, Tagawa M, et al. Waldenström's macroglobulinemia in a 10-year stable

19
IgG monoclonal gammopathy of undetermined significance. Leuk Res. 2008 May 1, [Epub
ahead of print].
27. Nakashima M, Kondo H, Miura S, et al. Incidence of multiple primary cancers in Nagasaki
atomic bomb survivors: association with radiation exposure. Cancer Sci. 2008;99:87-92.
28. Dainiak N. Hematologic consequences of exposure to ionizing radiation. Exp Hematol 2002;
30: 513-528
29. Morgan GJ, Davies FE, Linet M. Myeloma aetiology and epidemiology. Biomed Pharmacother.
2002;56:223-234.
30. Tolley HD, Marks S, Buchanan JA, Gilbert ES. A further update of the analysis of mortality of
workers in a nuclear facility. Radiat Res. 1983;95:211-213.
31. Gilbert ES, Petersen GR, Buchanan JA. Mortality of workers at the Hanford site: 1945-1981.
Health Phys. 1989;56:11-25.
32. Gilbert ES, Omohundro E, Buchanan JA, Holter NA. Mortality of workers at the Hanford site:
1945-1986. Health Phys. 1993;64:577-590.
33. Smith PG, Douglas AJ. Mortality of workers at the Sellafield plant of British Nuclear Fuels. Br
Med J (Clin Res Ed). 1986;293:845-854.
34. Douglas AJ, Omar RZ, Smith PG. Cancer mortality and morbidity among workers at the
Sellafield plant of British Nuclear Fuels. Br J Cancer. 1994;70:1232-1243.
35. Omar RZ, Barber JA, Smith PG. Cancer mortality and morbidity among plutonium workers at
the Sellafield plant of British Nuclear Fuels. Br J Cancer. 1999;79:1288-1301.
36. Cardis E, Vrijheid M, Blettner M, et al. The 15-Country Collaborative Study of Cancer Risk
among Radiation Workers in the Nuclear Industry: estimates of radiation-related cancer risks.
Radiat Res. 2007;167:396-416.
37. Darby SC, Kendall GM, Fell TP, et al. A summary of mortality and incidence of cancer in men
from the United Kingdom who participated in the United Kingdom's atmospheric nuclear
weapon tests and experimental programmes. BMJ 1988;296:332–338.
38. Darby SC, Kendall GM, Fell TP, et al. Further follow-up of mortality and incidence of cancer
in men from the United Kingdom who participated in the United Kingdom's atmospheric
nuclear weapon tests and experimental programmes. BMJ 1993;307:1530–1535.
39. Pearce N, Winkelmann R, Kennedy J, et al. Further follow-up of New Zealand participants in
United Kingdom atmospheric nuclear weapons tests in the Pacific. Cancer Causes Control.
1997; 8: 139-145.

20
40. Watanabe KK, Kang HK, Dalager NA. Cancer mortality risk among military participants of a
1958 atmospheric nuclear weapons test. Am J Public Health. 1995;85:523-527.
41. Boice JD Jr, Morin MM, Glass AG, et al. Diagnostic X-ray procedures and risk of leukemia,
lymphoma, and multiple myeloma. JAMA. 1991;265:1290-1294.
42. Weiss HA, Darby SC, Doll R. Cancer mortality following X-ray treatment for ankylosing
spondylitis. Int J Cancer. 1994;59:327-38.
43. Darby SC, Reeves G, Key T, Doll R, Stovall M. Mortality in a cohort of women given X-ray
therapy for metropathia haemorrhagica. Int J Cancer. 1994;56:793-801.
44. Boice JD Jr, Engholm G, Kleinerman RA, et al. Radiation dose and second cancer risk in
patients treated for cancer of the cervix. Radiat Res. 1988;116:3-55.
45. Shimizu Y, Schull WJ, Kato H. Cancer risk among atomic bomb survivors. The RERF Life
Span Study. Radiation Effects Research Foundation. JAMA. 1990;264(5):601-604.
46. Cesana C, Klersy C, Barbarano L, et al. Prognostic factors for malignant transformation in
monoclonal gammopathy of undetermined significance and smoldering multiple myeloma. J
Clin Oncol. 2002;20:1625-1634.
47. Rajkumar SV, Kyle RA, Therneau TM, et al. Serum free light chain ratio is an independent risk
factor for progression in monoclonal gammopathy of undetermined significance. Blood.
2005;106:812-817.
48. Rosiñol L, Cibeira MT, Montoto S, et al. Monoclonal gammopathy of undetermined
significance: predictors of malignant transformation and recognition of an evolving type
characterized by a progressive increase in M protein size. Mayo Clin Proc. 2007;82:428-34.
49. Weiss NS, Rossing MA. Healthy screenee bias in epidemiologic studies of cancer incidence.
Epidemiology 1996;7:319–322.
50. Lorimore SA, Coates PJ, Wright EG. Radiation-induced genomic instability and bystander
effects: inter-related nontargeted effects of exposure to ionizing radiation. Oncogene.
2003;22:7058-69.
51. Kuehl WM, Bergsagel PL. Multiple myeloma: evolving genetic events and host interactions.
Nat Rev Cancer. 2002;2:175-87.
52. Seidl S, Kaufmann H, Drach J. New insights into the pathophysiology of multiple myeloma.
Lancet Oncol. 2003;4:557-64.
53. Lynch HT, Ferrara K, Barlogie B, et al. Familial myeloma. N Engl J Med. 2008 ;359:152-7.
54. Brown LM, Gridley G, Check D, Landgren O. Risk of multiple myeloma and monoclonal

21
gammopathy of undetermined significance among white and black male United States veterans
with prior autoimmune, infectious, inflammatory, and allergic disorders. Blood.
2008;111:3388-94.
55. Wright EG, Coates PJ. Untargeted effects of ionizing radiation: implications for radiation
pathology. Mutat Res. 2006;597:119-32.
22
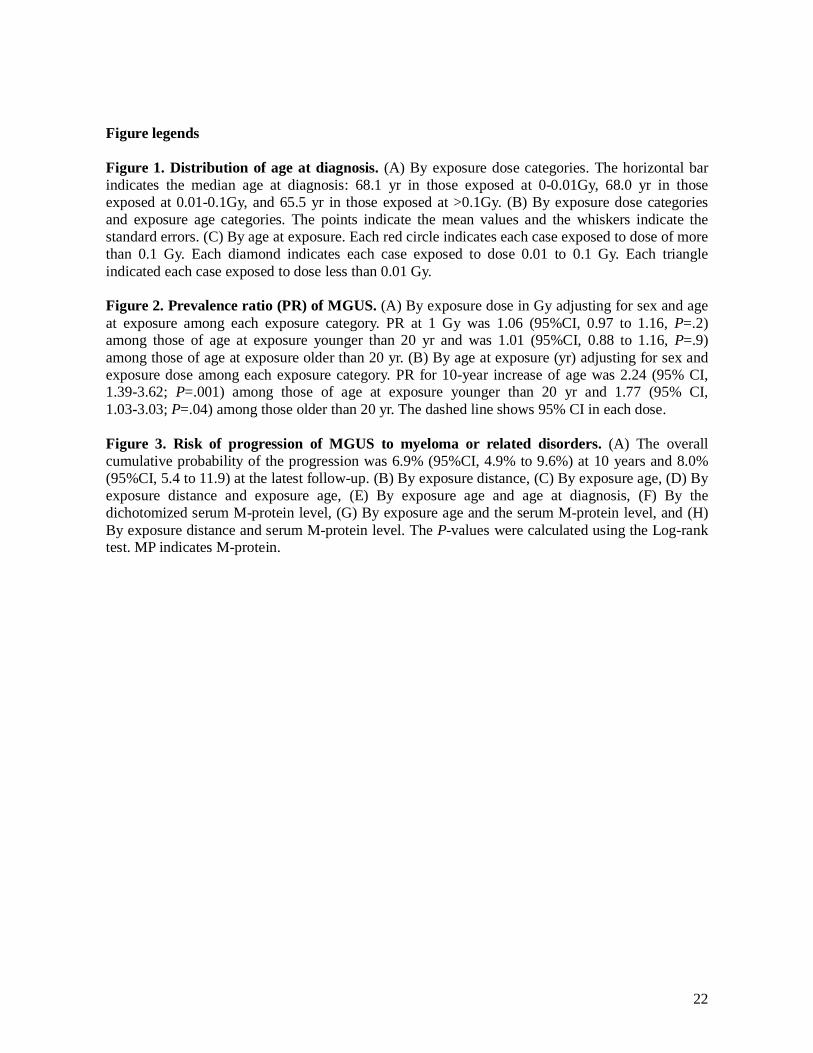
Figure legends Figure 1. Distribution of age at diagnosis. (A) By exposure dose categories. The horizontal bar indicates the median age at diagnosis: 68.1 yr in those exposed at 0-0.01Gy, 68.0 yr in those exposed at 0.01-0.1Gy, and 65.5 yr in those exposed at >0.1Gy. (B) By exposure dose categories and exposure age categories. The points indicate the mean values and the whiskers indicate the standard errors. (C) By age at exposure. Each red circle indicates each case exposed to dose of more than 0.1 Gy. Each diamond indicates each case exposed to dose 0.01 to 0.1 Gy. Each triangle indicated each case exposed to dose less than 0.01 Gy. Figure 2. Prevalence ratio (PR) of MGUS. (A) By exposure dose in Gy adjusting for sex and age at exposure among each exposure category. PR at 1 Gy was 1.06 (95%CI, 0.97 to 1.16, P=.2) among those of age at exposure younger than 20 yr and was 1.01 (95%CI, 0.88 to 1.16, P=.9) among those of age at exposure older than 20 yr. (B) By age at exposure (yr) adjusting for sex and exposure dose among each exposure category. PR for 10-year increase of age was 2.24 (95% CI, 1.39-3.62; P=.001) among those of age at exposure younger than 20 yr and 1.77 (95% CI, 1.03-3.03; P=.04) among those older than 20 yr. The dashed line shows 95% CI in each dose. Figure 3. Risk of progression of MGUS to myeloma or related disorders. (A) The overall cumulative probability of the progression was 6.9% (95%CI, 4.9% to 9.6%) at 10 years and 8.0% (95%CI, 5.4 to 11.9) at the latest follow-up. (B) By exposure distance, (C) By exposure age, (D) By exposure distance and exposure age, (E) By exposure age and age at diagnosis, (F) By the dichotomized serum M-protein level, (G) By exposure age and the serum M-protein level, and (H) By exposure distance and serum M-protein level. The P-values were calculated using the Log-rank test. MP indicates M-protein.

23
Table 1. Demographic characteristics of participants and non-participant among Nagasaki atomic bomb survivors during 1988-2004
Whole population (n=74411)
Population with ABS93D (n=6837)
Participants No. (%)
Non-participants No. (%)
Rates of participation
(%)¶
Participants No. (%)
Non-participants No. (%)
Rates of participation
(%)¶
Total 52525 21886 70.6
4758 2079 69.6
Sex Male 20450 9021 69.4 1652 794 67.5
Female 32075 12865 71.4 3106 1285 70.7
Age at exposure (yr)
< 10 16993 5522 75.5 1636 515 76.1
10 to < 20 20569 4967 80.5 1735 473 78.6
20 to <30 10554 3768 73.7 961 348 73.4
30 or older 4409 7629 36.6 426 743 36.4
Exposure status *
Directly exposed (km), all 40814 16808 70.8 4674 2079 69.2
< 1.5 2496 1035 70.7 614 277 68.9
1.5 to < 3.0 10457 4771 68.7 4055 1797 69.3
3.0 to 10 27857 11000 71.7 5 5 50.0
Unkown distance 4 2 66.7 0 0
Early entrants 9399 3713 71.7 5 0 100.0
Relief 714 940 43.2 0 0
Exposed In-Utero 885 392 69.3 79 0 100.0
Unkown 713 33 95.6 0 0
Exposed dose of ABS93D (Gy) †
Available for directly exposed, all 4674 2079 69.2
4674 2079 69.2
0 to < 0.01 1673 767 68.6
1673 767 68.6
0.01 to < 0.1 1720 734 70.1
1720 734 70.1
> 0.1 1281 578 68.9
1281 578 68.9
Available for early entrants ‡ 5 0 100.0 5 0 100.0
Available for exposed In-utero ‡ 79 0 100.0
79 0 100.0
Not available 47767 19807 70.7
* “Directly exposed” indicates those who were directly exposed to atomic radiation within 10 km from the hypocenter. "Early entrants" indicates those who entered the city within approximately 2 km from the hypocenter within two weeks of the explosion. “ Relief” indicates those who were engaged in disposal of the dead or relief works for atomic bomb victims. “Exposed In-Utero” indicate children who were exposed prenatally at the time of the bombing. † ABS93D indicates the Atomic Bomb Survivors 1993 Dose which is calculated for a limited number of Nagasaki atomic bomb survivors ‡ Some people exposed in-utero and early entrants have also ABS93D dose information, but the information was not presented in this study. ¶ Rates were calculated as the number of participants divided by the number of target population in each stratum.

24
Table 2. Clinical characteristics of MGUS patients
MGUS among all participants (n=1082)
MGUS among participants with dose (n=93)
Sex, no. (%)
Male 569 (53) 48 (52)
Female 513 (47) 45 (48)
Age at diagnosis, yr, no. (%)
< 50 25 (2) 3 (3)
50-59 166 (15) 16 (17)
60-69 407 (38) 38 (41)
70-79 349 (32) 26 (28)
>80 135 (13) 10 (11)
Median (range), yr 68.5 (45.0-100.9) 67.5 (48.2-100.9)
M-component heavy chain, no. (%)
IgG 796 (74) 75 (81)
IgA 191 (18) 16 (17)
IgM 82 (7) 1 (1)
IgD 1 (0.1) 0
Biclonal 12 (1) 1 (1)
M-component light chain, no. (%)
κ 609 (56) 52 (56)
λ 440 (41) 40 (43)
Biclonal 12 (1) 0
Not determined 21 (2) 1 (1)
Serum Monoclonal protein level, g/dL, no. (%)*
< 1.5 496 (48) 31 (34)
1.5 to < 3.0 525 (50) 60 (65)
3.0 to < 3.5 † 22 (2) 1 (1)
Median (range), g/dL 1.5 (0.1-3.4) 1.6 (0.4-3.1)
Median Serum albmin level, g/dL, (range) 4.5 (3.0-5.8) 4.5 (3.8-5.8)
Median Serum calcium level, mg/dL, (range) 9.4 (8.1-12.1) 9.3 (8.4-10.9)
Median Serum creatinin level, mg/dL, (range) 1.0 (0.5-7.5) 1.0 (0.5-2.0)
Median Hemoglobin level, g/dL, (range) 13.5 (6.7-18.2) 13.5 (8.3-17.8)
* Data from 12 cases of biclonal gammopathy were not included and 27 cases were not available for M-protein level at the first-time diagnosis but were available for data at the next follow year.
† These cases were diagnosed with MGUS in the referral hospitals based on the "recurrent" examination of immunoglobulin and the plasma cell percentage in the bone marrow.

25
Table 3. Age at diagnosis of MGUS by exposure distance, exposure dose, and age at exposure
Overall population
Distance from the hypocenter (km) Total
< 1.5 1.5 - 3.0 > 3.0
Ag
e at
exp
osu
re
(yr)
0-9 57.0 (50.3-67.1) 56.4 (47.4-67.5) 57.5 (45.0-68.0) 57.2 (45.0-68.0) 10-19 68.5 (56.0-77.5) 65.8 (56.4-75.7) 65.1 (54.8-77.8) 65.9 (54.8-77.9) 20-29 74.6 (68.3-78.5) 74.2 (64.5-86.4) 74.2 (64.5-87.4) 73.6 (63.7-87.4) > 30 86.4 (79.5-88.4) 81.3 (74.9-100.9) 81.4 (73.3-93.7) 82.1 (73.3-100.9)
All ages 69.7 (50.3-88.4) 67.5 (47.4-100.9) 67.5 (45.0-93.7) 68.5 (45.0-100.9)
Subpopulation with radiation dose
Radiation dose of ABS93D (Gy)
Total > 0.1 0.01 - 0.1 0 - 0.01
Ag
e at
exp
osu
re
(yr)
0-9 55.2 (49.7-67.1) 58.1 (48.2-64.0) 59.5 (49.3-67.5) 58.1 (48.2-67.5)
10-19 64.5 (56.0-70.7) 65.2 (58.2-73.7) 67.7 (57.4-70.5) 65.5 (56.0-73.7)
20-29 72.6 (71.1-77.1) 72.9 (67.7-79.5) 74.8 (67.4-86.4) 73.0 (67.4-86.4)
> 30 83.0 (77.3-87.5) 86.1 (74.9-91.9) 87.2 (79.9-100.9) 86.4 (74.9-100.9)
All ages 65.5 (49.7-87.5) 68.0 (48.2-91.9) 68.1 (49.3-100.9) 67.5 (48.2-100.9)
Data in each column indicates median (range) age at diagnosis in years.
ATB=at the time of the bombing; NIC=not in city at the time of the bombing.

26
Table 4. Comparison of M-protein level by sex, age at diagnosis, and exposure status*
MP < 1.5 g/dL MP > 1.5g/dL P-value†
Total 378 (48.4) 403 (51.6)
Sex
Male 195 (50.7) 190 (49.4) .21
Female 183 (46.2) 110 (27.8)
Age at exposure (yr)
0-9 83 (51.2) 79 (48.8) .004
10-19 183 (53.2) 161 (46.8)
20-29 78 (42.9) 104 (57.1)
> 30 34 (36.6) 59 (63.4)
Age at diagnosis (yr)
< 50 7 (35.0) 13 (65.0) .93
50 - 59 68 (50.8) 66 (49.2)
60 - 69 141 (47.8) 154 (52.2)
70 - 79 125 (50.8) 121 (49.2)
> 80 37 (43.0) 49 (57.0)
Exposure distance (km)
< 1.5 34 (52.3) 31 (47.7) .25
1.5 - 3.0 79 (40.5) 116 (59.5)
> 3.0 265 (50.9) 256 (49.1)
Exposure dose (Gy)
> 0.1 9 (34.6) 17 (65.4) .92
0.01 - 0.1 10 (29.4) 24 (70.6)
0 - 0.01 11 (35.5) 20 (64.5)
*Data were used for only MGUS patients with heavy chain class of A, G, and M and available for imformation of exposure distance and exposure dose.
† P-values were calculated using Chi-square test or Fisher exact test.
MP=monoclonal protein concentration
27
Table 5. Prevalence of MGUS by sex, age at exposure, and distance from the hypocenter.
Sex Male Female Total
Age at exposure (yr)
0-9 10-19 20-29 > 30 All ages
0-9 10-19 20-29 > 30 All ages
0-9 10-19 20-29 > 30 All ages
Exposure status
Directly exposed
Dis
tan
ce f
rom
the
hyp
oce
nte
r (k
m)
< 1.5
No. participants 195 522 164 97 978 225 861 363 68 1517 420 1383 527 165 2495
No. cases 7 22 4 3 36 2 21 5 2 30 9 43 9 5 66
Prevalence (%) 3.6 4.2 2.4 3.1 3.7 0.9 2.4 1.4 2.9 2.0 2.1 3.1 1.7 3.0 2.7
1.5 to < 3.0
No. participants 1452 1726 367 272 3817 1825 2411 1753 650 6639 3277 4137 2120 922 10456
No. cases 25 46 14 12 97 21 40 33 10 104 46 86 47 22 201
Prevalence (%) 1.7 2.7 3.8 4.4 2.5 1.2 1.7 1.9 1.5 1.6 1.4 2.1 2.2 2.4 1.9
> 3.0
No. participants 4639 4207 782 575 10203 5603 6231 4240 1569 17643 10242 10438 5022 2144 27846
No. cases 70 133 30 34 267 46 95 98 42 281 116 228 128 76 548
Prevalence (%) 1.5 3.2 3.8 5.9 2.6 0.8 1.5 2.3 2.7 1.6 1.1 2.2 2.6 3.5 2.0
Others *
No. participants 1419 2483 1043 497 5442 1633 2121 1835 676 6265 3052 4604 2878 1173 11707
No. cases 16 81 38 34 169 10 33 37 18 98 26 114 75 52 267
Prevalence (%) 1.1 3.3 3.6 6.8 3.1 0.6 1.6 2.0 2.7 1.6 0.9 2.5 2.6 4.4 2.3
Total
No. participants 7705 8938 2356 1441 20440 9286 11624 8191 2963 32064 16991 20562 10547 4404 52504
No. cases 118 282 86 83 569 79 189 173 72 512 197 471 259 155 1082
Prevalence (%) 1.5 3.2 3.7 5.8 2.8 0.9 1.6 2.1 2.4 1.6 1.2 2.3 2.5 3.5 2.1
*Others included survivors with unkown exposure distance, those early entered in the city, those who were engaged in disposal of the dead or in relief works for atomic bomb victims, those exposed in utero, and those with unkown exposure status.

28
Table 6 Prevalence Ratios (PRs) for MGUS in relation to sex, age at exposure, and distance from the hypocenter in
Participants with information of exposure distance
All Age at exposure < 20 yr Age at exposure > 20 yr PR (95% CI) P-value PR (95% CI) P-value PR (95% CI) P-value
Univariate analysis Sex Male 1.7 (1.5-1.9) <.0001 1.8 (1.5-2.1) <.0001 2.0 (1.5 - 2.5) <.0001 Female referent referent referent Age at exposure per yr 1.4 (1.3 - 1.5) <.0001 1.1 (1.1 - 1.1) <.0001 1.0 ( 1.0 - 1.1) 0.0013 per 5yr 1.2 (1.1 - 1.2) <.0001 1.4 (1.3 -1.5) <.0001 1.2 (1.1 - 1.3) 0.001 Age at exposure group (yr)
30 or older 2.6 (2.0-3.3) <.0001 1.3 (1.0 - 1.7) 0.02 20 to <30 2.0 (1.6-2.4) <.0001 referent 10 to < 20 1.8 (1.5-2.2) <.0001 1.8 (1.5-2.2) <.0001 < 10 referent referent Exposure distance group (km)
< 1.5 1.3 (1.0-1.7) 0.02 1.7 (1.3 - 2.3) 0.0002 0.7 (0.4 - 1.2) 0.2 1.5 to < 3.0 1.0 (0.8-1.1) 0.7 1.1 (0.9 - 1.3) 0.5 0.8 (0.6 - 1.0) 0.1 3.0 to 10.0 referent referent
Multivariate analysis * Male sex 1.9 (1.6 - 2.3) <.0001 1.9 (1.5 - 2.4) <.0001 Age at exposure per 5 yr 1.4 (1.3 - 1.5) <.0001 1.1 (1.0 - 1.2) 0.03 Exposure distance group (km)
< 1.5 1.4 (1.1 - 1.9) 0.02 0.6 (0.4 - 1.1) 0.1 1.5 to < 3.0 1.0 (0.8 - 1.2) 0.9 0.8 (0.6 - 1.0) 0.1 3.0 to 10.0 referent referent
PR = prevalence ratio; CI = confidence interval.

29
Table 7. Prevalence of MGUS by sex, age at exposure, and exposure dose by ABS93D
Sex Male Female Total
Age at exposure (yr) 0-9 10-19 20-29 > 30 All
ages
0-9 10-19 20-29 > 30 All ages
0-9 10-19 20-29 > 30 All
ages ABS93D dose (Gy)
0 to < 0.01
No. participants 238 207 57 35 537 336 382 306 111 1135 574 589 363 146 1672
No. cases 3 7 3 0 13 3 3 5 3 14 6 10 8 3 27
Prevalence (%) 1.3 3.4 5.3 0 3.7 0.9 0.8 1.6 2.7 1.2 1.1 1.7 2.2 2.1 1.6
0.01 to < 0.1
No. participants 288 245 34 40 607 336 357 292 127 1094 624 602 326 167 1719
No. cases 5 4 3 4 16 4 6 6 2 18 9 10 9 6 34
Prevalence (%) 1.7 1.6 8.8 10 2.7 1.2 1.7 2.1 1.6 1.6 1.4 1.7 2.8 3.6 2.0
> 0.1
No. participants 164 225 51 29 469 195 315 219 82 811 359 540 270 111 1280
No. cases 3 14 0 2 19 1 7 3 2 13 4 21 3 4 32
Prevalence (%) 1.8 6.2 0 6.9 4.1 0.5 2.2 1.4 2.4 1.6 1.1 3.9 1.1 3.6 2.5
Total
No. participants 690 677 142 104 1613 867 1054 817 320 3058 1557 1731 959 424 4671
No. cases 11 25 6 6 48 8 16 14 7 45 19 41 20 13 93
Prevalence (%) 1.6 3.7 4.2 5.8 3.0 0.9 1.5 1.7 2.2 1.6 1.2 2.4 2.1 3.1 2.0

30
Table 8. Prevalence Ratios (PRs) for MGUS in relation to sex, age at exposure, and radiation dose in participants with ABS93D
dose
Age at exposure < 20 yr Age at exposure > 20 yr PR (95% CI) P-value PR (95% CI) P-value
Univariate analysis Sex Male 2.11 (1.26 - 3.52) 0.0043 2.64 (1.31 -5.30) 0.0062
Female referent referent Age at exposure per 1 yr 1.08 (1.03 - 1.13) 0.002 1.07 (1.02 - 1.13) 0.01
per 5yr 1.44 (1.14 - 1.82) 0.002 1.40 (1.08 - 1.83) 0.01 ABS93D Dose per 0.1 Gy 1.02 (0.99- 1.06) 0.1 0.99 (0.63 - 1.57) 0.9
per Gy 1.25 (0.93- 1.71) 0.1 0.99 (0.63 - 1.57) 0.9 ABS93D Dose group (Gy) > 0.1 2.02 (1.09 - 3.76) 0.03 0.85 (0.33 - 2.17) 0.7
0.01 to < 0.1 1.13 (0.58- 2.18) 0.7 1.41 (0.65 - 3.04) 0.4 0 to < 0.01 referent referent
Multivariate analysis-1 Male sex 2.30 (1.38 - 3.84) 0.002 2.30 (1.13 - 4.68) 0.02 Age at exposure per 1 yr 1.49 (1.17 -1.89) 0.001 1.06 (1.00 - 1.12) 0.04 ABS93D Dose per 1 Gy 1.24 (0.90 - 1.71) 0.2 0.96 (0.59 - 1.62) 0.9 Multivariate analysis-2 Male sex 2.24 (1.34 - 3.74) 0.002 2.34 (1.15 - 4.77) 0.02 Age at exposure per 1 yr 1.08 (1.03 -1.13) 0.003 1.06 (1.00 - 1.12) 0.04 ABS93D Dose > 0.1 Gy (vs. < 0.1 Gy) 1.66 (0.99 -2.77) 0.05 0.69 (0.30 - 1.58) 0.4 PR = prevalence ratio; CI = confidence interval.

31
Table 9. Frequency of malignant progression among MGUS with information of exposure distance.
No. MGUS with Distance Information No. Progression (%) P-value*
Total 815 36 (4.4)
Sex
Male 400 14 (3.5) .21
Female 415 22 (5.3)
Age at exposure, yr
< 10 171 6 (3.5) .43
10 to < 20 357 14 (3.9)
20 to <30 184 12 (6.5)
30 or older 103 4 (3.9)
Exposure distance, km
< 1.5 66 5 (7.6) .16
1.5 - 3.0 201 10 (5.0)
3.0 - 10 548 21 (3.8)
Age at diagnosis, yr
< 59 165 7 (4.2) .11
60-69 304 21 (6.9)
>70 346 8 (2.3)
M-component heavy chain
IgG 148 29 (4.8) .77
IgA 599 5 (3.4)
IgM 61 2 (3.3)
Biclonal 7 0
Serum M-protein level, g/dL,
< 1.5 385 5 (1.3) <.0.0001
> 1.5 to less than 3.0 387 24 (6.2)
> 3.0 to less than 3.5 † 16 4 (25.0)
* P-values were calculated using Chi-square test or Fisher exact test for sex and M-compornent and using Mantel-Haenszel trend test for age at exposure, exposure distance, age at diagnosis, and aerum M-protein level.
32
Figure 1

33
Figure 2

34
Figure 3