Embed Size (px)
Citation preview

MATTSON TECHNOLOGY: INNOVATION.SPEED.SOLUTIONS
Dear Stockholders:
In 2011, the macroeconomic environment remained cautious due to natural disasters, the Europeanfinancial crises and slowing economic growth in global markets. Despite these uncertainties, MattsonTechnology leveraged the momentum that we built over the past year and again outpaced the industry. Oursignificant accomplishments in 2011 included:
2011 HIGHLIGHTS
• We ended 2011 with 34% growth over 2010 while the industry only grew by 10% during the sametime period.
• We secured seven new positions at four companies in the logic, foundry, NAND flash and CMOSimage sensors (CIS) segments.
• Etch systems net sales grew 77% year over year, and etch products now comprise over 30 percent ofsystems sales.
GROWTH STRATEGIESIn 2011, we solidified our new product positions and expanded our estimated served available market(SAM) to over $2.5 billion. Our etch, strip and RTP products are now engaged at advanced technologynodes in the NAND, foundry, DRAM, CIS and packaging areas. With the leading-edge positions that webuilt over the last year, Mattson Technology is now well prepared for the industry’s 450-millimetertransition and the continued progression under Moore’s Law. With our expanded product portfolio, we arepoised to leverage our technology investments to grow revenues and long-term value for all of ourstakeholders.
ETCH DRIVES SAM GROWTHIn 2011, we grew etch 77% over 2010, and etch now contributes over a third of our total revenue. Wecontinued to book and ship significant numbers of etch tools, further extending into new applications. Weshipped volume orders of the new paradigmE Si for silicon etch applications, which increased our etchSAM by over 25%. We also announced our first paradigmE shipment to a CMOS image sensor customerfor advanced etching of the microlens. This marked the fifth customer to which we have shipped our etchproducts. Etch has a broadened market coverage and is now established in the DRAM, NAND, foundryand CIS areas.
RAPID THERMAL PROCESSING (RTP) FURTHER EXTENDS INTO LOGIC AND FOUNDRYWe expanded our RTP business from a DRAM-centric customer base, and now over 70% of our businesshas shifted to NAND and foundry, where these areas were previously less than 10% of our RTP business.Our Helios XP system gained acceptance and is currently in production at three foundries at leading-edgetechnology nodes. We also made substantial progress in the millisecond anneal (MSA) area, with ourMillios system winning head-to-head competitions for the most advanced geometries at 20X nanometerand below. The Millios is now established at three different foundry/logic customers. We expect revenue toramp from these new positions as we move through 2012 and beyond.
DRY PHOTORESIST STRIP LEADS MARKET IN TECHNOLOGY AND COOWe demonstrated strong market share increases in strip, growing 79% year over year. The SUPREMA isone of the most flexible strip tools for our customers and has contributed to greater than 75% growth in2011 over 2010. Our strip products are engaged in standard strip, high-k metal gate cleaning and advancedhigh-dose implant strip (HDIS) applications at the leading-edge production lines throughout the world.Our strip tools gained share at key DRAM, NAND and logic at customers. We now have the broadest stripinstalled base and are well positioned to secure the number one position in this market with our system’sleading-edge technology and unparalleled cost-of-ownership.
3APR200800223284
21MAR201214384924
LOOKING AHEADOver the last year, we ramped our etch volume on positions that we gained in 2010 and won new positionsin foundry for our Helios XP and Millios thermal systems. We also significantly grew our strip businessabove the industry growth rate for a second consecutive year. We enter 2012 more diversified than everbefore, with a multi-product foundation established across foundry, NAND and DRAM. The growthinvestments we made will start to deliver returns as we move through 2012, and we expect to expand ourrevenue base at these new customer positions.
We thank our
• hard-working and talented employees for their efforts and their commitment to the company, and
• customers, stockholders, and suppliers for their continued trust, confidence and support during thepast year.
We look forward to sharing our progress and successes in 2012.
Sincerely,
David Dutton J. Michael DodsonPresident and Chief Financial Officer, Executive Vice PresidentChief Executive Officer and Secretary
‘‘Safe Harbor’’ Statement Under Private Securities Litigation Reform Act of 1995: This letter tostockholders contains forward-looking statements regarding, among other matters, trends in our markets,the size of our available market, and our future financial performance. Forward-looking statementsaddress matters that are subject to a number of risks and uncertainties that could cause actual results todiffer materially from those anticipated. Our most recent Annual Report on Form 10-K, and other filingswith the Securities and Exchange Commission, include further discussion of risks and uncertaintiesregarding our business. The Company assumes no obligation to update the information provided in thisletter.
7APR201121153036
UNITED STATES SECURITIES AND EXCHANGE COMMISSIONWashington, D.C. 20549
FORM 10-K� ANNUAL REPORT PURSUANT TO SECTION 13 OR 15(d) OF THE SECURITIES EXCHANGE ACT OF 1934
FOR THE FISCAL YEAR ENDED DECEMBER 31, 2011
or
� TRANSITION REPORT PURSUANT TO SECTION 13 OR 15(d) OF THE SECURITIES EXCHANGE ACT OF 1934
For the transition period from to
Commission file number 000-24838
MATTSON TECHNOLOGY, INC.(Exact Name of Registrant as Specified in Its Charter)
Delaware 77-0208119(State or Other Jurisdiction of Incorporation or Organization) (I.R.S. Employer Identification Number)
47131 Bayside Parkway, Fremont, California 94538(Address of Principal Executive Offices, Zip Code)
(510) 657-5900(Registrant’s Telephone Number, Including Area Code)
Securities registered pursuant to Section 12(b) of the Act:
Title of each class Name of each exchange on which registered
Common Stock, $.001 Par Value NASDAQ Global Select MarketPreferred Share Purchase Rights
Securities registered pursuant to Section 12(g) of the Act: None
Indicate by check mark if the registrant is a well-known seasoned issuer, as defined in Rule 405 of the Securities Act.Yes � No �
Indicate by check mark if the registrant is not required to file reports pursuant to Section 13 or Section 15(d) of the Act.Yes � No �
Indicate by check mark whether the registrant (1) has filed all reports required to be filed by Section 13 or 15 (d) of theSecurities Exchange Act of 1934 during the preceding 12 months (or for such shorter period that the registrant was requiredto file reports), and (2) has been subject to such filing requirements for the past 90 days. Yes � No �
Indicate by check mark whether the registrant has submitted electronically and posted on its corporate Web site, if any,every Interactive Data File required to be submitted and posted pursuant to Rule 405 of Regulation S-T (§232.405 of thischapter) during the preceding 12 months (or for such shorter period that the registrant was required to submit and post suchfiles). Yes � No �
Indicate by check mark if disclosure of delinquent filers pursuant to Item 405 of Regulation S-K (§229.405 of thischapter) is not contained herein, and will not be contained, to the best of registrant’s knowledge, in definitive proxy orinformation statements incorporated by reference in Part III of this Form 10-K or any amendment to this Form 10-K. �
Indicate by check mark whether the registrant is a large accelerated filer, an accelerated filer, a non-accelerated filer ora smaller reporting company. See definitions of ‘‘large accelerated filer,’’ ‘‘accelerated filer’’ and ‘‘smaller reportingcompany’’ in Rule 12b-2 of the Exchange Act. (Check one):
Large accelerated filer � Accelerated filer � Non-accelerated filer � Smaller reporting company �
Indicate by check mark whether the registrant is a shell company (as defined in Rule 12b-2 of the Exchange Act).Yes � No �
The aggregate market value of the registrant’s common stock held by non-affiliates of the registrant as of July 3, 2011was approximately $114.4 million based on the closing price for the registrant’s common stock reported by the NASDAQGlobal Select Market on that date ($1.97 per share). For purposes of this disclosure, shares of common stock held by officersand directors of the registrant and persons that may be deemed affiliates under the Act have been excluded. Thisdetermination of affiliate status is not necessarily a conclusive determination for other purposes.
As of February 13, 2012, there were 58,431,837 shares of common stock outstanding.
Documents incorporated by reference: Portions of the Proxy Statement for registrant’s Annual Meeting of Stockholdersto be held in 2012, which will be filed on or before April 20, 2012, are incorporated herein by reference into Part III.
MATTSON TECHNOLOGY, INC.
FORM 10-K
FOR THE YEAR ENDED DECEMBER 31, 2011
TABLE OF CONTENTS
Page
PART I
Item 1. Business . . . . . . . . . . . . . . . . . . . . . . . . . . . . . . . . . . . . . . . . . . . . . . . . . . . . . . 2Item 1A. Risk Factors . . . . . . . . . . . . . . . . . . . . . . . . . . . . . . . . . . . . . . . . . . . . . . . . . . . 11Item 1B. Unresolved Staff Comments . . . . . . . . . . . . . . . . . . . . . . . . . . . . . . . . . . . . . . . . 23Item 2. Properties . . . . . . . . . . . . . . . . . . . . . . . . . . . . . . . . . . . . . . . . . . . . . . . . . . . . . 23Item 3. Legal Proceedings . . . . . . . . . . . . . . . . . . . . . . . . . . . . . . . . . . . . . . . . . . . . . . . 23Item 4. Mine Safety Disclosures . . . . . . . . . . . . . . . . . . . . . . . . . . . . . . . . . . . . . . . . . . . 24
PART II
Item 5. Market for Registrant’s Common Equity, Related Stockholder Matters and IssuerPurchases of Equity Securities . . . . . . . . . . . . . . . . . . . . . . . . . . . . . . . . . . . . . 25
Item 6. Selected Financial Data . . . . . . . . . . . . . . . . . . . . . . . . . . . . . . . . . . . . . . . . . . . 27Item 7. Management’s Discussion and Analysis of Financial Condition and Results of
Operations . . . . . . . . . . . . . . . . . . . . . . . . . . . . . . . . . . . . . . . . . . . . . . . . . . . 28Item 7A. Quantitative and Qualitative Disclosures about Market Risk . . . . . . . . . . . . . . . . . 40Item 8. Financial Statements and Supplementary Data . . . . . . . . . . . . . . . . . . . . . . . . . . . 42Item 9. Changes in and Disagreements with Accountants on Accounting and Financial
Disclosure . . . . . . . . . . . . . . . . . . . . . . . . . . . . . . . . . . . . . . . . . . . . . . . . . . . 73Item 9A. Controls and Procedures . . . . . . . . . . . . . . . . . . . . . . . . . . . . . . . . . . . . . . . . . . 73Item 9B. Other Information . . . . . . . . . . . . . . . . . . . . . . . . . . . . . . . . . . . . . . . . . . . . . . . 74
PART III
Item 10. Directors, Executive Officers and Corporate Governance . . . . . . . . . . . . . . . . . . . 74Item 11. Executive Compensation . . . . . . . . . . . . . . . . . . . . . . . . . . . . . . . . . . . . . . . . . . 74Item 12. Security Ownership of Certain Beneficial Owners and Management and Related
Stockholder Matters . . . . . . . . . . . . . . . . . . . . . . . . . . . . . . . . . . . . . . . . . . . . 74Item 13. Certain Relationships and Related Transactions, and Director Independence . . . . . 74Item 14. Principal Accountant Fees and Services . . . . . . . . . . . . . . . . . . . . . . . . . . . . . . . . 74
PART IV
Item 15. Exhibits and Financial Statement Schedules . . . . . . . . . . . . . . . . . . . . . . . . . . . . . 75Signatures . . . . . . . . . . . . . . . . . . . . . . . . . . . . . . . . . . . . . . . . . . . . . . . . . . . . . 78
Schedule II. Valuation and Qualifying Accounts . . . . . . . . . . . . . . . . . . . . . . . . . . . . . . . . . . . 79
1
FORWARD-LOOKING STATEMENTS
This Annual Report on Form 10-K contains forward-looking statements made pursuant to the provisionsof Section 21E of the Securities Exchange Act of 1934. These forward-looking statements are based onmanagement’s current expectations and beliefs, including estimates and projections about our industry.Forward-looking statements may be identified by use of terms such as ‘‘anticipates,’’ ‘‘expects,’’ ‘‘intends,’’‘‘plans,’’ ‘‘seeks,’’ ‘‘estimates,’’ ‘‘believes’’ and similar expressions, although some forward-looking statementsare expressed differently. Forward-looking statements include, but are not limited to, statements concerning ourfinancial position, business strategy and plans, objectives for future operations, the impact of macroeconomicand industry specific conditions on our business, customer demand and future sales levels, cost controlmeasures such as outsourcing, customer adoption of new products and technologies, inventory levels,international operations, research and development initiatives, other product investment initiatives, workingcapital requirements or future cash flows. These statements are not guarantees of future performance and aresubject to certain risks, uncertainties and assumptions that are difficult to predict and may cause actual resultsto differ materially from the forward-looking statements and from management’s current expectations. Suchrisks and uncertainties include those set forth in Item 1A. ‘‘Risk Factors’’ in this Annual Report on Form 10-K.The forward-looking statements in this report speak only as of the time they are made and do not necessarilyreflect our outlook at any other point in time. We undertake no obligation to update publicly any forward-looking statements, whether as a result of new information, future events or for any other reason. However,readers should carefully review the risk factors set forth in other reports or documents we file from time to timewith the Securities and Exchange Commission.
As used herein, ‘‘Mattson Technology,’’ the ‘‘Company,’’ ‘‘we,’’ ‘‘our,’’ and similar terms include MattsonTechnology, Inc. and its subsidiaries, unless the context indicates otherwise.
PART I
Item 1. Business
Overview of Mattson Technology
We design, manufacture, market and globally support semiconductor wafer processing equipmentused in the fabrication of integrated circuits (ICs or chips). We are a key supplier of dry strip, rapidthermal processing (RTP) and etch equipment to the global semiconductor industry. Our manufacturingequipment utilizes innovative technology to deliver advanced processing capabilities and high productivityfor the fabrication of current and next-generation ICs.
Through strategic investments in the etch market and continued focus on the dry strip and RTPmarkets, we are now in an arena with a predicted total available market (TAM) of $5.3 billion in 2011,based on market research data obtained from Gartner(1), a market research firm. In 2011, our newpositions in etch and foundry RTP, added to our broad strip base, expanded our available market, and wehave transitioned from productivity-driven into more technology-driven markets. Our etch products targetthe stringent requirements of advanced dielectric and silicon etch, as well as packaging applications. In2011, we launched the paradigmE Si for silicon etch applications, and we now serve the growing silicon etchmarket. Our etch applications portfolio has helped our etch business grow and now contributes to overone-third of our total system revenue, as customers select our etch tools based on their processperformance and cost of ownership.
Our customer base includes foundries, memory and logic device manufacturers. We have a globalsales and support organization focused on developing strong, long-term customer relationships. We havedesign and manufacturing centers in the United States, Germany and South Korea. Our customer sales
(1) Forecast: Semiconductor Manufacturing Equipment, Worldwide, 4Q11 Update Report issued inDecember 2011.
2
and support teams are located in China, Germany, Japan, South Korea, Singapore, Taiwan and the UnitedStates.
We were incorporated in California in 1988 and reincorporated in Delaware in 1997. Our principalexecutive office is located at 47131 Bayside Parkway, Fremont, CA 94538. Our telephone number is(510) 657-5900. Additional information about us is available on our website at http://www.mattson.com.The information on our website is not incorporated herein by reference.
Industry Background
The manufacture of ICs is a highly complex process with hundreds of individual processing steps,many of which are performed multiple times before manufacturing is complete and the IC is fullyfunctional. To build an IC, transistors are first created on the surface of the silicon wafer, and then thetransistors are microscopically wired together by means of interconnect metal layers. The steps require thewafer to be subjected to a tightly controlled series of chemical, thermal and photolithographic processes,resulting in the formation of millions, and in some cases billions, of transistors per IC and thousands of ICson a single wafer.
Over the last four decades, the semiconductor industry has been able to uphold Moore’s Law, whichpostulates that the number of transistors on a chip doubles approximately every 18 to 24 months. Theprocess of reducing feature sizes will continue as the demand for smaller and faster electronic devicesincreases. Producing smaller features cost-effectively, while avoiding functional restrictions, requires theintroduction and use of new materials and technologies. Industry transitions to larger wafer diameters aredesigned to enable more efficient production and higher yield, with the industry currently manufacturingits latest devices on 300 millimeter (mm) wafers, which it transitioned to during the last decade. Theindustry is now preparing for the transition to 450 mm wafers, and in 2011, several of the industry’s largestcompanies announced 450 mm programs. Consortiums such as IMEC and ISMI have well-establishedprograms focused on the challenges posed by manufacturing with 450 mm wafers, and in September 2011,the Global 450 Consortium was formed at the University of Albany’s College of Nanoscale Science andEngineering to deploy 450 mm wafer tools and process capabilities. The 450 mm transition should enablethe Moore’s law curve development roadmap, a potential 30 percent lower die cost advantage and moreefficient manufacturing tool platforms.
These developments increase manufacturing complexity and create the need for manufacturingequipment with more precise process control capability, increased reliability, low defect rates and highproductivity. The increased difficulty of achieving transistor performance at advanced nodes has made highyields important in selecting process equipment. Semiconductor manufacturers demand systems that canachieve consistent, reliable and repeatable process results within critical tolerance limits while stillachieving desired throughput rates.
Consumer Electronics Driving Industry Growth
As computing and communications become ubiquitous, we are entering the fifth major technologycycle of the past half-century, the Mobile Internet Computing Era, where people, devices, and vehicles areconnected at all times and Internet access capability is being embedded in billions of wireless devices suchas PDAs, cellular phones, and computers embedded in vehicles (e.g. navigational systems in cars). Thecontent on the Internet continues to grow at an astounding pace. By extending the Internet through mobileinformation access, the Mobile Internet is on a trajectory to offer all of the same features and valuepropositions as the traditional Internet, with the potential of greater information access opportunities andbroader device-spanning Internet services and experiences, as a result of continuous availability andlocation awareness. Today’s mobile market is an era of ‘convergence’, gradually integrating computer,telecommunications, home appliances and broadcasting.
3
Mobile Internet usage is also ramping up faster than desktop Internet usage with smartphone andtablet devices leading this trend with billions of applications downloaded by consumers. Helping to drivethis increase is improved wireless 3G and 4G technology and cloud computing.
This trend toward increased mobile Internet usage places demands on cloud computing or ‘‘virtual’’networks that deliver convenient, on-demand common business applications and hosted services over theInternet to meet consumers’ computing needs. Cloud computing services have shown significant growth,with innovations making business and consumer applications even more mobile and collaborative.Applications in smartphones and tablet PCs are expected to continue to drive increased mobile DRAMdemand in the coming years.
The Mobile Internet Era shifts the fundamental IC demand from the PC era. In the PC era, the logicprocessor demand was driven by the complex instruction set computer (CISC) microprocessor while themobility products are served better with the reduced instruction set computer (RISC) microprocessorwhich allows for the lower power and streamlined operating system required to deliver the long battery lifeand fast application switching on today’s mobile products. At the memory level, the mobility era requiresNAND for long-term file storage, compared with the DRAM-based short-term memory required on a PC.Combining the computing power with wireless capability and touch-screen interfaces adds additionalchipsets that are more reliant on semiconductor foundry manufacturing. The industry still expects that PCInternet connectivity will continue to grow from today’s levels and that the mobility era chip requirementswill incrementally increase demand, place more emphasis on the foundry manufacturers and require afurther NAND capacity expansion.
We have prepared for this shift, with concerted efforts to build upon our existing dry strip positions inNAND flash and foundry, by expanding our etch and RTP products into these NAND flash and foundrycustomer accounts. During 2011, we established new product positions at several NAND flash and foundrycustomers. The successful transition of these product positions to high-volume production is expected tohelp drive incremental revenue gains for us as the Mobile Internet Era unfolds.
Our Strategy
Our business objective is to grow to a sustainable critical mass. Scale is required to deliver full supportto the global semiconductor industry while maintaining development for Moore’s Law and wafer sizetransitions. We expanded our served available market and are committed to:
• driving share gains in each of our existing market sectors; and
• leveraging our current technology capabilities to expand into new market sectors.
Our core competency is the ability to deliver leading-edge technical wafer processing at leadingproductivity levels to provide our customers with the most cost-effective manufacturing. Our tools areselected at the leading technology areas and in full production at advanced semiconductor manufacturing,including DRAM and NAND flash memory, logic and foundry sectors.
Semiconductor manufacturers demand processes that deliver results with an unprecedented level ofprecision. We work closely with our customers, supply chain vendors and technology partners to deliver onthese demands. An important element of our growth strategy is our commitment to technology leadershipin the markets we serve. We plan to extend our market and technology leadership by developing robustprocessing solutions that provide semiconductor manufacturers with technology, productivity and total costof ownership advantages. Investments in research and development have enabled us to make processimprovements and product innovations that we believe are ahead of current device requirements. Webelieve that our focus on delivering advanced technologies and increasing customer value will enable us toincrease our competitive advantage, expand our share in existing markets and penetrate new markets.
4
Markets, Applications and Products
Dry Strip
The manufacturing of an IC consists of building approximately 30 layers of alternating conducting andinsulating films on a silicon substrate wafer. Each layer is patterned according to the chip design.Photoresist stripping, or simply ‘‘resist stripping’’, is the removal of the photoresist masking layers from thewafer once the patterning process has been completed at each of the 30 layers. The objective is toeliminate the photoresist material from the wafer as quickly as possible, without allowing any surfacematerials to become etched. The need for dry strip across the entire wafer process requires a supplier todeliver very high-throughput, low-cost systems while delivering a strong technical solution. The 2011 drystrip market size was approximately $220 million according to Gartner in its December 2011 marketresearch report.
We are a leader in the dry strip market. Our SUPREMA strip system utilizes an innovative waferhandling architecture to deliver productivity and reliability with exceptionally low cost of ownership formanufacturing at the 65 nanometer (nm) node and below. The SUPREMA features our patented Faraday-Shielded inductively coupled plasma (ICP) technology that offers superior resist strip capability to leadingedge memory, logic and foundry customers. The SUPREMA has been installed at many of the globalsemiconductor companies for production and process development at advanced nodes.
Rapid Thermal Processing
Rapid thermal processing (RTP) refers to a semiconductor manufacturing process that heats siliconwafers to high temperatures (up to 1200�C or greater) using high intensity lamps on a timescale of severalseconds or less to set the electrical properties of the semiconductor and anneal any material defects. RTPconsists of heating a single wafer at a time in order to affect its electrical properties. The single-waferapproach allows for faster wafer processing with shorter annealing times from less than one second tothree minutes, and more precise control of the annealing profile and process parameters on the wafer. TheRTP market that we serve was estimated to be $494 million in 2011, based on Gartner’s market researchreport issued in December 2011.
As feature sizes become smaller and wafer uniformity demands become more stringent, there is anincreased demand from rapid thermal equipment manufacturers to improve control, uniformity andrepeatability of processes on wafers. Our RTP products feature dual-sided, lamp-based heating technologythat provides enhanced process uniformity and repeatability with precise process control for chipmanufacturing. Our products include the Helios and Helios XP systems for conventional annealingapplications and the Millios system for millisecond anneal applications (MSA).
Our Helios and Helios XP systems are in volume production at major memory customer sites. Thestrategy to expand beyond the memory market progressed further in 2011 with the Helios XP. Whileextending the capabilities in the DRAM and NAND memory segment, the Helios XP system’stemperature control architecture specifically aims at addressing advanced logic processing requirements,through its differentiated capabilities, including its low-temperature capability for advanced nickel silicide(NiSi) formation and high temperature pattern independent processing. In 2011, three major logic andfoundry customers purchased and accepted the Helios XP evaluation systems. Two of the customers aretransferring the system into current production while a third customer accepted the system as ‘process toolof record’ for the advanced 20 nm technology node and is slating pilot production starting in 2012. A followon order was shipped into a customer’s second production site and is expected to generate revenue in 2012.
Millios, which features a patented arc lamp technology capable of greatly reducing thermal cycle time,is designed to enable our customers to meet advanced gate anneal and activation process requirements atthe 32 nm technology node and beyond. This type of annealing, MSA, is needed in a few key processes inmost advanced technology nodes where the high temperature exposure requires less than one of a half
5
second. The capability to control anneal times in the millisecond time regime, has enabled one leadinglogic customer to significantly improve transistor performance in the 20 nm technology node. In 2011, ourMillios tool was sold to a leading logic customer’s research facility as one of the development systems toenable advanced process technologies. The Millios is valued as the enabling technology to advance 20 nmtransistor performance of major logic manufacturers.
Etch
Etching is the process of removing any deposited materials or layers from the wafer’s surface to createthe desired pattern on the wafer’s surface. Plasma etching is one type of dry etching, using plasma toproduce chemically reactive species from various gases. The reactive gases are exposed to the wafer surfaceand react with the material to be etched. Our etch products feature a proprietary Faraday-shielded ICPcombined with selectable etch bias control to provide excellent process on-wafer performance. Our etchproducts, the paradigmE and Alpine, are built on our high-throughput platform to provide lowcost-of-ownership. The etch market size was approximately $4.6 billion in 2011 according to Gartner in itsmarket research report issued in December 2011, of which we currently serve an estimated $1.7 billion ofthe market.
In 2011, we entered the year with the paradigmE solidly established in the DRAM market andexpanded into the NAND flash and logic/foundry market. We shipped paradigmE for dielectric and siliconetch applications to major DRAM and NAND flash fabs, where they are in volume production. Inaddition, at the close of 2011, our paradigmE was selected for applications in complementary metal-oxidesemiconductor (CMOS) Imaging Sensor manufacturing. This is part of our long-term vision to aggressivelyexpand the served available market for our etch products. In 2012, we expect to further broaden ourapplication and customer base in the etch market.
Research, Development and Engineering
The semiconductor equipment industry is characterized by rapid technological change and productinnovation. To be successful and competitive we continuously and aggressively develop more advancedprocess and process integration solutions for our customers. The products that we develop and marketallow our customers to address their advanced requirements. Only by continuously striving to develop newintellectual property (IP) for processes and hardware can we maintain and advance our competitiveposition in the markets we serve. Accordingly, we devote a significant portion of our resources to research,development and engineering programs. We seek to maintain close relationships with our global customersand to remain responsive to their product and processing needs.
Our achievements in research, development and engineering in 2011 were in the following:
• Solidly establishing the paradigmE in the DRAM market and developing new applications for itsexpansion into the NAND flash and logic/foundry market
• Expanding paradigmE’s application space into the polysilicon market
• Releasing our paradigmE for applications in CMOS Imaging Sensor manufacturing
• Achieving enhancements to the Helios XP, a RTP system designed to meet demands of high-volumeproduction at 4X and 3X nm nodes, as well as development at 2X nm node and beyond
• Developing new capabilities in our Millios MSA system for advanced logic device requirementsbeyond the 20 nm node
• Continuing improvement of our SUPREMA series strip systems to remove photoresist over newmaterials for semiconductor processing below 20 nm
6
• Initiating activities in plasma chamber and source design for stripping and etching, plus activities forthe process chamber in RTP, for upcoming 450 mm industry transition
In plasma etch, we introduced the paradigmE 300 mm reactive ion etch (RIE) for advanced siliconetch applications. During the year, we worked to extend the features and capabilities of our etch offeringand expand the system’s etch applications portfolio to include a new set of processes. The tool is nowestablished at foundry and logic customers and is in volume production at major DRAM and NAND flashfabs. In addition, the paradigmE is enabling development and manufacturing of next generation CMOSImaging Sensor manufacturing.
We continued to extend the capability of our latest-generation RTP tools for 3X and 2X nmtechnology requirements and improved our tool reliability and productivity to help reduce our customers’cost of ownership. For Helios XP, we successfully engineered capabilities for more precise temperaturemeasurement, as well as for low temperature processing. We have also developed and introduced theDifferential Energy Control (DEC) capability to specifically address the pattern loading effect for patternindependent processing, an increasing problem below 40 nm logic processing. These innovativeengineering improvements enable the formation of silicides and ultra-shallow junction (USJ) for the mostadvanced devices. In 2011, the Helios XP completed qualification for 20 nm node at advanced researchand development facilities of our memory and foundry customers.
In 2011, we continued to work closely with a leading device manufacturer to demonstrate Millios’process and manufacturing advantages. Based on the system’s proven high throughput, stability andreliability, this customer has qualified the Millios for its volume production facilities. In addition, a majorfoundry is now using the Millios system for its 20 nm logic process development. We are working withseveral other key customers to enable advanced process solutions, such as high-k metal gate (HKMG)transistors and precise NiSi formation.
Our SUPREMA strip system incorporates our ICP photoresist process module and an innovativevacuum-based, high-productivity platform that we expect will set new standards for technology and cost ofownership in the industry. Our Faraday-Shielded ICP source technology coupled with the advancedvacuum-based platform is becoming a requirement for processing of sub 30 nm devices. In response to theindustry’s continued demand for higher productivity, we continued to improve the throughput of ourSUPREMA during the year.
In 2012, we intend to continue to make investments in strategic development and engineeringprograms to meet our customers’ technical and production requirements. Over the next year, we intend tofocus our research, development and engineering efforts on improving existing system capabilities,developing new advanced strip, RTP and etch processes for smaller feature sizes, as well as continueddevelopment and commercialization of new products in etch and millisecond anneal.
We maintain applications development and engineering laboratories in California, Canada, andGermany to address new tool and process development activities and customer specific requirements. Ourresearch, development and engineering expenses were $26.2 million in 2011, $27.8 million in 2010 and$25.3 million in 2009, representing as a percentage of net sales 14 percent, 20 percent and 59 percent,respectively.
Intellectual Property
We rely on a combination of patent, copyright, trademark and trade secret laws, non-disclosureagreements and other IP protection methods to protect our proprietary technology. We hold a number ofU.S. patents and corresponding foreign patents, and have a number of patent applications pendingcovering various aspects of our products and processes. We also have licensed a small number of patentsand where appropriate, we intend to file additional patent applications on inventions resulting from our
7
ongoing research, development and engineering activities to grow and strengthen all of our individualproduct IP portfolios.
As is customary in our industry, from time to time we receive or make inquiries regarding possibleinfringement of patents or other IP rights. Although there are no pending claims against us regardinginfringement of any existing patents or other IP rights or any unresolved notices that we are infringing IPrights of others, such infringement claims could be asserted against us, or our suppliers, by third parties inthe future. Any claims, with or without merit, could be time-consuming, result in costly litigation, result inloss or cancellation of customer orders, cause product shipment delays, subject us to significant liabilitiesto third parties, require us to enter into royalty or licensing agreements or prevent us from manufacturingand selling our products. If our products were found to infringe a third party’s proprietary rights, we couldbe required to enter into royalty or licensing agreements in order to continue to sell our products. Royaltyor licensing agreements, if required, may not be available on terms acceptable to us, if at all, which couldseriously harm our business. Our involvement in any patent or other IP dispute or action to protect tradesecrets and know-how could have a material adverse effect on our business.
Competition
The global semiconductor equipment industry is intensely competitive and is characterized by rapidtechnological change and demanding customer service requirements. Our ability to compete depends uponour ability to continually improve products, processes and services, and our ability to develop new productsthat meet constantly evolving customer requirements.
Substantial capital investments are required by semiconductor manufacturers to install and integratenew processing equipment into a semiconductor production line. As a result, once a semiconductormanufacturer has selected a particular supplier’s products, the manufacturer often relies upon thatequipment for the specific production line application, and frequently will attempt to consolidate its othercapital equipment requirements with the same supplier. Accordingly, it is difficult for a competitor to sellto a customer for a significant period of time in the event a customer has selected our product. It may alsobe difficult to replace an existing relationship that a potential customer has with a competitor.
Each of our product lines competes in markets defined by the particular IC fabrication process itperforms. In each of these markets, we have multiple competitors. At present, however, no singlecompetitor competes with us in all of the process areas in which we serve. Competitors in a giventechnology tend to have different degrees of market presence in the various regional geographic markets.Competition is based on many factors, primarily technological innovation; productivity; total cost ofownership of the systems, including yield, price, product performance and throughput capability; quality;contamination control; reliability and customer support. We believe that our competitive position in eachof our markets is based on the ability of our products and services to address customer requirementsrelated to these competitive factors.
Our principal competitors in the dry strip market include Axcelis Technologies, Novellus Systems andPSK. Principal competitors for our thermal annealing systems are Applied Materials, Dainippon ScreenManufacturing and Ultratech. Principal competitors for our etch systems include Applied Materials, LamResearch and Tokyo Electron.
8
Customers
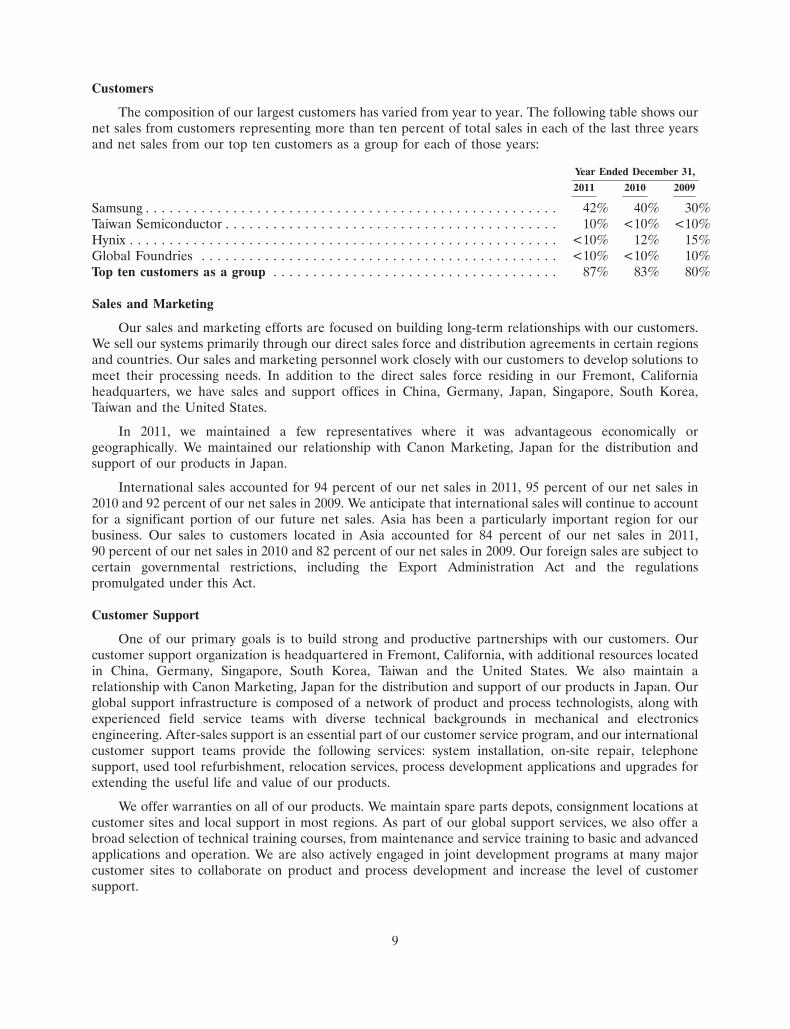
The composition of our largest customers has varied from year to year. The following table shows ournet sales from customers representing more than ten percent of total sales in each of the last three yearsand net sales from our top ten customers as a group for each of those years:
Year Ended December 31,
2011 2010 2009
Samsung . . . . . . . . . . . . . . . . . . . . . . . . . . . . . . . . . . . . . . . . . . . . . . . . . . . . 42% 40% 30%Taiwan Semiconductor . . . . . . . . . . . . . . . . . . . . . . . . . . . . . . . . . . . . . . . . . . 10% <10% <10%Hynix . . . . . . . . . . . . . . . . . . . . . . . . . . . . . . . . . . . . . . . . . . . . . . . . . . . . . . <10% 12% 15%Global Foundries . . . . . . . . . . . . . . . . . . . . . . . . . . . . . . . . . . . . . . . . . . . . . <10% <10% 10%Top ten customers as a group . . . . . . . . . . . . . . . . . . . . . . . . . . . . . . . . . . . . 87% 83% 80%
Sales and Marketing
Our sales and marketing efforts are focused on building long-term relationships with our customers.We sell our systems primarily through our direct sales force and distribution agreements in certain regionsand countries. Our sales and marketing personnel work closely with our customers to develop solutions tomeet their processing needs. In addition to the direct sales force residing in our Fremont, Californiaheadquarters, we have sales and support offices in China, Germany, Japan, Singapore, South Korea,Taiwan and the United States.
In 2011, we maintained a few representatives where it was advantageous economically orgeographically. We maintained our relationship with Canon Marketing, Japan for the distribution andsupport of our products in Japan.
International sales accounted for 94 percent of our net sales in 2011, 95 percent of our net sales in2010 and 92 percent of our net sales in 2009. We anticipate that international sales will continue to accountfor a significant portion of our future net sales. Asia has been a particularly important region for ourbusiness. Our sales to customers located in Asia accounted for 84 percent of our net sales in 2011,90 percent of our net sales in 2010 and 82 percent of our net sales in 2009. Our foreign sales are subject tocertain governmental restrictions, including the Export Administration Act and the regulationspromulgated under this Act.
Customer Support
One of our primary goals is to build strong and productive partnerships with our customers. Ourcustomer support organization is headquartered in Fremont, California, with additional resources locatedin China, Germany, Singapore, South Korea, Taiwan and the United States. We also maintain arelationship with Canon Marketing, Japan for the distribution and support of our products in Japan. Ourglobal support infrastructure is composed of a network of product and process technologists, along withexperienced field service teams with diverse technical backgrounds in mechanical and electronicsengineering. After-sales support is an essential part of our customer service program, and our internationalcustomer support teams provide the following services: system installation, on-site repair, telephonesupport, used tool refurbishment, relocation services, process development applications and upgrades forextending the useful life and value of our products.
We offer warranties on all of our products. We maintain spare parts depots, consignment locations atcustomer sites and local support in most regions. As part of our global support services, we also offer abroad selection of technical training courses, from maintenance and service training to basic and advancedapplications and operation. We are also actively engaged in joint development programs at many majorcustomer sites to collaborate on product and process development and increase the level of customersupport.
9
Backlog
We schedule production of our systems based on both backlog and regular sales forecasts. For severalof our key customers, we typically receive orders several weeks prior to shipment. We include in backlogonly those systems for which we have accepted purchase orders and assigned shipment dates within thenext 12 months. Orders may be subject to cancellation or delay by the customer with limited or no penalty.Our backlog was $27.1 million as of December 31, 2011, $22.2 million as of December 31, 2010 and$4.3 million as of December 31, 2009. Because of possible future changes in delivery schedules andcancellations of orders, our backlog at any particular date is not necessarily representative of actual sales tobe expected for any succeeding period. During periods of industry downturn, we have experiencedcancellations, delays and push-outs of orders that were previously included in backlog.
Manufacturing
We have direct manufacturing operations in the United States, Germany and South Korea. Our directmanufacturing operations consist of procurement, assembly, test, quality assurance and/or manufacturingengineering. We also utilize an outsourcing strategy for the manufacture of components and majorsubassemblies/modules. Our direct manufacturing teams are an integral part of our new productdevelopment process, working closely with our engineering teams to ensure that new products meetdesign-for-manufacturability, cost and quality targets. We have established sales and operations planningprocesses and systems to flexibly manage our production capacity and inventory levels, to quickly respondto fluctuating market demands.
Employees
As of December 31, 2011, we had 382 employees. The success of our future operations will depend inlarge part on our ability to recruit and retain qualified employees, particularly those highly-skilled design,process and test engineers involved in the manufacture of existing systems and the development of newsystems and processes. None of our employees outside of Germany is represented by a labor union, and wehave never experienced a work stoppage, slowdown or strike. In Germany, our employees are representedby workers’ councils.
Environmental Matters
We are subject to international, federal, state and local environmental laws, rules and regulations.These laws, rules and regulations govern the transport, receipt, storage, use, treatment, discharge anddisposal of hazardous and non-hazardous chemicals and wastes during manufacturing, research anddevelopment and sales demonstrations. Neither compliance with international, federal, state and localprovisions regulating discharge of materials into the environment, nor remedial agreements or otheractions relating to the environment have had, or is expected to have, a material effect on our capitalexpenditures, financial condition, results of operations or competitive position. However, if we fail tocomply with applicable regulations, we could be subject to substantial liability for cleanup efforts, personalinjuries, fines or suspension or cessation of our operations.
Gartner Market Data
The Gartner Report(s) described herein, (the ‘‘Gartner Report(s)’’) represent(s) data, researchopinion or viewpoints published, as part of a syndicated subscription service, by Gartner, Inc. (Gartner),and are not representations of fact. Each Gartner Report speaks as of its original publication date and theopinions expressed in the Gartner Report(s) are subject to change without notice.
10
Available Information
We make available free of charge, through our website, http://www.mattson.com, our Annual Reporton Form 10-K, quarterly reports on Form 10-Q, current reports on Form 8-K and all amendments to thosereports as soon as reasonably practicable after such material is electronically filed with the Securities andExchange Commission (SEC). Our publicly filed information is also available on the SEC’s website,http://www.sec.gov. The information on our website is not incorporated herein by reference.
Item 1A. Risk Factors
Because of the following factors, as well as other variables affecting our operating results, cash flowsand financial condition, past financial performance may not be a reliable indicator of future performance,and historical trends should not be used to anticipate results or trends in the future periods. Other eventsthat we do not currently anticipate or that we currently deem immaterial also may affect our results ofoperations, cash flows and financial condition. See also ‘‘Forward-Looking Statements’’ elsewhere in thisreport.
We are dependent on our revenue and the success of our cost reduction measures to ensure adequateliquidity and capital resources during the next twelve months.
We have incurred operating losses and generated negative cash flows for the last four years. As ofDecember 31, 2011, we had cash, cash equivalents and restricted cash of $32.9 million and working capitalof $56.2 million. Our operations require careful management of our cash and working capital balances.Our liquidity is affected by many factors including, among others, fluctuations in our revenue, gross profitsand operating expenses, as well as changes in our operating assets and liabilities. The cyclicality of thesemiconductor industry makes it difficult for us to predict our future liquidity needs with certainty. Anyupturn in the semiconductor industry would result in short-term uses of our cash to fund inventorypurchases and accounts receivable, with longer-term uses for research and development or otherwise tomake investments in our business. Alternatively, any renewed softening in the demand for our products orineffectiveness of our cost reduction efforts may cause us to incur additional losses in the future and lowerour cash balances.
We may need additional funds to support our working capital requirements, operating expenses or forother requirements. Historically, we have relied on a combination of fundraising from the sale andissuance of equity securities (such as our common stock offering in May 2011) and cash generated fromproduct, service and royalty revenues to provide funding for our operations. We periodically review ourliquidity position and may seek to raise additional funds from a combination of sources including issuanceof equity or debt securities through public or private financings. In the event additional needs for casharise, we may also seek to raise these funds externally through other means, such as the sale of assets. Theavailability of additional financing will depend on a variety of factors, including among others, marketconditions, the general availability of credit to the financial services industry and our credit ratings. As aconsequence, these financing options may not be available to us on a timely basis, or on terms acceptableto us, and could be dilutive to our stockholders. Our current liquidity position may result in risks anduncertainties affecting our operations and financial position, including the following:
• we may be required to reduce planned expenditures or investments;
• we may be unable to compete in our newer or developing markets;
• we may not be able to obtain and maintain normal terms with suppliers;
• suppliers may require standby letters of credit before delivering goods and services, which will resultin additional demands on our cash;
• customers may delay or discontinue entering into contracts with us; and
• our ability to retain management and other key individuals may be negatively affected.
11

Failure to generate sufficient cash flows from operations, raise additional capital or reduce spendingcould have a material adverse effect on our ability to achieve our intended long-term business objectives.
We are dependent on a highly concentrated customer base, and any cancellation, reduction or delay ofpurchases by these customers could harm our business. Additionally, we may not achieve anticipatedrevenue levels if we are not selected as ‘‘vendor of choice’’ for new or expanded customer fabricationfacilities.
We derive most of our revenues from the sale of systems to a relatively small number of customers,which makes our relationship with each customer critical to our business. For example, in the years endedDecember 31, 2011, 2010 and 2009, our three largest customers accounted for a total of 60 percent,59 percent and 55 percent of our revenues, respectively. We currently depend on one customer for asignificant portion of our revenues, and the loss of, or a significant reduction in, orders from this customerwould significantly reduce our revenue and adversely impact our operating results. See ‘‘Business—Customers’’ for a detailed description of our customer concentration. Because semiconductormanufacturers must make a substantial investment to install and integrate capital equipment into asemiconductor fabrication facility, these manufacturers will tend to choose semiconductor equipmentmanufacturers based on product compatibility and proven performance. Customer order cancellationscould result in the loss of anticipated sales without allowing us sufficient time to reduce our inventory andoperating expenses. In addition, changes in forecasts or the timing of orders from customers could exposeus to the risks of inventory shortages or excess inventory. This in turn could cause our operating results tofluctuate. If customer relationships are disrupted due to an inability to deliver sufficient products or forany other reason, it could have a significant negative impact on our business.
A large percentage of our sales are concentrated among customers in the memory market. As a result,a downturn or an upturn in memory spending could impact us more than it would impact competitors whoare more diversified with logic and foundry customers.
Once a semiconductor manufacturer selects a particular vendor’s capital equipment, the manufacturergenerally relies upon equipment from this ‘‘vendor of choice’’ (VOC) for the specific production lineapplication. In addition, the semiconductor manufacturer frequently will attempt to consolidate othercapital equipment requirements with the same vendors. Accordingly, we may face narrow windows ofopportunity to be selected as the VOC by significant new customers. It may be difficult for us to sell to aparticular customer for a significant period of time once that customer selects a competitor’s product. If weare unable to achieve broader market acceptance of our systems and technology, we may be unable tomaintain and grow our business and our operating results and financial condition will be adverselyaffected.
Although we maintain a backlog of customer orders with expected shipment dates within the next12 months, customers may request cancellations or delivery delays. Customers in some regions placeorders a few weeks before the shipment. As a result, our backlog may not be a reliable indication of futurerevenues. If shipments of orders in backlog are cancelled or delayed, revenues could fall below ourexpectations and the expectations of market analysts and investors.
We face stiff competition in the semiconductor equipment industry.
The semiconductor equipment industry is both highly competitive and subject to rapid technologicalchange. Significant competitive factors include the following:
• system performance;
• cost of ownership;
• size of the installed base;
12
• breadth of product line;
• delivery speed; and
• customer support.
Competitive pressure has been increasing in several areas. In addition to increased price competition,customers are waiting to make purchase commitments based on their end-user demand, which are thenplaced with requests for rapid delivery dates and increased product support. Some of our majorcompetitors are larger than we are, have greater capital resources and may have a competitive advantageover us by virtue of having:
• broader product lines;
• longer operating history;
• greater experience with high-volume manufacturing;
• substantially larger customer bases; and
• substantially greater customer support, financial, technical and marketing resources.
Growth in the semiconductor equipment industry is increasingly concentrated in the largestcompanies, resulting in increasing industry consolidation, such as the pending merger of Lam Researchand Novellus Systems announced in December 2011. Semiconductor companies are consolidating theirvendor base and prefer to purchase from vendors with a strong, worldwide support infrastructure.
In addition, to expand our sales we must often displace the systems of our competitors or sell newsystems to customers of our competitors. Our competitors may develop new or enhanced competitiveproducts that offer price or performance features that are superior to our systems. Our competitors mayalso be able to respond more quickly to new or emerging technologies and changes in customerrequirements or to devote greater resources to the development, promotion, sale and on-site customersupport of their product lines. We may not be able to maintain or expand our sales if competition increasesand we are unable to respond effectively.
The cyclical nature of the semiconductor industry has caused us to experience losses and reduced liquidity,and it may continue to negatively impact our financial performance.
The semiconductor equipment industry is highly cyclical and periodically has severe and prolongeddownturns, which causes our operating results to fluctuate significantly. We are exposed to the risksassociated with industry overcapacity, including decreased demand for our products and increased pricecompetition.
The semiconductor industry has historically experienced periodic downturns due to general economicchanges or due to capacity growth temporarily exceeding growth in demand for semiconductor devices.Our business depends, in significant part, upon capital expenditures by manufacturers of semiconductordevices, including manufacturers that open new or expand existing facilities. Periods of overcapacity andreductions in capital expenditures by our customers cause decreases in demand for our products. Thiscould result in significant under-utilization in our factories. If existing customer fabrication facilities arenot expanded and new facilities are not built, we may be unable to generate significant new orders andsales for our systems. During periods of declining demand for semiconductor manufacturing equipment,our customers typically reduce purchases, delay delivery of ordered products and/or cancel orders,resulting in reduced revenues and backlog, delays in revenue recognition and excess inventory for us.Increased price competition may also result as we compete for the smaller demand in the market, causingpressure on our gross margin and net income.
13
The weakness in the global economy may continue to negatively impact our financial performance.
The recessionary conditions of 2008 and 2009 in the global economy and the slowdown in thesemiconductor industry impacted customer demand for our products and correspondingly, negativelyimpacted our financial performance. There remains high unemployment in developed countries, concernsregarding the availability of credit, uncertainty about a sustained economic recovery in the U.S. and fearsof further economic deterioration in Europe and the developing world, which in turn, may lead to a globaldownturn. Any of these factors could have a negative impact on our business, or our financial condition.
Demand for semiconductor equipment depends on consumer spending. Continued economicuncertainty may lead to a decrease in consumer spending and may cause certain of our customers to cancelor delay orders. In addition, if our customers have difficulties in obtaining capital or financing, this couldresult in lower sales. Customers with liquidity issues could lead to charges to our bad debt expense, if weare unable to collect accounts receivables. These conditions could also affect our key suppliers, whichcould affect their ability to supply parts to us, and result in delays of the completion of our systems and theshipment of these systems to our customers.
Because of the economic downturn and the uncertainty of a full recovery, we may have to take furtheractions to reduce costs, which could reduce our ability to invest in research and development at levels webelieve are desirable. If we are unable to effectively align our cost structure with prevailing marketconditions, we will experience additional losses and additional reductions in our cash and cash equivalents.If we are not able to suitably adapt to these economic conditions in a timely manner or at all, ourperformance, cash flows, results of operations and ability to access capital could be materially andadversely impacted.
We must continually anticipate technology trends, improve our existing products and develop new productsin order to be competitive. The development of new or enhanced products involves significant risks,additional costs and delays in revenue recognition. Technical and manufacturing difficulties experienced inthe introduction of new products could be costly and could adversely affect our customer relationships.
The markets in which our customers and we compete are characterized by rapidly changingtechnology, evolving industry standards and continuous improvements in products and services.Consequently, our success depends upon our ability to anticipate future technology trends and customerneeds, to develop new systems and processes that meet industry standards and customer requirements andthat compete effectively on the basis of price and performance.
Our development of new products involves significant risk, since the products are very complex andthe development cycle is long and expensive. The success of any new system we develop and introduce isdependent on a number of factors, including our ability to correctly predict customer requirements for newprocesses, to assess and select the potential technologies for research and development and to timelycomplete new system designs that are acceptable to the market. We may make substantial investments innew technologies before we can know whether they are technically or commercially feasible oradvantageous, and without any assurance that revenue from future products or product enhancements willbe sufficient to recover the associated development costs. Not all development activities result incommercially viable products. We may not be able to improve our existing systems or develop newtechnologies or systems in a timely manner. We may exceed the budgeted cost of reaching our research,development and engineering objectives, and planned product development schedules may requireextension. Any delays or additional development costs could have a material adverse effect on our businessand results of operations.
Our products are complex, and we may experience technical or manufacturing inefficiencies, delays ordifficulties in the prototype introduction of new systems and enhancements, or in achieving volumeproduction of new systems or enhancements that meet customer requirements. Our inability, or theinability of our outsourced partners, to overcome such difficulties, to meet the technical specifications of
14
any new systems or enhancements or to manufacture and ship these systems or enhancements in volumeand in a timely manner would materially adversely affect our business and results of operations, as well asour customer relationships.
Our revenue recognition policies require that during the initial evaluation phase of a new product,customer acceptance needs to be obtained before we can recognize revenue on the product. Customeracceptances may not be completed in a timely manner for a variety of reasons, whether or not related tothe quality and performance of our products. Any delays in customer acceptance may result in revenuerecognition delays and have an adverse impact on our results of operations.
We may from time to time incur unanticipated costs to ensure the functionality and reliability of ourproducts early in their life cycles, and such costs can be substantial. If we encounter reliability or qualityproblems with our new products or enhancements, we could face a number of difficulties, includingreduced orders, higher manufacturing costs, delays in collection of accounts receivable and additionalservice and warranty expenses, all of which could materially adversely affect our business and results ofoperations. The costs associated with our warranties may be significant, and in the event our projectionsand estimates of these costs are inaccurate, our financial performance could be seriously harmed. Inaddition, if we experience product failures at an unexpectedly high level, our reputation in the marketplacecould be damaged, and our business would suffer.
Significant fluctuations in our operating results are difficult to predict due to our lengthy sales cycle, andour results may fall short of anticipated levels, which could cause our stock price to decline.
Sales of our systems depend upon the decision of a prospective customer to increase or replacemanufacturing capacity, typically involving a significant capital commitment. Accordingly, the decision topurchase our systems requires time-consuming internal procedures associated with the evaluation, testing,implementation and introduction of new technologies into our customers’ manufacturing facilities. Evenafter the customer determines that our systems meet their qualification criteria, we may experience delaysfinalizing system sales while the customer obtains approval for the purchase, constructs new facilities orexpands its existing facilities. Consequently, the time between our first contact with a customer regarding aspecific potential purchase and the customer’s placing its first order may last from nine to twelve months orlonger. We may incur significant sales and marketing expenses during this evaluation period. In addition,the length of this period makes it difficult to accurately forecast future sales. Also, any unexpected delaysin orders could impact our revenue and operating results. If sales forecasted from a specific customer arenot realized, we may experience an unplanned shortfall in revenues, and our quarterly and annual revenueand operating results may fluctuate significantly from period to period.
Our quarterly and annual revenue and operating results have varied significantly in the past and arelikely to vary significantly in the future, which makes it difficult for us to predict our future operatingresults. We incurred significant net losses between 2001 and 2003, yet were profitable for each of the years2004 to 2007. Again, we incurred net losses between 2008 and 2011, due to declining demand as a result ofthe weakness in the semiconductor equipment market and the global economy. We may not achieveprofitability in future years. We will need to generate significant sales to achieve profitability, and we maynot be able to do so. A substantial percentage of our operating expenses are fixed in the short term and wemay continue to be unable to adjust spending to compensate for shortfalls in revenues. As a result, we maycontinue to incur losses, which could cause the price of our common stock to decline further or remain at alow level for an extended period of time.
We are highly dependent on international sales, and face significant international business risks.
International sales accounted for 94 percent, 95 percent and 92 percent of our net sales for the yearsended December 31, 2011, 2010 and 2009, respectively. We anticipate international sales will continue toaccount for the vast majority of our future net sales. Asia has been a particularly important region for our
15
business, and we anticipate that it will continue to be important going forward. Our sales to customerslocated in Asia accounted for 84 percent, 90 percent and 82 percent of our net sales for the years endedDecember 31, 2011, 2010 and 2009, respectively. Because of our continuing dependence upon internationalsales, we are subject to a number of risks associated with international business activities, including:
• burdensome governmental controls, laws, regulations, tariffs, duties, taxes, restrictions, embargoesor export license requirements;
• unexpected changes in laws or regulations prompted by economic stress, such as protectionism, andother attempts to rectify real or perceived international trade imbalances;
• exchange rate volatility;
• the need to comply with a wide variety of foreign and U.S. customs and export laws;
• political and economic instability;
• government-sponsored competition;
• differing labor regulations;
• reduced protection for, and increased misappropriation of, intellectual property;
• difficulties in accounts receivable collections;
• increased costs for product shipments and potential difficulties from shipment delays;
• difficulties in managing distributors, representatives, contract manufacturers and suppliers;
• difficulties in staffing and managing foreign subsidiary operations; and
• natural disasters, acts of war, terrorism, widespread illness or other catastrophes affecting foreigncountries.
Our sales to date have been denominated primarily in U.S. dollars; however future sales to Asiancustomers may be denominated in the customer’s local currency. Our sales in foreign currencies are subjectto risks of currency fluctuation. For U.S. dollar sales in foreign countries, our products may become lessprice competitive when the local currency is declining in value compared to the dollar. This could cause usto lose sales or force us to lower our prices, which would reduce our gross margins.
We are exposed to various risks relating to compliance with the regulatory environment, including exportcontrol laws and material contracts provisions, and non-compliance or non-performance with any of theseitems could result in adverse consequences and monetary fines or damages.
We are subject to various risks related to (1) disagreements and disputes between national andregional regulatory agencies related to international trade; (2) new, inconsistent and conflicting rules byregulatory agencies in the countries in which we operate; and (3) interpretation and application ofdifferent laws and regulations. If we are found by a court or regulatory agency to not be in compliance withthe laws and regulations, our business, financial condition and results of operations could be adverselyaffected.
As an exporter, we must comply with various laws and regulations relating to the export of productsand technology from the U.S. and other countries having jurisdiction over our operations. In the U.S. theselaws include the International Traffic in Arms Regulations (‘‘ITAR’’) administered by the StateDepartment’s Directorate of Defense Trade Controls, the Export Administration Regulations (‘‘EAR’’)administered by the Bureau of Industry and Security (‘‘BIS’’), and trade sanctions against embargoedcountries and destinations administered by the U.S. Department of Treasury, Office of Foreign AssetsControl (‘‘OFAC’’). The EAR governs products, parts, technology and software which present military orweapons proliferation concerns, so-called ‘‘dual use’’ items, and ITAR governs military items listed on the
16
United States Munitions List. Prior to shipping certain items, we must obtain an export license or verifythat license exemptions are available. In addition, we must comply with certain requirements related todocumentation, record keeping, plant visits and hiring of foreign nationals. Any failures to comply withthese laws and regulations could result in fines, adverse publicity and restrictions on our ability to exportour products, and repeat failures could carry more significant penalties. In 2008, we self-disclosed to BIScertain inadvertent EAR violations, and are currently working with BIS to resolve these. As ofDecember 31, 2011, we have accrued an amount to reflect what management believes to be the minimumestimated liability. We are unable to estimate the extent of any higher fines or penalties or other potentiallosses that may be incurred with respect to this matter, though we could face substantial civil fines or otherpenalties, which could have a material adverse effect on us.
We are a party to several governmental and private-party contracts that provide for liquidateddamages in the event that we fail to comply with the covenants or requirements under any of thesecontracts. These liquidated damage payments could be significant and we could incur significant legal feesif we were to renegotiate these contracts. Any such damage amounts or legal expenses may adverselyimpact our financial condition or results of operations.
Because of competition for qualified personnel, we may not be able to recruit or retain necessary personnel,which could impede development or sales of our products.
Our growth will depend on our ability to attract and retain qualified, experienced employees. Ourability to attract employees may be harmed by our recent financial losses, which has impacted our availablecash and our ability to provide performance-based annual cash incentives. Also, part of our totalcompensation program includes share-based compensation. Share-based compensation is an importanttool in attracting and retaining employees in our industry. If the market price of our common sharesdeclines or remains low, it may adversely affect our ability to attract or retain employees.
During periods of growth in the semiconductor industry, there is substantial competition forexperienced engineering, technical, financial, sales and marketing personnel in our industry. In particular,we must attract and retain highly skilled design and process engineers. If we are unable to retain existingkey personnel, or attract and retain additional qualified personnel, we may from time to time experienceinadequate levels of staffing to develop and market our products and perform services for our customers.As a result, our growth could be limited, we could fail to meet our delivery commitments or we couldexperience deterioration in service levels or decreases in customer satisfaction.
The price of our common stock has fluctuated in the past and may continue to fluctuate significantly in thefuture, which may lead to losses by investors, securities litigation or hostile or otherwise unfavorabletakeover offers.
The market price of our common stock has been highly volatile in the past, and our stock price maydecline in the future. For example, for the year ended December 31, 2011, the closing price range for ourcommon stock was between $1.00 and $2.87 per share.
The relatively low stock price makes us attractive to hedge funds and other short-term investors. Thiscould result in substantial volatility of the stock price and cause fluctuations in trading volumes for ourstock. In addition, in recent years the stock market in general, and the market for shares of high technologystocks in particular, have experienced extreme price fluctuations. These fluctuations have frequently beenunrelated to the operating performance of the affected companies. In the past, securities class actionlitigation has often been instituted against a company following periods of volatility in its stock price. Thistype of litigation, if filed against us, could result in substantial costs and divert our management’s attentionand resources.
Our stock price has been below the five-year peak of $11.76 for several years, and if revenue does notreturn to the peak 2007 levels or we do not return to profitability in the near term, we could be an
17

attractive target for acquisition or be impacted by mergers or acquisition by another company orconsolidation in the industry. An acquisition or merger could be hostile or on terms unfavorable to us, andmay result in substantial costs and potential disruption to our business.
We are subject to significant risks related to our operations.
We are outsourcing logistics activities and select manufacturing activities to third-party service providers,which decrease our control over the performance of these functions and quality of our products.
We have outsourced our spare parts logistics functions and select core product manufacturing to third-party service providers. Outsourcing has a number of risks and reduces our control over the performanceof the outsourced functions. Significant performance problems by these third-party service providers couldresult in cost overruns, delayed deliveries, shortages, quality issues or other problems that could result insignificant customer dissatisfaction and could materially and adversely affect our business, financialcondition and results of operations. If for any reason one or more of these third-party service providersbecomes unable or unwilling to continue to provide services of acceptable quality, at acceptable costs andin a timely manner, our ability to deliver our products or spare parts to our customers could be severelyimpaired.
We depend upon a limited number of suppliers for some components and subassemblies, and supply shortagesor the loss of these suppliers could result in increased cost or delays in the manufacture and sale of ourproducts.
We rely, to a substantial extent, on outside vendors to provide many of the components andsubassemblies of our systems. We obtain some of these components and subassemblies from a sole sourceor a limited group of suppliers. We generally acquire these components on a purchase order basis and notunder long-term supply contracts. Because of this reliance on these vendors and suppliers, we may beunable to obtain an adequate supply of required components. When demand for semiconductor equipmentis strong, our suppliers may have difficulty providing components on a timely basis.
In addition, during periods of shortages of components, we may have reduced control over pricing andtimely delivery of components. We often quote prices to our customers and accept customer orders for ourproducts prior to purchasing components and subassemblies from our suppliers. If our suppliers increasethe cost of components or subassemblies, we may not have alternative sources of supply and may no longerbe able to increase the cost of the system being evaluated by our customers to cover all or part of theincreased cost of components.
The manufacture of some of these components is an extremely complex process and requires longlead times. If we are unable to obtain adequate and timely deliveries of our required components, we mayhave to seek alternative sources of supply or manufacture such components internally. This could delay ourability to manufacture or ship our systems in a timely manner, causing us to lose sales, incur additionalcosts, delay new product introductions and harm our reputation. Historically, we have not experienced anysignificant delays in manufacturing due to an inability to obtain components, and we are not currentlyaware of any specific problems regarding the availability of components that might significantly delay themanufacturing of our systems in the future. Any inability to obtain adequate deliveries, or any othercircumstance that would require us to seek alternative sources of supply or to manufacture suchcomponents internally, could delay our ability to ship our systems and could have a material adverse effecton us.
18
Our gross margins may be impacted if we do not effectively manage our inventory.
We need to manage our inventory of component parts, work-in-process and finished goods effectivelyto meet customer delivery demands at an acceptable risk and cost. For both the inventories that supportmanufacture of our products and our spare parts inventories, if the anticipated customer demand does notmaterialize in a timely manner, we will incur increased carrying costs and some inventory could becomeexcess or obsolete, resulting in write-offs, which would adversely affect our cash position and results ofoperations. The sale of this inventory during periods of increasing revenue could temporarily impact ourgross margins favorably due to the adjusted carrying value of this inventory, and could result in futureunpredictability in our gross margin estimates.
Our gross margins for sales of products that we manufacture in Germany and/or South Korea may fluctuatedue to changes in the value of the Euro and South Korean won.
We develop and manufacture a significant portion of our products in Germany, where our costs forlabor and materials are primarily denominated in Euros, and anticipate increased manufacturing activitiesin South Korea going forward, where our costs for labor are primarily denominated in won. Futureincreases in the strength of the Euro or won, if any, could increase our development costs, our costs tomanufacture systems, and our costs to purchase spare parts for products from our suppliers, which wouldmake it more difficult for us to compete and could adversely affect our results of operations.
We manufacture many of our products at two primary manufacturing facilities and are thus subject to risk ofdisruption.
Although we outsource select core product manufacturing to third parties, we continue to produceour latest generation products at our two principal manufacturing plants in Fremont, California andDornstadt, Germany. We have limited ability to interchangeably produce our products at either facility,and in the event of a disruption of operations at one facility, our other facility would not be able to makeup the capacity loss. Our operations could be subject to disruption for a variety of reasons, including, butnot limited to, natural disasters, including earthquakes in California, work stoppages, operational facilityconstraints and terrorism. Such disruption could cause delays in shipments of products to our customers,result in cancellation of orders or loss of customers and seriously harm our business.
We self-insure certain risks including earthquake risk. If one or more of the uninsured events occurs, we couldsuffer major financial losses.
We purchase insurance to help mitigate the economic impact of certain insurable risks; however,certain other risks are uninsurable or are insurable only at significant cost or cannot be mitigated withinsurance. An earthquake could significantly disrupt our principal manufacturing operations in Fremont,California, an area highly susceptible to earthquakes. It could also significantly delay our research anddevelopment efforts on new products, a significant portion of which is conducted in California. Weself-insure earthquake risks because we believe this is a prudent financial decision based on the high costand limited coverage available in the earthquake insurance market. If a major earthquake occurs, we couldsuffer a major financial loss and face significant disruption in our business.
If we are unable to protect our intellectual property, we may lose valuable assets and experience reducedmarket share. Efforts to protect our intellectual property may be costly to resolve, require additional costlylitigation and could divert management attention. We also agree to indemnify customers for certain claims,and such obligations are more likely to increase during downturns.
We rely on a combination of patents, copyrights, trademark and trade secret laws, non-disclosureagreements, and other intellectual property protection methods to protect our proprietary technology.Despite our efforts to protect our intellectual property, we may from time to time be subject to claims of
19
infringement of other parties’ patents or other proprietary rights. If this occurs, we may not be able toprevent the use of such technology. Our means of protecting our proprietary rights may not be adequateand our patents may not be sufficiently broad to protect our technology. Any patents owned by us could bechallenged, invalidated or circumvented and any rights granted under any patent may not provideadequate protection to us.
Furthermore, we may not have sufficient resources to protect our rights. When we outsource portionsof our manufacturing, we are less able to protect our intellectual property ourselves, and rely more on ourservice providers to do so. Our service providers may not always be able to assure that their employees orformer employees do not use our intellectual property for their own account to compete with us. Ourcompetitors may independently develop similar technology, or design around patents that may be issued tous. In addition, the laws of some foreign countries may not protect our proprietary rights to as great anextent as do the laws of the United States and it may be more difficult to monitor the use of our productsin such foreign countries. As a result of these threats to our proprietary technology, we may have to resortto costly litigation to enforce our intellectual property rights.
On occasion we receive notification from customers who believe that we are required to indemnifythem or we have other financial obligations to them because of claims of intellectual property infringementmade against them by third parties. Our involvement in any patent dispute or other intellectual propertydispute or action to protect trade secrets, even if the claims are without merit, could be very expensive todefend and could divert the attention of our management. Adverse determinations in any litigation couldsubject us to significant liabilities to third parties, require us to seek costly licenses from third parties andprevent us from manufacturing and selling our products. Royalty or license agreements, if required, maynot be available on terms acceptable to us, or at all. Any of these situations could have a material adverseeffect on our business and operating results in one or more countries.
In the normal course of business, we indemnify customers with respect to certain matters, for exampleif our tool infringes the intellectual property rights of any third party or if we breach any promise in ourcontract with the customer. During downturns in general or industry specific economic conditions, ourcustomers may require that the extent and scope of our obligation to indemnify them be expanded becausecustomers feel they have greater leverage in negotiating with us. In the future, we may be compelled toenter into or accrue for settlements under such indemnification provisions. Our financial performancecould be materially adversely affected if we expend significant amounts in defending or settling anypurported claims.
Our failure to comply with environmental or safety regulations could result in substantial liability.
We are subject to a variety of federal, state, local and foreign laws, rules, and regulations relating toenvironmental protection and workplace safety. These laws, rules and regulations govern the use, storage,discharge and disposal of hazardous chemicals during manufacturing, research and development and salesdemonstrations, as well as governmental standards for workplace safety. If we fail to comply with presentor future regulations, especially in our manufacturing facilities in the United States, Germany and SouthKorea, we could be subject to substantial liability for cleanup efforts, personal injury, fines or suspension orcessation of our operations. We may be subject to liability if our acquired companies have past violations.Restrictions on our ability to expand or continue to operate our present locations could be imposed uponus as a result of such laws, rules and regulations, and we could be required to acquire costly remediationequipment or incur other significant expenses.
Any future business divestitures or acquisitions may disrupt our business, diminish stockholder value ordistract management attention.
We may seek to divest of certain assets or businesses from time to time, especially if we needadditional liquidity or capital resources. When we make a decision to sell assets or a business, we may
20
encounter difficulty completing the transaction as a result of a range of possible factors such as new orchanged demands from the buyer. These circumstances may cause us to incur additional time or expenseor to accept less favorable terms, which may adversely affect the overall benefits of the transaction.
As part of our ongoing business strategy, we may consider acquisitions of, or significant investmentsin, businesses that offer products, services and technologies complementary to our own. Such acquisitionscould materially adversely affect our operating results and/or the price of our common stock. Acquisitionsalso entail numerous risks, including:
• difficulty of assimilating the operations, products and personnel of the acquired businesses andpossible impairments caused by this;
• potential disruption of our ongoing business;
• unanticipated costs associated with the acquisition;
• inability of management to manage the financial and strategic position of acquired or developedproducts, services and technologies;
• inability to maintain uniform standards, controls, policies and procedures; and
• impairment of relationships with employees and customers that may occur as a result of integrationof the acquired business.
To the extent that shares of our stock or other rights to purchase stock are issued in connection withany future acquisitions, dilution to our existing stockholders will result, and our earnings per share maysuffer. We may be required to incur debt to pay for any future acquisitions, which could subject us torestrictive covenants and other leverage concerns. Any future acquisitions may not generate additionalrevenue or provide any benefit to our business, and we may not achieve a satisfactory return on ourinvestment in any acquired businesses.
Divestitures, acquisitions and other transactions are inherently risky, and we cannot provide anyassurance that our previous or future transactions will be successful. The inability to effectively manage therisks associated with these transactions could materially and adversely affect our business, financialcondition or results of operations.
Our current transfer of operations and periodic restructuring plans may not produce anticipated benefitsand may lead to charges that will adversely affect our results of operations.
We are currently undertaking a transfer of our operations from Canada to our Germany facility. Thistransfer plan may not be achieved in a timely and efficient manner, and may not fully realize theanticipated cost savings and synergies for a variety of reasons. Some of the risk related to this transferinclude failure to obtain expected cost savings due to cost overruns in connection with the move or afteroperations commence; failure to merge our Canadian operations into our existing German operations; andemployment and other law, rules, regulations or other limitations in foreign jurisdictions that could havean impact on timing, amounts or costs of achieving expected synergies.
In addition, we have from time to time enacted restructuring and other cost reduction plans designedto reduce our manufacturing overhead and our operating expenses. These restructuring efforts resulted ormay result in significant restructuring charges that have adversely affected, and may continue to adverselyaffect, our results of operations for the periods in which such charges occur. Additionally, actual costsrelated to such restructuring plans have in the past, and may in the future, exceed the amounts that wepreviously estimated, leading to additional charges as actual costs are incurred. We expect to incursignificant restructuring charges over the next 12 months, both in connection with our transfer of theCanadian operations and otherwise.
21
Changes in tax rates or tax liabilities could affect results.
We are subject to taxation in the United States and various other countries. Significant judgment isrequired to determine and estimate worldwide tax liabilities. Our future annual and quarterly tax ratescould be affected by numerous factors, including changes in the applicable tax laws, composition ofearnings in countries with differing tax rates or our valuation and utilization of deferred tax assets andliabilities. In addition, we are subject to regular examination of our income tax returns by the InternalRevenue Service and other tax authorities. We regularly assess the likelihood of favorable or unfavorableoutcomes resulting from these examinations to determine the adequacy of our provision for income taxes.Although we believe our tax estimates are reasonable, there can be no assurance that any finaldetermination will not be materially different from the treatment reflected in our historical income taxprovisions and accruals, which could materially and adversely affect our results of operations.
We may be required to record additional impairment charges that will adversely impact our results ofoperations.
We review our goodwill and intangible assets for impairment whenever events or changes incircumstances indicate that the carrying amounts of these assets may not be recoverable, and also reviewgoodwill balances annually. For example, during the year ended December 31, 2008, we recordedimpairment charges of $18.1 million and $6.6 million related to the write-off of goodwill and certainintangible assets, respectively. The write-offs were triggered by the significant decline in our revenue andcash flows. The resulting assessment indicated a material decline in our market valuation and projectedrevenues, causing a decrease in the anticipated future cash flows attributable to these assets relative to thecash flow expectations when the assets were acquired. In the event that we determine in a future periodthat impairment of our intangible assets exists for any reason, we would record additional impairmentcharges in the period such determination is made, which would adversely impact our financial position andresults of operations.
Our restated certificate of incorporation and restated bylaws, our stockholder rights plan and Delaware lawcontain provisions that could discourage transactions resulting in a change in control, which may negativelyaffect the market price of our common stock.
Our restated certificate of incorporation, our restated bylaws, our stockholder rights plan andDelaware law contain provisions that might enable our management to discourage, delay or prevent achange in control. In addition, these provisions could limit the price that investors would be willing to payin the future for shares of our common stock. Pursuant to such provisions:
• our board of directors is authorized, without prior stockholder approval, to create and issuepreferred stock, commonly referred to as ‘‘blank check’’ preferred stock, with rights senior to thoseof common stock;
• our board of directors is staggered into three classes, only one of which is elected at each annualmeeting;
• stockholder action by written consent is prohibited;
• nominations for election to our board of directors and the submission of matters to be acted uponby stockholders at a meeting are subject to advance notice requirements;
• certain provisions in our bylaws and certificate of incorporation such as notice to stockholders, theability to call a stockholder meeting, advance notice requirements and action of stockholders bywritten consent may only be amended with the approval of stockholders holding 662⁄3 percent of ouroutstanding voting stock;
• the ability of our stockholders to call special meetings of stockholders is prohibited; and
22
• subject to certain exceptions requiring stockholder approval, our board of directors is expresslyauthorized to make, alter or repeal our bylaws.
In addition, the provisions in our stockholder rights plan could make it more difficult for a potentialacquiror to consummate an acquisition of our company. We are also subject to Section 203 of theDelaware General Corporation Law, which provides, subject to enumerated exceptions, that if a personacquires 15 percent or more of our outstanding voting stock, the person is an ‘‘interested stockholder’’ andmay not engage in any ‘‘business combination’’ with us for a period of three years from the time the personacquired 15 percent or more of our outstanding voting stock.
Item 1B. Unresolved Staff Comments
None.
Item 2. Properties
Our principal properties as of December 31, 2011 are set forth below:
SquareLocation Type Principal Use Footage Ownership
Fremont, CA . . . . . . . . . . . Office, plant and Headquarters, marketing, 101,000 Leasedwarehouse manufacturing, distribution,
research and engineering
Exton, PA . . . . . . . . . . . . . . Office Subleased 80,000(1) Leased
Dornstadt, Germany . . . . . . Office, plant and Manufacturing, research and 89,000 Leasedwarehouse engineering
(1) Leased property in Exton, PA is not needed for our operations. As of December 31, 2011,approximately half of this property was subleased to another party.
In addition to the above properties, we lease an aggregate of approximately 31,000 square feet ofoffice space for sales and customer support offices, worldwide. In Canada, we also lease approximately18,000 square feet of office, plant and warehouse space for office, manufacturing and research facilities.
In total, we lease office space for headquarters, manufacturing, operations, research and engineering,distribution, marketing, sales and customer support in approximately 22 locations throughout the world:three in the United States, six in Korea, four in each of China and Taiwan, two in Germany, and one ineach of Canada, Singapore and Japan. During 2011, we reviewed the utilization of our facilities and madeappropriate amendments to our lease agreements as necessary. We consider these current facilitiessuitable and adequate to meet our requirements.
Item 3. Legal Proceedings
In the ordinary course of business, we are subject to claims and litigation, including claims that weinfringe third party patents, trademarks and other intellectual property rights. Although we believe it isunlikely that any current claims or actions will have a material adverse impact on our operating results orour financial position, given the uncertainty of litigation, we cannot be certain of this. Moreover, thedefense of claims or actions against us, even if not meritorious, could result in the expenditure ofsignificant financial and managerial resources.
Our involvement in any patent dispute, other intellectual property dispute or action to protect tradesecrets and know-how could result in a material adverse effect on our business. Adverse determinations incurrent litigation or any other litigation in which we may become involved and regulatory non-compliance,including with respect to export regulations, could subject us to significant liabilities to third parties or
23

government agencies, require us to grant licenses to or seek licenses from third parties and prevent us frommanufacturing and selling our products. Any of these situations could have a material adverse effect on ourbusiness.
In addition, as disclosed in Note 7, Commitments and Contingencies in Part II, Item 8 of thisForm 10-K, we are working with the Bureau of Industry and Security to resolve certain inadvertent ExportAdministration Regulation violations.
Item 4. Mine Safety Disclosures
Not applicable
24
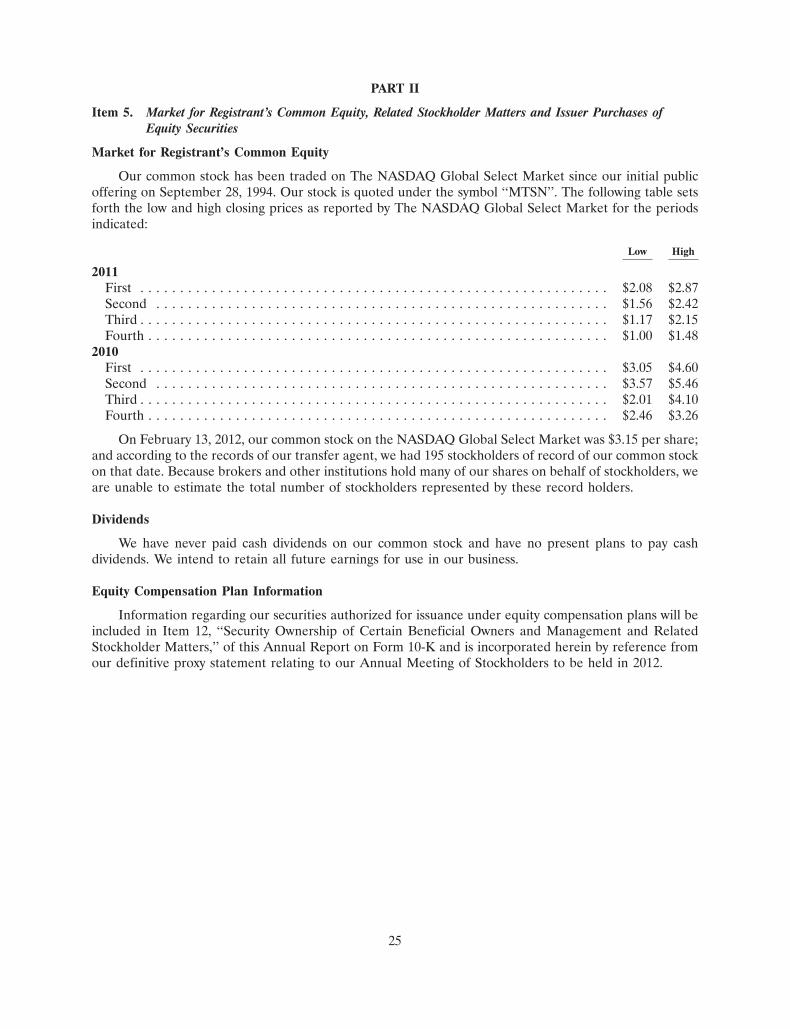
PART II
Item 5. Market for Registrant’s Common Equity, Related Stockholder Matters and Issuer Purchases ofEquity Securities
Market for Registrant’s Common Equity
Our common stock has been traded on The NASDAQ Global Select Market since our initial publicoffering on September 28, 1994. Our stock is quoted under the symbol ‘‘MTSN’’. The following table setsforth the low and high closing prices as reported by The NASDAQ Global Select Market for the periodsindicated:
Low High
2011First . . . . . . . . . . . . . . . . . . . . . . . . . . . . . . . . . . . . . . . . . . . . . . . . . . . . . . . . . . . $2.08 $2.87Second . . . . . . . . . . . . . . . . . . . . . . . . . . . . . . . . . . . . . . . . . . . . . . . . . . . . . . . . . $1.56 $2.42Third . . . . . . . . . . . . . . . . . . . . . . . . . . . . . . . . . . . . . . . . . . . . . . . . . . . . . . . . . . . $1.17 $2.15Fourth . . . . . . . . . . . . . . . . . . . . . . . . . . . . . . . . . . . . . . . . . . . . . . . . . . . . . . . . . . $1.00 $1.48
2010First . . . . . . . . . . . . . . . . . . . . . . . . . . . . . . . . . . . . . . . . . . . . . . . . . . . . . . . . . . . $3.05 $4.60Second . . . . . . . . . . . . . . . . . . . . . . . . . . . . . . . . . . . . . . . . . . . . . . . . . . . . . . . . . $3.57 $5.46Third . . . . . . . . . . . . . . . . . . . . . . . . . . . . . . . . . . . . . . . . . . . . . . . . . . . . . . . . . . . $2.01 $4.10Fourth . . . . . . . . . . . . . . . . . . . . . . . . . . . . . . . . . . . . . . . . . . . . . . . . . . . . . . . . . . $2.46 $3.26
On February 13, 2012, our common stock on the NASDAQ Global Select Market was $3.15 per share;and according to the records of our transfer agent, we had 195 stockholders of record of our common stockon that date. Because brokers and other institutions hold many of our shares on behalf of stockholders, weare unable to estimate the total number of stockholders represented by these record holders.
Dividends
We have never paid cash dividends on our common stock and have no present plans to pay cashdividends. We intend to retain all future earnings for use in our business.
Equity Compensation Plan Information
Information regarding our securities authorized for issuance under equity compensation plans will beincluded in Item 12, ‘‘Security Ownership of Certain Beneficial Owners and Management and RelatedStockholder Matters,’’ of this Annual Report on Form 10-K and is incorporated herein by reference fromour definitive proxy statement relating to our Annual Meeting of Stockholders to be held in 2012.
25

15MAR201220535843
Comparison of Stockholder Return
The following graph compares the cumulative five-year total return on Mattson Technology, Inc.’scommon stock relative to the cumulative total returns of The NASDAQ Composite index and theNASDAQ Electronic Components index:
Comparison of Five-Year Cumulative Total ReturnFrom December 31, 2006 through December 31, 2011(1)

Item 6. Selected Financial Data
The following historical financial data should be read in conjunction with our consolidated financialstatements and notes thereto. We derived the selected consolidated statement of operations data for theyears ended December 31, 2011, 2010 and 2009 and the selected consolidated balance sheet data as ofDecember 31, 2011 and 2010 from our audited consolidated financial statements appearing in Item 8 ofthis report. We derived the selected consolidated statement of operations data for the years endedDecember 31, 2008 and 2007, and the selected consolidated balance sheet data as of December 31, 2009,2008 and 2007 from our audited consolidated financial statements as published in our 10-K for the yearended December 31, 2009 and December 31, 2008. For presentation purposes, certain prior periodamounts have been reclassified to conform to the reporting in the current period financial statements.These reclassifications do not affect our net income, cash flows or stockholders’ equity.
Year Ended December 31,
2011 2010 2009 2008 2007
(thousands, except per share amounts)
Net sales . . . . . . . . . . . . . . . . . . . . . . . . . . . . $184,947 $138,336 $ 42,748 $133,551 $267,286Cost of sales . . . . . . . . . . . . . . . . . . . . . . . . . $128,699 $ 98,952 $ 46,960 $ 92,057 $150,699Gross profit (loss) . . . . . . . . . . . . . . . . . . . . . $ 56,248 $ 39,384 $ (4,212) $ 41,494 $116,587Income (loss) from operations . . . . . . . . . . . . . $ (16,550) $(33,195) $(77,011) $(91,825) $ 24,241Net income (loss) . . . . . . . . . . . . . . . . . . . . . . $ (17,950) $(33,403) $(67,042) $(92,163) $ 27,553Net income (loss) per share:
Basic . . . . . . . . . . . . . . . . . . . . . . . . . . . . . $ (0.32) $ (0.67) $ (1.35) $ (1.86) $ 0.53Diluted . . . . . . . . . . . . . . . . . . . . . . . . . . . . $ (0.32) $ (0.67) $ (1.35) $ (1.86) $ 0.52
Shares used in computing net income (loss)per share:Basic . . . . . . . . . . . . . . . . . . . . . . . . . . . . . 55,299 50,073 49,832 49,471 51,771Diluted . . . . . . . . . . . . . . . . . . . . . . . . . . . . 55,299 50,073 49,832 49,471 52,716
Consolidated Balance Sheet Data:
December 31,
2011 2010 2009 2008 2007
(thousands)
Cash, cash equivalents and restricted cash . . . . $ 32,950 $ 20,889 $ 47,346 $ 77,107 $125,533Short-term investments . . . . . . . . . . . . . . . . . . $ — $ 2,151 $ 13,089 $ 26,280 $ 26,280Working capital . . . . . . . . . . . . . . . . . . . . . . . $ 56,177 $ 51,126 $ 75,455 $140,491 $201,019Total assets . . . . . . . . . . . . . . . . . . . . . . . . . . $113,843 $111,624 $133,073 $208,211 $317,770Total stockholders’ equity . . . . . . . . . . . . . . . . $ 60,145 $ 62,655 $ 94,706 $156,836 $245,283
27

Item 7. Management’s Discussion and Analysis of Financial Condition and Results of Operations
The following discussion and analysis of our financial condition and results of operations should be readin conjunction with Item 6. ‘‘Selected Financial Data,’’ our consolidated financial statements and related notesincluded elsewhere in this document. In addition to historical information, the discussion below containscertain forward-looking statements that involve risks and uncertainties. These forward-looking statementsinclude, but are not limited to, those matters discussed under the heading ‘‘Forward-looking Statements,’’above. Our actual results could differ materially from those anticipated by these forward-looking statements dueto various factors, including, but not limited to, those set forth under Item 1A. ‘‘Risk Factors’’ in this AnnualReport on Form 10-K and elsewhere in this document.
Overview
We are a supplier of semiconductor wafer processing equipment used in the fabrication of integratedcircuits (ICs). Our manufacturing equipment is primarily used for semiconductor manufacturing. Ourmanufacturing equipment utilizes innovative technology to deliver advanced processing capabilities andhigh productivity for the fabrication of current and next-generation ICs. We were incorporated inCalifornia in 1988 and reincorporated in Delaware in 1997.
Our business depends upon capital expenditures by manufacturers of semiconductor devices. Thelevel of capital expenditures by these manufacturers depends upon the current and anticipated marketdemand for such devices. Because the demand for semiconductor devices is highly cyclical, the demand forwafer processing equipment is also highly cyclical. The semiconductor equipment industry is typicallycharacterized by wide swings in operating results as the industry moves through its cycle. In 2011, thesemiconductor capital equipment market was impacted by several natural disasters, the continuing globalmacroeconomic problems, semiconductor inventory overbuild and DRAM oversupply. The DRAM marketdeclined significantly in 2011, with DRAM capital expenditures continuing to soften. Despite the decline inDRAM, the NAND flash memory represented a growth segment in the semiconductor market in 2011,with revenue expected to grow for the year. The transition to mobility products such as tablet and eReaderproducts, smartphones and the solid state drives (SSDs) helped to drive IC demand in the NAND flash,advanced RISC machines (ARM) and some advanced foundry areas. Overall, this resulted in demand thatwas technology-based in anticipation of capacity increases.
In 2011, we solidified our new positions in etch and strip, and expanded RTP into foundry. Weannounced our move into silicon etch with the introduction of our new paradigmE Si system. The newsystem’s capability to perform the expanded silicon etch applications has increased our served availablemarket. Etch now addresses over half of the applications in the total etch market. We grew the etchbusiness by approximately 77 percent and expect etch to contribute a significant portion of total revenue in2012 as more customers select our etch tools based on the process performance and cost of ownership.
In 2011, we gained market share in strip, realizing new positions in foundry, logic, and NAND flash.These positions allowed strip to grow 79 percent over 2010. We introduced our SUPREMA XP5, based onthe production-proven, high-throughput SUPREMA platform providing further productivity value to theindustry. The SUPREMA series provides the technology extendibility, performance, cost of ownership andreliability that chipmakers require for high-volume production of current and future-generation logic,DRAM and flash memory devices. SUPREMA achieved wins at 30 nm and below in both the foundry andmemory markets, which will enable us to participate in advanced volume production facilities in the future.
In 2011, we gained new positions in RTP with our Helios XP system at three major foundry customers,with the first of these now in volume production. We shipped volume levels of our Helios RTP systems to amajor NAND flash memory manufacturer, a new position we gained during the last cycle. Additionally,our Millios millisecond anneal system (MSA) is now positioned at three key foundry/logic customers.
28

In 2011, our revenue increased by $46.6 million to $184.9 million from $138.3 million in 2010, due toour product traction, growth in our etch business and expansion of our strip products into the logic/foundrysector. Gross profit in 2011 was $56.2 million compared to a $39.4 million in 2010. The increase in grossprofit was primarily due to operating leverage from higher net sales, improved factory utilization andcontinued traction with our cost-reduction measures. Our operating expenses in 2011 remained relativelyflat compared with 2010, at $72.8 million, but is significantly reduced from the levels prior to the downturn.Excluding restructuring charges, our 2011 operating expenses decreased by $1.8 million as compared to2010. The impact of having better operating leverage from higher net sales and the cost-reductionmeasures contributed to a lower net loss in 2011 of $18.0 million compared to $33.4 million in 2010.
Results of Operations
Years Ended December 31, 2011 and 2010
The following table sets forth our consolidated results of operations for the years ended December 31,2011 and 2010, and the year-over-year increase (decrease) in our results, expressed both in dollar amounts(in thousands) and as a percentage of net sales, except where indicated:
Year Ended December 31,
2011 2010 Increase (Decrease)
(thousands) % (thousands) % (thousands) %
Net sales . . . . . . . . . . . . . . . . . . . . . . . . $184,947 100.0 $138,336 100.0 $46,611 33.7Cost of sales . . . . . . . . . . . . . . . . . . . . . 128,699 69.6 98,952 71.5 29,747 30.1
Gross profit . . . . . . . . . . . . . . . . . . . . 56,248 30.4 39,384 28.5 16,864 42.8
Operating expenses:Research, development and
engineering . . . . . . . . . . . . . . . . . . . 26,189 14.2 27,791 20.1 (1,602) (5.8)Selling, general and administrative . . . . 44,720 24.2 44,902 32.5 (182) (0.4)Restructuring charges . . . . . . . . . . . . . 1,889 1.0 (114) (0.1) 2,003 n/m(1)
Total operating expenses . . . . . . . . . 72,798 39.4 72,579 52.5 219 0.3
Loss from operations . . . . . . . . . . . . . . . (16,550) (9.0) (33,195) (24.0) 16,645 (50.1)Interest income (expense), net . . . . . . . . 107 0.1 5 — 102 2,040.0Other income (expense), net . . . . . . . . . . 163 0.1 108 0.1 55 50.9
Loss before income taxes . . . . . . . . . . . . (16,280) (8.8) (33,082) (23.9) 16,802 (50.8)Provision for income taxes . . . . . . . . . . . 1,670 0.9 321 0.2 1,349 420.2
Net income (loss) . . . . . . . . . . . . . . . . . . $ (17,950) (9.7) $(33,403) (24.1) $15,453 (46.3)
(1) Not meaningful
Net Sales Net sales were $184.9 million in 2011, an increase of $46.6 million or 34 percent, compared to$138.3 million in 2010. The increase in net sales was primarily due to the improvement in the globaleconomy and the semiconductor equipment sector as compared to the prior year, and from our continuedpenetration in the etch market which contributed over one-third of our system sales in 2011. In 2011,system sales generated from the etch market were over $22.7 million higher than in 2010.
In 2011, international sales to customers in Europe and Asia continued to account for a significantportion of our total net sales, comprising approximately 94 percent of net sales in 2011, compared to95 percent in 2010. We anticipate that international sales will continue to account for a significant portionof our net sales.
29

Cost of Sales Our cost of sales consists of the costs associated with manufacturing our products, andincludes the purchase of raw materials and related overhead, labor, warranty costs, charges for excess andobsolete inventory and costs incurred by our contract manufacturers in the production of our components,major subassemblies/modules and complete systems. In 2011, we reclassified certain current and priorperiod costs, including $5.2 million in 2010 related to our spare parts business from selling, general andadministrative expense to cost of sales, as they more appropriately reflect costs associated with revenuegenerating activities.
Cost of sales was $128.7 million in 2011, an increase of $29.7 million or 30 percent, compared to$99.0 million in 2010. The increase in cost of sales was primarily related to costs associated with highervolumes of sales in 2011.
Gross Profit Gross profit is calculated as net sales less cost of sales. Gross margin rate is gross profitreflected as a percentage of net sales.
Gross margin rate improved from 28 percent in 2010 to 30 percent in 2011. The increase in grossmargin in 2011 was primarily due to operating leverage from higher net sales volumes and improvedutilization of our internal manufacturing operations, partially offset by an increase of approximately$0.7 million in warranty provisions related to servicing our new products and a higher number of sales fromour lower margin Aspen III systems, as compared to our total sales mix. Gross margin rate was favorablyimpacted in 2011 and 2010, as we recorded a net benefit of $1.7 million and $3.1 million, respectively,related to the sale of previously written down inventories, net of inventory valuation charges.
Our gross margin rate has varied over the years and will continue to be affected by many factors,including competitive pressures, product mix, inventory reserves, economies of scale, material and othercosts, overhead absorption levels and the timing of revenue recognition.
Research, Development and Engineering Research, development and engineering expenses consistprimarily of salaries and related costs of employees engaged in research, development and engineeringactivities, costs of product development and depreciation on equipment used in the course of research,development and engineering activities.
Research, development and engineering expenses were $26.2 million in 2011, a decrease of$1.6 million or 6 percent, compared to $27.8 million in 2010. The decrease in research, development andengineering expenses was primarily due to a decrease of $0.8 million in depreciation expense on lab toolsresulting from significantly lower capital expenditures in 2009 through 2011 as compared to earlier years,and from a $0.4 million decrease in engineering materials used in new product development projects.
Selling, General and Administrative Selling, general and administrative expenses consist primarily ofpersonnel-related expenses, as well as legal and professional fees, facilities expenses (excluding researchand development focused sites), insurance expenses, amortization of evaluation systems and certaininformation technology costs.
Selling, general and administrative expenses were $44.7 million in 2011, a decrease of $0.2 millioncompared to $44.9 million in 2010. The slight decrease in selling, general and administrative expenses wasprimarily due to a $1.4 million allocation of field service costs to cost of sales as a result of higherutilization rates, a decrease of $0.7 million in outside service spending levels and a decrease of stockcompensation expense of $0.3 million, partially offset by a $1.4 million reduction year over year in thecollection of certain accounts receivable previously provided for in the allowance for doubtful accounts anda $0.9 million increase in amortization expense for evaluation tools placed at customer sites in late 2010.
Restructuring Charges In 2011, we incurred $1.4 million in contract termination costs related to revisedestimates of our future rent obligations associated with a vacated leased facility, net of sublease income.The revised estimates are based on a final settlement with the landlord, which includes exiting from thelease arrangement in July 2015, rather than the initial lease expiration of March 2019. The final settlement
30

also reduces our total future lease commitments from $9.6 million to $3.8 million, which includes a leasetermination and other fees of $1.0 million. During the fourth quarter of 2011, we also initiated a costreduction plan that includes workforce reductions and transitioning our operations in Canada to ourGermany facility. As of December 31, 2011, we recorded $0.5 million in employee severance benefitsrelated to this restructuring. We expect to incur approximately $1.1 million in employee separation andother charges in 2012 related to this restructuring plan.
In 2010, based on revised estimates, we reversed a net $0.1 million in restructuring reserves, related toearlier cost reduction plans.
Other Income (Expense), net Other income (expense), net was $0.2 million of income in 2011, anincrease of $0.1 million when compared to $0.1 million of income in 2010. The increase in income was dueto a $1.6 million gain related to the extinguishment of certain liabilities, partially offset by net foreignexchange losses primarily related to our foreign-denominated balances at our U.S. operations.
Provision for Income Taxes The provision for income taxes was $1.7 million in 2011, which consisted ofdeferred tax expense from the creation of a valuation allowance of $3.7 million against deferred tax assetsin a foreign jurisdiction, current foreign taxes of $0.9 million and current federal and state income taxes of$0.3 million, partially offset by a $3.1 million benefit from the release of various foreign reserves. Theprovision for income taxes was $0.3 million in 2010, which consisted of a provision for foreign taxes of$0.9 million, partially offset by a $0.5 million benefit from the release of various foreign reserves and abenefit for federal and state income taxes of $0.1 million.
Currently, we have provided a full valuation allowance against deferred tax assets for all jurisdictionsdue to uncertainties and other negative evidence in our current operations and our expectations of futureoperations. It is more likely than not that our deferred tax assets will not be realized. Our provision forincome taxes could be favorably impacted going forward if our results of operations and forecasts forfuture profitability improve sufficiently to indicate that the related deferred tax assets will be realized. Sucha change in management’s expectations could result in a material change to our valuation allowanceassessment and the resulting income tax provision.
31

Years Ended December 31, 2010 and 2009
The following table sets forth our consolidated results of operations for the years ended December 31,2010 and 2009, and the year-over-year increase (decrease) in our results, expressed both in dollar amounts(in thousands) and as a percentage of net sales, except where indicated:
Year Ended December 31,
2010 2009 Increase (Decrease)
(thousands) % (thousands) % (thousands) %
Net sales . . . . . . . . . . . . . . . . . . . . . . . . . $138,336 100.0 $ 42,748 100.0 $95,588 223.6Cost of sales . . . . . . . . . . . . . . . . . . . . . . . 98,952 71.5 46,960 109.9 51,992 110.7
Gross profit (loss) . . . . . . . . . . . . . . . . . 39,384 28.5 (4,212) (9.9) 43,596 n/m(1)
Operating expenses:Research, development and engineering . 27,791 20.1 25,340 59.3 2,451 9.7Selling, general and administrative . . . . . 44,902 32.5 44,863 104.9 39 0.1Restructuring charges . . . . . . . . . . . . . . . (114) (0.1) 2,596 6.1 (2,710) n/m(1)
Total operating expenses . . . . . . . . . . . 72,579 52.5 72,799 170.3 (220) (0.3)
Loss from operations . . . . . . . . . . . . . . . . (33,195) (24.0) (77,011) (180.2) 43,816 (56.9)Interest income (expense), net . . . . . . . . . . 5 — 532 1.2 (527) (99.1)Other income (expense), net . . . . . . . . . . . 108 0.1 1,371 3.2 (1,263) (92.1)
Loss before income taxes . . . . . . . . . . . . . . (33,082) (23.9) (75,108) (175.8) 42,026 (56.0)Provision for (benefit from) income taxes . . 321 0.2 (8,066) (18.9) 8,387 n/m(1)
Net income (loss) . . . . . . . . . . . . . . . . . . . $ (33,403) (24.1) $(67,042) (156.9) $33,639 (50.2)
(1) Not meaningful
Net Sales Net sales were $138.3 million in 2010, an increase of $95.6 million or 224 percent, comparedto $42.7 million in 2009. The increase in net sales was primarily due to the improvement in the globaleconomy and the semiconductor equipment sector. The low level of net sales in 2009 reflected the troughof the downturn in the semiconductor equipment industry. Since sales bottomed out in the first quarter of2009, we have experienced seven consecutive quarters of growth, as the upturn has moved from a period ofprincipally technology purchases to the current capacity building phase of the cycle. Accordingly, theyear-over-year increase in sales was broad-based across all of our products. In addition, our penetration ofthe etch market during 2010 contributed over 30 percent to our system sales compared with approximately14 percent in 2009.
In 2010, international sales to customers in Europe and Asia, continued to account for a significantportion of our total net sales, comprising approximately 95 percent of net sales in 2010, compared to92 percent in 2009.
Cost of Sales Cost of sales was $99.0 million in 2010, an increase of $52.0 million or 111 percent,compared to $47.0 million in 2009. The increase in cost of sales was primarily related to costs associatedwith increased product sales resulting from improved market conditions in 2010 and realizing the benefitsof previous cost reduction efforts described more fully in Note 6. Restructuring Charges.
In 2011, we reclassified certain current and prior period costs, including $5.2 million in 2010 and $2.1 million in 2009 related to our spare parts business from selling, general and administrative expense tocost of sales, as they more appropriately reflect costs associated with revenue generating activities.
Gross Profit (Loss) Gross margin rate improved to 28 percent in 2010, compared to a negative10 percent in 2009. The increase in gross margin in 2010 was primarily due to operating leverage from
32

higher net sales volumes, sales of previously written down inventories and an increase in absorption levels,partially offset by an increase in warranty provisions related to the higher net sales. Gross margin rate wasfavorably impacted in 2010 and unfavorably impacted in 2009, as we recorded a net benefit of $3.1 millioncompared to a net charge of $14.2 million in 2009, related to the sale of previously written downinventories, net of inventory valuation charges.
Research, Development and Engineering Research, development and engineering expenses were$27.8 million in 2010, an increase of $2.5 million or 10 percent, compared to $25.3 million in 2009. Theincrease in research, development and engineering expenses was primarily due to a $1.6 million increase inmaterials used in new product development projects and a $1.2 million increase in salaries and relatedcosts resulting from increased headcount and a reduction in the number of work furloughs throughout2010, partially offset by a decrease of $0.6 million in depreciation and amortization related to equipmentthat was fully depreciated in 2009.
Selling, General and Administrative Selling, general and administrative expenses remained flat in 2010at $44.9 million, as compared to $44.9 million in 2009. Selling, general and administrative expensesincreased as a result of higher level of revenues and related business activities in 2010, including increasesin costs related to legal fees, sales commissions and amortization of evaluation systems, offset by areduction year over year in the collection of certain accounts receivable previously provided for in theallowance for doubtful accounts.
Restructuring Charges In response to declining revenues, we implemented several restructuringprograms to reduce our cost structure in 2008 and 2009, which combined to reduce our workforce byapproximately 40 percent over those two years. Restructuring charges recorded under these programs wereprimarily for estimated employee severance costs and lease termination costs, which have since beenadjusted to reflect revised estimates and actual amounts paid. In 2010, based on revised estimates, wereversed a net $0.1 million in restructuring reserves, which is included in the accompanying consolidatedstatement of operations. In 2009, restructuring expenses were $2.6 million, comprised of $2.4 million inemployee severance costs and $0.2 million in lease termination costs.
Interest and Other Income (Expense), Net Interest income was $0.1 million in 2010, a decrease of$0.5 million when compared to $0.6 million in 2009. The decrease in interest income was primarily due tolower cash investment balances during fiscal 2010.
Other income (expense), net was $0.1 million of income in 2010, a decrease of $1.3 million whencompared to $1.4 million of income in 2010. The decrease in foreign currency gains related to thesignificant fluctuation in our foreign-denominated balances at our U.S. operations
Provision for (Benefit from) Income Taxes Provision for (benefit from) income taxes was a $0.3 millionnet provision in 2010, which consisted of a $0.4 million provision for foreign taxes partially offset by a$0.1 million benefit for federal and state income taxes. Provision for (benefit from) income taxes in 2009was an $8.1 million net benefit, which consisted of a $9.8 million benefit from the settlement of a Germantax audit for tax years 2001 to 2004, partially offset by provisions for foreign taxes and for federal and stateincome taxes of $1.6 million and $0.2 million, respectively.
Liquidity and Capital Resources
Our cash and cash equivalents, restricted cash and short-term investments were $32.9 million as ofDecember 31, 2011, an increase of approximately $9.9 million, as compared to $23.0 million as ofDecember 31, 2010. Stockholders’ equity as of December 31, 2011 was $60.1 million, as compared to$62.7 million as of December 31, 2010. Working capital as of December 31, 2011 was $56.2 million, ascompared to $51.1 million as of December 31, 2010.
33

Liquidity and Capital Resources Outlook
As of December 31, 2011, we had cash and cash equivalents of $31.1 million and working capital of$56.2 million. We believe that these balances will be sufficient to fund our working and other capitalrequirements over the course of the next twelve months. Our operations require careful management ofour cash and working capital balances. Our liquidity is affected by many factors including, among others,fluctuations in our revenue, gross profits and operating expenses, as well as changes in our operating assetsand liabilities. The cyclicality of the semiconductor industry makes it difficult to predict our future liquidityneeds with certainty. Any upturn in the semiconductor industry would result in short-term uses of cash tofund inventory purchases and accounts receivable. Alternatively, any renewed softening in the demand forour products or ineffectiveness of our cost reduction efforts may cause us to incur additional losses in thefuture and lower our cash balances. We may need additional funds to support our working capitalrequirements, operating expenses or for other requirements. Historically, we have relied on a combinationof fundraising from the sale and issuance of equity securities (such as our common stock offering inMay 2011) and cash generated from product, service and royalty revenues to provide funding for ouroperations. We will continue to review our expected cash requirements and take appropriate costreduction measures to ensure that we have sufficient liquidity. We periodically review our liquidity positionand may decide to raise additional funds, and may seek them from a combination of sources includingissuance of equity or debt securities through public or private financings. These financing options may notbe available on a timely basis, or on terms acceptable to us, and could be dilutive to our stockholders. Ifadequate funds are not available on acceptable terms, our ability to achieve our intended long-termbusiness objectives could be limited.
Contractual Obligations
Under U.S. generally accepted accounting principles, certain obligations and commitments are notrequired to be included in our consolidated balance sheet. These obligations and commitments, whileentered into in the normal course of business, may have a material impact on our liquidity.
Our contractual commitments as of December 31, 2011 are summarized in the following table:
Vendor CommitmentsOperating TotalLease Payments Sub-Contractor Inventory Other(1) Total Commitments
(thousands)
2012 . . . . . . . . . . . . . . . . . . $ 3,943 $1,913 $19,878 $5,837 $27,628 $31,5712013 . . . . . . . . . . . . . . . . . . 3,545 — — 1,742 1,742 5,2872014 . . . . . . . . . . . . . . . . . . 3,302 — — 73 73 3,3752015 . . . . . . . . . . . . . . . . . . 3,088 — — 1 — 3,0882016 . . . . . . . . . . . . . . . . . . 1,884 — — — 1,884Thereafter . . . . . . . . . . . . . . 2,291 — — — 2,291
$18,053 $1,913 $19,878 $7,653 $29,443 $47,496
(1) Other vendor commitments primarily include service-related contracts and agreements forinformation technology support, commitments for non-inventory purchases of assets, and otherservice-related commitments.
We continue to lease one building previously used to house the administrative functions related to wetsurface preparation products in Exton, Pennsylvania. The original lease for the administrative building wasscheduled to expire on March 31, 2019, with a current rental cost of approximately $0.9 million annually. InDecember 2011, we reached a final settlement with the landlord, which includes exiting from the leasearrangement in July 2015. The final settlement also reduces our total future lease obligations from$9.6 million to $3.8 million, which includes a lease termination and broker’s fee of $1.0 million. Of the
34

$3.8 million in future lease obligations, we expect to pay out $1.7 million in 2012 and the remaining balanceon a declining basis through July 2015. We continue to sublease a portion of the Exton facility, cancelableby our subtenant anytime after December 31, 2012. Our sublease income under the current subleaseagreement was $0.6 million for 2011. In determining facilities lease loss liability, various assumptions weremade, including the time period over which the buildings will be vacant, expected sublease terms andexpected sublease rates. At December 31, 2011 and 2010, we had an accrued liability balance of$2.3 million and $0.9 million, respectively, related to this facility. Adjustments to this accrual will be madein future periods, if events and circumstances change.
Our deferred income taxes have been excluded from the table above because the related future cashoutflows are uncertain. As of December 31, 2011, we had approximately $1.1 million of net unrecognizedtax benefits that may be subject to examination by applicable tax authorities. We are uncertain of thetiming and amounts of any potential future payments related to these unrecognized tax benefits.
In connection with our acquisition of Vortek Industries, Ltd (Vortek) in 2004, we became party to anagreement between Vortek and the Canadian Minister of Industry (the Minister) relating to an investmentin Vortek by Technology Partnerships Canada. Under the agreement, as amended, we, or Vortek (renamedMattson Technology, Canada, Inc. or MTC) agreed to various covenants, including (i) payment by us of aroyalty to the Minister of 1.4 percent of revenues from certain Flash RTP products, up to a total ofCAD 14,269,290 (approximately $14.0 million based on the applicable exchange rate as of December 31,2011), (ii) MTC maintaining a specified average workforce of employees in Canada through October 27,2009, (iii) investment of a certain amount by October 27, 2009 and certain other covenants concerningmanufacturing obligations. Under the provisions of this agreement, if we, or MTC, did not materiallysatisfy the obligations pursuant to the covenants, the Minister could have demanded payment of liquidateddamages in the amount of CAD 14,269,290 less any royalties paid by MTC or us to the Minister. As ofDecember 31, 2009, we were no longer subject to covenants (ii) and (iii), as discussed above; but are stillsubject to covenant (i), relating to the payment of royalty on revenues from certain Flash RTP productsuntil 2020. However, if MTC is dissolved, files for bankruptcy or does not materially comply with certainother terms and conditions of the contract prior to its expiration on December 31, 2020, we could besubject to liquidated damages in the amount of CAD 14,269,290 less any royalties paid by MTC or us tothe Minister.
Off-Balance Sheet Arrangements
As of December 31, 2011, we did not have any significant ‘‘off-balance sheet’’ arrangements as definedin Item 303 (a)(4)(ii) of Regulation S-K.
Cash Flows from Operating Activities
In 2011, net cash used in operations was $2.4 million, comprised primarily of a net loss of$18.0 million, partially offset by $0.8 million of cash increases reflected in the net change in assets andliabilities and non-cash charges of $14.8 million. Cash flow increases resulting from the net change in assetsand liabilities primarily consisted of a $6.3 million increase in deferred revenue, a $3.1 million increase inaccrued liabilities, a $2.5 million increase in other liabilities, a $2.3 million decrease in inventories and a$0.2 million increase in other assets, partially offset by a $3.9 decrease in accounts payable, a $3.3 millionincrease in prepaid expenses and other current assets, a $3.3 million increase in accounts receivable andadvance billings, and a $3.1 million decrease in income taxes payable, non-current. The increase inaccounts receivable and advance billings reflects the increase in sales and business activities in 2011 ascompared to 2010. Non-cash charges consisted primarily of $9.0 million of depreciation and amortization,$3.7 million for deferred income taxes and $2.3 million of stock-based compensation, partially offset by a$0.2 million gain on sale of fixed assets.
35

In 2010, net cash used in operations was $35.9 million, comprised primarily of a net loss of$33.4 million and $14.1 million of cash decreases reflected in the net change in assets and liabilities,partially offset by non-cash charges of $11.6 million. Cash flow decreases resulting from the net change inassets and liabilities primarily consisted of a $15.1 million increase in accounts receivable and advancebillings, an $10.2 million increase in inventories and a $5.8 decrease in accrued liabilities, income taxespayable, non-current and other liabilities; partially offset by a $13.3 million increase in accounts payable, a$2.7 million increase in deferred revenue and a $1.0 million combined decrease in prepaid expenses, othercurrent assets and other assets. The increases in accounts receivable, inventories and accounts payablereflect the sharp increase in sales and business activities in 2010 as compared to 2009. Non-cash chargesconsisted primarily of $9.2 million of depreciation and amortization, $2.7 million of stock-basedcompensation, $0.7 million for deferred taxes and $0.1 million of other non-cash charges; partially offset by$1.2 million from the collection of accounts receivable previously provided for in the allowance fordoubtful accounts during the recent industry downturn.
In 2009, net cash used in operations was $42.3 million, comprised primarily of a net loss of$67.0 million, offset by non-cash charges of $6.0 million and $18.8 million of cash increases reflected in thenet change in assets and liabilities. Non-cash charges consisted primarily of $13.6 million in depreciationand amortization charges, $2.9 million in stock-based compensation and $0.3 million in charges for othernon-cash items; partially offset by a $8.5 million net tax benefit, primarily consisting of a $8.3 millionreversal of certain foreign deferred tax liabilities, and $2.4 million from the collection of accountsreceivable previously provided for in the allowance for doubtful accounts during the recent industrydownturn. Cash flow increases resulting from the net change in assets and liabilities primarily consisted ofa $17.8 million decrease in inventories, a $5.7 million decrease in accounts receivable and advancedbillings, a $1.0 million decrease in prepaid expenses and other current assets and a $0.6 million combinedincrease in accounts payable, income taxes payable, non-current and other liabilities; partially offset by a$3.6 million decrease in accrued liabilities, a $2.5 million reduction in deferred revenue and a $0.3 millionincrease in other assets. The decrease in accounts receivable and deferred revenue were largely reflectiveof the 68 percent decrease in net sales in 2009. The decreases in inventories were the result of our effortsto maximize utilization of available inventory, thereby minimizing cash outlays on new inventories.
Cash provided by operations may fluctuate in future periods as a result of a number of factors,including fluctuations in our net sales and operating results, amount of revenue deferred, inventorypurchases, collection of accounts receivable and timing of payments.
Cash Flows from Investing Activities
In 2011, net cash provided by investing activities was $3.2 million, comprised primarily of $2.2 millionof maturities of available-for-sale investments, $2.1 million decrease in restricted cash used to securestandby letters of credit provided to certain vendors, and $0.8 million in proceeds from the sale of propertyand equipment, partially offset by $1.9 million of property and equipment purchases.
In 2010, net cash provided by investing activities was $7.2 million, comprised primarily of $10.8 millionof maturities of available-for-sale investments in excess of purchases, partially offset by $2.0 million ofproperty and equipment purchases and a $1.6 million increase in restricted cash. Our property andequipment purchases were primarily for tools and equipment used in our manufacturing activities. Theincrease in restricted cash represents purchases of certificates of deposit used to secure standby letters ofcredit we provided to certain vendors during the year.
In 2009, net cash provided by investing activities was $9.3 million, comprised primarily of $12.7 millionof maturities of available-for-sale investments in excess of purchases, partially offset by a $2.0 millionincrease in restricted cash and $1.4 million of property and equipment purchases.
36

Cash Flows from Financing Activities
In 2011, net cash provided by financing activities was $12.9 million, consisting primarily of$12.6 million of proceeds from our public offering on May 16, 2011 of 7.8 million shares of our commonstock at a price to the public of $1.80 per share of common stock. The $12.6 million of proceeds is net ofunderwriting discounts and offering expenses of $1.5 million. The net proceeds from this offering are beingused for general corporate purposes, including working capital. In addition, we also realized $0.3 million innet proceeds from employee stock plan transactions.
In 2010, net cash provided by financing activities was $0.4 million, consisting of net proceeds fromemployee stock plan transactions.
In 2009, net cash provided by financing activities was $0.2 million, consisting of net proceeds fromemployee stock plan transactions.
Critical Accounting Policies and Use of Estimates
Management’s Discussion and Analysis of Financial Condition and Results of Operations discussesour consolidated financial statements, which have been prepared in accordance with accounting principlesgenerally accepted in the United States of America. The preparation of these financial statements requiresmanagement to make estimates and assumptions that affect the reported amounts of assets and liabilities,the disclosure of contingent assets and liabilities at the date of the financial statements and the reportedamounts of revenues and expenses during the reporting periods. On an on-going basis, managementevaluates its estimates and judgments, including those related to reserves for excess and obsoleteinventory, warranty obligations, bad debts, goodwill, intangible assets, income taxes, restructuring costs,contingencies and litigation. Management bases its estimates and judgments on historical experience andon various other factors that are believed to be reasonable under the circumstances. These form the basisfor making judgment about the carrying values of assets and liabilities that are not readily apparent fromother sources. Actual results may differ from these estimates under different assumptions or conditions.
We consider certain accounting policies related to revenue recognition, allowance for doubtfulaccounts, warranty obligations, inventories, goodwill and other intangible assets, impairment of long-livedassets, restructuring, income taxes and stock-based compensation as critical to our business operations andan understanding of our results of operations. See Note 2. Summary of Significant Accounting Policies of theaccompanying consolidated financial statements for a summary of our significant accounting policies.
Revenue Recognition. We derive revenues from the following primary sources—equipment (tool orsystem) sales, spare part sales and service and maintenance contracts. In accordance with the authoritativeguidance on revenue recognition, we recognize revenue on equipment sales as follows: 1) for equipmentsales of existing products with new specifications and for sales of new products, revenue is recognized uponcustomer acceptance; 2) for equipment sales to existing customers who have purchased the sameequipment with the same specifications and previously demonstrated acceptance, or equipment sales tonew customers purchasing existing products with established reliability, we recognize revenue on a multipleelement approach in which revenue is recognized upon the delivery of the separate elements to thecustomer and when we receive customer acceptance or is otherwise released from our customeracceptance obligations. For multiple element arrangements initiated at or prior to December 31, 2010, therevenue relating to the undelivered elements is deferred at its estimated fair values until delivery of thedeferred elements; and for arrangements initiated or materially modified subsequent to December 31,2010 containing multiple elements, the revenue relating to the undelivered elements is deferred using therelative selling price method, which allocates revenue to each element using the estimated selling prices forthe deliverables when vendor-specific objective evidence or third-party evidence is not available. Themaximum revenue we recognize on a delivered element is limited to the amount that is not contingentupon the delivery of additional items such as installation and customer acceptance. Under this approach,generally 90 percent of the total invoice amount is recognized as revenue upon shipment and transfer of
37

title; 100 percent of the associated tool costs is also recognized upon shipment; and the remaining portion,generally 10 percent of the total invoice amount, is contingent upon customer acceptance and is recognizedonce installation services are completed and final customer acceptance of the tool is received. From timeto time, we allow customers to evaluate systems, with the customer maintaining the right to return thesystems at its discretion with limited or no penalty. For this type of arrangement, we do not recognizerevenue on the evaluation systems until customer acceptance is received. For spare parts, we recognizerevenue upon shipment. For service and maintenance contracts, we recognize revenue on a straight-linebasis over the service period of the related contract or as services are performed. In all cases, revenue isonly recognized when persuasive evidence of an arrangement exists, delivery has occurred, the price isfixed or determinable and collectability is reasonably assured. Accounts receivable for which revenue hasnot been recognized are classified as advance billings.
Allowance for Doubtful Accounts. We perform ongoing credit evaluations of our customers and recordspecific allowances for bad debts when a customer is unable to meet its financial obligations, as in the caseof bankruptcy filings or deteriorated financial position. We estimate the allowances for bad debts for allother customers based on factors such as current trends, the length of time the receivables are past dueand historical collection experience. We write-off a receivable when all rights, remedies and recoursesagainst the account and its principals are exhausted and record a benefit when previously reservedaccounts are collected.
Warranty. The warranty we offer on system sales is generally 12 months, except where previouscustomer agreements state otherwise. A provision for the estimated cost of warranty, based on historicalcosts, is recorded as a cost of sale when the revenue is recognized for the sale of the equipment or parts.Our warranty obligations require us to repair or replace defective products or parts during the warrantyperiod at no cost to the customer. The actual system performance and/or field expense profiles may differfrom historical experience, and in those cases we adjust our warranty accruals accordingly. Actual warrantyreserves and settlements against reserves are highly dependent on our system volumes.
Inventories. Our inventories are stated at the lower of cost or market, with cost determined on afirst-in, first-out basis, and include material, labor and manufacturing overhead costs. Finished goods arereported as inventories until the point of title transfer to the customer. Under our general terms of sale,title transfers when we complete physical transfer of the products to the freight carrier unless othercustomer practices prevail. All intercompany profits related to the sales and purchases of inventorybetween our legal entities are eliminated from the consolidated financial statements.
Inventory Valuation. Our policy is to assess the valuation of all inventories, including manufacturingraw materials, work-in-process, finished goods and spare parts, in each reporting period. Although weattempt to accurately forecast future inventory demand, given the competitive pressures and cyclicality ofthe semiconductor industry, there may be significant unanticipated changes in demand or technologicaldevelopments that could have a significant impact on the value of our inventories and reported operatingresults. The carrying value of our inventory is reduced for estimated excess and obsolescence by thedifference between its cost and the estimated market value based upon assumptions about future demand.We evaluate the inventory carrying value for potential excess and obsolete inventory exposures byanalyzing historical and anticipated demand. In addition, inventories are evaluated for potentialobsolescence due to the effect of known and anticipated engineering change orders and new products. Ifactual demand were to be substantially lower than estimated, additional inventory adjustments for excessor obsolete inventory might be required, which could have a material adverse effect on our business,financial condition and results of operations.
Fair Value Measurements of Assets and Liabilities. We measure certain of our assets at fair value, usingobservable market data. The authoritative guidance on fair value measurement defines fair value as an exitprice, representing the amount that would be received to sell an asset or paid to transfer a liability in anorderly transaction between market participants, and establishes valuation hierarchy based on the level of
38

independent objective evidence available regarding the value of assets or liabilities. The authoritativeguidance also establishes three classes of assets or liabilities: Level 1 consists of assets and liabilities forwhich there are quoted prices in active markets; Level 2 consists of assets and liabilities for whichobservable inputs other than Level 1 inputs are used such as prices for similar assets or liabilities in activemarkets or for identical assets or liabilities in less active markets and model-derived valuations for whichthe variables are derived from or corroborated by observable market data; and Level 3 consists of assetsand liabilities for which there are unobservable inputs to the valuation methodology that are significant tothe measurement of the fair value. Our cash equivalents and investment instruments are classified withinLevel 1 of the fair value hierarchy, as these instruments are valued using quoted market prices. We had noassets or liabilities classified within Level 2 or 3 as of December 31, 2011 and 2010.
Impairment of Long-Lived Assets. We review our long-lived assets, including property and equipment,intangibles and other long-lived assets, for impairment whenever events or changes in circumstancesindicate that the carrying amount of these assets may not be recoverable. Recoverability is measured by acomparison of the assets’ carrying amount to their expected future undiscounted net cash flows. If suchassets are considered to be impaired, the impairment is measured based on the amount by which thecarrying amount of the asset exceeds its fair value. In 2008, we recorded impairment charges to write offintangible assets of $6.6 million and certain lab assets of $2.8 million to adjust for the deteriorating value ofthese assets resulting from the decline in expected cash flows attributable to the assets. There were no suchimpairment charges in 2009 through 2011.
Restructuring. We recognize expenses related to employee termination benefits when the benefitarrangement is communicated to the employee and no significant future services are required. If anemployee is required to render service until a specific termination date in order to receive the terminationbenefits, the fair value of the associated liability would be recognized ratably over the future service period.The costs of severance are determined by local statutory requirements and our policies. For some entities,where salaries are paid during the notice period, a portion of the severance reserves would be based onestimates of the ability to find employment during the notice period, and we would determine the reservesin accordance with these estimates.
We recognize the present value of facility lease termination obligations, net of estimated subleaseincome and other exit costs, when we have future lease payments with no future economic benefit. Infuture periods, we will record accretion expense to increase the liability to an amount equal to theestimated future cash payments necessary to exit the lease. This requires a significant amount of judgmentand management estimation in order to determine the expected time frame it will take to secure asubtenant, the amount of sublease income to be received and the appropriate discount rate to calculate thepresent value of the future cash flows. If actual lease exit costs differ from estimates, we would adjust therestructuring charge, which would impact net income in the period any adjustment was recorded.
Income Taxes. We recognize the tax benefit from an uncertain tax position only if it is more likely thannot that the tax position will be sustained on examination by taxing authorities, based on the technicalmerits of the position. The tax benefits recognized in the financial statements from such a position aremeasured based on the largest benefit that has a greater than fifty percent likelihood of being realizedupon ultimate resolution.
For all tax jurisdictions, we recorded a 100 percent valuation allowance against our net deferred taxasset as we expect it is more likely than not that we will not realize our net deferred tax asset as ofDecember 31, 2011. In assessing the need for a valuation allowance, we consider historical levels of incomeand losses, expectations and risks associated with estimates of future taxable income and ongoing prudentand feasible tax planning strategies. In the event we determine that we would be able to realize additionaldeferred tax assets in the future in excess of the net recorded amount, or if we subsequently determine thatrealization of an amount previously recorded is unlikely, we would record an adjustment to the deferredtax asset valuation allowance, which would change income in the period of the adjustment.
39

Stock-based Compensation. We measure the fair value of all stock-based awards, including stockoptions, restricted stock units, and purchase rights under our employee stock purchase plan, on the date ofgrant, and we recognize the related stock-based compensation expense on a straight-line basis over therequisite service period, which is generally the vesting period.
We use the Black-Scholes option-pricing model to determine the fair value of certain of our stock-based awards. The determination of fair value using the Black-Scholes model is affected by our stock priceas well as assumptions regarding a number of complex and subjective variables, which includes expectedstock price volatility over the term of the awards, actual and projected employee exercise and cancellationbehaviors, risk-free interest rates, and expected dividends.
We estimate the expected life of options based on an analysis of our historical experience of employeeexercise and post-vesting termination behavior considered in relation to the contractual life of the option;expected volatility is based on the historical volatility of our common stock; and the risk-free interest rate isequal to the U.S. Treasury rates, with maturity approximating the expected life of the option. We do notcurrently pay cash dividends on our common stock and do not anticipate doing so in the foreseeablefuture; accordingly, the expected dividend yield is zero.
We estimate forfeiture rates on stock-based awards at the time of grant and revise those estimates insubsequent periods if actual forfeitures differ from those estimates. Such forfeiture estimates are based onhistorical experience. If the assumptions for estimating stock-based compensation expense change infuture periods, the amount of future stock-based compensation may differ significantly from the amountswe recorded in the current and prior periods.
Stock-based compensation expenses in 2011, 2010 and 2009 were $2.3 million, $2.7 million and$2.9 million, respectively.
New Accounting Pronouncements
For a description of new accounting pronouncements, including the expected dates of adoption andestimated effects, if any, on our consolidated financial statements, see Note 2. Summary of SignificantAccounting in Part II, Item 8 of this Form 10-K.
Item 7A. Quantitative and Qualitative Disclosures About Market Risk
We are exposed to various market risks related to fluctuations in foreign currency exchange rates andinterest rates. We may use derivative financial instruments to mitigate certain risks related foreignexchange rates. We do not use derivatives or other financial instruments for trading or speculativepurposes.
Interest Rate Risk
As of December 31, 2011, our portfolio consisted of $31.1 million in cash and cash equivalents. We didnot have any short-term investments as of December 31, 2011. Our exposure to interest rate risk relatesprimarily to short-term investments, which we may purchase at different points in time, and the potentiallosses arising from changes in those interest rates. Our investment objective is to achieve the maximumreturn compatible with capital preservation and our liquidity requirements. Our strategy is to invest ourcash in a manner that preserves capital, maintains sufficient liquidity to meet our cash requirements, andmaximizes yields consistent with approved credit risk. We place our investments with high credit qualityissuers and, by policy, limit the amount of our credit exposure to any one issuer. Our portfolio includesonly marketable securities with active secondary or resale markets to ensure portfolio liquidity. We classifyour cash equivalents and short-term investments in accordance with authoritative guidance on accountingfor investments in debt and equity securities; consider investments in instruments purchased with an
40

original maturity of 90 days or less to be cash equivalents; and classify our short-term investments asavailable-for-sale.
Our cash equivalents and short-term investment portfolios consist primarily of money market fundsand U.S. government and government-sponsored debt securities. Our short-term investments are reportedat fair value with unrealized gains and losses, net of tax, included in accumulated other comprehensiveincome within stockholders’ equity in the accompanying consolidated balance sheets. The amortization ofpremiums and discounts on the investments, realized gains and losses, and declines in value judged to beother-than-temporary on available-for-sale securities are included in other income (expense), net in theaccompanying consolidated statements of operations.
Based on the size of the investment portfolio as of December 31, 2011, an immediate increase ordecrease in interest rates of 100 basis points would not have a material adverse effect on the fair value ofour investment portfolio.
Foreign Currency Risk
The functional currency of our foreign subsidiaries is their local currencies. Accordingly, all assets andliabilities of these foreign operations are translated using exchange rates in effect at the end of the period,and revenues and costs are translated using average exchange rates for the period. Gains or losses fromtranslation of foreign operations where the local currencies are the functional currency, are included as acomponent of accumulated other comprehensive income in the accompanying consolidated balance sheets.Foreign currency transaction gains and losses are recognized in the accompanying consolidated statementsof operations as they are incurred. Because much of our revenues and capital spending are transacted inU.S. dollars, we are subject to fluctuations in foreign currency exchange rates that could have a materialadverse effect on our overall financial position, results of operations or cash flows, depending on thestrength of the U.S. dollar relative to the currencies of other countries in which we operate. Exchange ratefluctuations of greater than ten percent, primarily for the U.S. dollar relative to the Euro, Canadian dollaror South Korean won, could have a material impact on our financial statements. Additionally, foreigncurrency transaction gains and losses fluctuate depending upon the mix of foreign currency denominatedassets and liabilities and whether the local currency of an entity strengthens or weakens during a period. Asof December 31, 2011, our U.S. operations had approximately $11.3 million, net, in foreign denominatedoperating intercompany payables. It is estimated that a ten percent fluctuation in the U.S. dollar relative tothese foreign currencies would lead to a profit of $1.1 million (U.S. dollar strengthening), or a loss of$1.1 million (U.S. dollar weakening) on the translation of these intercompany payables, which would berecorded as other income (expense), net in our consolidated statement of operations.
In 2011, 2010 and 2009, we recorded foreign currency exchange gains and losses of $0.7 million loss,zero and $0.9 million gain, respectively, in other income (expense), net in the accompanying consolidatedstatements of operations.
Foreign currency translation adjustments included in comprehensive income for 2011 was $0.2 million,primarily due to the strengthening of the U.S. dollar against the Euro, which favorably impacted the netassets used in our foreign operations and held in local currencies. The cumulative translation adjustment asof December 31, 2011 and 2010 was $20.5 million and $20.3 million, respectively.
41

Item 8. Financial Statements and Supplementary Data
INDEX TO CONSOLIDATED FINANCIAL STATEMENTS
Page
Consolidated Financial Statements:
Consolidated Statements of Operations for the years ended December 31, 2011, 2010 and2009 . . . . . . . . . . . . . . . . . . . . . . . . . . . . . . . . . . . . . . . . . . . . . . . . . . . . . . . . . . . . . . . . 43
Consolidated Balance Sheets as of December 31, 2011 and 2010 . . . . . . . . . . . . . . . . . . . . . . 44
Consolidated Statements of Stockholders’ Equity and Comprehensive Loss for the years endedDecember 31, 2011, 2010 and 2009 . . . . . . . . . . . . . . . . . . . . . . . . . . . . . . . . . . . . . . . . . . 45
Consolidated Statements of Cash Flows for the years ended December 31, 2011, 2010 and2009 . . . . . . . . . . . . . . . . . . . . . . . . . . . . . . . . . . . . . . . . . . . . . . . . . . . . . . . . . . . . . . . . 46
Notes to Consolidated Financial Statements . . . . . . . . . . . . . . . . . . . . . . . . . . . . . . . . . . . . . 47
Report of Independent Registered Public Accounting Firm . . . . . . . . . . . . . . . . . . . . . . . . . . . . 71
Financial Statement Schedule:
Schedule II—Valuation and Qualifying Accounts . . . . . . . . . . . . . . . . . . . . . . . . . . . . . . . . . . 79
42

MATTSON TECHNOLOGY, INC.
CONSOLIDATED STATEMENTS OF OPERATIONS
Year Ended December 31,
2011 2010 2009
(in thousands, except per share amounts)
Net sales . . . . . . . . . . . . . . . . . . . . . . . . . . . . . . . . . . . . . . . . . . . . $184,947 $138,336 $ 42,748Cost of sales . . . . . . . . . . . . . . . . . . . . . . . . . . . . . . . . . . . . . . . . . 128,699 98,952 46,960
Gross profit (loss) . . . . . . . . . . . . . . . . . . . . . . . . . . . . . . . . . . . 56,248 39,384 (4,212)
Operating expenses:Research, development and engineering . . . . . . . . . . . . . . . . . . . . 26,189 27,791 25,340Selling, general and administrative . . . . . . . . . . . . . . . . . . . . . . . . 44,720 44,902 44,863Restructuring charges . . . . . . . . . . . . . . . . . . . . . . . . . . . . . . . . . 1,889 (114) 2,596
Total operating expenses . . . . . . . . . . . . . . . . . . . . . . . . . . . . . 72,798 72,579 72,799
Loss from operations . . . . . . . . . . . . . . . . . . . . . . . . . . . . . . . . . . . (16,550) (33,195) (77,011)
Interest income (expense), net . . . . . . . . . . . . . . . . . . . . . . . . . . . . 107 5 532Other income (expense), net . . . . . . . . . . . . . . . . . . . . . . . . . . . . . 163 108 1,371
Loss before income taxes . . . . . . . . . . . . . . . . . . . . . . . . . . . . . . . . (16,280) (33,082) (75,108)
Provision for (benefit from) income taxes . . . . . . . . . . . . . . . . . . . . 1,670 321 (8,066)
Net loss . . . . . . . . . . . . . . . . . . . . . . . . . . . . . . . . . . . . . . . . . . . . $ (17,950) $(33,403) $(67,042)
Net loss per share:Basic and diluted . . . . . . . . . . . . . . . . . . . . . . . . . . . . . . . . . . . . $ (0.32) $ (0.67) $ (1.35)
Shares used in computing net loss per share:Basic and diluted . . . . . . . . . . . . . . . . . . . . . . . . . . . . . . . . . . . . 55,299 50,073 49,832
The accompanying notes are an integral part of these consolidated financial statements.
43

MATTSON TECHNOLOGY, INC.
CONSOLIDATED BALANCE SHEETS
December 31,
2011 2010
(in thousands, except parvalue)
ASSETSCurrent assets:
Cash and cash equivalents . . . . . . . . . . . . . . . . . . . . . . . . . . . . . . . . . . . . . $ 31,073 $ 16,863Short-term investments . . . . . . . . . . . . . . . . . . . . . . . . . . . . . . . . . . . . . . . . — 2,151Restricted cash . . . . . . . . . . . . . . . . . . . . . . . . . . . . . . . . . . . . . . . . . . . . . 1,877 4,026Accounts receivable, net of allowance for doubtful accounts of $684 in 2011
and $681 in 2010 . . . . . . . . . . . . . . . . . . . . . . . . . . . . . . . . . . . . . . . . . . 25,278 24,127Advance billings . . . . . . . . . . . . . . . . . . . . . . . . . . . . . . . . . . . . . . . . . . . . 5,071 3,177Inventories . . . . . . . . . . . . . . . . . . . . . . . . . . . . . . . . . . . . . . . . . . . . . . . . 29,203 34,673Prepaid expenses and other current assets . . . . . . . . . . . . . . . . . . . . . . . . . . 9,024 5,770
Total current assets . . . . . . . . . . . . . . . . . . . . . . . . . . . . . . . . . . . . . . . . 101,526 90,787Property and equipment, net . . . . . . . . . . . . . . . . . . . . . . . . . . . . . . . . . . . . . 10,552 15,011Intangibles, net . . . . . . . . . . . . . . . . . . . . . . . . . . . . . . . . . . . . . . . . . . . . . . . 750 1,000Other assets . . . . . . . . . . . . . . . . . . . . . . . . . . . . . . . . . . . . . . . . . . . . . . . . . 1,015 4,826
Total assets . . . . . . . . . . . . . . . . . . . . . . . . . . . . . . . . . . . . . . . . . . . . . . $ 113,843 $ 111,624
LIABILITIES AND STOCKHOLDERS’ EQUITYCurrent liabilities:
Accounts payable . . . . . . . . . . . . . . . . . . . . . . . . . . . . . . . . . . . . . . . . . . . . $ 16,785 $ 20,860Accrued liabilities . . . . . . . . . . . . . . . . . . . . . . . . . . . . . . . . . . . . . . . . . . . 16,447 13,452Deferred revenue . . . . . . . . . . . . . . . . . . . . . . . . . . . . . . . . . . . . . . . . . . . . 12,117 5,349
Total current liabilities . . . . . . . . . . . . . . . . . . . . . . . . . . . . . . . . . . . . . . 45,349 39,661Income taxes payable, non-current . . . . . . . . . . . . . . . . . . . . . . . . . . . . . . . . . 1,312 4,287Other liabilities . . . . . . . . . . . . . . . . . . . . . . . . . . . . . . . . . . . . . . . . . . . . . . . 7,037 5,021
Total liabilities . . . . . . . . . . . . . . . . . . . . . . . . . . . . . . . . . . . . . . . . . . . . 53,698 48,969
Commitments and contingencies (Note 7)
Stockholders’ equity:Preferred stock, 2,000 shares authorized; none issued and outstanding . . . . . — —Common stock, par value $0.001, 120,000 shares authorized; 62,547 shares
issued and 58,366 shares outstanding in 2011; 54,440 shares issued and50,259 shares outstanding in 2010 . . . . . . . . . . . . . . . . . . . . . . . . . . . . . . 63 54
Additional paid-in capital . . . . . . . . . . . . . . . . . . . . . . . . . . . . . . . . . . . . . . 650,110 634,944Accumulated other comprehensive income . . . . . . . . . . . . . . . . . . . . . . . . . 20,472 20,207Treasury stock, 4,181 shares in 2011 and 2010, at cost . . . . . . . . . . . . . . . . . (37,986) (37,986)Accumulated deficit . . . . . . . . . . . . . . . . . . . . . . . . . . . . . . . . . . . . . . . . . . (572,514) (554,564)
Total stockholders’ equity . . . . . . . . . . . . . . . . . . . . . . . . . . . . . . . . . . . . 60,145 62,655
Total liabilities and stockholders’ equity . . . . . . . . . . . . . . . . . . . . . . . . $ 113,843 $ 111,624
The accompanying notes are an integral part of these consolidated financial statements.
44

MATTSON TECHNOLOGY, INC.
CONSOLIDATED STATEMENTS OF STOCKHOLDERS’ EQUITYAND COMPREHENSIVE LOSS
Shares Common Stock Accumulatedof and Additional Other TotalTreasury StockCommon Paid-In Comprehensive Accumulated Stockholders’
Stock Capital Income Shares Amount Deficit Equity
(in thousands)Balance at December 31, 2008 . . . . 53,874 628,686 20,255 (4,181) (37,986) (454,119) 156,836Components of comprehensive loss:
Net loss . . . . . . . . . . . . . . . . — — — — — (67,042) (67,042)Cumulative translation
adjustments . . . . . . . . . . . . — — 1,665 — — — 1,665Unrealized gain on investments . — — 94 — — — 94
Comprehensive loss . . . . . . . . . . (65,283)
Shares issued under employee stockplans, net . . . . . . . . . . . . . . . . 83 8 — — — — 8
Shares issued under employee stockpurchase plan . . . . . . . . . . . . . 183 201 — — — — 201
Stock-based compensation expense . . — 2,944 — — — — 2,944
Balance at December 31, 2009 . . . . 54,140 631,839 22,014 (4,181) (37,986) (521,161) 94,706Components of comprehensive loss:
Net loss . . . . . . . . . . . . . . . . — — — — — (33,403) (33,403)Cumulative translation
adjustments . . . . . . . . . . . . — — (1,815) — — — (1,815)Unrealized gain on investments . — — 8 — — — 8
Comprehensive loss . . . . . . . . . . (35,210)
Shares issued under employee stockplans, net . . . . . . . . . . . . . . . . 196 84 — — — — 84
Shares issued under employee stockpurchase plan . . . . . . . . . . . . . 104 331 — — — — 331
Stock-based compensation expense . . — 2,744 — — — — 2,744
Balance at December 31, 2010 . . . . 54,440 $634,998 $20,207 (4,181) $(37,986) $(554,564) $ 62,655Components of comprehensive loss:
Net loss . . . . . . . . . . . . . . . . — — — — — (17,950) (17,950)Cumulative translation
adjustments . . . . . . . . . . . . — — 158 — — — 158Unrealized gain on investments . — — 107 — — — 107
Comprehensive loss . . . . . . . . . . (17,685)
Shares issued in connection withpublic offering, net . . . . . . . . . . 7,820 12,599 — — — — 12,599
Shares issued under employee stockplans, net . . . . . . . . . . . . . . . . 144 87 — — — — 87
Shares issued under employee stockpurchase plan . . . . . . . . . . . . . 143 185 — — — — 185
Stock-based compensation expense . . — 2,304 — — — — 2,304
Balance at December 31, 2011 . . . . 62,547 $650,173 $20,472 (4,181) $(37,986) $(572,514) $ 60,145
The accompanying notes are an integral part of these consolidated financial statements.
45

MATTSON TECHNOLOGY, INC.
CONSOLIDATED STATEMENTS OF CASH FLOWS
Year Ended December 31,
2011 2010 2009
(in thousands)
Cash flows from operating activities:Net loss . . . . . . . . . . . . . . . . . . . . . . . . . . . . . . . . . . . . . . . . . . . . $(17,950) $(33,403) $(67,042)Adjustments to reconcile net loss to net cash used in operating
activities:Allowance for doubtful accounts . . . . . . . . . . . . . . . . . . . . . . . . . 8 (1,154) (2,440)Depreciation and amortization . . . . . . . . . . . . . . . . . . . . . . . . . . 8,983 9,183 13,618Deferred income taxes . . . . . . . . . . . . . . . . . . . . . . . . . . . . . . . . 3,698 691 (8,504)Stock-based compensation . . . . . . . . . . . . . . . . . . . . . . . . . . . . . 2,304 2,744 2,944Other non-cash items . . . . . . . . . . . . . . . . . . . . . . . . . . . . . . . . . (196) 130 348Changes in assets and liabilities:
Accounts receivable . . . . . . . . . . . . . . . . . . . . . . . . . . . . . . . . (1,380) (12,742) 6,479Advance billings . . . . . . . . . . . . . . . . . . . . . . . . . . . . . . . . . . . (1,897) (2,311) (765)Inventories . . . . . . . . . . . . . . . . . . . . . . . . . . . . . . . . . . . . . . . 2,265 (10,177) 17,784Prepaid expenses and other current assets . . . . . . . . . . . . . . . . (3,337) 69 1,034Other assets . . . . . . . . . . . . . . . . . . . . . . . . . . . . . . . . . . . . . . 220 867 (291)Accounts payable . . . . . . . . . . . . . . . . . . . . . . . . . . . . . . . . . . (3,906) 13,305 202Accrued liabilities . . . . . . . . . . . . . . . . . . . . . . . . . . . . . . . . . . 3,065 (4,807) (3,568)Deferred revenue . . . . . . . . . . . . . . . . . . . . . . . . . . . . . . . . . . 6,268 2,699 (2,548)Income taxes payable, non-current . . . . . . . . . . . . . . . . . . . . . . (3,076) (593) —Other liabilities . . . . . . . . . . . . . . . . . . . . . . . . . . . . . . . . . . . 2,537 (360) 435
Net cash used in operating activities . . . . . . . . . . . . . . . . . . . . . . . . . (2,394) (35,859) (42,314)
Cash flows from investing activities:Purchases of available-for-sale investments . . . . . . . . . . . . . . . . . . . — (11,327) (28,771)Maturities of available-for-sale investments . . . . . . . . . . . . . . . . . . . 2,151 22,125 41,500Decrease (increase) in restricted cash . . . . . . . . . . . . . . . . . . . . . . . 2,149 (2,026) (2,000)Purchases of property and equipment . . . . . . . . . . . . . . . . . . . . . . . (1,928) (1,526) (1,409)Sales of property and equipment . . . . . . . . . . . . . . . . . . . . . . . . . . 842 — —
Net cash provided by investing activities . . . . . . . . . . . . . . . . . . . . . . 3,214 7,246 9,320
Cash flows from financing activities:Proceeds from issuance of common stock, net . . . . . . . . . . . . . . . . . 12,871 415 208
Net cash provided by financing activities . . . . . . . . . . . . . . . . . . . . . . 12,871 415 208
Effect of exchange rate changes on cash and cash equivalents . . . . . . . 519 (285) 1,025
Net increase (decrease) in cash and cash equivalents . . . . . . . . . . . . . 14,210 (28,483) (31,761)Cash and cash equivalents, beginning of year . . . . . . . . . . . . . . . . . . 16,863 45,346 77,107
Cash and cash equivalents, end of year . . . . . . . . . . . . . . . . . . . . . . . $ 31,073 $ 16,863 $ 45,346
Supplemental disclosures:Cash paid for (refunded from) income taxes, net . . . . . . . . . . . . . . $ (479) $ 1,336 $ 266
The accompanying notes are an integral part of these consolidated financial statements.
46

MATTSON TECHNOLOGY, INC.
NOTES TO CONSOLIDATED FINANCIAL STATEMENTS
DECEMBER 31, 2011
1. Organization
Nature of Operations
Mattson Technology, Inc. was incorporated in California in 1988 and reincorporated in Delaware in1997. We design, manufacture, market and globally support semiconductor wafer processing equipmentused in the fabrication of integrated circuits.
Liquidity and Management Plans
As of December 31, 2011, we had cash and cash equivalents of $31.1 million and working capital of$56.2 million. We believe that these balances will be sufficient to fund our working and other capitalrequirements over the course of the next twelve months. Historically, we have relied on a combination offundraising from the sale and issuance of equity securities (such as our common stock offering inMay 2011) and cash generated from product, service and royalty revenues to provide funding for ouroperations. We will continue to review our expected cash requirements and take appropriate costreduction measures or raise additional funds, and may seek them from a combination of sources includingissuance of equity or debt securities through public or private financings. These financing options may notbe available on a timely basis, or on terms acceptable to us, and could be dilutive to our stockholders. Ifadequate funds are not available on acceptable terms, our ability to achieve our intended long-termbusiness objectives could be limited.
2. Summary of Significant Accounting Policies
Basis of Presentation
The consolidated financial statements include our accounts and the accounts of our subsidiaries. Allintercompany accounts and transactions have been eliminated in consolidation. Our fiscal year ends onDecember 31. Our interim fiscal quarters are based upon the first quarter ending on the Sunday closest toMarch 31, with the second and third fiscal quarters each being exactly 13 weeks long.
Use of Estimates
The preparation of financial statements in conformity with accounting principles generally accepted inthe United States of America (U.S. GAAP) requires management to make estimates and assumptions thataffect the reported amounts of assets and liabilities, disclosure of contingent assets and liabilities at thedate of the financial statements and the reported amounts of revenue and expenses during the reportedperiods. We evaluate our estimates on an ongoing basis, including those related to the useful lives and fairvalue of long-lived assets, estimates used to determine facility lease loss liabilities, measurement ofwarranty obligations, valuation allowances for deferred tax assets, the fair value of stock-basedcompensation, estimates for allowance for doubtful accounts, and valuation of excess and obsoleteinventories. Our estimates and assumptions can be subjective and complex and consequently actual resultscould differ materially from those estimates.
Reclassifications
For presentation purposes, certain prior period amounts have been reclassified to conform to thereporting in the current period financial statements. Specifically, in the fourth quarter of 2011, wereclassified certain current and prior period costs of $5.2 million in 2010 and $2.1 million in 2009 related to
47

our spare parts business from selling, general and administrative expense to cost of sales, as they moreappropriately reflect costs associated with revenue generating activities. These reclassifications do notaffect our net income, cash flows or stockholders’ equity.
Cash and Cash Equivalents
We consider all highly liquid investments purchased with an original maturity of three months or lessto be cash equivalents. Our cash and cash equivalents are carried at fair market value, and consist primarilyof cash balances, high-grade money market funds and commercial paper.
Short-term Investments
Our short-term investments, which primarily consist of U.S. agency securities and U.S. corporatebonds, are carried at fair market value. Our short-term investments are classified as available-for-saleinvestments, with unrealized gains and losses, net of tax, recorded as a component of stockholders’ equityin the accompanying consolidated balance sheets; and realized gains and losses as well as declines in fairvalue that are other than temporary are recorded in the accompanying consolidated statements ofoperations. As of December 31, 2011, we had no short-term investments. As of December 31, 2010, we had$2.2 million in short-term investments, with maturities of one year or less.
Concentration of Credit Risk
We maintain our cash and cash equivalents with several financial institutions. Deposits held withbanks may exceed the amount of insurance provided on such deposits. Generally these deposits may beredeemed upon demand and are maintained with financial institutions with reputable credit.
We may invest in a variety of financial instruments, such as U.S. treasury bills and notes, commercialpaper, money market funds and corporate bonds. We limit the amount of credit exposure to any onefinancial institution or commercial issuer. Historically, we have not experienced significant losses on theseinvestments.
Our trade accounts receivable are concentrated with companies in the semiconductor industry and arederived from sales in the U.S., Asia and Europe. As of December 31, 2011, three customers accounted for48 percent, 15 percent and 13 percent of our accounts receivable. As of December 31, 2010, four customersaccounted for 19 percent, 13 percent, 11 percent and 11 percent of our accounts receivable.
Allowance for Doubtful Accounts
We perform ongoing credit evaluations of our customers and record specific allowances for bad debtswhen a customer is unable to meet its financial obligations, as in the case of bankruptcy filings ordeteriorated financial position. We estimate the allowances for bad debts for all other customers based onfactors such as current trends, the length of time the receivables are past due and historical collectionexperience. We write-off a receivable when all rights, remedies and recourses against the account and itsprincipals are exhausted and record a benefit when previously reserved accounts are collected.
Fair Value Measurements of Assets and Liabilities
We measure certain of our assets at fair value, using observable market data. The authoritativeguidance on fair value measurement defines fair value as an exit price, representing the amount that wouldbe received to sell an asset or paid to transfer a liability in an orderly transaction between marketparticipants, and establishes a valuation hierarchy based on the level of independent objective evidenceavailable regarding the value of assets or liabilities. The authoritative guidance also establishes threeclasses of assets or liabilities: Level 1 consisting of assets and liabilities for which there are quoted prices inactive markets; Level 2 consisting of assets and liabilities for which observable inputs other than Level 1
48

inputs are used such as prices for similar assets or liabilities in active markets or for identical assets orliabilities in less active markets and model-derived valuations for which the variables are derived from orcorroborated by observable market data; and Level 3 consisting of assets or liabilities for which there areunobservable inputs to the valuation methodology that are significant to the measurement of the fair value.
Inventories
Inventories are stated at the lower of cost or market, with cost determined on a first-in, first-out basis,and include material, labor and manufacturing overhead costs. Finished goods are reported as inventoriesuntil the point of title transfers to the customer. Under our terms of sale, title generally transfers when wecomplete physical transfer of the products to the freight carrier, unless other customer practices or termsand conditions prevail. All intercompany profits pertaining to the sales and purchases of inventory amongour subsidiaries are eliminated from the consolidated financial statements.
We assess the valuation of all inventories, including manufacturing raw materials, work-in-process,finished goods and spare parts, at the end of each reporting period. Although we attempt to forecast futureinventory demand, given the competitive pressures and cyclical nature of the semiconductor industry, theremay be significant unanticipated changes in demand or technological developments that could have asignificant impact on the value of our inventories and reported operating results in future periods. Thecarrying value of our inventory is reduced for estimated excess and obsolescence by the difference betweenits cost and the estimated market value based upon assumptions about future demand. We evaluate theinventory carrying value for potential excess and obsolete inventory exposures by analyzing historical andanticipated demand. In addition, inventories are evaluated for potential obsolescence due to the effect ofknown and anticipated engineering change orders and new products. If actual demand were to besubstantially lower than estimated, additional inventory adjustments for excess or obsolete inventory mightbe required, which could have a material adverse effect on our business, financial condition and results ofoperations.
Inventory includes evaluation tools placed at customer sites as part of our marketing efforts. Weamortize the cost of the evaluation tools over an estimated two to three years, taking into consideration theestimated cost to refurbish the tools and the estimated net realizable value of the tools. The amortizationcharges are reported as selling, general and administrative expenses. Amortization expense was$3.1 million, $2.2 million and $5.3 million for the years ended December 31, 2011, 2010 and 2009,respectively.
Property and Equipment
Property and equipment are stated at cost. Depreciation is computed using the straight-line methodbased upon the estimated useful lives of the assets, which range from three to seven years. Leaseholdimprovements are amortized using the straight-line method over the useful lives or the term of the relatedlease, whichever is shorter.
Depreciation expense was $5.7 million, $6.7 million and $8.4 million for the years ended December 31,2011, 2010 and 2009, respectively. When assets are retired or otherwise disposed of, the assets and theassociated accumulated depreciation are removed from the accounts. Repair and maintenance costs areexpensed as incurred.
Impairment of Long-Lived Assets
We review our long-lived assets, including property and equipment and intangibles, for impairmentwhenever events or changes in circumstances indicate that the carrying amounts of these assets may not berecoverable. Recoverability is measured by a comparison of the assets’ carrying amount to their expectedfuture undiscounted net cash flows. If such assets are considered to be impaired, the impairment to be
49

recognized is measured based on the amount by which the carrying amount of the asset exceeds its fairvalue. We had no impairment charges in 2011, 2010 or 2009.
Warranty
The warranty offered by us on our system sales is generally 12 months, except where previouscustomer agreements state otherwise, and excludes certain consumable maintenance items. A provision forthe estimated cost of warranty obligations, based on historical costs, is recorded as cost of sales when therevenue is recognized. Our warranty obligations require us to repair or replace defective products or partsduring the warranty period at no cost to the customer. The actual system performance and/or fieldwarranty expense profiles may differ from historical experience, and in those cases, we adjust our warrantyaccruals accordingly. Actual warranty obligations and settlements against reserves are highly dependent onour system volumes.
Revenue Recognition
We derive revenues from the following primary sources—equipment (tool or system) sales, spare partsales and service and maintenance contracts. In accordance with the authoritative guidance on revenuerecognition, we recognize revenue on equipment sales as follows: 1) for equipment sales of existingproducts with new specifications and for sales of new products, revenue is recognized upon customeracceptance; 2) for equipment sales to existing customers who have purchased the same equipment with thesame specifications and previously demonstrated acceptance, or equipment sales to new customerspurchasing existing products with established reliability, we recognize revenue on a multiple elementapproach in which revenue is recognized upon the delivery of the separate elements to the customer andwhen we receive customer acceptance or is otherwise released from our customer acceptance obligations.For multiple element arrangements initiated at or prior to December 31, 2010, the revenue relating to theundelivered elements is deferred at its estimated fair values until delivery of the deferred elements; and forarrangements initiated or materially modified subsequent to December 31, 2010 containing multipleelements, the revenue relating to the undelivered elements is deferred using the relative selling pricemethod, which allocates revenue to each element using the estimated selling prices for the deliverableswhen vendor-specific objective evidence or third-party evidence is not available. The maximum revenue werecognize on a delivered element is limited to the amount that is not contingent upon the delivery ofadditional items such as installation and customer acceptance. Under this approach, generally 90 percentof the total invoice amount is recognized as revenue upon shipment and transfer of title; 100 percent of theassociated tool costs is also recognized upon shipment; and the remaining portion, generally 10 percent ofthe total invoice amount, is contingent upon customer acceptance and is recognized once installationservices are completed and final customer acceptance of the tool is received. From time to time, we allowcustomers to evaluate systems, with the customer maintaining the right to return the systems at itsdiscretion with limited or no penalty. For this type of arrangement, we do not recognize revenue on theevaluation systems until customer acceptance is received. For spare parts, we recognize revenue uponshipment. For service and maintenance contracts, we recognize revenue on a straight-line basis over theservice period of the related contract or as services are performed. In all cases, revenue is only recognizedwhen persuasive evidence of an arrangement exists, delivery has occurred, the price is fixed ordeterminable and collectability is reasonably assured. Accounts receivable for which revenue has not beenrecognized are classified as advance billings.
Research, Development and Engineering Expenses
Research, development and engineering costs are expensed as incurred.
50

Restructuring
We recognize expenses related to employee termination benefits when the benefit arrangement iscommunicated to the employee and no significant future services are required. If an employee is requiredto render service until a specific termination date in order to receive the termination benefits, the fairvalue of the associated liability would be recognized ratably over the future service period. Severance costsare determined in accordance with local statutory requirements and our policies. For some entities, wheresalaries are paid during the notice period, a portion of the severance reserves would be based on estimatesof the ability to find employment during the notice period, and we would determine the reserves inaccordance with these estimates.
We recognize the present value of facility lease termination obligations, net of estimated subleaseincome and other exit costs, when it has future lease payments with no future economic benefit. Subleaseincome is estimated based on current market rates for similar properties. If we are unable to sublease thefacility on a timely basis or if we are forced to sublease the facility at lower rates due to changes in marketconditions, we would adjust the restructuring liability accordingly.
Stock-Based Compensation
We measure the fair value of all stock-based awards, including stock options, restricted stock units,and purchase rights under our employee stock purchase plan, on the date of grant and recognizes therelated stock-based compensation expense on a straight-line basis over the requisite service period, whichis generally the vesting period.
We use the Black-Scholes option-pricing model to determine the fair value of certain of our stock-based awards. The determination of fair value using the Black-Scholes model is affected by our stock priceas well as assumptions regarding a number of complex and subjective variables, which includes expectedstock price volatility over the term of the awards, actual and projected employee exercise and cancellationbehaviors, risk-free interest rates, and expected dividends.
We estimate the expected life of options based on an analysis of our historical experience of employeeexercise and post-vesting termination behavior considered in relation to the contractual life of the option;expected volatility is based on the historical volatility of our common stock; and the risk-free interest rate isequal to the U.S. Treasury rates, with maturity approximating the expected life of the option. We do notcurrently pay cash dividends on our common stock and do not anticipate doing so in the foreseeablefuture; accordingly, the expected dividend yield is zero.
We estimate forfeiture rates on stock-based awards at the time of grant and revise those estimates insubsequent periods if actual forfeitures differ from those estimates. Such forfeiture estimates are based onhistorical experience. If the assumptions for estimating stock-based compensation expense change infuture periods, the amount of future stock-based compensation may differ significantly from the amountthat we recorded in the current and prior periods.
Stock-based compensation expenses for the years ended December 31, 2011, 2010 and 2009 were$2.3 million, $2.7 million and $2.9 million, respectively.
Foreign Currency Translation
The functional currencies of our foreign subsidiaries are their local currencies. All assets and liabilitiesof these foreign operations are translated into the U.S. dollar using exchange rates in effect at the end ofthe period, and revenues and costs are translated using average exchange rates for the period. Gains orlosses from translation of foreign operations where the local currencies are the functional currency areincluded as a component of accumulated other comprehensive income in the accompanying consolidatedbalance sheets. Foreign currency transaction gains and losses are recorded in other income (expense), netin the accompanying consolidated statements of operations.
51

Income Taxes
We provide for income taxes in accordance with the authoritative guidance, which requires a liability-based approach in accounting for income taxes. Deferred income tax assets and liabilities are recordedbased on the differences between the financial statement and tax bases of assets and liabilities usingenacted tax rates. Valuation allowances are provided against deferred income tax assets, which are notlikely to be realized.
We recognize the tax benefit from an uncertain tax position only if it is more likely than not that thetax position will be sustained on examination by taxing authorities, based on the technical merits of theposition. The tax benefits recognized in the financial statements from such a position are measured basedon the largest benefit that has a greater than fifty percent likelihood of being realized upon ultimateresolution.
New Accounting Pronouncements
In December 2011, the Financial Accounting Standards Board (FASB) issued Accounting StandardsUpdate (ASU) No. 2011-11, Disclosures about Offsetting Assets and Liabilities, which requires us to disclosegross information and net information about instruments and transactions eligible for offset in thestatement of financial position. ASU No. 2011-11 will be effective for our fiscal year beginning onJanuary 1, 2013. The adoption of this update is not expected to have a material impact on our consolidatedfinancial statements.
In September 2011, the FASB issued ASU No. 2011-08, Intangibles—Goodwill and Other—TestingGoodwill for Impairment to simplify goodwill impairment testing by permitting an assessment of qualitativefactors to determine whether it is more likely than not that the fair value of a reporting unit is less than itscarrying value. If it is concluded that this is the case, it is necessary to perform the currently prescribedtwo-step goodwill impairment test. Otherwise, the two-step goodwill impairment test is not required.ASU 2011-08 will be effective for our fiscal year beginning January 1, 2012. The adoption of this update isnot expected to have a material impact on our financial position, since we currently have no goodwillrecorded on our balance sheet.
In June 2011, the FASB issued ASU No. 2011-05, which amends current comprehensive incomeguidance. This accounting update eliminates the option to present the components of other comprehensiveincome as part of the statement of stockholders’ equity. Instead, we must report comprehensive income ineither a single continuous statement of comprehensive income that contains two sections, net income andother comprehensive income, or in two separate but consecutive statements. This portion of ASUNo. 2011-05 will be effective for our fiscal year beginning January 1, 2012. The adoption of this update willnot have an impact on our consolidated financial position, results of operations or cash flows, as it onlyrequires a change in the format of the current presentation. In December 2011, the FASB issued additionalguidance that defers the effective date of the requirement to present separate line items on the incomestatement for reclassification adjustments of items out of accumulated other comprehensive income intonet income. The deferral is temporary until the FASB reconsiders the operational concerns and needs offinancial statement users.
In May 2011, the FASB issued ASU No. 2011-04, an amendment to ASC 820, Fair ValueMeasurements, providing a consistent definition and measurement of fair value, as well as similar disclosurerequirements between U.S. GAAP and International Financial Reporting Standards. ASU 2011-04changes certain fair value measurement principles, clarifies the application of existing fair valuemeasurement and expands the ASC 820 disclosure requirements, particularly for Level 3 fair valuemeasurements. This amendment will be effective for our fiscal year beginning January 1, 2012. Theadoption of this amendment is not expected to have a material effect on our consolidated financialstatements, but may require certain additional disclosures.
52


Our prepaid expenses and other current assets consisted of the following on December 31, 2011 and2010:
December 31, December 31,2011 2010
(thousands)
Prepaid expenses and other current assets:Value-added tax . . . . . . . . . . . . . . . . . . . . . . . . . . . . . . . . . . . . . . . . . . . $2,996 $2,387Retirement insurance—foreign employees . . . . . . . . . . . . . . . . . . . . . . . . 1,185 971Insurance . . . . . . . . . . . . . . . . . . . . . . . . . . . . . . . . . . . . . . . . . . . . . . . 439 435Income tax receivable . . . . . . . . . . . . . . . . . . . . . . . . . . . . . . . . . . . . . . . 89 568Other . . . . . . . . . . . . . . . . . . . . . . . . . . . . . . . . . . . . . . . . . . . . . . . . . . 4,315 1,409
$9,024 $5,770
Our inventories consisted of the following on December 31, 2011 and 2010:
December 31, December 31,2011 2010
(thousands)
Inventories:Purchased parts and raw materials . . . . . . . . . . . . . . . . . . . . . . . . . . . . . $17,693 $14,266Work-in-process . . . . . . . . . . . . . . . . . . . . . . . . . . . . . . . . . . . . . . . . . . . 7,266 9,225Finished goods . . . . . . . . . . . . . . . . . . . . . . . . . . . . . . . . . . . . . . . . . . . 4,244 11,182
$29,203 $34,673
Inventories are stated at the lower of cost or market, with cost determined on a first-in, first-out basis,and include material, labor and manufacturing overhead costs. Amounts in the table above are presentednet of inventory valuation charges to reflect inventories considered excess and/or obsolete, whichinherently involve judgments, using assumptions about expected future demand and the impact of marketconditions on those assumptions. In 2011, 2010 and 2009, we recorded a net benefit of $1.7 million, a netbenefit of $3.1 million, and a net charge of $14.2 million, respectively, related to the sale of previouslywritten down inventories, net of inventory valuation charges.
Our property and equipment consisted of the following on December 31, 2011 and 2010:
December 31, December 31,2011 2010
(thousands)
Property and equipment, net:Machinery and equipment . . . . . . . . . . . . . . . . . . . . . . . . . . . . . . . . . . . $ 45,174 $ 52,608Furniture and fixtures . . . . . . . . . . . . . . . . . . . . . . . . . . . . . . . . . . . . . . 10,002 10,741Leasehold improvements . . . . . . . . . . . . . . . . . . . . . . . . . . . . . . . . . . . . 17,759 17,813
72,935 81,162Less: accumulated depreciation . . . . . . . . . . . . . . . . . . . . . . . . . . . . . . . . (62,383) (66,151)
$ 10,552 $ 15,011
Depreciation expense totaled $5.7 million, $6.7 million, and $8.4 million for the years endedDecember 31, 2011, 2010 and 2009, respectively.
54

Our accrued liabilities consisted of the following on December 31, 2011 and 2010:
December 31, December 31,2011 2010
(thousands)
Accrued liabilities:Compensation and benefits . . . . . . . . . . . . . . . . . . . . . . . . . . . . . . . . . . . $ 5,781 $ 5,941Warranty . . . . . . . . . . . . . . . . . . . . . . . . . . . . . . . . . . . . . . . . . . . . . . . . 3,419 2,539Value-added tax . . . . . . . . . . . . . . . . . . . . . . . . . . . . . . . . . . . . . . . . . . . 2,073 748Restructuring . . . . . . . . . . . . . . . . . . . . . . . . . . . . . . . . . . . . . . . . . . . . . 1,230 436Customer Deposits . . . . . . . . . . . . . . . . . . . . . . . . . . . . . . . . . . . . . . . . . 451 —Other . . . . . . . . . . . . . . . . . . . . . . . . . . . . . . . . . . . . . . . . . . . . . . . . . . 3,493 3,788
$16,447 $13,452
Other accrued liabilities in the table above primarily includes liabilities accrued for income taxespayable, professional fees, retrofit reserves and other miscellaneous liabilities.
In 2011, we recognized $1.6 million in other income related to the extinguishment of certain liabilitiespreviously recorded in accrued liabilities other.
Our other liabilities consisted of the following on December 31, 2011 and 2010:
December 31, December 31,2011 2010
(thousands)
Other liabilities:Deferred revenue, non-current . . . . . . . . . . . . . . . . . . . . . . . . . . . . . . . . $3,158 $2,875Other . . . . . . . . . . . . . . . . . . . . . . . . . . . . . . . . . . . . . . . . . . . . . . . . . . 3,879 2,146
$7,037 $5,021
4. Fair Value
We measure assets and liabilities at fair value based on exit price, which is defined by the authoritativeguidance on fair value measurements as the amount that would be received on the sale of an asset or paidto transfer a liability in an orderly transaction between market participants.
Fair Value Hierarchy
The authoritative guidance on fair value measurements establishes a three-tier value hierarchy, whichprioritizes the inputs used in measuring fair value as follows:
Level 1. Quoted prices in active markets for identical assets or liabilities.
Level 2. Observable inputs other than Level 1 prices, such as quoted prices for similar assets orliabilities, quoted prices in markets with insufficient volume or infrequent transactions (less activemarkets), or model-derived valuations in which all significant inputs are observable or can be derivedprincipally from or corroborated with observable market data for substantially the full term of the assets orliabilities.
Level 3. Unobservable inputs to the valuation methodology that are significant to the measurementof the fair value of assets or liabilities.
Our cash equivalents and investment instruments are classified within Level 1 of the fair valuehierarchy, as these instruments are valued using quoted market prices. Specifically, we value our
55

investments in U.S. government and agency securities, money market securities, certificates of deposit andplan assets under our Deferred Compensation Plan based on quoted market prices in active markets; andvalues our investments in corporate bonds, commercial paper and state, municipal and provincialobligations based on other observable inputs. As of December 31, 2011 and 2010, and for the years thenended, we had no assets or liabilities classified within Level 2 or Level 3 and there were no transfers ofinstruments between Level 1 and Level 2 regarding fair value measurement.
Assets and Liabilities Measured at Fair Value on a Recurring Basis
Assets measured at fair value on a recurring basis consisted of the following types of instruments as ofDecember 31, 2011 and 2010:
December 31, 2011 December 31, 2010
Fair Value Measurements at Fair Value Measurements atReporting Date Using Reporting Date Using
(Level 1) (Level 2) Total (Level 1) (Level 2) Total
(thousands) (thousands)
Assets measured at fair value:Cash equivalents:
Money market funds . . . . . . . . . . . . . . $13,039 $— $13,039 $2,885 $— $2,885Short-term investments:
United States agency securities . . . . . . . — — — 2,151 — 2,151Other assets:
Equity instruments . . . . . . . . . . . . . . . . 168 — 168 164 — 164
$13,207 $— $13,207 $5,200 $— $5,200
Liabilities measured at fair value:Other liabilities:
Deferred compensation . . . . . . . . . . . . $ 168 $— $ 168 $ 164 $— $ 164
In the table above, equity instruments represent plan assets under our Deferred Compensation Plan,which effectively offset corresponding Deferred Compensation Plan liabilities as of the dates presented.
5. Intangible Assets
In December 2009, we acquired intellectual property assets related to our etch and strip plasmaprocesses for $1.3 million, which are included in intangibles, net in the accompanying consolidated balancesheets. These assets are being amortized over a 5-year period in research, development and engineering inthe accompanying consolidated statements of operations. We had amortization charges of $0.3 million and$0.3 million in 2011 and 2010, respectively.
The following table summarizes intangible asset activities for the years ended December 31, 2011,2010 and 2009:
Developed Technology
AccumulatedCost Amortization Net
(thousands)
Balance at December 31, 2009 . . . . . . . . . . . . . . . . . . . . . . . . . . . . . . . $1,250 $ — $1,250Amortization . . . . . . . . . . . . . . . . . . . . . . . . . . . . . . . . . . . . . . . . . . — (250) (250)
Balance at December 31, 2010 . . . . . . . . . . . . . . . . . . . . . . . . . . . . . . . 1,250 (250) 1,000Amortization . . . . . . . . . . . . . . . . . . . . . . . . . . . . . . . . . . . . . . . . . . — (250) (250)
Balance at December 31, 2011 . . . . . . . . . . . . . . . . . . . . . . . . . . . . . . . $1,250 $(500) $ 750
56

6. Restructuring Charges
In 2011, we incurred $1.4 million in contract termination costs related to revised estimates of ourfuture rent obligations associated with a vacated leased facility, net of sublease income. The revisedestimates are based on a final settlement with the landlord, which includes exiting from the leasearrangement in July 2015, rather than the initial lease expiration of March 2019. The final settlement alsoreduces our total future lease commitments from $9.6 million to $3.8 million, which includes a leasetermination and other fees of $1.0 million. Of the $3.8 million in future lease commitments, we expect topay out $1.7 million in 2012 and the remaining balance on a declining basis through July 2015.
In December 2011, we also initiated a cost reduction plan, which included workforce reductions and aplan to transition our operations in Canada to our Germany facility. We expect to recognize synergiesthrough the consolidation of our operations and anticipate a cost reduction of approximately $0.5 millionin 2012 and approximately $1.2 million per year thereafter. As of December 31, 2011, we recorded$0.5 million in employee severance benefits related to this restructuring. We expect to incur an additional$1.1 million in employee separation and other charges related to this restructuring plan in 2012.
In 2009, we incurred $2.6 million in restructuring charges, net of reserve adjustments. Theserestructuring charges primarily consisted of employee severance costs related to a significant reduction inour workforce.
The following table summarizes our restructuring activities for the years ended December 31, 2011,2010 and 2009:
Employee ContractSeverance TerminationBenefits Costs Total
(thousands)
Balance at December 31, 2008 . . . . . . . . . . . . . . . . . . . . . . . . . . . . . . $ 3,496 $1,240 $ 4,736Restructuring charges . . . . . . . . . . . . . . . . . . . . . . . . . . . . . . . . . . 2,859 159 3,018Payments . . . . . . . . . . . . . . . . . . . . . . . . . . . . . . . . . . . . . . . . . . . (5,859) — (5,859)Reserve adjustments . . . . . . . . . . . . . . . . . . . . . . . . . . . . . . . . . . . (407) (15) (422)
Balance at December 31, 2009 . . . . . . . . . . . . . . . . . . . . . . . . . . . . . . 89 1,384 1,473Restructuring charges . . . . . . . . . . . . . . . . . . . . . . . . . . . . . . . . . . — — —Payments . . . . . . . . . . . . . . . . . . . . . . . . . . . . . . . . . . . . . . . . . . . (83) — (83)Reserve adjustments . . . . . . . . . . . . . . . . . . . . . . . . . . . . . . . . . . . 88 (178) (90)
Balance at December 31, 2010 . . . . . . . . . . . . . . . . . . . . . . . . . . . . . . 94 1,206 1,300Restructuring charges . . . . . . . . . . . . . . . . . . . . . . . . . . . . . . . . . . 452 1,437 1,889Payments and settlements . . . . . . . . . . . . . . . . . . . . . . . . . . . . . . . (370) (76) (446)Reserve adjustments . . . . . . . . . . . . . . . . . . . . . . . . . . . . . . . . . . . (94) 94 —
Balance at December 31, 2011 . . . . . . . . . . . . . . . . . . . . . . . . . . . . . . $ 82 $2,661 $ 2,743
As of December 31, 2011, $1.2 million of the restructuring balance was classified as short-term andrecorded within accrued liabilities in the consolidated balance sheet, and the remaining $1.5 million of therestructuring balance was classified as long-term and recorded within other liabilities in the consolidatedbalance sheet.
7. Commitments and Contingencies
Warranty
The warranty offered by us on our system sales is generally 12 months, except where previouscustomer agreements state otherwise, and excludes certain consumable maintenance items. A provision forthe estimated cost of warranty, based on historical costs, is recorded as cost of sales when the revenue is
57

recognized. Our warranty obligations require us to repair or replace defective products or parts during thewarranty period at no cost to the customer. The actual system performance and/or field warranty expenseprofiles may differ from historical experience, and in those cases, we adjust our warranty accrualsaccordingly.
The following table summarizes changes in the product warranty accrual for the years endedDecember 31, 2011, 2010 and 2009:
Year Ended December 31,
2011 2010 2009
(thousands)
Balance at the beginning of the year . . . . . . . . . . . . . . . . . . . . . . . . . . . $ 2,539 $ 1,310 $ 4,381Accrual for warranties issued during the year . . . . . . . . . . . . . . . . . . . . 3,577 3,599 1,273Changes in liability related to pre-existing warranties . . . . . . . . . . . . . . 566 (166) (1,834)Settlements made during the year . . . . . . . . . . . . . . . . . . . . . . . . . . . . (3,263) (2,204) (2,510)
Balance at the end of the year . . . . . . . . . . . . . . . . . . . . . . . . . . . . . . . . $ 3,419 $ 2,539 $ 1,310
Operating Leases
We hold various operating leases related to our facilities and equipment worldwide. Our minimumannual rental commitments with respect to our operating leases were as follows as of December 31, 2011:
OperatingYear Lease Payments
(thousands)
2012 . . . . . . . . . . . . . . . . . . . . . . . . . . . . . . . . . . . . . . . . . . . . . . . . . . . . . . . . . . . . . $ 3,9432013 . . . . . . . . . . . . . . . . . . . . . . . . . . . . . . . . . . . . . . . . . . . . . . . . . . . . . . . . . . . . . 3,5452014 . . . . . . . . . . . . . . . . . . . . . . . . . . . . . . . . . . . . . . . . . . . . . . . . . . . . . . . . . . . . . 3,3022015 . . . . . . . . . . . . . . . . . . . . . . . . . . . . . . . . . . . . . . . . . . . . . . . . . . . . . . . . . . . . . 3,0882016 . . . . . . . . . . . . . . . . . . . . . . . . . . . . . . . . . . . . . . . . . . . . . . . . . . . . . . . . . . . . . 1,884Thereafter . . . . . . . . . . . . . . . . . . . . . . . . . . . . . . . . . . . . . . . . . . . . . . . . . . . . . . . . . 2,291
$18,053
Rent expense was $5.0 million, $4.6 million and $4.2 million in 2011, 2010 and 2009, respectively. Werecorded sublease income related to our Exton, Pennsylvania facility of $0.6 million, $1.1 million and$1.5 million in 2011, 2010 and 2009, respectively.
In 2005, we entered into a new lease agreement for our existing corporate headquarters building inFremont, California. The lease is for a period of 10 years, which commenced on May 31, 2007, and has aninitial annual base rent cost of approximately $1.4 million, with annual increases of approximately3.5 percent. We are also responsible for an additional minimum lease payment at the end of the lease termof approximately $1.5 million, subject to adjustment, under a restoration cost obligation provision, which isbeing recognized on a straight-line basis over the lease term. To secure this obligation, we provided thelandlord a standby letter of credit of $1.5 million.
We continue to lease one building previously used to house the administrative functions related to wetsurface preparation products in Exton, Pennsylvania. The original lease for the administrative building wasscheduled to expire on March 31, 2019, with a current rental cost of approximately $0.9 million annually. InDecember 2011, we reached a final settlement with the landlord, which includes exiting from the leasearrangement in July 2015. The final settlement also reduces our total future lease obligations from$9.6 million to $3.8 million, which includes $1.0 million in lease termination and other fees. Of the$3.8 million in future lease commitments, we expect to pay out $1.7 million in 2012 and the remainingbalance on a declining basis through July 2015. We continue to sublease a portion of the Exton facility,
58

cancelable by our subtenant anytime after December 31, 2012. The sublease income under the currentsublease agreement was $0.6 million as of December 31, 2011. In determining facilities lease loss liability,various assumptions were made, including the time period over which the buildings will be vacant,expected sublease terms and expected sublease rates. At December 31, 2011 and 2010, we had an accruedliability balance of $2.3 million and $0.9 million, respectively, related to this facility. Adjustments to thisaccrual will be made in future periods, if events and circumstances change.
Guarantees
In the ordinary course of business, our bank provides standby letters of credit or other guaranteeinstruments on behalf of us to certain parties as required. The standby letters of credit are secured bycertificates of deposit, which are classified as restricted cash in the accompanying consolidated balancesheets. We have never recorded any liability in connection with these guarantee arrangements beyond whatis required to appropriately account for the underlying transaction being guaranteed. We do not believe,based on historical experience and information currently available, that it is probable that any amounts willbe required to be paid under such guarantee arrangements. As of December 31, 2011, the maximumpotential amount that we could be required to pay was $1.9 million, the total amount of outstandingstandby letters of credit, which were secured by $1.9 million in money market collateral accounts.
We are a party to a variety of agreements, pursuant to which we may be obligated to indemnify otherparties with respect to certain matters. Typically, these obligations arise in the context of contracts underwhich we may agree to hold other parties harmless against losses arising from a breach of representationsor with respect to certain intellectual property, operations or tax-related matters. Our obligations underthese agreements may be limited in terms of time and/or amount, and in some instances, we may havedefenses to asserted claims and/or recourse against third parties for payments made by us. It is not possibleto predict the maximum potential amount of future payments under these or similar agreements due to theconditional nature of our obligations and the unique facts and circumstances involved in each particularagreement. Historically, payments made by us under these agreements have not had a material effect onour financial position, results of operations or cash flows. We believe if it were to incur a loss in any ofthese matters, such loss would not have a material effect on its financial position, results of operations orcash flows.
In connection with our acquisition of Vortek Industries, Ltd (Vortek) in 2004, we became party to anagreement between Vortek and the Canadian Minister of Industry (the Minister) relating to an investmentin Vortek by Technology Partnerships Canada. Under the agreement, as amended, we, or Vortek (renamedMattson Technology, Canada, Inc. or MTC) agreed to various covenants, including (i) payment by us of aroyalty to the Minister of 1.4 percent of revenues from certain Flash RTP products, up to a total ofCAD 14,269,290 (approximately $14.0 million based on the applicable exchange rate as of December 31,2011), (ii) MTC maintaining a specified average workforce of employees in Canada through October 27,2009, (iii) investment of a certain amount by October 27, 2009 and certain other covenants concerningmanufacturing obligations. Under the provisions of this agreement, if we, or MTC, did not materiallysatisfy its obligations pursuant to the covenants, the Minister could have demanded payment of liquidateddamages in the amount of CAD 14,269,290 less any royalties paid by MTC or us to the Minister. As ofDecember 31, 2009, we were no longer subject to covenants (ii) and (iii), as discussed above; but are stillsubject to covenant (i), relating to the payment of royalty on revenues from certain Flash RTP productsuntil 2020. However, if MTC is dissolved, files for bankruptcy or does not materially comply with certainother terms and conditions of the contract prior to its expiration on December 31, 2020, we could besubject to liquidated damages in the amount of CAD 14,269,290 less any royalties paid by MTC or us tothe Minister.
We indemnify our directors and certain employees as permitted by law, and have entered intoindemnification agreements with our directors and certain senior officers. We have not recorded a liabilityassociated with these indemnification arrangements as we historically have not incurred any material costs
59

associated with such indemnification arrangements. Costs associated with such indemnificationarrangements may be mitigated, in whole or only in part, by insurance coverage that we maintain.
Government Agencies
As an exporter, we must comply with various laws and regulations relating to the export of productsand technology from the U.S. and other countries having jurisdiction over our operations. In the U.S. theselaws include the International Traffic in Arms Regulations (ITAR) administered by the State Department’sDirectorate of Defense Trade Controls, the Export Administration Regulations (EAR) administered bythe Bureau of Industry and Security (‘‘BIS’’), and trade sanctions against embargoed countries anddestinations administered by the U.S. Department of Treasury, Office of Foreign Assets Control (OFAC).The EAR governs products, parts, technology and software which present military or weaponsproliferation concerns, so-called ‘‘dual use’’ items, and ITAR governs military items listed on the UnitedStates Munitions List. Prior to shipping certain items, we must obtain an export license or verify thatlicense exemptions are available. In addition, we must comply with certain requirements related todocumentation, record keeping, plant visits and hiring of foreign nationals.
In 2008, we self-disclosed to BIS certain inadvertent EAR violations, and are currently working withBIS to resolve these. As of December 31, 2011, we have accrued an amount to reflect what managementbelieves to be the minimum estimated liability. We believe this accrual to be immaterial. We are unable toestimate the extent of any higher fines or penalties or other potential losses that may be incurred withrespect to this matter, though we could face substantial civil fines or other penalties, which could have amaterial adverse effect on us.
Litigation
In the ordinary course of business, we are subject to claims and litigation, including claims that weinfringe third party patents, trademarks and other intellectual property rights. Although we believe that itis unlikely that any current claims or actions will have a material adverse impact on our operating results orits financial position, given the uncertainty of litigation, we cannot be certain of this. The defense of claimsor actions against us, even if not meritorious, could result in the expenditure of significant financial andmanagerial resources.
We record a legal liability when we believe it is both probable that a liability has been incurred, andthe amount can be reasonably estimated. We monitor developments in our legal matters that could affectthe estimate we have previously accrued. Significant judgment is required to determine both probabilityand the estimated amount.
8. Stockholders’ Equity
Common Stock
On May 16, 2011, we completed a registered public offering of 7.8 million newly issued shares of ourcommon stock. The common stock was issued at a price to the public of $1.80 per share. We received netproceeds of approximately $12.6 million from the offering after deducting underwriting discounts andestimated offering expenses of $1.5 million.
Common Stock Repurchase Program
In March 2007, our Board of Directors approved a common stock repurchase plan (Repurchase Plan)that authorized the repurchase of up to $20.0 million of outstanding shares of our common stock throughopen-market purchases or private transactions. In October 2007, our Board of Directors expanded theRepurchase Plan, authorizing the repurchase of up to an additional $30.0 million of shares of our commonstock through open-market purchases or private transactions. By December 31, 2008, a total of 3.8 million
60

shares had been repurchased against the original and expanded Repurchase Plan, at a weighted-averagepurchase price of $9.20 for a total purchase price of approximately $35.0 million. Our last repurchase ofcommon stock under this plan was in the first quarter of 2008. On May 2, 2011, we terminated theRepurchase Plan.
We report common stock repurchased as treasury stock in the accompanying consolidated balancesheets. Including previous common stock repurchase plans from 1997 and 1998, our treasury stock as ofDecember 31, 2011 was 4.2 million shares at a total purchase price of $38.0 million.
Accumulated Other Comprehensive Income
The components of accumulated other comprehensive income, net of related tax, at December 31,2011 and 2010 are as follows:
December 31,
2011 2010
(thousands)
Accumulated other comprehensive income:Cumulative translation adjustments . . . . . . . . . . . . . . . . . . . . . . . . . . . . . . . . . . $20,466 $20,308Unrealized investment gain (loss), net of tax . . . . . . . . . . . . . . . . . . . . . . . . . . . 6 (101)
$20,472 $20,207
Stockholder Rights Plan
On July 28, 2005, we adopted a Stockholder Rights Plan (Rights Plan), under which stockholders ofrecord at the close of business on August 15, 2005 received one share purchase right (Right) for each shareof our common stock held on that date. The Rights, which currently trade with our common stock andrepresent the right to purchase one one-thousandth of a share of preferred stock at $55.00 per share,become exercisable when a person or group acquires 15 percent or more of our common stock (acquiror)without prior approval of our Board of Directors. In that event, the Rights would permit our stockholders,other than the acquiror, to purchase shares of the our common stock having a market value of twice theexercise price of the Rights, in lieu of the preferred stock. Also, under the Rights Plan, (i) prior to a personor group acquiring 15 percent of our common stock, we can redeem the Rights for $0.001 each; (ii) we canissue one Right for each share of common stock that becomes outstanding after the record date and beforethe acquisition of 15 percent of its common stock by an acquiror; (iii) when the Rights become exercisable,our Board of Directors may authorize the issuance of one share of our common stock in exchange for eachRight that is then exercisable; and (iv) in the event of certain business combinations, the Rights permit thepurchase of the common stock of an acquiror at a 50 percent discount. The Rights expire on July 27, 2015.As of December 31, 2011, we had approximately 50.0 million share purchase rights outstanding.
9. Employee Stock and Saving Plans
In May 2005, we amended and restated our 1989 Stock Option Plan (the 1989 Plan) as the 2005Equity Incentive Plan (the 2005 Plan), under which a total of approximately 12 million shares of commonstock were reserved for issuance. In June 2007, our shareholders approved an amendment to the 2005 Planby reserving an additional 2.5 million shares of common stock for issuance under the 2005 Plan, bringingthe total shares reserved to approximately 14.5 million shares of common stock. As of December 31, 2011,we had approximately 2.1 million shares available for future grants under the 2005 Plan.
61

The following table summarizes the combined activity under all of our equity incentive plans for thethree years ended December 31, 2011:
Weighted- Restricted Weighted-Awards Stock Average Stock Average
Available Options Exercise Units Grant DateFor Grant Outstanding Price Outstanding Fair Value
(thousands) (thousands) (thousands)
Balances at December 31, 2008 . . . . . . . . . 2,452 5,772 $8.85 768 $5.12Stock options:
Granted . . . . . . . . . . . . . . . . . . . . . . . . (1,583) 1,583 $0.91 — —Exercised . . . . . . . . . . . . . . . . . . . . . . . — (5) $1.69 — —Cancelled or forfeited . . . . . . . . . . . . . . 2,317 (2,317) $8.28 — —
Restricted stock units:Granted . . . . . . . . . . . . . . . . . . . . . . . . — — — — —Released . . . . . . . . . . . . . . . . . . . . . . . . 3 — — (120) $6.87Cancelled or forfeited . . . . . . . . . . . . . . 462 — — (264) $4.01
Balances at December 31, 2009 . . . . . . . . . 3,651 5,033 $6.62 384 $4.21Stock options:
Granted . . . . . . . . . . . . . . . . . . . . . . . . (2,057) 2,057 $3.19 — —Exercised . . . . . . . . . . . . . . . . . . . . . . . — (170) $0.81 — —Cancelled or forfeited . . . . . . . . . . . . . . 642 (642) $8.09 — —
Restricted stock units:Granted . . . . . . . . . . . . . . . . . . . . . . . . (5) — — 3 $3.96Released . . . . . . . . . . . . . . . . . . . . . . . . 23 — — (39) $7.92Cancelled or forfeited . . . . . . . . . . . . . . 9 — — (5) $6.91
Balances at December 31, 2010 . . . . . . . . . 2,263 6,278 $5.51 343 $3.67Stock options:
Granted . . . . . . . . . . . . . . . . . . . . . . . . (1,643) 1,643 $2.16 — —Exercised . . . . . . . . . . . . . . . . . . . . . . . — (128) $0.85 — —Cancelled or forfeited . . . . . . . . . . . . . . 1,304 (1,304) $7.40 — —
Restricted stock units:Granted . . . . . . . . . . . . . . . . . . . . . . . . — — — — —Released . . . . . . . . . . . . . . . . . . . . . . . . 13 — — (23) $6.33Cancelled or forfeited . . . . . . . . . . . . . . 130 — — (74) $3.39
Balances at December 31, 2011 . . . . . . . . . 2,067 6,489 $4.37 246 $3.50
The following table provides information pertaining to the our stock options and restricted stock unitswith time-based vesting for the years ended December 31, 2011, 2010 and 2009:
Year Ended December 31,
2011 2010 2009
(thousands, exceptweighted-average fair
values)
Stock options:Weighted-average fair value of options granted . . . . . . . . . . . . . . . . . . . . . . . $1.36 $1.96 $0.52Intrinsic value of options exercised . . . . . . . . . . . . . . . . . . . . . . . . . . . . . . . . $ 122 $ 441 $ 4Cash received from options exercised . . . . . . . . . . . . . . . . . . . . . . . . . . . . . . $ 109 $ 138 $ 9
Restricted stock units with time-based vesting:Weighted-average fair value of RSUs granted . . . . . . . . . . . . . . . . . . . . . . . . — $3.96 —
62

Stock Options
Stock option grants under the 2005 Plan generally vest 25 percent on the first anniversary of the dateof grant, and 1⁄36 per month thereafter. We granted 1.6 million, 2.1 million and 1.6 million stock optionsduring 2011, 2010 and 2009, respectively, with an estimated total grant-date fair value of $2.2 million,$4.0 million and $0.8 million, respectively. We settle employee stock option exercises with newly issuedcommon shares.
The following table summarizes information about stock options outstanding as of December 31,2011:
Outstanding Options Exercisable Options
Weighted Average Weighted WeightedNumber of Remaining Average Number of Average
Range of Exercise Prices Shares Contractual Life Exercise Price Shares Exercise Price
(thousands) (years) (thousands)
$0.76-$2.62 . . . . . . . . . . . . . . . . . 2,666 5.0 $1.73 919 $1.12$2.63-$5.86 . . . . . . . . . . . . . . . . . 2,178 4.2 $3.65 1,449 $3.80$5.87-$13.93 . . . . . . . . . . . . . . . . 1,645 2.0 $9.61 1,643 $9.61
Total . . . . . . . . . . . . . . . . . . . . . 6,489 4.0 $4.37 4,011 $5.57
The table below contains additional information with respect to our stock options outstanding atDecember 31, 2011:
Weighted Weighted Average AggregateAverage Remaining Intrinsic
Shares Exercise Price Contractual Life Value
(thousands) (years) (thousands)
Vested and exercisable options . . . . . . . . . . . . . 4,011 $5.57 3.0 $404Unvested options expected to vest . . . . . . . . . . 2,478 $2.43 5.5 $117Total outstanding options . . . . . . . . . . . . . . . . . 6,489 $4.37 4.0 $521
The aggregate intrinsic value shown in the table above represents the total pre-tax intrinsic value,based on the closing price of our common stock of $1.38 on December 31, 2011, which would have beenreceived by the option holders had all in-the-money option holders exercised their options as of that date.There were approximately 0.7 million shares of common stock subject to in-the-money options that wereexercisable as of December 31, 2011.
Restricted Stock Units (RSUs)
Our 2005 Plan provides for grants of timed-based and performance-based RSUs.
Time-Based Restricted Stock Units
Time-based RSUs generally vest at 1⁄4 per year. On occasion and for varying purposes, we granttime-based RSUs with different vesting criteria and duration. In 2011 and 2009, we did not grant anytime-based RSUs. During 2011 and 2009, we did not grant any time-based RSUs. During 2010, we granted3,000 time-based RSUs with a fair value of $12,000.
RSUs under the 2005 Plan are counted against the total number of shares of common stock issuableat 1.75 shares for every RSU.
Performance-Based Restricted Stock Units
The vesting of performance-based RSUs is contingent on our achievement of certain predeterminedfinancial goals and in some cases, the achievement of certain market performance targets. The amount of
63

stock-based compensation expense recognized in any one period can vary based on the achievement oranticipated achievement of specific performance goals. If a performance goal is not met or is not expectedto be met, no compensation cost would be recognized on the underlying RSUs, and any previouslyrecognized compensation expense on those RSUs would be reversed.
In 2008, our Board of Directors approved the grant of 683,000 performance-based RSUs to certain ofour executives, officers and senior-level management, with vesting in four equal tranches upon theachievement of four sequentially increasing revenue performance targets and contingent on theachievement of certain operating profit margin and stock price thresholds. The fair value of these RSUswas determined using the Monte Carlo valuation methodology. At December 31, 2008, we determined thatdue to the deteriorating market conditions during the fourth quarter of 2008, it was not probable that anyof the four revenue targets and the operating profit targets would be met by the specified dates. As aresult, the stock-based compensation related to these RSUs was deemed unrecognizable. We continue toevaluate the likelihood of achieving the performance targets. If and when we determine that the relatedtargets are probable of being achieved, we will begin recognizing expense in the period that suchdetermination is made. We have not recorded any compensation expense related to these performance-based RSUs in 2011, 2010 and 2009. As of December 31, 2011, 0.5 million of the performance-based RSUshad been canceled based on employee terminations, leaving 0.2 million units outstanding.
Employee Stock Purchase Plan
We have a noncompensatory employee stock purchase plan (ESPP) which allows each eligibleemployee to withhold up to 15 percent of gross compensation over semiannual six-month ESPP periods topurchase shares of our common stock, limited to 2,000 shares per ESPP period. Under the ESPP,employees purchase stock at a price equal to 90 percent of the fair market value (generally the closingprice of our common stock) on the trading day prior to the exercise when stock is purchased.
We reserved 6.2 million shares of common stock for issuance under the ESPP, of which 2.7 millionshares were available for issuance as of December 31, 2011. During 2011, 2010 and 2009, we issued sharesunder the ESPP totaling 0.1 million, 0.1 million and 0.2 million, respectively, with average purchase pricesof $1.29, $3.19 and $1.50, respectively.
Employee Savings Plan (ESP)
We have a retirement/savings plan (the ESP), which qualifies under section 401(k) of the InternalRevenue Code. All full-time employees of eligible age (over twenty-one years old) can participate in theESP and can contribute up to an amount allowed by the applicable Internal Revenue Service guidelines. Atour discretion, we can make matching contributions to the ESP equal to a percentage of the participants’contributions. In March 2009, we suspended matching contributions under the ESP as a cost-cuttingmeasure and it was reinstated in July 2011.
Deferred Compensation Plan
In 2006, we adopted a Deferred Compensation Plan (the DC Plan), under which we allow eligibleemployees and non-employee members of our Board of Directors to defer a specified percentage of theirbase salary or retainer fees, as appropriate. We are obligated to deliver on a future date the contributionsto the DC Plan plus income earned on such contributions. These liabilities represent an unsecured generalobligation of ours and rank in parity with other unsecured and unsubordinated indebtedness of ours andare non-transferable and non-tradable.
As of December 31, 2011 and 2010, we had approximately $0.2 million and $0.2 million, respectively,in net assets under the DC Plan, which were invested primarily in equity investment funds. These assets arereflected as a component of other assets and the corresponding liabilities are reflected as a component ofother liabilities in the accompanying consolidated balance sheets.
64

10. Stock-Based Compensation
We account for stock-based compensation in accordance with the applicable authoritative guidance,which requires the measurement of stock-based compensation on the date of grant based on the fair valueof the award, and the recognition of the expense over the requisite service period for the employee.Compensation related to restricted stock units is the intrinsic value on the date of grant, which is theclosing price of our common stock less the employee exercise price, if any. Compensation related to stockoptions is determined using a stock option valuation model.
Valuation Assumptions
We use the Black-Scholes valuation model to determine the fair value of stock options. The Black-Scholes model requires the input of highly subjective assumptions, which are summarized in the tablebelow for 2011, 2010 and 2009:
Year EndedDecember 31,
2011 2010 2009
Expected dividend yield . . . . . . . . . . . . . . . . . . . . . . . . . . . . . . . . . . . . . . . . . . — — —Expected stock price’s volatility . . . . . . . . . . . . . . . . . . . . . . . . . . . . . . . . . . . . 77% 74% 67%Risk-free interest rate . . . . . . . . . . . . . . . . . . . . . . . . . . . . . . . . . . . . . . . . . . . 1.8% 2.1% 1.9%Expected life of options in years . . . . . . . . . . . . . . . . . . . . . . . . . . . . . . . . . . . . 5 5 5
We estimate the expected life of options based on an analysis of our historical experience of employeeexercise and post-vesting termination behavior considered in relation to the contractual life of the option;expected volatility is based on the historical volatility of our common stock; and the risk-free interest rate isequal to the U.S. Treasury rates, with maturity approximating the expected life of the option. We do notcurrently pay cash dividends on our common stock and do not anticipate doing so in the foreseeablefuture; accordingly, the expected dividend yield is zero.
Our stock-based compensation in 2011, 2010 and 2009 was as follows:
Year Ended December 31,
2011 2010 2009
(thousands)
Stock-based compensation by type of award:Stock options . . . . . . . . . . . . . . . . . . . . . . . . . . . . . . . . . . . . . . . . . . . . . $2,167 $2,442 $2,280Restricted stock units . . . . . . . . . . . . . . . . . . . . . . . . . . . . . . . . . . . . . . . 112 263 626Employee stock purchase plan . . . . . . . . . . . . . . . . . . . . . . . . . . . . . . . . 25 39 38
$2,304 $2,744 $2,944
Stock-based compensation by category of expense:Cost of sales . . . . . . . . . . . . . . . . . . . . . . . . . . . . . . . . . . . . . . . . . . . . . $ 82 $ 96 $ 105Research, development and engineering . . . . . . . . . . . . . . . . . . . . . . . . . 367 451 426Selling, general and administrative . . . . . . . . . . . . . . . . . . . . . . . . . . . . . 1,855 2,197 2,413
$2,304 $2,744 $2,944
We did not capitalize any stock-based compensation as inventory in 2011, 2010 and 2009, as suchamounts were not material. As of December 31, 2011, we had $2.5 million in unrecognized stock-basedcompensation expense related to stock options, net of estimated forfeitures, which will be recognized overa weighted-average period of 2.7 years. As of December 31, 2011, we had $19,000 in unrecognized stock-based compensation expense related to unvested time-based RSUs outstanding, net of estimatedforfeitures, which will be recognized over a weighted-average period of 0.4 years.
65

11. Geographic and Customer Concentration Information
We have one operating segment, the design, manufacturing and marketing of advanced fabricationequipment to the semiconductor manufacturing industry. The authoritative guidance on segment reportingand disclosure defines operating segment as a component of an enterprise for which separate financialinformation is available that is evaluated regularly by the chief operating decision maker in deciding how toallocate resources and in assessing performance. As our business is completely focused on one industrysegment, the design, manufacturing and marketing of advanced fabrication equipment to thesemiconductor manufacturing industry, management believes that we have one reportable segment. Ourrevenues and profits are generated from the sales of systems and services in this one segment. For thepurposes of evaluating our reportable segments, our Chief Executive Officer is the chief operating decisionmaker, as defined in the applicable authoritative guidance.
The following table summarizes net sales by geographic areas based on the installation locations of thesystems and the location of services rendered:
Year Ended December 31,
2011 2010 2009
(thousands) % (thousands) % (thousands) %
Net sales:United States . . . . . . . . . . . . . . . . . . . . . . . . $ 10,311 6 $ 7,211 5 $ 3,601 8Korea . . . . . . . . . . . . . . . . . . . . . . . . . . . . . 84,623 46 67,973 49 14,619 34Taiwan . . . . . . . . . . . . . . . . . . . . . . . . . . . . . 37,507 20 18,878 14 7,233 17China . . . . . . . . . . . . . . . . . . . . . . . . . . . . . 12,110 7 16,210 12 5,143 12Japan . . . . . . . . . . . . . . . . . . . . . . . . . . . . . . 14,764 8 7,005 5 1,272 3Other Asia . . . . . . . . . . . . . . . . . . . . . . . . . . 6,238 3 13,641 10 6,842 17Europe and others . . . . . . . . . . . . . . . . . . . . 19,394 10 7,418 5 4,038 9
$184,947 100 $138,336 100 $42,748 100
In 2011, two customers accounted for 42 percent and 10 percent of total revenues, respectively. In2010, two customers accounted for 40 percent and 12 percent of total revenues, respectively. In 2009, threecustomers accounted for 30 percent, 15 percent and 10 percent of total revenues, respectively.
At December 31, 2011, three customers accounted for 48 percent, 15 percent and 13 percent of ouraccounts receivable, respectively. At December 31, 2010, four customers accounted for 19 percent,13 percent, 11 percent and 11 percent of our accounts receivable, respectively.
Geographical information relating to our property and equipment as of December 31, 2011 and 2010is as follows:
December 31,
2011 2010
(thousands)
Property and equipment, net:United States . . . . . . . . . . . . . . . . . . . . . . . . . . . . . . . . . . . . . . . . . . . . . . . . . $ 5,306 $ 9,880Germany . . . . . . . . . . . . . . . . . . . . . . . . . . . . . . . . . . . . . . . . . . . . . . . . . . . . . 2,396 2,236Canada . . . . . . . . . . . . . . . . . . . . . . . . . . . . . . . . . . . . . . . . . . . . . . . . . . . . . . 2,281 2,507Others . . . . . . . . . . . . . . . . . . . . . . . . . . . . . . . . . . . . . . . . . . . . . . . . . . . . . . 569 388
$10,552 $15,011
66

12. Income Taxes
The components of income (loss) before income taxes are as follows:
Year Ended December 31,
2011 2010 2009
(thousands)
Domestic loss . . . . . . . . . . . . . . . . . . . . . . . . . . . . . . . . . . . . . . . . . . $(17,052) $(32,620) $(71,241)Foreign income (loss) . . . . . . . . . . . . . . . . . . . . . . . . . . . . . . . . . . . . 772 (462) (3,867)
Loss before income taxes . . . . . . . . . . . . . . . . . . . . . . . . . . . . . . . . $(16,280) $(33,082) $(75,108)
The provision for (benefit from) income taxes consists of the following:
Year Ended December 31,
2011 2010 2009
(thousands)
Current:Federal . . . . . . . . . . . . . . . . . . . . . . . . . . . . . . . . . . . . . . . . . . . . . . . . $ 16 $(451) $ 66State . . . . . . . . . . . . . . . . . . . . . . . . . . . . . . . . . . . . . . . . . . . . . . . . . . 4 4 (1)Foreign . . . . . . . . . . . . . . . . . . . . . . . . . . . . . . . . . . . . . . . . . . . . . . . . (1,949) 77 (8,787)
Total current . . . . . . . . . . . . . . . . . . . . . . . . . . . . . . . . . . . . . . . . . . (1,929) (370) (8,722)
Deferred:Federal . . . . . . . . . . . . . . . . . . . . . . . . . . . . . . . . . . . . . . . . . . . . . . . . — — —State . . . . . . . . . . . . . . . . . . . . . . . . . . . . . . . . . . . . . . . . . . . . . . . . . . — — —Foreign . . . . . . . . . . . . . . . . . . . . . . . . . . . . . . . . . . . . . . . . . . . . . . . . 3,599 691 656
Total deferred . . . . . . . . . . . . . . . . . . . . . . . . . . . . . . . . . . . . . . . . . . 3,599 691 656
Provision for (benefit from) income taxes . . . . . . . . . . . . . . . . . . . . . . . . . $ 1,670 $ 321 $(8,066)
The provision for (benefit from) income taxes reconciles to the amount computed by multiplying lossbefore income taxes by the U.S. statutory rate of 35 percent as follows:
Year Ended December 31,
2011 2010 2009
(thousands)
Provision (benefit) at statutory rate . . . . . . . . . . . . . . . . . . . . . . . . . . . $(5,691) $(11,579) $(26,286)Deferred tax asset valuation allowance . . . . . . . . . . . . . . . . . . . . . . . . 5,169 9,699 24,060Foreign earnings taxed at different rates . . . . . . . . . . . . . . . . . . . . . . . 4,822 2,261 3,492State taxes, net of federal benefit . . . . . . . . . . . . . . . . . . . . . . . . . . . . 2 2 (1)Nondeductible stock option expense . . . . . . . . . . . . . . . . . . . . . . . . . . 507 573 512Uncertain tax position reserve release . . . . . . . . . . . . . . . . . . . . . . . . . (3,151) (697) (9,319)Other . . . . . . . . . . . . . . . . . . . . . . . . . . . . . . . . . . . . . . . . . . . . . . . . 12 62 (524)
Provision for (benefit from) income taxes . . . . . . . . . . . . . . . . . . . . . . $ 1,670 $ 321 $ (8,066)
67

Deferred tax assets are comprised of the following:
December 31,
2011 2010
(thousands)
Net operating loss carryforwards . . . . . . . . . . . . . . . . . . . . . . . . . . . . . . . . . . $ 156,589 $ 149,246Reserves not currently deductible . . . . . . . . . . . . . . . . . . . . . . . . . . . . . . . . . . 10,691 11,328Tax credit carryforwards . . . . . . . . . . . . . . . . . . . . . . . . . . . . . . . . . . . . . . . . . 985 1,242Depreciation . . . . . . . . . . . . . . . . . . . . . . . . . . . . . . . . . . . . . . . . . . . . . . . . . 4,969 4,604Deferred revenue . . . . . . . . . . . . . . . . . . . . . . . . . . . . . . . . . . . . . . . . . . . . . 751 513Research and development capitalization . . . . . . . . . . . . . . . . . . . . . . . . . . . . 17 151Other . . . . . . . . . . . . . . . . . . . . . . . . . . . . . . . . . . . . . . . . . . . . . . . . . . . . . . 1 1,119
Total deferred tax asset . . . . . . . . . . . . . . . . . . . . . . . . . . . . . . . . . . . . . . . 174,003 168,203Valuation allowance . . . . . . . . . . . . . . . . . . . . . . . . . . . . . . . . . . . . . . . . . . . (174,003) (164,400)
Net deferred tax asset . . . . . . . . . . . . . . . . . . . . . . . . . . . . . . . . . . . . . . . . . . $ — $ 3,803
The valuation allowance at December 31, 2011 is against all deferred tax and at December 31, 2010 isattributable to federal and state deferred tax assets, as well as certain foreign deferred tax assets. Ourvaluation allowance was determined in accordance with the applicable authoritative guidance, whichrequires an assessment of both positive and negative evidence when determining whether it is more likelythan not that deferred assets are recoverable, with such assessment being required on ajurisdiction-by-jurisdiction basis. As of December 31, 2011, a full valuation allowance was set up againstour German deferred tax assets. In assessing the need for a valuation allowance in the current year onthese German deferred tax assets, management considered historical levels of income and losses,expectations and risks associated with estimates of future taxable income and ongoing prudent and feasibletax planning strategies. For our other tax assets, management believes that sufficient uncertainty exists withregard to the realizability of these tax assets such that a valuation allowance is necessary. Factorsconsidered in providing a valuation allowance include the lack of a significant history of consistent profits,the cyclical nature of the overall semiconductor market thereby negatively impacting our ability to sustainor grow revenues and earnings and the lack of carry-back capacity to realize these assets. Based on theabsence of sufficient positive objective evidence, management is unable to assert that it is more likely thannot that we will generate sufficient taxable income to realize these remaining net deferred assets. Theamount of the deferred tax asset valuation allowance, however, could be reduced in future periods to theextent that future taxable income is realized.
As of December 31, 2011, we had federal and state net operating loss carryforwards of $427.1 millionand $100.1 million, respectively, which will begin expiring in 2018 for federal and 2012 for state. We alsohave foreign net operating loss carryforwards in Canada, Japan and Germany of $29.0 million, $1.6 millionand $12.1 million, respectively. Canada and Japan net operating loss carryforwards will begin expiring in2014. The German net operating loss carryforward has an indefinite carryover life.
We acquired $48.0 million of deferred tax assets as a result of our acquisitions of Vortek, STEAGSemiconductor Division, CFM and Concept Systems Design, Inc. The federal and state net operatinglosses acquired from the STEAG Semiconductor Division, CFM and Concept are also subject to change incontrol limitations as defined in Section 382 of the Internal Revenue Code. In addition, we had a change incontrol in April 2002, which limited our net operating losses generated prior to the date the ownershipchange occurred. If certain substantial changes in our ownership occur, there would be an additionalannual limitation on the amount of the net operating loss carryforwards that can be utilized.
As of December 31, 2011, we had research credit carryforwards of approximately $3.4 million and$4.0 million for federal and state income tax purposes, respectively. If not utilized, the federal carryforward
68

will expire in various amounts beginning in 2026. The California tax credit can be carried forwardindefinitely.
We provide U.S. income taxes on the earnings of foreign subsidiaries unless subsidiary earnings areconsidered indefinitely reinvested outside the U.S. As of December 31, 2011, U.S. income taxes were notprovided for on a cumulative total of $6.1 million of undistributed earnings for certain foreign subsidiaries.If these earnings were repatriated, we would be subject to additional U.S. income taxes (subject to anadjustment for foreign tax credits). It is not practical to determine the income tax liability that might beincurred if these earnings were to be repatriated. We intend to permanently reinvest all foreign unremittedearnings of foreign subsidiaries outside of the U.S., except for Germany. We permanently reinvestednon-U.S. earnings that have been deployed in active business operations, and we do not intend torepatriate any portion of our permanently reinvested non-U.S. earnings in the future.
As of December 31, 2011, our total unrecognized tax benefits were $25.1 million exclusive of interestand penalties described below. Included in the $25.1 million is approximately $1.1 million of unrecognizedtax benefits (net of federal benefit), that if recognized, would favorably affect the effective tax rate in afuture period before consideration of changes in the valuation allowance. We anticipate there may be adecrease of $0.4 million in our unrecognized tax benefit within the next twelve months.
Our practice is to recognize interest and/or penalties related to unrecognized tax benefits in incometax expense. Income tax expense included an estimated interest of $0.2 million for 2011, $0.3 million for2010 and $0.3 million for 2009. As of December 31, 2011 and 2010, we had $0.3 million and $1.2 million,respectively, accrued for estimated interest. As of December 31, 2011 and 2010, we had zero and$0.1 million, respectively, accrued for estimated penalties.
We are subject to U.S. federal income tax as well as to income taxes in Germany and various otherforeign and state jurisdictions. Our federal and state income tax returns are generally not subject toexamination by tax authorities for years before 2008 and 2007, respectively. We had no tax audits inprogress as of December 31, 2011.
A reconciliation of unrecognized tax benefits is as follows:
Year Ended December 31,
2011 2010 2009
(millions)
Balance at the beginning of the year . . . . . . . . . . . . . . . . . . . . . . . . . . . . . . . . $27.1 $27.6 $36.3Tax positions related to current year:
Additions . . . . . . . . . . . . . . . . . . . . . . . . . . . . . . . . . . . . . . . . . . . . . . . . . . — — 0.4Reductions . . . . . . . . . . . . . . . . . . . . . . . . . . . . . . . . . . . . . . . . . . . . . . . . . — — —
Tax positions related to prior years:Additions . . . . . . . . . . . . . . . . . . . . . . . . . . . . . . . . . . . . . . . . . . . . . . . . . . — — 0.3Reductions . . . . . . . . . . . . . . . . . . . . . . . . . . . . . . . . . . . . . . . . . . . . . . . . . (0.1) — —
Settlement with taxing authorities . . . . . . . . . . . . . . . . . . . . . . . . . . . . . . . . . . — — (9.3)Expiration of statutes of limitations . . . . . . . . . . . . . . . . . . . . . . . . . . . . . . . . . (1.9) (0.5) (0.1)
Balance at the end of the year . . . . . . . . . . . . . . . . . . . . . . . . . . . . . . . . . . . . $25.1 $27.1 $27.6
13. Net Loss Per Share
We present both basic and diluted net loss per share on the face of our consolidated statements ofoperations in accordance with the authoritative guidance on earnings per share. Basic net loss per share iscomputed by dividing net loss by the weighted-average number of shares of common stock outstanding forthe period. Since we had net losses in 2011, 2010 and 2009, none of the stock options and restricted stock
69

units were included in the computation of diluted shares for those years, as inclusion of such shares wouldhave been antidilutive.
The following table summarizes the incremental shares of common stock from potentially dilutivesecurities, calculated using the treasury stock method:
Year Ended December 31,
2011 2010 2009
(thousands)
Weighted average common shares outstanding—basic . . . . . . . . . . . . . . . . . 55,299 50,073 49,832Effect of dilutive potential common shares from stock options and
restricted stock units . . . . . . . . . . . . . . . . . . . . . . . . . . . . . . . . . . . . . . — — —
Weighted average common shares—diluted . . . . . . . . . . . . . . . . . . . . . . . . . 55,299 50,073 49,832
All outstanding stock options and restricted stock units are potentially dilutive securities, and as ofDecember 31, 2011, 2010 and 2009, the combined total of stock options and restricted stock unitsoutstanding were 6.7 million, 6.6 million and 5.4 million, respectively.
70

Report of Independent Registered Public Accounting Firm
To the Board of Directors and Stockholders of Mattson Technology, Inc.
In our opinion, the accompanying consolidated balance sheets and the related consolidatedstatements of operations, stockholders’ equity and comprehensive loss, and cash flows present fairly, in allmaterial respects, the financial position of Mattson Technology, Inc. and its subsidiaries at December 31,2011 and 2010 and the results of their operations and their cash flows for each of the three years in theperiod ended December 31, 2011 in conformity with accounting principles generally accepted in theUnited States of America. In addition, in our opinion, the financial statement schedule listed in the indexappearing under Item 15(a)(2) presents fairly, in all material respects, the information set forth thereinwhen read in conjunction with the related consolidated financial statements. Also in our opinion, theCompany maintained, in all material respects, effective internal control over financial reporting as ofDecember 31, 2011, based on criteria established in Internal Control—Integrated Framework issued by theCommittee of Sponsoring Organizations of the Treadway Commission (COSO). The Company’smanagement is responsible for these financial statements and financial statement schedule, for maintainingeffective internal control over financial reporting and for its assessment of the effectiveness of internalcontrol over financial reporting, included in the Management’s Report on Internal Control over FinancialReporting under Item 9A. Our responsibility is to express opinions on these financial statements, on thefinancial statement schedule, and on the Company’s internal control over financial reporting based on ourintegrated audits. We conducted our audits in accordance with the standards of the Public CompanyAccounting Oversight Board (United States). Those standards require that we plan and perform the auditsto obtain reasonable assurance about whether the financial statements are free of material misstatementand whether effective internal control over financial reporting was maintained in all material respects. Ouraudits of the financial statements included examining, on a test basis, evidence supporting the amounts anddisclosures in the financial statements, assessing the accounting principles used and significant estimatesmade by management, and evaluating the overall financial statement presentation. Our audit of internalcontrol over financial reporting included obtaining an understanding of internal control over financialreporting, assessing the risk that a material weakness exists, and testing and evaluating the design andoperating effectiveness of internal control based on the assessed risk. Our audits also included performingsuch other procedures as we considered necessary in the circumstances. We believe that our audits providea reasonable basis for our opinions.
A company’s internal control over financial reporting is a process designed to provide reasonableassurance regarding the reliability of financial reporting and the preparation of financial statements forexternal purposes in accordance with generally accepted accounting principles. A company’s internalcontrol over financial reporting includes those policies and procedures that (i) pertain to the maintenanceof records that, in reasonable detail, accurately and fairly reflect the transactions and dispositions of theassets of the company; (ii) provide reasonable assurance that transactions are recorded as necessary topermit preparation of financial statements in accordance with generally accepted accounting principles,and that receipts and expenditures of the company are being made only in accordance with authorizationsof management and directors of the company; and (iii) provide reasonable assurance regarding preventionor timely detection of unauthorized acquisition, use, or disposition of the company’s assets that could havea material effect on the financial statements.
Because of its inherent limitations, internal control over financial reporting may not prevent or detectmisstatements. Also, projections of any evaluation of effectiveness to future periods are subject to the riskthat controls may become inadequate because of changes in conditions, or that the degree of compliancewith the policies or procedures may deteriorate.
/s/ PricewaterhouseCoopers LLP
San Jose, CaliforniaFebruary 21, 2012
71

Supplementary Financial Information
Selected Quarterly Consolidated Financial Data (Unaudited)
The following tables set forth our unaudited condensed consolidated statements of operations datafor each of the eight quarterly periods ended December 31, 2011. We have prepared this unauditedinformation on a basis consistent with our audited consolidated financial statements, reflecting all normalrecurring adjustments that we consider necessary for a fair presentation of our financial position andoperating results for the fiscal quarters presented. Basic and diluted losses per share are computedindependently for each of the quarters presented. Therefore, the sum of quarterly basic and diluted pershare information may not equal annual basic and diluted losses per share.
Three Months Ended(1)
April 3, July 3, October 2, December 31,2011 2011 2011 2011
(thousands, except per share amounts)
Net sales . . . . . . . . . . . . . . . . . . . . . . . . . . . . . . . . . . . . $47,049 $51,259 $44,945 $41,694Gross profit . . . . . . . . . . . . . . . . . . . . . . . . . . . . . . . . . . $12,881 $13,984 $15,516 $13,867Loss from operations . . . . . . . . . . . . . . . . . . . . . . . . . . . . $ (5,081) $(4,028) $(2,625) $(4,816)Net loss . . . . . . . . . . . . . . . . . . . . . . . . . . . . . . . . . . . . . $ (6,274) $(5,213) $(2,289) $(4,174)Net loss per share:
Basic and diluted . . . . . . . . . . . . . . . . . . . . . . . . . . . . . $ (0.12) $ (0.10) $ (0.04) $ (0.07)Shares used in computing net loss per share:
Basic and diluted . . . . . . . . . . . . . . . . . . . . . . . . . . . . . 50,287 54,550 58,224 58,276
Three Months Ended(1)
March 28, June 27, September 26, December 31,2010 2010 2010 2010
(thousands, except per share amounts)
Net sales . . . . . . . . . . . . . . . . . . . . . . . . . . . . . . . . . . $ 25,195 $32,120 $39,762 $41,259Gross profit . . . . . . . . . . . . . . . . . . . . . . . . . . . . . . . $ 6,517 $ 8,530 $13,231 $11,106Loss from operations . . . . . . . . . . . . . . . . . . . . . . . . . $(11,033) $(9,598) $(4,984) $(7,580)Net loss . . . . . . . . . . . . . . . . . . . . . . . . . . . . . . . . . . $(10,756) $(8,380) $(6,366) $(7,901)Net loss per share:
Basic and diluted . . . . . . . . . . . . . . . . . . . . . . . . . . $ (0.22) $ (0.17) $ (0.13) $ (0.16)Shares used in computing net loss per share:
Basic and diluted . . . . . . . . . . . . . . . . . . . . . . . . . . 49,984 50,052 50,094 50,153
(1) For presentation purposes, we reclassified certain prior period costs related to our spare partsbusiness from selling, general and administrative expense to cost of sales as they more appropriatelyreflect costs associated with revenue generating activities. The results of these reclassifications do notaffect our net income, cash flows or stockholders’ equity.
72


The effectiveness of the Company’s internal control over financial reporting as of December 31, 2011has been audited by PricewaterhouseCoopers, LLP, an independent registered public accounting firm, asstated in their report, which appears in Item 8 of this report.
Changes in Internal Control over Financial Reporting
Our management, with the participation of our Chief Executive Officer and Chief Financial Officer,also conducted an evaluation of our internal control over financial reporting to determine whether anychange occurred during the year ended December 31, 2011 that has materially affected, or is reasonablylikely to materially affect, our internal control over financial reporting. Based on that evaluation, ourmanagement concluded that there was no such change during the fourth quarter.
Item 9B. Other Information
None.
PART III
Item 10. Directors, Executive Officers and Corporate Governance
The information required by this item will be included under the captions ‘‘Executive Compensation,’’‘‘Election of Directors,’’ ‘‘Report of the Audit Committee’’ and ‘‘Section 16(a) Beneficial OwnershipReporting Compliance’’ for the 2012 Annual Meeting in our Proxy Statement with the SEC within 120 daysof the year-end December 31, 2011 (2012 Proxy Statement) and is incorporated herein by reference.
We have adopted a Code of Ethics and Business Conduct for all officers, directors and employees. Wehave posted the Code of Ethics and Business Conduct on our website located at http://www.mattson.com.We intend to satisfy the disclosure requirement under Item 5.05 of Form 8-K regarding an amendment to,or a waiver from, this Code of Ethics by posting such information on our website.
Item 11. Executive Compensation
The information required by this item will be set forth in our 2012 Proxy Statement under the captions‘‘Executive Compensation’’ and ‘‘Report of the Compensation Committee on Executive Compensation’’and is incorporated herein by reference.
Item 12. Security Ownership of Certain Beneficial Owners and Management and Related StockholderMatters
Information related to the security ownership of certain beneficial owners and management will be setforth in our 2012 Proxy Statement under the caption ‘‘Security Ownership of Management and PrincipalStockholders,’’ and is incorporated herein by reference.
Item 13. Certain Relationships and Related Transactions, and Director Independence
The information required by this item will be set forth in our 2012 Proxy Statement under the caption‘‘Certain Relationships and Related Transactions, and Director Independence’’ and is incorporated hereinby reference.
Item 14. Principal Accountant Fees and Services
The information required by this item will be set forth in our 2012 Proxy Statement under the captions‘‘Audit and Related Fees’’ and ‘‘Policy on Audit Committee Pre-Approval of Audit and PermissibleNon-Audit Services of Independent Auditors’’ and is incorporated herein by reference.
74

PART IV
Item 15. Exhibits and Financial Statement Schedules
(a)(1) Financial Statements
The financial statements filed as part of this report are listed on the index to consolidated financialstatements in Item 8.
(a)(2) Financial Statement Schedules
Schedule II—Valuation and Qualifying Accounts for the three years ended December 31, 2011, 2010and 2009, which is included in Schedule II of this Form 10-K.
(a)(3) Exhibits
ExhibitNumber Description Notes
3.1 Amended and Restated Certificate of Incorporation of Mattson Technology, Inc. (1)
3.2 Amended and Restated Bylaws of Mattson Technology, Inc. (3)
4.5 Form of Rights Agreement between the Mattson Technology, Inc. and Mellon (4)Investor Services, LLC as Rights Agent (including as Exhibit A the form ofCertificate of Designation, Preferences and Rights of the Terms of the Series APreferred Stock, as Exhibit B the form of Right Certificate, and as Exhibit C theSummary of Terms of Rights Agreement)
4.6 Amendment No. 1 to Rights Agreement between Mattson Technology, Inc. and (5)Mellon Investor Services, LLC as Rights Agent
4.7 Amendment No. 2 to Rights Agreement between Mattson Technology, Inc. and (14)Mellon Investor Services, LLC as Rights Agent
10.1 2005 Equity Incentive Plan (6) (C)
10.2 Amendment #1 to 2005 Equity Incentive Plan (7) (C)
10.3 Nonqualified Deferred Compensation Plan (8) (C)
10.4 1989 Stock Option plan, as amended (2) (C)
10.5 Amended and Restated 1994 Employee Stock Purchase Plan 16
10.6 Form of Indemnity Agreement (9) (C)
10.10 Industrial Space Lease, dated August 1, 2005, between Mattson (10)Technology, Inc. and Renco Equities IV, a California partnership.
10.11 Sublease Agreement dated February 27, 2003, by and between Lam Research (11)Corporation, a Delaware Corporation, and Mattson Technology, Inc., aDelaware Corporation, for lease of building.
10.12 Lease Agreement dated September 2, 2001, by and between Renco Equities IV, (11)a California partnership, and Lam Research Corporation, a DelawareCorporation, for lease of building.
10.13 Form of Performance Based Restricted Stock Units Agreement between (12)Mattson Technology and some employees.
75

ExhibitNumber Description Notes
10.15 Severance and Executive Change of Control Agreement for David Dutton, (13) (C)President and Chief Executive Officer
10.16 Severance and Executive Change of Control Agreement for J. Michael Dodson, (15) (C)Chief Financial Officer
10.17 Transition Agreement and Release for Andy Moring, Chief Financial Officer, 17 (C)Secretary and Executive Vice President—Finance
10.18 Offer Letter between Mattson Technology, Inc. and J. Michael Dodson 17 (C)
21.1 Subsidiaries of Registrant. *
23.1 Consent of Independent Registered Public Accounting Firm *
31.1 Certification of Chief Executive Officer Pursuant to Sarbanes-Oxley Act *Section 302(a)
31.2 Certification of Chief Financial Officer Pursuant to Sarbanes-Oxley Act *Section 302(a)
32.1 Certification of Chief Executive Officer Pursuant to 18 U.S.C. Section 1350 *
32.2 Certification of Chief Financial Officer Pursuant to 18 U.S.C. Section 1350 *
101.INS XBRL Instance Document. (18)
101.SCH XBRL Taxonomy Extension Schema Document. (18)
101.CAL XBRL Taxonomy Extension Calculation Linkbase Document. (18)
101.DEF XBRL Taxonomy Extension Definition Linkbase Document. (18)
101.LAB XBRL Taxonomy Extension Label Linkbase Document. (18)
101.PRE XBRL Taxonomy Extension Presentation Linkbase Document. (18)
Notes:
* Filed herewith.
(C) Management contract or compensatory plan or arrangement.
(1) Incorporated by reference to corresponding exhibit to Mattson Technology, Inc. current report onForm 8-K/A filed on January 30, 2001.
(2) Incorporated by reference to corresponding exhibit to Mattson Technology, Inc. quarterly report onForm 10-Q filed on August 14, 2002.

SIGNATURES
Pursuant to the requirements of Section 13 or 15(d) of the Securities Exchange Act of 1934, theRegistrant has duly caused this report to be signed on its behalf by the undersigned, thereunto dulyauthorized.
MATTSON TECHNOLOGY, INC.(Registrant)
February 21, 2012 By: /s/ DAVID DUTTON
David DuttonPresident, Chief Executive Officer and Director
(Principal Executive Officer)
February 21, 2012 By: /s/ J. MICHAEL DODSON
J. Michael DodsonChief Financial Officer,
Executive Vice President—Finance and Secretary(Principal Financial and Accounting Officer)
Pursuant to the requirements of the Securities Exchange Act of 1934, this report has been signedbelow by the following persons on behalf of the Registrant and in the capacities and on the date indicated.
Signature Title Date
/s/ HANS-GEORG BETZChairman of the Board and Director February 21, 2012
Hans-Georg Betz
/s/ RICHARD E. DYCKDirector February 21, 2012
Richard E. Dyck
/s/ KENNETH KANNAPPANDirector February 21, 2012
Kenneth Kannappan
/s/ SCOTT KRAMERDirector February 21, 2012
Scott Kramer
/s/ SHIGERU NAKAYAMADirector February 21, 2012
Shigeru Nakayama
/s/ SCOTT PETERSONDirector February 21, 2012
Scott Peterson
/s/ KENNETH SMITHDirector February 21, 2012
Kenneth Smith
78

SCHEDULE II
VALUATION AND QUALIFYING ACCOUNTS
Allowance for Doubtful Accounts
Balance at ChargedBeginning (Credited) Deductions Balance at
Year Ended December 31, of Year to Income and Other End of Year
(thousands)
2011 . . . . . . . . . . . . . . . . . . . . . . . . . . . . . . . . . . . . . . . $ 681 $ 8 $ (5) $ 6842010 . . . . . . . . . . . . . . . . . . . . . . . . . . . . . . . . . . . . . . . $2,167 $(1,154) $(332) $ 6812009 . . . . . . . . . . . . . . . . . . . . . . . . . . . . . . . . . . . . . . . $4,606 $(2,440) $ 1 $2,167
Schedules other than those listed above have been omitted since they are either not required, notapplicable, or because the information required is included in the consolidated financial statements or thenotes thereto.
79