Embed Size (px)
Citation preview
FORM 10-K SECURITIES AND EXCHANGE COMMISSION
Washington, D.C. 20549
(Mark one)
[ ] ANNUAL REPORT PURSUANT TO SECTION 13 OR 15(d) OF THE SECURITIES EXCHANGE ACT OF 1934 FOR THE YEAR ENDED DECEMBER 31, 2001 OR
[ ] TRANSITION REPORT PURSUANT TO SECTION 13 OR 15(d) OF THE
SECURITIES EXCHANGE ACT OF 1934
Commission file number 1-12317
NATIONAL-OILWELL, INC. (Exact name of registrant as specified in its charter)
Delaware (State or other jurisdiction
of incorporation or organization)
76-0475815 (IRS Employer
Identification No.)
10000 Richmond Avenue 4th Floor
Houston, Texas 77042-4200
(Address of principal executive offices)
(713) 346-7500
(Registrant’s telephone number, including area code)
Securities registered pursuant to Section 12(b) of the Act:
Common Stock, par value $.01 (Title of Class)
New York Stock Exchange (Exchange on which registered)
Securities registered pursuant to Section 12(g) of the Act: None
Indicate by check mark whether the registrant (1) has filed all reports required to be filed by Section 13 or 15(d) of the Securities Exchange Act of 1934 during the preceding 12 months (or for such shorter period that the registrant was required to file such reports), and (2) has been subject to such filing requirements for the past 90 days.
YES NO
Indicate by check mark if disclosure of delinquent filers pursuant to Item 405 of Regulation S-K is not contained herein, and will not be contained, to the best of registrant’s knowledge, in definitive proxy or information statements incorporated by reference in Part III of this Form 10-K or any amendment to this Form 10-K. [ ] As of March 22, 2002, 80,947,105 common shares were outstanding. Based upon the closing price of these shares on the New York Stock Exchange and, excluding solely for purposes of this calculation 5,798,591 shares beneficially owned by directors and executive officers, the aggregate market value of the common shares of National-Oilwell, Inc. held by non-affiliates was approximately $1.8 billion. Documents Incorporated by Reference Portions of the Proxy Statement in connection with the 2002 Annual Meeting of Stockholders are incorporated in Part III of this report.

Item 1. Business
GENERAL National Oilwell is a worldwide leader in the design, manufacture and sale of comprehensive systems and components used in oil and gas drilling and production, as well as in providing supply chain integration services to the upstream oil and gas industry. National Oilwell manufactures and assembles drilling machinery, including drawworks, mud pumps and top drives, which are the major mechanical components of drilling rigs, as well as masts, derricks, cranes and substructures. Many of these components are designed specifically for more demanding applications, which include offshore, extended reach and deep land drilling. We also provide electrical power systems, computer control systems and automation systems for drilling rigs. Our systems are used in many of the industry’s most technologically demanding applications. In addition, we provide engineering and fabrication services to integrate our drilling products and deliver complete land drilling and workover rigs as well as drilling modules for mobile offshore drilling rigs or offshore drilling platforms. Our Products and Technology segment also designs and manufactures drilling motors and specialized downhole tools for rent and sale. Drilling motors are essential components of systems for horizontal, directional, extended reach and performance drilling. Downhole tools include fishing tools, drilling jars, shock tools and other specialized products. Our Distribution Services segment offers comprehensive supply chain integration services to the drilling and production segments. Our network of service centers located in the United States and Canada and near other major drilling and production activity worldwide use state of the art information technology platforms to provide procurement, inventory management and logistics services. These service centers stock and sell a variety of expendable items for oilfield applications and spare parts for equipment manufactured by National Oilwell. BUSINESS STRATEGY National Oilwell's business strategy is to enhance its market positions and operating performance by: Leveraging our Installed Base of Drilling Machinery and Equipment We believe our market position and comprehensive product offering present substantial opportunities to capture a significant portion of expenditures for the construction of new drilling rigs and equipment as well as the upgrade and refurbishment of existing drilling rigs and equipment. Over the next few years, the advanced age of the existing fleet of drilling rigs, coupled with drilling activity involving greater depths and extended reach, is expected to generate demand for new equipment. National Oilwell's automation and control systems offer the potential to improve the performance of new and existing drilling rigs. The large installed base of our equipment also provides recurring demand for spare parts and expendable products necessary for proper and efficient operation. Expanding our Downhole Products Business We believe economic opportunities for directional, horizontal, extended reach and other value-added drilling applications will increase, providing an opportunity for growth in the rental and sale of high-performance drilling motors and downhole tools. Furthering our Information Technology and Process Improvement Strategy National Oilwell has developed an integrated information technology and process improvement strategy to enhance procurement, inventory management and logistics activities. As a result of the need to improve industry efficiency, oil and gas companies and drilling contractors are frequently seeking alliances with suppliers, manufacturers and
-1-
service providers to achieve cost and capital improvements. We believe we are well positioned to provide these services as a result of our:
- large and geographically diverse network of distribution service centers in major oil and gas producing areas;
- strong relationship with a large community of industry suppliers;
- knowledge of customers procurement processes, suppliers capabilities and products performance; and
- information systems that offer customers and suppliers enhanced e-commerce capabilities.
In addition, the integration of our distribution expertise, extensive network and growing base of customer alliances provides an increased opportunity for cost-effective marketing of our manufactured parts and equipment. Continuing our Acquisitions Strategy We believe the oilfield service and equipment industry will continue to experience consolidation as businesses seek to align themselves with other market participants in order to gain access to broader markets and integrated product offerings. From 1997 through January 2002, National Oilwell has made a total of twenty-seven acquisitions and plans to continue to participate in this trend. OPERATIONS Products and Technology National Oilwell designs, manufactures and sells drilling systems and components for both land and offshore drilling rigs as well as complete land drilling and well servicing rigs. The major mechanical components include drawworks, mud pumps, top drives, SCR houses, solids control equipment, traveling equipment and rotary tables. These components are essential to the pumping of fluids and hoisting, supporting and rotating of the drill string. Many of these components are designed specifically for applications in offshore, extended reach and deep land drilling. This equipment is installed on new rigs and often replaced during the upgrade and refurbishment of existing rigs. Masts, derricks and substructures are designed and manufactured for use on land rigs and on fixed and mobile offshore platforms, and are suitable for drilling applications to depths of up to 30,000 feet or more. Other products include pedestal cranes, reciprocating and centrifugal pumps and fluid end expendables for all major manufacturers' pumps. Our business includes the sale of replacement parts for our own manufactured machinery and equipment. We also design and produce control and data acquisition systems for drilling related operations and automated and remotely controlled machinery for drilling rigs. Products include the Cyberbase™ operator system which incorporates computer software, keypads and joysticks rather than traditional gauges, lights and switches. The Cyberbase™ system forms the basis for the state-of-the-art driller’s cabin. Another product is the automated pipe handling system that provides an efficient and cost effective method of joining lengths of drill pipe or casing. While offering a complete line of conventional rigs, National Oilwell has extensive experience in providing rig designs to satisfy requirements for harsh or specialized environments. Such products include drilling and well servicing rigs designed for the Arctic, highly mobile drilling and well servicing rigs for jungle and desert use, modular well servicing rigs for offshore platforms and modular drilling facilities for North Sea platforms. We also design and produce fully integrated drilling solutions for the topside of offshore rigs. National Oilwell designs and manufactures drilling motors, drilling jars and specialized drilling tools for rent and sale. We also design and manufacture a complete line of fishing tools used to remove objects stuck in the wellbore.
-2-
Distribution Services National Oilwell provides distribution services through its network of approximately 150 distribution service centers. These distribution service centers stock and sell a variety of expendable items for oilfield applications and spare parts for our proprietary equipment. As oil and gas companies and drilling contractors have refocused on their core competencies and emphasized efficiency initiatives to reduce costs and capital requirements, our distribution services have expanded to offer outsourcing and alliance arrangements that include comprehensive procurement, inventory management and logistics support. In addition, we believe we have a competitive advantage in the distribution services business by distributing market-leading products manufactured by us. The supplies and equipment stocked by our distribution service centers vary by location. Each distribution point generally offers a large line of oilfield products including valves, fittings, flanges, spare parts for oilfield equipment and miscellaneous expendable items. Most drilling contractors and oil and gas companies typically buy supplies and equipment pursuant to non-exclusive contracts, which normally specify a discount from list price for each product or product category. Strategic alliances are also significant to the Distribution Services business and differ from standard agreements for supplies and equipment in that we become the customer's primary supplier of those items. In certain cases, we assume responsibility for procurement, inventory management and product delivery for the customer, occasionally by working directly out of the customer's facilities. We believe e-commerce brings a significant advantage to larger companies that are technologically proficient. During the last few years, we have invested over $20 million to improve our information technology systems. Our e-commerce system can interface directly with customers’ systems to maximize efficiencies for us and for our customers. We believe we have an advantage in this effort due to our investment in technology, geographic size, knowledge of the industry and customers, existing relationships with vendors and existing means of product delivery. Marketing Substantially all of our capital equipment and spare parts sales, and a large portion of our smaller pumps and parts sales, are made through our direct sales force and distribution service centers. Sales to foreign state-owned oil companies are typically made in conjunction with agent or representative arrangements. Our downhole products are generally rented and sold worldwide through our own sales force and through commissioned representatives. Distribution sales are made through our network of distribution service centers. Customers for our products and services include drilling and other service contractors, exploration and production companies, supply companies and nationally owned or controlled drilling and production companies. Competition The oilfield services and equipment industry is highly competitive and our revenues and earnings can be affected by price changes, introduction of new technologies and products and improved availability and delivery. We compete with a large number of companies, none of which are dominant. Manufacturing and Backlog National Oilwell has manufacturing facilities located in the United States, Canada and Norway. The manufacture of parts or purchase of components is sometimes outsourced to qualified subcontractors. The manufacturing operations require a variety of components, parts and raw materials which we purchase from multiple commercial sources. We have not experienced and do not expect any significant delays in obtaining deliveries of materials.
-3-
Sales of products are made on the basis of written orders and oral commitments. Our backlog for equipment at recent year ends has been: December 31, 2001 $ 385 million December 31, 2000 282 million December 31, 1999 114 million December 31, 1998 83 million Distribution Suppliers National Oilwell obtains products sold by its Distribution Services business from a number of suppliers, including our own Products and Technology segment. No single supplier of products is significant to our operations. We have not experienced and do not expect a shortage of products that we sell. Engineering National Oilwell maintains a staff of engineers and technicians to:
- design and test new products, components and systems for use in drilling and pumping applications;
- enhance the capabilities of existing products; and
- assist our sales organization and customers with special projects. Our product engineering efforts focus on developing technology to improve the economics and safety of drilling and pumping processes, and to emphasize technology and complete drilling solutions. Patents and Trademarks National Oilwell owns or has a license to use a number of patents covering a variety of products. Although in the aggregate these patents are of importance, we do not consider any single patent to be of a critical or essential nature. In general, our business has historically relied upon technological capabilities, quality products and application of expertise rather than patented technology. Employees As of December 31, 2001, we had a total of 6,200 employees, 3,400 of whom were salaried and 2,800 of whom were paid on an hourly basis. Of this workforce, 1,365 employees are employed in Canada and 574 are employed in other locations outside the United States. RISK FACTORS Before purchasing any shares of National Oilwell common stock, you should consider carefully the following factors, in addition to the other information contained or incorporated by reference herein. National Oilwell Depends on the Oil and Gas Industry National Oilwell is dependent upon the oil and gas industry and its willingness to explore for and produce oil and gas. The industry's willingness to explore and produce depends upon the prevailing view of future product prices. Many factors affect the supply and demand for oil and gas and therefore influence product prices, including:
-4-
- level of production from known reserves;
- cost of producing oil and gas;
- level of drilling activity;
- worldwide economic activity;
- national government political requirements;
- development of alternate energy sources; and
- environmental regulation. If there is a significant reduction in demand for drilling services, in cash flows of drilling contractors or production companies or in drilling or well servicing rig utilization rates, then demand for our products will decline. Oil and Gas Prices Are Volatile Oil and gas prices have been volatile over the last ten years, ranging from $10 - $40 per barrel. Oil prices were low in 1998, generally ranging from $11 to $16 per barrel. In 1999, oil prices recovered to more normal historical levels, and were generally in the $25-$30 per barrel range during 2000. Prices once again declined in the second half of 2001, generally ranging between $18 and $22. Spot gas prices have also been volatile over the last ten years, ranging from less than $1.00 per mmbtu to above $10.00. Gas prices were moderate in 1998 and 1999, generally ranging from $1.80 to $2.50 per mmbtu. Gas prices strengthened throughout 2000, generally ranging from $4-$8 per mmbtu. Since the second quarter of 2001, gas prices have been under pressure again, and have generally ranged from $2.20 to $3.00 per mmbtu. These price changes have caused many shifts in the strategies and expenditure levels of oil and gas companies and drilling contractors, particularly with respect to decisions to purchase major capital equipment of the type we manufacture. In the second half of 1998, lower oil prices slowed production and new drilling, particularly in areas with high per barrel cost of production. This slowdown quickly affected our Distribution Services segment and subsequently negatively impacted our Products and Technology segment. While activity increased in 2000 and 2001, demand again declined in the fourth quarter of 2001. We cannot predict future oil and gas prices or the effect prices will have on exploration and production levels. National Oilwell's Industry Is Highly Competitive The oilfield products and services industry is highly competitive. The following competitive actions can each affect our revenues and earnings: - price changes; - new product and technology introductions; and - improvements in availability and delivery. We compete with many companies and there are low barriers to entry in many of our businesses. Some of the companies with which we now or may in the future compete may possess greater financial resources or offer certain products that we do not have.
-5-
National Oilwell Faces Potential Product Liability and Warranty Claims Customers use some of our products in potentially hazardous drilling, completion and production applications that can cause: - injury or loss of life; - damage to property, equipment or the environment; and - suspension of operations. We maintain amounts and types of insurance coverage that we believe are consistent with normal industry practice. We cannot guarantee that insurance will be adequate to cover all liabilities we may incur. We also may not be able to maintain insurance in the future at levels we believe are necessary and at rates we consider reasonable. National Oilwell may be named as a defendant in product liability or other lawsuits asserting potentially large claims if an accident occurs at a location where our equipment and services have been used. We are currently party to various legal and administrative proceedings. We cannot predict the outcome of these proceedings, nor can we guarantee any negative outcomes will not be significant to us. Instability of Foreign Markets Could Have a Negative Impact on the Revenues of National Oilwell Some of our revenues depend upon customers in the Middle East, Africa, Southeast Asia, South America and other international markets. These revenues are subject to risks of instability of foreign economies and governments. Laws and regulations limiting exports to particular countries can affect our sales, and sometimes export laws and regulations of one jurisdiction contradict those of another. National Oilwell is exposed to the risks of changes in exchange rates between the U.S. dollar and foreign currencies. We do not currently engage in or plan to engage in any significant hedging or currency trading transactions designed to compensate for adverse currency fluctuations. National Oilwell May Not Be Able to Successfully Manage Its Growth National Oilwell has acquired 26 companies during the past five years, including nine in 2001. We also made one acquisition in January 2002 and intend to acquire additional companies in the future. We cannot predict whether suitable acquisition candidates will be available on reasonable terms or if we will have access to adequate funds to complete any desired acquisition. Once acquired, we cannot guarantee that we will successfully integrate the operations of the acquired companies. Combining organizations could interrupt the activities of some or all of our businesses and have a negative impact on operations. National Oilwell Has Debt In 1998, National Oilwell issued $150 million of 6 7/8% unsecured senior notes due July 1, 2005. In 2001, we issued an additional $150 million of 6 ¾% unsecured senior notes due March 15, 2011. As a result of these issuances, we became more leveraged. It is also possible that we will incur additional debt in the future in connection with acquisitions, operations or other matters. As of December 31, 2001, we had a total of $310 million of debt and a total of $868 million of stockholders' equity. Our leverage requires us to use some of our cash flow from operations for payment of interest on our debt. Our leverage may also make it more difficult to obtain additional financing in the future. Further, our leverage could make us more vulnerable to economic downturns and competitive pressures.
-6-
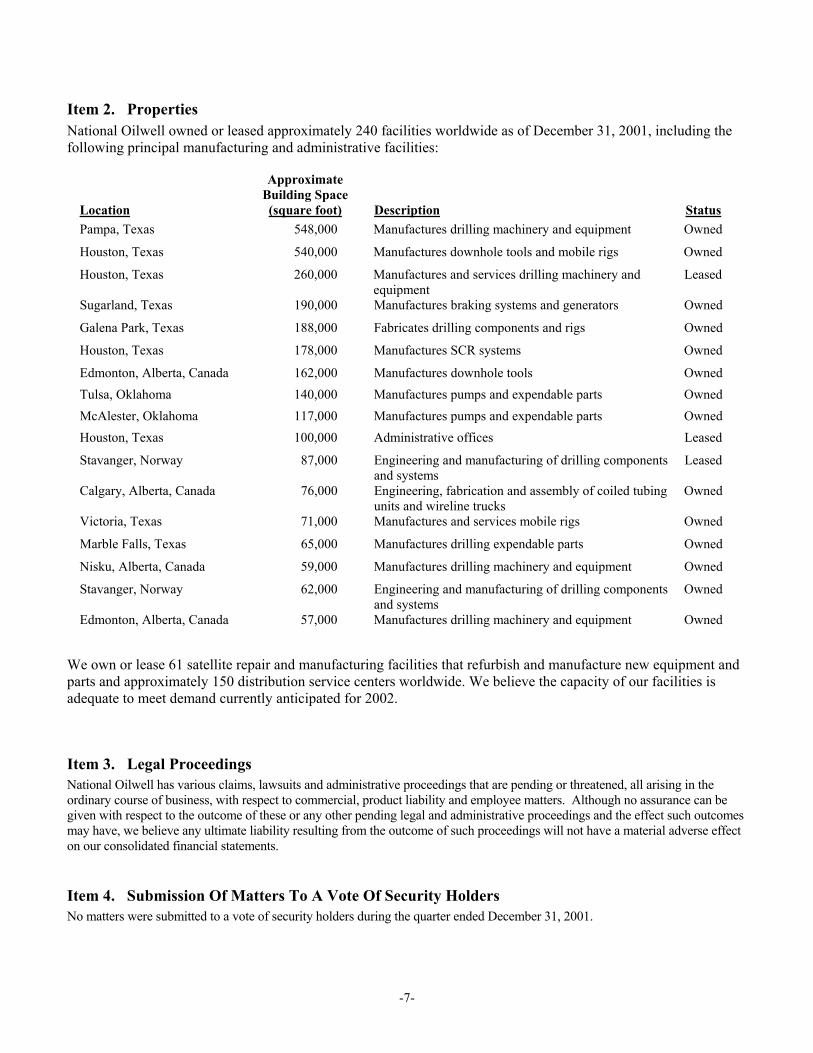
Item 2. Properties National Oilwell owned or leased approximately 240 facilities worldwide as of December 31, 2001, including the following principal manufacturing and administrative facilities:
Approximate Building Space Location (square foot) Description Status Pampa, Texas 548,000 Manufactures drilling machinery and equipment Owned
Houston, Texas 540,000 Manufactures downhole tools and mobile rigs Owned
Houston, Texas 260,000 Manufactures and services drilling machinery and equipment
Leased
Sugarland, Texas 190,000 Manufactures braking systems and generators Owned
Galena Park, Texas 188,000 Fabricates drilling components and rigs Owned
Houston, Texas 178,000 Manufactures SCR systems Owned
Edmonton, Alberta, Canada 162,000 Manufactures downhole tools Owned Tulsa, Oklahoma 140,000 Manufactures pumps and expendable parts Owned McAlester, Oklahoma 117,000 Manufactures pumps and expendable parts Owned Houston, Texas 100,000 Administrative offices Leased
Stavanger, Norway 87,000 Engineering and manufacturing of drilling components and systems
Leased
Calgary, Alberta, Canada 76,000 Engineering, fabrication and assembly of coiled tubing units and wireline trucks
Owned
Victoria, Texas 71,000 Manufactures and services mobile rigs Owned
Marble Falls, Texas 65,000 Manufactures drilling expendable parts Owned
Nisku, Alberta, Canada 59,000 Manufactures drilling machinery and equipment Owned
Stavanger, Norway 62,000 Engineering and manufacturing of drilling components and systems
Owned
Edmonton, Alberta, Canada 57,000 Manufactures drilling machinery and equipment Owned
We own or lease 61 satellite repair and manufacturing facilities that refurbish and manufacture new equipment and parts and approximately 150 distribution service centers worldwide. We believe the capacity of our facilities is adequate to meet demand currently anticipated for 2002.
Item 3. Legal Proceedings National Oilwell has various claims, lawsuits and administrative proceedings that are pending or threatened, all arising in the ordinary course of business, with respect to commercial, product liability and employee matters. Although no assurance can be given with respect to the outcome of these or any other pending legal and administrative proceedings and the effect such outcomes may have, we believe any ultimate liability resulting from the outcome of such proceedings will not have a material adverse effect on our consolidated financial statements.
Item 4. Submission Of Matters To A Vote Of Security Holders No matters were submitted to a vote of security holders during the quarter ended December 31, 2001.
-7-
Part II
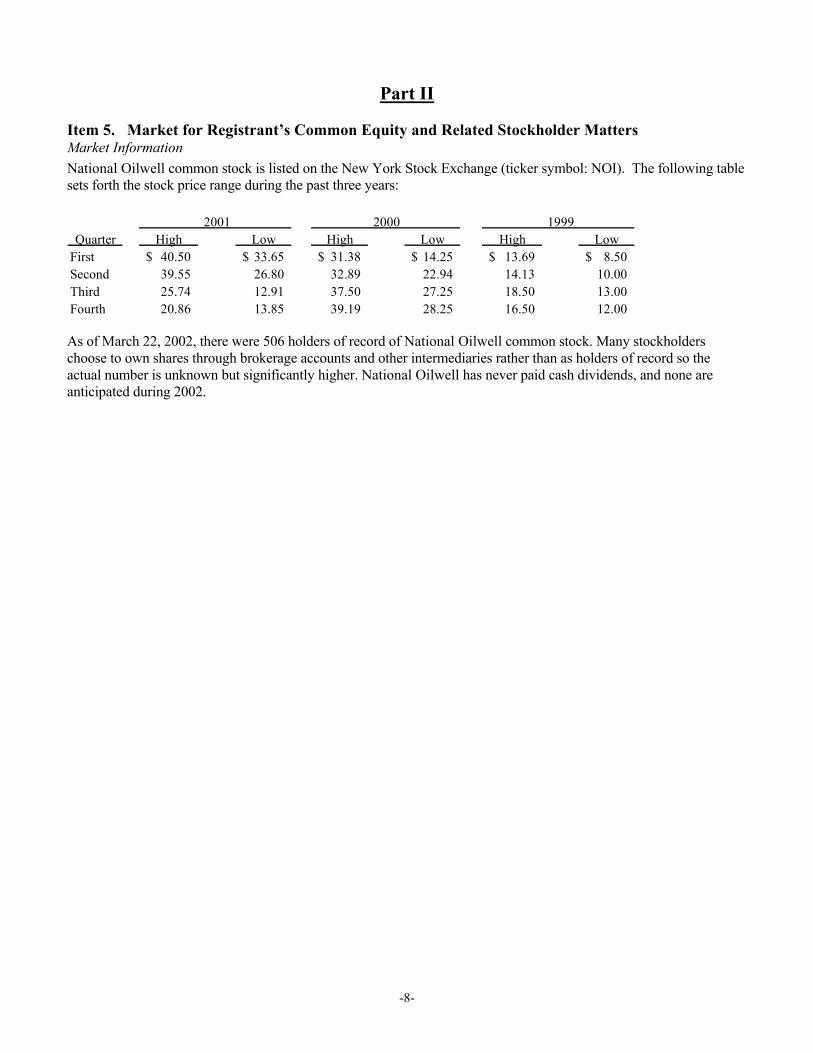
Item 5. Market for Registrant’s Common Equity and Related Stockholder Matters Market Information National Oilwell common stock is listed on the New York Stock Exchange (ticker symbol: NOI). The following table sets forth the stock price range during the past three years:
2001 2000 1999Quarter High Low High Low High Low
First 40.50$ 33.65$ 31.38$ 14.25$ 13.69$ 8.50$ Second 39.55 26.80 32.89 22.94 14.13 10.00 Third 25.74 12.91 37.50 27.25 18.50 13.00 Fourth 20.86 13.85 39.19 28.25 16.50 12.00 As of March 22, 2002, there were 506 holders of record of National Oilwell common stock. Many stockholders choose to own shares through brokerage accounts and other intermediaries rather than as holders of record so the actual number is unknown but significantly higher. National Oilwell has never paid cash dividends, and none are anticipated during 2002.
-8-
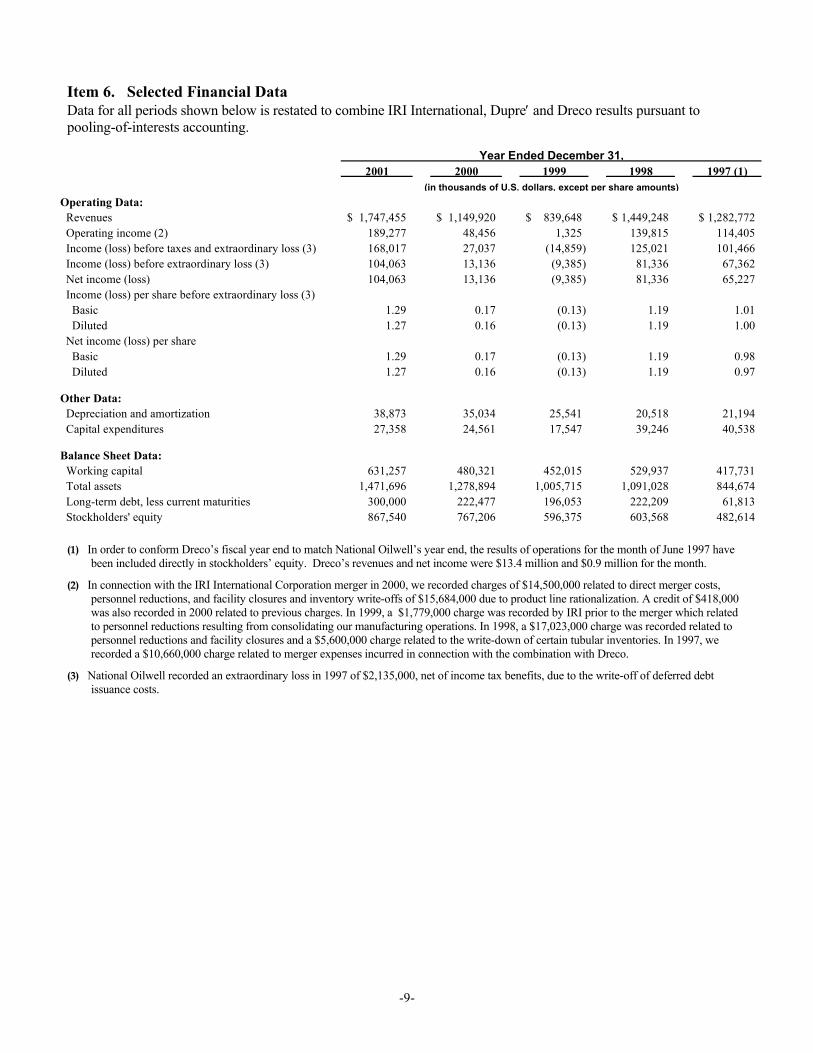
Item 6. Selected Financial Data Data for all periods shown below is restated to combine IRI International, Dupre′ and Dreco results pursuant to pooling-of-interests accounting.
2001 2000 1999 1998 1997 (1)
Operating Data: Revenues 1,747,455$ 1,149,920$ 839,648$ 1,449,248$ 1,282,772$ Operating income (2) 189,277 48,456 1,325 139,815 114,405 Income (loss) before taxes and extraordinary loss (3) 168,017 27,037 (14,859) 125,021 101,466 Income (loss) before extraordinary loss (3) 104,063 13,136 (9,385) 81,336 67,362 Net income (loss) 104,063 13,136 (9,385) 81,336 65,227 Income (loss) per share before extraordinary loss (3) Basic 1.29 0.17 (0.13) 1.19 1.01 Diluted 1.27 0.16 (0.13) 1.19 1.00 Net income (loss) per share Basic 1.29 0.17 (0.13) 1.19 0.98 Diluted 1.27 0.16 (0.13) 1.19 0.97
Other Data: Depreciation and amortization 38,873 35,034 25,541 20,518 21,194 Capital expenditures 27,358 24,561 17,547 39,246 40,538
Balance Sheet Data: Working capital 631,257 480,321 452,015 529,937 417,731 Total assets 1,471,696 1,278,894 1,005,715 1,091,028 844,674 Long-term debt, less current maturities 300,000 222,477 196,053 222,209 61,813 Stockholders' equity 867,540 767,206 596,375 603,568 482,614
Year Ended December 31,
(in thousands of U.S. dollars, except per share amounts)
(1) In order to conform Dreco’s fiscal year end to match National Oilwell’s year end, the results of operations for the month of June 1997 have
been included directly in stockholders’ equity. Dreco’s revenues and net income were $13.4 million and $0.9 million for the month.
(2) In connection with the IRI International Corporation merger in 2000, we recorded charges of $14,500,000 related to direct merger costs, personnel reductions, and facility closures and inventory write-offs of $15,684,000 due to product line rationalization. A credit of $418,000 was also recorded in 2000 related to previous charges. In 1999, a $1,779,000 charge was recorded by IRI prior to the merger which related to personnel reductions resulting from consolidating our manufacturing operations. In 1998, a $17,023,000 charge was recorded related to personnel reductions and facility closures and a $5,600,000 charge related to the write-down of certain tubular inventories. In 1997, we recorded a $10,660,000 charge related to merger expenses incurred in connection with the combination with Dreco.
(3) National Oilwell recorded an extraordinary loss in 1997 of $2,135,000, net of income tax benefits, due to the write-off of deferred debt issuance costs.
-9-
Item 7. Management’s Discussion and Analysis of Financial Condition and Results of Operations
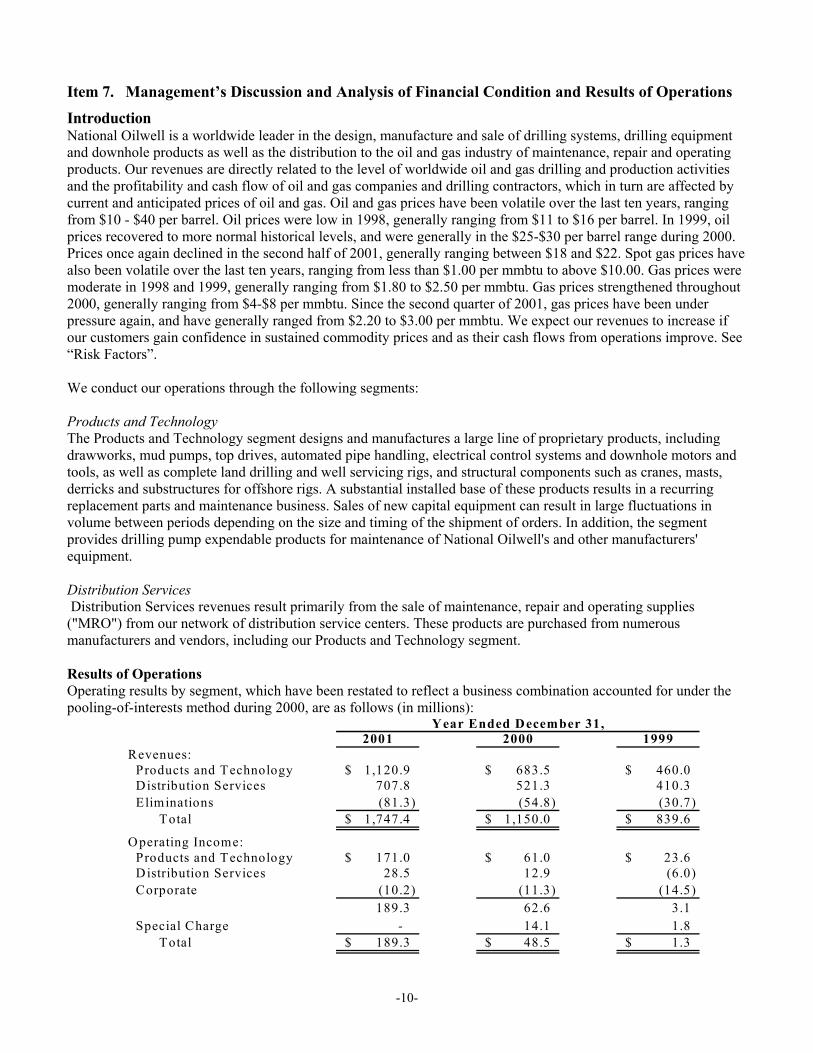
Introduction National Oilwell is a worldwide leader in the design, manufacture and sale of drilling systems, drilling equipment and downhole products as well as the distribution to the oil and gas industry of maintenance, repair and operating products. Our revenues are directly related to the level of worldwide oil and gas drilling and production activities and the profitability and cash flow of oil and gas companies and drilling contractors, which in turn are affected by current and anticipated prices of oil and gas. Oil and gas prices have been volatile over the last ten years, ranging from $10 - $40 per barrel. Oil prices were low in 1998, generally ranging from $11 to $16 per barrel. In 1999, oil prices recovered to more normal historical levels, and were generally in the $25-$30 per barrel range during 2000. Prices once again declined in the second half of 2001, generally ranging between $18 and $22. Spot gas prices have also been volatile over the last ten years, ranging from less than $1.00 per mmbtu to above $10.00. Gas prices were moderate in 1998 and 1999, generally ranging from $1.80 to $2.50 per mmbtu. Gas prices strengthened throughout 2000, generally ranging from $4-$8 per mmbtu. Since the second quarter of 2001, gas prices have been under pressure again, and have generally ranged from $2.20 to $3.00 per mmbtu. We expect our revenues to increase if our customers gain confidence in sustained commodity prices and as their cash flows from operations improve. See “Risk Factors”. We conduct our operations through the following segments: Products and Technology The Products and Technology segment designs and manufactures a large line of proprietary products, including drawworks, mud pumps, top drives, automated pipe handling, electrical control systems and downhole motors and tools, as well as complete land drilling and well servicing rigs, and structural components such as cranes, masts, derricks and substructures for offshore rigs. A substantial installed base of these products results in a recurring replacement parts and maintenance business. Sales of new capital equipment can result in large fluctuations in volume between periods depending on the size and timing of the shipment of orders. In addition, the segment provides drilling pump expendable products for maintenance of National Oilwell's and other manufacturers' equipment. Distribution Services Distribution Services revenues result primarily from the sale of maintenance, repair and operating supplies ("MRO") from our network of distribution service centers. These products are purchased from numerous manufacturers and vendors, including our Products and Technology segment. Results of Operations Operating results by segment, which have been restated to reflect a business combination accounted for under the pooling-of-interests method during 2000, are as follows (in millions):
Year Ended December 31,2001 2000 1999
Revenues: Products and Technology 1,120.9$ 683.5$ 460.0$ Distribution Services 707.8 521.3 410.3 Eliminations (81.3) (54.8) (30.7) Total 1,747.4$ 1,150.0$ 839.6$
Operating Income: Products and Technology 171.0$ 61.0$ 23.6$ Distribution Services 28.5 12.9 (6.0) Corporate (10.2) (11.3) (14.5)
189.3 62.6 3.1 Special Charge - 14.1 1.8 Total 189.3$ 48.5$ 1.3$
-10-
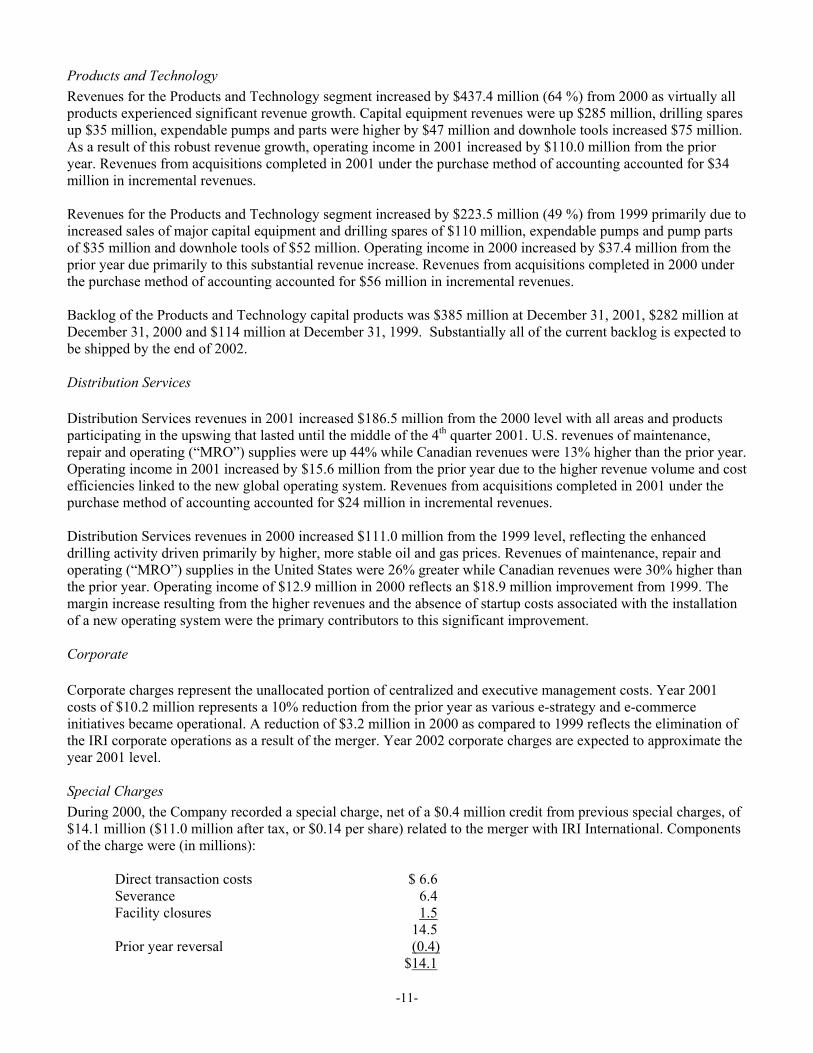
Products and Technology Revenues for the Products and Technology segment increased by $437.4 million (64 %) from 2000 as virtually all products experienced significant revenue growth. Capital equipment revenues were up $285 million, drilling spares up $35 million, expendable pumps and parts were higher by $47 million and downhole tools increased $75 million. As a result of this robust revenue growth, operating income in 2001 increased by $110.0 million from the prior year. Revenues from acquisitions completed in 2001 under the purchase method of accounting accounted for $34 million in incremental revenues. Revenues for the Products and Technology segment increased by $223.5 million (49 %) from 1999 primarily due to increased sales of major capital equipment and drilling spares of $110 million, expendable pumps and pump parts of $35 million and downhole tools of $52 million. Operating income in 2000 increased by $37.4 million from the prior year due primarily to this substantial revenue increase. Revenues from acquisitions completed in 2000 under the purchase method of accounting accounted for $56 million in incremental revenues. Backlog of the Products and Technology capital products was $385 million at December 31, 2001, $282 million at December 31, 2000 and $114 million at December 31, 1999. Substantially all of the current backlog is expected to be shipped by the end of 2002. Distribution Services Distribution Services revenues in 2001 increased $186.5 million from the 2000 level with all areas and products participating in the upswing that lasted until the middle of the 4th quarter 2001. U.S. revenues of maintenance, repair and operating (“MRO”) supplies were up 44% while Canadian revenues were 13% higher than the prior year. Operating income in 2001 increased by $15.6 million from the prior year due to the higher revenue volume and cost efficiencies linked to the new global operating system. Revenues from acquisitions completed in 2001 under the purchase method of accounting accounted for $24 million in incremental revenues. Distribution Services revenues in 2000 increased $111.0 million from the 1999 level, reflecting the enhanced drilling activity driven primarily by higher, more stable oil and gas prices. Revenues of maintenance, repair and operating (“MRO”) supplies in the United States were 26% greater while Canadian revenues were 30% higher than the prior year. Operating income of $12.9 million in 2000 reflects an $18.9 million improvement from 1999. The margin increase resulting from the higher revenues and the absence of startup costs associated with the installation of a new operating system were the primary contributors to this significant improvement. Corporate Corporate charges represent the unallocated portion of centralized and executive management costs. Year 2001 costs of $10.2 million represents a 10% reduction from the prior year as various e-strategy and e-commerce initiatives became operational. A reduction of $3.2 million in 2000 as compared to 1999 reflects the elimination of the IRI corporate operations as a result of the merger. Year 2002 corporate charges are expected to approximate the year 2001 level. Special Charges During 2000, the Company recorded a special charge, net of a $0.4 million credit from previous special charges, of $14.1 million ($11.0 million after tax, or $0.14 per share) related to the merger with IRI International. Components of the charge were (in millions): Direct transaction costs $ 6.6 Severance 6.4 Facility closures 1.5 14.5 Prior year reversal (0.4) $14.1
-11-
The cash and non-cash elements of the charge approximate $13 million and $1.1 million, respectively. Approximately $11 million of the direct cash outlays were spent by the end of 2000, and essentially all of the remainder had been spent at December 31, 2001. Facility closure costs consist of lease cancellation costs and impairment of a closed manufacturing facility that is classified with “Property held for sale” on our balance sheet. All of this charge is applicable to the Products and Technology business segment. During 1999 and prior to the merger with National Oilwell, a $1.8 million charge was recorded by IRI related to additional severance costs resulting from consolidating our manufacturing operations. Interest Expense Despite continual borrowing rate declines during 2001, interest expense increased approximately $5.5 million over 2000 due to our higher debt level to support the working capital associated with the robust business climate. In March 2001, we sold $150 million of 6 ½% unsecured senior notes which increased our total senior debt to $300 million. Year 2001 average monthly debt, including the senior notes, was $334 million or $118 million (54%) greater than the 2000 level. Interest expense was greater in 2000 than the prior year due to an average borrowing rate increase of 0.25 basis points and a higher debt level throughout the year. Income Taxes
National Oilwell is subject to U.S. federal, state and foreign taxes and recorded a combined tax rate of 38% in 2001, 51% in 2000 and 37% in 1999. The 2000 effective tax rate was impacted by certain transaction costs associated with the IRI merger and the inclusion of pre-merger IRI capital losses due to pooling-of-interests accounting that may not be deductible. Excluding the impact of merger-related costs and capital losses, our combined effective tax rate for 2000 was 36% compared to 43% in 1999.
We have net operating loss carryforwards in the United States, which expire at various dates through 2009, that could reduce future tax expense by up to $4.5 million. Additional loss carryforwards in Europe generally would reduce goodwill if realized in the future. Due to the uncertainty of future utilization, most of the potential benefits described above have been fully reserved. We realized a tax benefit of $0.9 million during 2001, 2000 and 1999 from its U.S. carryforwards. Liquidity and Capital Resources At December 31, 2001, National Oilwell had working capital of $631.3 million, an increase of $150.9 million from December 31, 2000. During 2001, accounts receivable and inventory increased by $87 million and $80 million, respectively. Current portion of long-term debt increased approximately $10 million due to the classification of our revolving credit agreement as a current liability due to its expiration in September 2002. We have entered negotiations to secure a revolving credit facility of a similar size prior to the expiration of the current facility. Total capital expenditures were $27.4 million during 2001, $24.6 million in 2000 and $17.5 million in 1999. Additions and enhancements to the downhole rental tool fleet and information management and inventory control systems represent the majority of these capital expenditures. Capital expenditures are expected to approximate $30 million in 2002. We believe we have sufficient existing manufacturing capacity to meet currently anticipated demand through 2002 for our products and services. In September 1997, we entered into a five-year unsecured $125 million revolving credit facility. The credit facility is available for acquisitions and general corporate purposes. The credit facility provides for interest at prime or LIBOR plus 0.5 %, subject to downward adjustment based on our Capitalization Ratio, as defined. It also contains financial covenants and ratios regarding minimum tangible net worth, maximum debt to capital and minimum interest coverage. We have not violated any financial covenants during the term of this credit facility.
-12-
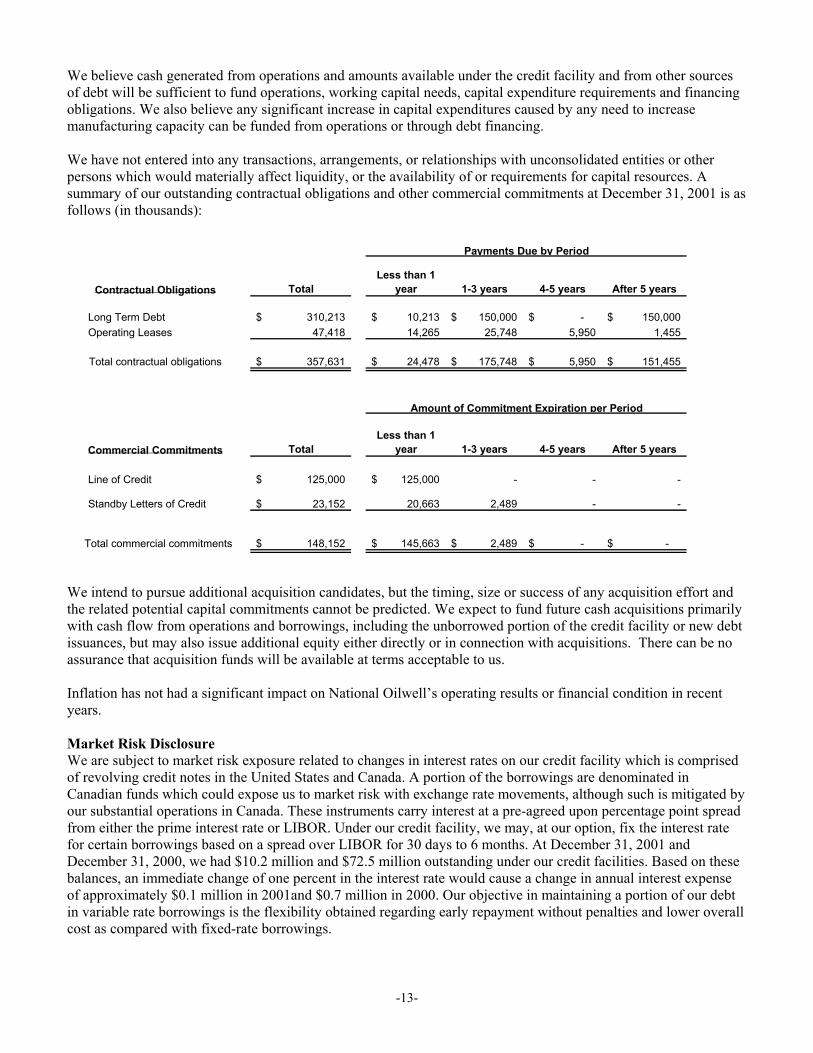
We believe cash generated from operations and amounts available under the credit facility and from other sources of debt will be sufficient to fund operations, working capital needs, capital expenditure requirements and financing obligations. We also believe any significant increase in capital expenditures caused by any need to increase manufacturing capacity can be funded from operations or through debt financing. We have not entered into any transactions, arrangements, or relationships with unconsolidated entities or other persons which would materially affect liquidity, or the availability of or requirements for capital resources. A summary of our outstanding contractual obligations and other commercial commitments at December 31, 2001 is as follows (in thousands):
Contractual Obligations TotalLess than 1
year 1-3 years 4-5 years After 5 years
Long Term Debt 310,213$ 10,213$ 150,000$ -$ 150,000$ Operating Leases 47,418 14,265 25,748 5,950 1,455
Total contractual obligations 357,631$ 24,478$ 175,748$ 5,950$ 151,455$
Commercial Commitments TotalLess than 1
year 1-3 years 4-5 years After 5 years
Line of Credit 125,000$ 125,000$ - - -
Standby Letters of Credit 23,152$ 20,663 2,489 - -
Total commercial commitments 148,152$ 145,663$ 2,489$ -$ -$
Amount of Commitment Expiration per Period
Payments Due by Period
We intend to pursue additional acquisition candidates, but the timing, size or success of any acquisition effort and the related potential capital commitments cannot be predicted. We expect to fund future cash acquisitions primarily with cash flow from operations and borrowings, including the unborrowed portion of the credit facility or new debt issuances, but may also issue additional equity either directly or in connection with acquisitions. There can be no assurance that acquisition funds will be available at terms acceptable to us. Inflation has not had a significant impact on National Oilwell’s operating results or financial condition in recent years. Market Risk Disclosure We are subject to market risk exposure related to changes in interest rates on our credit facility which is comprised of revolving credit notes in the United States and Canada. A portion of the borrowings are denominated in Canadian funds which could expose us to market risk with exchange rate movements, although such is mitigated by our substantial operations in Canada. These instruments carry interest at a pre-agreed upon percentage point spread from either the prime interest rate or LIBOR. Under our credit facility, we may, at our option, fix the interest rate for certain borrowings based on a spread over LIBOR for 30 days to 6 months. At December 31, 2001 and December 31, 2000, we had $10.2 million and $72.5 million outstanding under our credit facilities. Based on these balances, an immediate change of one percent in the interest rate would cause a change in annual interest expense of approximately $0.1 million in 2001and $0.7 million in 2000. Our objective in maintaining a portion of our debt in variable rate borrowings is the flexibility obtained regarding early repayment without penalties and lower overall cost as compared with fixed-rate borrowings.
-13-
Critical Accounting Policies and Estimates The preparation of our financial statements requires us to make certain estimates and assumptions that affect the amounts reported in the financial statements and accompanying notes. Our estimation process generally relates to potential bad debts, obsolete and slow moving inventory, value of intangible assets, and deferred income tax accounting. Note 3 to the consolidated financial statements contains the accounting policies governing each of these matters. Our estimates are based on historical experience and on our future expectations that we believe to be reasonable under the circumstances. The combination of these factors result in the amounts shown as carrying values of assets and liabilities in the financial statements and accompanying notes. Actual results could differ from our current estimates and those differences may be material. We believe the following accounting policies are the most critical in the preparation of our consolidated financial statements: We maintain an allowance for doubtful accounts for accounts receivables by providing for specifically identified accounts where collectibility is doubtful and a general allowance based on the aging of the receivables compared to past experience and current trends. A majority of our revenues come from drilling contractors, independent oil companies, international oil companies and government-owned or government-controlled oil companies, and we have receivables, some denominated in local currency, in many foreign countries. If, due to changes in worldwide oil and gas drilling activity or changes in economic conditions in certain foreign countries, our customers were unable to repay these receivables, additional allowances would be required. Reserves for inventory obsolescence are determined based on our historical usage of inventory on-hand as well as our future expectations related to our substantial installed base and the development of new products. The amount reserved is the recorded cost of the inventory minus its estimated realizable value. Changes in worldwide oil and gas drilling activity and the development of new technologies associated with the drilling industry could require additional allowances to reduce the value of inventory to the lower of its cost or net realizable value. Business acquisitions are accounted for using the purchase method of accounting. The cost of the acquired company is allocated to identifiable tangible and intangible assets based on estimated fair value, with the excess allocated to goodwill. The determination of impairment on long-lived assets, including goodwill, is conducted as indicators of impairment are present. If such indicators were present, the determination of the amount of impairment would be based on our judgments as to the future operating cash flows to be generated from these assets throughout their estimated useful lives. Our industry is highly cyclical and our estimates of the period over which future cash flows will be generated, as well as the predictability of these cash flows, can have a significant impact on the carrying value of these assets. In periods of prolonged down cycles, impairment charges may result. Our net deferred tax assets and liabilities are recorded at the amount that is more likely than not to be realized or paid. Should we determine that we would not be able to realize all or part of the net deferred tax asset in the future, an adjustment to the deferred tax assets would be charged to income in the period of such determination. Subsequent Event On January 10, 2002, we completed the acquisition of the assets and business of HAL Oilfield Pump & Equipment Company for approximately $16 million. This business, which designs, manufactures and distributes centrifugal pumps, pump packages and expendable parts, is complementary to our Mission pump product line. The acquisition was accounted for as a purchase with goodwill approximating $10 million.
-14-
Recently Issued Accounting Standards In June 2001, the Financial Accounting Standards Board (“FASB”) issued Statement No. 142, Goodwill and Other Intangible Assets, effective for fiscal years beginning after December 15, 2001. Under the new rules, goodwill and intangible assets deemed to have indefinite lives will no longer be amortized but will be subject to annual impairment tests in accordance with the statement. Other intangible assets will continue to be amortized over their useful lives. In addition, accounting for acquisitions under the pooling-of-interests method is no longer permitted. We will adopt the new rules on accounting for goodwill and other intangible assets beginning in the first quarter of 2002. Application of the non-amortization provisions of the statement for 2001 would have resulted in an increase in net income of $11 million ($0.13 per diluted share). Pursuant to SFAS 142, we will test goodwill for impairment upon adoption and, if impairment is indicated, record such impairment as a cumulative effect of an accounting change. We are currently evaluating the effect that the adoption may have on our consolidated results of operations and financial position. In August 2001, the FASB issued SFAS No. 144, Accounting for the Impairment or Disposal of Long-Lived Assets. This statement supercedes SFAS No. 121, Accounting for the Impairment of Long-Lived Assets and for Long-Lived Assets to be Disposed Of , and the accounting and reporting provisions of Accounting Principles Board Opinion (“APB”) No. 30, Reporting the Results of Extraordinary, Unusual, and Infrequently Occurring Events and Transactions. This statement retains the fundamental provisions of SFAS No. 121 and the basic requirements of APB No. 30; however, it establishes a single accounting model to be used for long-lived assets to be disposed of by sale and it expands the presentation of discontinued operations to include more disposal transactions. The provisions of this statement are effective for financial statements issued for fiscal years beginning after December 15, 2001. We do not anticipate that the statement will have a material impact on our financial position or results of operations. Forward–Looking Statements Some of the information in this document contains, or has incorporated by reference, forward-looking statements. Statements that are not historical facts, including statements about our beliefs and expectations, are forward-looking statements. Forward-looking statements typically are identified by use of terms such as "may," "will," "expect," "anticipate," "estimate," and similar words, although some forward-looking statements are expressed differently. You should be aware that our actual results could differ materially from results anticipated in the forward-looking statements due to a number of factors, including changes in oil and gas prices, customer demand for our products and worldwide economic activity. You should also consider carefully the statements under "Risk Factors" which address additional factors that could cause our actual results to differ from those set forth in the forward-looking statements. Given these uncertainties, current or prospective investors are cautioned not to place undue reliance on any such forward-looking statements. We disclaim any obligation or intent to update any such factors or forward-looking statement to reflect future events or developments. Item 7A. Quantitative and Qualitative Disclosures About Market Risk
Incorporated by reference to Item 7 above, “Market Risk Disclosure.” Item 8. Financial Statement and Supplementary Data
Attached hereto and a part of this report are financial statements and supplementary data listed in Item 14.
Item 9. Changes in and Disagreements with Accountants on Accounting and Financial Disclosure None.
-15-
Part III
Item 10. Directors and Executive Officers of the Registrant Incorporated by reference to the definitive Proxy Statement for the 2002 Annual Meeting of Stockholders. Item 11. Executive Compensation Incorporated by reference to the definitive Proxy Statement for the 2002 Annual Meeting of Stockholders. Item 12. Security Ownership of Certain Beneficial Owners and Management Incorporated by reference to the definitive Proxy Statement for the 2002 Annual Meeting of Stockholders. Item 13. Certain Relationships and Related Transactions Incorporated by reference to the definitive Proxy Statement for the 2002 Annual Meeting of Stockholders. .
-16-
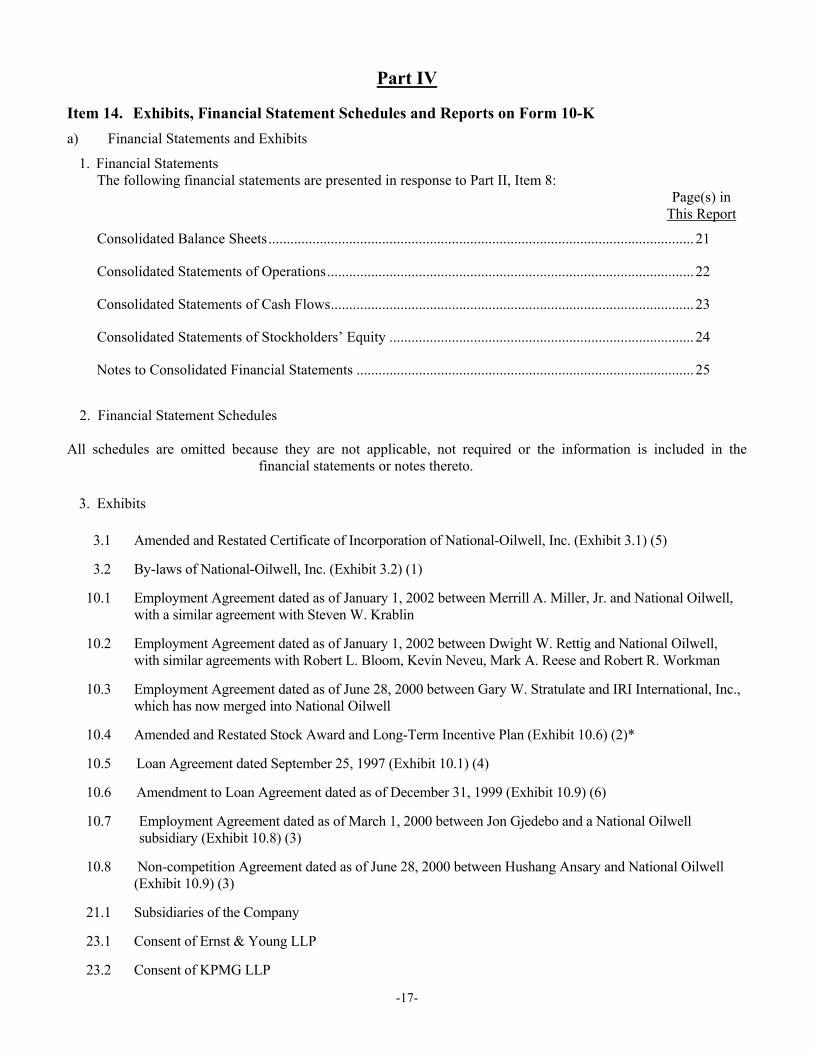
Part IV Item 14. Exhibits, Financial Statement Schedules and Reports on Form 10-K a) Financial Statements and Exhibits
1. Financial Statements The following financial statements are presented in response to Part II, Item 8: Page(s) in This Report
Consolidated Balance Sheets.................................................................................................................... 21
Consolidated Statements of Operations.................................................................................................... 22
Consolidated Statements of Cash Flows................................................................................................... 23
Consolidated Statements of Stockholders’ Equity ................................................................................... 24
Notes to Consolidated Financial Statements ............................................................................................ 25
2. Financial Statement Schedules
All schedules are omitted because they are not applicable, not required or the information is included in the
financial statements or notes thereto.
3. Exhibits
3.1 Amended and Restated Certificate of Incorporation of National-Oilwell, Inc. (Exhibit 3.1) (5)
3.2 By-laws of National-Oilwell, Inc. (Exhibit 3.2) (1)
10.1 Employment Agreement dated as of January 1, 2002 between Merrill A. Miller, Jr. and National Oilwell, with a similar agreement with Steven W. Krablin
10.2 Employment Agreement dated as of January 1, 2002 between Dwight W. Rettig and National Oilwell, with similar agreements with Robert L. Bloom, Kevin Neveu, Mark A. Reese and Robert R. Workman
10.3 Employment Agreement dated as of June 28, 2000 between Gary W. Stratulate and IRI International, Inc., which has now merged into National Oilwell
10.4 Amended and Restated Stock Award and Long-Term Incentive Plan (Exhibit 10.6) (2)*
10.5 Loan Agreement dated September 25, 1997 (Exhibit 10.1) (4)
10.6 Amendment to Loan Agreement dated as of December 31, 1999 (Exhibit 10.9) (6)
10.7 Employment Agreement dated as of March 1, 2000 between Jon Gjedebo and a National Oilwell subsidiary (Exhibit 10.8) (3)
10.8 Non-competition Agreement dated as of June 28, 2000 between Hushang Ansary and National Oilwell (Exhibit 10.9) (3)
21.1 Subsidiaries of the Company
23.1 Consent of Ernst & Young LLP
23.2 Consent of KPMG LLP
-17-
24.1 Power of Attorney (included on signature page hereto)
b) Reports on Form 8-K No reports on Form 8-K were filed during the quarter ended December 31, 2001.
* Compensatory plan or arrangement for management or others
(1) Filed as an Exhibit to Registration Statement No. 333-11051 on Form S-1, as amended, initially filed on August 29, 1996.
(2) Filed with the Proxy Statement for the 1999 Annual Meeting of Stockholders, filed on May 12, 1999.
(3) Filed as an Exhibit to our Annual Report on Form 10-K filed on March 1, 2001.
(4) Filed as an Exhibit to our Quarterly Report on Form 10-Q filed on November 7, 1997.
(5) Filed as an Exhibit to our Quarterly Report on Form 10-Q filed on August 11, 2000.
(6) Filed as an Exhibit to our Quarterly Report on Form 10-Q filed on March 16, 2000.
-18-
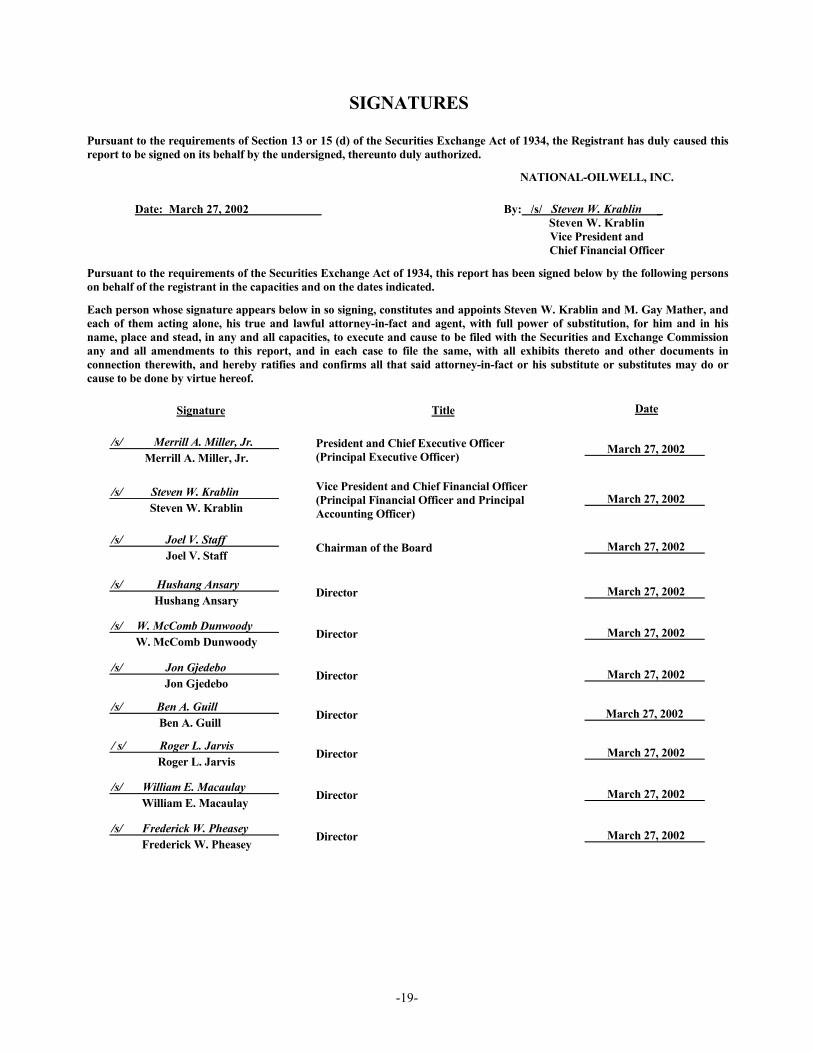
SIGNATURES
Pursuant to the requirements of Section 13 or 15 (d) of the Securities Exchange Act of 1934, the Registrant has duly caused thisreport to be signed on its behalf by the undersigned, thereunto duly authorized.
NATIONAL-OILWELL, INC.
Date: March 27, 2002 By: /s/ Steven W. Krablin Steven W. KrablinVice President and
Chief Financial Officer
Pursuant to the requirements of the Securities Exchange Act of 1934, this report has been signed below by the following personson behalf of the registrant in the capacities and on the dates indicated.
Each person whose signature appears below in so signing, constitutes and appoints Steven W. Krablin and M. Gay Mather, andeach of them acting alone, his true and lawful attorney-in-fact and agent, with full power of substitution, for him and in hisname, place and stead, in any and all capacities, to execute and cause to be filed with the Securities and Exchange Commissionany and all amendments to this report, and in each case to file the same, with all exhibits thereto and other documents inconnection therewith, and hereby ratifies and confirms all that said attorney-in-fact or his substitute or substitutes may do orcause to be done by virtue hereof.
Signature Title Date
/s/ Merrill A. Miller, Jr.Merrill A. Miller, Jr.
President and Chief Executive Officer(Principal Executive Officer)
March 27, 2002
/s/ Steven W. KrablinSteven W. Krablin
Vice President and Chief Financial Officer(Principal Financial Officer and PrincipalAccounting Officer)
March 27, 2002
/s/ Joel V. StaffJoel V. Staff
Chairman of the Board March 27, 2002
/s/ Hushang AnsaryHushang Ansary
Director March 27, 2002
/s/ W. McComb DunwoodyW. McComb Dunwoody
Director March 27, 2002
/s/ Jon GjedeboJon Gjedebo
Director March 27, 2002
/s/ Ben A. Guill Ben A. Guill
Director March 27, 2002
/ s/ Roger L. JarvisRoger L. Jarvis
Director March 27, 2002
/s/ William E. Macaulay William E. Macaulay
Director March 27, 2002
/s/ Frederick W. Pheasey Frederick W. Pheasey
Director March 27, 2002
-19-
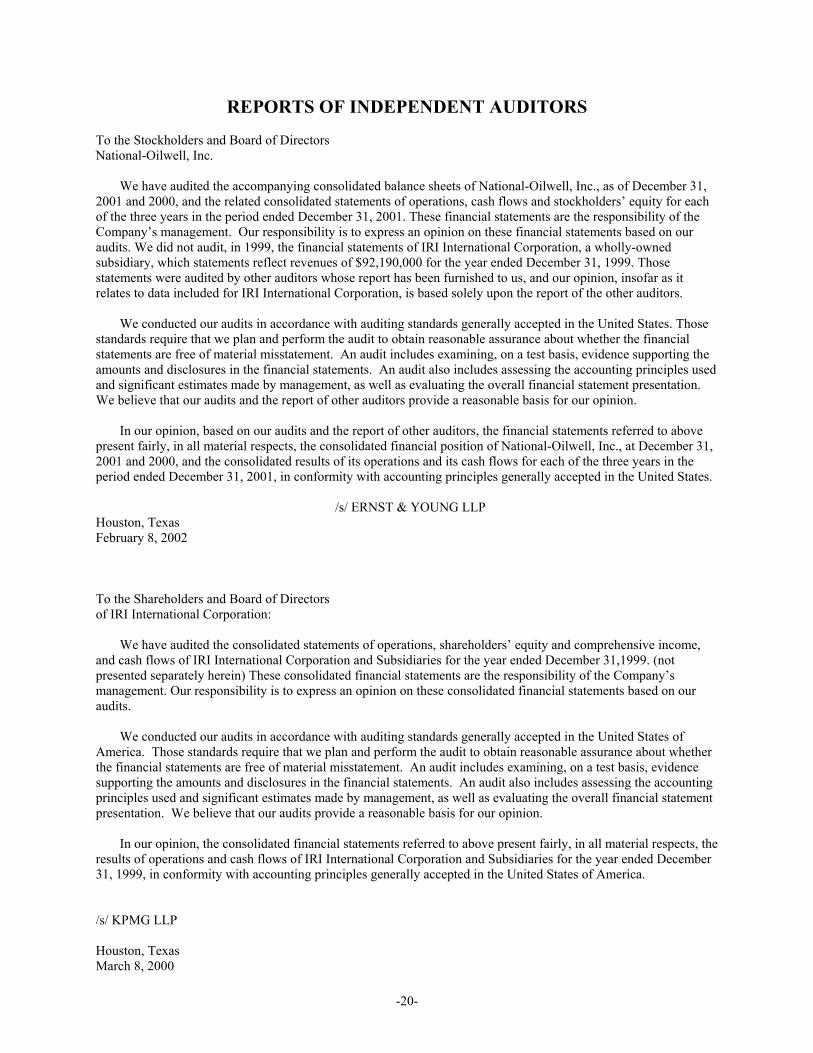
REPORTS OF INDEPENDENT AUDITORS To the Stockholders and Board of Directors National-Oilwell, Inc.
We have audited the accompanying consolidated balance sheets of National-Oilwell, Inc., as of December 31, 2001 and 2000, and the related consolidated statements of operations, cash flows and stockholders’ equity for each of the three years in the period ended December 31, 2001. These financial statements are the responsibility of the Company’s management. Our responsibility is to express an opinion on these financial statements based on our audits. We did not audit, in 1999, the financial statements of IRI International Corporation, a wholly-owned subsidiary, which statements reflect revenues of $92,190,000 for the year ended December 31, 1999. Those statements were audited by other auditors whose report has been furnished to us, and our opinion, insofar as it relates to data included for IRI International Corporation, is based solely upon the report of the other auditors.
We conducted our audits in accordance with auditing standards generally accepted in the United States. Those
standards require that we plan and perform the audit to obtain reasonable assurance about whether the financial statements are free of material misstatement. An audit includes examining, on a test basis, evidence supporting the amounts and disclosures in the financial statements. An audit also includes assessing the accounting principles used and significant estimates made by management, as well as evaluating the overall financial statement presentation. We believe that our audits and the report of other auditors provide a reasonable basis for our opinion.
In our opinion, based on our audits and the report of other auditors, the financial statements referred to above
present fairly, in all material respects, the consolidated financial position of National-Oilwell, Inc., at December 31, 2001 and 2000, and the consolidated results of its operations and its cash flows for each of the three years in the period ended December 31, 2001, in conformity with accounting principles generally accepted in the United States.
/s/ ERNST & YOUNG LLP
Houston, Texas February 8, 2002
To the Shareholders and Board of Directors of IRI International Corporation:
We have audited the consolidated statements of operations, shareholders’ equity and comprehensive income, and cash flows of IRI International Corporation and Subsidiaries for the year ended December 31,1999. (not presented separately herein) These consolidated financial statements are the responsibility of the Company’s management. Our responsibility is to express an opinion on these consolidated financial statements based on our audits.
We conducted our audits in accordance with auditing standards generally accepted in the United States of
America. Those standards require that we plan and perform the audit to obtain reasonable assurance about whether the financial statements are free of material misstatement. An audit includes examining, on a test basis, evidence supporting the amounts and disclosures in the financial statements. An audit also includes assessing the accounting principles used and significant estimates made by management, as well as evaluating the overall financial statement presentation. We believe that our audits provide a reasonable basis for our opinion.
In our opinion, the consolidated financial statements referred to above present fairly, in all material respects, the
results of operations and cash flows of IRI International Corporation and Subsidiaries for the year ended December 31, 1999, in conformity with accounting principles generally accepted in the United States of America.
/s/ KPMG LLP Houston, Texas March 8, 2000
-20-
-21-
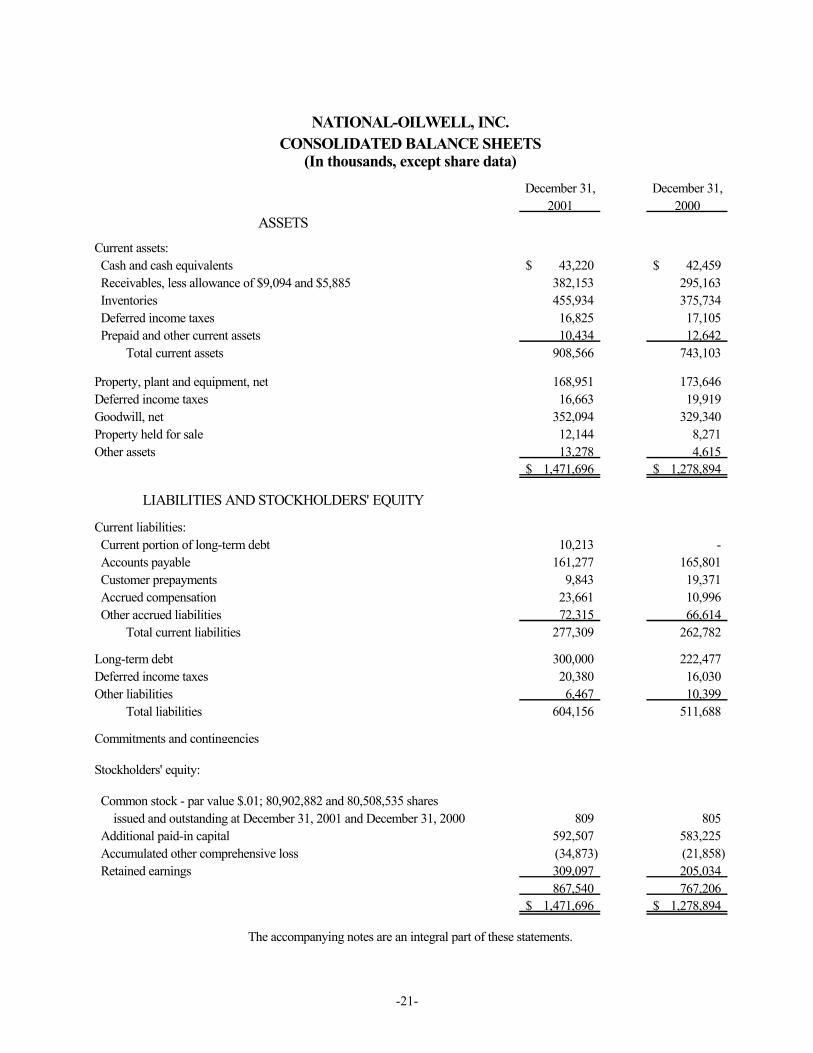
NATIONAL-OILWELL, INC.CONSOLIDATED BALANCE SHEETS
(In thousands, except share data)December 31, December 31,
2001 2000ASSETS
Current assets: Cash and cash equivalents 43,220$ 42,459$ Receivables, less allowance of $9,094 and $5,885 382,153 295,163 Inventories 455,934 375,734 Deferred income taxes 16,825 17,105 Prepaid and other current assets 10,434 12,642 Total current assets 908,566 743,103
Property, plant and equipment, net 168,951 173,646 Deferred income taxes 16,663 19,919 Goodwill, net 352,094 329,340 Property held for sale 12,144 8,271 Other assets 13,278 4,615
1,471,696$ 1,278,894$
LIABILITIES AND STOCKHOLDERS' EQUITY
Current liabilities: Current portion of long-term debt 10,213 - Accounts payable 161,277 165,801 Customer prepayments 9,843 19,371 Accrued compensation 23,661 10,996 Other accrued liabilities 72,315 66,614 Total current liabilities 277,309 262,782
Long-term debt 300,000 222,477 Deferred income taxes 20,380 16,030 Other liabilities 6,467 10,399 Total liabilities 604,156 511,688
Commitments and contingencies
Stockholders' equity:
Common stock - par value $.01; 80,902,882 and 80,508,535 shares issued and outstanding at December 31, 2001 and December 31, 2000 809 805 Additional paid-in capital 592,507 583,225 Accumulated other comprehensive loss (34,873) (21,858) Retained earnings 309,097 205,034
867,540 767,206 1,471,696$ 1,278,894$
The accompanying notes are an integral part of these statements.
-22-
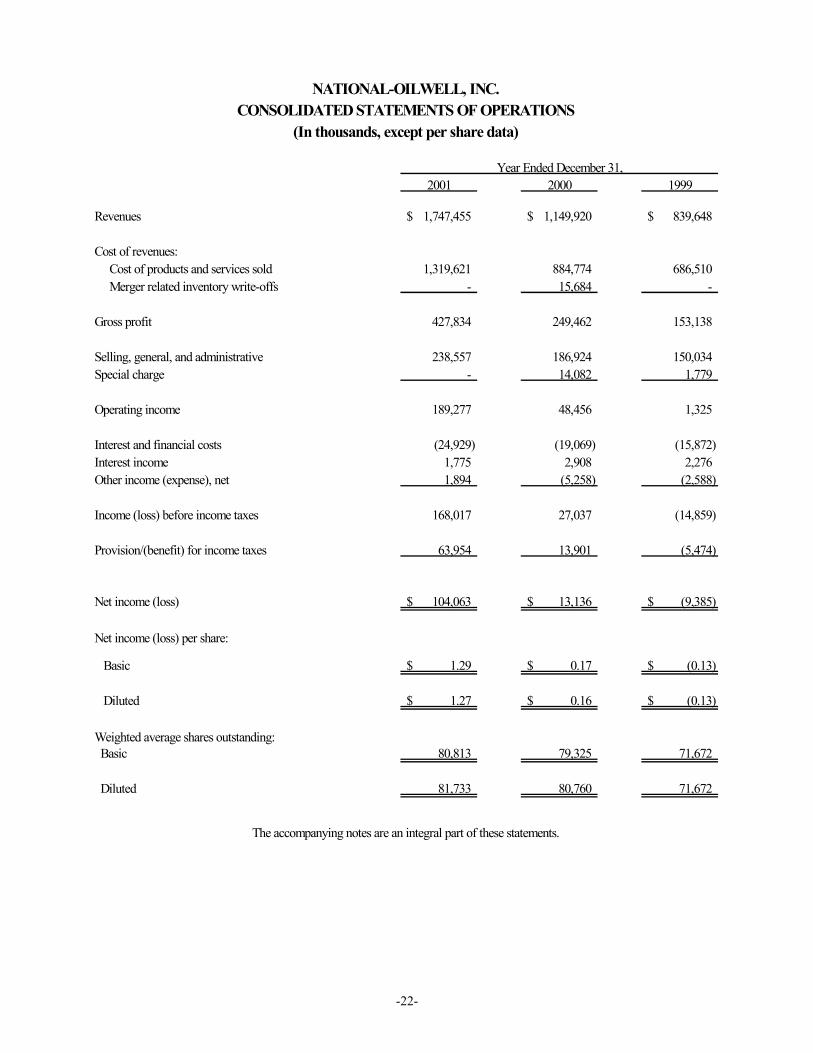
NATIONAL-OILWELL, INC.CONSOLIDATED STATEMENTS OF OPERATIONS
(In thousands, except per share data)
Year Ended December 31, 2001 2000 1999
Revenues 1,747,455$ 1,149,920$ 839,648$
Cost of revenues: Cost of products and services sold 1,319,621 884,774 686,510 Merger related inventory write-offs - 15,684 -
Gross profit 427,834 249,462 153,138
Selling, general, and administrative 238,557 186,924 150,034 Special charge - 14,082 1,779
Operating income 189,277 48,456 1,325
Interest and financial costs (24,929) (19,069) (15,872) Interest income 1,775 2,908 2,276 Other income (expense), net 1,894 (5,258) (2,588)
Income (loss) before income taxes 168,017 27,037 (14,859)
Provision/(benefit) for income taxes 63,954 13,901 (5,474)
Net income (loss) 104,063$ 13,136$ (9,385)$
Net income (loss) per share: Basic 1.29$ 0.17$ (0.13)$
Diluted 1.27$ 0.16$ (0.13)$
Weighted average shares outstanding: Basic 80,813 79,325 71,672
Diluted 81,733 80,760 71,672
The accompanying notes are an integral part of these statements.
-23-
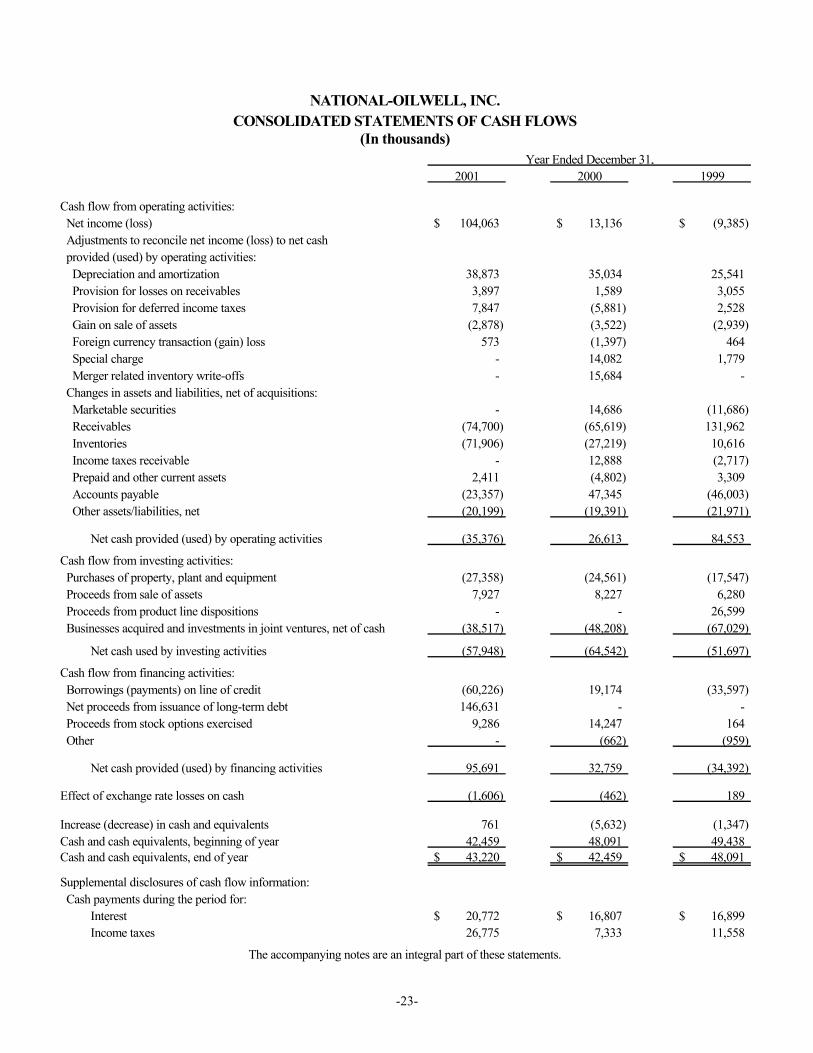
NATIONAL-OILWELL, INC.CONSOLIDATED STATEMENTS OF CASH FLOWS
(In thousands)Year Ended December 31,
2001 2000 1999
Cash flow from operating activities: Net income (loss) 104,063$ 13,136$ (9,385)$ Adjustments to reconcile net income (loss) to net cash provided (used) by operating activities: Depreciation and amortization 38,873 35,034 25,541 Provision for losses on receivables 3,897 1,589 3,055 Provision for deferred income taxes 7,847 (5,881) 2,528 Gain on sale of assets (2,878) (3,522) (2,939) Foreign currency transaction (gain) loss 573 (1,397) 464 Special charge - 14,082 1,779 Merger related inventory write-offs - 15,684 - Changes in assets and liabilities, net of acquisitions: Marketable securities - 14,686 (11,686) Receivables (74,700) (65,619) 131,962 Inventories (71,906) (27,219) 10,616 Income taxes receivable - 12,888 (2,717) Prepaid and other current assets 2,411 (4,802) 3,309 Accounts payable (23,357) 47,345 (46,003) Other assets/liabilities, net (20,199) (19,391) (21,971)
Net cash provided (used) by operating activities (35,376) 26,613 84,553
Cash flow from investing activities: Purchases of property, plant and equipment (27,358) (24,561) (17,547) Proceeds from sale of assets 7,927 8,227 6,280 Proceeds from product line dispositions - - 26,599 Businesses acquired and investments in joint ventures, net of cash (38,517) (48,208) (67,029)
Net cash used by investing activities (57,948) (64,542) (51,697)
Cash flow from financing activities: Borrowings (payments) on line of credit (60,226) 19,174 (33,597) Net proceeds from issuance of long-term debt 146,631 - - Proceeds from stock options exercised 9,286 14,247 164 Other - (662) (959)
Net cash provided (used) by financing activities 95,691 32,759 (34,392)
Effect of exchange rate losses on cash (1,606) (462) 189
Increase (decrease) in cash and equivalents 761 (5,632) (1,347) Cash and cash equivalents, beginning of year 42,459 48,091 49,438 Cash and cash equivalents, end of year 43,220$ 42,459$ 48,091$
Supplemental disclosures of cash flow information: Cash payments during the period for: Interest 20,772$ 16,807$ 16,899$ Income taxes 26,775 7,333 11,558
The accompanying notes are an integral part of these statements.
-24-
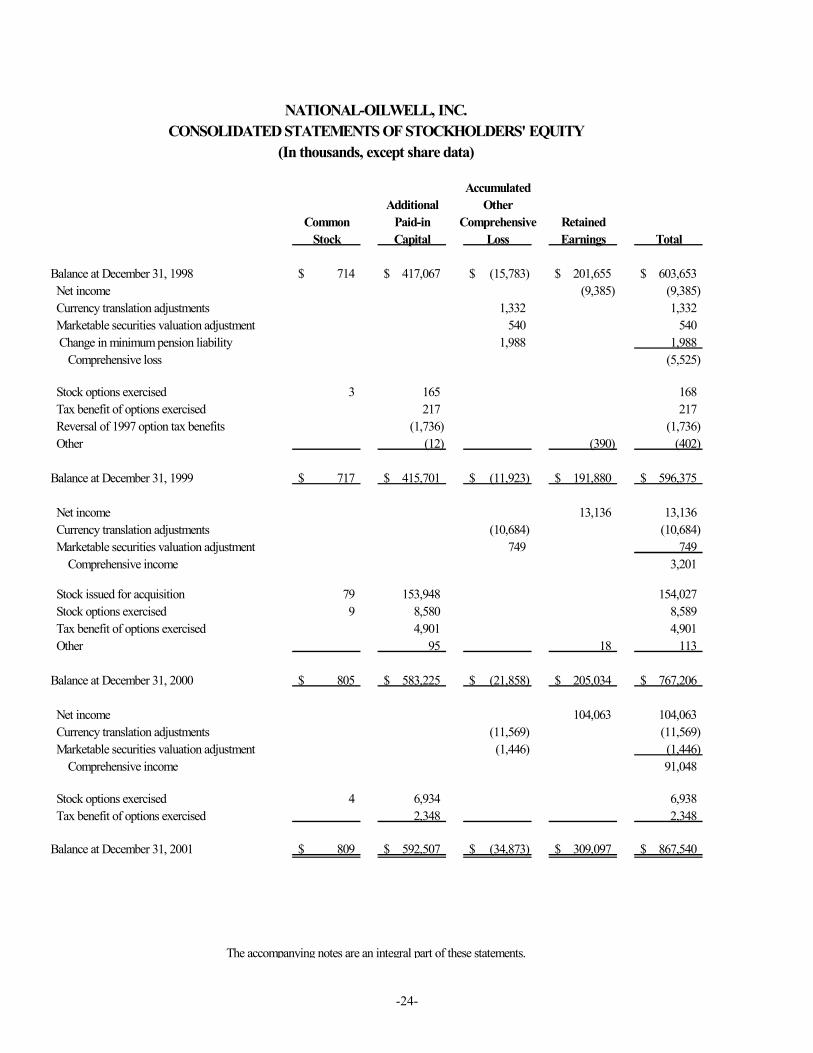
NATIONAL-OILWELL, INC.CONSOLIDATED STATEMENTS OF STOCKHOLDERS' EQUITY
(In thousands, except share data)
AccumulatedAdditional Other
Common Paid-in Comprehensive RetainedStock Capital Loss Earnings Total
Balance at December 31, 1998 714$ 417,067$ (15,783)$ 201,655$ 603,653$ Net income (9,385) (9,385) Currency translation adjustments 1,332 1,332 Marketable securities valuation adjustment 540 540 Change in minimum pension liability 1,988 1,988 Comprehensive loss (5,525)
Stock options exercised 3 165 168 Tax benefit of options exercised 217 217 Reversal of 1997 option tax benefits (1,736) (1,736) Other (12) (390) (402)
Balance at December 31, 1999 717$ 415,701$ (11,923)$ 191,880$ 596,375$
Net income 13,136 13,136 Currency translation adjustments (10,684) (10,684) Marketable securities valuation adjustment 749 749 Comprehensive income 3,201
Stock issued for acquisition 79 153,948 154,027 Stock options exercised 9 8,580 8,589 Tax benefit of options exercised 4,901 4,901 Other 95 18 113 Balance at December 31, 2000 805$ 583,225$ (21,858)$ 205,034$ 767,206$
Net income 104,063 104,063 Currency translation adjustments (11,569) (11,569) Marketable securities valuation adjustment (1,446) (1,446) Comprehensive income 91,048
Stock options exercised 4 6,934 6,938 Tax benefit of options exercised 2,348 2,348 Balance at December 31, 2001 809$ 592,507$ (34,873)$ 309,097$ 867,540$
The accompanying notes are an integral part of these statements.
NATIONAL-OILWELL, INC.
NOTES TO CONSOLIDATED FINANCIAL STATEMENTS 1. Organization and Basis of Presentation Information concerning common stock and per share data assumes the exchange of all Exchangeable Shares issued in connection with the combination with Dreco Energy Services Ltd. effective September 25, 1997. Each Exchangeable Share is intended to have substantially identical economic and legal rights as, and are expected to be exchanged during 2002 on a one-for-one basis for, a share of National Oilwell common stock. The preparation of financial statements in conformity with generally accepted accounting principles requires management to make estimates and assumptions that affect reported and contingent amounts of assets and liabilities as of the date of the financial statements and reported amounts of revenues and expenses during the reporting period. Actual results could differ from those estimates. 2. Acquisitions Year 2001 We made nine acquisitions in 2001, ranging in value from $600,000 to a high of $16.5 million, for a total cash outlay of $51.5 million. All of these acquisitions were accounted for under the purchase method of accounting and generated approximately $30 million in goodwill. Two of the larger acquisitions, Integrated Power Systems and Maritime Hydraulics (Canada) Ltd., were acquired in early January 2001 and their financial results were included in our consolidated financial results for substantially the entire year. Pro-forma information related to acquisitions has not been provided as such amounts are not material individually or in the aggregate. Year 2000 In February 2000, the merger with Hitec ASA was completed for approximately $158 million as we issued 7.9 million shares of common stock. This transaction was accounted for as a purchase effective February 1, 2000 and generated goodwill of approximately $150 million. In June 2000, IRI International Corporation was merged with the Company and accounted for as a pooling-of-interests. We issued 13.5 million shares of common stock valued at approximately $447 million. All prior periods have been restated.
-25-
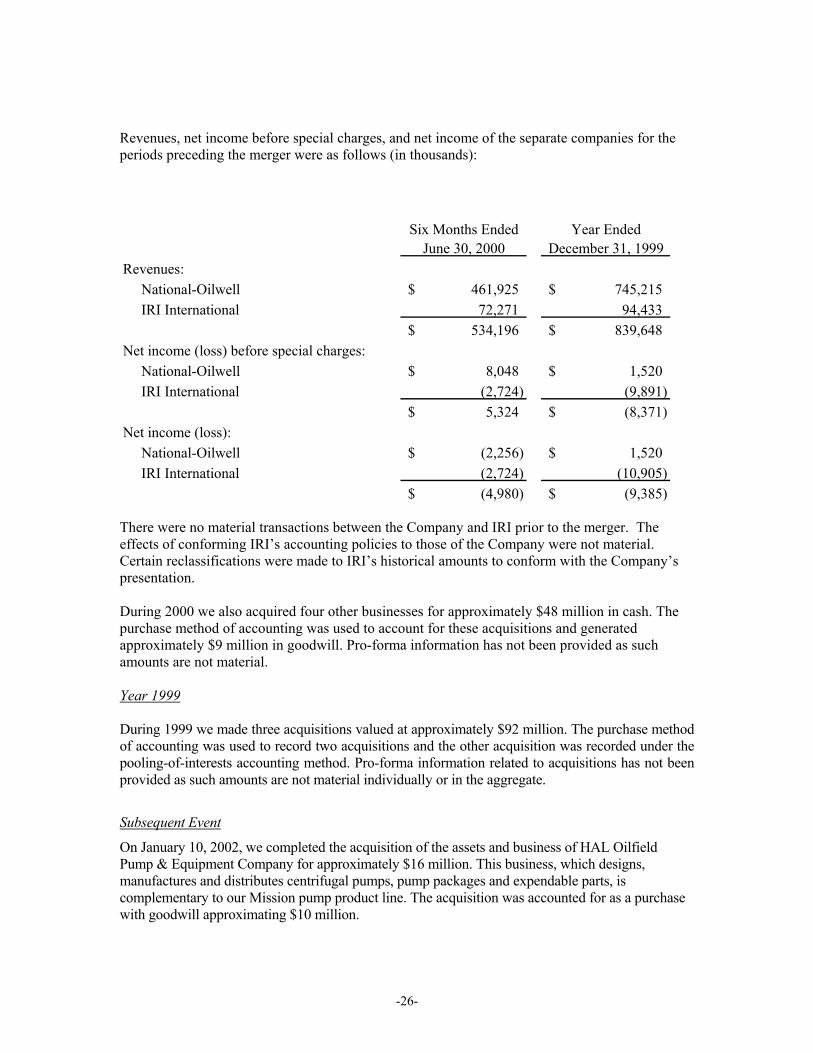
Revenues, net income before special charges, and net income of the separate companies for the periods preceding the merger were as follows (in thousands):
Six Months EndedJune 30, 2000
Year Ended December 31, 1999
Revenues: National-Oilwell 461,925$ 745,215$ IRI International 72,271 94,433
534,196$ 839,648$ Net income (loss) before special charges: National-Oilwell 8,048$ 1,520$ IRI International (2,724) (9,891)
5,324$ (8,371)$ Net income (loss): National-Oilwell (2,256)$ 1,520$ IRI International (2,724) (10,905)
(4,980)$ (9,385)$ There were no material transactions between the Company and IRI prior to the merger. The effects of conforming IRI’s accounting policies to those of the Company were not material. Certain reclassifications were made to IRI’s historical amounts to conform with the Company’s presentation. During 2000 we also acquired four other businesses for approximately $48 million in cash. The purchase method of accounting was used to account for these acquisitions and generated approximately $9 million in goodwill. Pro-forma information has not been provided as such amounts are not material. Year 1999 During 1999 we made three acquisitions valued at approximately $92 million. The purchase method of accounting was used to record two acquisitions and the other acquisition was recorded under the pooling-of-interests accounting method. Pro-forma information related to acquisitions has not been provided as such amounts are not material individually or in the aggregate.
Subsequent Event
On January 10, 2002, we completed the acquisition of the assets and business of HAL Oilfield Pump & Equipment Company for approximately $16 million. This business, which designs, manufactures and distributes centrifugal pumps, pump packages and expendable parts, is complementary to our Mission pump product line. The acquisition was accounted for as a purchase with goodwill approximating $10 million.
-26-
3. Summary of Significant Accounting Policies Principles of Consolidation The consolidated financial statements include the accounts of National Oilwell and its subsidiaries, all of which are wholly owned. All significant intercompany transactions and balances have been eliminated in consolidation. Fair Value of Financial Instruments Financial instruments consist primarily of cash and cash equivalents, receivables, payables and debt instruments. Cash equivalents include only those investments having a maturity of three months or less at the time of purchase. The carrying values of these financial instruments approximate their respective fair values.
Inventories
Inventories consist of oilfield products, manufactured equipment, manufactured specialized drilling products and downhole motors and spare parts for manufactured equipment and drilling products. Inventories are stated at the lower of cost or market using the first-in, first-out or average cost methods. Property, Plant and Equipment Property, plant and equipment are recorded at cost. Expenditures for major improvements that extend the lives of property and equipment are capitalized while minor replacements, maintenance and repairs are charged to operations as incurred. Disposals are removed at cost less accumulated depreciation with any resulting gain or loss reflected in operations. Depreciation is provided using the straight-line method or declining balance method over the estimated useful lives of individual items.
Investments in Affiliates
During 2001 we formed a joint venture with Lanzhou Petroleum & Chemical Machinery Equipment & Engineering Group Corporation, a major manufacturer of drilling equipment located in the People’s Republic of China. We made an initial capital contribution of $6.7 million to acquire a 60% ownership in the joint venture. Due to substantive participating rights retained by the minority partner and foreign exchange restriction concerns, we use the equity method to account for this investment. The investment totaled $7.3 million at December 31, 2001.
Intangible Assets Deferred financing costs are amortized on a straight-line basis over the life of the related debt security and accumulated amortization was $1,366,000 and $873,000 at December 31, 2001 and 2000, respectively. Through December 31, 2001, goodwill was amortized on a straight-line basis over its estimated life of 10-40 years. Accumulated amortization at December 31, 2001 and 2000 was $31,612,000 and $19,559,000. On an annual basis, the Company estimates the future estimated discounted cash flows of the business to which goodwill relates in order to determine that the carrying value of the goodwill has not been impaired.
-27-
Foreign Currency The functional currency for National Oilwell’s Canadian, United Kingdom, Netherlands, German and Australian operations is the local currency. The cumulative effects of translating the balance sheet accounts from the functional currency into the U.S. dollar at current exchange rates are included in accumulated other comprehensive income. The U.S. dollar is used as the functional currency for the Singapore and Venezuelan operations. Accordingly, certain assets are translated at historical exchange rates and all translation adjustments are included in income. For all operations, gains or losses from remeasuring foreign currency transactions into the functional currency are included in income. Revenue Recognition
Revenue from the sale and rental of products and delivery of services is recognized upon passage of title, incurrance of rental charges or delivery of services to the customer. Revenue is recognized on certain significant contracts in the Products and Technology segment using the percentage of completion method based on the percentage of total costs incurred to total costs expected. Provision for estimated losses, if any, is made in the period such losses are estimable.
Income Taxes The liability method is used to account for income taxes. Deferred tax assets and liabilities are determined based on differences between financial reporting and tax bases of assets and liabilities and are measured using the enacted tax rates and laws that will be in effect when the differences are expected to reverse. Valuation allowances are established when necessary to reduce deferred tax assets to amounts which are more likely than not to be realized. Concentration of Credit Risk National Oilwell grants credit to its customers, which operate primarily in the oil and gas industry. National Oilwell performs periodic credit evaluations of its customers’ financial condition and generally does not require collateral, but may require letters of credit for certain international sales. Reserves are maintained for potential credit losses and such credit losses have historically been within management’s expectations.
Stock-Based Compensation National Oilwell uses the intrinsic value method in accounting for its stock-based employee compensation plans.
Recently Issued Accounting Standards
-28-
In June 2001, the Financial Accounting Standards Board (“FASB”) issued Statement No. 142, Goodwill and Other Intangible Assets, effective for fiscal years beginning after December 15, 2001. Under the new rules, goodwill and intangible assets deemed to have indefinite lives will no longer be amortized but will be subject to annual impairment tests in accordance with the statement. Other intangible assets will continue to be amortized over their useful lives. In addition, accounting for acquisitions under the pooling-of-interests method is no longer permitted. We will adopt the new rules on accounting for goodwill and other intangible assets beginning in the first quarter of 2002. Application of the non-amortization provisions of the statement for 2001 would have resulted in an increase in net income of $11 million ($0.13 per diluted share). Pursuant to SFAS 142, we will test goodwill for impairment upon adoption and, if impairment is indicated, record such impairment as a cumulative effect of an accounting change. We are currently evaluating the effect that the adoption may have on our consolidated results of operation and financial position.
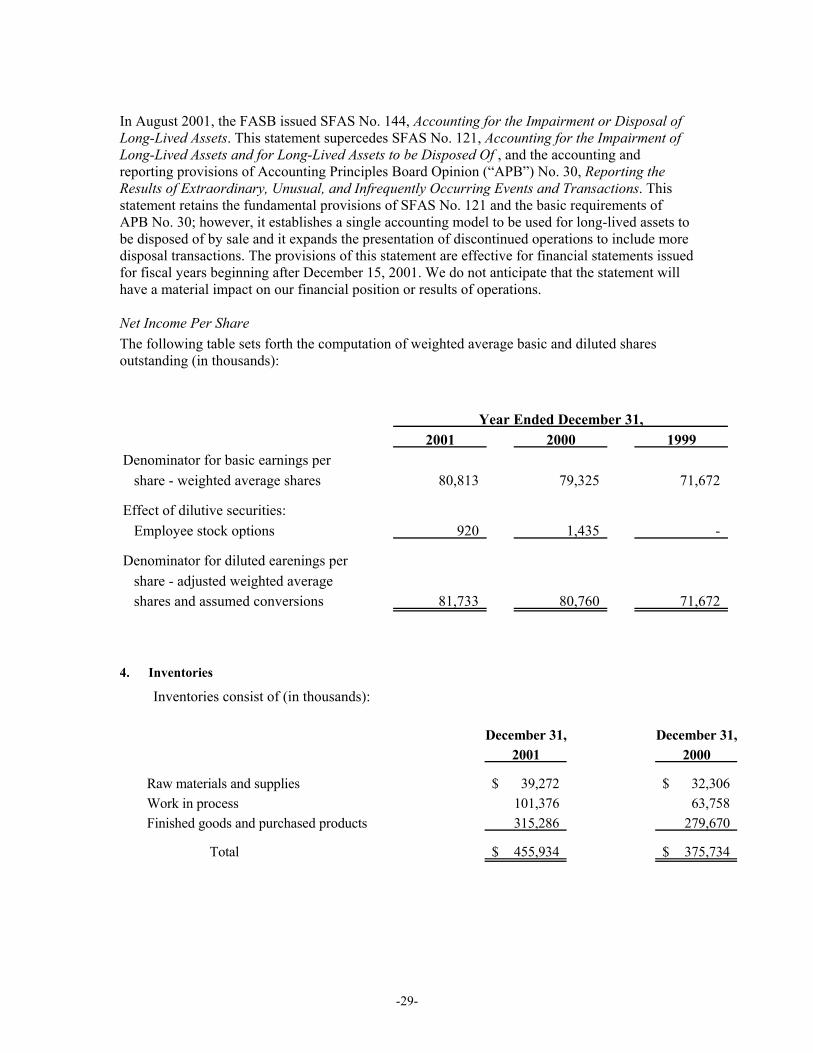
In August 2001, the FASB issued SFAS No. 144, Accounting for the Impairment or Disposal of Long-Lived Assets. This statement supercedes SFAS No. 121, Accounting for the Impairment of Long-Lived Assets and for Long-Lived Assets to be Disposed Of , and the accounting and reporting provisions of Accounting Principles Board Opinion (“APB”) No. 30, Reporting the Results of Extraordinary, Unusual, and Infrequently Occurring Events and Transactions. This statement retains the fundamental provisions of SFAS No. 121 and the basic requirements of APB No. 30; however, it establishes a single accounting model to be used for long-lived assets to be disposed of by sale and it expands the presentation of discontinued operations to include more disposal transactions. The provisions of this statement are effective for financial statements issued for fiscal years beginning after December 15, 2001. We do not anticipate that the statement will have a material impact on our financial position or results of operations. Net Income Per Share The following table sets forth the computation of weighted average basic and diluted shares outstanding (in thousands):
Year Ended December 31,2001 2000 1999
Denominator for basic earnings pershare - weighted average shares 80,813 79,325 71,672
Effect of dilutive securities:Employee stock options 920 1,435 -
Denominator for diluted earenings pershare - adjusted weighted averageshares and assumed conversions 81,733 80,760 71,672
4. Inventories
Inventories consist of (in thousands):
December 31, December 31,2001 2000
Raw materials and supplies 39,272$ 32,306$ Work in process 101,376 63,758 Finished goods and purchased products 315,286 279,670
Total 455,934$ 375,734$
-29-
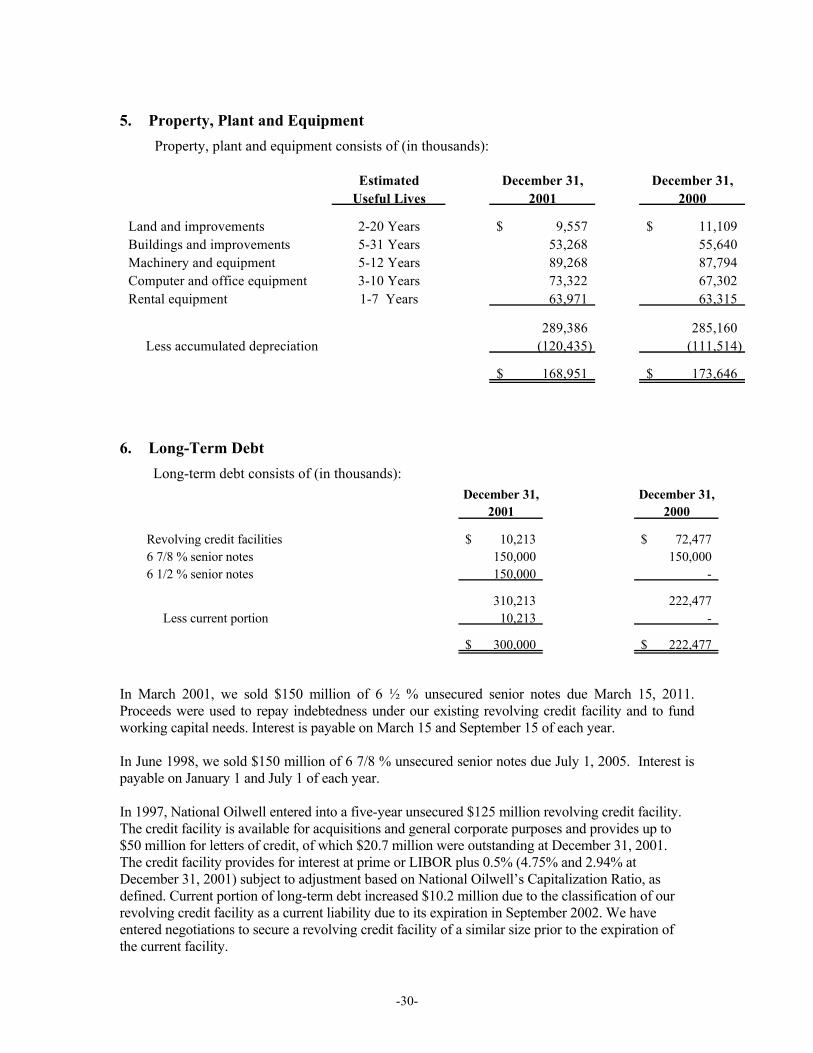
5. Property, Plant and Equipment Property, plant and equipment consists of (in thousands):
Estimated December 31, December 31,Useful Lives 2001 2000
Land and improvements 2-20 Years 9,557$ 11,109$ Buildings and improvements 5-31 Years 53,268 55,640 Machinery and equipment 5-12 Years 89,268 87,794 Computer and office equipment 3-10 Years 73,322 67,302 Rental equipment 1-7 Years 63,971 63,315
289,386 285,160 Less accumulated depreciation (120,435) (111,514)
168,951$ 173,646$
6. Long-Term Debt
Long-term debt consists of (in thousands): December 31, December 31,
2001 2000
Revolving credit facilities 10,213$ 72,477$ 6 7/8 % senior notes 150,000 150,000 6 1/2 % senior notes 150,000 -
310,213 222,477 Less current portion 10,213 -
300,000$ 222,477$
In March 2001, we sold $150 million of 6 ½ % unsecured senior notes due March 15, 2011. Proceeds were used to repay indebtedness under our existing revolving credit facility and to fund working capital needs. Interest is payable on March 15 and September 15 of each year. In June 1998, we sold $150 million of 6 7/8 % unsecured senior notes due July 1, 2005. Interest is payable on January 1 and July 1 of each year. In 1997, National Oilwell entered into a five-year unsecured $125 million revolving credit facility. The credit facility is available for acquisitions and general corporate purposes and provides up to $50 million for letters of credit, of which $20.7 million were outstanding at December 31, 2001. The credit facility provides for interest at prime or LIBOR plus 0.5% (4.75% and 2.94% at December 31, 2001) subject to adjustment based on National Oilwell’s Capitalization Ratio, as defined. Current portion of long-term debt increased $10.2 million due to the classification of our revolving credit facility as a current liability due to its expiration in September 2002. We have entered negotiations to secure a revolving credit facility of a similar size prior to the expiration of the current facility.
-30-
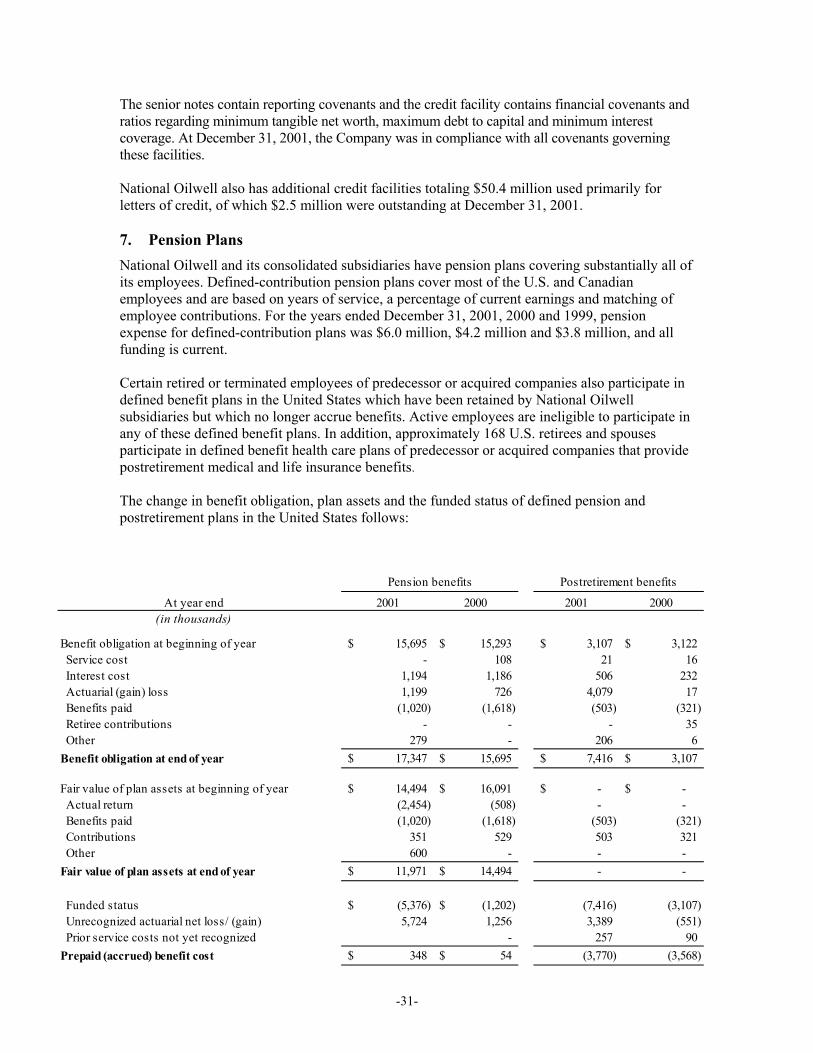
-31-
The senior notes contain reporting covenants and the credit facility contains financial covenants and ratios regarding minimum tangible net worth, maximum debt to capital and minimum interest coverage. At December 31, 2001, the Company was in compliance with all covenants governing these facilities. National Oilwell also has additional credit facilities totaling $50.4 million used primarily for letters of credit, of which $2.5 million were outstanding at December 31, 2001. 7. Pension Plans National Oilwell and its consolidated subsidiaries have pension plans covering substantially all of its employees. Defined-contribution pension plans cover most of the U.S. and Canadian employees and are based on years of service, a percentage of current earnings and matching of employee contributions. For the years ended December 31, 2001, 2000 and 1999, pension expense for defined-contribution plans was $6.0 million, $4.2 million and $3.8 million, and all funding is current. Certain retired or terminated employees of predecessor or acquired companies also participate in defined benefit plans in the United States which have been retained by National Oilwell subsidiaries but which no longer accrue benefits. Active employees are ineligible to participate in any of these defined benefit plans. In addition, approximately 168 U.S. retirees and spouses participate in defined benefit health care plans of predecessor or acquired companies that provide postretirement medical and life insurance benefits. The change in benefit obligation, plan assets and the funded status of defined pension and postretirement plans in the United States follows:
Pension benefits Postretirement benefits
At year end 2001 2000 2001 2000(in thousands)
Benefit obligation at beginning of year 15,695$ 15,293$ 3,107$ 3,122$ Service cost - 108 21 16 Interest cost 1,194 1,186 506 232 Actuarial (gain) loss 1,199 726 4,079 17 Benefits paid (1,020) (1,618) (503) (321) Retiree contributions - - - 35 Other 279 - 206 6 Benefit obligation at end of year 17,347$ 15,695$ 7,416$ 3,107$
Fair value of plan assets at beginning of year 14,494$ 16,091$ -$ -$ Actual return (2,454) (508) - - Benefits paid (1,020) (1,618) (503) (321) Contributions 351 529 503 321 Other 600 - - - Fair value of plan assets at end of year 11,971$ 14,494$ - -
Funded status (5,376)$ (1,202)$ (7,416) (3,107) Unrecognized actuarial net loss/ (gain) 5,724 1,256 3,389 (551) Prior service costs not yet recognized - 257 90 Prepaid (accrued) benefit cost 348$ 54$ (3,770) (3,568)
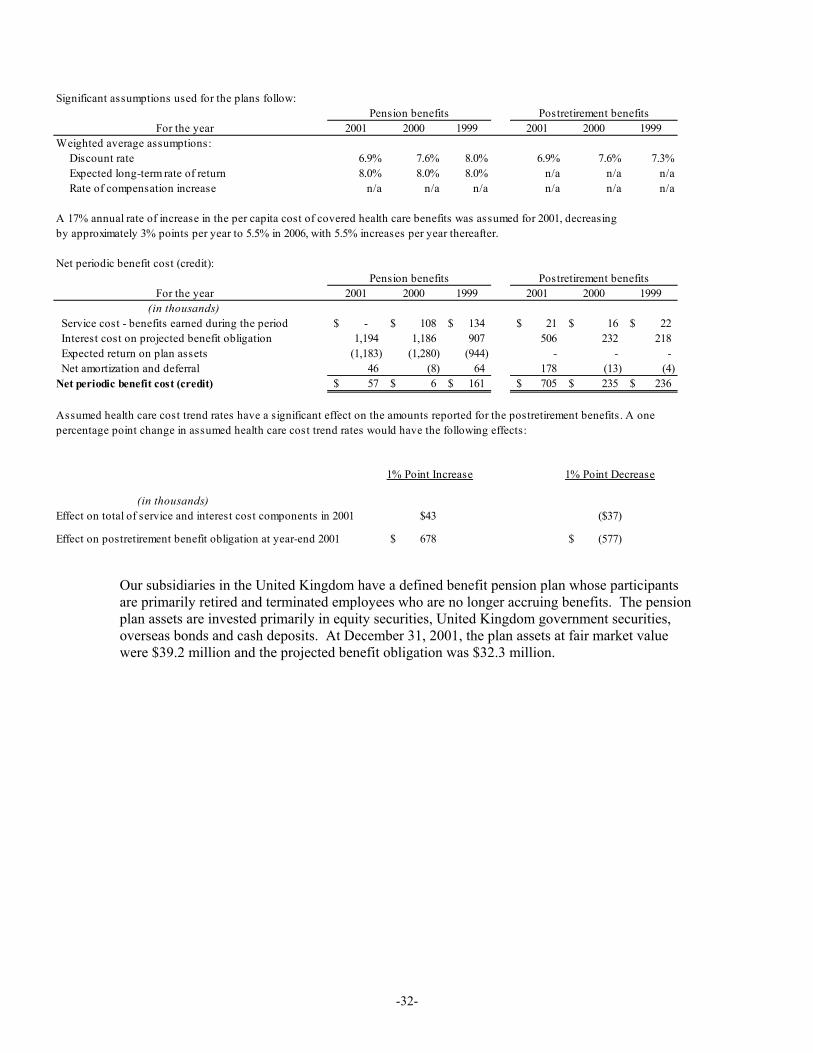
-32-
Significant assumptions used for the plans follow:
For the year 2001 2000 1999 2001 2000 1999Weighted average assumptions: Discount rate 6.9% 7.6% 8.0% 6.9% 7.6% 7.3% Expected long-term rate of return 8.0% 8.0% 8.0% n/a n/a n/a Rate of compensation increase n/a n/a n/a n/a n/a n/a
A 17% annual rate of increase in the per capita cost of covered health care benefits was assumed for 2001, decreasing by approximately 3% points per year to 5.5% in 2006, with 5.5% increases per year thereafter.
Net periodic benefit cost (credit):
For the year 2001 2000 1999 2001 2000 1999(in thousands)
Service cost - benefits earned during the period -$ 108$ 134$ 21$ 16$ 22$ Interest cost on projected benefit obligation 1,194 1,186 907 506 232 218 Expected return on plan assets (1,183) (1,280) (944) - - - Net amortization and deferral 46 (8) 64 178 (13) (4) Net periodic benefit cost (credit) 57$ 6$ 161$ 705$ 235$ 236$
Assumed health care cost trend rates have a significant effect on the amounts reported for the postretirement benefits. A onepercentage point change in assumed health care cost trend rates would have the following effects:
1% Point Increase 1% Point Decrease
(in thousands)Effect on total of service and interest cost components in 2001 $43 ($37)
Effect on postretirement benefit obligation at year-end 2001 678$ (577)$
Pension benefits Postretirement benefits
Pension benefits Postretirement benefits
Our subsidiaries in the United Kingdom have a defined benefit pension plan whose participants are primarily retired and terminated employees who are no longer accruing benefits. The pension plan assets are invested primarily in equity securities, United Kingdom government securities, overseas bonds and cash deposits. At December 31, 2001, the plan assets at fair market value were $39.2 million and the projected benefit obligation was $32.3 million.
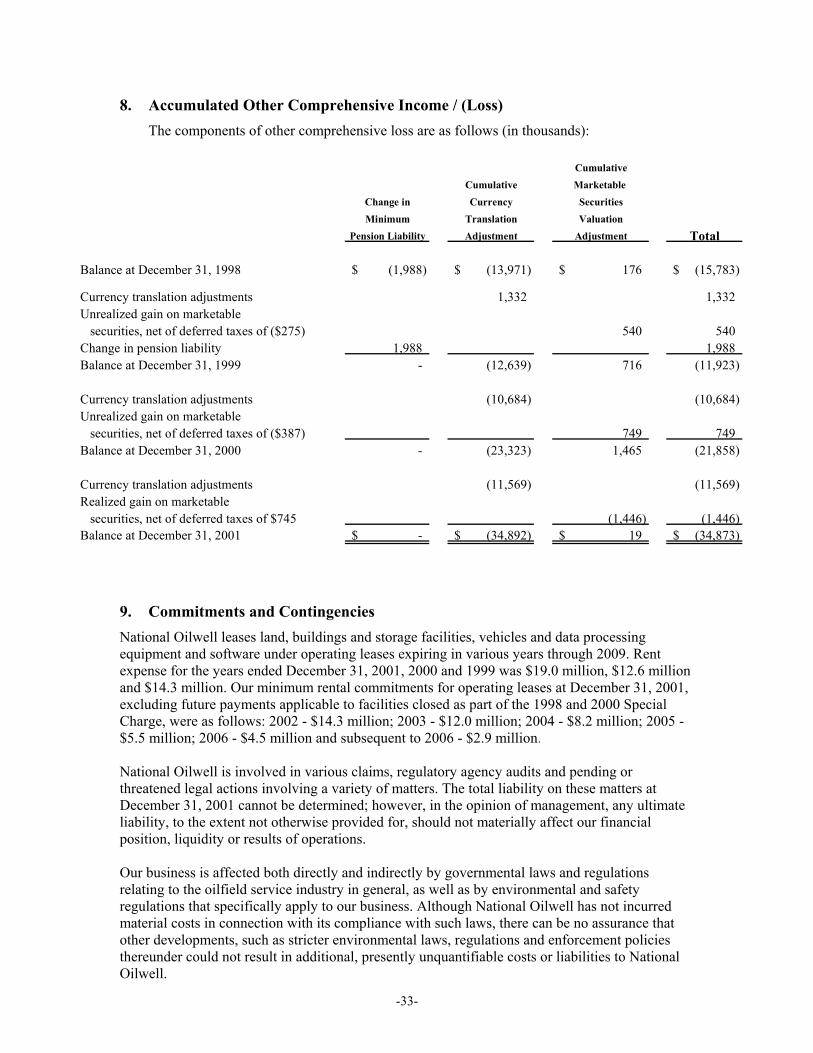
8. Accumulated Other Comprehensive Income / (Loss) The components of other comprehensive loss are as follows (in thousands):
CumulativeCumulative Marketable
Change in Currency SecuritiesMinimum Translation Valuation
Pension Liability Adjustment Adjustment Total
Balance at December 31, 1998 (1,988)$ (13,971)$ 176$ (15,783)$
Currency translation adjustments 1,332 1,332 Unrealized gain on marketable securities, net of deferred taxes of ($275) 540 540 Change in pension liability 1,988 1,988 Balance at December 31, 1999 - (12,639) 716 (11,923)
Currency translation adjustments (10,684) (10,684) Unrealized gain on marketable securities, net of deferred taxes of ($387) 749 749 Balance at December 31, 2000 - (23,323) 1,465 (21,858)
Currency translation adjustments (11,569) (11,569) Realized gain on marketable securities, net of deferred taxes of $745 (1,446) (1,446) Balance at December 31, 2001 -$ (34,892)$ 19$ (34,873)$
9. Commitments and Contingencies National Oilwell leases land, buildings and storage facilities, vehicles and data processing equipment and software under operating leases expiring in various years through 2009. Rent expense for the years ended December 31, 2001, 2000 and 1999 was $19.0 million, $12.6 million and $14.3 million. Our minimum rental commitments for operating leases at December 31, 2001, excluding future payments applicable to facilities closed as part of the 1998 and 2000 Special Charge, were as follows: 2002 - $14.3 million; 2003 - $12.0 million; 2004 - $8.2 million; 2005 - $5.5 million; 2006 - $4.5 million and subsequent to 2006 - $2.9 million. National Oilwell is involved in various claims, regulatory agency audits and pending or threatened legal actions involving a variety of matters. The total liability on these matters at December 31, 2001 cannot be determined; however, in the opinion of management, any ultimate liability, to the extent not otherwise provided for, should not materially affect our financial position, liquidity or results of operations. Our business is affected both directly and indirectly by governmental laws and regulations relating to the oilfield service industry in general, as well as by environmental and safety regulations that specifically apply to our business. Although National Oilwell has not incurred material costs in connection with its compliance with such laws, there can be no assurance that other developments, such as stricter environmental laws, regulations and enforcement policies thereunder could not result in additional, presently unquantifiable costs or liabilities to National Oilwell.
-33-
10. Common Stock National Oilwell has authorized 150 million shares of $.01 par value common stock. We also have authorized 10 million shares of $.01 par value preferred stock, none of which is issued or outstanding. Under the terms of National Oilwell’s Stock Award and Long-Term Incentive Plan, as amended, 4.5 million shares of common stock are authorized for the grant of options to officers, key employees, non-employee directors and other persons. Options granted under our stock option plan generally vest over a three-year period starting one year from the date of grant and expire five or ten years from the date of grant. The purchase price of options granted may not be less than the market price of National Oilwell common stock on the date of grant. At December 31, 2001, approximately 1.2 million shares were available for future grants.
We also have inactive stock option plans that were acquired in connection with the acquisitions of Dreco Energy Services, Ltd. in 1997, and of Hitec ASA and IRI International Corporation in 2000. We converted the outstanding stock options under these plans to options to acquire our common stock and no further options are being issued under these plans. Stock option information summarized below includes amounts for the National Oilwell Stock Award and Long-Term Incentive Plan and stock plans of acquired companies. Options outstanding at December 31, 2001 under the stock option plans have exercise prices between $5.62 and $40.50 per share, and expire at various dates from March 21, 2002 to February 14, 2011. The weighted average exercise price on the 3,094,160 outstanding options at December 31, 2001 is $22.95.
-34-
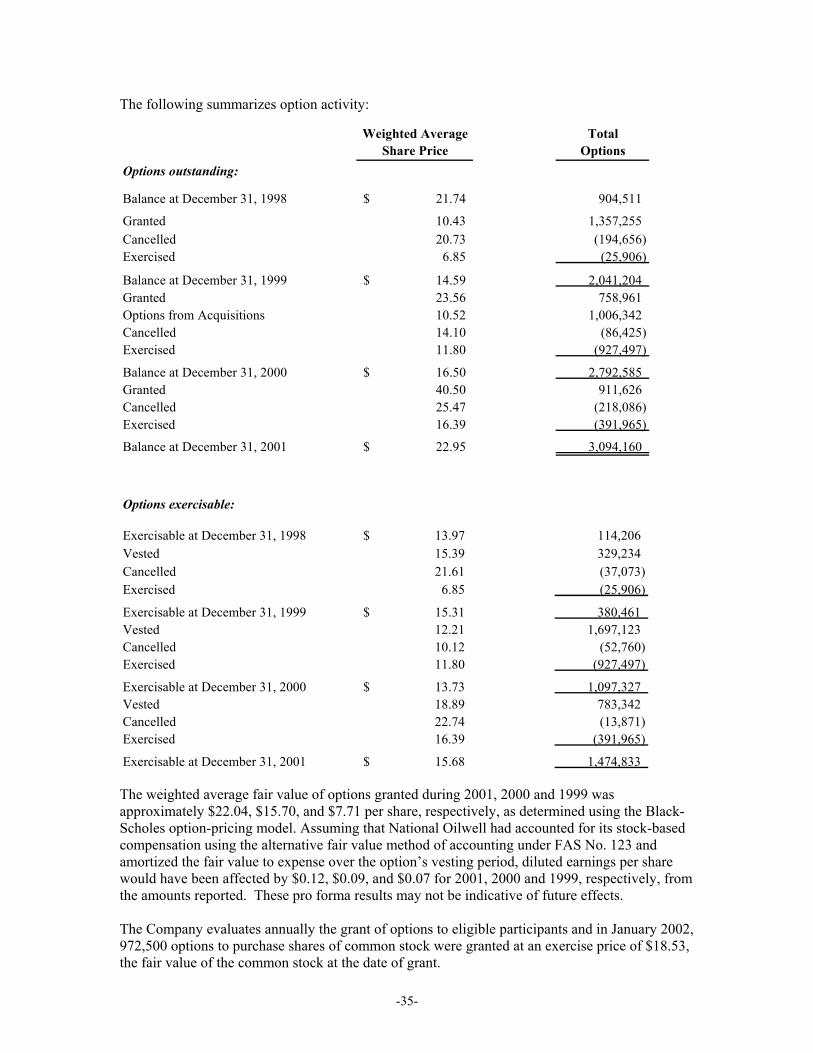
The following summarizes option activity:
Weighted Average TotalShare Price Options
Options outstanding:
Balance at December 31, 1998 21.74$ 904,511
Granted 10.43 1,357,255 Cancelled 20.73 (194,656) Exercised 6.85 (25,906)
Balance at December 31, 1999 14.59$ 2,041,204 Granted 23.56 758,961 Options from Acquisitions 10.52 1,006,342 Cancelled 14.10 (86,425) Exercised 11.80 (927,497)
Balance at December 31, 2000 16.50$ 2,792,585 Granted 40.50 911,626 Cancelled 25.47 (218,086) Exercised 16.39 (391,965)
Balance at December 31, 2001 22.95$ 3,094,160
Options exercisable:
Exercisable at December 31, 1998 13.97$ 114,206 Vested 15.39 329,234 Cancelled 21.61 (37,073) Exercised 6.85 (25,906)
Exercisable at December 31, 1999 15.31$ 380,461 Vested 12.21 1,697,123 Cancelled 10.12 (52,760) Exercised 11.80 (927,497)
Exercisable at December 31, 2000 13.73$ 1,097,327 Vested 18.89 783,342 Cancelled 22.74 (13,871) Exercised 16.39 (391,965)
Exercisable at December 31, 2001 15.68$ 1,474,833
The weighted average fair value of options granted during 2001, 2000 and 1999 was approximately $22.04, $15.70, and $7.71 per share, respectively, as determined using the Black-Scholes option-pricing model. Assuming that National Oilwell had accounted for its stock-based compensation using the alternative fair value method of accounting under FAS No. 123 and amortized the fair value to expense over the option’s vesting period, diluted earnings per share would have been affected by $0.12, $0.09, and $0.07 for 2001, 2000 and 1999, respectively, from the amounts reported. These pro forma results may not be indicative of future effects. The Company evaluates annually the grant of options to eligible participants and in January 2002, 972,500 options to purchase shares of common stock were granted at an exercise price of $18.53, the fair value of the common stock at the date of grant.
-35-
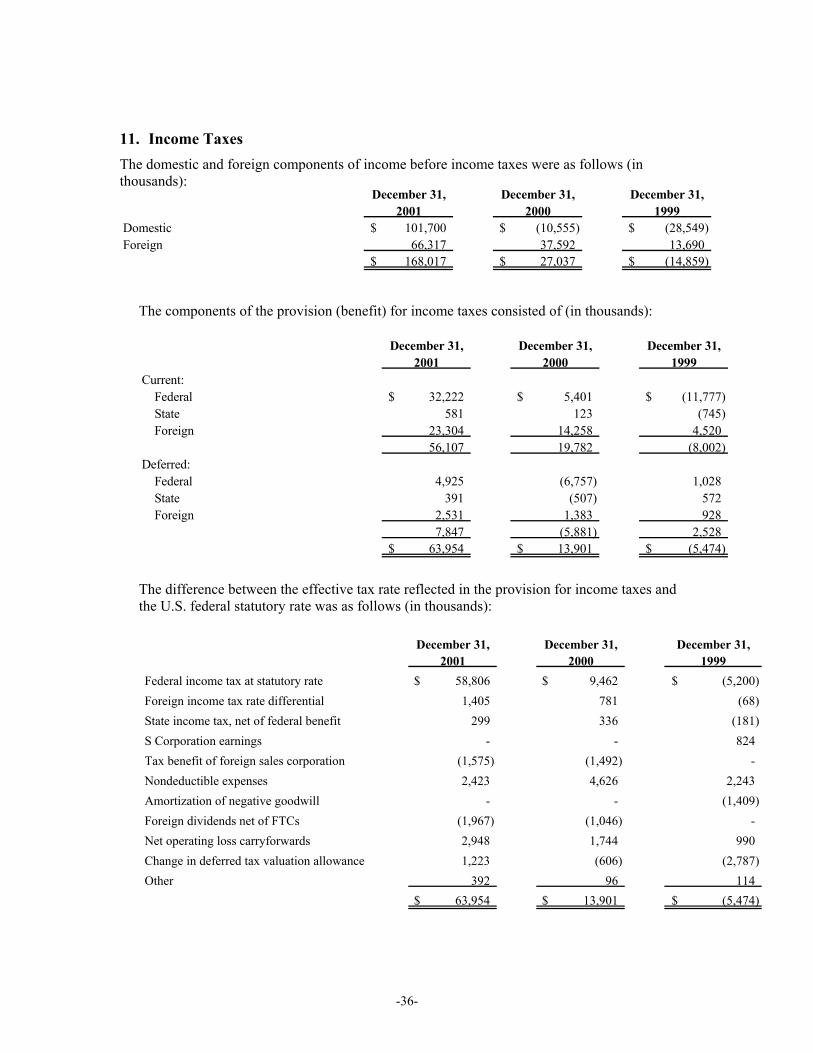
11. Income Taxes The domestic and foreign components of income before income taxes were as follows (in thousands):
Dome
F
December 31, 2001
December 31, 2000
December 31, 1999
stic 101,700$ (10,555)$ (28,549)$ oreign 66,317 37,592 13,690
168,017$ 27,037$ (14,859)$ The components of the provision (benefit) for income taxes consisted of (in thousands):
Cu
F
S F D F S F
December 31, 2001
December 31, 2000
December 31, 1999
rrent:ederal 32,222$ 5,401$ (11,777)$ tate 581 123 (745) oreign 23,304 14,258 4,520
56,107 19,782 (8,002) eferred:
ederal 4,925 (6,757) 1,028 tate 391 (507) 572 oreign 2,531 1,383 928
7,847 (5,881) 2,528 63,954$ 13,901$ (5,474)$
The difference between the effective tax rate reflected in the provision for income taxes and the U.S. federal statutory rate was as follows (in thousands):
December 31, 2001
December 31, 2000
December 31, 1999
Federal income tax at statutory rate 58,806$ 9,462$ (5,200)$ Foreign income tax rate differential 1,405 781 (68) State income tax, net of federal benefit 299 336 (181) S Corporation earnings - - 824 Tax benefit of foreign sales corporation (1,575) (1,492) - Nondeductible expenses 2,423 4,626 2,243 Amortization of negative goodwill - - (1,409) Foreign dividends net of FTCs (1,967) (1,046) - Net operating loss carryforwards 2,948 1,744 990 Change in deferred tax valuation allowance 1,223 (606) (2,787) Other 392 96 114
63,954$ 13,901$ (5,474)$
-36-
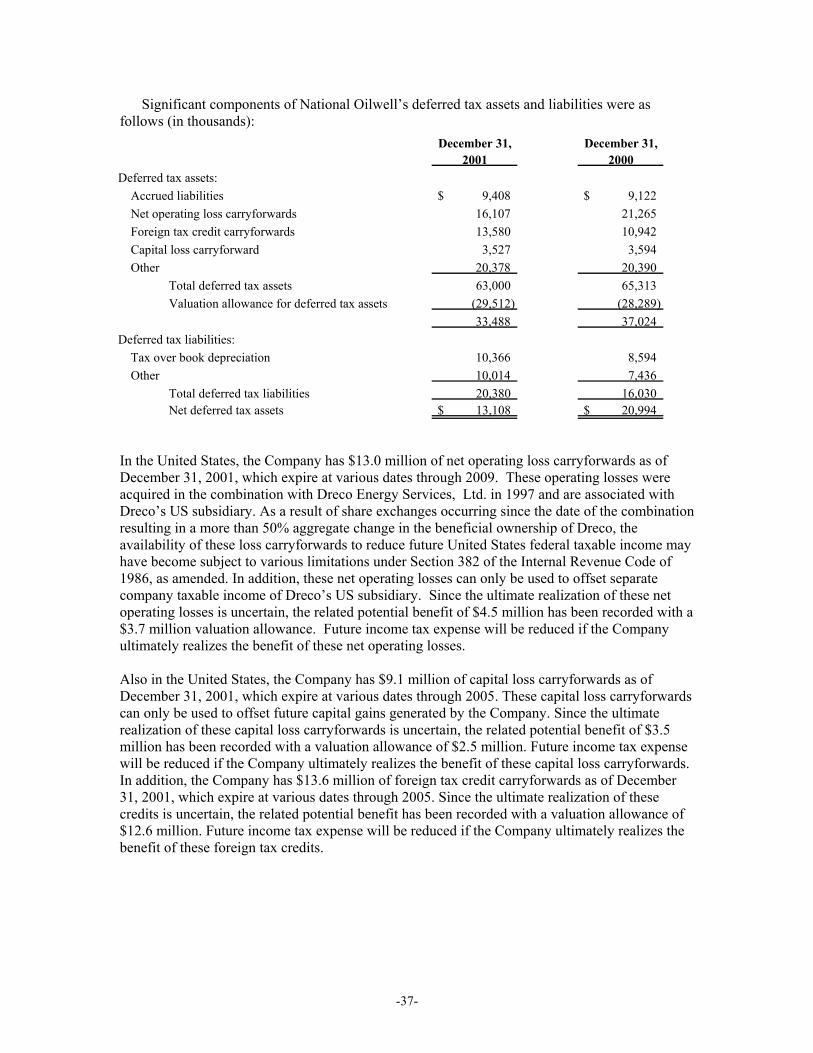
-37-
Significant components of National Oilwell’s deferred tax assets and liabilities were as follows (in thousands):
December 31, December 31,2001 2000
Deferred tax assets: Accrued liabilities 9,408$ 9,122$ Net operating loss carryforwards 16,107 21,265 Foreign tax credit carryforwards 13,580 10,942 Capital loss carryforward 3,527 3,594 Other 20,378 20,390 Total deferred tax assets 63,000 65,313 Valuation allowance for deferred tax assets (29,512) (28,289)
33,488 37,024 Deferred tax liabilities: Tax over book depreciation 10,366 8,594 Other 10,014 7,436 Total deferred tax liabilities 20,380 16,030 Net deferred tax assets 13,108$ 20,994$
In the United States, the Company has $13.0 million of net operating loss carryforwards as of December 31, 2001, which expire at various dates through 2009. These operating losses were acquired in the combination with Dreco Energy Services, Ltd. in 1997 and are associated with Dreco’s US subsidiary. As a result of share exchanges occurring since the date of the combination resulting in a more than 50% aggregate change in the beneficial ownership of Dreco, the availability of these loss carryforwards to reduce future United States federal taxable income may have become subject to various limitations under Section 382 of the Internal Revenue Code of 1986, as amended. In addition, these net operating losses can only be used to offset separate company taxable income of Dreco’s US subsidiary. Since the ultimate realization of these net operating losses is uncertain, the related potential benefit of $4.5 million has been recorded with a $3.7 million valuation allowance. Future income tax expense will be reduced if the Company ultimately realizes the benefit of these net operating losses. Also in the United States, the Company has $9.1 million of capital loss carryforwards as of December 31, 2001, which expire at various dates through 2005. These capital loss carryforwards can only be used to offset future capital gains generated by the Company. Since the ultimate realization of these capital loss carryforwards is uncertain, the related potential benefit of $3.5 million has been recorded with a valuation allowance of $2.5 million. Future income tax expense will be reduced if the Company ultimately realizes the benefit of these capital loss carryforwards. In addition, the Company has $13.6 million of foreign tax credit carryforwards as of December 31, 2001, which expire at various dates through 2005. Since the ultimate realization of these credits is uncertain, the related potential benefit has been recorded with a valuation allowance of $12.6 million. Future income tax expense will be reduced if the Company ultimately realizes the benefit of these foreign tax credits.
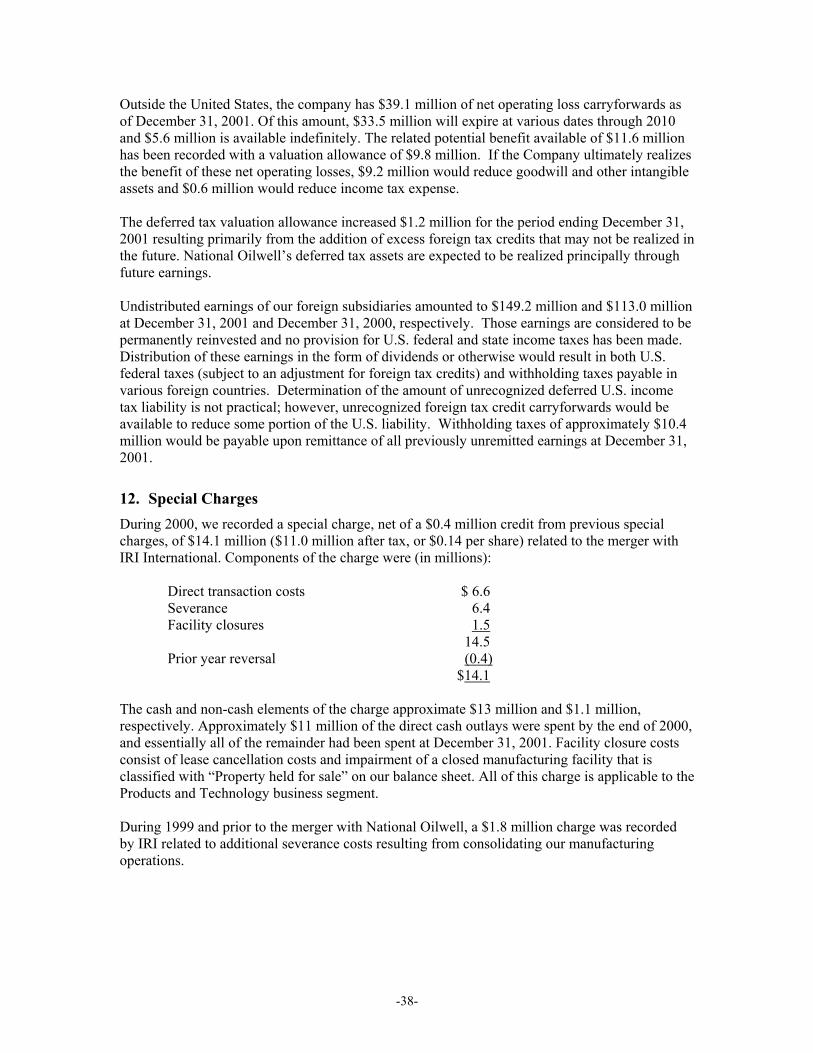
Outside the United States, the company has $39.1 million of net operating loss carryforwards as of December 31, 2001. Of this amount, $33.5 million will expire at various dates through 2010 and $5.6 million is available indefinitely. The related potential benefit available of $11.6 million has been recorded with a valuation allowance of $9.8 million. If the Company ultimately realizes the benefit of these net operating losses, $9.2 million would reduce goodwill and other intangible assets and $0.6 million would reduce income tax expense. The deferred tax valuation allowance increased $1.2 million for the period ending December 31, 2001 resulting primarily from the addition of excess foreign tax credits that may not be realized in the future. National Oilwell’s deferred tax assets are expected to be realized principally through future earnings. Undistributed earnings of our foreign subsidiaries amounted to $149.2 million and $113.0 million at December 31, 2001 and December 31, 2000, respectively. Those earnings are considered to be permanently reinvested and no provision for U.S. federal and state income taxes has been made. Distribution of these earnings in the form of dividends or otherwise would result in both U.S. federal taxes (subject to an adjustment for foreign tax credits) and withholding taxes payable in various foreign countries. Determination of the amount of unrecognized deferred U.S. income tax liability is not practical; however, unrecognized foreign tax credit carryforwards would be available to reduce some portion of the U.S. liability. Withholding taxes of approximately $10.4 million would be payable upon remittance of all previously unremitted earnings at December 31, 2001.
12. Special Charges During 2000, we recorded a special charge, net of a $0.4 million credit from previous special charges, of $14.1 million ($11.0 million after tax, or $0.14 per share) related to the merger with IRI International. Components of the charge were (in millions): Direct transaction costs $ 6.6 Severance 6.4 Facility closures 1.5 14.5 Prior year reversal (0.4) $14.1 The cash and non-cash elements of the charge approximate $13 million and $1.1 million, respectively. Approximately $11 million of the direct cash outlays were spent by the end of 2000, and essentially all of the remainder had been spent at December 31, 2001. Facility closure costs consist of lease cancellation costs and impairment of a closed manufacturing facility that is classified with “Property held for sale” on our balance sheet. All of this charge is applicable to the Products and Technology business segment. During 1999 and prior to the merger with National Oilwell, a $1.8 million charge was recorded by IRI related to additional severance costs resulting from consolidating our manufacturing operations.
-38-
13. Business Segments and Geographic Areas National Oilwell’s operations consist of two segments: Products and Technology and Distribution Services. The Products and Technology segment designs and manufactures a variety of oilfield equipment for use in oil and gas drilling, completion and production activities. The Distribution Services segment distributes an extensive line of oilfield supplies and equipment. Intersegment sales and transfers are accounted for at commercial prices and are eliminated in consolidation. The accounting policies of the reportable segments are the same as those described in the summary of significant accounting policies of the Company. The Company evaluates performance of each reportable segment based upon its operating income, excluding non-recurring items. No single customer accounted for 10% or more of consolidated revenues during the three years ended December 31, 2001.
-39-
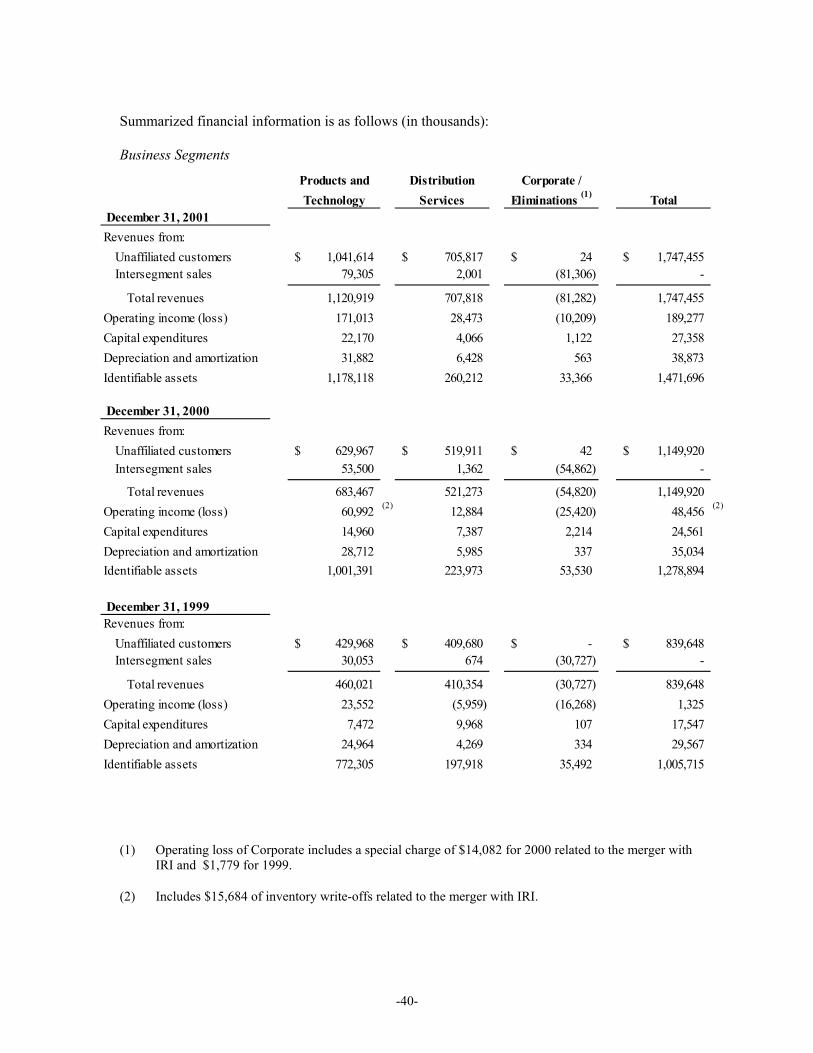
Summarized financial information is as follows (in thousands): Business Segments
Products and Distribution Corporate /Technology Services Eliminations (1) Total
December 31, 2001Revenues from: Unaffiliated customers 1,041,614$ 705,817$ 24$ 1,747,455$ Intersegment sales 79,305 2,001 (81,306) -
Total revenues 1,120,919 707,818 (81,282) 1,747,455 Operating income (loss) 171,013 28,473 (10,209) 189,277
Capital expenditures 22,170 4,066 1,122 27,358 Depreciation and amortization 31,882 6,428 563 38,873 Identifiable assets 1,178,118 260,212 33,366 1,471,696
December 31, 2000Revenues from: Unaffiliated customers 629,967$ 519,911$ 42$ 1,149,920$ Intersegment sales 53,500 1,362 (54,862) -
Total revenues 683,467 521,273 (54,820) 1,149,920
Operating income (loss) 60,992 (2) 12,884 (25,420) 48,456 (2)
Capital expenditures 14,960 7,387 2,214 24,561 Depreciation and amortization 28,712 5,985 337 35,034 Identifiable assets 1,001,391 223,973 53,530 1,278,894
December 31, 1999Revenues from: Unaffiliated customers 429,968$ 409,680$ -$ 839,648$ Intersegment sales 30,053 674 (30,727) -
Total revenues 460,021 410,354 (30,727) 839,648 Operating income (loss) 23,552 (5,959) (16,268) 1,325
Capital expenditures 7,472 9,968 107 17,547 Depreciation and amortization 24,964 4,269 334 29,567 Identifiable assets 772,305 197,918 35,492 1,005,715
(1) Operating loss of Corporate includes a special charge of $14,082 for 2000 related to the merger with IRI and $1,779 for 1999.
(2) Includes $15,684 of inventory write-offs related to the merger with IRI.
-40-
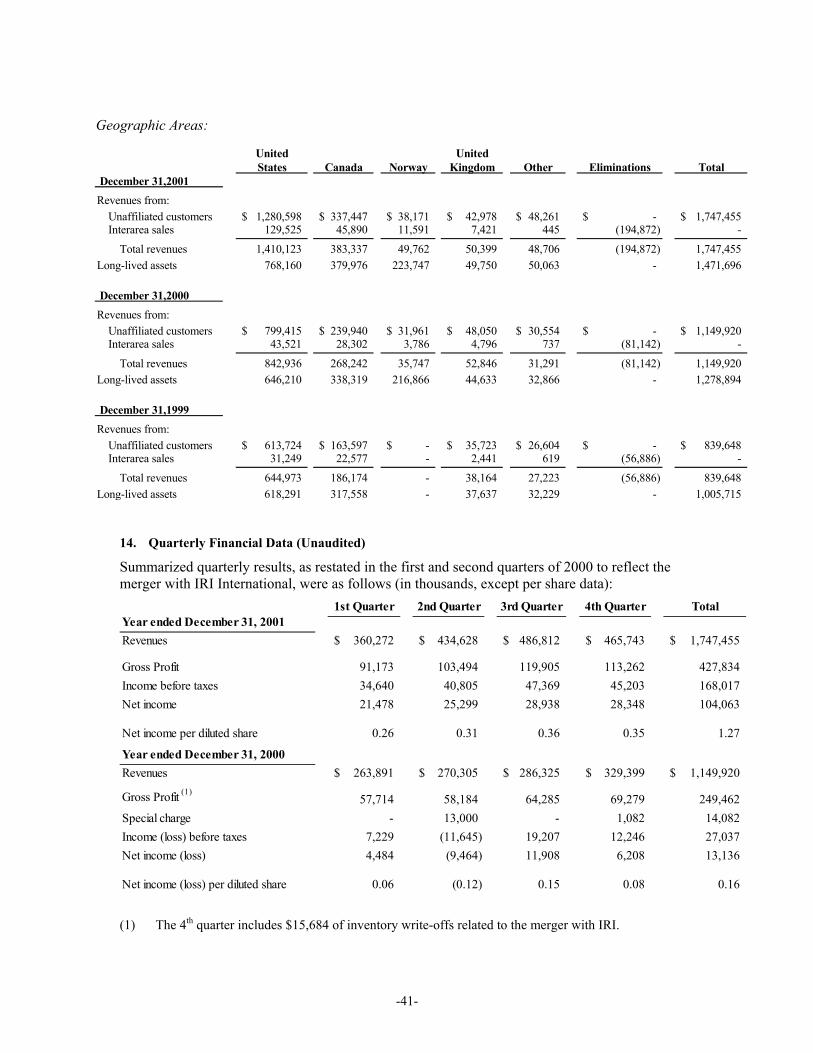
Geographic Areas:
United UnitedStates Canada Norway Kingdom Other Eliminations Total
December 31,2001Revenues from: Unaffiliated customers 1,280,598$ 337,447$ 38,171$ 42,978$ 48,261$ -$ 1,747,455$ Interarea sales 129,525 45,890 11,591 7,421 445 (194,872) -
Total revenues 1,410,123 383,337 49,762 50,399 48,706 (194,872) 1,747,455 Long-lived assets 768,160 379,976 223,747 49,750 50,063 - 1,471,696
December 31,2000Revenues from: Unaffiliated customers 799,415$ 239,940$ 31,961$ 48,050$ 30,554$ -$ 1,149,920$ Interarea sales 43,521 28,302 3,786 4,796 737 (81,142) -
Total revenues 842,936 268,242 35,747 52,846 31,291 (81,142) 1,149,920 Long-lived assets 646,210 338,319 216,866 44,633 32,866 - 1,278,894
December 31,1999Revenues from: Unaffiliated customers 613,724$ 163,597$ -$ 35,723$ 26,604$ -$ 839,648$ Interarea sales 31,249 22,577 - 2,441 619 (56,886) -
Total revenues 644,973 186,174 - 38,164 27,223 (56,886) 839,648 Long-lived assets 618,291 317,558 - 37,637 32,229 - 1,005,715
14. Quarterly Financial Data (Unaudited)
Summarized quarterly results, as restated in the first and second quarters of 2000 to reflect the merger with IRI International, were as follows (in thousands, except per share data):
1st Quarter 2nd Quarter 3rd Quarter 4th Quarter TotalYear ended December 31, 2001Revenues 360,272$ 434,628$ 486,812$ 465,743$ 1,747,455$
Gross Profit 91,173 103,494 119,905 113,262 Income before taxes 34,640 40,805 47,369 45,203 168,017 Net income 21,478 25,299 28,938 28,348 104,063
Net income per diluted share 0.26 0.31 0.36 0.35 1.27
Year ended December 31, 2000Revenues 263,891$ 270,305$ 286,325$ 329,399$ 1,149,920$
Gross Profit (1)57,714 58,184 64,285 69,279 249,462
Special charge - 13,000 - 1,082 14,082 Income (loss) before taxes 7,229 (11,645) 19,207 12,246 27,037 Net income (loss) 4,484 (9,464) 11,908 6,208 13,136
Net income (loss) per diluted share 0.06 (0.12) 0.15 0.08 0.16
427,834
(1) The 4th quarter includes $15,684 of inventory write-offs related to the merger with IRI.
-41-