Embed Size (px)
Citation preview

STRATEGIC TRANSFORMATIONInvesting For Growth
Annual Report and Form 10-K
2011

Scalable Storage
In Scalable Storage, we see significant future opportunity with our new portfolio of appliances designed specifically for the storage needs of small and medium businesses. These businesses are looking for storage solutions that help lower costs, meet compliance requirements, and protect and retrieve business data.
In 2011, we made two exciting acquisitions to advance our Scalable Storage area. First, we acquired assets of ProStor Systems, adding the InfiniVault™ data archive appliance and related technologies to our portfolio. We later acquired Nine Technology’s Data Deduplication engine, a key software technology platform that will provide further differentiation and cloud connectivity for our new line of storage appliances.
Audio and Video Information (AVI)
In AVI, we continue our focus on differentiated products. We recognize that the increase of digital information in all forms — documents, photos, music, and video — creates new opportunities for consumers to store, protect, and connect with their digital content.
In 2011, we invested in advanced audio and wireless technologies that we are applying across our line of Memorex, TDK Life on Record, and XtremeMac products. Our global retail placements are strong, our brands are well regarded, and our products are unique. We expect to continue this positive momentum with our AVI product line.
LOOKING FORWARD
We are pleased with the significant progress we have made on our strategic transformation.
We will continue to invest in key technologies to build out our businesses, add important new skills to our organization, and bring differentiated products to market. Our global team is committed to our new strategy, and excited by the opportunities that it offers.
We look forward to sharing our continued progress with you in the quarters ahead.
Sincerely,
Imation is in the midst of an exciting strategic transformation. We are investing in Secure and Scalable Storage and in Audio and Video Information (AVI) products as we execute a new strategy designed to return the company to long-term growth and improved operating margins.
OUR STRATEGY
In early 2011, we outlined our new strategic direction in a two-year plan. Our path forward leverages Imation’s deep core and leadership positions in data storage, while building a platform for growth in Secure and Scalable Storage and AVI.
Imation’s strategy is focused on growth in new, higher-margin product categories that address the world’s need to store, protect, and connect digital content. We intend to build a successful company, investing in Secure Storage to protect both business and personal data, in Scalable Storage for small and medium businesses, and in differentiated AVI products. We also look forward to maintaining global share leadership in our traditional storage categories of optical disc and magnetic tape.
2011 FINANCIAL RECAP
Imation’s 2011 revenues were $1.29 billion, reflecting the expected decline in traditional storage and our decision to exit certain lower-margin products. We were very pleased with our gross margin performance throughout the year, reflecting our ongoing transition to more differentiated products. Operating loss for the year was $33.1 million (GAAP), and excluding special charges* of $34.2 million, we had operating income of $1.1 million. We have a strong financial position, ending the year with $223 million in cash and no long-term debt.
EXECUTING ON OUR TRANSFORMATION
Secure Storage
We have launched a new mobile security business with key technology differentiators and a robust product portfolio. Our direction is to add security features such as encryption, authentication, and central management of devices. These additional security features help businesses, governments, and consumers protect their data from loss or theft.
In 2011, we made several key acquisitions in the security area, including the assets of ENCRYPTX and MXI Security, and the hardware business of IronKey. These acquisitions brought new technology and skills that are enabling Imation to offer a leading portfolio of mobile data security solutions.
DEAR FELLOW IMATION SHAREHOLDER,
L. White Matthews, IIINon-ExecutiveChairman of the Board
Mark E. LucasPresident andChief Executive Officer
*Special charges include restructuring and other ($21.5 million), litigation settlement ($2.0 million), goodwill impairment ($1.6 million) and inventory writedowns ($9.1 million).
UNITED STATESSECURITIES AND EXCHANGE COMMISSION
Washington, D.C. 20549
Form 10-K(Mark One)
Í ANNUAL REPORT PURSUANT TO SECTION 13 OR 15(d) OF THE SECURITIES EXCHANGE ACT OF 1934For the fiscal year ended December 31, 2011
or
‘ TRANSITION REPORT PURSUANT TO SECTION 13 OR 15(d) OF THE SECURITIES EXCHANGE ACT OF 1934For the transition period from to
Commission file number: 1-14310
IMATION CORP.(Exact name of registrant as specified in its charter)
Delaware 41-1838504(State or other jurisdiction ofincorporation or organization)
(I.R.S. EmployerIdentification No.)
1 Imation WayOakdale, Minnesota 55128
(Address of principal executive offices) (Zip Code)
(651) 704-4000(Registrant’s telephone number, including area code)
Securities registered pursuant to Section 12(b) of the Act:Title of each class Name of each exchange on which registered
Common Stock, $.01 per share New York Stock Exchange, Inc.;Chicago Stock Exchange, Incorporated
Preferred Stock Purchase Rights New York Stock Exchange, Inc.;Chicago Stock Exchange, Incorporated
Securities registered pursuant to Section 12(g) of the Act: None
Indicate by check mark if the registrant is a well-known seasoned issuer, as defined in Rule 405 of the Securities Act. Yes ‘ No Í
Indicate by check mark if the registrant is not required to file reports pursuant to Section 13 or Section 15(d) of the Act. Yes ‘ No Í
Indicate by check mark whether the registrant (1) has filed all reports required to be filed by Section 13 or Section 15(d) of the Securities Exchange Act of1934 during the preceding 12 months (or for such shorter period that the registrant was required to file such reports), and (2) has been subject to such filingrequirements for the past 90 days. Yes Í No ‘
Indicate by check mark whether the registrant has submitted electronically and posted on its corporate Web site, if any, every Interactive Data File requiredto be submitted and posted pursuant to Rule 405 of Regulation S-T during the preceding 12 months (or for such shorter period that the registrant was required tosubmit and post such files). Yes Í No ‘
Indicate by check mark if disclosure of delinquent filers pursuant to Item 405 of Regulation S-K is not contained herein, and will not be contained, to the best ofregistrant’s knowledge, in definitive proxy or information statements incorporated by reference in Part III of this Form 10-K or any amendment to this Form 10-K. Í
Indicate by check mark whether the registrant is a large accelerated filer, an accelerated filer, a non-accelerated filer, or a smaller reporting company. See thedefinitions of “large accelerated filer,” “accelerated filer” and “smaller reporting company” in Rule 12b-2 of the Exchange Act (check one).
Large accelerated filer ‘ Accelerated filer Í Non-accelerated filer ‘ Smaller reporting company ‘(Do not check if a smaller reporting company)
Indicate by check mark whether the registrant is a shell company (as defined in Rule 12b-2 of the Exchange Act). Yes ‘ No Í
Aggregate market value of voting and non-voting stock of the registrant held by non-affiliates of the registrant, based on the closing price of $9.44 asreported on the New York Stock Exchange on June 30, 2011, was $355.5 million.
The number of shares outstanding of the registrant’s common stock on February 22, 2012 was 38,316,993.DOCUMENTS INCORPORATED BY REFERENCE
Selected portions of registrant’s Proxy Statement for registrant’s 2012 Annual Meeting are incorporated by reference into Part III.
IMATION CORP.
FORM 10-K
FOR THE YEAR ENDED DECEMBER 31, 2011
TABLE OF CONTENTS
Page
PART I
ITEM 1 BUSINESS 2
ITEM 1A RISK FACTORS 9
ITEM 1B UNRESOLVED STAFF COMMENTS 14
ITEM 2 PROPERTIES 14
ITEM 3 LEGAL PROCEEDINGS 14
ITEM 4 MINE SAFETY DISCLOSURE 15
PART II
ITEM 5 MARKET FOR REGISTRANT’S COMMON EQUITY, RELATED STOCKHOLDER MATTERS AND
ISSUER PURCHASES OF EQUITY SECURITIES 16
ITEM 6 SELECTED FINANCIAL DATA 18
ITEM 7 MANAGEMENT’S DISCUSSION AND ANALYSIS OF FINANCIAL CONDITION AND RESULTS OF
OPERATIONS 19
ITEM 7A QUANTITATIVE AND QUALITATIVE DISCLOSURES ABOUT MARKET RISK 40
ITEM 8 FINANCIAL STATEMENTS AND SUPPLEMENTARY DATA 41
ITEM 9 CHANGES IN AND DISAGREEMENTS WITH ACCOUNTANTS ON ACCOUNTING AND FINANCIAL
DISCLOSURE 92
ITEM 9A CONTROLS AND PROCEDURES 92
ITEM 9B OTHER INFORMATION 92
PART III
ITEM 10 DIRECTORS, EXECUTIVE OFFICERS AND CORPORATE GOVERNANCE 93
ITEM 11 EXECUTIVE COMPENSATION 94
ITEM 12 SECURITY OWNERSHIP OF CERTAIN BENEFICIAL OWNERS AND MANAGEMENT AND RELATED
STOCKHOLDER MATTERS 94
ITEM 13 CERTAIN RELATIONSHIPS AND RELATED TRANSACTIONS, AND DIRECTOR INDEPENDENCE 94
ITEM 14 PRINCIPAL ACCOUNTANT FEES AND SERVICES 94
PART IV
ITEM 15 EXHIBITS AND FINANCIAL STATEMENT SCHEDULES 95
SIGNATURES 100
1

PART I
Item 1. Business.
General
Imation Corp., a Delaware corporation, is a global scalable storage and data security company. Our portfolio includestiered storage and security offerings for business and products designed to manage audio and video information in the home.Imation reaches customers in more than 100 countries through a global distribution network. As used herein, the terms“Imation,” “Company,” “we,” “us,” or “our” mean Imation Corp. and its subsidiaries unless the context indicates otherwise.
In July 1996, Imation was established as a manufacturer of magnetic tape products under the Imation brand, sold tocommercial end users through multiple distribution channels. We then expanded our business into other removable datastorage media such as optical media, flash and solid state drives, and removable and external hard disk drives. In 2006, weacquired substantially all of the assets of Memorex International Inc. (Memorex), followed by the acquisition of the TDKRecording Media business (TDK Life on Record) in 2007. In 2007, we also acquired certain assets of Memcorp, Inc. andMemcorp Asia Limited (together Memcorp) used in or relating to the sourcing and sale of consumer electronic products,principally under the Memorex brand name. This acquisition established our foundation in audio and video consumerelectronic products. In 2008, we expanded our presence in consumer electronic products with the acquisition of certain assetsof Xtreme Accessories, LLC (XtremeMac), a maker of accessories for Apple consumer electronics products. In 2011, welaunched our strategy to grow in the secure and scalable storage markets and create a global leadership position in high-security data storage and device management with the acquisitions of the Encryptx security solutions for removable storagedevices and removable storage media from BeCompliant Corporation, the secure data storage hardware business of IronKeySystems, Inc. (IronKey) and the portable security solutions and technologies of MXI Security from Memory ExpertsInternational, Inc.
Our global brand portfolio includes the Imation™ brand, the Memorex™ brand, the XtremeMac™ and MXI Security™brands. Imation is also the exclusive licensee of the TDK Life on Record™ brand, one of the world’s leading recording mediabrands, and the IronKey brand.
Our Products
We have three major product categories: traditional storage, secure and scalable storage, and audio and videoinformation.
Traditional Storage
Traditional storage products include optical media products, magnetic tape media products and other traditional storagemedia products.
Our optical media products consist of CDs, DVDs and Blu-ray recordable media. We have the leading global marketshare for recordable optical media however the overall market for CDs and DVDs is declining as digital streaming, hard diskand flash media replace optical media in some applications such as music and video recording. We sell high capacity Blu-raydiscs which are used primarily for recording high-definition video content. Our recordable optical media products are soldthrough a variety of retail and commercial distribution channels and sourced from manufacturers primarily in Taiwan andIndia. Optical storage capacities range from 650 megabyte CD-R (recordable) and CD-RW (rewritable) optical discs to 9.4gigabyte (GB) double-sided DVD optical discs and Blu-ray discs with 25GB to 100GB of capacity. Our optical media is soldthroughout the world under brands we own or control, including Imation, Memorex and TDK Life on Record, and under adistribution agreement for the Hewlett Packard brand.
Our magnetic tape media products are used for back-up, business and operational continuity planning, disasterrecovery, near-line data storage and retrieval and for cost-effective mass and archival storage. Capacity of our tape productsrange from less than 10GB up to 3.0 terabytes (TB) per cartridge. We enjoy a leading market share, a significant intellectual
2

property portfolio, a solid industry reputation, and strong relationships with key original equipment manufacturers (OEMs).Some of our legacy tape formats are proprietary or semi-proprietary and have higher gross profit margins thannon-proprietary products. Our magnetic tape products are sold throughout the world under various brands.
Other traditional storage products include primarily optical drives and audio and video tape media.
Secure and Scalable Storage
Secure storage products and software include USB flash drives and external hard drives designed to meet the moststringent security standards to protect data at rest with Federal Information Processing Standard (FIPS) validation, passwordand biometric authentication, including biometric USB drives, encrypted and biometric hard disk drives, secure portabledesktop solutions, and software solutions. Flash media products with security features provide margins significantly higherthan traditional flash media without data security. These products are sold throughout the world under the ImationDefender™, MXI Security and IronKey brands. We also sell standard USB flash drives and external hard disk drivesthroughout the world under our Imation, Memorex and TDK Life on Record brands. We source these products frommanufacturers primarily in Asia and the United States and sell them through a variety of retail and commercial distributionchannels around the world. USB flash drives have capacities ranging from 1GB up to 64GB and capacities continue toincrease as new products are introduced. External hard disk drives have capacities ranging from 250 GB to 5 TB. Scalablestorage products include data protection appliances such as DataGuard network attached storage backup appliances andInfiniVault™ active archive appliances. The Imation RDX™ removable hard disk cartridge is a high-capacity, rugged andremovable 2.5-inch hard disk drive cartridge with 160GB to 1TB capacities.
Audio and Video Information
Our audio and video information products include Apple iPad®, iPod® and iPhone® accessories, headphones, CDplayers, alarm clocks, portable boom boxes, MP3 players, and speakers sold under the Memorex, TDK Life on Record andXtremeMac brands. The portfolio continues to evolve with consumer demand and with development of our brands. We designproducts to meet user needs and source these products from manufacturers throughout Asia.
The table below describes our revenue by product category:
Years Ended December 31,
2011 2010 2009
Revenue% ofTotal Revenue
% ofTotal Revenue
% ofTotal
(Dollars in millions)
Traditional storageOptical products . . . . . . . . . . . . . . . . . . . . . . . $ 511.9 39.6% $ 619.3 42.4% $ 738.0 44.8%Magnetic products . . . . . . . . . . . . . . . . . . . . . 327.4 25.4% 347.8 23.8% 406.0 24.6%Other traditional storage . . . . . . . . . . . . . . . . . 47.7 3.7% 62.8 4.3% 77.7 4.7%
Total traditional storage . . . . . . . . . . . . . . . . 887.0 68.7% 1,029.9 70.5% 1,221.7 74.1%Secure and scalable storage . . . . . . . . . . . . . . . . 210.1 16.3% 207.5 14.2% 165.4 10.0%Audio and video information . . . . . . . . . . . . . . . . 193.3 15.0% 223.5 15.3% 262.4 15.9%
Total . . . . . . . . . . . . . . . . . . . . . . . . . . . . . . . . $1,290.4 $1,460.9 $1,649.5
Our Brands
The Imation brand has been at the forefront of data storage and digital technology since inception. Imation brandproducts include magnetic tape media, recordable CDs, DVDs and Blu-ray discs, flash products and hard disk drives. TheImation brand includes the DataGuard Data Protection Appliances, InfiniVault™ Storage appliances and RDX® Removablehard disk storage systems. Imation Defender products include secure storage flash drives and external hard drives. Imationbrand products are sold throughout the world and target the commercial user and individual consumer. Imation Defenderproducts include secure storage flash drives and external hard drives.
3

The Memorex brand was acquired by Imation in 2006. Memorex brand products include recordable CDs, DVDs andBlu-ray discs, CD players, alarm clocks, portable boom boxes, iPod and iPhone accessories, headphones and speakers.Memorex brand products are sold primarily in North America.
The rights to the TDK Life on Record brand were acquired by Imation in 2007 under an exclusive long-term license fromTDK Corporation (TDK). TDK Life on Record brand products include recordable CDs, DVDs and Blu-ray discs, flash drives,tape cartridges, headphones and computer speakers which are sold to commercial customers and individual consumers. TDKLife on Record brand products are sold throughout the world.
The XtremeMac brand was acquired by Imation in 2008. XtremeMac brand products include cases, chargers and audiosolutions to protect, power and play Apple iPad, iPod, iPhone and other devices. XtremeMac products are developed forApple enthusiasts and are available worldwide.
The MXI Security brand was acquired by Imation in 2011 and includes secure storage flash drives and external harddrives, as well as software solutions to help manage portable security devices on the network.
During 2011 Imation and IronKey entered into a strategic partnership whereby Imation received an exclusive licensefrom IronKey for its secure storage management software and service, and a license to use the IronKey brand for securestorage products.
Business Segments
Our business is organized, managed and internally and externally reported as segments differentiated by the regionalmarkets we serve: Americas, Europe, North Asia and South Asia. Each of these geographic segments has responsibility forselling generally all of our product lines.
The Americas segment, our largest segment by revenue, includes North America, Central America and South America.The United States represents the largest current market for our products. It has a great variety and sophistication ofdistribution channels including value-added resellers, OEMs, retail outlets, mass merchants and on-line resellers. Thecountries in South America and the Caribbean represent potential growth markets with increasing penetration of InformationTechnology (IT) in the commercial and consumer markets.
The Europe segment includes Europe and parts of Africa. Western Europe exhibits traits similar to North America interms of overall breadth of product offerings, high penetration of end user markets and breadth and sophistication ofdistribution channels. Emerging markets in Eastern Europe represent potential growth markets for our products as IT enduser and consumer markets grow.
North Asia is our second largest segment by revenue, and includes Japan, China, Hong Kong, Korea and Taiwan.Japan is the single largest market in the segment and is similar to North America and Western Europe in terms of overallpenetration of IT into the market, though its distribution channels are less developed than those of other regions.
The South Asia segment includes Australia, Singapore, India, the Middle East and parts of Africa. It is similar to North Americaand Western Europe in terms of overall penetration of IT into the market, though its distribution channels are less developed.
4

The chart below breaks out our 2011 revenue by segment:
Europe19%
Americas46% North Asia
24%
South Asia11%
See Note 14 to the Consolidated Financial Statements for further information regarding our business segments andgeographic information.
Customers, Marketing and Distribution
Our products are sold to businesses and individual consumers. No one customer constituted 10 percent or more of ourrevenue in 2011, 2010 or 2009.
Our products are sold through a combination of distributors, wholesalers, value-added resellers, OEMs and retail outlets.Worldwide, approximately 51 percent of our 2011 revenue came from distributors, 46 percent came from the retail channeland 3 percent came from OEMs. We maintain a company sales force and a network of distributors and value-added resellers(VARs) to generate sales of our products around the world.
Market and Competition
The global market for our products is highly competitive and characterized by continuing changes in technology,frequent new product introductions and performance improvements, diverse distribution channels, aggressive marketing andpricing practices and ongoing variable price erosion. Competition is based on a multitude of factors, including product design,brand strength, distribution presence and capability, channel knowledge and expertise, geographic availability, breadth ofproduct line, product cost, media capacity, access speed and performance, durability, reliability, scalability and compatibility.
Our primary competitors in recordable optical media include Maxell, JVC, Sony and Verbatim brands. Our primarycompetitors in magnetic tape media include Fuji, Sony, Maxell and HP brands. Our primary competitors in secure andscalable storage products include SanDisk, Lexar, PNY and Kingston brands in flash media, Western Digital and Seagate inexternal and removable hard drives, and Tandberg Data and Overland Data in scalable data appliances. These companiesgenerally compete with us in all our business segments. While the parent companies that own these brands compete in theremovable data storage media market, most generally do not report financial results for these business lines on a stand-alonebasis. Therefore, it is difficult for us to estimate our relative market share. However, we use a variety of industry sources toestimate market size and share and we estimate we held a leading market share in optical and magnetic products with morethan one-third of those markets.
The demand for data storage capacity is expected to grow. The magnetic tape industry has consistently addressed thegrowth in demand for storage capacity with new non-proprietary storage formats with higher capacity cartridges resulting in alower cost per gigabyte which results in a decline in actual number of units of media shipped. In addition, these
5
non-proprietary formats experience greater price competition than proprietary formats. The market for non-proprietary formattape continues to gain share against proprietary formats and is typically more competitive with lower gross margins thanproprietary formats. In addition, lower cost disk and storage optimization strategies such as virtual tape and de-duplicationremain a factor in certain sectors of the market. As a result, we expect our tape revenue to continue to be under pressure asthese factors contribute over time to a shift in the mix of total tape revenue toward lower margin open formats.
The secure flash media market is growing as more companies and individuals become victims of cyber-attacks and asdata becomes more mobile. The traditional flash media market is competitive with highly variable price swings driven byNAND chip manufacturing volume and capacity as well as market demand in the much larger embedded flash market.Focused and efficient sourcing and distribution, as well as diligent management of inventories, channel placement andpromotional activity are critical elements for success in this market.
Audio and video information products are sold based on a variety of factors, including brand and reputation, productfeatures and designs, distribution coverage, innovation and price. Our competitors in the audio and video information productsmarket consist of numerous manufacturers and brands. The global audio and video information products market is a verylarge and highly diverse market in terms of competitors, channels and products. Our current product offerings focus on asubset of this market.
Product Sourcing
We contract for the manufacturing of all products we sell and distribute from a variety of third-party providers thatmanufacture predominately outside the United States. We seek to differentiate our products through unique designs, productpositioning, packaging, merchandising and branding.
On July 31, 2007, we acquired substantially all of the assets relating to the marketing, distribution, sales, customerservice and support of removable recording media products, accessory products and ancillary products being sold under theTDK Life on Record brand name (TDK Recording Media), from TDK, including the assets or capital stock of TDK’s operatingsubsidiaries engaged in the TDK Recording Media business. In conjunction with our acquisition of the TDK Recording Mediabusiness we also entered into a supply agreement, dated July 31, 2007, with TDK (Supply Agreement), which allows us topurchase a limited number of LTO Tape media and Blu-ray removable recording media products and accessory products forresale under the TDK Life on Record brand name. TDK agreed to supply such products on competitive terms, and TDKagreed not to sell any such products to third parties for resale under the TDK Life on Record brand name during the term ofthe trademark license agreements. The trademark license agreements will continue unless terminated by TDK no earlier than2032 (2017 in the case of headphones and speakers) or earlier in the event of a material breach of the trademark licenseagreement, specific change of control events or default by Imation. The Supply Agreement will continue until the later of 2012or for so long as TDK manufactures any of the products. TDK owned approximately 20 percent of outstanding Imation Corp.common stock on December 31, 2011.
On January 13, 2011, our Board of Directors approved a restructuring plan to discontinue tape coating operations at ourWeatherford, Oklahoma facility by April 2011. We signed a strategic agreement with TDK to jointly develop and manufacturemagnetic tape technologies. Under the agreement, we collaborate on the research and development of future tape formats inboth companies’ research centers in the U.S. and Japan, and consolidated tape coating operations to the TDK GroupYamanashi manufacturing facility.
We also make significant purchases of finished and semi-finished products, including optical media and USB flashdrives, certain finished tape and tape cartridges and consumer electronic products, primarily from Asian suppliers. For ouroptical media, we procure our supply primarily from three companies. If supply were disrupted from any of our primarysuppliers, our business could be negatively impacted. The loss of these certain suppliers could have a material adverseimpact on the business. We view the sourcing and distribution of finished goods as a critical success factor for these products.Therefore, we seek to establish and maintain strategic sourcing relationships with several key suppliers.
6

Research, Development and Engineering
Development and timely introduction of new products are important to our future success. We maintain an advancedresearch facility and invest resources in researching, developing and engineering potential new products and improvingexisting products. Our research and development expense was $21.0 million, $16.4 million and $20.4 million for 2011, 2010and 2009, respectively. We invest in research, development, engineering and capital equipment in order to remaincompetitive and successfully develop and source products that meet market requirements. We are also engaged both on ourown and in collaboration with other organizations in certain research programs related to future generations of magnetic tapethat do not yet have specific commercialized products in the market. We also invest in research related to our strategic focuson data protection and management, storage hardware, audio and video information products, removable hard drive systemsand related software. As noted above, we signed a strategic agreement with TDK to jointly develop and manufacturemagnetic tape technologies. Under the agreement, we collaborate on the research and development of future tape formats inboth companies’ research centers in the U.S. and Japan.
Intellectual Property
We rely on a combination of patent, trademark and copyright laws, trade secret protection and confidentiality and licenseagreements to protect the intellectual property rights related to our products. We register our patents and trademarks in theUnited States and in a number of other countries where we do business. United States patents are currently granted for aterm of 20 years from the date a patent application is filed. United States trademark registrations are for a term of ten yearsand are renewable every ten years as long as the trademarks are used in the regular course of trade. Pursuant to trademarklicense agreements between TDK and Imation and its affiliates, TDK granted Imation and its affiliates a long-term exclusivelicense to use the TDK Life on Record brand for current and future recordable magnetic, optical, flash media and accessoryproducts globally. The trademark license agreements will continue unless terminated by TDK no earlier than 2032 (2017 inthe case of headphones and speakers) or earlier in the event of a material breach of the trademark license agreement,specific change of control events or default by Imation.
During 2011, we were awarded 14 United States patents and at the end of the year held over 249 patents in the UnitedStates.
Employees
At December 31, 2011, we employed approximately 1,130 people worldwide, with approximately 470 employed in theUnited States and approximately 660 employed internationally.
Environmental Matters
Our operations are subject to a wide range of federal, state and local environmental laws. Environmental remediationcosts are accrued when a probable liability has been determined and the amount of such liability has been reasonablyestimated. These accruals are reviewed periodically as remediation and investigatory activities proceed and are adjustedaccordingly. Compliance with environmental regulations has not had a material adverse effect on our financial results. As ofDecember 31, 2011, we had environmental-related accruals totaling $0.5 million and we had minor remedial activitiesunderway at one of our prior manufacturing facilities. We believe that our accruals are adequate, though there can be noassurance that the amount of expense relating to remedial actions and compliance with applicable environmental laws will notexceed the amounts reflected in our accruals.
International Operations
Approximately 60 percent of our total 2011 revenue came from sales outside the United States, primarily throughsubsidiaries, sales offices, distributors, VARs and relationships with OEMs throughout Europe, Asia, Latin America andCanada. We do not own manufacturing facilities outside of the United States. See Note 14 to the Consolidated FinancialStatements for further information by geographic region.
7

As discussed under Risk Factors in Item 1A of this Form 10-K, our international operations are subject to various risksand uncertainties that are not present in our domestic operations.
Executive Officers of the Registrant
Information regarding our executive officers as of February 28, 2012 is set forth below:
Gregory J. Bosler, age 50, is Senior Vice President of Global Business Management, a position he has held sinceOctober 2010. From May 2010 to October 2010 he was Vice President, Americas, and from January 2009 to April 2010 hewas Vice President, Americas Consumer. Prior to joining Imation in January 2009, he was with TTE Corporation, a globalconsumer electronics manufacturer, where he held the position of Executive Vice President, North America Business Centerfrom August 2004 until February 2008. Prior to that, Mr. Bosler held a series of senior sales and general managementpositions at Thomson Inc., Pioneer Electronics (USA) and Duracell Inc.
John P. Breedlove, age 54, is Vice President, General Counsel and Corporate Secretary, a position he has held sinceMay 2011. Prior to joining Imation, from July 1993 to May 2011, he served as Vice President of business law and variousother positions at Supervalu Inc., a $40 billion food wholesale and retail company and logistics provider. Prior to that role,Mr. Breedlove was an attorney with the law offices of Dorsey & Whitney, Minneapolis, and Graham & James, San Francisco.
Dr. Subodh Kulkarni, age 47, is Senior Vice President, OEM and Emerging Business, and Chief Technology Officer, aposition he has held since August 2009. He has been with Imation since spin-off in July 1996. Prior to assuming his currentresponsibilities, he served as Vice President, Global Commercial Business, R&D and Manufacturing, from August 2007 toAugust 2009. He was appointed Vice President, R&D and Manufacturing in October 2006, Vice President of R&D in March2006, Executive Director of R&D in 2004 and has held various positions leading the R&D organization.
Mark E. Lucas, age 57, is President, Chief Executive Officer and a member of our Board of Directors, positions he hasheld since May 2010. He was President and Chief Operating Officer from March 2009 through May 2010. Prior to joiningImation, he served as Chairman and Chief Executive Officer of Geneva Watch Group, a privately held company that is aleading designer, manufacturer and distributor of watches under both its own brand and licensed brands, from November2005 to August 2008. Prior to that role, Mr. Lucas served as President and Chief Executive Officer of Altec LansingTechnologies, a manufacturer of consumer audio equipment from June 2001 to August 2005. Mr. Lucas was a member of theBoard of Directors of Imation from April 2007 to February 2009 and served as a member of the Company’s Audit and FinanceCommittee and Compensation Committee. Mr. Lucas resigned from the Board of Directors of Imation in connection with hisappointment as President and Chief Operating Officer. Mr. Lucas’ resignation from the Board of Directors was a requirementof his employment.
Scott J. Robinson, age 45, is Vice President, Corporate Controller and Chief Accounting Officer. He was appointedVice President in February 2010 and was appointed Corporate Controller and Chief Accounting Officer in August 2007. Hejoined Imation in March 2004 and held the position of Chief Accountant until August 2007. Prior to joining Imation, he was atDeluxe Corporation, where he held the position of Assistant Corporate Controller from August 2002 to March 2004 and heldthe position of Director of Internal Audit from June 1999 to August 2002.
Paul R. Zeller, age 51, is Senior Vice President and Chief Financial Officer, a position he has held since May 2009. Hewas Vice President and Chief Financial Officer from August 2004 to May 2009. He has been with Imation since spin-off andheld the position of Corporate Controller from May 1998 until August 2004. Prior to joining Imation, he held several accountingmanagement positions with 3M Company.
Availability of SEC Reports
The Securities and Exchange Commission (SEC) maintains a website that contains reports, proxy and informationstatements, and other information regarding issuers, including Imation Corp., that file electronically with the SEC. The publiccan obtain any documents that we file with the SEC at www.sec.gov. We file annual reports, quarterly reports, proxystatements and other documents with the SEC under the Securities Exchange Act of 1934 (Exchange Act). The public may
8

read and copy any materials that we file with the SEC at the SEC’s Public Reference Room at 100 F Street, N.E.,Washington, D.C. 20549. The public may obtain information on the operation of the Public Reference Room by calling theSEC at 1-800-SEC-0330.
We also make available free of charge through our website (www.imation.com) our Annual Report on Form 10-K,Quarterly Reports on Form 10-Q, Current Reports on Form 8-K, and, if applicable, amendments to those reports filed orfurnished pursuant to the Exchange Act as soon as reasonably practicable after we electronically file such material with, orfurnish it to, the SEC.
Item 1A. Risk Factors
Our business faces many risks. Any of the risks discussed below, or elsewhere in this Form 10-K or our other SECfilings, could have a material impact on our business, financial condition or results of operations.
We must make strategic decisions from time to time as to the products and technologies in which we invest
and if we choose the wrong product or technology, our financial results could be adversely impacted. In February2011 we announced our transformation strategy, which includes improving gross margins, exiting low margin products,introducing new products in secure and scalable storage, and organic and inorganic growth. These strategies requiresignificant investment. If we are not successful in implementing these strategies or if we choose the wrong focus for ourstrategies, our financial results could be negatively impacted.
The future revenue growth of our business depends in part on the development and performance of our new
products. We have experienced revenue declines over prior year in 2011 and 2010 of $170.5 million or 11.7 percent and$188.6 million or 11.4 percent, respectively. Historically, magnetic and optical products have provided the majority of ourrevenues. While demand for data capacity is expected to increase, removable magnetic media market size is expected todecrease in terms of revenue. Demand for optical media products is decreasing due to a shift in demand to the use of datastreaming and other media for storing data. We expect new product revenue growth to eventually offset the product revenuedeclines of our products in mature markets so that our total company revenue will grow. If we are not successful in growingnew product revenues, our financial results could be negatively impacted.
Our security products must provide appropriate levels of security to adequately store and protect our
customers’ data. Many of our secure storage products include software and hardware security such as userauthentication, data encryption, and portable digital identities which are designed to prevent digital security breaches. If ourproducts do not provide adequate security and that security is compromised, our customer(s) could be subject to decliningproduct sales, which could subject us to litigation and loss of reputation. As an outcome our financial results could benegatively impacted.
Because of the rapid technology changes in our industry, we may not be able to compete if we cannot quickly
develop, source, introduce and deliver differentiating and innovative products. We operate in a highly competitiveenvironment against competitors who are both larger and smaller than us in terms of resources and market share. Ourindustry is characterized by rapid technological change and new product introductions. In these highly competitive andchanging markets, our success will depend, to a significant extent, on our ability to continue to develop and introducedifferentiated and innovative products cost-effectively and on a timely basis. The success of our offerings is dependent onseveral factors including our differentiation from competitive offerings, timing of new product introductions, effectiveness ofmarketing programs and maintaining low manufacturing, sourcing and supply chain costs. No assurance can be given withregard to our ability to anticipate and react to changes in market requirements, actions of competitors or the pace anddirection of technology changes.
We may be dependent on third parties for new product introductions or technologies in order to introduce our
own new products. We are dependent in some cases upon various third parties for the introduction and acceptance ofnew products, the timing of which is out of our control. In addition, there can be no assurance that we will maintain existingrelationships or forge new OEM relationships. There can also be no assurance that we will continue to have access tosignificant proprietary technologies through internal development and licensing arrangements with third parties, or that we will
9

continue to have access to new competitive technologies that may be required to introduce new products. If we are notsuccessful in maintaining and developing new relationships with OEMs or obtaining rights to use competitive technologies, wemay become less competitive in certain markets.
We use third-party contract manufacturing services and supplier-provided parts, components, and
sub-systems in our businesses and significant shortages, supplier capacity constraints, supplier production
disruptions or price increases could increase our operating costs and adversely impact the competitive positions of
our products. Our reliance on suppliers and third-party contract manufacturing to secure raw materials, parts andcomponents used in our products exposes us to volatility in the prices and availability of these materials. In some instances,we depend upon a single source of supply, manufacturing or assembly or participate in commodity markets that may besubject to allocations by suppliers. A disruption in deliveries from our suppliers or third-party contract manufacturers, suppliercapacity constraints, supplier and third-party contract manufacturer production disruptions, price increases or decreasedavailability of raw materials or commodities could have an adverse effect on our ability to meet our commitments to customersor increase our operating costs. Additionally, we may experience changes in the supply and cost of raw materials and keycomponents of our products resulting from the effects of natural disasters including the October 2011 flooding in Thailand,which itself did not have a material impact. We believe that our supply management and production practices are based on anappropriate balancing of the foreseeable risks and the costs of alternative practices. No assurances can be given thatacceptable cost levels will continue in the future. In addition, some critical raw materials and key components have a limitednumber of suppliers. If we cannot obtain those raw materials or critical components from the suppliers, we will not be able toproduce certain products.
Negative or uncertain global economic conditions could result in a decrease in our sales and revenue and an
increase in our operating costs, which could adversely affect our business and operating results. Negative oruncertain global economic conditions could cause many of our direct and indirect customers to delay or reduce theirpurchases of our products. Further, many of our customers in OEM, distribution and retail channels rely on credit financing inorder to purchase our products. Additionally, some of our suppliers pay us quarterly or annual rebates based on the amount ofpurchases we make from them. If negative conditions in the global credit markets prevent our customers’ access to credit,product orders in these channels may decrease, which could result in lower revenue. Likewise, our suppliers may facechallenges in obtaining credit, in selling their products or otherwise in operating their businesses. These actions could result inreductions in our revenue, increased price competition and increased operating costs, which could adversely affect ourbusiness, results of operations and financial condition.
We may engage in business combinations that are dilutive to existing shareholders, result in unanticipated
accounting charges or otherwise harm our results of operations, and result in difficulties in assimilating and
integrating the operations, personnel, technologies, products and information systems of acquired companies or
businesses. We continually evaluate and explore strategic opportunities as they arise, including business combinations,strategic partnerships, collaborations, capital investments and the purchase, licensing or sale of assets. Acquisitions madeentirely or partially for cash would reduce our cash reserves. We use financial assumptions and forecasts to determine thenegotiated price we are willing to pay for an acquisition. If those financial assumptions and/or forecasts are not accurate, theprice we pay may be too high, resulting in an inefficient use of cash and future goodwill impairment.
No assurance can be given that our previous or future acquisitions will be successful and will not materially adverselyaffect our business, operating results, or financial condition. Failure to manage and successfully integrate acquisitions couldmaterially harm our business and operating results. Even when an acquired company has already developed and marketedproducts, there can be no assurance that such products will be successful after the closing and will not cannibalize sales ofour existing products, that product enhancements will be made in a timely fashion or that pre-acquisition due diligence willhave identified all possible issues that might arise with respect to such company. Failed business combinations, or the effortsto create a business combination, can also result in litigation.
Acquisitions may require significant capital infusions, typically entail many risks and could result in difficulties inassimilating and integrating the operations, personnel, technologies, products and information systems of acquiredcompanies. We may experience delays in the timing and successful integration of acquired technologies and productdevelopment, unanticipated costs and expenditures, changing relationships with customers, suppliers and strategic partners,
10

or contractual, intellectual property or employment issues. In addition, key personnel of an acquired company may decide notto work for us. The acquisition of another company or its products and technologies may also result in our entering into abusiness market in which we have little or no prior experience. These challenges could disrupt our ongoing business, distractour management and employees, harm our reputation, subject us to an increased risk of intellectual property and otherlitigation and increase our expenses. These challenges are magnified as the size of the acquisition increases, and we cannotassure that we will realize the intended benefits of any acquisition. Acquisitions may require large one-time charges and canresult in contingent liabilities, adverse tax consequences, substantial depreciation or deferred compensation charges,amortization of identifiable purchased intangible assets or impairment of goodwill, any of which could have a material adverseeffect on our business, financial condition or results of operations. If we acquire a business while our market value remainslower than our book value, which was the case as of December 31, 2011 and 2010, accounting rules may require us toexpense any goodwill associated with a new acquisition.
If our goodwill or any goodwill that we acquire becomes impaired, it may adversely affect our operating
results. As a result of our MXI Security and IronKey acquisitions, we have $31.3 million of goodwill as of December 31,2011. These acquisitions are part of our Mobile Security reporting unit. Based on our 2011 annual impairment test performedas of November 30, 2011, we determined that the fair value of the reporting unit exceeded its carrying amount by $13.0million or 25 percent. Our estimate of fair value was determined based on a discounted cash flow model. Growth rates forsales and profits are determined using inputs from our annual long-range planning process. We also make estimates ofdiscount rates, perpetuity growth assumptions, market comparables and other factors.
Negative or uncertain global economic conditions could result in circumstances, such as a sustained decline in our stockprice and market capitalization or a decrease in the forecasted cash flows of our Mobile Security reporting unit such that theyare insufficient, indicating that the carrying value of our acquired goodwill may be impaired. If we are required to record asignificant charge to earnings in our Consolidated Financial Statements because an impairment of our acquired goodwill isdetermined, our results of operations will be adversely affected.
Volatility of demand and seasonality may result in our inability to accurately forecast our product purchase
requirements. Sales of some of our products are subject to seasonality. For example, sales have typically increased in thefourth quarter of each fiscal year, sometimes followed by significant declines in the first quarter of the following fiscal year.This seasonality makes it more difficult for us to forecast our business, especially in the volatile current global economicenvironment and its corresponding change in consumer confidence, which may impact typical seasonal trends. If ourforecasts are inaccurate, we may lose market share due to product shortages or procure excess inventory or inappropriatelyincrease or decrease our operating expenses, any of which could harm our business, financial condition and results ofoperations. This seasonality also may lead to the need for significant working capital investments in receivables and inventoryand our need to build inventory levels in advance of our most active selling seasons.
Our international operations subject us to economic risk as our results of operations may be adversely affected
by changes in political, economic and other conditions and foreign currency fluctuations. We conduct our businesson a global basis, with 60 percent of our 2011 revenue derived from operations outside of the United States. Our internationaloperations may be subject to various risks which are not present in domestic operations, including political and economicinstability, terrorist activity, the possibility of expropriation, trade tariffs or embargoes, unfavorable tax laws, restrictions onroyalties, dividend and currency remittances, changes in foreign laws and regulations, requirements for governmentalapprovals for new ventures and local participation in operations such as local equity ownership and workers’ councils. Inaddition, our business and financial results are affected by fluctuations in world financial markets. Changes in local andregional economic conditions, including fluctuations in exchange rates, may affect product demand in our non-U.S. operationsand export markets. Foreign currency fluctuations can also affect reported profits of our non-U.S. operations wheretransactions are generally denominated in local currencies. A recession in any of our regional business segments includingthe potential recession in Europe might affect product demand and cause fluctuations in exchange rates. In addition, currencyfluctuations may affect the prices we pay suppliers for materials used in our products. Our financial statements aredenominated in U.S. dollars. Accordingly, fluctuations in exchange rates may give rise to translation gains or losses whenfinancial statements of non-U.S. operating units are translated into U.S. dollars. Given that the majority of our revenues arenon-U.S. based, a strengthening of the U.S. dollar against other major foreign currencies could adversely affect our results ofoperations. While these factors or the impact of these factors are difficult to predict, any one or more of them could adversely
11

affect our business, financial condition or operating results. Additionally, changes in European law or practice related to theimposition or collectability of optical levies could impact our operating results.
Significant changes in discount rates, rates of return on pension assets, mortality tables and other factors
could affect our future earnings, equity and pension funding requirements. Pension obligations and related costs aredetermined using actual investment results as well as actuarial valuations that involve several assumptions. Our fundingrequirements are based on these assumptions in addition to the performance of assets in the pension plans. The most criticalassumptions are the discount rate, the long-term expected return on assets and mortality. Some of these assumptions, suchas the discount rate, are largely outside of our control. Changes in these assumptions could affect our future earnings, equityand funding requirements.
We could incur asset impairment charges for intangible assets. We have $321.7 million of definite-livedintangible assets subject to amortization at December 31, 2011. We evaluate assets on our balance sheet, including suchintangible assets, whenever events or changes in circumstances indicate that their carrying value may not be recoverable. Wemonitor factors or indicators, such as unfavorable variances from forecasted cash flows, established business plans orvolatility inherent to external markets and industries, become apparent that would require an impairment test. While webelieve that the current carrying value of these assets is not impaired, materially different assumptions regarding futureperformance of our businesses, which in many cases require subjective judgments concerning estimates, could result insignificant impairment losses. The test for impairment requires a comparison of the carrying value of the asset or asset groupwith their estimated undiscounted future cash flows. If the carrying value of the asset or asset group is considered impaired,an impairment charge is recorded for the amount by which the carrying value of the asset or asset group exceeds its fairvalue. Due to additional losses, particularly in the U.S., such a test was completed as of December 31, 2011, and noimpairment was noted to exist.
Our results of operations include our determinations of the amount of taxes owed in the various tax
jurisdictions in which we operate and are subject to changes in tax laws and regulations, and to inspection by
various tax authorities. Changes in related interpretations and other tax guidance as well as inspections by tax authoritiescould materially impact our tax receivables and liabilities and our deferred tax assets and deferred tax liabilities. Additionally,in the ordinary course of business we are subject to examinations by tax authorities in multiple jurisdictions. In addition toongoing investigations, there could be additional investigations launched in the future by governmental authorities in variousjurisdictions and existing investigations could be expanded. While we believe we have adopted appropriate risk managementand compliance programs to address and reduce these risks, the global and diverse nature of our operations means thatthese risks will continue to exist and additional issues will arise from time to time. Our results may be affected by the outcomeof such proceedings and other contingencies that cannot be predicted with certainty.
Our success depends in part on our ability to obtain and protect our intellectual property rights and to defend
ourselves against intellectual property infringement claims of others. Claims may arise from time to time alleging thatwe infringe on the intellectual property rights of others. If we are not successful in defending ourselves against those claims,we could incur substantial costs in implementing remediation actions, such as redesigning our products or processes, payingfor license rights or paying to settle disputes. The related costs or the disruption to our operations could have a materialadverse effect on our results.
In addition, we utilize valuable non-patented technical know-how and trade secrets in our product development andmanufacturing operations. There can be no assurance that confidentiality agreements and other measures we utilize toprotect such proprietary information will be effective, that these agreements will not be breached or that our competitors willnot acquire the information as a result of or through independent development. We enforce our intellectual property rightsagainst others who infringe those rights.
Additionally, our audio and video information product category is subject to allegations of patent infringement by ourcompetitors as well as by non-practicing entities (NPEs), sometimes referred to as “patent trolls,” who may seek monetarysettlements from the U.S. consumer electronics industry.
12

Significant litigation matters could result in large costs. We are subject to various pending or threatened legalactions in the ordinary course of our business, especially regarding patents related to our data storage and audio and videoinformation products. We are generally indemnified by our suppliers; litigation, however, is always subject to manyuncertainties and outcomes that are not predictable. We cannot ascertain the ultimate aggregate amount of any monetaryliability or financial impact that may be incurred by us in litigation.
Changing laws and regulations have resulted in increased compliance costs for us, which could affect our
operating results. Changing laws, regulations and standards relating to corporate governance and public disclosure,including the Sarbanes-Oxley Act of 2002, the Dodd-Frank Wall Street Reform and Consumer Protection Act and newlyenacted SEC regulations have created additional compliance requirements. We are committed to maintaining high standardsof internal controls over financial reporting, corporate governance and public disclosure. As a result, we intend to continue toinvest appropriate resources as necessary to comply with evolving standards which may result in increased expenses. Lawsenacted that directly or indirectly affect our production, distribution, packaging, cost of raw materials, fuel, ingredients, andwater could impact our business and financial results.
We rely on our information systems to conduct our business, and failure to protect these systems against
security breaches could adversely affect our business and results of operations. Additionally, if these systems fail
or become unavailable for any significant period of time, our business could be harmed. The efficient operation ofour business is dependent on computer hardware and software systems. Information systems are vulnerable to securitybreach by computer hackers and cyber terrorists. We rely on industry accepted security measures and technology to securelymaintain confidential and proprietary information maintained on our information systems. However, these measures andtechnology may not adequately prevent security breaches. In addition, the unavailability of the information systems or failureof these systems to perform as anticipated for any reason could disrupt our business and could result in decreasedperformance and increased overhead costs, causing our business and results of operations to suffer. Any significantinterruption or failure of our information systems or any significant breach of security could adversely affect our business andresults of operations.
The market price of our common stock is volatile. The market price of our common stock has been, and maycontinue to be, volatile. Factors such as the following may significantly affect the market price of our common stock:
• actual or anticipated fluctuations in our operating results;
• announcements of technological innovations by us or our competitors which may decrease the volume andprofitability of sales of our existing products and increase the risk of inventory obsolescence;
• new products introduced by us or our competitors;
• periods of severe pricing pressures due to oversupply or price erosion resulting from competitive pressures orindustry consolidation;
• developments with respect to patents or proprietary rights;
• conditions and trends in the consumer electronics and data storage industries;
• contraction in our operating results or growth rates;
• changes in financial estimates by securities analysts relating specifically to us or the industries in which we participatein general; and
• macroeconomic conditions that affect the market generally.
In addition, general economic conditions may cause the stock market to experience extreme price and volumefluctuations from time to time that particularly affect the stock prices of many high technology companies. These fluctuationsoften appear to be unrelated to the operating performance of the companies.
If we are unable to attract and retain employees and key talent our business and financial results may be
materially impacted. We operate in a highly competitive market for employees with specialized skills, experience andindustry knowledge. No assurance can be given that we will be able to attract and retain employees and key talent.
13

Item 1B. Unresolved Staff Comments.
None.
Item 2. Properties
Our worldwide headquarters is located in Oakdale, Minnesota, in the United States of America. Our principal facilities,and the functions at such facilities, are listed below for each reporting segment. Our facilities are in good operating conditionsuitable for their respective uses and are adequate for our current needs.
Facility Function
Americas
Oakdale, Minnesota (owned) . . . . . . . . . . . . . . . . . . . . . . . . . Sales/Administrative/Laboratory facility/Corporateheadquarters
Southaven, Mississippi (leased*) . . . . . . . . . . . . . . . . . . . . . . Distribution CenterEurope
Hoofddorp, Netherlands (leased) . . . . . . . . . . . . . . . . . . . . . . Sales/Administrative/European regional headquartersNeuss, Germany (leased) . . . . . . . . . . . . . . . . . . . . . . . . . . . . Sales/Administrative/Distribution CenterNorth Asia
Tokyo, Japan (leased) . . . . . . . . . . . . . . . . . . . . . . . . . . . . . . Sales/Administrative/North Asia regional headquartersSouth Asia
Kings Park, Australia (leased) . . . . . . . . . . . . . . . . . . . . . . . . . Sales/Administrative/Distribution CenterSingapore (leased) . . . . . . . . . . . . . . . . . . . . . . . . . . . . . . . . . South Asia regional headquarters
* Our Southaven lease was transferred on to our logistics provider on January 1, 2012.
Item 3. Legal Proceedings.
In the normal course of business, we periodically enter into agreements that incorporate general indemnificationlanguage. Performance under these indemnities would generally be triggered by a breach of terms of the contract or by athird-party claim. There has historically been no material losses related to such indemnifications. In accordance withaccounting principles generally accepted in the United States of America, we record a liability in our Consolidated FinancialStatements for these actions when a loss is known or considered probable and the amount can be reasonably estimated.
We are the subject of various pending or threatened legal actions in the ordinary course of our business. All suchmatters are subject to many uncertainties and outcomes that are not predictable with assurance. Additionally, our audio andvideo information business is subject to allegations of patent infringement by our competitors as well as by non-practicingentities (NPEs), sometimes referred to as “patent trolls,” who may seek monetary settlements from us, our competitors,suppliers and resellers. Consequently, as of December 31, 2011, we are unable to ascertain the ultimate aggregate amount ofany monetary liability or financial impact that we may incur with respect to these matters. While these matters could materiallyaffect operating results depending upon the final resolution in future periods, it is our opinion that after final disposition, anymonetary liability beyond that provided in the Consolidated Balance Sheet as of December 31, 2011 would not be material toour Consolidated Financial Statements.
On June 14, 2011, Trek 2000 International Ltd and certain of its affiliates (“Trek”) filed a complaint asking theInternational Trade Commission (“ITC”) to commence an investigation against us and various others. Trek alleges thatImation and others unlawfully import and sell into the United States certain universal serial bus (“USB”) portable storagedevices that allegedly infringe several of Trek’s U.S. patents. Trek seeks to block the importation of the allegedly offendingproducts into the United States. On August 15, 2011, we filed an answer to Trek’s complaint, denying liability and assertingthat Trek fails to meet certain requirements to bring its complaint to the ITC. This investigation is in the discovery phase. Thehearing is scheduled for May 9-16, 2012; the initial determination is expected July 19, 2012; and the target date for thecompletion of this investigation is November 19, 2012. Although this proceeding is subject to the uncertainties inherent in thelitigation process, based on the information presently available to us, management does not expect that the ultimateresolution of this action will have a material adverse effect on our financial condition, results of operations or cash flows.
14

On January 11, 2011, we signed a patent cross-license agreement with SanDisk to settle two patent cases filed bySanDisk in Federal District Court against our flash memory products, including USB drives and solid state disk (SSD) drives.Under the terms of the cross-license, we will pay SanDisk royalties on certain flash memory products that were previously notlicensed. The specific terms of the cross-license are confidential. The cross-license agreement required us to make aone-time payment of $2.6 million in 2011, which was included in litigation settlement expense in the Consolidated Statementsof Operations during 2010.
On June 19, 2009 Advanced Research Corp. (ARC) sued Imation in Ramsey County District Court for breach of contractrelating to a supply agreement under which we purchased our requirements for magnetic heads to write servo patterns onmagnetic tape prior to sale of the finished cartridges, requesting the court to order that Imation pay damages and return thepurchased heads to ARC. In September 2011 we agreed to a settlement by which we agreed to pay ARC $2.0 million, whichwas included in litigation settlement expense in the Consolidated Statements of Operations during 2011.
See Note 15 to the Consolidated Financial Statements for further information.
Item 4. Mine Safety Disclosures.
Not Applicable.
15

PART II
Item 5. Market for Registrant’s Common Equity, Related Stockholder Matters and Issuer Purchases of Equity
Securities.
(a) — (b)
As of February 22, 2012, there were 38,316,993 shares of our common stock, $0.01 par value (common stock),outstanding and held by 21,070 shareholders of record. Our common stock is listed on the New York Stock Exchange and theChicago Stock Exchange under the symbol “IMN.” No dividends were declared or paid during 2011 or 2010.
Unregistered Sales of Equity Securities
On November 21, 2011, Imation Corp. entered into an agreement to purchase certain intellectual property with NineTechnology, LLC (Nine Technology). A portion of the consideration paid to Nine Technology consisted of 75,534 commonshares, $0.01 par value, issued by Imation Corp. The shares were not registered under the Securities Act of 1933, asamended (the Act) by reason of the exemption under Section 4(2) of the Act. The shares were issued in a private transactionto one entity which represented its investment intent with respect to the shares. Nine Technology must hold the sharesindefinitely unless they are registered with the Securities and Exchange Commission and qualified by state authorities, or anexemption from such registration and qualification requirement is available.
The following table sets forth, for the periods indicated, the high and low sales prices of common stock as reported onthe New York Stock Exchange.
2011 Sales Prices 2010 Sales Prices
High Low High Low
First quarter . . . . . . . . . . . . . . . . . . . . . . . . . . . . . . . . . . . . $12.36 $9.81 $11.81 $8.46Second quarter . . . . . . . . . . . . . . . . . . . . . . . . . . . . . . . . . . $11.97 $8.50 $12.59 $8.56Third quarter . . . . . . . . . . . . . . . . . . . . . . . . . . . . . . . . . . . . $ 9.98 $6.64 $10.72 $8.41Fourth quarter . . . . . . . . . . . . . . . . . . . . . . . . . . . . . . . . . . . $ 8.00 $5.40 $11.12 $9.14
(c) Issuer Purchases of Equity Securities
No shares were repurchased by the Company during the fourth quarter of 2011. Employees tendered 1,804 shares topay taxes related to awards vesting during the quarter.
16

Stock Performance Graph
The graph and table below compare the cumulative total shareholder return on our common stock for the last five fiscalyears with the cumulative total return of the S&P MidCap 400 Index and ArcaEx Tech 100 Index, formerly known as thePacific Stock Exchange High Technology Index, over the same period. The graph and table assume the investment of $100on December 31, 2006 in each of our common stock, the S&P MidCap 400 Index and the ArcaEx Tech 100 Index andreinvestment of all dividends.
12/31/201112/31/201012/31/200912/31/200812/31/200712/31/2006
Imation Corp.
S&P Midcap 400 Index
ArcaEx Tech 100 Index
$-
$50
$100
$150
$200
$250
Shareholder Return Performance
(Total Return Index) 12/31/2006 12/31/2007 12/31/2008 12/31/2009 12/31/2010 12/31/2011
Imation Corp. . . . . . . . . . . . . . . . . . . . . . . . . $100.00 45.67 29.89 19.20 22.71 12.62
S&P Midcap 400 Index . . . . . . . . . . . . . . . . . $100.00 106.69 66.92 90.34 112.79 109.30
ArcaEx Tech 100 Index . . . . . . . . . . . . . . . . . $100.00 107.26 69.73 99.76 123.91 122.98
The stock performance graph shall not be deemed soliciting material or to be filed with the Securities and ExchangeCommission or subject to Regulation 14A or 14C under the Exchange Act or to the liabilities of Section 18 of the ExchangeAct, nor shall it be incorporated by reference into any past or future filing under the Securities Act of 1933 or the ExchangeAct, except to the extent we specifically request that it be treated as soliciting material or specifically incorporate it byreference into a filing under the Securities Act of 1933 or the Exchange Act.
17

Item 6. Selected Financial Data.*
2011 2010 2009 2008 2007
(Dollars in millions, except per share data)
Statement of Operations Data:
Net revenue . . . . . . . . . . . . . . . . . . . . . . . . . . . . . . . . . . . $1,290.4 $1,460.9 $1,649.5 $1,981.0 $1,895.8Gross profit . . . . . . . . . . . . . . . . . . . . . . . . . . . . . . . . . . . . 216.7 226.4 264.0 338.8 345.8Selling, general and administrative . . . . . . . . . . . . . . . . . . . 203.7 202.5 229.7 287.6 218.9Research and development . . . . . . . . . . . . . . . . . . . . . . . . 21.0 16.4 20.4 23.6 38.2Litigation settlement . . . . . . . . . . . . . . . . . . . . . . . . . . . . . 2.0 2.6 49.0 — —Goodwill impairment . . . . . . . . . . . . . . . . . . . . . . . . . . . . . 1.6 23.5 — 32.4 94.1Restructuring and other . . . . . . . . . . . . . . . . . . . . . . . . . . . 21.5 51.1 26.6 28.9 33.3Operating loss . . . . . . . . . . . . . . . . . . . . . . . . . . . . . . . . . . (33.1) (69.7) (61.7) (33.7) (38.7)Loss from continuing operations . . . . . . . . . . . . . . . . . . . . (46.7) (158.3) (44.0) (37.8) (56.4)Net loss . . . . . . . . . . . . . . . . . . . . . . . . . . . . . . . . . . . . . . (46.7) (158.5) (42.2) (33.3) (50.4)Loss per common share from continuing operations:
Basic . . . . . . . . . . . . . . . . . . . . . . . . . . . . . . . . . . . . . . (1.24) (4.19) (1.17) (1.01) (1.52)Diluted . . . . . . . . . . . . . . . . . . . . . . . . . . . . . . . . . . . . . (1.24) (4.19) (1.17) (1.01) (1.52)
Net loss per common share:Basic . . . . . . . . . . . . . . . . . . . . . . . . . . . . . . . . . . . . . . (1.24) (4.19) (1.13) (0.89) (1.36)Diluted . . . . . . . . . . . . . . . . . . . . . . . . . . . . . . . . . . . . . (1.24) (4.19) (1.13) (0.89) (1.36)
Balance Sheet Data:
Cash and cash equivalents . . . . . . . . . . . . . . . . . . . . . . . . $ 223.1 $ 304.9 $ 163.4 $ 96.6 $ 135.5Accounts receivable, net . . . . . . . . . . . . . . . . . . . . . . . . . . 234.9 258.8 314.9 378.3 507.1Inventories . . . . . . . . . . . . . . . . . . . . . . . . . . . . . . . . . . . . 208.8 203.3 235.7 363.2 366.1Property, plant and equipment, net . . . . . . . . . . . . . . . . . . 55.4 66.9 109.8 122.4 171.5Intangible assets, net . . . . . . . . . . . . . . . . . . . . . . . . . . . . 321.7 320.4 337.3 357.0 371.0Total assets . . . . . . . . . . . . . . . . . . . . . . . . . . . . . . . . . . . 1,149.3 1,251.0 1,393.8 1,540.0 1,751.0Accounts payable . . . . . . . . . . . . . . . . . . . . . . . . . . . . . . . 205.2 219.2 201.4 296.1 350.1Long-term debt . . . . . . . . . . . . . . . . . . . . . . . . . . . . . . . . . — — — — 21.3Total liabilities . . . . . . . . . . . . . . . . . . . . . . . . . . . . . . . . . . 425.6 469.3 466.6 595.4 697.2Total shareholders’ equity . . . . . . . . . . . . . . . . . . . . . . . . . 723.7 781.7 927.2 944.6 1,053.8
Other Information:
Current ratio . . . . . . . . . . . . . . . . . . . . . . . . . . . . . . . . . . . 2.0 2.1 2.4 2.0 1.8Days sales outstanding(1) . . . . . . . . . . . . . . . . . . . . . . . . . 58 57 60 63 64Days of inventory supply(1) . . . . . . . . . . . . . . . . . . . . . . . . 85 69 75 112 94Return on average assets(2) . . . . . . . . . . . . . . . . . . . . . . . (3.9)% (11.8)% (3.1)% (2.4)% (3.6)%Return on average equity(2) . . . . . . . . . . . . . . . . . . . . . . . (6.2)% (18.0)% (4.8)% (3.7)% (5.4)%Dividends per common share . . . . . . . . . . . . . . . . . . . . . . $ — $ — $ — $ 0.56 $ 0.62Capital expenditures . . . . . . . . . . . . . . . . . . . . . . . . . . . . . $ 7.3 $ 8.3 $ 11.0 $ 13.6 $ 14.5Number of employees . . . . . . . . . . . . . . . . . . . . . . . . . . . . 1,130 1,115 1,210 1,570 2,250
* See Item 7. Management’s Discussion and Analysis of Financial Condition and Results of Operations, for additionalinformation regarding the financial information presented in this table. The acquisitions of TDK Recording Media onJuly 31, 2007 and Memcorp, Inc. on July 9, 2007 may affect the comparability of financial information in this table. SeeNote 4 to the Consolidated Financial Statements for further information.
(1) These operational measures, which we regularly use, are provided to assist in the investor’s further understanding of ouroperations. Days sales outstanding is calculated using the count-back method, which calculates the number of days ofmost recent revenue that are reflected in the net accounts receivable balance. Days of inventory supply is calculatedusing the current period inventory balance divided by an estimate of the inventoriable portion of cost of goods soldexpressed in days.
(2) Return percentages are calculated using (loss) income from continuing operations.
18

Item 7. Management’s Discussion and Analysis of Financial Condition and Results of Operations.
The following discussion is intended to be read in conjunction with Item 1. Business, the Consolidated FinancialStatements and related notes that appear elsewhere in this Annual Report on Form 10-K.
Overview
Imation is a global scalable storage and data security company. Our portfolio includes tiered storage and securityofferings for business and products designed to manage audio and video information in the home. Imation reaches customersin more than 100 countries through a global distribution network and well recognized brands.
Optical media product revenue comprised 39.6 percent, 42.4 percent and 44.8 percent of our total consolidated revenuein 2011, 2010 and 2009, respectively. The optical media market continues to contract as consumers adopt alternatives suchas digital streaming, hard disk and flash media, resulting in decreasing revenues. We believe we are generally maintainingour worldwide market share. During 2010 and 2011 we saw significant price increases for the raw materials required toproduce optical media, particularly polycarbonate which is made out of oil and silver. These raw materials price increaseswere passed on to us in 2011 by our suppliers, mitigated partially by successfully negotiated price increases with ourcustomers, causing gross margin pressures. The contracting optical media market size and increasing raw materials pricesimpacted all of our segments resulting in decreasing revenues and gross margins. During 2011, we reversed $7.8 million ofaccruals related to prior year European optical media copyright levies payable for which we considered payment remote. SeeNote 2 to the Consolidated Financial Statements for further information regarding levies.
Magnetic product revenue comprised 25.4 percent, 23.8 percent and 24.6 percent of our total consolidated revenue in2011, 2010 and 2009, respectively. While we expect the demand for data storage capacity to increase, advances intechnology allow increasingly more data to be stored on a single unit of magnetic tape and thus over the recent past themarket has declined each year. While the market is getting smaller, we believe we are maintaining our market share in all ofour regional business segments. During 2011, in order to gain efficiencies and reduce manufacturing costs, we discontinuedtape coating operations at our Weatherford, Oklahoma facility. We signed a strategic agreement with TDK Corporation tojointly develop and manufacture magnetic tape technologies. Under the agreement, we are collaborating on the research anddevelopment of future tape formats in both companies’ research centers in the United States and Japan and we consolidatedtape coating operations to the TDK Yamanashi manufacturing facility. The contracting magnetic tape market size impacted allof our segments resulting in decreasing revenues, and we expect these trends to continue into 2012.
Other traditional storage product revenue comprised 3.7 percent, 4.3 percent and 4.7 percent of our total consolidatedrevenue in 2011, 2010 and 2009, respectively. We expect the demand for audio video tape and optical drives, the productswhich comprise the majority of the revenue in this category, to decrease similarly to our magnetic products.
Secure and scalable storage product revenue comprised 16.3 percent, 14.2 percent and 10.0 percent of our totalconsolidated revenue in 2011, 2010 and 2009, respectively. During 2011 we committed substantial investment in secure andscalable storage products to complement our Defender line of secure storage products with the acquisitions of the Encryptxsecurity solutions for removable storage devices and removable storage media from BeCompliant Corporation, the securedata storage hardware business of IronKey Systems, Inc. (IronKey), the portable security solutions and technologies of MXISecurity from Memory Experts International, Inc. and certain intellectual assets of Prostor Systems and Nine Technology.With these investments, we have expanded our offerings of encrypted and biometric USB drives, encrypted and biometrichard disk drives, secure portable desktop solutions, and software solutions, including products which contain various securityfeatures such as password authentication, encryption and remote manageability. With our acquisition of ProStor Systems’InfiniVault data-archive appliance and related technologies for our scalable storage portfolio, we’ve added a new portfolio ofdata protection and data archive appliances designed to help data-intensive, compliance-driven small and medium sizedbusinesses retain, retrieve and recover valuable data. We are moving beyond removable storage offerings to a portfolio ofappliances designed specifically for the storage needs of small and medium businesses. We anticipate revenue from secureand scalable storage products to grow during 2012 in all of our regional business segments.
Audio and video information product revenue comprised 15.0 percent, 15.3 percent and 15.9 percent of our totalconsolidated revenue in 2011, 2010 and 2009, respectively. During 2011, we rationalized our product lines by exiting certain
19

products which were not achieving adequate gross margins, such as TVs, video players and gaming. Our new audio andvideo information products are designed to provide consumers with a unique, high quality user experience. We anticipaterevenue from audio and video information products to grow as a result of new product offerings during 2012 in all of ourregional business segments.
Overall, we expect revenue in 2012 to decline when compared with 2011. As we exit 2012 and enter 2013, we target theCompany to return to growth. Further, we target long-term future revenue growth rates of 3 to 5 percent. We are targeting2012 revenue from our recent acquisitions of approximately $45 million to $50 million. We are targeting gross margins movingtowards 20 percent in 2012 with long-term future gross margins of approximately 20 percent or more. We estimate researchand development expenses in 2012 increasing to approximately 2 percent of revenue. We project selling, general andadministrative expenses in 2012 of approximately 17.5 percent of revenue and then decreasing over time as revenues grow.We anticipate operating income excluding restructuring and other charges to be flat in 2012 compared to 2011, with long-termannual operating income targeted at 4 to 5 percent of revenue.
We target revenue from traditional storage products in the future to decline at an annual rate of 14 to 18 percent withstabilizing gross margins. We target revenue from secure and scalable storage products to grow 15 to 30 percent due toleveraging our recently completed acquisitions in mobile security and scalable storage and the developing RDX market. Wetarget revenue from audio and video information products in the future to grow 5 to 15 percent with gross margins increasingovertime to approximately 20 percent. We are targeting future gross margins over time to improve to in excess of 20 percent.
Factors Affecting Comparability of our Financial Results
Discontinued Operations
As a result of the wind down of our Global Data Media (GDM) business joint venture during 2009 it was determined thatthe GDM operations and cash flows would be eliminated from our ongoing operations and that we would not have anysignificant continuing involvement in the operations of GDM after the exit from the joint venture. As a result, these operationsare presented in our Consolidated Financial Statements as discontinued operations for all periods presented. GDM was ajoint venture created to market optical media products with Moser Baer India Ltd. (MBI). Since the inception of the jointventure in 2003, we held a 51 percent ownership in the business. As the controlling shareholder, we have historicallyconsolidated the results of the joint venture in our financial statements. GDM was included partially in the Americas andEurope segments. Operating results of the GDM business joint venture are included as discontinued operations for thecurrent period and all prior periods presented in the Consolidated Statements of Operations. See Note 4 to the ConsolidatedFinancial Statements for further information.
Executive Summary
2011 Consolidated Results of Operations
• Revenue of $1,290.4 million in 2011 was down 11.7 percent compared with revenue of $1,460.9 million in 2010.
• Gross margin of 16.8 percent in 2011 was up from 15.5 percent in 2010.
• Selling, general and administrative expense was $203.7 million in 2011, up $1.2 million, compared with $202.5million in 2010.
• Research and development expense was $21.0 million in 2011, up $4.6 million, compared with $16.4 million in2010.
• We recorded non-cash goodwill impairment charges of $1.6 million in 2011 and $23.5 million in 2010.
• Restructuring and other expense was $21.5 million in 2011 and $51.1 million in 2010, primarily related topreviously announced restructuring programs.
• Other (income) expense was $9.8 million in 2011, up $3.1 million, compared with $6.7 million in 2010.
• Operating loss was $33.1 million in 2011 compared with $69.7 million in 2010.
• The income tax provision was $3.8 million in 2011 compared with $81.9 million in 2010.
20

2011 Cash Flow/Financial Condition
• Cash and cash equivalents totaled $223.1 million as of December 31, 2011 compared with $304.9 million as ofDecember 31, 2010.
• Cash flow used in operating activities was $16.3 million for 2011 compared with cash flow provided by operatingactivities of $151.4 million for 2010.
Results of Operations
Net Revenue
Years Ended December 31, Percent Change
2011 2010 2009 2011 vs. 2010 2010 vs. 2009
(In millions)
Net revenue . . . . . . . . . . . . . . . . . . . . . . . . . . . . . . . . . . . $1,290.4 $1,460.9 $1,649.5 (11.7)% (11.4)%
Our worldwide revenue in 2011 decreased compared with 2010 due to declines in traditional storage products of$142.9 million, including $107.4 million from optical products and $20.4 million from magnetic products, as well as$30.2 million from audio and video information products driven by planned rationalization of our video products, offset partiallyby increases in secure and scalable storage products of $2.6 million. Revenue was positively impacted by foreign currencytranslation of four percent.
Our worldwide revenue in 2010 decreased compared with 2009 driven by declines in traditional storage products of$191.8 million, including $118.7 million from optical products and $58.2 million from magnetic products, as well as$38.9 million from audio and video information products driven in part by planned rationalization of our video products, offsetpartially by increases in secure and scalable storage products of $42.1 million.
Gross Profit
Years Ended December 31, Percent Change
2011 2010 2009 2011 vs. 2010 2010 vs. 2009
(In millions)
Gross profit . . . . . . . . . . . . . . . . . . . . . . . . . . . . . . . . . . . . $216.7 $226.4 $264.0 (4.3)% (14.2)%Gross margin . . . . . . . . . . . . . . . . . . . . . . . . . . . . . . . . . . 16.8% 15.5% 16.0%
Gross profit decreased in 2011 compared with 2010 due primarily to lower revenues from optical products and magneticproducts, as well as inventory write-offs of $9.1 million which were part of our restructuring programs, offset partially by highergross margins on all product categories. Optical gross profit was benefited by $7.8 million related to the reversal of Europeanlevies accrued in prior years and price increases which were partially offset by optical supplier price increases of $12.8 million.
Gross profit decreased in 2010 compared with 2009 due primarily to lower revenues from traditional storage productsand inventory write-offs of $14.2 million which were part of our 2011 manufacturing redesign restructuring plan, offset partiallyby gross profit increases in secure and scalable storage products of $9.5 million and audio and video information products of$4.2 million.
Total gross margins increased in 2011 compared with 2010 primarily due to the reversal of European levies accrued aswell as price increases, offset partially by optical supplier cost increases along with changes in product mix. Total grossmargins decreased in 2010 compared with 2009 primarily due to inventory write-offs which were part of our restructuring plan.
Selling, General and Administrative (SG&A)
Years Ended December 31, Percent Change
2011 2010 2009 2011 vs. 2010 2010 vs. 2009
(In millions)
Selling, general and administrative . . . . . . . . . . . . . . . . . . $203.7 $202.5 $229.7 0.6% (11.8)%As a percent of revenue . . . . . . . . . . . . . . . . . . . . . . . . 15.8% 13.9% 13.9%
21

SG&A expense was essentially flat in 2011 compared with 2010 and was impacted by lower compensation expense, thereversal of a bad debt reserve of $2.7 million and cost control actions, offset by additional ongoing SG&A expenses related to ouracquired businesses. This resulted in an increase in our SG&A expense as a percent of revenue in 2011 compared to 2010.
SG&A expense decreased in 2010 compared with 2009 due to lower legal expenses of $10.5 million related to thePhilips litigation settled in July 2009 as well as cost control actions. As a percentage of revenue, our SG&A remained flat in2010 compared with 2009.
Research and Development (R&D)
Years Ended December 31, Percent Change
2011 2010 2009 2011 vs. 2010 2010 vs. 2009
(In millions)
Research and development . . . . . . . . . . . . . . . . . . . . . . . . . . . . . . $21.0 $16.4 $20.4 28.0% (19.6)%As a percent of revenue . . . . . . . . . . . . . . . . . . . . . . . . . . . . . . . 1.6% 1.1% 1.2%
R&D expense increased in 2011 compared with 2010 due to our investment to support growth initiatives in secure andscalable storage products. During 2011 we refocused our R&D effort to invest in four core product technology areas: securestorage, scalable storage, wireless/connectivity and magnetic tape. This resulted in an increase in our R&D expense as apercent of revenue in 2011 compared with 2010.
R&D expense decreased in 2010 compared with 2009 due to cost savings from restructuring activities and cost controlactions. R&D expense as a percent of revenue in 2010 remained relatively flat compared with 2009.
Litigation Settlements
Years Ended December 31,
2011 2010 2009
(In millions)
Litigation settlements . . . . . . . . . . . . . . . . . . . . . . . . . . . . . . . . . . . . . . . . . . . . . . . . . . . . . . . . . . $2.0 $2.6 $49.0
A litigation settlement charge of $2.0 million was recognized in 2011. In September 2011 we entered into a settlementwith Advanced Research Corp. (ARC) under which we agreed to pay ARC $2.0 million to settle a dispute relating to a supplyagreement under which we purchased our requirements for magnetic heads to write servo patterns on magnetic tape prior tosale of the finished cartridges.
A litigation settlement charge of $2.6 million was recognized in 2010. On January 11, 2011, we signed a patent cross-license agreement with SanDisk to settle the two patent cases filed by SanDisk in Federal District Court against our flashmemory products, including USB drives and solid state disk (SSD) drives. Under the terms of the cross-license, we will paySanDisk royalties on certain flash memory products that were previously not licensed. The specific terms of the cross-licenseare confidential. The cross-license agreement required us to make a one-time payment of $2.6 million in 2011, which wasincluded in litigation settlement expense in the Consolidated Statements of Operations during 2010.
A litigation settlement charge of $49.0 million was recorded in 2009. We entered into a confidential settlementagreement ending all legal disputes with Philips Electronics N.V., U.S. Philips Corporation and North American PhilipsCorporation (collectively, Philips). We had been involved in a complex series of disputes in multiple jurisdictions regardingcross-licensing and patent infringement related to recordable optical media. The settlement provided resolution of all claimsand counterclaims filed by the parties without any finding or admission of liability or wrongdoing by any party. As a term of thesettlement, we agreed to pay Philips $53.0 million over a period of three years. Based on the present value of thesesettlement payments, we recorded a charge of $49.0 million in the second quarter of 2009. We made payments of $8.3million, $8.2 million and $20.0 million in 2011, 2010 and 2009, respectively. Interest accretion of $1.2 million, $1.5 million and$0.8 million was recorded in 2011, 2010 and 2009, respectively. The interest accretion is included in the interest expense onour Consolidated Statements of Operations.
22

See Note 15 to the Consolidated Financial Statements for further information.
Goodwill Impairment
Years Ended December 31,
2011 2010 2009
(In millions)
Goodwill impairment . . . . . . . . . . . . . . . . . . . . . . . . . . . . . . . . . . . . . . . . . . . . . . . . . . . . . . . . . $1.6 $23.5 $—
During 2011 we acquired substantially all of the assets of BeCompliant Corporation (doing business as Encryptx). Thepurchase price allocation resulted in goodwill of $1.6 million related to this acquisition, made up of expected strategicsynergies and intangible assets that do not qualify for separate recognition. The goodwill was allocated to our existingAmericas-Commercial reporting unit. Goodwill is considered impaired when its carrying amount exceeds its implied fair value.At the time of the acquisition the carrying amount of all of our reporting units significantly exceeded their fair value and weperformed an impairment test. Based on the goodwill test performed as of March 31, 2011, we determined that the carryingamount of the goodwill in the Americas-Commercial reporting unit, including the assets of Encryptx, exceeded the implied fairvalue and, therefore, the goodwill was fully impaired.
During 2010 we made certain changes to our business segments. As a result of the segment change in 2010, the$23.5 million of goodwill which was previously allocated to the Electronics Products segment was merged into the Americas-Consumer reporting unit. See Note 14 to the Consolidated Financial Statements for further information about the changes ofour segments in 2010. The Americas-Consumer reporting unit had a fair value that was significantly less than its carryingamount prior to the combination, which is a triggering event for an interim goodwill impairment test. Goodwill is consideredimpaired when its carrying amount exceeds its implied fair value. A two-step impairment test was performed to identify apotential impairment and measure an impairment loss to be recognized.
Based on the goodwill test performed in the second quarter of 2010, we determined that the carrying amount of thereporting unit significantly exceeded its fair value and that the $23.5 million of goodwill was fully impaired. See Note 6 to theConsolidated Financial Statements for further information about the goodwill impairment.
See Notes 2 and 6 to the Consolidated Financial Statements as well as Critical Accounting Policies and Estimates forfurther background and information on goodwill impairment.
Restructuring and Other
The components of our restructuring and other expense included in the Consolidated Statements of Operations were asfollows:
Years Ended December 31,
2011 2010 2009
(In millions)
RestructuringSeverance and severance related . . . . . . . . . . . . . . . . . . . . . . . . . . . . . . . . . . . . . . . . . . . . . $ 7.0 $13.0 $11.2Lease termination costs . . . . . . . . . . . . . . . . . . . . . . . . . . . . . . . . . . . . . . . . . . . . . . . . . . . . 3.3 1.7 0.7Other . . . . . . . . . . . . . . . . . . . . . . . . . . . . . . . . . . . . . . . . . . . . . . . . . . . . . . . . . . . . . . . . . . 1.1 — —
Total restructuring . . . . . . . . . . . . . . . . . . . . . . . . . . . . . . . . . . . . . . . . . . . . . . . . . . . . . . 11.4 14.7 11.9Pension settlement/curtailment . . . . . . . . . . . . . . . . . . . . . . . . . . . . . . . . . . . . . . . . . . . . . . . . . 2.5 2.8 11.7Asset impairments . . . . . . . . . . . . . . . . . . . . . . . . . . . . . . . . . . . . . . . . . . . . . . . . . . . . . . . . . . — 31.2 2.7Asset disposals . . . . . . . . . . . . . . . . . . . . . . . . . . . . . . . . . . . . . . . . . . . . . . . . . . . . . . . . . . . . 7.0 — —Acquisition and integration related costs . . . . . . . . . . . . . . . . . . . . . . . . . . . . . . . . . . . . . . . . . . 2.6 — —Other . . . . . . . . . . . . . . . . . . . . . . . . . . . . . . . . . . . . . . . . . . . . . . . . . . . . . . . . . . . . . . . . . . . . (2.0 ) 2.4 0.3
Total . . . . . . . . . . . . . . . . . . . . . . . . . . . . . . . . . . . . . . . . . . . . . . . . . . . . . . . . . . . . . . . . . . $21.5 $51.1 $26.6
23

2011 Manufacturing Redesign Restructuring Program
On January 13, 2011, the Board of Directors approved a 2011 manufacturing redesign restructuring program of up to$55 million to rationalize certain product lines and discontinue tape coating operations at our Weatherford, Oklahoma facilityby April 2011 and subsequently close the facility. We signed a strategic agreement with TDK to jointly develop andmanufacture magnetic tape technologies. Under the agreement, we are collaborating on the research and development offuture tape formats in both companies’ research centers in the U.S. and Japan and we consolidated tape coating operationsto the TDK Group Yamanashi manufacturing facility. We also recorded additional inventory write-offs related to this programdue to end of life. Since the inception of this program, we have recorded a total of $21.7 million of inventory write-offs, $31.2million of asset impairment charges, $3.2 million of severance and related expenses, $0.3 million for lease termination andmodification costs and $0.9 million of site clean-up expenses. Therefore this program is substantially complete.
During 2011 we recorded restructuring charges of $0.3 million for lease termination and modification costs and siteclean-up expenses of $0.9 million related to this program. We also recorded inventory write-offs of $7.5 million related to thisprogram, which are included in cost of goods sold on our Consolidated Statements of Operations.
During 2010 we recorded restructuring charges of $3.2 million for severance and related expenses and $31.2 million ofasset impairment charges primarily related to the Weatherford facility. We also recorded inventory write-offs of $14.2 millionrelated to this program, which are included in cost of goods sold on our Consolidated Statements of Operations. Although thisprogram was approved by the Board in 2011, these charges were recorded in 2010 as the charges were probable and wewere able to make a reasonable estimate of the liability.
2011 Corporate Strategy Restructuring Program
On January 31, 2011, the Board of Directors approved the 2011 corporate strategy restructuring program of up to $35million to rationalize certain product lines and increase efficiency and gain greater focus in support of our go-forward strategy.Major components of the program include charges associated with certain benefit plans, improvements to our global sourcingand distribution network and costs associated with both further rationalization of our product lines as well as evolving skill setsto align with our new strategy. Since the inception of this program, we have recorded a total of $10.4 million of severance andrelated expenses, $3.0 million of lease termination and modification costs, $1.6 million of inventory write-offs, $0.2 million ofother charges and $0.3 million related to a pension curtailment charge.
During 2011 we recorded restructuring charges of $7.0 million for severance and related expenses, $3.0 million for leasetermination and modification costs and $0.2 million of other charges. In addition, we also recorded inventory write-offs of $1.6million related to the planned rationalization of certain product lines as part of this program, which are included in cost ofgoods sold in our Consolidated Statements of Operations.
During 2010 we recorded restructuring charges of $3.4 million for severance and related expenses and a pensioncurtailment charge of $0.3 million. Although this program was approved by the Board in 2011, these charges were recorded in2010 as the charges were probable and we were able to make a reasonable estimate of the liability.
Prior Programs Substantially Complete
During 2010, we recorded $6.4 million of severance and related expenses, $1.7 million of lease termination costs, $2.5million of pension settlement and curtailment charges, and $0.2 million of other charges related to our 2008 corporateredesign restructuring program. This program was initiated during the fourth quarter of 2008 and aligned our cost structure byreducing SG&A expenses. We reduced costs by rationalizing key accounts and products and by simplifying our corporatestructure globally.
During 2009, we recorded $11.2 million of severance and related expenses, $0.1 million of lease termination costs and$11.7 million of pension settlement and curtailment charges related to our 2008 corporate redesign restructuring program.Additionally during 2009, we recorded $0.9 million of lease termination costs related to our 2008 cost reduction restructuringprogram. This program began in the third quarter of 2008 when our Board of Directors approved the Camarillo, California
24
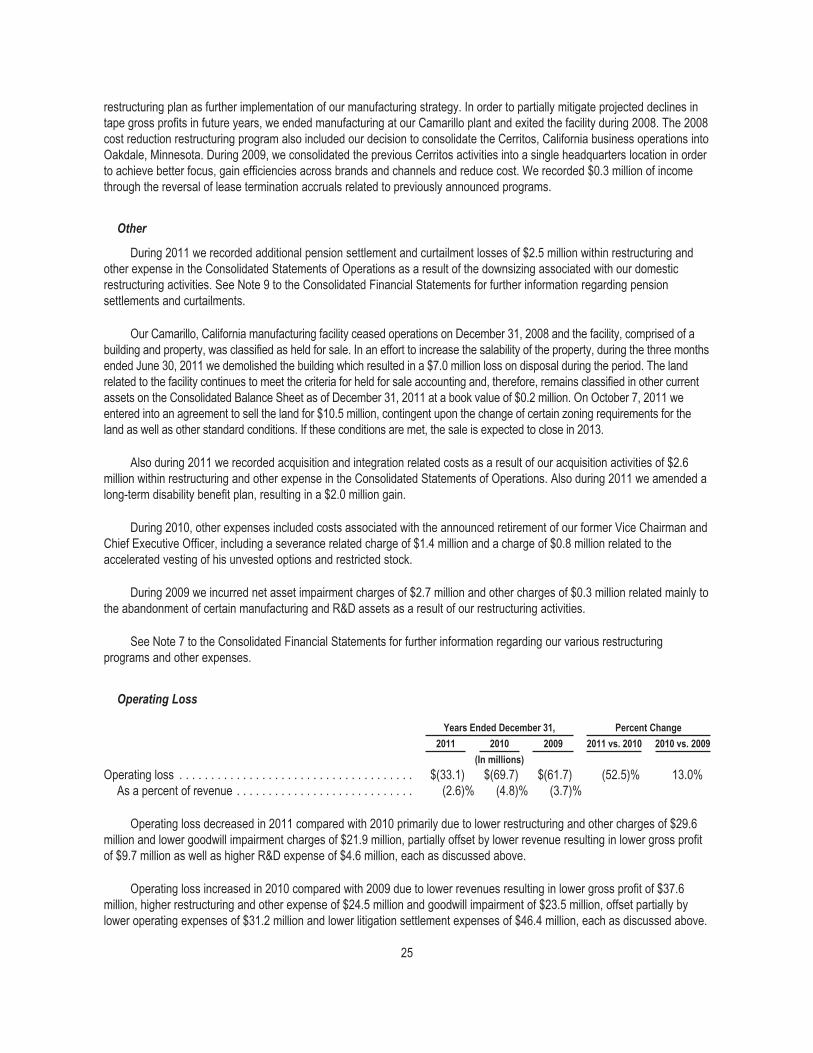
restructuring plan as further implementation of our manufacturing strategy. In order to partially mitigate projected declines intape gross profits in future years, we ended manufacturing at our Camarillo plant and exited the facility during 2008. The 2008cost reduction restructuring program also included our decision to consolidate the Cerritos, California business operations intoOakdale, Minnesota. During 2009, we consolidated the previous Cerritos activities into a single headquarters location in orderto achieve better focus, gain efficiencies across brands and channels and reduce cost. We recorded $0.3 million of incomethrough the reversal of lease termination accruals related to previously announced programs.
Other
During 2011 we recorded additional pension settlement and curtailment losses of $2.5 million within restructuring andother expense in the Consolidated Statements of Operations as a result of the downsizing associated with our domesticrestructuring activities. See Note 9 to the Consolidated Financial Statements for further information regarding pensionsettlements and curtailments.
Our Camarillo, California manufacturing facility ceased operations on December 31, 2008 and the facility, comprised of abuilding and property, was classified as held for sale. In an effort to increase the salability of the property, during the three monthsended June 30, 2011 we demolished the building which resulted in a $7.0 million loss on disposal during the period. The landrelated to the facility continues to meet the criteria for held for sale accounting and, therefore, remains classified in other currentassets on the Consolidated Balance Sheet as of December 31, 2011 at a book value of $0.2 million. On October 7, 2011 weentered into an agreement to sell the land for $10.5 million, contingent upon the change of certain zoning requirements for theland as well as other standard conditions. If these conditions are met, the sale is expected to close in 2013.
Also during 2011 we recorded acquisition and integration related costs as a result of our acquisition activities of $2.6million within restructuring and other expense in the Consolidated Statements of Operations. Also during 2011 we amended along-term disability benefit plan, resulting in a $2.0 million gain.
During 2010, other expenses included costs associated with the announced retirement of our former Vice Chairman andChief Executive Officer, including a severance related charge of $1.4 million and a charge of $0.8 million related to theaccelerated vesting of his unvested options and restricted stock.
During 2009 we incurred net asset impairment charges of $2.7 million and other charges of $0.3 million related mainly tothe abandonment of certain manufacturing and R&D assets as a result of our restructuring activities.
See Note 7 to the Consolidated Financial Statements for further information regarding our various restructuringprograms and other expenses.
Operating Loss
Years Ended December 31, Percent Change
2011 2010 2009 2011 vs. 2010 2010 vs. 2009
(In millions)
Operating loss . . . . . . . . . . . . . . . . . . . . . . . . . . . . . . . . . . . . . $(33.1) $(69.7) $(61.7) (52.5)% 13.0%As a percent of revenue . . . . . . . . . . . . . . . . . . . . . . . . . . . . (2.6)% (4.8)% (3.7)%
Operating loss decreased in 2011 compared with 2010 primarily due to lower restructuring and other charges of $29.6million and lower goodwill impairment charges of $21.9 million, partially offset by lower revenue resulting in lower gross profitof $9.7 million as well as higher R&D expense of $4.6 million, each as discussed above.
Operating loss increased in 2010 compared with 2009 due to lower revenues resulting in lower gross profit of $37.6million, higher restructuring and other expense of $24.5 million and goodwill impairment of $23.5 million, offset partially bylower operating expenses of $31.2 million and lower litigation settlement expenses of $46.4 million, each as discussed above.
25

The 2010 operating loss was significantly impacted by restructuring and other expenses of $51.1 million, asset impairment of$31.2 million and inventory write-offs of $14.2 million as well as a litigation settlement charge of $2.6 million. Our 2009operating loss was significantly impacted by the Philips litigation settlement charge of $49.0 million and restructuring andother charges of $26.6 million.
Other Expense
Years Ended December 31, Percent Change
2011 2010 2009 2011 vs. 2010 2010 vs. 2009
(In millions)
Interest income . . . . . . . . . . . . . . . . . . . . . . . . . . . . . . . . . . . . $(0.9) $(0.8) $ (0.7) 12.5% 14.3%Interest expense . . . . . . . . . . . . . . . . . . . . . . . . . . . . . . . . . . . 3.7 4.2 2.9 (11.9)% 44.8%Other expense, net . . . . . . . . . . . . . . . . . . . . . . . . . . . . . . . . . 7.0 3.3 12.8 112.1% (74.2)%
Other expense . . . . . . . . . . . . . . . . . . . . . . . . . . . . . . . . . . . . . $ 9.8 $ 6.7 $15.0 46.3% (55.3)%As a percent of revenue . . . . . . . . . . . . . . . . . . . . . . . . . . . . 0.8% 0.5% 0.9%
Interest income remained relatively constant in 2011 compared with 2010. Our interest expense decreased in 2011compared with 2010 due to decreased amortization of capitalized fees related to securing our credit facility and decreasedimputed interest related to our liability for the Philips litigation settlement. Other expense increased in 2011 compared with2010 due to increases in foreign currency losses of $2.4 million. We attempt to mitigate the exposure to foreign currencyvolatility through our hedging program; however, our program is not designed to fully hedge our risk and as a result weexperience some volatility in other income, especially in periods of significant foreign currency fluctuation. Other expense in2010 benefited $2.0 million from a recovery of a note receivable from a commercial partner.
Interest income remained relatively constant in 2010 compared with 2009 primarily due to higher average cash balancesduring the year, offset by reduced interest rates year-over-year. Our interest expense increased in 2010 compared with 2009due to increased amortization of capitalized fees related to securing our credit facility of $1.1 million and increased imputedinterest related to our liability for the Philips litigation settlement of $0.7 million, offset partially by reduced interest onborrowings of $0.5 million. Our other expense net decreased in 2010, compared with 2009, due to declines in foreign currencylosses of $4.5 million and a $3.0 million reserve for a note receivable from one of our commercial partners recorded in 2009,offset partially by a recovery of $2.0 million in 2010.
Income Tax Provision (Benefit)
Years Ended December 31,
2011 2010 2009
(In millions)
Income tax provision (benefit) . . . . . . . . . . . . . . . . . . . . . . . . . . . . . . . . . . . . . . . . . . . . . . . $ 3.8 $81.9 $(32.7)Effective tax rate . . . . . . . . . . . . . . . . . . . . . . . . . . . . . . . . . . . . . . . . . . . . . . . . . . . . . . . . . NM NM 42.6%
NM - Not meaningful
The 2011 income tax provision primarily represents tax expense related to operations outside the United States as wellas foreign withholding taxes. We maintain a valuation allowance related to our U.S. deferred tax assets and, therefore, no taxprovision or benefit was recorded related to 2011 U.S. results. Because of the valuation allowance, the effective tax rates for2011 and 2010 are not meaningful.
The change in our income tax provision (benefit) for 2010, as compared to 2009, was primarily due to the establishmentof a valuation allowance on our U.S. deferred tax assets. During the fourth quarter of 2010, we recognized significantrestructuring charges related to our U.S. operations. Due to these charges and cumulative losses incurred in recent years, wewere no longer able to conclude that it was more-likely-than-not that our U.S. deferred tax assets would be fully realized.Therefore, during 2010, we recorded a charge to establish a valuation allowance of $105.6 million related to our U.S. deferredtax assets. The valuation allowance charge is included in income tax provision on our Consolidated Statement of Operations.
26

Other items that had an impact on the 2010 effective tax rate included a change in the state tax effective rate, reservesfor uncertain tax positions, foreign earnings subject to U.S. taxation, and changes in the mix of income by jurisdiction. SeeNote 10 to the Consolidated Financial Statements for further information.
Items that had an impact on the 2009 effective tax rate include an increase in the state tax effective rate, additionalreserves for uncertain tax positions and the change in proportion of income by jurisdiction.
As of December 31, 2011 and 2010 we had valuation allowances of $141.1 million and $127.4 million, respectively, toaccount for deferred tax assets we have concluded are not considered to be more-likely-than-not to be realized in the futuredue to our cumulative losses in recent years. The deferred tax assets subject to valuation allowance include certain U.S. andforeign operating loss carryforwards, certain U.S. deferred tax deductions, and certain tax credit carryforwards.
Segment Results
Our business is organized, managed and internally and externally reported as segments differentiated by the regionalmarkets we serve: Americas, Europe, North Asia and South Asia. Each of these geographic segments has responsibility forselling generally all of our product lines.
• Our Americas segment includes North America, Central America and South America.
• Our Europe segment includes Europe and parts of Africa.
• Our North Asia segment includes Japan, China, Hong Kong, Korea and Taiwan.
• Our South Asia segment includes Australia, Singapore, India, the Middle East and parts of Africa.
We evaluate segment performance based on revenue and operating income (loss). Revenue for each segment isgenerally based on customer location where the product is shipped. The operating income (loss) reported in our segmentsexcludes corporate and other unallocated amounts. Although such amounts are excluded from the business segment results,they are included in reported consolidated results. Corporate and unallocated amounts include litigation settlement expense,goodwill impairment expense, research and development expense, corporate expense, stock-based compensation expenseand restructuring and other expenses which are not allocated to the segments.
Information related to our segments is as follows:
Americas
Years Ended December 31, Percent Change
2011 2010 2009 2011 vs. 2010 2010 vs. 2009
(In millions)
Net revenue . . . . . . . . . . . . . . . . . . . . . . . . . . . . . . . . . . . . . . . $595.9 $712.9 $834.2 (16.4)% (14.5)%Operating income . . . . . . . . . . . . . . . . . . . . . . . . . . . . . . . . . . 8.4 36.8 48.3 (77.2)% (23.8)%
As a percent of revenue . . . . . . . . . . . . . . . . . . . . . . . . . . . . 1.4% 5.2% 5.8%
The Americas segment was our largest segment comprising 46.2 percent, 48.8 percent and 50.6 percent of our totalconsolidated revenue in 2011, 2010 and 2009, respectively. The Americas segment revenue decreased in 2011 comparedwith 2010 driven primarily by the decreases in revenue from optical products of $57.3 million, audio and video informationproducts of $41.1 million due to planned rationalization of certain product lines and magnetic products of $25.7 million.Operating income decreased in 2011 compared with 2010 driven primarily by decreases in revenue and lower gross marginson optical and magnetic products and decreases in revenue on audio and video information products, partially offset by highergross margins on secure and scalable storage products.
The Americas segment revenue decreased in 2010 compared with 2009 driven primarily by declines in revenues fromtraditional storage products of $82.2 million and audio and video information products of $48.8 million, partially offset by
27

higher revenue from secure and scalable storage products of $8.8 million. Operating income decreased in 2010 comparedwith 2009 driven primarily by decreases in gross profits from traditional storage products, partially offset by higher grossmargins on secure and scalable storage products. Operating income as a percentage of revenue decreased in 2010compared with 2009 driven primarily by decreases in revenue and gross margin on traditional storage products, partially offsetby lower SG&A.
Europe
Years Ended December 31, Percent Change
2011 2010 2009 2011 vs. 2010 2010 vs. 2009
(In millions)
Net revenue . . . . . . . . . . . . . . . . . . . . . . . . . $248.0 $289.8 $370.5 (14.4)% (21.8)%Operating income (loss) . . . . . . . . . . . . . . . . 10.3 (0.6) 2.4 NM NM
As a percent of revenue . . . . . . . . . . . . . . 4.2 % (0.2)% 0.6%
NM - Not meaningful
The Europe segment revenue comprised 19.2 percent, 19.8 percent and 22.5 percent of our total consolidated revenuein 2011, 2010 and 2009, respectively. The Europe segment revenue decreased in 2011 compared with 2010 driven primarilyby decreases in revenue from optical products of $31.4 million. Operating income increased in 2011 compared with 2010driven primarily by the higher gross margins on optical products mainly due to the reversal of prior year European opticalmedia copyright levy payables of $7.8 million for which we considered payment remote. Revenue was benefited by foreigncurrency impacts of approximately six percent.
The Europe segment revenue decreased in 2010 compared with 2009 due to declines in revenues from traditional storageproducts of $90.2 million, offset partially by increases in secure and scalable storage products of $8.0 million. Operating incomedecreased in 2010 compared with 2009 driven primarily by the declines in revenue on traditional storage products, offset partiallyby lower SG&A costs. Revenue was impacted by unfavorable foreign currency of approximately two percent.
North Asia
Years Ended December 31, Percent Change
2011 2010 2009 2011 vs. 2010 2010 vs. 2009
(In millions)
Net revenue . . . . . . . . . . . . . . . . . . . . . . . . . $307.2 $315.2 $306.9 (2.5)% 2.7%Operating income . . . . . . . . . . . . . . . . . . . . . 12.5 14.9 15.3 (16.1)% (2.6)%
As a percent of revenue . . . . . . . . . . . . . . 4.1% 4.7% 5.0%
The North Asia segment revenue comprised 23.8 percent, 21.6 percent and 18.6 percent of our total consolidatedrevenue in 2011, 2010 and 2009, respectively. The North Asia segment revenue decreased in 2011 compared with 2010driven primarily by declines in revenue from optical products of $14.4 million, partially offset by higher revenue from audio andvideo information products of $5.3 million. Operating income decreased in 2011 compared with 2010 driven primarily bydecreases in revenue and lower gross margins on optical products and higher SG&A expense, partially offset by the reversalof a bad debt reserve of $2.7 million and higher gross margins on secure and scalable products. Revenue was benefited byforeign currency impacts of approximately eight percent.
The North Asia segment revenue increased in 2010 compared with 2009 primarily due to higher revenues from secure andscalable storage products of $10.6 million and audio and video information products of $3.3 million, offset partially by decreasesin traditional storage products of $5.5 million. Operating income declined in 2010 compared with 2009 driven by slightly lowermargins in traditional storage products. Revenue was benefited by foreign currency impacts of approximately six percent.
28

South Asia
Years Ended December 31, Percent Change
2011 2010 2009 2011 vs. 2010 2010 vs. 2009
(In millions)
Net revenue . . . . . . . . . . . . . . . . . . . . . . . . . $139.3 $143.0 $137.9 (2.6)% 3.7%Operating income . . . . . . . . . . . . . . . . . . . . . 4.0 4.0 2.6 —% 53.8%
As a percent of revenue . . . . . . . . . . . . . . 2.9% 2.8% 1.9%
The South Asia segment revenue comprised 10.8 percent, 9.8 percent and 8.4 percent of our total consolidated revenuein 2011, 2010 and 2009, respectively. The South Asia segment revenue decreased in 2011 compared with 2010 drivenprimarily by decreases in revenue from optical products of $4.6 million and other traditional storage products of $2.8 million,partially offset by higher revenue from audio and video information of $4.4 million. Operating income remained unchanged in2011 compared with 2010, impacted by higher gross margins on audio and video information products offset by higher SG&Acosts. Revenue was benefited by foreign currency impacts of approximately six percent.
The South Asia segment revenue increased in 2010 compared with 2009 due to higher revenues from secure andscalable storage products of $14.7 million and audio and video information products of $4.9 million, offset partially bydecreases in traditional storage products of $14.2 million. Operating income increased in 2010 compared with 2009 drivenprimarily by higher gross margin percentages across all product categories, offset partially by increased SG&A costs.Revenue was benefited by foreign currency impacts of approximately six percent.
Corporate and Unallocated
Years Ended December 31, Percent Change
2011 2010 2009 2011 vs. 2010 2010 vs. 2009
(In millions)
Operating loss . . . . . . . . . . . . . . . . . . . . . . . $(68.3) $(124.8) $(130.3) (45.3)% (4.2)%
The corporate and unallocated operating loss includes costs which are not allocated to the business segments inmanagement’s evaluation of segment performance such as litigation settlement expense, goodwill impairment expense,research and development expense, corporate expense, stock-based compensation expense and restructuring and otherexpense. The operating loss decreased in 2011 compared with 2010 driven primarily by an asset impairment charge during2010 of $31.2 million, a goodwill impairment charge during 2010 of $23.5 million, offset partially by increased restructuringand other expense related to our previously announced programs as well as the $7.0 million charge relating to the demolitionof our Camarillo, California facility during 2011.
The corporate and unallocated operating loss in 2009 included a litigation settlement charge of $49.0 million,restructuring and other charges of $26.6 million and asset impairment charges of $2.7 million.
Financial Position
As of December 31, 2011, our cash and cash equivalents balance was $223.1 million, a decrease of $81.8 millioncompared with December 31, 2010. The decrease was primarily attributable to acquisition related payments of $47.0 million,pension contributions of $14.2 million, litigation settlement payments of $10.9 million, restructuring payments of $16.9 millionand treasury stock repurchases of $9.7 million. Of our total cash balance, $135.3 million is held in the United States.
Accounts receivable days sales outstanding was 58 days as of December 31, 2011, up one day fromDecember 31, 2010. Days sales outstanding is calculated using the count-back method, which calculates the number of daysof most recent revenue that is reflected in the net accounts receivable balance.
29

Days of inventory supply was 85 days as of December 31, 2011, up sixteen days compared with 69 days as ofDecember 31, 2010. These increases were primarily a result of changes in terms with our optical vendors from consignmentto owned inventory during 2011. Days of inventory supply is calculated using the current period inventory balance divided byan estimate of the inventoriable portion of cost of goods sold expressed in days.
Our other current assets balance as of December 31, 2011 was $49.7 million, a decrease of $24.5 million from $74.2million as of December 31, 2010. The decrease was primarily due to decreased restricted cash balances as the result of therelated cash payments being made.
Goodwill as of December 31, 2011 was $31.3 million compared with no goodwill as of December 31, 2010. The increasewas a result of the MXI Security and IronKey acquisitions.
Our intangible assets balance as of December 31, 2011 was $321.7 million, an increase of $1.3 million from $320.4million as of December 31, 2010. The increase was primarily due to intangibles purchased as part of the MXI Security,IronKey and Nine Technology acquisitions offset partially by the amortization of intangible assets.
Our accounts payable balance as of December 31, 2011 was $205.2 million, a decrease of $14.0 million from $219.2million as of December 31, 2010. The decrease in accounts payable was mainly due to reduced payment terms primarily toour optical suppliers.
Our other current liabilities balance as of December 31, 2011 was $151.2 million, a decrease of $21.1 million from$172.3 million as of December 31, 2010. The decrease is due to reduced restructuring and rebate accruals and the $10.5million payment associated with the TDK value added tax liability which was paid from restricted cash, partially offset by theincrease in current litigation settlement accruals to be paid in 2012.
Our other liabilities balance as of December 31, 2011 was $69.2 million, a decrease of $8.6 million from $77.8 million asof December 31, 2010. The decrease was primarily due to the reclassification of litigation settlement accruals which were$15.1 million at December 31, 2010, offset by the estimated fair value of future contingent consideration of $9.2 million relatedto our recent acquisitions.
Liquidity and Capital Resources
Cash Flows (used in) provided by Operating Activities:
Years Ended December 31,
2011 2010 2009
(In millions)
Net loss . . . . . . . . . . . . . . . . . . . . . . . . . . . . . . . . . . . . . . . . . . . . . . . . . . . . . . . . . . . . . . . . . . $(46.7) $(158.5) $ (42.2)Adjustments to reconcile net loss to net cash provided by operating activities . . . . . . . . . . . . . . . 73.9 185.4 121.1Changes in operating assets and liabilities, net of effects from acquisitions . . . . . . . . . . . . . . . . . (43.5) 124.5 (11.4)
Net cash (used in) provided by operating activities . . . . . . . . . . . . . . . . . . . . . . . . . . . . . . . . . $(16.3) $ 151.4 $ 67.5
Cash flows from operating activities can fluctuate significantly from period to period as many items can significantlyimpact cash flows. While operating activities resulted in a net use of cash in 2011, this was due to changes in operatingassets and liabilities which used $43.5 million in cash. In 2011, 2010 and 2009 we contributed $14.2 million, $9.9 million and$10.3 million to our pensions worldwide, respectively. Operating cash outflows included restructuring payments of$16.9 million, $9.5 million and $22.3 million in 2011, 2010 and 2009, respectively, and litigation settlement payments of $10.9million, $8.2 million and $20.0 million in 2011, 2010 and 2009, respectively. Cash provided by operating activities in 2010 wasprimarily a result of initiatives to improve working capital by lowering levels of inventory and changing payable and receivableterms. During 2010 we recorded a non-cash goodwill impairment charge of $23.5 million, asset impairment charges of $31.2million, inventory impairment charges of $14.2 million and a valuation allowance against our U.S. deferred tax assets of$105.6 million.
30
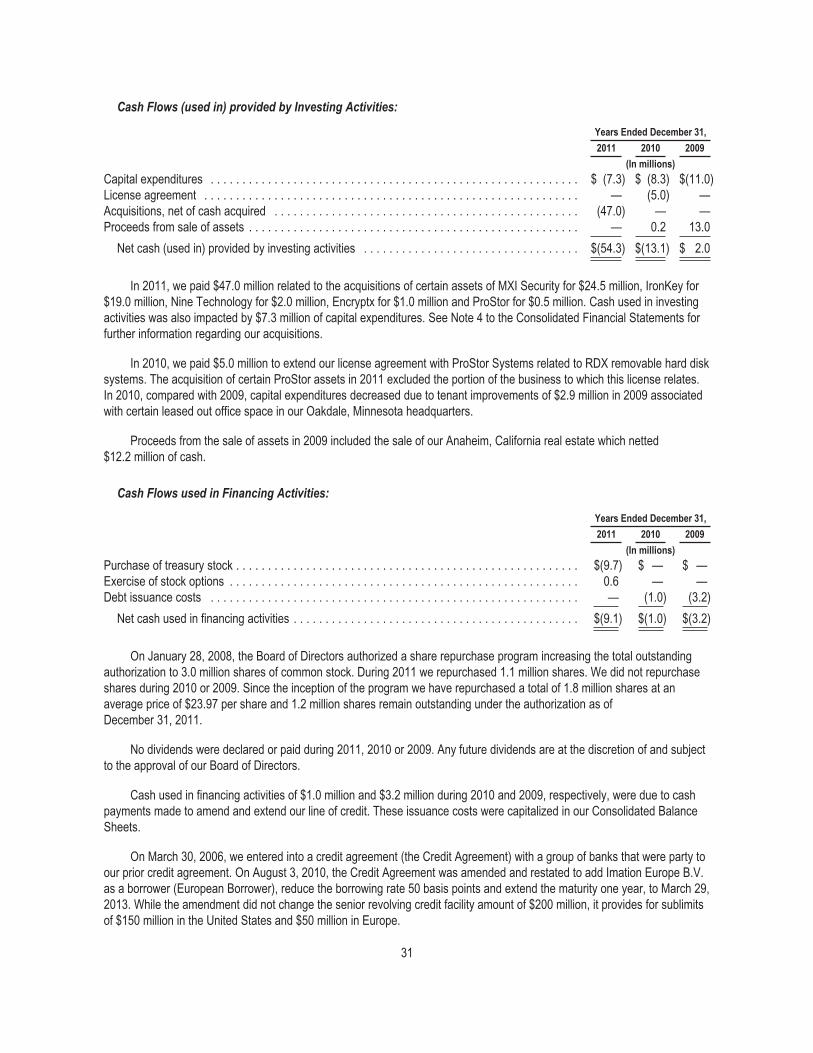
Cash Flows (used in) provided by Investing Activities:
Years Ended December 31,
2011 2010 2009
(In millions)
Capital expenditures . . . . . . . . . . . . . . . . . . . . . . . . . . . . . . . . . . . . . . . . . . . . . . . . . . . . . . . . . . $ (7.3) $ (8.3) $(11.0)License agreement . . . . . . . . . . . . . . . . . . . . . . . . . . . . . . . . . . . . . . . . . . . . . . . . . . . . . . . . . . . — (5.0) —Acquisitions, net of cash acquired . . . . . . . . . . . . . . . . . . . . . . . . . . . . . . . . . . . . . . . . . . . . . . . . (47.0) — —Proceeds from sale of assets . . . . . . . . . . . . . . . . . . . . . . . . . . . . . . . . . . . . . . . . . . . . . . . . . . . . — 0.2 13.0
Net cash (used in) provided by investing activities . . . . . . . . . . . . . . . . . . . . . . . . . . . . . . . . . . $(54.3) $(13.1) $ 2.0
In 2011, we paid $47.0 million related to the acquisitions of certain assets of MXI Security for $24.5 million, IronKey for$19.0 million, Nine Technology for $2.0 million, Encryptx for $1.0 million and ProStor for $0.5 million. Cash used in investingactivities was also impacted by $7.3 million of capital expenditures. See Note 4 to the Consolidated Financial Statements forfurther information regarding our acquisitions.
In 2010, we paid $5.0 million to extend our license agreement with ProStor Systems related to RDX removable hard disksystems. The acquisition of certain ProStor assets in 2011 excluded the portion of the business to which this license relates.In 2010, compared with 2009, capital expenditures decreased due to tenant improvements of $2.9 million in 2009 associatedwith certain leased out office space in our Oakdale, Minnesota headquarters.
Proceeds from the sale of assets in 2009 included the sale of our Anaheim, California real estate which netted$12.2 million of cash.
Cash Flows used in Financing Activities:
Years Ended December 31,
2011 2010 2009
(In millions)
Purchase of treasury stock . . . . . . . . . . . . . . . . . . . . . . . . . . . . . . . . . . . . . . . . . . . . . . . . . . . . . . $(9.7) $ — $ —Exercise of stock options . . . . . . . . . . . . . . . . . . . . . . . . . . . . . . . . . . . . . . . . . . . . . . . . . . . . . . . 0.6 — —Debt issuance costs . . . . . . . . . . . . . . . . . . . . . . . . . . . . . . . . . . . . . . . . . . . . . . . . . . . . . . . . . . — (1.0) (3.2)
Net cash used in financing activities . . . . . . . . . . . . . . . . . . . . . . . . . . . . . . . . . . . . . . . . . . . . . $(9.1) $(1.0) $(3.2)
On January 28, 2008, the Board of Directors authorized a share repurchase program increasing the total outstandingauthorization to 3.0 million shares of common stock. During 2011 we repurchased 1.1 million shares. We did not repurchaseshares during 2010 or 2009. Since the inception of the program we have repurchased a total of 1.8 million shares at anaverage price of $23.97 per share and 1.2 million shares remain outstanding under the authorization as ofDecember 31, 2011.
No dividends were declared or paid during 2011, 2010 or 2009. Any future dividends are at the discretion of and subjectto the approval of our Board of Directors.
Cash used in financing activities of $1.0 million and $3.2 million during 2010 and 2009, respectively, were due to cashpayments made to amend and extend our line of credit. These issuance costs were capitalized in our Consolidated BalanceSheets.
On March 30, 2006, we entered into a credit agreement (the Credit Agreement) with a group of banks that were party toour prior credit agreement. On August 3, 2010, the Credit Agreement was amended and restated to add Imation Europe B.V.as a borrower (European Borrower), reduce the borrowing rate 50 basis points and extend the maturity one year, to March 29,2013. While the amendment did not change the senior revolving credit facility amount of $200 million, it provides for sublimitsof $150 million in the United States and $50 million in Europe.
31

Borrowings under the Credit Agreement as amended (collectively the Amended Credit Agreement) would have borneinterest through December 31, 2009 at a rate equal to (i) the Eurodollar Rate (as defined in the Amended Credit Agreement)plus 3.00 percent or (ii) the Base Rate (as defined in the Amended Credit Agreement) plus 2.00 percent. On January 1, 2010,the applicable margins for the Eurodollar Rate and the Base Rate became subject to adjustments based on average dailyavailability (as defined in the Amended Credit Agreement), as set forth in the definition of “Applicable Rate” in the AmendedCredit Agreement.
Our U.S. obligations under the Amended Credit Agreement are guaranteed by the material domestic subsidiaries ofImation Corp. (the Guarantors) and are secured by a first priority lien (subject to customary exceptions) on the real propertycomprising Imation Corp.’s corporate headquarters and all of the personal property of Imation Corp., its subsidiary ImationEnterprises Corp., which is also an obligor under the Amended Credit Agreement, and the Guarantors. Advances under theU.S. portion of the Credit Facility are limited to the lesser of (a) $150 million and (b) the “U.S. borrowing base.” TheU.S. borrowing base is equal to the following:
• up to 85 percent of eligible accounts receivable; plus
• up to the lesser of 65 percent of eligible inventory or 85 percent of the appraised net orderly liquidation value ofeligible inventory; plus
• up to 60 percent of the appraised fair market value of eligible real estate (the Original Real Estate Value), suchOriginal Real Estate Value to be reduced each calendar month by 1/84th, provided, that the Original Real EstateValue shall not exceed $40 million; plus
• such other classes of collateral as may be mutually agreed upon and at advance rates as may be determined by theAgent; minus
• such reserves as the Agent may establish in good faith.
Our European obligations under the Credit Agreement are secured by a first priority lien on substantially all of thematerial personal property of the European Borrower. Advances under the European portion of the Credit Facility are limitedto the lesser of (a) $50 million and (b) the “European borrowing base.” The European borrowing base calculation isfundamentally the same as the U.S. borrowing base, subject to certain differences to account for European law and othersimilar issues.
During the twelve months ended December 31, 2011 interest on borrowings under the Amended Credit Agreementwould have been at a variable rate of interest of approximately 5.0 percent. However, we did not have borrowings under theCredit Agreement during 2011.
The Amended Credit Agreement contains covenants which are customary for similar credit arrangements, includingcovenants relating to financial reporting and notification; payment of indebtedness, taxes and other obligations; compliancewith applicable laws; and limitations regarding additional liens, indebtedness, certain acquisitions, investments anddispositions of assets. We were in compliance with all covenants as of December 31, 2011. The Amended Credit Agreementalso contains a conditional financial covenant that requires us to have a Consolidated Fixed Charge Coverage Ratio (asdefined in the Amended Credit Agreement) of not less than 1.20 to 1.00 during certain periods described in the AmendedCredit Agreement. At December 31, 2011 the condition did not arise such that the Consolidated Fixed Charge Coverage Ratiowas required as a covenant. As of December 31, 2011, our total availability under the Credit Facility was $127.6 million
We had $88 million of cash outside the U.S. at December 31, 2011. We also have significant net operating losscarryforwards offset by a full valuation allowance in the U.S. The calculation of a deferred tax liability on the repatriation of thecash outside the U.S. is impractical. However, because of the valuation allowance in the U.S., we do not believe there wouldbe any significant impact to earnings if we were to remit this foreign held cash.
Our liquidity needs for 2012 include the following: restructuring payments of approximately $5 million to $10 million,litigation settlement payments of $18.5 million, capital expenditures of approximately $8 million to $12 million, pension fundingof approximately $7 million to $10 million, operating lease payments of approximately $8 million, any amounts associated with
32

strategic acquisitions, any amounts associated with organic investment opportunities and any amounts associated with therepurchase of common stock under the authorization discussed above. We expect that cash and cash equivalents, togetherwith cash flow from operations and availability of borrowings under our current sources of financing, will provide liquiditysufficient to meet these needs and for our operations.
Off-Balance Sheet Arrangements
Other than the operating lease commitments discussed in Note 15 to the Consolidated Financial Statements, we are notusing off-balance sheet arrangements, including special purpose entities.
Summary of Contractual Obligations
Payments Due by Period
TotalLess Than
1 Year 1-3 Years 3-5 YearsMore Than
5 Years
(In millions)
Operating lease obligations . . . . . . . . . . . . . . . . . . . . . . . . . . . . . . . . $ 17.9 $ 7.8 $ 8.7 $1.3 $ 0.1Purchase obligations(1) . . . . . . . . . . . . . . . . . . . . . . . . . . . . . . . . . . . 218.8 211.0 6.2 1.6 —Litigation settlements . . . . . . . . . . . . . . . . . . . . . . . . . . . . . . . . . . . . . 18.5 18.5 — — —Other liabilities(2) . . . . . . . . . . . . . . . . . . . . . . . . . . . . . . . . . . . . . . . . 39.8 — — — 39.8
Total . . . . . . . . . . . . . . . . . . . . . . . . . . . . . . . . . . . . . . . . . . . . . . . $295.0 $237.3 $14.9 $2.9 $39.9
(1) The majority of the purchase obligations consist of 90-day rolling estimates. In most cases, we provide suppliers with athree to six month rolling forecast of our demand. The forecasted amounts are generally not binding on us. However, itmay take up to 60 days from the purchase order issuance to receipt, depending on supplier and inbound lead time.Effective December 8, 2009, we began an agreement with a third party to outsource certain aspects of our informationtechnology support. While the agreement is cancelable at any time with certain cash penalties, our obligation throughthe expected termination date of January 2016 is included above.
(2) Timing of payments for the vast majority of other liabilities cannot be reasonably determined and, as such, have beenincluded in the “More Than 5 Years” category. This amount includes $17.6 million of reserves for uncertain tax positionsincluding accrued interest and penalties and the long-term fair value of contingent consideration related to acquisitionsof $9.9 million.
The table above does not include payments for non-contributory defined benefit pension plans. It is our general practice,at a minimum, to fund amounts sufficient to meet the requirements set forth in applicable benefits laws and local tax laws.From time to time, we contribute additional amounts, as we deem appropriate. We expect to contribute approximately$7 million to $10 million to our pension plans in 2012 and have $29.3 million recorded in other liabilities related to pensionplans as of December 31, 2011.
Critical Accounting Policies and Estimates
The discussion and analysis of our financial condition and results of operations is based upon our Consolidated FinancialStatements, which have been prepared in accordance with accounting principles generally accepted in the United States ofAmerica. The preparation of these financial statements requires us to make estimates and judgments that affect the reportedamounts of assets, liabilities, revenue, expenses and related disclosures of contingent assets and liabilities. On an on-goingbasis, we evaluate our estimates to ensure they are consistent with historical experience and the various assumptions that arebelieved to be reasonable under the circumstances, the results of which form the basis for making judgments about the carryingvalues of assets and liabilities that are not readily apparent from other sources. Actual results may differ from these estimatesunder different assumptions or conditions and could materially impact our results of operations.
We believe the following critical accounting policies are affected by significant judgments and estimates used in thepreparation of our Consolidated Financial Statements:
33
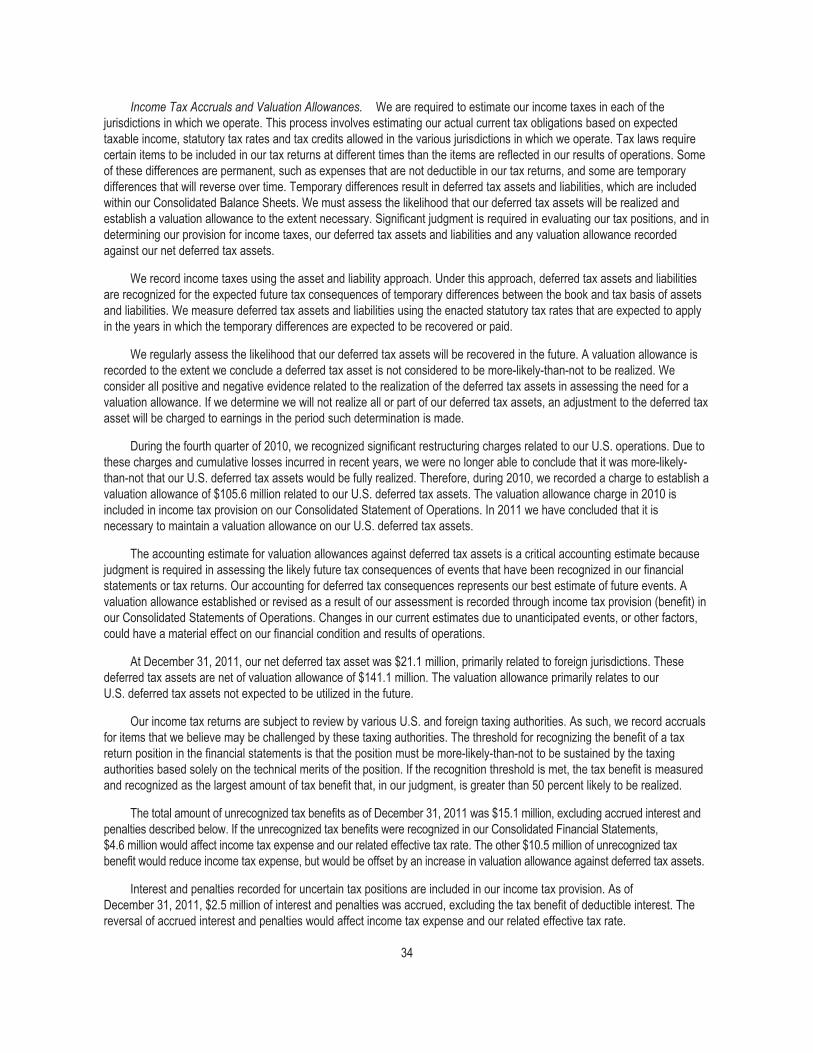
Income Tax Accruals and Valuation Allowances. We are required to estimate our income taxes in each of thejurisdictions in which we operate. This process involves estimating our actual current tax obligations based on expectedtaxable income, statutory tax rates and tax credits allowed in the various jurisdictions in which we operate. Tax laws requirecertain items to be included in our tax returns at different times than the items are reflected in our results of operations. Someof these differences are permanent, such as expenses that are not deductible in our tax returns, and some are temporarydifferences that will reverse over time. Temporary differences result in deferred tax assets and liabilities, which are includedwithin our Consolidated Balance Sheets. We must assess the likelihood that our deferred tax assets will be realized andestablish a valuation allowance to the extent necessary. Significant judgment is required in evaluating our tax positions, and indetermining our provision for income taxes, our deferred tax assets and liabilities and any valuation allowance recordedagainst our net deferred tax assets.
We record income taxes using the asset and liability approach. Under this approach, deferred tax assets and liabilitiesare recognized for the expected future tax consequences of temporary differences between the book and tax basis of assetsand liabilities. We measure deferred tax assets and liabilities using the enacted statutory tax rates that are expected to applyin the years in which the temporary differences are expected to be recovered or paid.
We regularly assess the likelihood that our deferred tax assets will be recovered in the future. A valuation allowance isrecorded to the extent we conclude a deferred tax asset is not considered to be more-likely-than-not to be realized. Weconsider all positive and negative evidence related to the realization of the deferred tax assets in assessing the need for avaluation allowance. If we determine we will not realize all or part of our deferred tax assets, an adjustment to the deferred taxasset will be charged to earnings in the period such determination is made.
During the fourth quarter of 2010, we recognized significant restructuring charges related to our U.S. operations. Due tothese charges and cumulative losses incurred in recent years, we were no longer able to conclude that it was more-likely-than-not that our U.S. deferred tax assets would be fully realized. Therefore, during 2010, we recorded a charge to establish avaluation allowance of $105.6 million related to our U.S. deferred tax assets. The valuation allowance charge in 2010 isincluded in income tax provision on our Consolidated Statement of Operations. In 2011 we have concluded that it isnecessary to maintain a valuation allowance on our U.S. deferred tax assets.
The accounting estimate for valuation allowances against deferred tax assets is a critical accounting estimate becausejudgment is required in assessing the likely future tax consequences of events that have been recognized in our financialstatements or tax returns. Our accounting for deferred tax consequences represents our best estimate of future events. Avaluation allowance established or revised as a result of our assessment is recorded through income tax provision (benefit) inour Consolidated Statements of Operations. Changes in our current estimates due to unanticipated events, or other factors,could have a material effect on our financial condition and results of operations.
At December 31, 2011, our net deferred tax asset was $21.1 million, primarily related to foreign jurisdictions. Thesedeferred tax assets are net of valuation allowance of $141.1 million. The valuation allowance primarily relates to ourU.S. deferred tax assets not expected to be utilized in the future.
Our income tax returns are subject to review by various U.S. and foreign taxing authorities. As such, we record accrualsfor items that we believe may be challenged by these taxing authorities. The threshold for recognizing the benefit of a taxreturn position in the financial statements is that the position must be more-likely-than-not to be sustained by the taxingauthorities based solely on the technical merits of the position. If the recognition threshold is met, the tax benefit is measuredand recognized as the largest amount of tax benefit that, in our judgment, is greater than 50 percent likely to be realized.
The total amount of unrecognized tax benefits as of December 31, 2011 was $15.1 million, excluding accrued interest andpenalties described below. If the unrecognized tax benefits were recognized in our Consolidated Financial Statements,$4.6 million would affect income tax expense and our related effective tax rate. The other $10.5 million of unrecognized taxbenefit would reduce income tax expense, but would be offset by an increase in valuation allowance against deferred tax assets.
Interest and penalties recorded for uncertain tax positions are included in our income tax provision. As ofDecember 31, 2011, $2.5 million of interest and penalties was accrued, excluding the tax benefit of deductible interest. Thereversal of accrued interest and penalties would affect income tax expense and our related effective tax rate.
34

Our U.S. federal income tax returns for 2004 through 2010 remain subject to examination by the Internal RevenueService. With few exceptions, we are no longer subject to examination by foreign tax jurisdictions, or state and city taxjurisdictions for years before 2005. In the event that we have determined not to file tax returns with a particular state or city, allyears remain subject to examination by the tax jurisdiction.
The ultimate outcome of tax matters may differ from our estimates and assumptions. Unfavorable settlement of anyparticular issue may require the use of cash and could result in increased income tax expense. Favorable resolution couldresult in reduced income tax expense. It is reasonably possible that our unrecognized tax benefits could increase or decreasesignificantly during the next twelve months due to the resolution of certain U.S. and international tax uncertainties; however itis not possible to estimate the potential change at this time.
Litigation. We record a liability when a loss from litigation is known or considered probable and the amount can bereasonably estimated. Our current estimated range of liability related to pending litigation is based on claims for which we canestimate the amount or range of loss. Based upon information presently available, we believe that accruals for these claimsare adequate. Due to uncertainties related to both the amount and range of loss on the remaining pending litigation, we areunable to make a reasonable estimate of the liability that could result from an unfavorable outcome. While these matters couldmaterially affect operating results in future periods depending on the final resolution, it is our opinion that after finaldisposition, any monetary liability to us beyond that provided in the Consolidated Balance Sheet as of December 31, 2011,would not be material to our financial position. As additional information becomes available, the potential liability related topending litigation will be assessed and estimates will be revised as necessary.
Intangibles. We record all assets and liabilities acquired in purchase acquisitions, including intangibles, at fair value.Intangible assets with a definite life are amortized based on a pattern in which the economic benefits of the assets areconsumed, typically with useful lives ranging from one to 30 years. The initial recognition of intangible assets, thedetermination of useful lives and subsequent impairment analysis require management to make subjective judgmentsconcerning estimates of how the acquired assets will perform in the future using valuation methods including discounted cashflow analysis. We evaluate assets on our balance sheet, including such intangible assets, whenever events or changes incircumstances indicate that their carrying value may not be recoverable. Factors such as unfavorable variances fromforecasted cash flows, established business plans or volatility inherent to external markets and industries may indicate apossible impairment that would require an impairment test. While we believe that the current carrying value of these assets isnot impaired, materially different assumptions regarding future performance of our businesses, which in many cases requiresubjective judgments concerning estimates, could result in significant impairment losses. The test for impairment requires acomparison of the carrying value of the asset or asset group with their estimated undiscounted future cash flows. If thecarrying value of the asset or asset group is considered impaired, an impairment charge is recorded for the amount by whichthe carrying value of the asset or asset group exceeds its fair value. As of December 31, 2011, we had $321.7 million ofdefinite-lived intangible assets subject to amortization. Due to additional losses, particularly in the U.S., an impairment testwas triggered and completed as of December 31, 2011, and no impairment was noted to exist. Given our intangible assetshave remaining useful lives of more than 25 years, and our operating segment cash flows (which excludes cash used by ourcorporate segment) remain sufficient over the projection period, our total estimated undiscounted cash flows well exceed ourcarrying value of intangible assets. While we believe that the current carrying value of these assets is not impaired, materiallydifferent assumptions regarding future performance of our businesses could result in significant impairment losses.
Goodwill. We record all assets and liabilities acquired in purchase acquisitions, including goodwill, at fair value. Theinitial recognition of goodwill and subsequent impairment analysis require management to make subjective judgmentsconcerning estimates of how the acquired assets will perform in the future using valuation methods including discounted cashflow analysis.
Goodwill is the excess of the cost of an acquired entity over the amounts assigned to assets acquired and liabilitiesassumed in a business combination. Goodwill is not amortized. Goodwill is considered impaired when its carrying amountexceeds its implied fair value. The first step of the impairment test involves comparing the fair value of the reporting unit towhich goodwill was assigned to its carrying amount. The second step of the impairment test compares the implied fair value ofthe reporting unit’s goodwill with the carrying amount of the reporting unit’s goodwill. If the carrying amount of the reporting
35

unit’s goodwill is greater than the implied fair value of the reporting unit’s goodwill an impairment loss must be recognized forthe excess. This involves measuring the fair value of the reporting unit’s assets and liabilities (both recognized andunrecognized) at the time of the impairment test. The difference between the reporting unit’s fair value and the fair valuesassigned to the reporting unit’s individual assets and liabilities is the implied fair value of the reporting unit’s goodwill.
Our reporting units for goodwill are our operating segments (Americas, Europe, North Asia and South Asia) with theexception of the Americas segment which is further divided between the Americas-Consumer, Americas-Commercial andMobile Security reporting units as determined by sales channel.
In evaluating whether goodwill was impaired, we compared the fair value of the Mobile Security reporting unit to itscarrying value (Step 1 of the impairment test). In calculating fair value, we used the income approach, a valuation techniqueunder which we estimate future cash flows using the reporting unit’s financial forecasts. Future estimated cash flows arediscounted to their present value to calculate fair value. In determining the fair value of the Mobile Security reporting unitunder the income approach, our expected cash flows are affected by various assumptions. Fair value on a discounted cashflow basis uses forecasts over a 10 year period with an estimation of residual growth rates thereafter. We use our businessplans and projections as the basis for expected future cash flows. A discount rate of 16.5 percent was used to reflect therelevant risks of the higher growth assumed for this reporting unit. An increase in the discount rate of one percent would havedecreased the reporting unit’s fair value by approximately $5.0 million while a decrease in the discount rate by one percentwould have increased the reporting unit’s fair value by $6.0 million. The revenue growth rates in 2012 through 2014 aresignificant assumptions within the projections. If revenue were decreased 10 percent for each year without a change inprojected SG&A costs or other cash flows, the indicated fair value of the reporting unit would be reduced by approximately$11.0 million.
The indicated excess in fair value over carrying value of the Mobile Security reporting unit in step one of the impairmenttest at November 30, 2011 and goodwill is as follows:
GoodwillReporting Unit
Carrying Amount
Excess of FairValue Over
Carrying Amount
Percentage ofFair Value
Over Carrying Amount
(In millions)
Mobile Security . . . . . . . . . . . . . . . . . . . . . . . . . . . . . . . . $31.3 $52.0 $13.0 25%
While this analysis indicates that this goodwill is not impaired, to the extent that actual results or other assumptionsabout future economic conditions or potential for our growth and profitability in this business changes, it is possible that ourconclusion regarding the remaining goodwill could change, which could have a material effect on our financial position andresults of operations.
During 2009 our reporting units for goodwill were our operating segments (Americas, Europe, Asia Pacific, andElectronic Products) with the exception of the Americas segment which was further divided between the Americas-Consumerand Americas-Commercial reporting units as determined by sales channel. During the second quarter of 2010 we realignedour corporate segments and reporting structure and combined our Electronic Products segment with our Americas segment,and we separated our Asia Pacific segment into North Asia and South Asia regions. As a result of the segment change, thegoodwill of $23.5 million which was previously allocated to the Electronics Products segment was merged into the Americas-Consumer reporting unit. The Americas-Consumer reporting unit had a fair value that was significantly less than its carryingamount prior to the combination, which is a triggering event for an interim goodwill impairment test. A two-step impairment testwas performed to identify a potential impairment and measure an impairment loss to be recognized. Based on this step of theimpairment test, we determined that the full amount of remaining goodwill, $23.5 million, was impaired.
Excess Inventory and Obsolescence. We write down our inventory for excess, slow moving and obsolescence to thenet realizable value based upon assumptions about future demand and market conditions. If actual market conditions are lessfavorable than those we project, additional write-downs may be required. As of December 31, 2011, the estimated inventorywrite-downs for excess inventory and obsolescence for inventory on hand was $43.4 million.
36

Rebates. We maintain an accrual for customer rebates that totaled $45.2 million as of December 31, 2011 included inother current liabilities. This accrual requires a program-by-program estimation of outcomes based on a variety of factorsincluding customer unit sell-through volumes and end user redemption rates. In the event that actual volumes and redemptionrates differ from the estimates used in the accrual calculation, adjustments to the accrual, upward or downward, may benecessary.
Restructuring Reserves. Employee-related severance charges are largely based upon distributed employment policiesand substantive severance plans. Generally, these charges are reflected in the quarter in which the Board approves theassociated actions, the actions are probable and the amounts are estimable. In the event that the Board approves theassociated actions post the balance sheet date, but ultimately confirms the existence of a probable liability as of the balancesheet date, a reasonable estimate of these charges are recorded in the period in which the probable liability existed. Thisestimate takes into account all information available as of the date the financial statements are issued. Severance amountsfor which affected employees were required to render service in order to receive benefits at their termination dates weremeasured at the date such benefits were communicated to the applicable employees and recognized as expense over theemployees’ remaining service periods.
Copyright Levies. In many European Union (“EU”) member countries, the sale of recordable optical media is subject toa private copyright levy. The levies are intended to compensate copyright holders for “fair compensation” for the harm causedby private copies made by natural persons of protected works under the European Copyright Directive, which becameeffective in 2002 (“Directive”). Levies are generally charged directly to the importer of the product upon the sale of theproducts. Payers of levies normally remit levy payments to collecting societies which in turn distribute funds to copyrightholders. Levy systems of EU member countries must comply with the Directive, but individual member countries areresponsible for administering their own systems. Since implementation, the levy systems have been the subject of numerouslitigation and law making activities. On October 21, 2010, the European Court of Justice (“ECJ”) ruled that fair compensationis an autonomous European law concept that was introduced by the Directive and must be uniformly applied in all EUmember states. The ECJ stated that fair compensation must be calculated based on the harm caused to the authors ofprotected works by private copying. The ECJ also stated that the indiscriminate application of the private copying levy todevices not made available to private users and clearly reserved for uses other than private copying is incompatible with theDirective. The ECJ ruling made clear that copyright holders are only entitled to fair compensation payments (funded by levypayments made by the Company) when sales of optical media are made to natural persons intending to make private copies.Based on this development, we began in 2010 withholding payments to various collecting societies of levies arising fromprofessional or commercial sales. Notwithstanding our view that the ECJ ruling was determinative, as of December 31, 2010,we continued to accrue a liability for all withheld levy payments in our financial statements.
Since the October 2010 ECJ ruling, quarterly we evaluated on a country-by-country basis whether (i) levies should beaccrued on current period sales of professional or commercial sales and (ii) accrued, but unpaid, levies on prior period salesshould be reversed. Our evaluation considers ongoing and cumulative developments related to levy litigation and law makingactivities throughout the EU. If we determine a levy obligation is remote, in the period of such determination we discontinueaccruing current period levies and reverse previously accrued, but unpaid amounts by reducing cost of goods sold. Cost ofgoods sold for the year ended December 31, 2011 was reduced by $7.8 million due to reversal of prior year levy accruals. Ona quarterly basis, cost of goods sold was reduced by $2.1 million, $1.9 million, and $3.8 million during the first, second, andthird quarters of 2011, respectively, due to reversal of prior year obligations that were determined to be remote.
Since the Directive was implemented in 2002, we have paid approximately $85 million in levies to various ongoingcollecting societies related to professional and commercial sales. Based on the ECJ’s October 2010 ruling and subsequentlitigation and law making activities, we believe that these payments were not consistent with the Directive and should not havebeen paid to the various collecting societies. At December 31, 2011, the recovery of some or all of these payments representa gain contingency that has not met the required criteria for recognition in our financial statements. There is no assurance thatwe will realize any of this gain contingency.
Due to this significant amount of over payments to the various collecting societies, beginning in 2010 for some countriesand 2011 for others, we have accrued and withheld payments of $19.7 million, as of December 31, 2011, from the collectingsocieties pending resolution of the over payments of prior years.
37
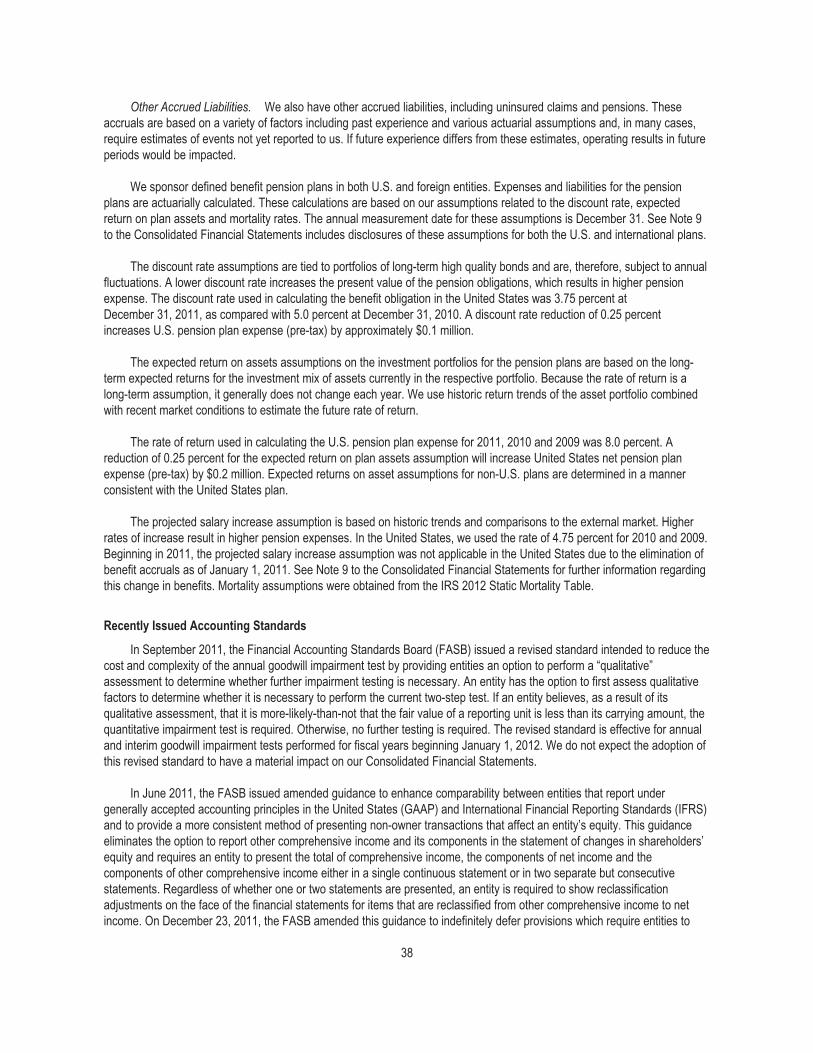
Other Accrued Liabilities. We also have other accrued liabilities, including uninsured claims and pensions. Theseaccruals are based on a variety of factors including past experience and various actuarial assumptions and, in many cases,require estimates of events not yet reported to us. If future experience differs from these estimates, operating results in futureperiods would be impacted.
We sponsor defined benefit pension plans in both U.S. and foreign entities. Expenses and liabilities for the pensionplans are actuarially calculated. These calculations are based on our assumptions related to the discount rate, expectedreturn on plan assets and mortality rates. The annual measurement date for these assumptions is December 31. See Note 9to the Consolidated Financial Statements includes disclosures of these assumptions for both the U.S. and international plans.
The discount rate assumptions are tied to portfolios of long-term high quality bonds and are, therefore, subject to annualfluctuations. A lower discount rate increases the present value of the pension obligations, which results in higher pensionexpense. The discount rate used in calculating the benefit obligation in the United States was 3.75 percent atDecember 31, 2011, as compared with 5.0 percent at December 31, 2010. A discount rate reduction of 0.25 percentincreases U.S. pension plan expense (pre-tax) by approximately $0.1 million.
The expected return on assets assumptions on the investment portfolios for the pension plans are based on the long-term expected returns for the investment mix of assets currently in the respective portfolio. Because the rate of return is along-term assumption, it generally does not change each year. We use historic return trends of the asset portfolio combinedwith recent market conditions to estimate the future rate of return.
The rate of return used in calculating the U.S. pension plan expense for 2011, 2010 and 2009 was 8.0 percent. Areduction of 0.25 percent for the expected return on plan assets assumption will increase United States net pension planexpense (pre-tax) by $0.2 million. Expected returns on asset assumptions for non-U.S. plans are determined in a mannerconsistent with the United States plan.
The projected salary increase assumption is based on historic trends and comparisons to the external market. Higherrates of increase result in higher pension expenses. In the United States, we used the rate of 4.75 percent for 2010 and 2009.Beginning in 2011, the projected salary increase assumption was not applicable in the United States due to the elimination ofbenefit accruals as of January 1, 2011. See Note 9 to the Consolidated Financial Statements for further information regardingthis change in benefits. Mortality assumptions were obtained from the IRS 2012 Static Mortality Table.
Recently Issued Accounting Standards
In September 2011, the Financial Accounting Standards Board (FASB) issued a revised standard intended to reduce thecost and complexity of the annual goodwill impairment test by providing entities an option to perform a “qualitative”assessment to determine whether further impairment testing is necessary. An entity has the option to first assess qualitativefactors to determine whether it is necessary to perform the current two-step test. If an entity believes, as a result of itsqualitative assessment, that it is more-likely-than-not that the fair value of a reporting unit is less than its carrying amount, thequantitative impairment test is required. Otherwise, no further testing is required. The revised standard is effective for annualand interim goodwill impairment tests performed for fiscal years beginning January 1, 2012. We do not expect the adoption ofthis revised standard to have a material impact on our Consolidated Financial Statements.
In June 2011, the FASB issued amended guidance to enhance comparability between entities that report undergenerally accepted accounting principles in the United States (GAAP) and International Financial Reporting Standards (IFRS)and to provide a more consistent method of presenting non-owner transactions that affect an entity’s equity. This guidanceeliminates the option to report other comprehensive income and its components in the statement of changes in shareholders’equity and requires an entity to present the total of comprehensive income, the components of net income and thecomponents of other comprehensive income either in a single continuous statement or in two separate but consecutivestatements. Regardless of whether one or two statements are presented, an entity is required to show reclassificationadjustments on the face of the financial statements for items that are reclassified from other comprehensive income to netincome. On December 23, 2011, the FASB amended this guidance to indefinitely defer provisions which require entities to
38

present reclassification adjustments out of accumulated other comprehensive income by component in both the statement inwhich net income is presented and the statement in which other comprehensive income is presented (for both interim andannual financial statements). This guidance is effective for interim and annual reporting periods beginning January 1, 2012.The adoption of this guidance will only change the presentation of our Consolidated Statements of Shareholders’ Equity andComprehensive Income.
In May 2011, the FASB issued amended disclosure requirements to provide a consistent definition of fair value andensure that the fair value measurement and disclosure requirements are similar between U.S. GAAP and IFRS. Thisguidance changes certain fair value measurement principles and enhances the disclosure requirements particularly for Level3 fair value measurements. This guidance is effective for reporting periods beginning January 1, 2012. We do not expectthese disclosures to have a material impact on our Consolidated Financial Statements.
A variety of proposed potential accounting standards are currently under study by standard setting organizations andvarious regulatory agencies. Due to the tentative and preliminary nature of those proposed standards, management has notdetermined whether implementation of such proposed standards would be material to our Condensed Consolidated FinancialStatements.
Forward-Looking Statements
We may from time to time make written or oral forward-looking statements with respect to our future goals, includingstatements contained in this Form 10-K, in our other filings with the SEC and in our reports to shareholders.
Certain information which does not relate to historical financial information may be deemed to constitute forward-lookingstatements within the meaning of the Private Securities Litigation Reform Act of 1995. The words or phrases “is targeting,”“will likely result,” “are expected to,” “will continue,” “is anticipated,” “estimate,” “project,” “believe,” or similar expressionsidentify “forward looking statements.” Such statements are subject to certain risks and uncertainties that could cause ouractual results in the future to differ materially from our historical results and those presently anticipated or projected. We wishto caution investors not to place undue reliance on any such forward-looking statements. Any forward-looking statementsspeak only as of the date on which such statements are made, and we undertake no obligation to update such statements toreflect events or circumstances arising after such date. Risk factors include our ability to successfully implement our strategy;our ability to grow our business in new products with profitable margins and the rate of revenue decline for certain existingproducts; the ability of our data security products to withstand cyber-attacks; the ability to quickly develop, source, introduceand deliver differentiating and innovative products; our potential dependence on third parties for new product introductions ortechnologies in order to introduce our own new products; the ready availability and price of energy and key raw materials orcritical components including due to the effects of natural disasters such as the October 2011 flooding in Thailand and ourability to pass along raw materials price increases to our customers; continuing uncertainty in global and regional economicconditions; our ability to identify, value, integrate and realize the expected benefits from any acquisition which has occurred ormay occur in connection with our strategy; the possibility that our goodwill or any goodwill that we acquire may becomeimpaired; the seasonality and volatility of the markets in which we operate; foreign currency fluctuations; changes in Europeanlaw or practice related to the imposition or collectability of optical levies; significant changes in discount rates and otherassumptions used in the valuation of our pension plans; the possibility that our intangible assets may become impaired;changes in tax laws, regulations and results of inspections by various tax authorities; our ability to successfully defend ourintellectual property rights and the ability or willingness of our suppliers to provide adequate protection against third partyintellectual property or product liability claims; the outcome of any pending or future litigation; failure to adequately protect ourinformation systems from cyber-attacks; our ability to meet our revenue growth, gross margin and earnings targets and thevolatility of our stock price due to our results or market trends, as well as various factors set forth in Item 1A of this Form 10-Kand from time to time in our filings with the SEC.
39

Item 7A. Quantitative and Qualitative Disclosures About Market Risk.
We are exposed to various market risks including volatility in foreign currency exchange rates and credit risk.International operations, which comprised approximately 60 percent of our revenue in 2011, may be subject to various risksthat are not present in domestic operations. The additional risks include political and economic instability, terrorist activity, thepossibility of expropriation, trade tariffs or embargoes, unfavorable tax laws, restrictions on royalties, dividends and currencyremittances, requirements for governmental approvals for new ventures and local participation in operations such as localequity ownership and workers’ councils.
Our foreign currency hedging policy attempts to manage some of the foreign currency risks over near term periods;however, we cannot ensure that these risk management activities will offset more than a portion of the adverse financialimpact resulting from unfavorable movements in foreign exchange rates or that medium and longer term effects of exchangerates will not be significant. Although we attempt to utilize hedging to manage the impact of changes in currency exchangerates, our revenue or costs are adversely impacted when the U.S. dollar sustains a strengthening position against currenciesin which we sell products or a weakening exchange rate against currencies in which we incur costs.
In accordance with established policies and procedures, we may utilize derivative financial instruments, includingforward exchange contracts, options, combination option strategies and swap agreements to manage certain of theseexposures. Factors that could impact the effectiveness of our hedging include the accuracy of our forecasts, the volatility ofthe currency markets and the availability of hedging instruments. We do not hold or issue derivative financial instruments fortrading or speculative purposes and we are not a party to leveraged derivative transactions. The utilization of derivatives andhedging activities is described more fully in Note 12 to the Consolidated Financial Statements.
As of December 31, 2011, we had $241.1 million notional amount of foreign currency forward and option contracts ofwhich $32.9 million hedged recorded balance sheet exposures. This compares to $293.1 million notional amount of foreigncurrency forward and option contracts as of December 31, 2010, of which $47.1 million hedged recorded balance sheetexposures. An immediate adverse change of 10 percent in year-end foreign currency exchange rates with all other variables(including interest rates) held constant would reduce the fair value of foreign currency contracts outstanding as ofDecember 31, 2011 by $6.6 million.
We are exposed to credit risk associated with cash investments and foreign currency derivatives. We do not believe thatour cash investments and foreign currency derivatives present significant credit risks because the counterparties to theinstruments consist of major financial institutions and we monitor and manage the notional amount of contracts entered intowith each counterparty.
40
Item 8. Financial Statements and Supplementary Data.
REPORT OF INDEPENDENT REGISTERED PUBLIC ACCOUNTING FIRM
To the Board of Directors and Shareholders of Imation Corp.:
In our opinion, the accompanying consolidated balance sheets and the related consolidated statements of operations, ofshareholders’ equity and comprehensive income (loss) and of cash flows present fairly, in all material respects, the financialposition of Imation Corp. and its subsidiaries (the “Company”) at December 31, 2011 and 2010, and the results of theiroperations and their cash flows for each of the three years in the period ended December 31, 2011 in conformity withaccounting principles generally accepted in the United States of America. Also in our opinion, the Company maintained, in allmaterial respects, effective internal control over financial reporting as of December 31, 2011, based on criteria established inInternal Control — Integrated Framework issued by the Committee of Sponsoring Organizations of the Treadway Commission(COSO). The Company’s management is responsible for these financial statements, for maintaining effective internal controlover financial reporting and for its assessment of the effectiveness of internal control over financial reporting, included inManagement’s Report on Internal Control over Financial Reporting appearing under Item 9A. Our responsibility is to expressopinions on these financial statements and on the Company’s internal control over financial reporting based on our integratedaudits. We conducted our audits in accordance with the standards of the Public Company Accounting Oversight Board(United States). Those standards require that we plan and perform the audits to obtain reasonable assurance about whetherthe financial statements are free of material misstatement and whether effective internal control over financial reporting wasmaintained in all material respects. Our audits of the financial statements included examining, on a test basis, evidencesupporting the amounts and disclosures in the financial statements, assessing the accounting principles used and significantestimates made by management, and evaluating the overall financial statement presentation. Our audit of internal control overfinancial reporting included obtaining an understanding of internal control over financial reporting, assessing the risk that amaterial weakness exists, and testing and evaluating the design and operating effectiveness of internal control based on theassessed risk. Our audits also included performing such other procedures as we considered necessary in the circumstances.We believe that our audits provide a reasonable basis for our opinions.
A company’s internal control over financial reporting is a process designed to provide reasonable assurance regardingthe reliability of financial reporting and the preparation of financial statements for external purposes in accordance withgenerally accepted accounting principles. A company’s internal control over financial reporting includes those policies andprocedures that (i) pertain to the maintenance of records that, in reasonable detail, accurately and fairly reflect thetransactions and dispositions of the assets of the company; (ii) provide reasonable assurance that transactions are recordedas necessary to permit preparation of financial statements in accordance with generally accepted accounting principles, andthat receipts and expenditures of the company are being made only in accordance with authorizations of management anddirectors of the company; and (iii) provide reasonable assurance regarding prevention or timely detection of unauthorizedacquisition, use, or disposition of the company’s assets that could have a material effect on the financial statements.
Because of its inherent limitations, internal control over financial reporting may not prevent or detect misstatements.Also, projections of any evaluation of effectiveness to future periods are subject to the risk that controls may becomeinadequate because of changes in conditions, or that the degree of compliance with the policies or procedures maydeteriorate.
/s/ PRICEWATERHOUSECOOPERS LLPMinneapolis, MinnesotaFebruary 28, 2012
41

IMATION CORP.
CONSOLIDATED STATEMENTS OF OPERATIONS
Years Ended December 31,
2011 2010 2009
(In millions, except per share amounts)
Net revenue . . . . . . . . . . . . . . . . . . . . . . . . . . . . . . . . . . . . . . . . . . . . . . . . . . . . . . . . . $1,290.4 $1,460.9 $1,649.5Cost of goods sold . . . . . . . . . . . . . . . . . . . . . . . . . . . . . . . . . . . . . . . . . . . . . . . . . . . . . 1,073.7 1,234.5 1,385.5
Gross profit . . . . . . . . . . . . . . . . . . . . . . . . . . . . . . . . . . . . . . . . . . . . . . . . . . . . . . 216.7 226.4 264.0Operating expenses:
Selling, general and administrative . . . . . . . . . . . . . . . . . . . . . . . . . . . . . . . . . . . . . 203.7 202.5 229.7Research and development . . . . . . . . . . . . . . . . . . . . . . . . . . . . . . . . . . . . . . . . . . 21.0 16.4 20.4Litigation settlements . . . . . . . . . . . . . . . . . . . . . . . . . . . . . . . . . . . . . . . . . . . . . . . 2.0 2.6 49.0Goodwill impairment . . . . . . . . . . . . . . . . . . . . . . . . . . . . . . . . . . . . . . . . . . . . . . . 1.6 23.5 —Restructuring and other . . . . . . . . . . . . . . . . . . . . . . . . . . . . . . . . . . . . . . . . . . . . . 21.5 51.1 26.6
Total . . . . . . . . . . . . . . . . . . . . . . . . . . . . . . . . . . . . . . . . . . . . . . . . . . . . . . . . . 249.8 296.1 325.7Operating loss . . . . . . . . . . . . . . . . . . . . . . . . . . . . . . . . . . . . . . . . . . . . . . . . . . . . . . . . (33.1) (69.7) (61.7)Other (income) and expense
Interest income . . . . . . . . . . . . . . . . . . . . . . . . . . . . . . . . . . . . . . . . . . . . . . . . . . . (0.9) (0.8) (0.7)Interest expense . . . . . . . . . . . . . . . . . . . . . . . . . . . . . . . . . . . . . . . . . . . . . . . . . . 3.7 4.2 2.9Other expense, net . . . . . . . . . . . . . . . . . . . . . . . . . . . . . . . . . . . . . . . . . . . . . . . . 7.0 3.3 12.8
Total . . . . . . . . . . . . . . . . . . . . . . . . . . . . . . . . . . . . . . . . . . . . . . . . . . . . . . . . . 9.8 6.7 15.0Loss from continuing operations before income taxes . . . . . . . . . . . . . . . . . . . . . . . . . . . (42.9) (76.4) (76.7)Income tax provision (benefit) . . . . . . . . . . . . . . . . . . . . . . . . . . . . . . . . . . . . . . . . . . . . 3.8 81.9 (32.7)
Loss from continuing operations . . . . . . . . . . . . . . . . . . . . . . . . . . . . . . . . . . . . . . . . . . . (46.7) (158.3) (44.0)Discontinued operations:
(Loss) income from discontinued operations, net of income taxes . . . . . . . . . . . . . . . . — (0.2) 1.8Net loss . . . . . . . . . . . . . . . . . . . . . . . . . . . . . . . . . . . . . . . . . . . . . . . . . . . . . . . . . . . . . $ (46.7) $ (158.5) $ (42.2)
(Loss) earnings per common share — basic:Continuing operations . . . . . . . . . . . . . . . . . . . . . . . . . . . . . . . . . . . . . . . . . . . . . . . . $ (1.24) $ (4.19) $ (1.17)Discontinued operations . . . . . . . . . . . . . . . . . . . . . . . . . . . . . . . . . . . . . . . . . . . . . . — (0.01) 0.05Net loss . . . . . . . . . . . . . . . . . . . . . . . . . . . . . . . . . . . . . . . . . . . . . . . . . . . . . . . . . . . (1.24) (4.19) (1.13)
(Loss) earnings per common share — diluted:Continuing operations . . . . . . . . . . . . . . . . . . . . . . . . . . . . . . . . . . . . . . . . . . . . . . . . $ (1.24) $ (4.19) $ (1.17)Discontinued operations . . . . . . . . . . . . . . . . . . . . . . . . . . . . . . . . . . . . . . . . . . . . . . — (0.01) 0.05Net loss . . . . . . . . . . . . . . . . . . . . . . . . . . . . . . . . . . . . . . . . . . . . . . . . . . . . . . . . . . . (1.24) (4.19) (1.13)
Weighted average shares outstanding:Basic . . . . . . . . . . . . . . . . . . . . . . . . . . . . . . . . . . . . . . . . . . . . . . . . . . . . . . . . . . . . . 37.7 37.8 37.5Diluted . . . . . . . . . . . . . . . . . . . . . . . . . . . . . . . . . . . . . . . . . . . . . . . . . . . . . . . . . . . 37.7 37.8 37.5
Cash dividend paid per common share . . . . . . . . . . . . . . . . . . . . . . . . . . . . . . . . . . . . . . $ — $ — $ —
The accompanying Notes to Consolidated Financial Statements are an integral part of these statements.
42

IMATION CORP.
CONSOLIDATED BALANCE SHEETS
As of December 31,
2011 2010
(In millions, except pershare amounts)
ASSETS
Current assetsCash and cash equivalents . . . . . . . . . . . . . . . . . . . . . . . . . . . . . . . . . . . . . . . . . . . . . . . . . . . . . . . $ 223.1 $ 304.9Accounts receivable, net . . . . . . . . . . . . . . . . . . . . . . . . . . . . . . . . . . . . . . . . . . . . . . . . . . . . . . . . 234.9 258.8Inventories . . . . . . . . . . . . . . . . . . . . . . . . . . . . . . . . . . . . . . . . . . . . . . . . . . . . . . . . . . . . . . . . . . . 208.8 203.3Other current assets . . . . . . . . . . . . . . . . . . . . . . . . . . . . . . . . . . . . . . . . . . . . . . . . . . . . . . . . . . . 49.7 74.2
Total current assets . . . . . . . . . . . . . . . . . . . . . . . . . . . . . . . . . . . . . . . . . . . . . . . . . . . . . . . . . . 716.5 841.2Property, plant and equipment, net . . . . . . . . . . . . . . . . . . . . . . . . . . . . . . . . . . . . . . . . . . . . . . . . . . . 55.4 66.9Intangible assets, net . . . . . . . . . . . . . . . . . . . . . . . . . . . . . . . . . . . . . . . . . . . . . . . . . . . . . . . . . . . . . 321.7 320.4Goodwill . . . . . . . . . . . . . . . . . . . . . . . . . . . . . . . . . . . . . . . . . . . . . . . . . . . . . . . . . . . . . . . . . . . . . . . 31.3 —Other assets . . . . . . . . . . . . . . . . . . . . . . . . . . . . . . . . . . . . . . . . . . . . . . . . . . . . . . . . . . . . . . . . . . . 24.4 22.5
Total assets . . . . . . . . . . . . . . . . . . . . . . . . . . . . . . . . . . . . . . . . . . . . . . . . . . . . . . . . . . . . . . . . $1,149.3 $1,251.0
LIABILITIES AND SHAREHOLDERS’ EQUITY
Current liabilitiesAccounts payable . . . . . . . . . . . . . . . . . . . . . . . . . . . . . . . . . . . . . . . . . . . . . . . . . . . . . . . . . . . . . . $ 205.2 $ 219.2Other current liabilities . . . . . . . . . . . . . . . . . . . . . . . . . . . . . . . . . . . . . . . . . . . . . . . . . . . . . . . . . . 151.2 172.3
Total current liabilities . . . . . . . . . . . . . . . . . . . . . . . . . . . . . . . . . . . . . . . . . . . . . . . . . . . . . . . . 356.4 391.5Other liabilities . . . . . . . . . . . . . . . . . . . . . . . . . . . . . . . . . . . . . . . . . . . . . . . . . . . . . . . . . . . . . . . . . . 69.2 77.8
Total liabilities . . . . . . . . . . . . . . . . . . . . . . . . . . . . . . . . . . . . . . . . . . . . . . . . . . . . . . . . . . . . . . 425.6 469.3
Commitments and contingencies (Note 15)Shareholders’ equity
Preferred stock, $.01 par value, authorized 25 million shares, none issued and outstanding . . . . . . . — —Common stock, $.01 par value, authorized 100 million shares, 42.9 million issued . . . . . . . . . . . . . . 0.4 0.4Additional paid-in capital . . . . . . . . . . . . . . . . . . . . . . . . . . . . . . . . . . . . . . . . . . . . . . . . . . . . . . . . . 1,107.8 1,103.6Retained deficit . . . . . . . . . . . . . . . . . . . . . . . . . . . . . . . . . . . . . . . . . . . . . . . . . . . . . . . . . . . . . . . (200.1) (153.4)Accumulated other comprehensive loss . . . . . . . . . . . . . . . . . . . . . . . . . . . . . . . . . . . . . . . . . . . . . (72.6) (60.7)Treasury stock, at cost . . . . . . . . . . . . . . . . . . . . . . . . . . . . . . . . . . . . . . . . . . . . . . . . . . . . . . . . . . (111.8) (108.2)
Total shareholders’ equity . . . . . . . . . . . . . . . . . . . . . . . . . . . . . . . . . . . . . . . . . . . . . . . . . . . . . 723.7 781.7
Total liabilities and shareholders’ equity . . . . . . . . . . . . . . . . . . . . . . . . . . . . . . . . . . . . . . . . . . . $1,149.3 $1,251.0
The accompanying Notes to Consolidated Financial Statements are an integral part of these statements.
43

IMATION CORP.
CONSOLIDATED STATEMENTS OF SHAREHOLDERS’ EQUITY AND COMPREHENSIVE INCOME (LOSS)
CommonStock
AdditionalPaid-inCapital
Retained(Deficit)
Earnings
AccumulatedOther
ComprehensiveLoss
TreasuryStock
TotalShareholders’
Equity
(In millions, except per share amounts)
Balance as of December 31, 2008 . . . . . . . . . . . . . . $0.4 $1,113.1 $ 47.3 $(85.0) $(131.2) $ 944.6
Restricted stock grants and other . . . . . . . . . . . . (3.8) 6.3 2.5401(k) matching contribution . . . . . . . . . . . . . . . . (1.9) 3.2 1.3Stock-based compensation related to options . . . 4.9 4.9Comprehensive loss:
Net loss . . . . . . . . . . . . . . . . . . . . . . . . . . . . . (42.2) (42.2)Net change in cumulative translation
adjustment . . . . . . . . . . . . . . . . . . . . . . . . . 4.5 4.5Pension adjustments (net of income tax
provision of $5.1) . . . . . . . . . . . . . . . . . . . . 9.8 9.8Cash flow hedging (net of income tax provision
of $0.9) . . . . . . . . . . . . . . . . . . . . . . . . . . . . 1.8 1.8
Comprehensive loss . . . . . . . . . . . . . . . . . . . . (26.1)
Balance as of December 31, 2009 . . . . . . . . . . . . . . $0.4 $1,112.3 $ 5.1 $(68.9) $(121.7) $ 927.2
Restricted stock grants and other . . . . . . . . . . . . (7.3) 9.9 2.6401(k) matching contribution . . . . . . . . . . . . . . . . (1.9) 3.6 1.7Stock-based compensation related to options . . . 3.8 3.8Share-based payment modification . . . . . . . . . . . 0.8 0.8Tax impact of stock-based compensation . . . . . . (4.1) (4.1)Comprehensive loss:
Net loss . . . . . . . . . . . . . . . . . . . . . . . . . . . . . (158.5) (158.5)Net change in cumulative translation
adjustment . . . . . . . . . . . . . . . . . . . . . . . . . 3.0 3.0Pension adjustments (net of income tax
provision of $3.6) . . . . . . . . . . . . . . . . . . . . 4.6 4.6Cash flow hedging (net of income tax provision
of $0.2) . . . . . . . . . . . . . . . . . . . . . . . . . . . . 0.6 0.6
Comprehensive loss . . . . . . . . . . . . . . . . . . . . (150.3)
Balance as of December 31, 2010 . . . . . . . . . . . . . . $0.4 $1,103.6 $(153.4) $(60.7) $(108.2) $ 781.7
Purchase of treasury stock . . . . . . . . . . . . . . . . . (9.7) (9.7)Restricted stock grants and other . . . . . . . . . . . . 0.7 3.4 4.1401(k) matching contribution . . . . . . . . . . . . . . . . (0.6) 2.7 2.1Stock-based compensation related to options . . . 4.1 4.1Comprehensive loss:
Net loss . . . . . . . . . . . . . . . . . . . . . . . . . . . . . (46.7) (46.7)Pension adjustments (net of income tax benefit
of $1.8) . . . . . . . . . . . . . . . . . . . . . . . . . . . . (12.7) (12.7)Cash flow hedging (net of income tax provision
of $0.3) . . . . . . . . . . . . . . . . . . . . . . . . . . . . 0.8 0.8
Comprehensive loss . . . . . . . . . . . . . . . . . . . . (58.6)
Balance as of December 31, 2011 . . . . . . . . . . . . . . $0.4 $1,107.8 $(200.1) $(72.6) $(111.8) $ 723.7
The accompanying Notes to Consolidated Financial Statements are an integral part of these statements.
44

IMATION CORP.
CONSOLIDATED STATEMENTS OF CASH FLOWS
Years Ended December 31,
2011 2010 2009
(In millions)
Cash Flows from Operating Activities:
Net loss . . . . . . . . . . . . . . . . . . . . . . . . . . . . . . . . . . . . . . . . . . . . . . . . . . . . . . . . . . . . . . . . $ (46.7) $(158.5) $ (42.2)Adjustments to reconcile net loss to net cash provided by operating activities:
Depreciation . . . . . . . . . . . . . . . . . . . . . . . . . . . . . . . . . . . . . . . . . . . . . . . . . . . . . . . . . . 10.7 18.2 19.7Intangible amortization . . . . . . . . . . . . . . . . . . . . . . . . . . . . . . . . . . . . . . . . . . . . . . . . . . . 26.0 23.6 23.3Deferred income taxes . . . . . . . . . . . . . . . . . . . . . . . . . . . . . . . . . . . . . . . . . . . . . . . . . . . (2.9) (48.6) (2.0)Goodwill impairment . . . . . . . . . . . . . . . . . . . . . . . . . . . . . . . . . . . . . . . . . . . . . . . . . . . . 1.6 23.5 —Asset disposals/impairments . . . . . . . . . . . . . . . . . . . . . . . . . . . . . . . . . . . . . . . . . . . . . . 7.0 31.2 2.7Inventory write-downs . . . . . . . . . . . . . . . . . . . . . . . . . . . . . . . . . . . . . . . . . . . . . . . . . . . 9.1 14.2 —Stock-based compensation . . . . . . . . . . . . . . . . . . . . . . . . . . . . . . . . . . . . . . . . . . . . . . . 7.5 6.9 7.5Pension settlement/curtailment . . . . . . . . . . . . . . . . . . . . . . . . . . . . . . . . . . . . . . . . . . . . . 3.1 2.8 11.7Deferred tax asset valuation allowance . . . . . . . . . . . . . . . . . . . . . . . . . . . . . . . . . . . . . . . — 105.6 —Litigation settlements . . . . . . . . . . . . . . . . . . . . . . . . . . . . . . . . . . . . . . . . . . . . . . . . . . . . 2.0 2.6 49.0Other . . . . . . . . . . . . . . . . . . . . . . . . . . . . . . . . . . . . . . . . . . . . . . . . . . . . . . . . . . . . . . . . 9.8 5.4 9.2
Changes in operating assets and liabilities, net of effects from acquisitions:Litigation settlement payments . . . . . . . . . . . . . . . . . . . . . . . . . . . . . . . . . . . . . . . . . . . . . (10.9) (8.2) (20.0)Accounts receivable . . . . . . . . . . . . . . . . . . . . . . . . . . . . . . . . . . . . . . . . . . . . . . . . . . . . . 28.0 59.7 67.6Inventories . . . . . . . . . . . . . . . . . . . . . . . . . . . . . . . . . . . . . . . . . . . . . . . . . . . . . . . . . . . . (12.2) 16.1 132.9Restricted cash . . . . . . . . . . . . . . . . . . . . . . . . . . . . . . . . . . . . . . . . . . . . . . . . . . . . . . . . 4.2 1.2 (19.2)Other assets . . . . . . . . . . . . . . . . . . . . . . . . . . . . . . . . . . . . . . . . . . . . . . . . . . . . . . . . . . 1.3 53.7 (19.4)Accounts payable . . . . . . . . . . . . . . . . . . . . . . . . . . . . . . . . . . . . . . . . . . . . . . . . . . . . . . (17.7) 13.6 (98.4)Other liabilities . . . . . . . . . . . . . . . . . . . . . . . . . . . . . . . . . . . . . . . . . . . . . . . . . . . . . . . . . (36.2) (11.6) (54.9)
Net cash (used in) provided by operating activities . . . . . . . . . . . . . . . . . . . . . . . . . . . . (16.3) 151.4 67.5Cash Flows from Investing Activities:
Capital expenditures . . . . . . . . . . . . . . . . . . . . . . . . . . . . . . . . . . . . . . . . . . . . . . . . . . . . . . (7.3) (8.3) (11.0)License agreement . . . . . . . . . . . . . . . . . . . . . . . . . . . . . . . . . . . . . . . . . . . . . . . . . . . . . . . — (5.0) —Acquisitions, net of cash acquired . . . . . . . . . . . . . . . . . . . . . . . . . . . . . . . . . . . . . . . . . . . . . (47.0) — —Proceeds from sale of assets . . . . . . . . . . . . . . . . . . . . . . . . . . . . . . . . . . . . . . . . . . . . . . . . — 0.2 13.0
Net cash (used in) provided by investing activities . . . . . . . . . . . . . . . . . . . . . . . . . . . . (54.3) (13.1) 2.0Cash Flows from Financing Activities:
Purchase of treasury stock . . . . . . . . . . . . . . . . . . . . . . . . . . . . . . . . . . . . . . . . . . . . . . . . . . (9.7) — —Exercise of stock options . . . . . . . . . . . . . . . . . . . . . . . . . . . . . . . . . . . . . . . . . . . . . . . . . . . 0.6 — —Debt issuance costs . . . . . . . . . . . . . . . . . . . . . . . . . . . . . . . . . . . . . . . . . . . . . . . . . . . . . . . — (1.0) (3.2)
Net cash used in financing activities . . . . . . . . . . . . . . . . . . . . . . . . . . . . . . . . . . . . . . . (9.1) (1.0) (3.2)Effect of exchange rate changes on cash and cash equivalents . . . . . . . . . . . . . . . . . . . . . . . . . (2.1) 4.2 0.5
Change in cash and equivalents . . . . . . . . . . . . . . . . . . . . . . . . . . . . . . . . . . . . . . . . . . . . . . . . (81.8) 141.5 66.8Cash and cash equivalents — beginning of year . . . . . . . . . . . . . . . . . . . . . . . . . . . . . . . . . . . . 304.9 163.4 96.6
Cash and cash equivalents — end of year . . . . . . . . . . . . . . . . . . . . . . . . . . . . . . . . . . . . . . . . $223.1 $ 304.9 $163.4
The accompanying Notes to Consolidated Financial Statements are an integral part of these statements.
45

IMATION CORP.
NOTES TO CONSOLIDATED FINANCIAL STATEMENTS
Note 1 — Background and Basis of Presentation
Background
Imation Corp., a Delaware corporation, was formed in 1996 as a result of the spin-off of substantially all of thebusinesses which comprised the data storage and imaging systems groups of 3M Company. As used herein, the terms“Imation,” “Company,” “we,” “us,” or “our” mean Imation Corp. and its subsidiaries unless the context indicates otherwise. Weare a global scalable storage and data security company. Our portfolio includes tiered storage and security offerings forbusiness and products designed to manage audio and video information in the home. Imation reaches customers in morethan 100 countries through a global distribution network and well recognized brands.
Basis of Presentation
The Consolidated Financial Statements include our accounts and our wholly- or majority-owned subsidiaries, and havebeen prepared in accordance with accounting principles generally accepted in the United States of America (GAAP). Allsignificant inter-company transactions have been eliminated.
As a result of the wind down of our Global Data Media (GDM) joint venture during 2009 it was determined that the GDMoperations and cash flows would be eliminated from our ongoing operations and that we would not have any significantcontinuing involvement in the operations of GDM after the exit of the joint venture. As a result, these operations are presentedin our Consolidated Financial Statements as discontinued operations for all periods presented. See Note 4 herein foradditional information.
Note 2 — Summary of Significant Accounting Policies
Use of Estimates. The preparation of financial statements in conformity with GAAP requires management to makeestimates and assumptions that affect the reported asset and liability amounts, and the contingent asset and liabilitydisclosures at the date of the financial statements, as well as the revenue and expense amounts reported during the period.Actual results could differ from those estimates.
Foreign Currency. For operations in local currency environments, assets and liabilities are translated at year-endexchange rates with cumulative translation adjustments included as a component of shareholders’ equity and income andexpense items are translated at average foreign exchange rates prevailing during the year. For operations in which theU.S. dollar is not considered the functional currency, certain financial statements amounts are re-measured at historicalexchange rates, with all other asset and liability amounts translated at year-end exchange rates. These re-measuredadjustments are reflected in the results of operations. Gains and losses from foreign currency transactions are included in theConsolidated Statements of Operations.
Cash Equivalents. Cash equivalents consisted of highly liquid investments purchased with original maturities of threemonths or less. The carrying amounts reported in the Consolidated Balance Sheets for cash equivalents approximate fairvalue. At December 31, 2010 restricted cash included $12.0 million for a payment made in 2011 related to the TDK VATliability. As of December 31, 2011 all restricted cash is related to contractual obligations. Restricted cash is included in otherassets on our Consolidated Balance Sheets.
Trade Accounts Receivable and Allowances. Trade accounts receivable are initially recorded at the invoiced amountupon the sale of goods or services to customers and do not bear interest. They are stated net of allowances, which primarilyrepresent estimated amounts for expected customer returns, allowances and deductions for a variety of claims such as termsdiscounts or the inability of certain customers to make the required payments. When determining the allowances, we takeseveral factors into consideration, including prior history of accounts receivable credit activity and write-offs, the overallcomposition of accounts receivable aging, the types of customers and our day-to-day knowledge of specific customers.Changes in the allowances are recorded as reductions of net revenue or as bad debt expense (included in selling, general
46

NOTES TO CONSOLIDATED FINANCIAL STATEMENTS — (Continued)
and administrative expense), as appropriate, in the Consolidated Statements of Operations. In general, accounts which haveentered into an insolvency action, have been returned by a collection agency as uncollectible or whose existence can nolonger be confirmed are charged-off in full. If, subsequent to the charge-off, a portion of the account is recovered, it isrecorded as an increase to revenue or reduction of bad debt expense, as appropriate, in the Consolidated Statements ofOperations at the time cash is received.
Inventories. Inventories are valued at the lower of cost or market, with cost generally determined on a first-in, first-outbasis. We provide estimated inventory write-downs for excess, slow-moving and obsolete inventory as well as inventory with acarrying value in excess of net realizable value.
Derivative Financial Instruments. We recognize all derivatives, including foreign currency exchange contracts on thebalance sheet at fair value. Derivatives that are not hedges are recorded at fair value through operations. If a derivative is ahedge, depending on the nature of the hedge, changes in the fair value of the derivative are either offset against the changein fair value of the underlying assets or liabilities through operations or recognized in accumulated other comprehensive lossin shareholders’ equity until the underlying hedged item is recognized in operations. These gains and losses are generallyrecognized as an adjustment to cost of goods sold for inventory-related hedge transactions, or as adjustments to foreigncurrency transaction gains or losses included in non-operating expenses for foreign denominated payables and receivables-related hedge transactions. Cash flows attributable to these financial instruments are included with cash flows of theassociated hedged items. The ineffective portion of a derivative’s change in fair value is immediately recognized in operations.
Property, Plant and Equipment. Property, plant and equipment, including leasehold and other improvements thatextend an asset’s useful life or productive capabilities, are recorded at cost. Maintenance and repairs are expensed asincurred. The cost and related accumulated depreciation of assets sold or otherwise disposed are removed from the relatedaccounts and the gains or losses are reflected in the results of operations.
Property, plant and equipment are generally depreciated on a straight-line basis over their estimated useful lives. Theestimated depreciable lives range from 10 to 20 years for buildings and 5 to 10 years for machinery and equipment.Leasehold and other improvements are amortized over the lesser of the remaining life of the lease or the estimated useful lifeof the improvement.
Intangible Assets. Intangible assets include trade names, customer relationships and other intangible assets acquiredin business combinations. Intangible assets are amortized using methods that approximate the benefit provided by utilizationof the assets.
We record all assets and liabilities acquired in purchase acquisitions, including intangibles, at fair value. The initialrecognition of intangible assets, the determination of useful lives and subsequent impairment analyses require managementto make subjective judgments concerning estimates of how the acquired assets will perform in the future using valuationmethods including discounted cash flow analysis. As of December 31, 2011, we had $321.7 million of definite-lived intangibleassets subject to amortization. While we believe that the current carrying value of these assets is not impaired, materiallydifferent assumptions regarding future performance of our businesses could result in significant impairment losses.
We capitalize costs of software developed or obtained for internal use, once the preliminary project stage has beencompleted, management commits to funding the project and it is probable that the project will be completed and the softwarewill be used to perform the function intended. Capitalized costs include only (1) external direct costs of materials and servicesconsumed in developing or obtaining internal-use software, (2) payroll and payroll-related costs for employees who aredirectly associated with and who devote time to the internal-use software project and (3) interest costs incurred, whenmaterial, while developing internal-use software. Capitalization of costs ceases when the project is substantially complete andready for its intended use.
Goodwill. Goodwill is the excess of the cost of an acquired entity over the amounts assigned to assets acquired andliabilities assumed in a business combination. Goodwill is not amortized. Goodwill is considered impaired when its carryingamount exceeds its implied fair value. The first step of the impairment test involves comparing the fair value of the reporting
47
NOTES TO CONSOLIDATED FINANCIAL STATEMENTS — (Continued)
unit to which goodwill was assigned to its carrying amount. If fair value is deemed to be less than carrying value, the secondstep of the impairment test compares the implied fair value of the reporting unit’s goodwill with the carrying amount of thereporting unit’s goodwill. If the carrying amount of the reporting unit’s goodwill is greater than the implied fair value of thereporting unit’s goodwill an impairment loss must be recognized for the excess. This involves measuring the fair value of thereporting unit’s assets and liabilities (both recognized and unrecognized) at the time of the impairment test. The differencebetween the reporting unit’s fair value and the fair values assigned to the reporting unit’s individual assets and liabilities is theimplied fair value of the reporting unit’s goodwill.
Our reporting units for goodwill are our operating segments (Americas, Europe, North Asia and South Asia) with theexception of the Americas segment which is further divided between the Americas-Consumer, Americas-Commercial andMobile Security reporting units as determined by sales channel. At December 31, 2011, the only reporting unit which hadgoodwill was Mobile Security.
In evaluating whether goodwill was impaired, we compared the fair value of the Mobile Security reporting unit to it’scarrying value (Step 1 of the impairment test). In calculating fair value, we used the income approach, a valuation techniqueunder which we estimate future cash flows using the reporting unit’s financial forecasts. Future estimated cash flows arediscounted to their present value to calculate fair value. In determining the fair value of the Mobile Security reporting unitunder the income approach, our expected cash flows are affected by various assumptions. Fair value on a discounted cashflow basis uses forecasts over a 10 year period with an estimation of residual growth rates thereafter. We use our businessplans and projections as the basis for expected future cash flows. A discount rate of 16.5 percent was used to reflect therelevant risks of the higher growth assumed for this reporting unit. The revenue growths in 2012 through 2014 are significantassumptions within the projections. Based on the goodwill test performed, we determined that the fair value of the reportingunit exceeded its carrying amount. See Note 6 herein for additional information.
Impairment of Long-Lived Assets. We periodically review the carrying value of our property and equipment and ourintangible assets to test whether current events or circumstances indicate that such carrying value may not be recoverable. Ifthe tests indicate that the carrying value of the asset is greater than the expected undiscounted cash flows to be generated bysuch asset or asset group, an impairment loss would be recognized. The impairment loss is determined by the amount bywhich the carrying value of such asset or asset group exceeds its fair value. We generally measure fair value by consideringsale prices for similar assets or by discounting estimated future cash flows from such assets using an appropriate discountrate. Assets to be disposed of are carried at the lower of their carrying value or fair value less costs to sell. Considerablemanagement judgment is necessary to estimate the fair value of assets and, accordingly, actual results could varysignificantly from such estimates.
In conjunction with the 2011 manufacturing redesign restructuring program announced in January 2011, certain assetsheld primarily at our Weatherford, Oklahoma facility were determined to be impaired in accordance with the provisions ofimpairment of long-lived assets. These long-lived assets held and used include the property, building and equipment primarilyrelated to the manufacturing of magnetic tape which was consolidated to the TDK Group Yamanashi manufacturing facility inApril 2011. TDK Corporation (TDK) is a related party to Imation. These assets had a carrying amount of $17.0 million andwere written down to their fair value of $2.3 million, resulting in an impairment charge of $14.7 million during 2010. The fairvalue of the equipment was assessed based upon sales proceeds from similar equipment sold as part of the closing of ourCamarillo, California facility. These assets had a carrying amount of $17.3 million and were written down to their fair value of$0.8 million, resulting in an impairment charge of $16.5 million during 2010. The impairments were recorded as part ofrestructuring and other charges in the Consolidated Statements of Operations in 2010.
As of June 30, 2011, the Weatherford facility met the criteria for classification as held for sale outlined in the accountingguidance for the sale of a long-lived asset. Accordingly, the book value of the building and property were transferred into othercurrent assets on the Consolidated Balance Sheets and is no longer being depreciated.
Revenue Recognition. We sell a wide range of removable data storage media products as well as certain consumerelectronic products. Net revenue consists primarily of magnetic, optical, flash media, consumer electronics and accessories
48

NOTES TO CONSOLIDATED FINANCIAL STATEMENTS — (Continued)
sales. We recognize revenue when persuasive evidence of an arrangement exists, delivery has occurred or services havebeen rendered, fees are fixed or determinable and collectability is reasonably assured. For product sales, delivery isconsidered to have occurred when the risks and rewards of ownership transfer to the customer. For inventory maintained atthe customer site, revenue is recognized at the time these products are sold by the customer. We base our estimates forreturns on historical experience and have not experienced significant fluctuations between estimated and actual returnactivity. Non-income based taxes collected from customers and remitted to governmental authorities include levies andvarious excise taxes, mainly in non U.S. jurisdictions. These taxes included in revenue in 2011, 2010, and 2009 were $20.3million, $28.3 million, and $50.9 million, respectively.
Copyright Levies. In many European Union (“EU”) member countries, the sale of recordable optical media is subject toa private copyright levy. The levies are intended to compensate copyright holders for “fair compensation” for the harm causedby private copies made by natural persons of protected works under the European Copyright Directive, which becameeffective in 2002 (“Directive”). Levies are generally charged directly to the importer of the product upon the sale of theproducts. Payers of levies normally remit levy payments to collecting societies which in turn distribute funds to copyrightholders. Levy systems of EU member countries must comply with the Directive, but individual member countries areresponsible for administering their own systems. Since implementation, the levy systems have been the subject of numerouslitigation and law making activities. On October 21, 2010, the European Court of Justice (“ECJ”) ruled that fair compensationis an autonomous European law concept that was introduced by the Directive and must be uniformly applied in all EUmember states. The ECJ stated that fair compensation must be calculated based on the harm caused to the authors ofprotected works by private copying. The ECJ also stated that the indiscriminate application of the private copying levy todevices not made available to private users and clearly reserved for uses other than private copying is incompatible with theDirective. The ECJ ruling made clear that copyright holders are only entitled to fair compensation payments (funded by levypayments made by the Company) when sales of optical media are made to natural persons intending to make private copies.Based on this development, we began in 2010 withholding payments to various collecting societies of levies arising fromprofessional or commercial sales. Notwithstanding our view that the ECJ ruling was determinative, as of December 31, 2010,we continued to accrue a liability for all withheld levy payments in our financial statements.
Since the October 2010 ECJ ruling, quarterly we evaluated on a country-by-country basis whether (i) levies should beaccrued on current period sales of professional or commercial sales and (ii) accrued, but unpaid, levies on prior period salesshould be reversed. Our evaluation considers ongoing and cumulative developments related to levy litigation and law makingactivities throughout the EU. If we determine a levy obligation is remote, in the period of such determination we discontinueaccruing current period levies and reverse previously accrued, but unpaid amounts by reducing cost of goods sold. Cost ofgoods sold for the year ended December 31, 2011 was reduced by $7.8 million due to reversal of prior year levy accruals. Ona quarterly basis, cost of goods sold was reduced by $2.1 million, $1.9 million, and $3.8 million during the first, second, andthird quarters of 2011, respectively, due to reversal of prior year obligations that were determined to be remote.
Since the Directive was implemented in 2002, we have paid approximately $85 million in levies to various ongoingcollecting societies related to professional and commercial sales. Based on the ECJ’s October 2010 ruling and subsequentlitigation and law making activities, we believe that these payments were not consistent with the Directive and should not havebeen paid to the various collecting societies. At December 31, 2011, the recovery of some or all of these payments representa gain contingency that has not met the required criteria for recognition in our financial statements. There is no assurance thatwe will realize any of this gain contingency.
Due to this significant amount of over payments to the various collecting societies, beginning in 2010 for some countriesand 2011 for others, we have accrued and withheld payments of $19.7 million, as of December 31, 2011, from the collectingsocieties pending resolution of the over payments of prior years.
Concentrations of Credit Risk. We sell a wide range of products and services to a diversified base of customersaround the world and perform ongoing credit evaluations of our customers’ financial condition. Therefore, we believe there isno material concentration of credit risk. No single customer represented more than 10 percent of total net revenue in 2011,2010, or 2009.
49

NOTES TO CONSOLIDATED FINANCIAL STATEMENTS — (Continued)
Inventory Related Shipping and Handling Costs. Costs related to shipping and handling are included in cost of goodssold.
Research and Development Costs. Research and development costs are charged to expense as incurred. Researchand development costs include salaries, stock compensation, payroll taxes, employee benefit costs, supplies, depreciationand maintenance of research equipment as well as the allocable portion of facility costs such as rent, utilities, insurance,repairs, maintenance and general support services.
Advertising Costs. Advertising and other promotional costs are expensed as incurred and were approximately$2 million, $4 million and $6 million in 2011, 2010 and 2009, respectively. Prepaid advertising costs were not significant atDecember 31, 2011 or 2010.
Rebates. We provide rebates to our customers. Customer rebates are accounted for as a reduction of revenue at thetime of sale based on an estimate of the cost to honor the related rebate programs.
Rebates Received. We receive rebates from some of our inventory vendors if we achieve pre-determined purchasingthresholds. These rebates are included as a reduction of our cost of goods sold in the period in which the purchased inventoryis sold, allocated using a systematic and rational method.
Restructuring Reserves. Employee-related severance charges are largely based upon distributed employment policiesand substantive severance plans. Generally, these charges are reflected in the period in which the Board approves theassociated actions, the actions are probable and the amounts are estimable. In the event that the Board approves theassociated actions after the balance sheet date, but ultimately confirms the existence of a probable liability as of the balancesheet date, a reasonable estimate of these charges are recorded in the period in which the probable liability existed. Thisestimate takes into account all information available as of the date the financial statements are issued. Severance amountsfor which affected employees were required to render service in order to receive benefits at their termination dates weremeasured at the date such benefits were communicated to the applicable employees and recognized as expense over theemployees’ remaining service periods.
Income Taxes. We are required to estimate our income taxes in each of the jurisdictions in which we operate. Thisprocess involves estimating our actual current tax obligations based on expected taxable income, statutory tax rates and taxcredits allowed in the various jurisdictions in which we operate. Tax laws require certain items to be included in our tax returnsat different times than the items are reflected in our results of operations. Some of these differences are permanent, such asexpenses that are not deductible in our tax returns, and some are temporary differences that will reverse over time.Temporary differences result in deferred tax assets and liabilities, which are included within our Consolidated Balance Sheets.We must assess the likelihood that our deferred tax assets will be realized and establish a valuation allowance to the extentnecessary. Significant judgment is required in evaluating our tax positions, and in determining our provision for income taxes,our deferred tax assets and liabilities and any valuation allowance recorded against our net deferred tax assets.
We record income taxes using the asset and liability approach. Under this approach, deferred tax assets and liabilitiesare recognized for the expected future tax consequences of temporary differences between the book and tax basis of assetsand liabilities. We measure deferred tax assets and liabilities using the enacted statutory tax rates that are expected to applyin the years in which the temporary differences are expected to be recovered or paid.
We regularly assess the likelihood that our deferred tax assets will be recovered in the future. A valuation allowance isrecorded to the extent we conclude a deferred tax asset is not considered to be more-likely-than-not to be realized. Weconsider all positive and negative evidence related to the realization of the deferred tax assets in assessing the need for avaluation allowance. If we determine we will not realize all or part of our deferred tax assets, an adjustment to the deferred taxasset will be charged to earnings in the period such determination is made.
50
NOTES TO CONSOLIDATED FINANCIAL STATEMENTS — (Continued)
At December 31, 2011, our net deferred tax asset was $21.1 million, which relates to foreign jurisdictions. Thesedeferred tax assets are net of a valuation allowance of $141.1 million, primarily related to the deferred tax assets in the U.S.
Our income tax returns are subject to review by various U.S. and foreign taxing authorities. As such, we record accrualsfor items that we believe may be challenged by these taxing authorities. The threshold for recognizing the benefit of a taxreturn position in the financial statements is that the position must be more-likely-than-not to be sustained by the taxingauthorities based solely on the technical merits of the position. If the recognition threshold is met, the tax benefit is measuredand recognized as the largest amount of tax benefit that, in our judgment, is greater than 50 percent likely to be realized.Interest and penalties recorded for uncertain tax positions are included in our income tax provision.
Treasury Stock. Our repurchases of shares of common stock are recorded as treasury stock and are presented as areduction of shareholders’ equity. When treasury shares are reissued, we use a last-in, first-out method and the differencebetween repurchase cost and fair value at reissuance is treated as an adjustment to equity.
Stock-Based Compensation. Share-based compensation awards are measured at fair value at the date of grant andexpensed over their vesting or service periods.
The fair value of each option award is estimated on the date of grant using the Black-Scholes option valuation model.Expected volatilities are based on historical volatility of our stock. The risk-free rate for the contractual life of the option isbased on the U.S. Treasury yield curve in effect at the time of grant. We use historical data to estimate option exercise andemployee termination activity within the valuation model. The expected term of stock options granted is based on historicaldata and represents the period of time that stock options granted are expected to be outstanding. The dividend yield, ifapplicable, is based on the latest dividend payments made on or announced by the date of the grant. Forfeitures areestimated based on historical experience and current demographics. See Note 8 herein for further information regardingstock-based compensation.
Comprehensive Income. Comprehensive income (loss) includes net income (loss), the effects of currency translation,unrealized gains and losses on cash flow hedges and pension adjustments. Comprehensive income (loss) for all yearspresented is included in the Consolidated Statements of Shareholders’ Equity and Comprehensive Income (Loss).
Weighted Average Basic and Diluted Shares Outstanding. Basic earnings per share is calculated using the weightedaverage number of shares outstanding during the year. Diluted earnings per share is computed on the basis of the weightedaverage basic shares outstanding plus the dilutive effect of our stock-based compensation plans using the “treasury stock” method.See Note 3 herein for further information regarding the calculation of weighted average basic and diluted shares outstanding.
Recent Accounting Pronouncements
In September 2011, the Financial Accounting Standards Board (FASB) issued a revised standard intended to reduce thecost and complexity of the annual goodwill impairment test by providing entities an option to perform a “qualitative”assessment to determine whether further impairment testing is necessary. An entity has the option to first assess qualitativefactors to determine whether it is necessary to perform the current two-step test. If an entity believes, as a result of itsqualitative assessment, that it is more-likely-than-not that the fair value of a reporting unit is less than its carrying amount, thequantitative impairment test is required. Otherwise, no further testing is required. The revised standard is effective for annualand interim goodwill impairment tests performed for fiscal years beginning January 1, 2012. We do not expect the adoption ofthis revised standard to have a material impact on our Consolidated Financial Statements.
In June 2011, the FASB issued amended guidance to enhance comparability between entities that report under GAAPand International Financial Reporting Standards (IFRS) and to provide a more consistent method of presenting non-ownertransactions that affect an entity’s equity. This guidance eliminates the option to report other comprehensive income and itscomponents in the statement of changes in shareholders’ equity and requires an entity to present the total of comprehensiveincome, the components of net income and the components of other comprehensive income either in a single continuous
51
NOTES TO CONSOLIDATED FINANCIAL STATEMENTS — (Continued)
statement or in two separate but consecutive statements. Regardless of whether one or two statements are presented, anentity is required to show reclassification adjustments on the face of the financial statements for items that are reclassifiedfrom other comprehensive income to net income. On December 23, 2011, the FASB amended this guidance to indefinitelydefer provisions which require entities to present reclassification adjustments out of accumulated other comprehensiveincome by component in both the statement in which net income is presented and the statement in which othercomprehensive income is presented (for both interim and annual financial statements). This guidance is effective for interimand annual reporting periods beginning January 1, 2012. The adoption of this guidance will only change the presentation ofour Consolidated Statements of Shareholders’ Equity and Comprehensive Income.
In May 2011, the FASB issued amended disclosure requirements to provide a consistent definition of fair value andensure that the fair value measurement and disclosure requirements are similar between U.S. GAAP and IFRS. Thisguidance changes certain fair value measurement principles and enhances the disclosure requirements particularly for Level3 fair value measurements. This guidance is effective for reporting periods beginning January 1, 2012. We do not expectthese disclosures to have a material impact on our Consolidated Financial Statements.
A variety of proposed potential accounting standards are currently under study by standard setting organizations andvarious regulatory agencies. Due to the tentative and preliminary nature of those proposed standards, management has notdetermined whether implementation of such proposed standards would be material to our Consolidated Financial Statements.
Note 3 — (Loss) Earnings per Common Share
Basic earnings per share is calculated using the weighted average number of shares outstanding for the period. Dilutedearnings per share is computed on the basis of the weighted average basic shares outstanding plus the dilutive effect of ourstock-based compensation plans using the “treasury stock” method. Unvested restricted stock and treasury shares areexcluded from the calculation of weighted average number of common stock outstanding because they do not participate individends. Once restricted stock vests, it is included in our common stock outstanding.
The following table sets forth the computation of the weighted average basic and diluted income (loss) per share:
Years Ended December 31,
2011 2010 2009
(In millions)
Numerator:Loss from continuing operations . . . . . . . . . . . . . . . . . . . . . . . . . . . . . . . . . . . $(46.7) $(158.3) $(44.0)(Loss) income from discontinued operations . . . . . . . . . . . . . . . . . . . . . . . . . . — (0.2 ) 1.8
Net loss . . . . . . . . . . . . . . . . . . . . . . . . . . . . . . . . . . . . . . . . . . . . . . . . . . . . . $(46.7) $(158.5) $(42.2)
Denominator:Weighted average number of common stock outstanding during the period . . . 37.7 37.8 37.5Dilutive effect of stock-based compensation plans . . . . . . . . . . . . . . . . . . . . . . — — —
Weighted average number of diluted shares outstanding during the period . . . . 37.7 37.8 37.5
Basic (loss) earnings per common share:Continuing operations . . . . . . . . . . . . . . . . . . . . . . . . . . . . . . . . . . . . . . . . . . . $(1.24) $ (4.19) $(1.17)Discontinued operations . . . . . . . . . . . . . . . . . . . . . . . . . . . . . . . . . . . . . . . . . — (0.01) 0.05Net loss . . . . . . . . . . . . . . . . . . . . . . . . . . . . . . . . . . . . . . . . . . . . . . . . . . . . . (1.24) (4.19) (1.13)
Diluted (loss) earnings per common share:Continuing operations . . . . . . . . . . . . . . . . . . . . . . . . . . . . . . . . . . . . . . . . . . . $(1.24) $ (4.19) $(1.17)Discontinued operations . . . . . . . . . . . . . . . . . . . . . . . . . . . . . . . . . . . . . . . . . — (0.01) 0.05Net loss . . . . . . . . . . . . . . . . . . . . . . . . . . . . . . . . . . . . . . . . . . . . . . . . . . . . . (1.24) (4.19) (1.13)
Anti-dilutive options excluded from calculation . . . . . . . . . . . . . . . . . . . . . . . . . . . 5.4 4.9 4.6
52

NOTES TO CONSOLIDATED FINANCIAL STATEMENTS — (Continued)
Note 4 — Acquisitions and Divestiture
2011 Acquisitions
IronKey Systems, Inc.
On October 4, 2011 we acquired the secure data storage hardware assets of IronKey Systems Inc. (IronKey). Thepurchase price consisted of a cash payment of $19.0 million. We also entered into a strategic partnership whereby wereceived a license from IronKey for its secure storage management software and service as well as an exclusive license touse the IronKey brand for secure storage products including online cloud-based security service.
The purchase price allocation resulted in goodwill of $9.4 million, consisting of expected strategic synergies andintangible assets that do not qualify for separate recognition. IronKey is included in our existing Americas operating segmentand is included in the Mobile Security reporting unit for the purposes of goodwill impairment testing. This goodwill is deductiblefor tax purposes. See Note 6 here for more information regarding goodwill.
The following table illustrates our allocation of the purchase price to the assets acquired and liabilities assumed:
Amount
(In millions)
Accounts receivable and other assets . . . . . . . . . . . . . . . . . . . . . . . . . . . . . . . . . . . . . . . . . . . . . . . $ 3.5Inventories . . . . . . . . . . . . . . . . . . . . . . . . . . . . . . . . . . . . . . . . . . . . . . . . . . . . . . . . . . . . . . . . . . . 2.1Intangible assets . . . . . . . . . . . . . . . . . . . . . . . . . . . . . . . . . . . . . . . . . . . . . . . . . . . . . . . . . . . . . . . 7.8Goodwill . . . . . . . . . . . . . . . . . . . . . . . . . . . . . . . . . . . . . . . . . . . . . . . . . . . . . . . . . . . . . . . . . . . . . 9.4Accounts payable and other liabilities . . . . . . . . . . . . . . . . . . . . . . . . . . . . . . . . . . . . . . . . . . . . . . . (3.8)
$19.0
Our allocation of the purchase price to the assets acquired and liabilities assumed resulted in the recognition of thefollowing intangible assets:
Amount
WeightedAverage
Life
(In millions)
Trade name . . . . . . . . . . . . . . . . . . . . . . . . . . . . . . . . . . . . . . . . . . . . . . . . . . . . . . . . . $0.8 2 yearsLicense . . . . . . . . . . . . . . . . . . . . . . . . . . . . . . . . . . . . . . . . . . . . . . . . . . . . . . . . . . . . 1.9 7 yearsCustomer relationships . . . . . . . . . . . . . . . . . . . . . . . . . . . . . . . . . . . . . . . . . . . . . . . . . 0.4 7 yearsDistributor relationships . . . . . . . . . . . . . . . . . . . . . . . . . . . . . . . . . . . . . . . . . . . . . . . . 0.9 9 yearsProprietary technology . . . . . . . . . . . . . . . . . . . . . . . . . . . . . . . . . . . . . . . . . . . . . . . . . 3.8 4 years
$7.8
ProStor Systems, Inc.
On August 29, 2011, we acquired certain assets of ProStor Systems, Inc. (ProStor), including the InfiniVault tieredstorage system and other related technologies. The purchase price consisted of a cash payment of $0.5 million and resultedin no goodwill.
Memory Experts International Inc. (MXI Security)
On June 4, 2011, we acquired the assets of MXI Security, a leader in high-security and privacy technologies, fromMemory Experts International Inc. MXI Security sells encrypted and biometric USB drives (MXI Stealth Key), encrypted andbiometric hard disk drives (MXI Stealth HD), secure portable desktop solutions (Stealth Zone), and software solutions. MXI
53

NOTES TO CONSOLIDATED FINANCIAL STATEMENTS — (Continued)
Security products contain various security features such as password authentication, encryption and remote manageability.The purchase price consisted of a cash payment of $24.5 million and the estimated fair value of future contingentconsideration of $9.2 million, totaling $33.7 million.
The purchase price allocation resulted in goodwill of $21.9 million, consisting of expected strategic synergies andintangible assets that do not qualify for separate recognition. MXI Security is included in our existing Americas operatingsegment and is included in the Mobile Security reporting unit for the purposes of goodwill impairment testing. This goodwill isdeductible for tax purposes. See Note 6 here for more information regarding goodwill.
Future contingent consideration consists of an earn-out payments which may be paid based on incremental revenue ofthe acquired business and incremental gross margin of the acquired business. The earn-out payments will be between $0.0and $45.0 million. We revalue this contingent consideration each reporting period. Based on our analysis of fair value as ofDecember 31, 2011, the value at acquisition of such contingent consideration obligation equaled the estimated fair value as ofDecember 31, 2011 and no adjustments were required.
The following table illustrates our allocation of the purchase price to the assets acquired and liabilities assumed:
Amount
(In millions)
Accounts receivable and other assets . . . . . . . . . . . . . . . . . . . . . . . . . . . . . . . . . . . . . . . . . . . . . . . $ 0.8Inventories . . . . . . . . . . . . . . . . . . . . . . . . . . . . . . . . . . . . . . . . . . . . . . . . . . . . . . . . . . . . . . . . . . . 1.1Intangible assets . . . . . . . . . . . . . . . . . . . . . . . . . . . . . . . . . . . . . . . . . . . . . . . . . . . . . . . . . . . . . . . 10.6Goodwill . . . . . . . . . . . . . . . . . . . . . . . . . . . . . . . . . . . . . . . . . . . . . . . . . . . . . . . . . . . . . . . . . . . . . 21.9Accounts payable and other liabilities . . . . . . . . . . . . . . . . . . . . . . . . . . . . . . . . . . . . . . . . . . . . . . . (0.7)
$33.7
Our allocation of the purchase price to the assets acquired and liabilities assumed resulted in the recognition of thefollowing intangible assets:
Amount
WeightedAverage
Life
(In millions)
Trademark . . . . . . . . . . . . . . . . . . . . . . . . . . . . . . . . . . . . . . . . . . . . . . . . . . . . . . . . . $ 0.7 10 yearsSupply agreement . . . . . . . . . . . . . . . . . . . . . . . . . . . . . . . . . . . . . . . . . . . . . . . . . . . . 1.4 3 yearsCustomer relationships . . . . . . . . . . . . . . . . . . . . . . . . . . . . . . . . . . . . . . . . . . . . . . . . 1.0 8 yearsProprietary technology . . . . . . . . . . . . . . . . . . . . . . . . . . . . . . . . . . . . . . . . . . . . . . . . . 7.5 6 years
$10.6
BeCompliant Corporation (doing business as Encryptx)
On February 28, 2011, we acquired substantially all of the assets of BeCompliant Corporation, doing business asEncryptx (Encryptx), a technology leader in encryption and security solutions for removable storage devices and removablestorage media. The purchase price was $2.3 million, consisting of a cash payment of $1.0 million and the estimated fair valueof future contingent consideration of $1.3 million. The total amount of contingent consideration that could become payableunder the terms of the agreement is $1.5 million. We revalue this contingent consideration each reporting period. Based onour analysis of fair value as of December 31, 2011, the value at acquisition of such contingent consideration obligationequaled the estimated fair value as of December 31, 2011 and no adjustments were required.
The purchase price allocation resulted in goodwill of $1.6 million, consisting of expected strategic synergies andintangible assets that do not qualify for separate recognition. This goodwill is deductible for tax purposes. The goodwill was
54

NOTES TO CONSOLIDATED FINANCIAL STATEMENTS — (Continued)
allocated to our existing Americas-Commercial reporting unit. Goodwill is considered impaired when its carrying amountexceeds its implied fair value. As of March 31, 2011, the carrying amount of all of our reporting units significantly exceededtheir fair value and we performed an impairment test. Based on the goodwill test performed as of March 31, 2011, wedetermined that the carrying amount of the goodwill in the Americas-Commercial reporting unit, including the assets ofEncryptx, exceeded the implied fair value and, therefore, the goodwill was fully impaired. As a result, a $1.6 million goodwillimpairment charge was recorded during 2011 in the Consolidated Statements of Operations.
The effects of these acquisitions individually and in total did not materially impact our 2011 results ofoperations. Therefore, pro forma disclosures are not presented.
Divestiture Presented as Discontinued Operations
Discontinued operations are related to the wind down of the GDM joint venture. GDM was a joint venture created tomarket optical media products with Moser Baer India Ltd. (MBI). Since the inception of the joint venture in 2003, we held a51 percent ownership in the business. As the controlling shareholder, we have historically consolidated the results of the jointventure in our financial statements. GDM was previously included partially in the Americas and Europe segments. SeeNote 14 herein for additional detail regarding the impact of discontinued operations on the Americas and Europe segments.
The results of discontinued operations were as follows:
Years Ended December 31,
2011 2010 2009
(In millions)
Net revenue . . . . . . . . . . . . . . . . . . . . . . . . . . . . . . . . . . . . . . . . . . . . . . . . . . . . . . . $ — $ — $74.5(Loss) income before income taxes . . . . . . . . . . . . . . . . . . . . . . . . . . . . . . . . . . . . . . (0.1) (0.2) 2.1Income tax provision . . . . . . . . . . . . . . . . . . . . . . . . . . . . . . . . . . . . . . . . . . . . . . . . . — — 0.3
Total discontinued operations . . . . . . . . . . . . . . . . . . . . . . . . . . . . . . . . . . . . . . . . . . $(0.1) $(0.2) $ 1.8
No acquisitions were completed during the years ended December 31, 2010 or 2009.
55

NOTES TO CONSOLIDATED FINANCIAL STATEMENTS — (Continued)
Note 5 — Supplemental Balance Sheet Information
As of December 31,
2011 2010
(In millions)
InventoriesFinished goods . . . . . . . . . . . . . . . . . . . . . . . . . . . . . . . . . . . . . . . . . . . . . . . . . . . . . . . $ 186.7 $ 175.0Work in process . . . . . . . . . . . . . . . . . . . . . . . . . . . . . . . . . . . . . . . . . . . . . . . . . . . . . . 13.5 10.6Raw materials and supplies . . . . . . . . . . . . . . . . . . . . . . . . . . . . . . . . . . . . . . . . . . . . . 8.6 17.7
Total inventories . . . . . . . . . . . . . . . . . . . . . . . . . . . . . . . . . . . . . . . . . . . . . . . . . . . . $ 208.8 $ 203.3
Other Current AssetsDeferred income taxes . . . . . . . . . . . . . . . . . . . . . . . . . . . . . . . . . . . . . . . . . . . . . . . . . $ 6.1 $ 9.1Restricted cash (Note 2) . . . . . . . . . . . . . . . . . . . . . . . . . . . . . . . . . . . . . . . . . . . . . . . . 2.2 17.9Assets held for sale (Note 7) . . . . . . . . . . . . . . . . . . . . . . . . . . . . . . . . . . . . . . . . . . . . . 3.3 7.2Taxes receivable . . . . . . . . . . . . . . . . . . . . . . . . . . . . . . . . . . . . . . . . . . . . . . . . . . . . . 1.5 2.0Other . . . . . . . . . . . . . . . . . . . . . . . . . . . . . . . . . . . . . . . . . . . . . . . . . . . . . . . . . . . . . . 36.6 38.0
Total other current assets . . . . . . . . . . . . . . . . . . . . . . . . . . . . . . . . . . . . . . . . . . . . . $ 49.7 $ 74.2
Property, Plant and EquipmentLand . . . . . . . . . . . . . . . . . . . . . . . . . . . . . . . . . . . . . . . . . . . . . . . . . . . . . . . . . . . . . . $ 1.2 $ 1.4Buildings and leasehold improvements . . . . . . . . . . . . . . . . . . . . . . . . . . . . . . . . . . . . . 92.6 122.2Machinery and equipment . . . . . . . . . . . . . . . . . . . . . . . . . . . . . . . . . . . . . . . . . . . . . . . 146.1 223.6Construction in progress . . . . . . . . . . . . . . . . . . . . . . . . . . . . . . . . . . . . . . . . . . . . . . . . 1.5 2.1
Total . . . . . . . . . . . . . . . . . . . . . . . . . . . . . . . . . . . . . . . . . . . . . . . . . . . . . . . . . . . . $ 241.4 $ 349.3Less accumulated depreciation and leasehold amortization . . . . . . . . . . . . . . . . . . . . . . (186.0) (282.4)
Property, plant and equipment, net . . . . . . . . . . . . . . . . . . . . . . . . . . . . . . . . . . . . . . $ 55.4 $ 66.9
Other AssetsDeferred income taxes . . . . . . . . . . . . . . . . . . . . . . . . . . . . . . . . . . . . . . . . . . . . . . . . . $ 15.8 $ 12.2Other . . . . . . . . . . . . . . . . . . . . . . . . . . . . . . . . . . . . . . . . . . . . . . . . . . . . . . . . . . . . . . 8.6 10.3
Total other assets . . . . . . . . . . . . . . . . . . . . . . . . . . . . . . . . . . . . . . . . . . . . . . . . . . . $ 24.4 $ 22.5
Other Current LiabilitiesRebates . . . . . . . . . . . . . . . . . . . . . . . . . . . . . . . . . . . . . . . . . . . . . . . . . . . . . . . . . . . . $ 45.2 $ 53.4Levies . . . . . . . . . . . . . . . . . . . . . . . . . . . . . . . . . . . . . . . . . . . . . . . . . . . . . . . . . . . . . 19.7 23.6Accrued payroll . . . . . . . . . . . . . . . . . . . . . . . . . . . . . . . . . . . . . . . . . . . . . . . . . . . . . . . 13.2 15.6Litigation settlement — current . . . . . . . . . . . . . . . . . . . . . . . . . . . . . . . . . . . . . . . . . . . 18.0 10.6Employee separation costs . . . . . . . . . . . . . . . . . . . . . . . . . . . . . . . . . . . . . . . . . . . . . . 5.9 10.5Value added tax . . . . . . . . . . . . . . . . . . . . . . . . . . . . . . . . . . . . . . . . . . . . . . . . . . . . . . 1.9 10.5Deferred income taxes . . . . . . . . . . . . . . . . . . . . . . . . . . . . . . . . . . . . . . . . . . . . . . . . . 0.7 —Other . . . . . . . . . . . . . . . . . . . . . . . . . . . . . . . . . . . . . . . . . . . . . . . . . . . . . . . . . . . . . . 46.6 48.1
Total other current liabilities . . . . . . . . . . . . . . . . . . . . . . . . . . . . . . . . . . . . . . . . . . . $ 151.2 $ 172.3
Other LiabilitiesPension . . . . . . . . . . . . . . . . . . . . . . . . . . . . . . . . . . . . . . . . . . . . . . . . . . . . . . . . . . . . $ 29.3 $ 27.0Litigation settlement — long-term . . . . . . . . . . . . . . . . . . . . . . . . . . . . . . . . . . . . . . . . . — 15.1Deferred income taxes . . . . . . . . . . . . . . . . . . . . . . . . . . . . . . . . . . . . . . . . . . . . . . . . . 0.1 3.4Uncertain tax positions . . . . . . . . . . . . . . . . . . . . . . . . . . . . . . . . . . . . . . . . . . . . . . . . . 17.6 17.5Other . . . . . . . . . . . . . . . . . . . . . . . . . . . . . . . . . . . . . . . . . . . . . . . . . . . . . . . . . . . . . . 22.2 14.8
Total other liabilities . . . . . . . . . . . . . . . . . . . . . . . . . . . . . . . . . . . . . . . . . . . . . . . . . $ 69.2 $ 77.8
56

NOTES TO CONSOLIDATED FINANCIAL STATEMENTS — (Continued)
AccountsReceivable*
(In millions)
Reserves and AllowancesBalance, as of December 31, 2008 . . . . . . . . . . . . . . . . . . . . . . . . . . . . . . . . . . . . . . . . . . . . . . . $ 36.6
Additions . . . . . . . . . . . . . . . . . . . . . . . . . . . . . . . . . . . . . . . . . . . . . . . . . . . . . . . . . . . . . . . . 40.1Write-offs, net of recoveries . . . . . . . . . . . . . . . . . . . . . . . . . . . . . . . . . . . . . . . . . . . . . . . . . . (48.1)
Balance, as of December 31, 2009 . . . . . . . . . . . . . . . . . . . . . . . . . . . . . . . . . . . . . . . . . . . . . . . $ 28.6Additions . . . . . . . . . . . . . . . . . . . . . . . . . . . . . . . . . . . . . . . . . . . . . . . . . . . . . . . . . . . . . . . . 9.0Write-offs, net of recoveries . . . . . . . . . . . . . . . . . . . . . . . . . . . . . . . . . . . . . . . . . . . . . . . . . . (17.0)
Balance, as of December 31, 2010 . . . . . . . . . . . . . . . . . . . . . . . . . . . . . . . . . . . . . . . . . . . . . . . $ 20.6Additions . . . . . . . . . . . . . . . . . . . . . . . . . . . . . . . . . . . . . . . . . . . . . . . . . . . . . . . . . . . . . . . . 10.5Write-offs, net of recoveries . . . . . . . . . . . . . . . . . . . . . . . . . . . . . . . . . . . . . . . . . . . . . . . . . . (12.7)
Balance, as of December 31, 2011 . . . . . . . . . . . . . . . . . . . . . . . . . . . . . . . . . . . . . . . . . . . . . . . $ 18.4
* Accounts receivable reserves and allowances include estimated amounts for customer returns, term discounts and theinability of certain customers to make the required payment.
Note 6 — Intangible Assets and Goodwill
Intangible Assets
Intangible assets consist of the following:
TradeNames Software
CustomerRelationships Other Total
(In millions)
December 31, 2011
Cost . . . . . . . . . . . . . . . . . . . . . . . . . . . . . . . . . . . $347.1 $ 57.9 $ 61.5 $13.9 $ 480.4Accumulated amortization . . . . . . . . . . . . . . . . . . . (57.5) (51.1) (45.5) (4.6) (158.7)
Net . . . . . . . . . . . . . . . . . . . . . . . . . . . . . . . . . . $289.6 $ 6.8 $ 16.0 $ 9.3 $ 321.7
December 31, 2010
Cost . . . . . . . . . . . . . . . . . . . . . . . . . . . . . . . . . . . $332.4 $ 54.2 $ 58.8 $ 8.3 $ 453.7Accumulated amortization . . . . . . . . . . . . . . . . . . . (44.9) (49.1) (36.2) (3.1) (133.3)
Net . . . . . . . . . . . . . . . . . . . . . . . . . . . . . . . . . . $287.5 $ 5.1 $ 22.6 $ 5.2 $ 320.4
On December 20, 2011, we acquired intellectual property and other assets, including key data deduplication technology,from Nine Technology, LLC, (Nine Technology). This data deduplication software engine eliminates redundant data, enablingshorter backup windows, quicker recovery, lower infrastructure costs and more robust and reliable data protection. Thepurchase price consisted of a cash payment of $2.0 million, $1.0 million in future contingent payments and $0.5 million instock. We recorded the payment as an other intangible asset and are amortizing the intangible asset over a five year period.
In 2010 we entered into an amendment to our license agreement with ProStor. Under the terms of the agreement, we paid$5.0 million and will have a semi-exclusive license to manufacture, market and sell RDX removable hard disk systems through2020. We recorded the payment as an other intangible asset and are amortizing the payment over a five year period. Theacquisition of certain ProStor assets on August 29, 2011 excluded the portion of the business to which this license relates.
57

NOTES TO CONSOLIDATED FINANCIAL STATEMENTS — (Continued)
Amortization expense for intangible assets consisted of the following:
Years Ended December 31,
2011 2010 2009
(In millions)
Amortization expense . . . . . . . . . . . . . . . . . . . . . . . . . . . . . . . . . . . . . . . . . . . . . . . . $26.0 $23.6 $23.3
Based on the intangible assets in service as of December 31, 2011, estimated amortization expense for each of the nextfive years ending December 31 is as follows:
2012 2013 2014 2015 2016
(In millions)
Amortization expense . . . . . . . . . . . . . . . . . . . . . . . . . . . . . . . . . $27.6 $22.4 $18.2 $15.9 $14.4
Goodwill
The following table presents the changes in goodwill allocated to our reportable segments:
Americas Europe North Asia South AsiaElectronicProducts Total
(In millions)
Balance as of December 31, 2009:Goodwill . . . . . . . . . . . . . . . . . . . . . $ 64.3 $ 39.2 $ 10.2 $— $ 38.6 $ 152.3Accumulated impairment losses . . . . (64.3) (39.2) (10.2) — (15.1) (128.8)
— — — — 23.5 23.5Operating segment reclassification:
Goodwill . . . . . . . . . . . . . . . . . . . . . 38.6 — — — (38.6) —Accumulated impairment losses . . . . (15.1) — — — 15.1 —
Goodwill impairment . . . . . . . . . . . . . . . (23.5) — — — — (23.5)
Balance as of December 31, 2010:Goodwill . . . . . . . . . . . . . . . . . . . . . $ 102.9 $ 39.2 $ 10.2 $— $ — $ 152.3Accumulated impairment losses . . . . (102.9) (39.2) (10.2) — — (152.3)
— — — — — —Encryptx acquisition . . . . . . . . . . . . . . . 1.6 — — — — 1.6MXI Security acquisition . . . . . . . . . . . . 21.9 — — — — 21.9IronKey acquisition . . . . . . . . . . . . . . . . 9.4 — — — — 9.4Goodwill impairment . . . . . . . . . . . . . . . (1.6) — — — — (1.6)Balance as of December 31, 2011:
Goodwill . . . . . . . . . . . . . . . . . . . . . $ 135.8 $ 39.2 $ 10.2 $— $ — $ 185.2Accumulated impairment losses . . . . (104.5) (39.2) (10.2) — — (153.9)
$ 31.3 $ — $ — $— $ — $ 31.3
Our reporting units for goodwill are our operating segments (Americas, Europe, North Asia and South Asia) with theexception of the Americas segment which is further divided between the Americas-Consumer, Americas-Commercial, andAmericas-Mobile Security reporting units as determined by sales channel.
During 2011 we acquired the assets of MXI Security and assets of IronKey’s secure data storage hardware businesswhich resulted in goodwill of $21.9 million and $9.4 million, respectively. These acquired businesses are included in ourexisting Americas operating segment and function as a business with discrete financial information available. Therefore, these
58

NOTES TO CONSOLIDATED FINANCIAL STATEMENTS — (Continued)
businesses are considered a separate reporting unit (Mobile Security) for the purposes of goodwill impairment testing. Inaccordance with our policy, goodwill was tested for impairment during the fourth quarter of 2011.
In evaluating whether goodwill was impaired, we compared the fair value of the Mobile Security reporting unit to it’scarrying value (Step 1 of the impairment test). In calculating fair value, we used the income approach, a valuation techniqueunder which we estimate future cash flows using the reporting unit’s financial forecasts. Future estimated cash flows arediscounted to their present value to calculate fair value. In determining the fair value of the Mobile Security reporting unitunder the income approach, our expected cash flows are affected by various assumptions. Fair value on a discounted cashflow basis uses forecasts over a 10 year period with an estimation of residual growth rates thereafter. We use our businessplans and projections as the basis for expected future cash flows. A discount rate of 16.5 percent was used to reflect therelevant risks of the higher growth assumed for this reporting unit. An increase in the discount rate of one percent would havedecreased the reporting unit’s fair value by approximately $5.0 million while a decrease in the discount rate by one percentwould have increased the reporting unit’s fair value by $6.0 million. The revenue growths in 2012 through 2014 are significantassumptions within the projections. If revenue were decreased 10 percent for each year in the plan without a change inprojected SG&A costs or other cash flows, the indicated fair value of the reporting unit would be reduced by approximately$11.0 million. Based on the goodwill test performed, we determined that the fair value of the reporting unit exceeded itscarrying amount. The indicated excess in fair value over carrying value of the Mobile Security reporting unit in step one of theimpairment test at November 30, 2011 and goodwill is as follows:
Goodwill
ReportingUnit
CarryingAmount
Excess of FairValue OverCarryingAmount
Percentage ofFair Value
Over CarryingAmount
(In millions)
Mobile Security . . . . . . . . . . . . . . . . . . . . . . . . . . . . . . . $31.3 $52.0 $13.0 25%
While this analysis indicates that this goodwill is not impaired, to the extent that actual results or other assumptionsabout future economic conditions or potential for our growth and profitability in this business changes, it is possible that ourconclusion regarding the remaining goodwill could change, which could have a material effect on our financial position andresults of operations.
During 2011 we acquired certain assets of Encryptx which resulted in goodwill of $1.6 million. The goodwill was allocated toour existing Americas-Commercial reporting unit. Goodwill is considered impaired when its carrying amount exceeds its impliedfair value. As of March 31, 2011, the carrying amount of all of our reporting units significantly exceeded their fair value and weperformed an impairment test. Based on the goodwill test performed as of March 31, 2011, we determined that the carryingamount of the goodwill in the Americas-Commercial reporting unit, including the assets of Encryptx, exceeded the implied fairvalue and, therefore, the goodwill was fully impaired. As a result, a $1.6 million goodwill impairment charge was recorded duringthe three months ended March 31, 2011 in the Consolidated Statements of Operations.
During 2009 our reporting units for goodwill were our operating segments (Americas, Europe, Asia Pacific, andElectronic Products) with the exception of the Americas segment which was further divided between the Americas-Consumerand Americas-Commercial reporting units as determined by sales channel. During the second quarter of 2010 we realignedour corporate segments and reporting structure and combined our Electronic Products segment with our Americas segment,and we separated our Asia Pacific segment into North Asia and South Asia regions. As a result of the segment change, thegoodwill of $23.5 million which was previously allocated to the Electronics Products segment was merged into the Americas-Consumer reporting unit. The Americas-Consumer reporting unit had a fair value that was significantly less than its carryingamount prior to the combination, which is a triggering event for an interim goodwill impairment test. A two-step impairment testwas performed to identify a potential impairment and measure an impairment loss to be recognized. Based on this step of theimpairment test, we determined that the full amount of remaining goodwill, $23.5 million, was impaired.
59

NOTES TO CONSOLIDATED FINANCIAL STATEMENTS — (Continued)
Note 7 — Restructuring and Other Expense
The components of our restructuring and other expense included in the Consolidated Statements of Operations were asfollows:
Years Ended December 31,
2011 2010 2009
(In millions)
RestructuringSeverance and related . . . . . . . . . . . . . . . . . . . . . . . . . . . . . . . . . . . . . . . . . . . . . $ 7.0 $13.0 $11.2Lease termination costs . . . . . . . . . . . . . . . . . . . . . . . . . . . . . . . . . . . . . . . . . . . . 3.3 1.7 0.7Other . . . . . . . . . . . . . . . . . . . . . . . . . . . . . . . . . . . . . . . . . . . . . . . . . . . . . . . . . . 1.1 — —
Total restructuring . . . . . . . . . . . . . . . . . . . . . . . . . . . . . . . . . . . . . . . . . . . . . . 11.4 14.7 11.9Other
Pension settlement/curtailment . . . . . . . . . . . . . . . . . . . . . . . . . . . . . . . . . . . . . . . 2.5 2.8 11.7Asset impairments . . . . . . . . . . . . . . . . . . . . . . . . . . . . . . . . . . . . . . . . . . . . . . . . — 31.2 2.7Asset disposals . . . . . . . . . . . . . . . . . . . . . . . . . . . . . . . . . . . . . . . . . . . . . . . . . . 7.0 — —Acquisition and integration related costs . . . . . . . . . . . . . . . . . . . . . . . . . . . . . . . . 2.6 — —Other . . . . . . . . . . . . . . . . . . . . . . . . . . . . . . . . . . . . . . . . . . . . . . . . . . . . . . . . . . (2.0) 2.4 0.3
Total . . . . . . . . . . . . . . . . . . . . . . . . . . . . . . . . . . . . . . . . . . . . . . . . . . . . . . . . $21.5 $51.1 $26.6
2011 Manufacturing Redesign Restructuring Program
On January 13, 2011 the Board of Directors approved the 2011 manufacturing redesign restructuring program of up to$55 million to rationalize certain product lines and discontinue tape coating operations at our Weatherford, Oklahoma facilityby April 2011 and subsequently close the facility. We signed a strategic agreement with TDK Corporation to jointly developand manufacture magnetic tape technologies. Under the agreement, we are collaborating on the research and developmentof future tape formats in both companies’ research centers in the United States and Japan and we consolidated tape coatingoperations to the TDK Yamanashi manufacturing facility. We also recorded additional inventory write-offs related to thisprogram due to end of life. This program originally included a total of approximately $50 million in restructuring and othercharges, consisting of severance and related costs of approximately $3 million, asset impairments of approximately $31million primarily related to the Weatherford facility, inventory write-offs of approximately $14 million and other charges ofapproximately $2 million. Therefore this program is substantially complete.
As of June 30, 2011 the Weatherford facility met the held for sale criteria outlined in the accounting guidance for the saleof a long-lived asset. Accordingly, the book value of the building and property, $3.1 million, was transferred into other currentassets on the Consolidated Balance Sheet and is no longer being depreciated.
During 2011 we recorded restructuring charges of $0.3 million for lease termination and modification costs and siteclean-up expenses of $0.9 million related to this program. We also recorded non-cash inventory write-offs of $7.5 millionrelated to this program, which are included in cost of goods sold on our Consolidated Statements of Operations. Since theinception of this program, we have recorded a total of $21.7 million of inventory write-offs, $31.2 million of asset impairmentcharges, $3.2 million of severance and related expenses, $0.3 million for lease termination and modification costs and $0.9million of site clean-up expenses.
During 2010 we recorded restructuring charges of $3.2 million for severance and related expenses and $31.2 million ofasset impairment charges primarily related to the Weatherford facility. We also recorded non-cash inventory write-offs of$14.2 million related to this program, which are included in cost of goods sold on our Consolidated Statements of Operations.
60

NOTES TO CONSOLIDATED FINANCIAL STATEMENTS — (Continued)
Changes in the 2011 manufacturing redesign restructuring program accruals were as follows:
Severanceand Related
LeaseTermination
Costs Other Total
(In millions)
Accrued balance at December 31, 2009 . . . . . . . . . . . . . . . . . . $ — $ — $ — $ —Charges . . . . . . . . . . . . . . . . . . . . . . . . . . . . . . . . . . . . . . . . . . 3.2 — 45.4 48.6Usage . . . . . . . . . . . . . . . . . . . . . . . . . . . . . . . . . . . . . . . . . . . — — (45.4) (45.4)Currency impacts . . . . . . . . . . . . . . . . . . . . . . . . . . . . . . . . . . . — — — —
Accrued balance at December 31, 2010 . . . . . . . . . . . . . . . . . . $ 3.2 $ — $ — $ 3.2
Charges . . . . . . . . . . . . . . . . . . . . . . . . . . . . . . . . . . . . . . . . . . — 0.3 8.4 8.7Usage . . . . . . . . . . . . . . . . . . . . . . . . . . . . . . . . . . . . . . . . . . . (3.0) (0.3) (8.4) (11.7)Currency Impacts . . . . . . . . . . . . . . . . . . . . . . . . . . . . . . . . . . . — — — —
Accrued balance at December 31, 2011 . . . . . . . . . . . . . . . . . . $ 0.2 $ — $ — $ 0.2
For the year ended December 31, 2011, non-cash inventory write-offs of $7.5 million and $0.9 million of site clean-upcosts are included in other. For the year ended December 31, 2010 a non-cash asset impairment charge of $31.2 million,primarily related to our Weatherford Facility, and non-cash inventory write-offs of $14.2 million are included in other in thetable above.
2011 Corporate Strategy Restructuring Program
On January 31, 2011 the Board of Directors approved the 2011 corporate strategy restructuring program to rationalizecertain product lines, increase efficiency and gain greater focus in support of our go-forward strategy. Major components of theprogram include charges associated with certain benefit plans, improvements to our global sourcing and distribution network,costs associated with further rationalization of our product lines and evolution of our skill sets to align with our announcedstrategy. This program originally included a total of approximately $35 million in restructuring and other charges, consisting ofseverance and related expenses of approximately $14 million, charges associated with certain benefit plans of approximately $11million, lease termination expenses of approximately $5 million and other charges of approximately $5 million.
During 2011, we recorded restructuring charges of $7.0 million for severance and related expenses, $3.0 million forlease termination and modification costs and $0.2 million of other charges. In addition, we also recorded inventory write-offs of$1.6 million related to the planned rationalization of certain product lines as part of this program, which are included in cost ofgoods sold in our Consolidated Statements of Operations. Since the inception of this program, we have recorded a total of$10.4 million of severance and related expenses, $3.0 million of lease termination and modification costs, $1.6 million ofinventory write-offs, $0.2 million of other charges and $0.3 million related to a pension curtailment charge.
During 2010, we recorded restructuring charges of $3.4 million for severance and related expenses and a pensioncurtailment charge of $0.3 million.
61

NOTES TO CONSOLIDATED FINANCIAL STATEMENTS — (Continued)
Changes in the 2011 corporate strategy restructuring program accruals were as follows:
Severanceand Related
LeaseTermination
Costs Other Total
(In millions)
Accrued balance at December 31, 2009 . . . . . . . . . . . . . . . . . . . $ — $ — $ — $ —Charges . . . . . . . . . . . . . . . . . . . . . . . . . . . . . . . . . . . . . . . . . . . 3.4 — 0.3 3.7Usage . . . . . . . . . . . . . . . . . . . . . . . . . . . . . . . . . . . . . . . . . . . . — — (0.3) (0.3)Currency impacts . . . . . . . . . . . . . . . . . . . . . . . . . . . . . . . . . . . . — — — —
Accrued balance at December 31, 2010 . . . . . . . . . . . . . . . . . . . $ 3.4 $ — $ — $ 3.4
Charges . . . . . . . . . . . . . . . . . . . . . . . . . . . . . . . . . . . . . . . . . . . 7.0 3.0 1.8 11.8Usage . . . . . . . . . . . . . . . . . . . . . . . . . . . . . . . . . . . . . . . . . . . . (5.7) (2.3) (2.1) (10.1)Currency impacts . . . . . . . . . . . . . . . . . . . . . . . . . . . . . . . . . . . . (0.1) (0.1) 0.3 0.1
Accrued balance at December 31, 2011 . . . . . . . . . . . . . . . . . . . $ 4.6 $ 0.6 $ — $ 5.2
For the year ended December 31, 2011 other includes non-cash inventory write-offs of $1.6 million. Inventory write-offswere included in cost of goods sold on our Consolidated Statements of Operations.
The restructuring is expected to be substantially complete during 2012.
Prior Programs Substantially Complete
During 2010, we recorded $6.4 million of severance and related expenses, $1.7 million of lease termination costs, $2.5million of pension settlement and curtailment charges, and $0.2 million of other charges related to our 2008 corporateredesign restructuring program. This program was initiated during the fourth quarter of 2008 and aligned our cost structure byreducing SG&A expenses. We reduced costs by rationalizing key accounts and products and by simplifying our corporatestructure globally.
During 2009, we recorded $11.2 million of severance and related expenses, $0.1 million of lease termination costs and$11.7 million of pension settlement and curtailment charges related to our 2008 corporate redesign restructuring program.Additionally during 2009, we recorded $0.9 million of lease termination costs related to our 2008 cost reduction restructuringprogram. This program began in the third quarter of 2008 when our Board of Directors approved the Camarillo, Californiarestructuring plan as further implementation of our manufacturing strategy. In order to partially mitigate projected declines intape gross profits in future years, we ended manufacturing at our Camarillo plant and exited the facility during 2008. The 2008cost reduction restructuring program also included our decision to consolidate the Cerritos, California business operations intoOakdale, Minnesota. During 2009, we consolidated the previous Cerritos activities into a single headquarters location in orderto achieve better focus, gain efficiencies across brands and channels and reduce cost. We recorded $0.3 million of incomethrough the reversal of lease termination accruals related to previously announced programs.
Other
During 2011 we recorded additional pension settlement and curtailment losses of $2.5 million within restructuring andother expense in the Consolidated Statements of Operations as a result of the downsizing associated with our domesticrestructuring activities. See Note 9 to the Consolidated Financial Statements for further information regarding pensionsettlements and curtailments.
Our Camarillo, California manufacturing facility ceased operations on December 31, 2008 and the facility, comprised of abuilding and property, was classified as held for sale. In an effort to increase the salability of the property, during the three months
62

NOTES TO CONSOLIDATED FINANCIAL STATEMENTS — (Continued)
ended June 30, 2011 we demolished the building which resulted in a $7.0 million loss on disposal during the period. The landrelated to the facility continues to meet the criteria for held for sale accounting and, therefore, remains classified in other currentassets on the Consolidated Balance Sheet as of December 31, 2011 at a book value of $0.2 million. On October 7, 2011 weentered into an agreement to sell the land for $10.5 million, contingent upon the change of certain zoning requirements for theland as well as other standard conditions. If these conditions are met, the sale is expected to close in 2013.
Also during 2011 we recorded acquisition and integration related costs as a result of our acquisition activities of $2.6million within restructuring and other expense in the Consolidated Statements of Operations. Also during 2011 we amended along-term disability benefit plan, resulting in a $2.0 million gain.
During 2010, other expenses included costs associated with the announced retirement of our former Vice Chairman andChief Executive Officer, including a severance related charge of $1.4 million and a charge of $0.8 million related to theaccelerated vesting of his unvested options and restricted stock.
During 2009 we incurred net asset impairment charges of $2.7 million and other charges of $0.3 million related mainly tothe abandonment of certain manufacturing and R&D assets as a result of our restructuring activities.
2011 Activity
The following table summarizes 2011 restructuring and other activity by restructuring program:
2011Manufacturing
RedesignProgram
2011CorporateStrategyProgram Other Total
(In millions)
RestructuringSeverance and related . . . . . . . . . . . . . . . . . . . . . . . . . . . . . . $ — $ 7.0 $ — $ 7.0Lease termination costs . . . . . . . . . . . . . . . . . . . . . . . . . . . . . 0.3 3.0 — 3.3Other . . . . . . . . . . . . . . . . . . . . . . . . . . . . . . . . . . . . . . . . . . . 0.9 0.2 — 1.1
Total restructuring . . . . . . . . . . . . . . . . . . . . . . . . . . . . . . . 1.2 10.2 — 11.4Other
Pension settlement/curtailment . . . . . . . . . . . . . . . . . . . . . . . . — — 2.5 2.5Asset disposals . . . . . . . . . . . . . . . . . . . . . . . . . . . . . . . . . . . — — 7.0 7.0Acquisition and integration costs . . . . . . . . . . . . . . . . . . . . . . . — — 2.6 2.6Other . . . . . . . . . . . . . . . . . . . . . . . . . . . . . . . . . . . . . . . . . . . — — (2.0) (2.0)
Total . . . . . . . . . . . . . . . . . . . . . . . . . . . . . . . . . . . . . . . . . $1.2 $10.2 $10.1 $21.5
63

NOTES TO CONSOLIDATED FINANCIAL STATEMENTS — (Continued)
2010 Activity
The following table summarizes 2010 restructuring and other activity by restructuring program:
2011Manufacturing
RedesignProgram
2011CorporateStrategyProgram
2008CorporateRedesignProgram Other Total
(In millions)
RestructuringSeverance and related . . . . . . . . . . . . . . . . . . . . . $ 3.2 $3.4 $ 6.4 $ — $13.0Lease termination costs . . . . . . . . . . . . . . . . . . . . — — 1.7 — 1.7
Total restructuring . . . . . . . . . . . . . . . . . . . . . . 3.2 3.4 8.1 — 14.7Other
Pension settlement/curtailment . . . . . . . . . . . . . . . — 0.3 2.5 — 2.8Asset Impairments . . . . . . . . . . . . . . . . . . . . . . . . 31.2 — — — 31.2Other . . . . . . . . . . . . . . . . . . . . . . . . . . . . . . . . . . — — 0.2 2.2 2.4
Total . . . . . . . . . . . . . . . . . . . . . . . . . . . . . . . . $34.4 $3.7 $10.8 $2.2 $51.1
2009 Activity
The following table summarizes 2009 restructuring and other activity by restructuring program:
2008CorporateRedesignProgram
2008Cost
ReductionProgram Other Total
(In millions)
RestructuringSeverance and related . . . . . . . . . . . . . . . . . . . . . . . . . . . . . . . . . $11.2 $ — $ — $11.2Lease termination costs . . . . . . . . . . . . . . . . . . . . . . . . . . . . . . . . 0.1 0.9 (0.3) 0.7Other . . . . . . . . . . . . . . . . . . . . . . . . . . . . . . . . . . . . . . . . . . . . . . — — — —
Total restructuring . . . . . . . . . . . . . . . . . . . . . . . . . . . . . . . . . . 11.3 0.9 (0.3) 11.9Other
Pension settlement/curtailment . . . . . . . . . . . . . . . . . . . . . . . . . . . 11.7 — — 11.7Asset impairments . . . . . . . . . . . . . . . . . . . . . . . . . . . . . . . . . . . . — — 2.7 2.7Other . . . . . . . . . . . . . . . . . . . . . . . . . . . . . . . . . . . . . . . . . . . . . . — — 0.3 0.3
Total . . . . . . . . . . . . . . . . . . . . . . . . . . . . . . . . . . . . . . . . . . . . $23.0 $0.9 $ 2.7 $26.6
Note 8 — Stock-Based Compensation
Stock compensation expense consisted of the following:
Years Ended December 31,
2011 2010 2009
(In millions)
Stock-based compensation . . . . . . . . . . . . . . . . . . . . . . . . . . . . . . . . . . . . . . . . . . $7.5 $6.9 $7.5
We have stock-based compensation awards outstanding under five plans (collectively, the Stock Plans). We have stockoptions outstanding under our 1996 Directors Stock Compensation Program (Directors Plan). We have stock options andrestricted stock outstanding under our 2000 Stock Incentive Plan (2000 Incentive Plan), our 2005 Stock Incentive Plan (2005Incentive Plan), our 2008 Stock Incentive Plan (2008 Incentive Plan) and our 2011 Stock Incentive Plan (2011 Incentive Plan).
64

NOTES TO CONSOLIDATED FINANCIAL STATEMENTS — (Continued)
We also have restricted stock units outstanding under our 2005 Incentive Plan, our 2008 Incentive Plan and our 2011Incentive Plan. No further shares are available for grant under the Directors Plan, 2000 Incentive Plan, the 2005 IncentivePlan or the 2008 Incentive Plan. Restricted stock granted and stock option awards exercised are issued from our treasurystock. The purchase of treasury stock is discretionary and will be subject to determination by our Board of Directors eachquarter following its review of our financial performance and other factors.
The Directors Plan was approved and adopted by 3M Company, as our sole shareholder, and became effective onJuly 1, 1996. The outstanding options are non-qualified, normally have a term of ten years and generally became exercisableone year after grant date. Exercise prices are equal to the fair market value of our common stock on the date of grant. As aresult of the approval and adoption of the 2005 Incentive Plan in May 2005, no further shares are available for grant under theDirectors Plan.
The 2000 Incentive Plan was approved and adopted by our shareholders on May 16, 2000, and became effectiveimmediately. The outstanding options are non-qualified, normally have a term of seven to ten years and generally becameexercisable 25 percent per year beginning on the first anniversary of the grant date. Exercise prices are equal to the fairmarket value of our common stock on the date of grant.
The 2005 Incentive Plan was approved and adopted by our shareholders on May 4, 2005, and became effectiveimmediately. The 2005 Incentive Plan permitted the granting of incentive and non-qualified stock options, stock appreciationrights, restricted stock, restricted stock units, dividend equivalents, performance awards and other stock and stock-basedawards. The total number of shares of common stock that could have been issued or awarded under the 2005 Incentive Planwas not to exceed 2.5 million, of which the maximum number of shares that could have been awarded pursuant to grants ofrestricted stock, restricted stock units and stock awards was 1.5 million. The outstanding options are non-qualified andnormally have a term of ten years. For employees, the options generally become exercisable 25 percent per year beginningon the first anniversary of the grant date. For directors, the options generally became exercisable in full on the firstanniversary of the grant date. Exercise prices for stock options are equal to the fair market value of our common stock on thedate of grant. As a result of the approval and adoption of the 2008 Incentive Plan in May 2008, no further shares are availablefor grant under the 2005 Incentive Plan.
The 2008 Incentive Plan was approved and adopted by our shareholders on May 7, 2008 and became effectiveimmediately. The 2008 Incentive Plan permits grants of stock options, stock appreciation rights, restricted stock, restrictedstock units, dividend equivalents, performance awards, stock awards and other stock-based awards (collectively, Awards).The Board of Directors and Compensation Committee have the authority to determine the type of Awards as well as theamount, terms and conditions of each Award under the 2008 Incentive Plan, subject to the limitations and other provisions ofthe 2008 Incentive Plan. The total number of shares of common stock that may be issued or granted under the 2008 IncentivePlan may not exceed 4.0 million, of which the maximum number of shares that may be provided pursuant to grants of Awardsother than options and stock appreciation rights is 2.0 million. The number of shares available for Awards, as well as theterms of outstanding Awards, is subject to adjustments as provided in the 2008 Incentive Plan for stock splits, stock dividends,recapitalization and other similar events. The outstanding options are non-qualified and normally have a term of ten years. Foremployees, the options generally become exercisable and restricted stock vests 25 percent per year beginning on the firstanniversary of the grant date, subject to the employees continuing service to the Company. For directors, the optionsgenerally become exercisable and restricted stock vests in full on the first anniversary of the grant date. Exercise prices forstock options are equal to the fair market value of our common stock on the date of grant. As a result of the approval andadoption of the 2011 Incentive Plan in May 2011, no further shares are available for grant under the 2008 Incentive Plan.
The 2011 Incentive Plan was approved and adopted by our shareholders on May 4, 2011 and became effectiveimmediately. The 2011 Stock Incentive Plan permits the grant of stock options, stock appreciation rights, restricted stock,restricted stock units, dividend equivalents, performance awards, stock awards and other stock-based awards. The aggregatenumber of shares of our common stock that may be issued under all stock-based awards made under the 2011 StockIncentive Plan is 4.5 million and the maximum number of shares that may be awarded pursuant to grants of awards other than
65

NOTES TO CONSOLIDATED FINANCIAL STATEMENTS — (Continued)
options and stock appreciation rights is 1.1 million. The number of shares available for awards, as well as the terms ofoutstanding awards, is subject to adjustments as provided in the 2011 Stock Incentive Plan for stock splits, stock dividends,recapitalization and other similar events. Awards may be granted under the 2011 Stock Incentive Plan until the earlier to occurof May 3, 2021 or the date on which all shares available for awards under the 2011 Stock Incentive Plan have beenpurchased or acquired; provided, however, that incentive stock options may not be granted after February 10, 2021. As ofDecember 31, 2011, we had stock-based compensation awards consisting of stock options and restricted stock. As ofDecember 31, 2011, there were 3,799,009 shares available for grant under our 2011 Incentive Plan. No further shares wereavailable for grant under any other Stock Plan.
Stock Options
The fair value of each option award is estimated on the date of grant using the Black-Scholes option pricing model. Theassumptions used in the valuation model are supported primarily by historical indicators and current market conditions.Volatility was calculated using the historical weekly close rate for a period of time equal to the expected term. The risk-freerate of return was determined by using the U.S. Treasury yield curve in effect at the time of grant. The expected term wascalculated on an aggregated basis and estimated based on an analysis of options already exercised and any foreseeabletrends or changes in recipients’ behavior. In determining the expected term, we considered the vesting period of the awards,the contractual term of the awards, historical average holding periods, stock price history, impacts from recent restructuringinitiatives and the relative weight for each of these factors. The dividend yield was based on the latest dividend paymentsmade on or announced by the date of the grant.
The following table summarizes our weighted average assumptions used in the valuation of options for the years endedDecember 31:
2011 2010 2009
Volatility . . . . . . . . . . . . . . . . . . . . . . . . . . . . . . . . . . . . . . . . . . . . . . . . . . . . . . . . . . . . 44% 43% 41%Risk-free interest rate . . . . . . . . . . . . . . . . . . . . . . . . . . . . . . . . . . . . . . . . . . . . . . . . . . . 2.13% 2.49% 2.13%Expected life (months) . . . . . . . . . . . . . . . . . . . . . . . . . . . . . . . . . . . . . . . . . . . . . . . . . . 70 66 65Dividend yield . . . . . . . . . . . . . . . . . . . . . . . . . . . . . . . . . . . . . . . . . . . . . . . . . . . . . . . . —% —% —%
66
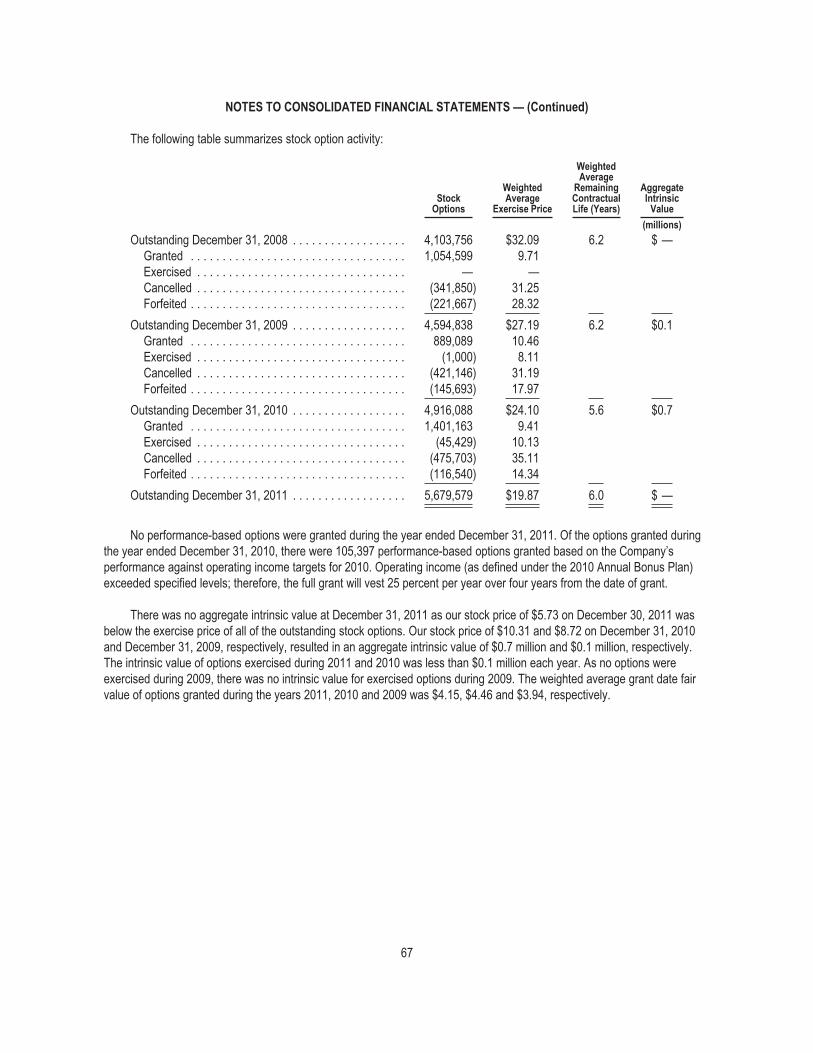
NOTES TO CONSOLIDATED FINANCIAL STATEMENTS — (Continued)
The following table summarizes stock option activity:
StockOptions
WeightedAverage
Exercise Price
WeightedAverage
RemainingContractualLife (Years)
AggregateIntrinsic
Value
(millions)
Outstanding December 31, 2008 . . . . . . . . . . . . . . . . . . 4,103,756 $32.09 6.2 $ —Granted . . . . . . . . . . . . . . . . . . . . . . . . . . . . . . . . . . 1,054,599 9.71Exercised . . . . . . . . . . . . . . . . . . . . . . . . . . . . . . . . . — —Cancelled . . . . . . . . . . . . . . . . . . . . . . . . . . . . . . . . . (341,850) 31.25Forfeited . . . . . . . . . . . . . . . . . . . . . . . . . . . . . . . . . . (221,667) 28.32
Outstanding December 31, 2009 . . . . . . . . . . . . . . . . . . 4,594,838 $27.19 6.2 $0.1Granted . . . . . . . . . . . . . . . . . . . . . . . . . . . . . . . . . . 889,089 10.46Exercised . . . . . . . . . . . . . . . . . . . . . . . . . . . . . . . . . (1,000) 8.11Cancelled . . . . . . . . . . . . . . . . . . . . . . . . . . . . . . . . . (421,146) 31.19Forfeited . . . . . . . . . . . . . . . . . . . . . . . . . . . . . . . . . . (145,693) 17.97
Outstanding December 31, 2010 . . . . . . . . . . . . . . . . . . 4,916,088 $24.10 5.6 $0.7Granted . . . . . . . . . . . . . . . . . . . . . . . . . . . . . . . . . . 1,401,163 9.41Exercised . . . . . . . . . . . . . . . . . . . . . . . . . . . . . . . . . (45,429) 10.13Cancelled . . . . . . . . . . . . . . . . . . . . . . . . . . . . . . . . . (475,703) 35.11Forfeited . . . . . . . . . . . . . . . . . . . . . . . . . . . . . . . . . . (116,540) 14.34
Outstanding December 31, 2011 . . . . . . . . . . . . . . . . . . 5,679,579 $19.87 6.0 $ —
No performance-based options were granted during the year ended December 31, 2011. Of the options granted duringthe year ended December 31, 2010, there were 105,397 performance-based options granted based on the Company’sperformance against operating income targets for 2010. Operating income (as defined under the 2010 Annual Bonus Plan)exceeded specified levels; therefore, the full grant will vest 25 percent per year over four years from the date of grant.
There was no aggregate intrinsic value at December 31, 2011 as our stock price of $5.73 on December 30, 2011 wasbelow the exercise price of all of the outstanding stock options. Our stock price of $10.31 and $8.72 on December 31, 2010and December 31, 2009, respectively, resulted in an aggregate intrinsic value of $0.7 million and $0.1 million, respectively.The intrinsic value of options exercised during 2011 and 2010 was less than $0.1 million each year. As no options wereexercised during 2009, there was no intrinsic value for exercised options during 2009. The weighted average grant date fairvalue of options granted during the years 2011, 2010 and 2009 was $4.15, $4.46 and $3.94, respectively.
67

NOTES TO CONSOLIDATED FINANCIAL STATEMENTS — (Continued)
The following table summarizes outstanding, exercisable options and options expected to vest as ofDecember 31, 2011:
Exercisable Options Options Expected to Vest
Range of ExercisePrices
StockOptions
WeightedAverage
RemainingContractualLife (Years)
WeightedAverageExercise
PriceStock
Options
WeightedAverage
RemainingContractualLife (Years)
WeightedAverageExercise
Price
$6.17 to $14.15 . . . . . . . . . . . . . . . . . . . . . . . . . . . 909,873 6.2 $ 9.95 1,910,343 8.8 $ 9.67$14.16 to $19.20 . . . . . . . . . . . . . . . . . . . . . . . . . . — — — — — —$19.21 to $23.95 . . . . . . . . . . . . . . . . . . . . . . . . . . 104,468 0.7 22.83 3,035 6.6 20.64$23.96 to $28.70 . . . . . . . . . . . . . . . . . . . . . . . . . . 731,717 4.9 24.37 135,077 6.3 24.62$28.71 to $39.38 . . . . . . . . . . . . . . . . . . . . . . . . . . 1,180,329 2.8 34.93 — — —$39.39 to $41.75 . . . . . . . . . . . . . . . . . . . . . . . . . . 388,145 3.1 41.34 — — —$41.76 to $46.97 . . . . . . . . . . . . . . . . . . . . . . . . . . 38,000 1.9 44.45 — — —
$6.17 to $46.97 . . . . . . . . . . . . . . . . . . . . . . . . . 3,352,532 4.1 $26.32 2,048,455 8.7 $10.67
The outstanding options are non-qualified and generally have a term of ten years. For employees, the options grantedprior to May 2011 generally become exercisable and vest 25 percent per year beginning on the first anniversary of the grantdate, subject to the employee’s continuing service to the Company. Grants during and after May 2011 become exercisableand vest 33 percent per year beginning on the first anniversary of the grant date, subject to the employee’s continuing serviceto the Company. For directors, the options generally become exercisable in full on the first anniversary of the grant date.
Total related stock-based compensation expense recognized in the Consolidated Statements of Operations for the yearsended December 31, 2011, 2010 and 2009 was $4.1 million, $3.8 million and $4.9 million, respectively. This expense wouldresult in related tax benefits of $1.3 million, $1.2 million and $1.6 million for the years ended December 31, 2011, 2010 and2009, respectively. However, these tax benefits are included in the U.S. deferred tax assets which are subject to a fullvaluation allowance, and due to the valuation allowance, we did not recognize the related tax benefit in 2011 and 2010.
On March 18, 2010, we announced the retirement of our former Vice Chairman and Chief Executive Officer, effectiveMay 5, 2010. In connection with his retirement from the Company, the Board of Directors also determined to accelerate thevesting of his outstanding unvested options and restricted stock. As a result, additional compensation expense of $0.8 millionwas recognized during the first quarter of 2010. The related tax benefit was $0.3 million for the year ended December 31,2010. This tax benefit was included in the U.S. deferred tax assets that were subject to the valuation allowance establishedduring 2010.
No related stock-based compensation was capitalized as part of an asset for the years ended December 31, 2011, 2010or 2009. As of December 31, 2011, there was $7.2 million of total unrecognized compensation expense related to non-vestedstock options granted under our Stock Plans. That expense is expected to be recognized over a weighted average period of2.21 years.
68

NOTES TO CONSOLIDATED FINANCIAL STATEMENTS — (Continued)
Restricted Stock
The following table summarizes our restricted stock activity:
RestrictedStock
WeightedAverage
Grant DateFair ValuePer Share
Nonvested as of December 31, 2008 . . . . . . . . . . . . . . . . . . . . . . . . . . . . . . . . . . . . . . 304,511 $28.98Granted . . . . . . . . . . . . . . . . . . . . . . . . . . . . . . . . . . . . . . . . . . . . . . . . . . . . . . . . . . 327,654 9.38Vested . . . . . . . . . . . . . . . . . . . . . . . . . . . . . . . . . . . . . . . . . . . . . . . . . . . . . . . . . . . (119,074) 29.44Forfeited . . . . . . . . . . . . . . . . . . . . . . . . . . . . . . . . . . . . . . . . . . . . . . . . . . . . . . . . . (51,389) 30.04
Nonvested as of December 31, 2009 . . . . . . . . . . . . . . . . . . . . . . . . . . . . . . . . . . . . . . 461,702 $14.84Granted . . . . . . . . . . . . . . . . . . . . . . . . . . . . . . . . . . . . . . . . . . . . . . . . . . . . . . . . . . 524,655 10.45Vested . . . . . . . . . . . . . . . . . . . . . . . . . . . . . . . . . . . . . . . . . . . . . . . . . . . . . . . . . . . (209,302) 15.17Forfeited . . . . . . . . . . . . . . . . . . . . . . . . . . . . . . . . . . . . . . . . . . . . . . . . . . . . . . . . . (37,859) 11.15
Nonvested as of December 31, 2010 . . . . . . . . . . . . . . . . . . . . . . . . . . . . . . . . . . . . . . 739,196 $11.34Granted . . . . . . . . . . . . . . . . . . . . . . . . . . . . . . . . . . . . . . . . . . . . . . . . . . . . . . . . . . 385,049 9.28Vested . . . . . . . . . . . . . . . . . . . . . . . . . . . . . . . . . . . . . . . . . . . . . . . . . . . . . . . . . . . (274,934) 12.15Forfeited . . . . . . . . . . . . . . . . . . . . . . . . . . . . . . . . . . . . . . . . . . . . . . . . . . . . . . . . . (54,265) 12.05
Nonvested as of December 31, 2011 . . . . . . . . . . . . . . . . . . . . . . . . . . . . . . . . . . . . . . 795,046 $10.02
There were no performance-based restricted shares granted during the year ended December 31, 2011. Of therestricted shares granted during the year ended December 31, 2010, there were 265,837 performance-based restrictedshares granted based on the Company’s performance against operating income targets for 2010. Operating income (asdefined under the 2010 Annual Bonus Plan) exceeded specified levels; therefore, the full grant will vest 25 percent per yearover four years from the date of grant.
The total fair value of shares vested during the years 2011, 2010 and 2009 was $3.3 million, $3.2 million and$3.5 million, respectively.
Total related stock-based compensation expense recognized in the Consolidated Statements of Operations for the yearsended December 31, 2011, 2010 and 2009 was $3.4 million, $3.1 million and $2.6 million, respectively. This expense wouldresult in related tax benefits of $1.3 million, $1.2 and $1.0 million for the years ended December 31, 2011, 2010 and 2009,respectively. However, these tax benefits are included in the U.S. deferred tax assets which are subject to a full valuationallowance and due to the valuation allowance, we did not recognize the related tax benefit in 2011 and 2010.
No related stock-based compensation was capitalized as part of an asset for the years ended December 31, 2011, 2010 or2009. As of December 31, 2011, there was $5.7 million of total unrecognized compensation expense related to restricted stockgranted under our Stock Plans. That expense is expected to be recognized over a weighted average period of 2.2 years.
Note 9 — Retirement Plans
Pension Plans
We have various non-contributory defined benefit pension plans covering substantially all United States employees andcertain employees outside the United States. Total pension expense was $2.4 million, $4.5 million and $15.1 million in 2011,2010 and 2009, respectively. Total pension expense decreased year over year due primarily to lower service and interestcosts. The measurement date of our pension plans is December 31. We expect to contribute approximately $7 million to
69

NOTES TO CONSOLIDATED FINANCIAL STATEMENTS — (Continued)
$10 million to our pension plans in 2012. It is our general practice, at a minimum, to fund amounts sufficient to meet therequirements set forth in applicable benefits laws and local tax laws. From time to time, we contribute additional amounts, aswe deem appropriate.
In connection with actions taken under our previously announced restructuring programs, the number of employeesaccumulating benefits under our pension plan in the United States has declined significantly. Participants in our U.S. pensionplan have the option of receiving cash lump sum payments when exiting the plan, which a number of participants exiting thepension plan have elected to receive. Lump sum payments in 2011 exceeded our 2010 service and interest costs; as a resulta partial settlement event occurred and we recognized a pro-rata portion of the previously unrecognized net actuarial loss. Weincurred partial settlement losses of $2.5 million, $2.5 million and $7.1 million in 2011, 2010 and 2009, respectively, which areincluded in restructuring and other expense on our Consolidated Statements of Operations. Further, as required by GAAP, weremeasured the funded status of our United States plan as of the date of the settlements.
Effective January 1, 2010, the U.S. pension plan was amended to exclude new hires and rehires from participating in theplan. Furthermore, we eliminated benefit accruals under the United States defined benefit pension plan as of January 1, 2011,thus “freezing” the defined benefit pension plan. Under the plan freeze, no pay credits will be made to a participant’s accountbalance after December 31, 2010. However, interest credits will continue in accordance with the annual update process. Theseactions resulted in the recognition of all prior service cost as a curtailment loss of $0.3 million in 2010, included as a component ofrestructuring and other in the Consolidated Statements of Operations. Due to the timing of this plan amendment we remeasuredthe funded status of our U.S. pension plan in conjunction with the annual remeasurement as of December 31, 2010.
In connection with actions taken under our previously announced restructuring programs, we fully terminated a definedbenefit pension plan in Canada during the year ended December 31, 2009. We purchased annuities to fully fund ourobligation and removed the Company from future liability. A full settlement event occurred and we recognized the previouslyunrecognized net actuarial position and incurred a settlement loss of $4.6 million, which is included in restructuring and otherexpense on our Consolidated Statements of Operations.
For the U.S. pension plan, employees who have completed three years or more of service, including service with3M Company before July 1, 1996, or who have reached age 65, are entitled to pension benefits beginning at normalretirement age (65) based primarily on employees’ pay credits and interest credits. Through December 31, 2009, pay creditswere made to each eligible participant’s account equal to six percent of that participant’s eligible earnings for the year.Beginning on January 1, 2010 and through December 31, 2010, pay credits were reduced to three percent of eachparticipant’s eligible earnings. In conjunction with the plan freeze, no additional pay credits will be made to a participant’saccount balance after December 31, 2010. A monthly interest credit is made to each eligible participant’s account based onthe participant’s account balance as of the last day of the preceding year. The interest credit rate is established annually andis based on the interest rate of certain low-risk debt instruments. The interest credit rate was 4.19 percent for 2011. Inaccordance with the annual update process, the interest credit rate will be 3.02 percent for 2012.
The U.S. pension plan permits four payment options: a lump-sum option, a life income option, a survivor option or aperiod certain option. If a participant terminates prior to completing three years of service, the participant forfeits the right toreceive benefits under the pension plan unless the participant has reached the age of 65 at the time of termination.
70

NOTES TO CONSOLIDATED FINANCIAL STATEMENTS — (Continued)
The benefit obligations and plan assets, changes to the benefit obligations and plan assets, and the funded status of thedefined benefit plan were as follows:
United States International
As of December 31, As of December 31,
2011 2010 2011 2010
(In millions)
Change in benefit obligation
Benefit obligation, beginning of year . . . . . . . . . . . . . . . . . . . . . . . . . . $ 93.8 $ 96.7 $ 58.9 $59.2Service cost . . . . . . . . . . . . . . . . . . . . . . . . . . . . . . . . . . . . . . . . . . . . — 1.7 0.7 0.6Interest cost . . . . . . . . . . . . . . . . . . . . . . . . . . . . . . . . . . . . . . . . . . . . 4.2 4.8 2.5 2.8Actuarial (gain) loss . . . . . . . . . . . . . . . . . . . . . . . . . . . . . . . . . . . . . . 5.1 1.9 4.4 (1.5)Benefits paid . . . . . . . . . . . . . . . . . . . . . . . . . . . . . . . . . . . . . . . . . . . (8.4) (1.6) (2.2) (2.1)Settlements . . . . . . . . . . . . . . . . . . . . . . . . . . . . . . . . . . . . . . . . . . . . (2.5) (9.0) (8.4) —Foreign exchange rate changes . . . . . . . . . . . . . . . . . . . . . . . . . . . . . — — (0.3) (1.4)Plan amendments . . . . . . . . . . . . . . . . . . . . . . . . . . . . . . . . . . . . . . . — — — 1.3Curtailments . . . . . . . . . . . . . . . . . . . . . . . . . . . . . . . . . . . . . . . . . . . — (0.7) — —
Projected benefit obligation, end of year . . . . . . . . . . . . . . . . . . . . . . . $ 92.2 $ 93.8 $ 55.6 $58.9
Change in plan assets
Fair value of plan assets, beginning of year . . . . . . . . . . . . . . . . . . . . $ 70.9 $ 64.1 $ 61.2 $59.0Actual return on plan assets . . . . . . . . . . . . . . . . . . . . . . . . . . . . . . . . (0.9) 9.3 1.6 4.2Foreign exchange rate changes . . . . . . . . . . . . . . . . . . . . . . . . . . . . . — — (0.3) (1.7)Company contributions . . . . . . . . . . . . . . . . . . . . . . . . . . . . . . . . . . . . 10.5 8.1 3.8 1.8Benefits paid . . . . . . . . . . . . . . . . . . . . . . . . . . . . . . . . . . . . . . . . . . . (8.4) (1.6) (2.2) (2.1)Settlements . . . . . . . . . . . . . . . . . . . . . . . . . . . . . . . . . . . . . . . . . . . . (2.5) (9.0) (10.6) —
Fair value of plan assets, end of year . . . . . . . . . . . . . . . . . . . . . . . . . $ 69.6 $ 70.9 $ 53.5 $61.2
Funded status of the plan, end of year . . . . . . . . . . . . . . . . . . . . . . . . $(22.6) $(22.9) $ (2.1) $ 2.3
Amounts recognized in the Consolidated Balance Sheets consisted of the following:
United States International
As of December 31, As of December 31,
2011 2010 2011 2010
(In millions)
Noncurrent assets . . . . . . . . . . . . . . . . . . . . . . . . . . . . . . . . . . . . . . . $ — $ — $ 4.6 $ 6.4Noncurrent liabilities . . . . . . . . . . . . . . . . . . . . . . . . . . . . . . . . . . . . . . (22.6) (22.9) (6.7) (4.1)Accumulated other comprehensive loss — pre-tax . . . . . . . . . . . . . . . 30.2 21.6 8.6 2.7
Amounts recognized in accumulated other comprehensive loss consisted of the following:
United States International
As of December 31, As of December 31,
2011 2010 2011 2010
(In millions)
Net actuarial loss . . . . . . . . . . . . . . . . . . . . . . . . . . . . . . . . . . . . . . . . $30.2 $21.6 $13.3 $ 7.3Prior service cost (credit) . . . . . . . . . . . . . . . . . . . . . . . . . . . . . . . . . . — — (6.5) (6.7)Transition asset obligation . . . . . . . . . . . . . . . . . . . . . . . . . . . . . . . . . — — 1.8 2.1
Total . . . . . . . . . . . . . . . . . . . . . . . . . . . . . . . . . . . . . . . . . . . . . . . $30.2 $21.6 $ 8.6 $ 2.7
71

NOTES TO CONSOLIDATED FINANCIAL STATEMENTS — (Continued)
The following table includes information for pension plans with an accumulated benefit obligation in excess of planassets. This excludes our plans which have plan assets in excess of accumulated benefit obligations.
United States International
As of December 31, As of December 31,
2011 2010 2011 2010
(In millions)
Projected benefit obligation, end of year . . . . . . . . . . . . . . . . . . . . . . . . . $92.2 $93.8 $31.7 $29.0Accumulated benefit obligation, end of year . . . . . . . . . . . . . . . . . . . . . . 92.2 93.7 31.4 28.8Plan assets at fair value, end of year . . . . . . . . . . . . . . . . . . . . . . . . . . . 69.6 70.9 25.1 25.1
Components of net periodic benefit costs included the following:
United States International
Years Ended December 31, Years Ended December 31,
2011 2010 2009 2011 2010 2009
(In millions)
Service cost . . . . . . . . . . . . . . . . . . . . . . . . . . . . . . . $ — $ 1.7 $ 2.8 $ 0.7 $ 0.6 $ 0.7Interest cost . . . . . . . . . . . . . . . . . . . . . . . . . . . . . . . 4.2 4.8 5.4 2.5 2.8 3.2Expected return on plan assets . . . . . . . . . . . . . . . . . (6.3) (5.7) (6.5) (3.0) (3.1) (3.0)Amortization of net actuarial loss . . . . . . . . . . . . . . . . 1.2 0.4 0.2 0.2 0.2 0.4Amortization of prior service cost (credit) . . . . . . . . . . — 0.1 0.1 (0.5) (0.4) (0.2)Amortization of transition obligation . . . . . . . . . . . . . . — — — 0.3 0.3 0.3
Net periodic benefit cost . . . . . . . . . . . . . . . . . . . . . . $(0.9) $ 1.3 $ 2.0 $ 0.2 $ 0.4 $ 1.4
Settlements and curtailments . . . . . . . . . . . . . . . . . . 2.5 2.8 7.1 0.6 — 4.6
Total pension costs . . . . . . . . . . . . . . . . . . . . . . . . . . $ 1.6 $ 4.1 $ 9.1 $ 0.8 $ 0.4 $ 6.0
The estimated net actuarial loss, prior service credit and net obligations at transition for the defined benefit pensionplans that will be amortized from accumulated other comprehensive loss into net periodic benefit costs over the next fiscalyear are $1.7 million loss, $0.5 million credit and $0.3 million obligation, respectively.
Weighted-average assumptions used to determine benefit obligations were as follows:
United States International
As of December 31, As of December 31,
2011 2010 2011 2010
Discount rate . . . . . . . . . . . . . . . . . . . . . . . . . . . . . . . . . . . . . . . . . . . . . 3.75% 5.00% 4.07% 4.77%Rate of compensation increase . . . . . . . . . . . . . . . . . . . . . . . . . . . . . . . —% 4.75% 3.05% 1.30%
Weighted-average assumptions used to determine net periodic benefit costs were as follows:
United States International
As of December 31, As of December 31,
2011 2010 2009 2011 2010 2009
Discount rate . . . . . . . . . . . . . . . . . . . . . . . . . . . . . . 4.75% 5.30% 5.60% 4.56% 5.00% 5.79%Expected return on plan assets . . . . . . . . . . . . . . . . . 8.00% 8.00% 8.00% 4.92% 5.52% 5.07%Rate of compensation increase . . . . . . . . . . . . . . . . . —% 4.75% 4.75% 2.77% 2.98% 3.56%
The discount rate is determined through a modeling process utilizing a customized portfolio of high-quality bonds whoseannual cash flows cover the expected benefit payments of the plan, as well as comparing the results of our modeling to other
72

NOTES TO CONSOLIDATED FINANCIAL STATEMENTS — (Continued)
corporate bond and pension liability indices. Beginning in 2011, the projected salary increase assumption was not applicablein the United States due to the elimination of benefit accruals as of January 1, 2011. The expected long-term rate of return onplan assets is chosen from the range of likely results of compounded average annual returns over a 10-year time horizonbased on the plans’ current investment policy. The expected return and volatility for each asset class is based on historicalequity, bond and cash market returns. While this approach considers recent fund performance and historical returns, theassumption is primarily a long-term, prospective rate.
The plans’ asset allocations by asset category were as follows:
United States International
As of December 31, As of December 31,
2011 2010 2011 2010
Short-term investments . . . . . . . . . . . . . . . . . . . . . . . . . . . . . . . . . . . . . 2% 3% 1% 1%Fixed income securities . . . . . . . . . . . . . . . . . . . . . . . . . . . . . . . . . . . . . 15% 19% 41% 36%Equity securities . . . . . . . . . . . . . . . . . . . . . . . . . . . . . . . . . . . . . . . . . . 65% 66% 24% 32%Absolute return strategy equity funds . . . . . . . . . . . . . . . . . . . . . . . . . . . 18% 12% —% —%Insurance contracts . . . . . . . . . . . . . . . . . . . . . . . . . . . . . . . . . . . . . . . . —% —% 34% 31%
Total . . . . . . . . . . . . . . . . . . . . . . . . . . . . . . . . . . . . . . . . . . . . . . . . . 100% 100% 100% 100%
In the United States, we maintain target allocation percentages among various asset classes based on an investment policyestablished for the plan, which is designed to achieve long-term objectives of return, while mitigating against downside risk andconsidering expected cash flows. The current target asset allocation includes equity securities at 50 to 80 percent, fixed incomesecurities at 15 to 25 percent and other investments at 10 to 20 percent. Other investments include absolute return strategiesinvestments and insurance contracts. Management reviews our United States investment policy for the plan at least annually.Outside the United States, the investment objectives are similar to the United States, subject to local regulations. In somecountries, a higher percentage allocation to fixed income securities is required and certain investment objectives are coordinatedthrough insurance contract strategies for all contracts rather than individual Imation insurance contracts.
The following benefit payments as of December 31, 2011, reflect expected future services and are expected to be paidin each of the next five years and in the aggregate for the five years thereafter:
United States International
(In millions)
2012 . . . . . . . . . . . . . . . . . . . . . . . . . . . . . . . . . . . . . . . . . . . . . . . . . . . . . . . . . . . $19.6 $ 2.12013 . . . . . . . . . . . . . . . . . . . . . . . . . . . . . . . . . . . . . . . . . . . . . . . . . . . . . . . . . . . 5.0 2.22014 . . . . . . . . . . . . . . . . . . . . . . . . . . . . . . . . . . . . . . . . . . . . . . . . . . . . . . . . . . . 4.7 2.32015 . . . . . . . . . . . . . . . . . . . . . . . . . . . . . . . . . . . . . . . . . . . . . . . . . . . . . . . . . . . 5.0 2.42016 . . . . . . . . . . . . . . . . . . . . . . . . . . . . . . . . . . . . . . . . . . . . . . . . . . . . . . . . . . . 5.7 2.62017-2021 . . . . . . . . . . . . . . . . . . . . . . . . . . . . . . . . . . . . . . . . . . . . . . . . . . . . . . . 27.9 14.3
The assets of our pension plans are valued at fair value. Fair value measurements are categorized into one of threelevels based on the lowest level of significant input used: Level 1 (unadjusted quoted prices in active markets for identicalassets); Level 2 (significant observable market inputs available at the measurement date, other than quoted prices included inLevel 1); and Level 3 (unobservable inputs that cannot be corroborated by observable market data).
Short-term investments:
Carrying value of these assets approximates fair value because maturities are generally less than three months.
Equity securities:
Valued at the closing price reported on the major market on which the individual securities are traded.
73
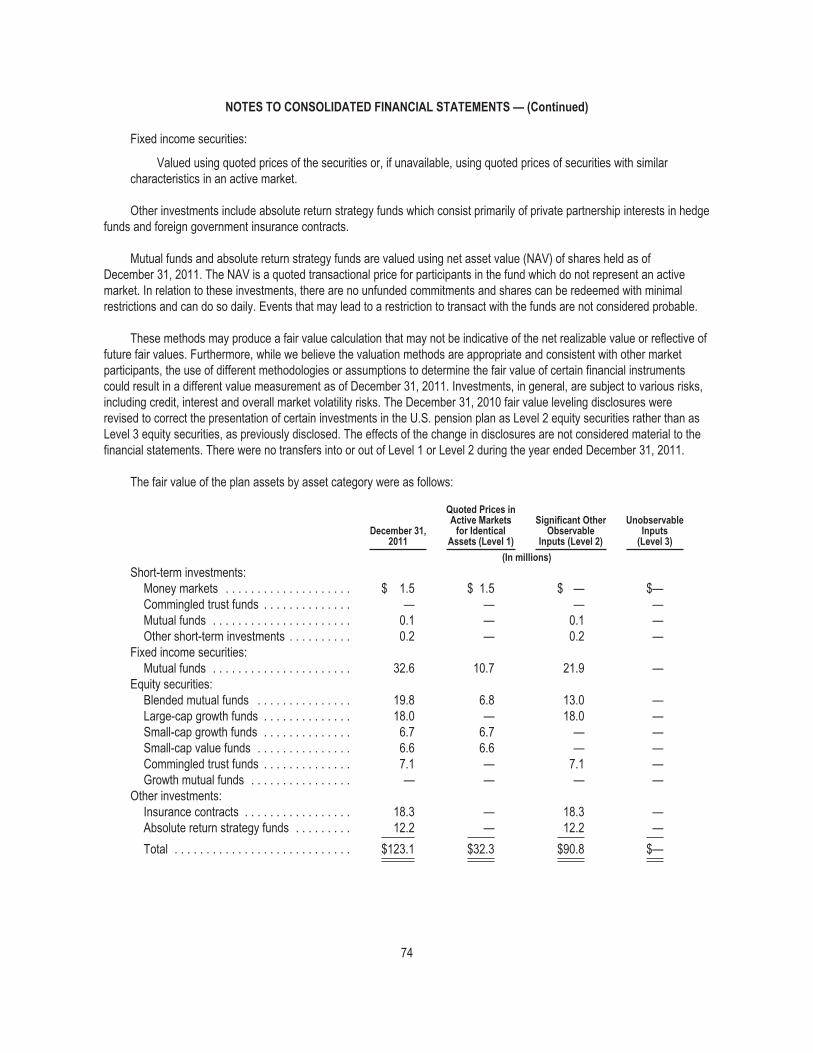
NOTES TO CONSOLIDATED FINANCIAL STATEMENTS — (Continued)
Fixed income securities:
Valued using quoted prices of the securities or, if unavailable, using quoted prices of securities with similarcharacteristics in an active market.
Other investments include absolute return strategy funds which consist primarily of private partnership interests in hedgefunds and foreign government insurance contracts.
Mutual funds and absolute return strategy funds are valued using net asset value (NAV) of shares held as ofDecember 31, 2011. The NAV is a quoted transactional price for participants in the fund which do not represent an activemarket. In relation to these investments, there are no unfunded commitments and shares can be redeemed with minimalrestrictions and can do so daily. Events that may lead to a restriction to transact with the funds are not considered probable.
These methods may produce a fair value calculation that may not be indicative of the net realizable value or reflective offuture fair values. Furthermore, while we believe the valuation methods are appropriate and consistent with other marketparticipants, the use of different methodologies or assumptions to determine the fair value of certain financial instrumentscould result in a different value measurement as of December 31, 2011. Investments, in general, are subject to various risks,including credit, interest and overall market volatility risks. The December 31, 2010 fair value leveling disclosures wererevised to correct the presentation of certain investments in the U.S. pension plan as Level 2 equity securities rather than asLevel 3 equity securities, as previously disclosed. The effects of the change in disclosures are not considered material to thefinancial statements. There were no transfers into or out of Level 1 or Level 2 during the year ended December 31, 2011.
The fair value of the plan assets by asset category were as follows:
December 31,2011
Quoted Prices inActive Markets
for IdenticalAssets (Level 1)
Significant OtherObservable
Inputs (Level 2)
UnobservableInputs
(Level 3)
(In millions)
Short-term investments:Money markets . . . . . . . . . . . . . . . . . . . . $ 1.5 $ 1.5 $ — $—Commingled trust funds . . . . . . . . . . . . . . — — — —Mutual funds . . . . . . . . . . . . . . . . . . . . . . 0.1 — 0.1 —Other short-term investments . . . . . . . . . . 0.2 — 0.2 —
Fixed income securities:Mutual funds . . . . . . . . . . . . . . . . . . . . . . 32.6 10.7 21.9 —
Equity securities:Blended mutual funds . . . . . . . . . . . . . . . 19.8 6.8 13.0 —Large-cap growth funds . . . . . . . . . . . . . . 18.0 — 18.0 —Small-cap growth funds . . . . . . . . . . . . . . 6.7 6.7 — —Small-cap value funds . . . . . . . . . . . . . . . 6.6 6.6 — —Commingled trust funds . . . . . . . . . . . . . . 7.1 — 7.1 —Growth mutual funds . . . . . . . . . . . . . . . . — — — —
Other investments:Insurance contracts . . . . . . . . . . . . . . . . . 18.3 — 18.3 —Absolute return strategy funds . . . . . . . . . 12.2 — 12.2 —
Total . . . . . . . . . . . . . . . . . . . . . . . . . . . . $123.1 $32.3 $90.8 $—
74

NOTES TO CONSOLIDATED FINANCIAL STATEMENTS — (Continued)
December 31,2010
Quoted Prices inActive Markets forIdentical Assets
(Level 1)
Significant OtherObservable
Inputs (Level 2)
UnobservableInputs
(Level 3)
(In millions)
Short-term investments:Money markets . . . . . . . . . . . . . . . . . . . $ 1.5 $ 1.5 $ — $—Commingled trust funds . . . . . . . . . . . . . — — — —Mutual funds . . . . . . . . . . . . . . . . . . . . . 0.2 — 0.2 —Other short-term investments . . . . . . . . . 0.2 — 0.2 —
Fixed income securities:Mutual funds . . . . . . . . . . . . . . . . . . . . . 35.6 13.2 22.4 —
Equity securities:Blended mutual funds . . . . . . . . . . . . . . 26.4 7.9 18.5 —Large-cap growth funds . . . . . . . . . . . . . 18.3 — 18.3 —Small-cap growth funds . . . . . . . . . . . . . 6.9 6.9 — —Small-cap value funds . . . . . . . . . . . . . . 6.8 6.8 — —Commingled trust funds . . . . . . . . . . . . . 7.2 — 7.2 —Growth mutual funds . . . . . . . . . . . . . . . 1.1 1.1 — —
Other investments:Insurance contracts . . . . . . . . . . . . . . . . 18.8 — 18.8 —Absolute return strategy funds . . . . . . . . 8.7 — 8.7 —
Total . . . . . . . . . . . . . . . . . . . . . . . . . . . $131.7 $37.4 $94.3 $—
Employee Retirement Savings Plans
We sponsor a 401(k) retirement savings plan under which eligible United States employees may choose to save up to20 percent of eligible compensation on a pre-tax basis, subject to certain IRS limitations. From January 1 to March 31, 2009,we matched 100 percent of employee contributions up to the first three percent of eligible compensation plus 50 percent onthe next two percent of eligible compensation. Between April 2009 and December 31, 2009, we matched 50 percent ofemployee contributions on the first three percent of eligible compensation and 25 percent on the next two percent of eligiblecompensation in our stock. In November 2009, we determined it was appropriate to reinstate our 401(k) Plan matchingcontribution to the rate applied prior to April 2009. The reinstatement became effective January 1, 2010 and continuedthrough December 31, 2010. Effective January 1, 2011, we match 100 percent of employee contributions up to the first fivepercent of eligible compensation.
We also sponsor a variable compensation program in which we may, at our discretion, contribute up to three percent ofeligible employee compensation to employees’ 401(k) retirement accounts, depending upon total company performance. Nocontributions have been made under the variable compensation program for the years ended 2011, 2010 or 2009.
We used shares of treasury stock to match employee 401(k) contributions for 2011, 2010 and 2009. Total expenserelated to the use of shares of treasury stock to match employee 401(k) contributions was $2.1 million, $1.7 million and $1.3million in 2011, 2010 and 2009, respectively.
75

NOTES TO CONSOLIDATED FINANCIAL STATEMENTS — (Continued)
Note 10 — Income Taxes
The components of loss from continuing operations before income taxes were as follows:
Years Ended December 31,
2011 2010 2009
(In millions)
U.S. . . . . . . . . . . . . . . . . . . . . . . . . . . . . . . . . . . . . . . . . . . . . . . . . . . . . . . . . . $(67.0) $(114.3) $(116.0)International . . . . . . . . . . . . . . . . . . . . . . . . . . . . . . . . . . . . . . . . . . . . . . . . . . . 24.1 37.9 39.3
Total . . . . . . . . . . . . . . . . . . . . . . . . . . . . . . . . . . . . . . . . . . . . . . . . . . . . . . $(42.9) $ (76.4) $ (76.7)
The components of the income tax provision (benefit) from continuing operations were as follows:
Years Ended December 31,
2011 2010 2009
(In millions)
CurrentFederal . . . . . . . . . . . . . . . . . . . . . . . . . . . . . . . . . . . . . . . . . . . . . . . . . . . . . . . . $ 1.5 $12.1 $(27.0)State . . . . . . . . . . . . . . . . . . . . . . . . . . . . . . . . . . . . . . . . . . . . . . . . . . . . . . . . . . — 3.8 (6.4)International . . . . . . . . . . . . . . . . . . . . . . . . . . . . . . . . . . . . . . . . . . . . . . . . . . . . 5.5 9.0 2.7
DeferredFederal . . . . . . . . . . . . . . . . . . . . . . . . . . . . . . . . . . . . . . . . . . . . . . . . . . . . . . . . — 44.7 (6.6)State . . . . . . . . . . . . . . . . . . . . . . . . . . . . . . . . . . . . . . . . . . . . . . . . . . . . . . . . . . — 8.6 (0.9)International . . . . . . . . . . . . . . . . . . . . . . . . . . . . . . . . . . . . . . . . . . . . . . . . . . . . (3.2) 3.7 5.5
Total . . . . . . . . . . . . . . . . . . . . . . . . . . . . . . . . . . . . . . . . . . . . . . . . . . . . . . . . . . . . $ 3.8 $81.9 $(32.7)
The income tax provision from continuing operations differs from the amount computed by applying the statutory UnitedStates income tax rate (35 percent) because of the following items:
Years Ended December 31,
2011 2010 2009
(In millions)
Tax at statutory U.S. tax rate . . . . . . . . . . . . . . . . . . . . . . . . . . . . . . . . . . . . . . . . $(15.0) $ (26.8) $(26.9)State income taxes, net of federal benefit . . . . . . . . . . . . . . . . . . . . . . . . . . . . . (2.2) (3.7) (5.6)Net effect of international operations . . . . . . . . . . . . . . . . . . . . . . . . . . . . . . . . (1.3) (2.8) (7.2)Valuation allowances . . . . . . . . . . . . . . . . . . . . . . . . . . . . . . . . . . . . . . . . . . . . 17.6 105.2 1.4U.S. tax on foreign earnings . . . . . . . . . . . . . . . . . . . . . . . . . . . . . . . . . . . . . . . 4.8 5.1 0.6Uncertain tax positions . . . . . . . . . . . . . . . . . . . . . . . . . . . . . . . . . . . . . . . . . . . 0.2 1.3 3.5Other . . . . . . . . . . . . . . . . . . . . . . . . . . . . . . . . . . . . . . . . . . . . . . . . . . . . . . . . (0.3) 3.6 1.5
Income tax provision (benefit) . . . . . . . . . . . . . . . . . . . . . . . . . . . . . . . . . . . . . . . . $ 3.8 $ 81.9 $(32.7)
In comparing our 2011 tax provision of $3.8 million to our 2010 tax provision of $81.9, the primary change is due to theU.S. not receiving a tax benefit from the 2011 net operating loss, and the establishment of a valuation allowance in 2010 onour U.S. deferred tax assets. Other items that had an impact on the 2011 tax provision included a $5.0 million benefit for thereversal of a foreign net operating loss valuation allowance and changes in the mix of income/loss by jurisdiction.
The 2009 tax benefit included an increase in the state tax effective rate, additional reserves for uncertain tax positionsand the change in proportion of income by jurisdiction.
In 2011, 2010 and 2009 the net cash received (or paid) for income taxes, relating to both continuing and discontinuedoperations, was ($4.9) million, $6.4 million and $14.8 million, respectively.
76

NOTES TO CONSOLIDATED FINANCIAL STATEMENTS — (Continued)
Tax laws require certain items to be included in our tax returns at different times than the items are reflected in ourresults of operations. Some of these items are temporary differences that will reverse over time. We record the tax effect oftemporary differences as deferred tax assets and deferred tax liabilities in our Consolidated Balance Sheets.
The components of net deferred tax assets and liabilities were as follows:
As of December 31,
2011 2010
(In millions)
Accounts receivable allowances . . . . . . . . . . . . . . . . . . . . . . . . . . . . . . . . . . . . . . . . . . . . $ 5.6 $ 8.1Inventories . . . . . . . . . . . . . . . . . . . . . . . . . . . . . . . . . . . . . . . . . . . . . . . . . . . . . . . . . . . . 12.3 13.0Compensation and employee benefits . . . . . . . . . . . . . . . . . . . . . . . . . . . . . . . . . . . . . . . . 9.7 10.9Tax credit carryforwards . . . . . . . . . . . . . . . . . . . . . . . . . . . . . . . . . . . . . . . . . . . . . . . . . . 35.0 20.4Net operating loss carryforwards . . . . . . . . . . . . . . . . . . . . . . . . . . . . . . . . . . . . . . . . . . . . 49.5 54.2Accrued liabilities and other reserves . . . . . . . . . . . . . . . . . . . . . . . . . . . . . . . . . . . . . . . . 16.3 19.1Pension . . . . . . . . . . . . . . . . . . . . . . . . . . . . . . . . . . . . . . . . . . . . . . . . . . . . . . . . . . . . . . 8.7 6.0Property, plant and equipment . . . . . . . . . . . . . . . . . . . . . . . . . . . . . . . . . . . . . . . . . . . . . 14.0 3.2Intangible assets . . . . . . . . . . . . . . . . . . . . . . . . . . . . . . . . . . . . . . . . . . . . . . . . . . . . . . . . 5.6 5.4Other, net . . . . . . . . . . . . . . . . . . . . . . . . . . . . . . . . . . . . . . . . . . . . . . . . . . . . . . . . . . . . . 5.5 5.0
Gross deferred tax assets . . . . . . . . . . . . . . . . . . . . . . . . . . . . . . . . . . . . . . . . . . . . . . . 162.2 145.3Valuation allowance . . . . . . . . . . . . . . . . . . . . . . . . . . . . . . . . . . . . . . . . . . . . . . . . . . . . . (141.1) (127.4)
Deferred tax assets . . . . . . . . . . . . . . . . . . . . . . . . . . . . . . . . . . . . . . . . . . . . . . . . . . . 21.1 17.9Deferred tax liabilities . . . . . . . . . . . . . . . . . . . . . . . . . . . . . . . . . . . . . . . . . . . . . . . . . . — —
Net deferred tax assets . . . . . . . . . . . . . . . . . . . . . . . . . . . . . . . . . . . . . . . . . . . . . . . $ 21.1 $ 17.9
We regularly assess the likelihood that our deferred tax assets will be recovered in the future. A valuation allowance isrecorded to the extent we conclude a deferred tax asset is not considered to be more-likely-than-not to be realized. Weconsider all positive and negative evidence related to the realization of the deferred tax assets in assessing the need for avaluation allowance. If we determine we will not realize all or part of our deferred tax assets, an adjustment to the deferred taxasset will be charged to earnings in the period such determination is made.
During the fourth quarter of 2010, we recognized significant restructuring charges related to our U.S. operations. Due tothese charges and cumulative losses incurred in recent years, we were no longer able to conclude that it was more-likely-than-not that our U.S. deferred tax assets would be fully realized. Therefore, during 2010, we recorded a charge to establish avaluation allowance of $105.6 million related to our U.S. deferred tax assets, of which $53.3 million related to beginning of theyear U.S. deferred tax assets. The valuation allowance charge is included in income tax provision on our ConsolidatedStatement of Operations.
Our accounting for deferred tax consequences represents our best estimate of future events. A valuation allowanceestablished or revised as a result of our assessment is recorded through income tax provision (benefit) in our ConsolidatedStatements of Operations. Changes in our current estimates due to unanticipated events, or other factors, could have amaterial effect on our financial condition and results of operations.
The valuation allowance was $141.1 million, $127.4 million, and $22.9 million as of December 31, 2011, 2010 and 2009,respectively. During 2011, the valuation allowance increased due to $13.4 million of additional federal tax credits related tothe repatriation of cash to the U.S., $3.8 million of additional U.S. net operating losses and $1.5 million of other items, offsetby a $5.0 million benefit from the reversal of a foreign net operating loss valuation allowance.
The increase in 2010, as compared to 2009, was due to the establishment of a valuation allowance against ourU.S. deferred tax assets in the amount of $105.6 million as discussed above, offset by expirations and releases of foreignvaluation allowances in the amount of $1.1 million.
77
NOTES TO CONSOLIDATED FINANCIAL STATEMENTS — (Continued)
Federal net operating loss carry forwards totaling $89.0 million will expire between 2029 and 2031. State income taxoperating losses of $215.6 million, will expire between 2013 and 2031. Federal and state tax credit carryforwards of$35.0 million will expire between 2012 and 2031. Of the aggregate foreign net operating loss carryforwards totaling $35.0million, $11.5 million will expire at various dates up to 2031 and $23.5 million may be carried forward indefinitely.
During the fourth quarter of 2010, our U.S. parent company borrowed funds from certain foreign subsidiaries. Theseloans were treated as permanent repatriations of unremitted earnings during the fourth quarter of 2010. Our 2010 provisionincluded a $5.1 million charge to record the U.S. tax liability associated with these earnings. During the fourth quarter of 2011,these funds were permanently repatriated to the U.S. as dividends.
Also during the fourth quarter of 2011, we distributed additional funds to the U.S. These distributions were treated asrepatriations of unremitted earnings during the fourth quarter of 2011. Our 2011 provision includes an additional $4.0 millioncharge to record the U.S. tax liability associated with these earnings. Some of these distributions were loans of funds to theU.S. from our subsidiaries which at this time we expect to repay in future periods.
Any amount of earnings in excess of the amounts described above were either already invested in the foreign operations orneeded as working capital. The remaining unremitted earnings of our foreign subsidiaries will continue to be permanentlyreinvested in their operations, and no additional deferred taxes have been recorded. The actual U.S. tax cost of any futurerepatriation of foreign earnings would depend on income tax law and circumstances at the time of distribution. Determination ofthe related tax liability is not practicable because of the complexities associated with the hypothetical calculation. As ofDecember 31, 2011, approximately $109.2 million of earnings attributable to foreign subsidiaries were considered to bepermanently invested in those operations. There were no taxable distributions of foreign dividends in 2010 or 2009.
Our income tax returns are subject to review by various U.S. and foreign taxing authorities. As such, we record accrualsfor items that we believe may be challenged by these taxing authorities. The threshold for recognizing the benefit of a taxreturn position in the financial statements is that the position must be more-likely-than-not to be sustained by the taxingauthorities based solely on the technical merits of the position. If the recognition threshold is met, the tax benefit is measuredand recognized as the largest amount of tax benefit that, in our judgment, is greater than 50 percent likely to be realized.
78

NOTES TO CONSOLIDATED FINANCIAL STATEMENTS — (Continued)
A reconciliation of the beginning and ending amount of unrecognized tax benefits is as follows:
Amount
(In millions)
Balance at December 31, 2008 . . . . . . . . . . . . . . . . . . . . . . . . . . . . . . . . . . . . . . . . . . . . . . . . . . . . $10.5Additions:
Tax positions of prior years . . . . . . . . . . . . . . . . . . . . . . . . . . . . . . . . . . . . . . . . . . . . . . . . . . . . . 4.4Reductions:
Tax positions of prior years . . . . . . . . . . . . . . . . . . . . . . . . . . . . . . . . . . . . . . . . . . . . . . . . . . . . . (0.6)Settlements with tax authorities . . . . . . . . . . . . . . . . . . . . . . . . . . . . . . . . . . . . . . . . . . . . . . . . . . (0.2)Lapse of statute of limitations . . . . . . . . . . . . . . . . . . . . . . . . . . . . . . . . . . . . . . . . . . . . . . . . . . . (0.3)
Balance at December 31, 2009 . . . . . . . . . . . . . . . . . . . . . . . . . . . . . . . . . . . . . . . . . . . . . . . . . . . . $13.8
Additions:Tax positions of current years . . . . . . . . . . . . . . . . . . . . . . . . . . . . . . . . . . . . . . . . . . . . . . . . . . . 0.3Tax positions of prior years . . . . . . . . . . . . . . . . . . . . . . . . . . . . . . . . . . . . . . . . . . . . . . . . . . . . . 1.3
Reductions:Settlements with taxing authorities . . . . . . . . . . . . . . . . . . . . . . . . . . . . . . . . . . . . . . . . . . . . . . . (0.2)Lapse of statute of limitations . . . . . . . . . . . . . . . . . . . . . . . . . . . . . . . . . . . . . . . . . . . . . . . . . . . (0.3)
Balance at December 31, 2010 . . . . . . . . . . . . . . . . . . . . . . . . . . . . . . . . . . . . . . . . . . . . . . . . . . . . $14.9
Additions:Tax positions of current year . . . . . . . . . . . . . . . . . . . . . . . . . . . . . . . . . . . . . . . . . . . . . . . . . . . . 0.3Tax positions of prior years . . . . . . . . . . . . . . . . . . . . . . . . . . . . . . . . . . . . . . . . . . . . . . . . . . . . . 0.1
Reductions:Settlements with taxing authorities . . . . . . . . . . . . . . . . . . . . . . . . . . . . . . . . . . . . . . . . . . . . . . . —Lapse of statute of limitations . . . . . . . . . . . . . . . . . . . . . . . . . . . . . . . . . . . . . . . . . . . . . . . . . . . (0.2)
Balance at December 31, 2011 . . . . . . . . . . . . . . . . . . . . . . . . . . . . . . . . . . . . . . . . . . . . . . . . . . . . $15.1
The total amount of unrecognized tax benefits as of December 31, 2011 was $15.1 million, excluding accrued interestand penalties described below. If the unrecognized tax benefits were recognized in our consolidated financial statements,$4.6 million would ultimately affect income tax expense and our related effective tax rate. The other $10.5 million ofunrecognized tax benefit would reduce income tax expense, but would be offset by an increase in valuation allowance againstdeferred tax assets.
Interest and penalties recorded for uncertain tax positions are included in our income tax provision. During the yearsended December 31, 2011, 2010, and 2009, we recognized approximately $(0.2) million benefit, $0.5 million expense, and$0.5 million expense, respectively, in interest and penalties. We had approximately $2.5 million, $2.6 million and $2.2 millionaccrued, excluding the tax benefit of deductible interest, for the payment of interest and penalties at December 31, 2011,2010 and 2009, respectively. The reversal of accrued interest and penalties would affect income tax expense and our relatedeffective tax rate.
It is reasonably possible that our unrecognized tax benefits could increase or decrease significantly during the nexttwelve months due to the resolution of certain U.S. and international tax uncertainties; however it is not possible to estimatethe potential change at this time.
Our federal income tax returns for 2004 through 2010 remain subject to examination by the Internal Revenue Service(IRS). The IRS completed its field examination of our U.S. federal income tax returns for the years 2006 through 2008 in thesecond quarter of 2010. The IRS completed its field examination for the 2009 tax year in the fourth quarter of 2011. We haveprotested certain IRS positions in both audit cycles and the matters are currently pending in the IRS appeals process. With
79

NOTES TO CONSOLIDATED FINANCIAL STATEMENTS — (Continued)
few exceptions, we are no longer subject to examination by foreign tax jurisdictions or state and city tax jurisdictions for yearsbefore 2005. In the event that we have determined not to file tax returns with a particular state or city, all years remain subjectto examination by the tax jurisdiction.
Note 11 — Debt
On March 30, 2006, we entered into a credit agreement (the Credit Agreement) with a group of banks that were party toour prior credit agreement, extending the expiration date from December 15, 2006 to March 29, 2011. An amendment to theCredit Agreement entered into on July 24, 2007 included an extension of the expiration date to March 29, 2012.
The Credit Agreement was amended on June 3, 2009 when we entered into a Third Amendment to the CreditAgreement (the Third Amendment) to provide a more consistent amount of availability under the Credit Agreement,accomplished in part by changing the form of the credit facility such that the availability is now based on the value of certainassets and generally removing limitations to availability based on income levels. The Third Amendment also resulted in areduction of the senior revolving credit facility to an amount up to $200 million (the Credit Facility), including a $75 millionsub-limit for letters of credit, that we may use (i) to pay fees, commissions and expenses in connection with the Credit Facilityand (ii) for ongoing working capital requirements, capital expenditures and other general corporate purposes. Pricing was alsoadjusted as the result of the Third Amendment.
On August 3, 2010, the Credit Agreement was amended and restated to add Imation Europe B.V. as a borrower(European Borrower), reduce the borrowing rate 50 basis points and extend the maturity one year. While the amendment didnot change the Credit facility amount of $200 million, it provides for sub-limits of $150 million in the United States and$50 million in Europe.
Borrowings under the Credit Agreement as amended (collectively the Amended Credit Agreement) would have borneinterest through December 31, 2009 at a rate equal to (i) the Eurodollar Rate (as defined in the Amended Credit Agreement)plus 3.00 percent or (ii) the Base Rate (as defined in the Amended Credit Agreement) plus 2.00 percent. On January 1, 2010,the applicable margins for the Eurodollar Rate and the Base Rate became subject to adjustments based on average dailyavailability (as defined in the Amended Credit Agreement), as set forth in the definition of “Applicable Rate” in the AmendedCredit Agreement.
Our U.S. obligations under the Amended Credit Agreement are guaranteed by the material domestic subsidiaries ofImation Corp. (the Guarantors) and are secured by a first priority lien (subject to customary exceptions) on the real propertycomprising Imation Corp.’s corporate headquarters and all of the personal property of Imation Corp., its subsidiary ImationEnterprises Corp., which is also an obligor under the Amended Credit Agreement, and the Guarantors. Advances under theU.S. portion of the Credit Facility are limited to the lesser of (a) $150 million and (b) the “U.S. borrowing base.” TheU.S. borrowing base is equal to the following:
• up to 85 percent of eligible accounts receivable; plus
• up to the lesser of 65 percent of eligible inventory or 85 percent of the appraised net orderly liquidation value ofeligible inventory; plus
• up to 60 percent of the appraised fair market value of eligible real estate (the Original Real Estate Value), suchOriginal Real Estate Value to be reduced each calendar month by 1/84th, provided, that the Original Real EstateValue shall not exceed $40 million; plus
• such other classes of collateral as may be mutually agreed upon and at advance rates as may be determined bythe Agent; minus
• such reserves as the Agent may establish in good faith.
Our European obligations under the Credit Agreement are secured by a first priority lien on substantially all of thematerial personal property of the European Borrower. Advances under the European portion of the Credit Facility are limited
80

NOTES TO CONSOLIDATED FINANCIAL STATEMENTS — (Continued)
to the lesser of (a) $50 million and (b) the “European borrowing base.” The European borrowing base calculation isfundamentally the same as the U.S. borrowing base, subject to certain differences to account for European law and othersimilar issues.
During the twelve months ended December 31, 2011 interest on borrowings under the Amended Credit Agreementwould have been at a variable rate of interest of approximately 5.0 percent. However, we did not have borrowings under theCredit Agreement during 2011.
The Amended Credit Agreement contains covenants which are customary for similar credit arrangements, includingcovenants relating to financial reporting and notification; payment of indebtedness, taxes and other obligations; compliancewith applicable laws; and limitations regarding additional liens, indebtedness, certain acquisitions, investments anddispositions of assets. We were in compliance with all covenants as of December 31, 2011. The Amended Credit Agreementalso contains a conditional financial covenant that requires us to have a Consolidated Fixed Charge Coverage Ratio (asdefined in the Amended Credit Agreement) of not less than 1.20 to 1.00 during certain periods described in the AmendedCredit Agreement. At December 31, 2011 the condition did not arise such that the Consolidated Fixed Charge Coverage Ratiowas required as a covenant. As of December 31, 2011, our total availability under the Credit Facility was $127.6 million.
As of December 31, 2011, we had no other credit facilities available outside the United States.
As of December 31, 2011 we had outstanding standby letters of credit of $0.6 million. As of December 31, 2010, we hadoutstanding standby and import letters of credit of $3.4 million. When circumstances allow, we are using standardizedpayment terms and are no longer actively using trade letters of credit as payments to certain foreign suppliers, which hasresulted in a decrease in our outstanding letters of credit as of December 31, 2011.
Our interest expense, which includes letter of credit fees, facility fees and commitment fees under the Credit Agreement,for 2011, 2010 and 2009 was $3.7 million, $4.2 million and $2.9 million, respectively. Interest expense also includesamortization of debt issuance costs which are being amortized through March 2013. Cash paid for interest for 2011, 2010 and2009, relating to both continuing and discontinued operations, was $2.7 million, $2.7 million and $1.4 million, respectively.
Note 12 — Fair Value Measurements
Fair Value of Financial Instruments
At December 31, 2011 and 2010, our financial instruments included cash and cash equivalents, accounts receivable,accounts payable and derivative contracts. The fair values of cash and cash equivalents, accounts receivable and accountspayable approximated carrying values due to the short-term nature of these instruments. In addition, derivative instruments,assets held for sale and certain fixed assets are recorded at fair value as discussed below.
Fair value measurements are categorized into one of three levels based on the lowest level of significant input used:Level 1 (unadjusted quoted prices in active markets for identical assets); Level 2 (significant observable market inputsavailable at the measurement date, other than quoted prices included in Level 1); and Level 3 (unobservable inputs thatcannot be corroborated by observable market data).
Assets and Liabilities that are Measured at Fair Value on a Nonrecurring Basis
The Company’s non-financial assets such as goodwill, intangible assets, and property, plant, and equipment are measuredat fair value when there is an indicator of impairment and recorded at fair value only when an impairment is recognized.
The Company assesses the impairment of intangible assets whenever events or changes in circumstances indicate thatthe carrying amount of an intangible asset may not be recoverable. The aggregate carrying amount of intangible assets was
81

NOTES TO CONSOLIDATED FINANCIAL STATEMENTS — (Continued)
$321.7 million and $320.4 million at December 31, 2011 and 2010, respectively. The inputs used in the fair value analysis fallwithin Level 3 of the fair value hierarchy due to the use of significant unobservable inputs to determine fair value. Based uponthe testing performed in 2011 and 2010, no impairment of intangible assets was deemed to have occurred.
The Company assesses the impairment of property, plant, and equipment whenever events or changes incircumstances indicate that the carrying amount of property, plant, and equipment assets may not be recoverable. As part ofthe Company’s 2011 manufacturing redesign restructuring program, the Company recorded property, plant, and equipmentimpairments of $14.7 million in 2010 related to the Weatherford, Oklahoma facility. See Note 7 herein for further discussion ofthe previously announced restructuring initiatives.
During 2011 we acquired MXI Security and IronKey which resulted in goodwill of $21.9 million and $9.4 million,respectively. Also during 2011 we acquired Encryptx which resulted in goodwill of $1.6 million. In accordance with theaccounting provisions for goodwill, goodwill related to the Encryptx acquisition was written-off as the carrying amount of ourAmericas-Commercial reporting unit, including Encryptx, significantly exceeded the implied fair value. This resulted in animpairment charge of $1.6 million, which was included in earnings in 2011. See Note 6 herein for further information regardingthe assumptions used to assess this impairment.
Assets and Liabilities that are Measured at Fair Value on a Recurring Basis
The assets in our postretirement benefit plans are measured at fair value on a recurring basis (at least annually). SeeNote 9 herein for additional discussion concerning pension and postretirement benefit plans.
We revalue the contingent consideration obligation for acquisitions completed on a recurring basis each reportingperiod. Changes in the fair value of our contingent consideration obligations are recognized as a fair value adjustment ofcontingent consideration within our consolidated statements of income. These fair value measurements are based onsignificant inputs not observable in the market and therefore represent Level 3 measurements. The total of such contingentconsideration obligations at December 31, 2011 was $10.5 million, related to our acquisitions of MXI Security and Encryptx inthe amounts of $9.2 million and $1.3 million, respectively. Based on our analysis of fair value as of December 31, 2011, thevalue at acquisition of such contingent consideration obligations equaled the estimated fair value as of December 31, 2011and no adjustments were required.
We maintain a foreign currency exposure management policy that allows the use of derivative instruments, principallyforeign currency forward, option contracts and option combination strategies to manage risks associated with foreignexchange rate volatility. Generally, these contracts are entered into to fix the U.S. dollar amount of the eventual cash flows.The derivative instruments range in duration at inception from less than one to sixteen months. We do not hold or issuederivative financial instruments for speculative or trading purposes and we are not a party to leveraged derivatives.
As of December 31, 2011, we held derivative instruments that are required to be measured at fair value on a recurringbasis. Our derivative instruments consist of foreign currency forwards, option contracts and option combination strategies.The fair value of our derivative instruments is determined based on inputs that are observable in the public market, but areother than publicly quoted prices (Level 2).
We are exposed to the risk of nonperformance by our counter-parties in foreign currency forward and option contracts,but we do not anticipate nonperformance by any of these counter-parties. We actively monitor our exposure to credit riskthrough the use of credit approvals and credit limits and by using major international banks and financial institutions ascounter-parties.
Cash Flow Hedges
We attempt to substantially mitigate the risk that forecasted cash flows denominated in foreign currencies may beadversely affected by changes in currency exchange rates through the use of option, forward and combination option
82

NOTES TO CONSOLIDATED FINANCIAL STATEMENTS — (Continued)
contracts. The degree of our hedging can fluctuate based on management judgment and forecasted projections. We formallydocument all relationships between hedging instruments and hedged items, as well as our risk management objective andstrategy for undertaking the hedge items. This process includes linking all derivatives to forecasted transactions.
We also formally assess, both at the hedge’s inception and on an ongoing basis, whether the derivatives used inhedging transactions are highly effective in offsetting changes in the cash flows of hedged items. Gains and losses related tocash flow hedges are deferred in accumulated other comprehensive income (loss) with a corresponding asset or liability.When the hedged transaction occurs, the gains and losses in accumulated other comprehensive income (loss) arereclassified into the Consolidated Statements of Operations in the same line as the item being hedged. If at any time it isdetermined that a derivative is not highly effective as a hedge, we discontinue hedge accounting prospectively, with deferredgains and losses being recognized in current period operations.
As of December 31, 2011 and 2010, cash flow hedges ranged in duration from one to 16 months and had a totalnotional amount of $208.2 million and $246.0 million, respectively. Hedge gains of $0.8 million in 2011, and hedge losses of$0.1 million, and $3.8 million in 2010 and 2009, respectively, were reclassified into the Consolidated Statements ofOperations. The amount of net deferred gains on foreign currency cash flow hedges included in accumulated othercomprehensive income (loss) in shareholders’ equity as of December 31, 2011 was $2.2 million, pre-tax, which depending onmarket factors is expected to reverse in the Consolidated Balance Sheets or be reclassified into operations in 2012.
Other Hedges
We enter into foreign currency forward contracts, generally with durations of one to three months, to manage the foreigncurrency exposure related to our monetary assets and liabilities denominated in foreign currencies. We record the estimatedfair value of these forwards within other current assets or other current liabilities in the Consolidated Balance Sheets and allchanges in their fair value are immediately recognized in the Consolidated Statements of Operations.
As of December 31, 2011 and 2010, we had a notional amount of forward contracts of $32.9 million and $47.1 million,respectively, to hedge our recorded balance sheet exposures.
Our financial assets and liabilities that are measured at fair value on a recurring basis were as follows:
December 31, 2011 December 31, 2010
Quoted Prices inActive Markets
for IdenticalAssets
(Level 1)
SignificantOther
ObservableInputs
(Level 2)
UnobservableInputs
(Level 3)
Quoted Prices inActive Markets
for IdenticalAssets
(Level 1)
SignificantOther
ObservableInputs
(Level 2)
UnobservableInputs
(Level 3)
(In millions)
Derivative assetsForeign currency option
contracts . . . . . . . . . . . . . . . . $— $ 2.3 $— $— $ 3.5 $—Foreign currency forward
contracts . . . . . . . . . . . . . . . . — 1.1 — — — —Derivative liabilities
Foreign currency optioncontracts . . . . . . . . . . . . . . . . — (1.4) — — (2.3) —
Foreign currency forwardcontracts . . . . . . . . . . . . . . . . — — — — — —
Total . . . . . . . . . . . . . . . . . . . . . $— $ 2.0 $— $— $ 1.2 $—
There were no transfers into or out of Level 1 or Level 2 during the year ended December 31, 2011.
83

NOTES TO CONSOLIDATED FINANCIAL STATEMENTS — (Continued)
The notional amounts and fair values of our derivative instruments in the Consolidated Financial Statements were asfollows as of December 31, 2011:
Fair Value
NotionalAmount
OtherCurrentAssets
OtherCurrent
Liabilities
(In millions)
Cash flow hedges designated as hedging instruments . . . . . . . . . . . . . . . . . . . . $208.2 $3.4 $(1.4)Other economic hedges not receiving hedge accounting . . . . . . . . . . . . . . . . . . 32.9 — —
Total . . . . . . . . . . . . . . . . . . . . . . . . . . . . . . . . . . . . . . . . . . . . . . . . . . . . . . $241.1 $3.4 $(1.4)
On December 31, 2011 we entered into certain economic hedges which do not meet the definition for hedge accountingtreatment. In accordance with trade date accounting, these hedges and related exposures are recorded as ofDecember 31, 2011, but do not have a value until the subsequent day.
The derivative gains and losses in the Consolidated Statements of Operations for the year ended December 31, 2011were as follows:
Pretax Gain/(Loss)Recognized in
OtherComprehensive
Income onEffective Portion
of Derivative
Pretax Gain/(Loss) onEffective Portion of
DerivativeReclassification fromAccumulated Other
Comprehensive Incometo Cost of Goods
Sold, Net
Pretax Gain/(Loss)Recognized in the
Consolidated Statement ofOperations in Other
Expense, Net
(In millions)
Cash flow hedges designated as hedginginstruments . . . . . . . . . . . . . . . . . . . . . . . . . . $1.9 $0.8 $ —
Other economic hedges not receivinghedge accounting . . . . . . . . . . . . . . . . . . . . . . — — (1.7)
Total . . . . . . . . . . . . . . . . . . . . . . . . . . . . . . . $1.9 $0.8 $(1.7)
Note 13 — Shareholders’ Equity
Shareholder Rights Plan
In 2006, we adopted a shareholder rights plan under which we have issued one preferred share purchase right (Right)for each share of our common stock. If it becomes exercisable, each Right will entitle its holder to purchase oneone-hundredth of a share of Series A Junior Participating Preferred Stock at an exercise price of $160, subject to adjustment.The Rights are exercisable only if a person or group acquires beneficial ownership of 15 percent or more of our outstandingcommon stock, or after the first public announcement relating to a tender offer or exchange offer that would result in a personor group beneficially owning 15 percent or more of our outstanding shares of common stock subject to certain exceptions. TheRights expire on July 1, 2016 and may be redeemed earlier by the Board of Directors for $0.01 per Right.
The shareholder rights plan was amended effective July 30, 2007 to change the definition of acquiring person to excludeTDK Corporation and its affiliates at any time during the period (TDK Standstill Period) beginning at the time, if any, that TDK andits affiliates own 15 percent or more of the outstanding shares of common stock and ending at the time, if any, that TDK and itsaffiliates cease to own at least 75 percent of the shares issued related to the acquisition of the TDK Recording Media business orcease to be holders of record of at least 10 percent of the common stock as a result of Imation issuing additional shares.
84

NOTES TO CONSOLIDATED FINANCIAL STATEMENTS — (Continued)
TDK cannot become the beneficial owner of more than 21 percent of the common stock outstanding at any time duringthe TDK Standstill Period other than as a result of a reduction in the number of shares outstanding due to Imationrepurchasing shares of common stock and is limited to 22 percent in this event. TDK shall dispose of a sufficient number ofshares of common stock within 10 days after becoming aware that the percentage has been surpassed such that TDK shallbe the beneficial owner of no more than 21 percent of the common stock then outstanding.
Treasury Stock
Our Board of Directors has authorized the repurchase of a total of 3.0 million shares. Since the inception of thisauthorization we have repurchased 1.8 million shares of common stock and as of December 31, 2011 we have remainingauthorization to repurchase up to 1.2 million shares. We repurchased 1.1 million shares for $9.7 million during 2011. We didnot repurchase any shares during 2010 or 2009. The treasury stock held as of December 31, 2011 was acquired at anaverage price of $23.97 per share.
Following is a summary of treasury share activity:
TreasuryShares
Balance as of December 31, 2008 . . . . . . . . . . . . . . . . . . . . . . . . . . . . . . . . . . . . . . . . . . . . . . . . . . 5,227,777Purchases . . . . . . . . . . . . . . . . . . . . . . . . . . . . . . . . . . . . . . . . . . . . . . . . . . . . . . . . . . . . . . . . . —Exercise of stock options . . . . . . . . . . . . . . . . . . . . . . . . . . . . . . . . . . . . . . . . . . . . . . . . . . . . . . . —Restricted stock grants and other . . . . . . . . . . . . . . . . . . . . . . . . . . . . . . . . . . . . . . . . . . . . . . . . (264,301)401(k) matching contribution . . . . . . . . . . . . . . . . . . . . . . . . . . . . . . . . . . . . . . . . . . . . . . . . . . . . (136,771)
Balance as of December 31, 2009 . . . . . . . . . . . . . . . . . . . . . . . . . . . . . . . . . . . . . . . . . . . . . . . . . . 4,826,705Purchases . . . . . . . . . . . . . . . . . . . . . . . . . . . . . . . . . . . . . . . . . . . . . . . . . . . . . . . . . . . . . . . . . —Exercise of stock options . . . . . . . . . . . . . . . . . . . . . . . . . . . . . . . . . . . . . . . . . . . . . . . . . . . . . . . (1,000)Restricted stock grants and other . . . . . . . . . . . . . . . . . . . . . . . . . . . . . . . . . . . . . . . . . . . . . . . . (439,175)401(k) matching contribution . . . . . . . . . . . . . . . . . . . . . . . . . . . . . . . . . . . . . . . . . . . . . . . . . . . . (174,245)
Balance as of December 31, 2010 . . . . . . . . . . . . . . . . . . . . . . . . . . . . . . . . . . . . . . . . . . . . . . . . . . 4,212,285Purchases . . . . . . . . . . . . . . . . . . . . . . . . . . . . . . . . . . . . . . . . . . . . . . . . . . . . . . . . . . . . . . . . . 1,099,219Exercise of stock options . . . . . . . . . . . . . . . . . . . . . . . . . . . . . . . . . . . . . . . . . . . . . . . . . . . . . . . (45,429)Restricted stock grants and other . . . . . . . . . . . . . . . . . . . . . . . . . . . . . . . . . . . . . . . . . . . . . . . . (365,712)401(k) matching contribution . . . . . . . . . . . . . . . . . . . . . . . . . . . . . . . . . . . . . . . . . . . . . . . . . . . . (236,440)
Balance as of December 31, 2011 . . . . . . . . . . . . . . . . . . . . . . . . . . . . . . . . . . . . . . . . . . . . . . . . . . 4,663,923
Accumulated Other Comprehensive Loss
Accumulated other comprehensive loss consisted of the following:
December 31,2011
December 31,2010
(In millions)
Cumulative currency translation adjustment . . . . . . . . . . . . . . . . . . . . . . . . . . . . . . $(47.4) $(47.4)Pension adjustments, net of income tax . . . . . . . . . . . . . . . . . . . . . . . . . . . . . . . . . (26.8) (14.2)Cash flow hedging and other, net of income tax . . . . . . . . . . . . . . . . . . . . . . . . . . . 1.6 0.9
Total accumulated other comprehensive loss . . . . . . . . . . . . . . . . . . . . . . . . . . $(72.6) $(60.7)
85

NOTES TO CONSOLIDATED FINANCIAL STATEMENTS — (Continued)
Comprehensive loss consisted of the following:
Years Ended December 31,
2011 2010 2009
(In millions)
Net loss . . . . . . . . . . . . . . . . . . . . . . . . . . . . . . . . . . . . . . . . . . . . . . . . . . . . . . . $(46.7) $(158.5) $(42.2)Cumulative currency translation adjustment . . . . . . . . . . . . . . . . . . . . . . . . . . . . . — 3.0 4.5Pension adjustments, net of income taxes . . . . . . . . . . . . . . . . . . . . . . . . . . . . . . (12.6) 4.6 9.8Cash flow hedging and other, net of income tax . . . . . . . . . . . . . . . . . . . . . . . . . . 0.7 0.6 1.8
Total comprehensive loss . . . . . . . . . . . . . . . . . . . . . . . . . . . . . . . . . . . . . . . . $(58.6) $(150.3) $(26.1)
Note 14 — Business Segment Information and Geographic Data
Our business is organized, managed and internally and externally reported as segments differentiated by the regionalmarkets we serve: Americas, Europe, North Asia and South Asia. Each of these geographic segments has responsibility forselling generally all of our product lines.
• Our Americas segment includes North America, Central America and South America.
• Our Europe segment includes Europe and parts of Africa.
• Our North Asia segment includes Japan, China, Hong Kong, Korea and Taiwan.
• Our South Asia segment includes Australia, Singapore, India, the Middle East and parts of Africa.
We evaluate segment performance based on revenue and operating income (loss). Revenue for each segment isgenerally based on customer location where the product is shipped. The operating income (loss) reported in our segmentsexcludes corporate and other unallocated amounts. Although such amounts are excluded from the business segment results,they are included in reported consolidated results. Corporate and unallocated amounts include litigation settlement expense,goodwill impairment expense, research and development expense, corporate expense, stock-based compensation expenseand restructuring and other expenses which are not allocated to the segments.
Net revenue and operating income (loss) were as follows:
Years Ended December 31,
2011 2010 2009
(In millions)
Net Revenue
Americas . . . . . . . . . . . . . . . . . . . . . . . . . . . . . . . . . . . . . . . . . . . . . . . . $ 595.9 $ 712.9 $ 834.2Europe . . . . . . . . . . . . . . . . . . . . . . . . . . . . . . . . . . . . . . . . . . . . . . . . . 248.0 289.8 370.5North Asia . . . . . . . . . . . . . . . . . . . . . . . . . . . . . . . . . . . . . . . . . . . . . . . 307.2 315.2 306.9South Asia . . . . . . . . . . . . . . . . . . . . . . . . . . . . . . . . . . . . . . . . . . . . . . . 139.3 143.0 137.9
Total . . . . . . . . . . . . . . . . . . . . . . . . . . . . . . . . . . . . . . . . . . . . . . . . . $1,290.4 $1,460.9 $1,649.5
Operating Income (Loss)
Americas . . . . . . . . . . . . . . . . . . . . . . . . . . . . . . . . . . . . . . . . . . . . . . . . $ 8.4 $ 36.8 $ 48.3Europe . . . . . . . . . . . . . . . . . . . . . . . . . . . . . . . . . . . . . . . . . . . . . . . . . 10.3 (0.6) 2.4North Asia . . . . . . . . . . . . . . . . . . . . . . . . . . . . . . . . . . . . . . . . . . . . . . . 12.5 14.9 15.3South Asia . . . . . . . . . . . . . . . . . . . . . . . . . . . . . . . . . . . . . . . . . . . . . . . 4.0 4.0 2.6Corporate and unallocated . . . . . . . . . . . . . . . . . . . . . . . . . . . . . . . . . . . (68.3) (124.8) (130.3)
Total . . . . . . . . . . . . . . . . . . . . . . . . . . . . . . . . . . . . . . . . . . . . . . . . . $ (33.1) $ (69.7) $ (61.7)
86

NOTES TO CONSOLIDATED FINANCIAL STATEMENTS — (Continued)
We have not provided specific asset information by segment, as it is not regularly provided to our chief operatingdecision maker for review at a segment specific level. Corporate and unallocated amounts above include non-cash goodwillimpairment charges of $1.6 million and $23.5 million for the years ended December 31, 2011 and 2010, respectively, as wellas restructuring and other costs of $21.5 million, $51.1 million and $26.6 million for the years ended December 31, 2011,2010 and 2009, respectively. Corporate and unallocated amounts above include a litigation settlement charge of $2.0 million,$2.6 million and $49.0 million for the years ended December 31, 2011, 2010 and 2009, respectively.
We have three major product categories: traditional storage, secure and scalable storage, and audio and video information.Traditional storage products include optical products, magnetic products and other traditional storage media products. Opticalproducts include primarily DVDs, CDs and Blu-ray disc recordable media. Magnetic products include primarily data storage tapemedia. Other traditional storage products include primarily optical drives and audio and video tape media. Secure and scalablestorage products include flash memory and hard disk drive products, including encrypted and biometric USB drives, encryptedand biometric hard disk drives, secure portable desktop solutions, and software solutions, including products which containvarious security features such as password authentication, encryption and remote manageability, and data protection and dataarchive appliances. Audio and video information products include primarily audio electronics such as portable CD players andiPod clock radios and accessories such as CD and DVD jewel cases and headphones.
Net revenue by product category was as follows:
Years Ended December 31,
2011 2010 2009
(In millions)
Optical products . . . . . . . . . . . . . . . . . . . . . . . . . . . . . . . . . . . . . . . . . . . . . $ 511.9 $ 619.3 $ 738.0Magnetic products . . . . . . . . . . . . . . . . . . . . . . . . . . . . . . . . . . . . . . . . . . . 327.4 347.8 406.0Other traditional storage . . . . . . . . . . . . . . . . . . . . . . . . . . . . . . . . . . . . . . . 47.7 62.8 77.7
Total traditional storage . . . . . . . . . . . . . . . . . . . . . . . . . . . . . . . . . . . . . . . 887.0 1,029.9 1,221.7Secure and scalable storage . . . . . . . . . . . . . . . . . . . . . . . . . . . . . . . . . . . 210.1 207.5 165.4Audio and video information . . . . . . . . . . . . . . . . . . . . . . . . . . . . . . . . . . . . 193.3 223.5 262.4
Total . . . . . . . . . . . . . . . . . . . . . . . . . . . . . . . . . . . . . . . . . . . . . . . . . . . $1,290.4 $1,460.9 $1,649.5
The following tables present net revenue and long-lived assets by geographical region:
Years Ended December 31,
2011 2010 2009
(In millions)
Net Revenue
United States . . . . . . . . . . . . . . . . . . . . . . . . . . . . . . . . . . . . . . . . . . . . . $ 519.2 $ 633.1 $ 726.9International . . . . . . . . . . . . . . . . . . . . . . . . . . . . . . . . . . . . . . . . . . . . . 771.2 827.8 922.6
Total . . . . . . . . . . . . . . . . . . . . . . . . . . . . . . . . . . . . . . . . . . . . . . . . . $1,290.4 $1,460.9 $1,649.5
The United States and Japan each comprise more than 10 percent of our total net revenue. Net revenue from Japanwas 17.6 percent, 16.0 percent and 13.9 percent of total net revenue for the years ended December 31, 2011, 2010 and2009, respectively.
87

NOTES TO CONSOLIDATED FINANCIAL STATEMENTS — (Continued)
As of December 31,
2011 2010 2009
(In millions)
Long-Lived Assets
United States . . . . . . . . . . . . . . . . . . . . . . . . . . . . . . . . . . . . . . . . . . . . . . . . . . . $51.6 $62.4 $105.1International . . . . . . . . . . . . . . . . . . . . . . . . . . . . . . . . . . . . . . . . . . . . . . . . . . . . 3.8 4.5 4.7
Total . . . . . . . . . . . . . . . . . . . . . . . . . . . . . . . . . . . . . . . . . . . . . . . . . . . . . . . $55.4 $66.9 $109.8
Note 15 — Commitments and Contingencies
Litigation
In the normal course of business, we periodically enter into agreements that incorporate general indemnificationlanguage. Performance under these indemnities would generally be triggered by a breach of terms of the contract or by athird-party claim. There has historically been no material losses related to such indemnifications. In accordance withaccounting principles generally accepted in the United States of America, we record a liability in our Consolidated FinancialStatements for these actions when a loss is known or considered probable and the amount can be reasonably estimated.
We are the subject of various pending or threatened legal actions in the ordinary course of our business. All suchmatters are subject to many uncertainties and outcomes that are not predictable with assurance. Additionally, our electronicsand accessories business is subject to allegations of patent infringement by our competitors as well as by non-practicingentities (NPEs), sometimes referred to as “patent trolls,” who may seek monetary settlements from us, our competitors,suppliers and resellers. Consequently, as of December 31, 2011, we are unable to ascertain the ultimate aggregate amount ofany monetary liability or financial impact that we may incur with respect to these matters. While these matters could materiallyaffect operating results depending upon the final resolution in future periods, it is our opinion that after final disposition, anymonetary liability beyond that provided in the Consolidated Balance Sheet as of December 31, 2011 would not be material toour Consolidated Financial Statements.
On June 14, 2011, Trek 2000 International Ltd and certain of its affiliates (“Trek”) filed a complaint asking theInternational Trade Commission (“ITC”) to commence an investigation against us and various others. Trek alleges thatImation and others unlawfully import and sell into the United States certain universal serial bus (“USB”) portable storagedevices that allegedly infringe several of Trek’s U.S. patents. Trek seeks to block the importation of the allegedly offendingproducts into the United States. On August 15, 2011, we filed an answer to Trek’s complaint, denying liability and assertingthat Trek fails to meet certain requirements to bring its complaint to the ITC. This investigation is in the discovery phase. Thehearing is scheduled for May 9-16, 2012; the initial determination is expected July 19, 2012; and the target date for thecompletion of this investigation is November 19, 2012. Although this proceeding is subject to the uncertainties inherent in thelitigation process, based on the information presently available to us, management does not expect that the ultimateresolution of this action will have a material adverse effect on our financial condition, results of operations or cash flows.
On January 11, 2011, we signed a patent cross-license agreement with SanDisk to settle two patent cases filed bySanDisk in Federal District Court against our flash memory products, including USB drives and solid state disk (SSD) drives.Under the terms of the cross-license, we will pay SanDisk royalties on certain flash memory products that were previously notlicensed. The specific terms of the cross-license are confidential. The cross-license agreement required us to make aone-time payment of $2.6 million in 2011, which was included in litigation settlement expense in the Consolidated Statementsof Operations during 2010.
On June 19, 2009 Advanced Research Corp. (ARC) sued Imation in Ramsey County District Court for breach of contractrelating to a supply agreement under which we purchased our requirements for magnetic heads to write servo patterns onmagnetic tape prior to sale of the finished cartridges, requesting the court to order that Imation pay damages and return thepurchased heads to ARC. In September 2011 we agreed to a settlement by which we agreed to pay ARC $2.0 million, whichis included in litigation settlement expense in the Consolidated Statements of Operations during 2011.
88

NOTES TO CONSOLIDATED FINANCIAL STATEMENTS — (Continued)
A litigation settlement charge of $49.0 million was recorded in 2009. We entered into a confidential settlementagreement ending all legal disputes with Philips Electronics N.V., U.S. Philips Corporation and North American PhilipsCorporation (collectively, Philips). We had been involved in a complex series of disputes in multiple jurisdictions regardingcross-licensing and patent infringement related to recordable optical media. The settlement provided resolution of all claimsand counterclaims filed by the parties without any finding or admission of liability or wrongdoing by any party. As a term of thesettlement, we agreed to pay Philips $53.0 million over a period of three years. Based on the present value of thesesettlement payments, we recorded a charge of $49.0 million in the second quarter of 2009. We made payments of$8.3 million, $8.2 million and $20.0 million in 2011, 2010 and 2009, respectively. Interest accretion of $1.2 million, $1.5 millionand $0.8 million was recorded in 2011, 2010 and 2009, respectively. The interest accretion is included in the interest expenseon our Consolidated Statements of Operations.
Operating Leases
We incur rent expense under operating leases, which primarily relate to equipment and office space. Most long-termleases include one or more options to renew at the then fair rental value for a period of approximately one to three years. Thefollowing table sets forth the components of rent expense for the years ended December 31:
2011 2010 2009
(In millions)
Minimum lease payments . . . . . . . . . . . . . . . . . . . . . . . . . . . . . . . . . . . . . . . . . . . . . $ 8.7 $ 9.6 $10.3Contingent rentals . . . . . . . . . . . . . . . . . . . . . . . . . . . . . . . . . . . . . . . . . . . . . . . . . . . 4.5 7.2 18.0Rental income . . . . . . . . . . . . . . . . . . . . . . . . . . . . . . . . . . . . . . . . . . . . . . . . . . . . . (3.1) (2.9) (2.8)Sublease income . . . . . . . . . . . . . . . . . . . . . . . . . . . . . . . . . . . . . . . . . . . . . . . . . . . (0.8) (0.5) (0.3)
Total rental expense . . . . . . . . . . . . . . . . . . . . . . . . . . . . . . . . . . . . . . . . . . . . . . . . . $ 9.3 $13.4 $25.2
Minimum lease payments and contingent rental expenses incurred due to agreements with warehouse providers areincluded as a component of cost of goods sold in the Consolidated Statements of Operations. The minimum lease paymentsunder such arrangements were $0.8 million, $2.0 million and $2.2 million in 2011, 2010 and 2009, respectively. Thecontingent rental expenses under such arrangements were $1.7 million, $3.6 million and $5.8 million in 2011, 2010 and 2009,respectively.
The following table sets forth the minimum rental payments under operating leases with non-cancelable terms in excessof one year as of December 31, 2011:
2012 2013 2014 2015 2016 Thereafter Total
(In millions)
Minimum lease payments . . . . . . . . . . . . . . . . . . . . . . . . . . . . . . . . . $7.8 $6.3 $2.4 $1.0 $0.3 $0.1 $17.9
Minimum payments have not been reduced by minimum sublease rentals of approximately $1.1 million due in the futureunder non-cancelable lease agreements.
Environmental Matters
Our operations are subject to a wide range of federal, state and local environmental laws. Environmental remediationcosts are accrued when a probable liability has been determined and the amount of such liability has been reasonablyestimated. These accruals are reviewed periodically as remediation and investigatory activities proceed and are adjustedaccordingly. Compliance with environmental regulations has not had a material adverse effect on our financial results. As ofDecember 31, 2011, we had environmental-related accruals totaling $0.5 million recorded in other liabilities and we haveminor remedial activities underway at one of our prior manufacturing facilities. We believe that our accruals are adequate,though there can be no assurance that the amount of expense relating to remediation actions and compliance with applicableenvironmental laws will not exceed the amounts reflected in our accruals.
89

NOTES TO CONSOLIDATED FINANCIAL STATEMENTS — (Continued)
Note 16 — Related Party Transactions
As a result of the TDK Recording Media business acquisition, TDK became our largest shareholder and ownedapproximately 20 percent of our shares as of December 31, 2011 and 2010. In connection with the acquisition we entered intoa Supply Agreement and a Transition Services Agreement with TDK. Under the Transition Services Agreement, TDK providedcertain services to assist in the transfer of the TDK Recording Media business to Imation.
In 2011, 2010 and 2009 we purchased products and services in the aggregate amounts of approximately $50 million,$28 million and $64 million, respectively, from TDK or its affiliates. We did not sell products nor provide services to TDK or itsaffiliates in 2011, 2010 or 2009. Fees under the Transition Services Agreement were approximately $3 million in 2009. Thesetransition services were completed in July 2009. Trade payables to TDK or its affiliates were $9.8 million and $6.2 million atDecember 31, 2011 and 2010, respectively. No trade receivables from TDK or its affiliates were outstanding as ofDecember 31, 2011 or December 31, 2010.
On January 13, 2011, the Board of Directors approved a restructuring plan to discontinue tape coating operations at ourWeatherford, Oklahoma facility by April 2011 and subsequently close the facility. We signed a strategic agreement with TDK tojointly develop and manufacture magnetic tape technologies. Under the agreement, we will collaborate on the research anddevelopment of future tape formats in both companies’ research centers in the U.S. and Japan, while consolidating tape coatingoperations to the TDK Yamanashi manufacturing facility. See Note 7 for additional details regarding the restructuring costs.
90

NOTES TO CONSOLIDATED FINANCIAL STATEMENTS — (Continued)
Note 17 — Quarterly Data (Unaudited)
First Second Third Fourth Total(1)
(In millions, except per share amounts)
2010
Net revenue . . . . . . . . . . . . . . . . . . . . . . . . . . . . . . . . . . . . . . $365.8 $354.4 $342.3 $ 398.4 $1,460.9Gross profit . . . . . . . . . . . . . . . . . . . . . . . . . . . . . . . . . . . . . . . 61.7 58.5 55.6 50.6 226.4Operating (loss) income . . . . . . . . . . . . . . . . . . . . . . . . . . . . . . 0.2 (23.8) (2.3) (43.8) (69.7)(Loss) income from continuing operations . . . . . . . . . . . . . . . . (2.5) (15.7) (2.3) (137.8) (158.3)Discontinued operations . . . . . . . . . . . . . . . . . . . . . . . . . . . . . (0.1) — (0.1) — (0.2)Net (loss) income . . . . . . . . . . . . . . . . . . . . . . . . . . . . . . . . . . (2.6) (15.7) (2.4) (137.8) (158.5)(Loss) earnings per common share, continuing operations:
Basic . . . . . . . . . . . . . . . . . . . . . . . . . . . . . . . . . . . . . . . . . $ (0.07) $ (0.42) $ (0.06) $ (3.63) $ (4.19)Diluted . . . . . . . . . . . . . . . . . . . . . . . . . . . . . . . . . . . . . . . . (0.07) (0.42) (0.06) (3.63) (4.19)
Earnings (loss) per common share, discontinued operations:Basic . . . . . . . . . . . . . . . . . . . . . . . . . . . . . . . . . . . . . . . . . $ — $ — $ — $ — $ (0.01)Diluted . . . . . . . . . . . . . . . . . . . . . . . . . . . . . . . . . . . . . . . . — — — — (0.01)
(Loss) earnings per common share, net income:Basic . . . . . . . . . . . . . . . . . . . . . . . . . . . . . . . . . . . . . . . . . $ (0.07) $ (0.42) $ (0.06) $ (3.63) $ (4.19)Diluted . . . . . . . . . . . . . . . . . . . . . . . . . . . . . . . . . . . . . . . . (0.07) (0.42) (0.06) (3.63) (4.19)
2011
Net revenue . . . . . . . . . . . . . . . . . . . . . . . . . . . . . . . . . . . . . . $316.5 $323.0 $308.6 $ 342.3 $1,290.4Gross profit . . . . . . . . . . . . . . . . . . . . . . . . . . . . . . . . . . . . . . . 54.0 54.0 57.2 51.5 216.7Operating (loss) income . . . . . . . . . . . . . . . . . . . . . . . . . . . . . . (3.4) (9.3) (8.3) (12.1) (33.1)Loss from continuing operations . . . . . . . . . . . . . . . . . . . . . . . (7.2) (12.5) (14.1) (12.9) (46.7)Discontinued operations . . . . . . . . . . . . . . . . . . . . . . . . . . . . . — — — — —Net loss . . . . . . . . . . . . . . . . . . . . . . . . . . . . . . . . . . . . . . . . . . (7.2) (12.5) (14.1) (12.9) (46.7)(Loss) earnings per common share, continuing operations:
Basic . . . . . . . . . . . . . . . . . . . . . . . . . . . . . . . . . . . . . . . . . $ (0.19) $ (0.33) $ (0.38) $ (0.34) $ (1.24)Diluted . . . . . . . . . . . . . . . . . . . . . . . . . . . . . . . . . . . . . . . . (0.19) (0.33) (0.38) (0.34) (1.24)
Earnings (loss) per common share, discontinued operations:Basic . . . . . . . . . . . . . . . . . . . . . . . . . . . . . . . . . . . . . . . . . $ — $ — $ — $ — $ —Diluted . . . . . . . . . . . . . . . . . . . . . . . . . . . . . . . . . . . . . . . . — — — — —
(Loss) earnings per common share, net income:Basic . . . . . . . . . . . . . . . . . . . . . . . . . . . . . . . . . . . . . . . . . $ (0.19) $ (0.33) $ (0.38) $ (0.34) $ (1.24)Diluted . . . . . . . . . . . . . . . . . . . . . . . . . . . . . . . . . . . . . . . . (0.19) (0.33) (0.38) (0.34) (1.24)
(1) The sum of the quarterly earnings per share may not equal the annual earnings per share due to changes in averageshares outstanding.
91

Item 9. Changes in and Disagreements with Accountants on Accounting and Financial Disclosure.
None.
Item 9A. Controls and Procedures.
Evaluation of Disclosure Controls and Procedures. Based on an evaluation of our disclosure controls and procedures(as defined in Rule 13a-15(e) under the Exchange Act) as of December 31, 2011, the end of the period covered by this report,the President and Chief Executive Officer, Mark E. Lucas, and the Senior Vice President and Chief Financial Officer, Paul R.Zeller, have concluded that the disclosure controls and procedures were effective.
Changes in Internal Controls. During the quarter ended December 31, 2011, there was no change in our internalcontrol over financial reporting (as defined in Rule 13a-15(f) under the Exchange Act) that has materially affected, or isreasonably likely to materially affect, our internal control over financial reporting.
Management’s Report on Internal Control over Financial Reporting. Management of Imation is responsible forestablishing and maintaining adequate internal control over financial reporting. Imation’s internal control system is a processdesigned to provide reasonable assurance regarding the reliability of financial reporting and the preparation of financialstatements for external purposes in accordance with generally accepted accounting principles.
Because of its inherent limitations, internal control over financial reporting may not prevent or detect misstatements. Also,projections of any evaluation of effectiveness to future periods are subject to the risk that controls may become inadequatebecause of changes in conditions, or that the degree of compliance with the policies or procedures may deteriorate.
Imation management assessed the effectiveness of Imation’s internal control over financial reporting as ofDecember 31, 2011. In making this assessment, we used the criteria set forth by the Committee of Sponsoring Organizationsof the Treadway Commission (COSO) in Internal Control — Integrated Framework. Based on our assessment, we concludedthat, as of December 31, 2011, Imation’s internal control over financial reporting was effective, based on those criteria. Ourindependent registered public accounting firm, PricewaterhouseCoopers LLP, has audited the effectiveness of our internalcontrol over financial reporting, as stated in their report which appears herein.
Item 9B. Other Information.
None.
92

PART III
Except where otherwise noted, the information required by Items 10 through 14 is incorporated by reference from ourdefinitive Proxy Statement pursuant to general instruction G(3) to Form 10-K, with the exception of the executive officerssection of Item 10, which is included in Item 1 of this Form 10-K. We will file our definitive Proxy Statement pursuant toRegulation 14A by April 30, 2012.
Item 10. Directors, Executive Officers and Corporate Governance.
Board of Directors
Information regarding our Board of Directors as of February 28, 2012 is set forth below:
David P. Berg, President, International Outback Steak (a chain of Australian themed steakhouse restaurants owned byOSI Restaurant Partners, LLC).
Charles A. Haggerty, Chief Executive Officer, Le Conte Associates, LLC (a consulting and investment company) andformer Chairman, President and Chief Executive Officer, Western Digital Corporation (a hard disk maker).
Ronald T. LeMay, Chief Executive Officer, MachineryLink, Inc. (a farm equipment leasing company), Chairman of AirCellCorporation, now known as Gogo (a designer, manufacturer and marketer of airborne telecommunication systems) andChairman, October Capital and Razorback Capital (private investment companies). Mr. LeMay will be retiring from our Boardon May 2, 2012.
Mark E. Lucas, President and Chief Executive Officer, Imation. See Executive Officers of the Registrant in Item 1.Business herein for further information.
L. White Matthews, III, retired Executive Vice President and Chief Financial Officer, Ecolab Inc. (a developer andmarketer of cleaning and sanitizing products and services), former Chief Financial Officer and Executive Vice President,Union Pacific Corporation (a company involved in rail/truck transportation and oil/gas exploration and production) andNon-Executive Chairman of our Board.
Trudy A. Rautio, Executive Vice President, Chief Financial Officer and Chief Administrative Officer, Carlson Companies,Inc., (a global hospitality and travel company).
Glen A. Taylor, Chairman, Taylor Corporation (a holding company in the specialty printing and marketing areas) andOwner, Minnesota Timberwolves (NBA) and Minnesota Lynx (WNBA).
Daryl J. White, retired President and Chief Financial Officer, Legerity, Inc. (a supplier of data and voice communicationsintegrated circuitry), and former Senior Vice President of Finance and Chief Financial Officer, Compaq Computer Corporation(a computer equipment manufacturer).
See Part I of this Form 10-K, “Executive Officers of the Registrant.” The Sections of the Proxy Statement entitled “Boardof Directors-Director Independence and Determination of Audit Committee Financial Expert,” “Board of Directors-Meetings ofthe Board and Board Committees,” “Information Concerning Solicitation and Voting — Section 16(a) Beneficial OwnershipReporting Compliance” and “Item No. 1-Election of Directors — Information Concerning Directors” are incorporated byreference into this Form 10-K.
We adopted a code of ethics that applies to our principal executive officer, principal financial officer, principal accountingofficer/controller, or persons performing similar functions and all our other employees. This code of ethics is part of ourbroader Business Conduct Policy, posted on our website. The Internet address for our website is http://www.imation.com andthe Business Conduct Policy may be found on the “Corporate Governance” web page, which can be accessed from the“Investor Relations” page, which can be accessed from the main web page. We intend to satisfy the disclosure requirementunder Item 5.05 of Form 8-K regarding an amendment to, or waiver from, a provision of the required code of ethics that
93

applies to our principal executive officer, principal financial officer, principal accounting officer/controller or persons performingsimilar functions by posting such information on our website, at the address and location specified above.
Materials posted on our website are not incorporated by reference into this Form 10-K.
Item 11. Executive Compensation.
The Sections of the Proxy Statement entitled “Compensation Discussion and Analysis,” “Compensation CommitteeReport,” “Compensation of Executive Officers” and “Board of Directors — Compensation of Directors” are incorporated byreference into this Form 10-K.
Item 12. Security Ownership of Certain Beneficial Owners and Management and Related Stockholder Matters.
The Sections of the Proxy Statement entitled “Information Concerning Solicitation and Voting—Security Ownership ofCertain Beneficial Owners” and “Information Concerning Solicitation and Voting—Security Ownership of Management” areincorporated by reference into this Form 10-K.
Equity Compensation Plan Information
The following table gives information about our common stock that may be issued under all of our existing equitycompensation plans as of December 31, 2011, including the 2011 Stock Incentive Plan, 2008 Stock Incentive Plan, the 2005Stock Incentive Plan, the 2000 Stock Incentive Plan and the 1996 Directors Stock Compensation Program. As ofDecember 31, 2011, options and restricted stock had been granted under the 2000 Stock Incentive Plan, 2005 StockIncentive Plan, 2008 Stock Incentive Plan and 2011 Stock Incentive Plan, and options, restricted stock and restricted stockunits had been granted to directors under the 2005 Stock Incentive Plan and 1996 Directors Stock Compensation Program.Our shareholders have approved all of the compensation plans listed below.
Equity Compensation Plans Approved by Shareholders
Number of Securitiesto be Issued Upon
Exercise ofOutstanding Options,Warrants and Rights
Weighted-AverageExercise Price of
Outstanding Options,Warrants and Rights
Number of SecuritiesRemaining Availablefor Future Issuance
Under EquityCompensation
Plans (ExcludingSecurities Reflectedin the First Column)
2011 Stock Incentive Plan . . . . . . . . . . . . . . . . . . . . . . . . . . . 308,741(1) $ 8.49 3,799,0092008 Stock Incentive Plan . . . . . . . . . . . . . . . . . . . . . . . . . . . 2,931,335(1) $10.59 —(2)2005 Stock Incentive Plan . . . . . . . . . . . . . . . . . . . . . . . . . . . 1,560,326(1) $32.20 —(2)2000 Stock Incentive Plan . . . . . . . . . . . . . . . . . . . . . . . . . . . 722,584 $32.41 —(2)1996 Directors Stock Compensation Program . . . . . . . . . . . . 156,593 $35.23 —(2)
Total . . . . . . . . . . . . . . . . . . . . . . . . . . . . . . . . . . . . . . . . . 5,679,579 $19.87 3,799,009
(1) This number does not include restricted stock of 374,435 shares under our 2011 Stock Incentive Plan, 415,061 sharesunder our 2008 Stock Incentive Plan and 5,550 shares under our 2005 Stock Incentive Plan.
(2) No additional awards may be granted under our 2008 Stock Incentive Plan, 2005 Stock Incentive Plan, 2000 StockIncentive Plan or 1996 Directors Stock Compensation Program.
Item 13. Certain Relationships and Related Transactions and Director Independence.
The Sections of the Proxy Statement entitled “Information Concerning Solicitation and Voting — Related PersonTransactions and Related Person Transaction Policy”, and “Board of Directors — Director Independence and Determinationof Audit Committee Financial Expert” are incorporated by reference into this Form 10-K.
Item 14. Principal Accountant Fees and Services.
The Section of the Proxy Statement entitled “Audit and Other Fees and Audit and Finance Committee Pre-ApprovalPolicies” is incorporated by reference into this Form 10-K.
94

PART IV
Item 15. Exhibits and Financial Statement Schedules.
List of Documents Filed as Part of this Report
1. Financial Statements
Page
Report of Independent Registered Public Accounting Firm . . . . . . . . . . . . . . . . . . . . . . . . . . . . . . . . . . . . 41
Consolidated Statements of Operations for the Years Ended December 31, 2011, 2010 and 2009 . . . . . . . 42
Consolidated Balance Sheets as of December 31, 2011 and 2010 . . . . . . . . . . . . . . . . . . . . . . . . . . . . . . 43
Consolidated Statements of Shareholders’ Equity and Comprehensive Income (Loss) for the Years EndedDecember 31, 2011, 2010 and 2009 . . . . . . . . . . . . . . . . . . . . . . . . . . . . . . . . . . . . . . . . . . . . . . . . . . 44
Consolidated Statements of Cash Flows for the Years Ended December 31, 2011, 2010 and 2009 . . . . . . 45
Notes to Consolidated Financial Statements . . . . . . . . . . . . . . . . . . . . . . . . . . . . . . . . . . . . . . . . . . . . . . . 46
2. Financial Statement Schedules
All financial statement schedules are omitted because of the absence of the conditions under which they are required orbecause the required information is included in the Consolidated Financial Statements or the notes thereto.
3. Exhibits
The following Exhibits are filed as part of, or incorporated by reference into, this report:
Number Description of Exhibit
2.1 Asset Purchase Agreement, dated May 7, 2007, among Hopper Radio of Florida, Inc., Memcorp, Inc., MemcorpAsia Limited and Imation Corp. (incorporated by reference to Exhibit 2.1 of Imation’s Form 10-Q for the quarterended March 31, 2007)
2.2 Acquisition Agreement, dated April 19, 2007, by and between Imation Corp. and TDK Corporation (incorporatedby reference to Exhibit 2.1 to Imation’s Form 8-K Current Report filed on April 25, 2007)
2.3 Acquisition Agreement, dated January 19, 2006, by and between Imation Corp. and Memorex International Inc.(incorporated by reference to Exhibit 2.1 to Imation’s Form 8-K Current Report filed on January 25, 2006)
2.4 Inducement Agreement, dated January 19, 2006, among Hanny Holding Limited, Hanny Magnetics (B.V.I.)Limited, Investor Capital Management Asia Limited, Investor Capital Partners — Asia Fund L.P, Global MediaLimited, Memorex Holdings Limited and Imation Corp. (incorporated by reference to Exhibit 2.2 to Imation’sForm 8-K Current Report filed on January 25, 2006)
2.5 Purchase Agreement, dated October 5, 2011, by and between Imation Corp. and FF Realty LLC.
2.6 First Amendment to Purchase Agreement, dated January 5, 2012, by and between Imation Corp. and FF RealtyLLC.
2.7 Second Amendment to Purchase Agreement, dated January 31, 2012, by and between Imation Corp. and FFRealty LLC.
2.8 Third Amendment to Purchase Agreement, dated February 10, 2012, by and between Imation Corp. and FFRealty LLC.
3.1 Restated Certificate of Incorporation of Imation Corp. (incorporated by reference to Exhibit 3.1 to RegistrationStatement on Form 10, No. 1-14310)
95
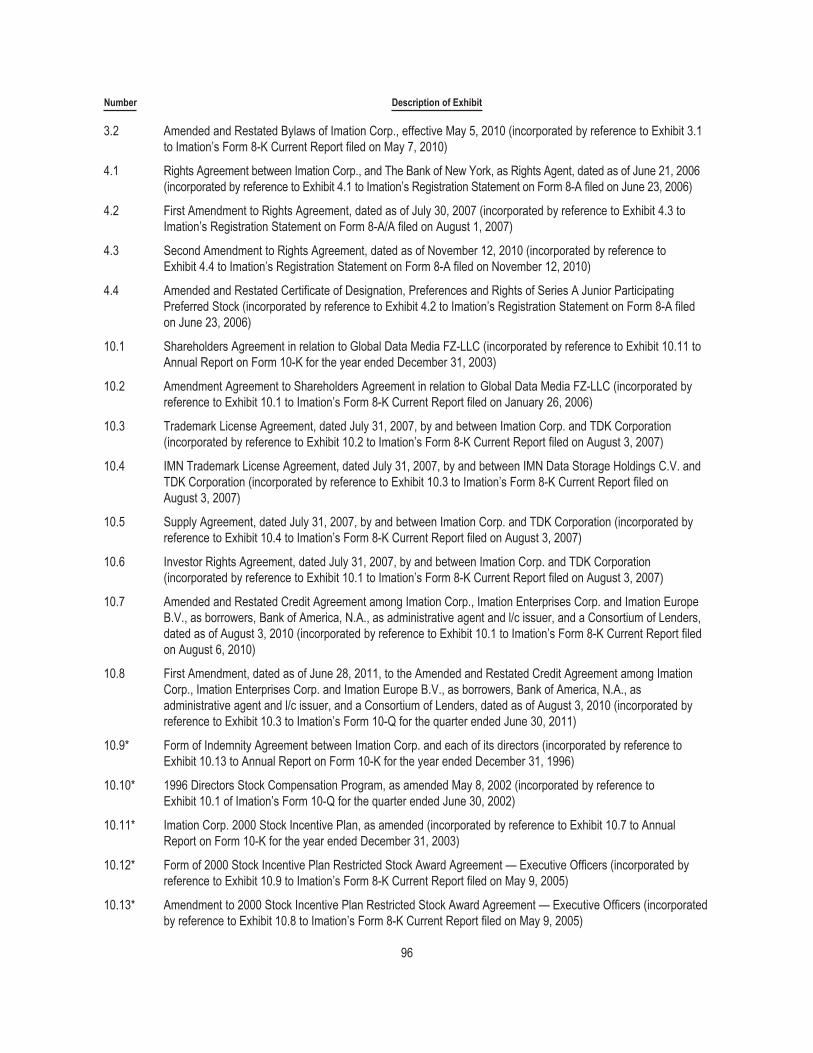
Number Description of Exhibit
3.2 Amended and Restated Bylaws of Imation Corp., effective May 5, 2010 (incorporated by reference to Exhibit 3.1to Imation’s Form 8-K Current Report filed on May 7, 2010)
4.1 Rights Agreement between Imation Corp., and The Bank of New York, as Rights Agent, dated as of June 21, 2006(incorporated by reference to Exhibit 4.1 to Imation’s Registration Statement on Form 8-A filed on June 23, 2006)
4.2 First Amendment to Rights Agreement, dated as of July 30, 2007 (incorporated by reference to Exhibit 4.3 toImation’s Registration Statement on Form 8-A/A filed on August 1, 2007)
4.3 Second Amendment to Rights Agreement, dated as of November 12, 2010 (incorporated by reference toExhibit 4.4 to Imation’s Registration Statement on Form 8-A filed on November 12, 2010)
4.4 Amended and Restated Certificate of Designation, Preferences and Rights of Series A Junior ParticipatingPreferred Stock (incorporated by reference to Exhibit 4.2 to Imation’s Registration Statement on Form 8-A filedon June 23, 2006)
10.1 Shareholders Agreement in relation to Global Data Media FZ-LLC (incorporated by reference to Exhibit 10.11 toAnnual Report on Form 10-K for the year ended December 31, 2003)
10.2 Amendment Agreement to Shareholders Agreement in relation to Global Data Media FZ-LLC (incorporated byreference to Exhibit 10.1 to Imation’s Form 8-K Current Report filed on January 26, 2006)
10.3 Trademark License Agreement, dated July 31, 2007, by and between Imation Corp. and TDK Corporation(incorporated by reference to Exhibit 10.2 to Imation’s Form 8-K Current Report filed on August 3, 2007)
10.4 IMN Trademark License Agreement, dated July 31, 2007, by and between IMN Data Storage Holdings C.V. andTDK Corporation (incorporated by reference to Exhibit 10.3 to Imation’s Form 8-K Current Report filed onAugust 3, 2007)
10.5 Supply Agreement, dated July 31, 2007, by and between Imation Corp. and TDK Corporation (incorporated byreference to Exhibit 10.4 to Imation’s Form 8-K Current Report filed on August 3, 2007)
10.6 Investor Rights Agreement, dated July 31, 2007, by and between Imation Corp. and TDK Corporation(incorporated by reference to Exhibit 10.1 to Imation’s Form 8-K Current Report filed on August 3, 2007)
10.7 Amended and Restated Credit Agreement among Imation Corp., Imation Enterprises Corp. and Imation EuropeB.V., as borrowers, Bank of America, N.A., as administrative agent and l/c issuer, and a Consortium of Lenders,dated as of August 3, 2010 (incorporated by reference to Exhibit 10.1 to Imation’s Form 8-K Current Report filedon August 6, 2010)
10.8 First Amendment, dated as of June 28, 2011, to the Amended and Restated Credit Agreement among ImationCorp., Imation Enterprises Corp. and Imation Europe B.V., as borrowers, Bank of America, N.A., asadministrative agent and l/c issuer, and a Consortium of Lenders, dated as of August 3, 2010 (incorporated byreference to Exhibit 10.3 to Imation’s Form 10-Q for the quarter ended June 30, 2011)
10.9* Form of Indemnity Agreement between Imation Corp. and each of its directors (incorporated by reference toExhibit 10.13 to Annual Report on Form 10-K for the year ended December 31, 1996)
10.10* 1996 Directors Stock Compensation Program, as amended May 8, 2002 (incorporated by reference toExhibit 10.1 of Imation’s Form 10-Q for the quarter ended June 30, 2002)
10.11* Imation Corp. 2000 Stock Incentive Plan, as amended (incorporated by reference to Exhibit 10.7 to AnnualReport on Form 10-K for the year ended December 31, 2003)
10.12* Form of 2000 Stock Incentive Plan Restricted Stock Award Agreement — Executive Officers (incorporated byreference to Exhibit 10.9 to Imation’s Form 8-K Current Report filed on May 9, 2005)
10.13* Amendment to 2000 Stock Incentive Plan Restricted Stock Award Agreement — Executive Officers (incorporatedby reference to Exhibit 10.8 to Imation’s Form 8-K Current Report filed on May 9, 2005)
96

Number Description of Exhibit
10.14* Form of Amendment to 2000 Employee Stock Incentive Plan Restricted Stock Award Agreements — ExecutiveOfficer (incorporated by reference to Exhibit 10.2 to Imation’s Form 8- K Current Report filed on February 13, 2006)
10.15* Form of 2000 Stock Incentive Plan Stock Option Agreement — Executive Officers (incorporated by reference toExhibit 10.11 to Imation’s Form 8-K Current Report filed on May 9, 2005)
10.16* Form of 2000 Stock Incentive Plan Stock Option Agreement — Employees (incorporated by reference toExhibit 10.10 to Imation’s Form 8-K Current Report filed on May 9, 2005)
10.17* Form of 2000 Stock Incentive Plan Restricted Stock Award Agreement — Employees 2004 (incorporated byreference to Exhibit 10.1 of Imation’s Form 10-Q for the quarter ended September 30, 2004)
10.18* Form of 2000 Stock Incentive Plan Restricted Stock Award Agreement — Executive Officers 2004 (incorporatedby reference to Exhibit 10.2 of Imation’s Form 10-Q for the quarter ended September 30, 2004)
10.19* Form of 2000 Stock Incentive Plan Stock Option Agreement — Employees 2004 (incorporated by reference toExhibit 10.3 of Imation’s Form 10-Q for the quarter ended September 30, 2004)
10.20* Form of 2000 Stock Incentive Plan Stock Option Agreement — Executive Officers 2004 (incorporated byreference to Exhibit 10.4 of Imation’s Form 10-Q for the quarter ended September 30, 2004)
10.21* Imation Corp. 2005 Stock Incentive Plan, as amended November 9, 2005 (incorporated by reference toExhibit 10.1 to Imation’s Form 8-K Current Report filed on November 16, 2005)
10.22* Form of 2005 Stock Incentive Plan Stock Option Agreement — Employees (incorporated by reference toExhibit 10.2 to Imation’s Form 8-K Current Report filed on May 9, 2005)
10.23* Form of 2005 Stock Incentive Plan Stock Option Agreement — Executive Officers (incorporated by reference toExhibit 10.3 to Imation’s Form 8-K Current Report filed on May 9, 2005)
10.24* Form of Amendment to 2005 Stock Incentive Plan Option Agreements — Executive Officer (incorporated byreference to Exhibit 10.5 to Imation’s Form 8-K Current Report filed on February 13, 2006)
10.25* Form of 2005 Stock Incentive Plan Stock Option Agreement — Directors (incorporated by reference toExhibit 10.4 to Imation’s Form 8-K Current Report filed on May 9, 2005)
10.26* Form of Amendment to 2005 Stock Incentive Plan Stock Option Agreement — Directors (incorporated byreference to Exhibit 10.2 to Imation’s Form 8-K Current Report filed on November 16, 2005)
10.27* Form of 2005 Stock Incentive Plan Restricted Stock Award Agreement — Employees (incorporated by referenceto Exhibit 10.5 to Imation’s Form 8-K Current Report filed on May 9, 2005)
10.28* Form of 2005 Stock Incentive Plan Restricted Stock Award Agreement — Executive Officers (incorporated byreference to Exhibit 10.6 to Imation’s Form 8-K Current Report filed on May 9, 2005)
10.29* Form of Amendment to 2005 Stock Incentive Plan Restricted Stock Award Agreements — Executive Officer(incorporated by reference to Exhibit 10.6 to Imation’s Form 8-K Current Report filed on February 13, 2006)
10.30* Form of 2005 Stock Incentive Plan Restricted Stock Award Agreement — Directors (incorporated by reference toExhibit 10.7 to Imation’s Form 8-K Current Report filed on May 9, 2005)
10.31* Form of Amendment to 2005 Stock Incentive Plan Restricted Stock Award Agreement — Directors (incorporatedby reference to Exhibit 10.3 to Imation’s Form 8-K Current Report filed on November 16, 2005)
10.32* Form of Amendment to 2004 and 2005 Executive Officer Option Agreements under the 2000 Employee StockIncentive Plan (incorporated by reference to Exhibit 10.1 to Imation’s Form 8-K Current Report filed onFebruary 13, 2006)
10.33* Form of 2005 Stock Incentive Plan Amendment to 2005 Stock Option Agreements — Non-Employee Directors(incorporated by reference to Exhibit 10.7 to Imation’s Form 8-K Current Report filed on February 13, 2006)
97

Number Description of Exhibit
10.34* Form of 2005 Stock Incentive Plan Non-Employee Director Option Agreement (incorporated by reference toExhibit 10.12 to Imation’s Form 8-K Current Report filed on February 13, 2006)
10.35* Form of 2005 Stock Incentive Plan Amendment to 2005 Restricted Stock Award Agreements — Non-EmployeeDirectors (incorporated by reference to Exhibit 10.8 to Imation’s Form 8-K Current Report filed on February 13,2006)
10.36* Form of 2005 Stock Incentive Plan Non-Qualified Stock Option Agreement for Executive Officers (incorporated byreference to Exhibit 10.2 to Imation’s Form 8-K Current Report filed on May 12, 2008)
10.37* Form of 2005 Stock Incentive Plan Non-Employee Director Restricted Stock Award Agreement (incorporated byreference to Exhibit 10.13 to Imation’s Form 8-K Current Report filed on February 13, 2006)
10.38* Form of 2005 Stock Incentive Plan Executive Officer Option Agreement (incorporated by reference toExhibit 10.10 to Imation’s Form 8-K Current Report filed on February 13, 2006)
10.39* Form of 2005 Stock Incentive Plan Executive Officer Restricted Stock Award Agreement (incorporated byreference to Exhibit 10.11 to Imation’s Form 8-K Current Report filed on February 13, 2006)
10.40* Imation Corp. 2008 Stock Incentive Plan (incorporated by reference to Exhibit 10.1 to Imation’s Form 8-K CurrentReport filed on May 12, 2008)
10.41* Form of 2008 Stock Incentive Plan Non-Qualified Stock Option Agreement for Executive Officers (incorporated byreference to Exhibit 10.3 to Imation’s Form 8-K Current Report filed on May 12, 2008)
10.42* Form of 2008 Stock Incentive Plan Non-Qualified Stock Option Agreement for Directors (incorporated byreference to Exhibit 10.4 to Imation’s Form 8-K Current Report filed on May 12, 2008)
10.43* Form of 2008 Stock Incentive Plan Restricted Stock Agreement for Executive Officers (incorporated by referenceto Exhibit 10.5 to Imation’s Form 8-K Current Report filed on May 12, 2008)
10.44* Form of 2008 Stock Incentive Plan Restricted Stock Agreement for Directors (incorporated by reference toExhibit 10.6 to Imation’s Form 8-K Current Report filed on May 12, 2008)
10.45* Form of 2008 Stock Incentive Plan Performance-Based Stock Option Agreement (incorporated by reference toExhibit 10.2 to Imation’s 10-Q for the quarter ended June 30, 2010)
10.46* Form of 2008 Stock Incentive Plan Stock Option Agreement for Executive Officers (3 yr vest) (incorporated byreference to Exhibit 10.6 to Imation’s Form 10-Q for the quarter ended March 31, 2011)
10.47* Form of 2008 Stock Incentive Plan Performance-Based Restricted Stock Award Agreement (incorporated byreference to Exhibit 10.2 to Imation’s 10-Q for the quarter ended June 30, 2010)
10.48* Imation Corp. 2011 Stock Incentive Plan (incorporated by reference to Exhibit 4.7 to Imation’s Form S-8Registration Statement, File No. 333-173903, filed on May 4, 2011)
10.49* Form of 2011 Stock Incentive Plan Stock Option Agreement for Executive Officers (incorporated by reference toExhibit 10.1 to Imation’s Form 10-Q for the quarter ended March 31, 2011)
10.50* Form of 2011 Stock Incentive Plan Performance Award Agreement for Executive Officers (incorporated byreference to Exhibit 10.3 to Imation’s Form 10-Q for the quarter ended March 31, 2011)
10.51* Form of 2011 Stock Incentive Plan Stock Option Agreement for Directors (incorporated by reference toExhibit 10.4 to Imation’s Form 10-Q for the quarter ended March 31, 2011)
10.52* Form of 2011 Stock Incentive Plan Restricted Stock Award Agreement for Directors (incorporated by reference toExhibit 10.5 to Imation’s Form 10-Q for the quarter ended March 31, 2011)
10.53* Imation Excess Benefit Plan (incorporated by reference to Exhibit 10.10 to Registration Statement on Form 10,No. 1-14310)
98

Number Description of Exhibit
10.54* Employment Offer Letter from Imation Corp. to Mark E. Lucas (incorporated by reference to Exhibit 10.1 toImation’s Form 8-K Current Report filed on February 17, 2009)
10.55* Description of 2010 Annual Bonus Plan Target Approval (incorporated by reference to Imation’s Form 8-KCurrent Report filed on November 9, 2009)
10.56* Description of 2011 Annual Bonus Plan Target Approval (incorporated by reference to Imation’s Form 8-KCurrent Report filed on November 10, 2010)
10.57* Description of 2012 Annual Bonus Plan Target Approval (incorporated by reference to Imation’s Form 8-KCurrent Report filed on November 4, 2011)
10.58* Director Compensation Program Effective May 4, 2005 (as amended on May 4, 2011) (incorporated by referenceto Exhibit 10.1 to Imation’s Form 10-Q for the quarter ended June 30, 2011)
10.59* Form of Amended and Restated Severance Agreement with Executive Officers (incorporated by reference toExhibit 10.2 to Imation’s Form 8-K Current Report filed on August 6, 2010)
10.60* Amended and Restated Severance Agreement of John P. Breedlove, effective June 20, 2011 (incorporated byreference to Imation’s Form 10-Q for the quarter ended June 30, 2011)
21.1 Subsidiaries of Imation Corp.
23.1 Consent of Independent Registered Public Accounting Firm
24.1 Power of Attorney
31.1 Certification Pursuant to Section 302 of the Sarbanes-Oxley Act of 2002
31.2 Certification Pursuant to Section 302 of the Sarbanes-Oxley Act of 2002
32.1 Certification Pursuant to Section 906 of the Sarbanes-Oxley Act of 2002
32.2 Certification Pursuant to Section 906 of the Sarbanes-Oxley Act of 2002
101 The following financial information from Imation Corp.’s Annual Report on Form 10-K for the year endedDecember 31, 2011, filed with the SEC on February 28, 2012, formatted in Extensible Business ReportingLanguage (XBRL): (i) the Consolidated Statements of Operations for the years ended December 31, 2011, 2010and 2009, (ii) the Consolidated Balance Sheets as of December 31, 2011 and 2010, (iii) the ConsolidatedStatements of Shareholders’ Equity and Comprehensive Income or the years ended December 31, 2011, 2010and 2009, (iv) the Consolidated Statements of Cash Flows for the years ended December 31, 2011, 2010 and2009, and Notes to Consolidated Financial Statements**
* Items that are management contracts or compensatory plans or arrangements required to be filed as an exhibit pursuantto Item 15(b) of Form 10-K.
** Pursuant to Rule 406T of Regulation S-T, the XBRL related information in Exhibit 101 to this Annual Report on Form10-K shall not be deemed to be “filed” for purposes of Section 18 of the Exchange Act, or otherwise subject to theliability of that section, and shall not be deemed part of a registration statement, prospectus or other document filedunder the Securities Act or the Exchange Act, except as shall be expressly set forth by specific reference in such filings.
99

SIGNATURES
Pursuant to the requirements of Section 13 or 15(d) of the Securities Exchange Act of 1934, the registrant has dulycaused this report to be signed on its behalf by the undersigned, thereunto duly authorized.
IMATION CORP.
By: /s/ MARK E. LUCAS
Mark E. LucasPresident and Chief Executive Officer
Date: February 28, 2012
100

Pursuant to the requirements of the Securities Exchange Act of 1934, this report has been signed below by the followingpersons on behalf of the registrant and in the capacities and on the dates indicated.
Signature Title Date
/s/ MARK E. LUCAS
Mark E. Lucas
President, Chief Executive Officer and Director(Principal Executive Officer)
February 28, 2012
/s/ PAUL R. ZELLER
Paul R. Zeller
Senior Vice President and Chief Financial Officer(Principal Financial Officer)
February 28, 2012
/s/ SCOTT J. ROBINSON
Scott J. Robinson
Vice President, Corporate Controller and ChiefAccounting Officer (Principal Accounting Officer)
February 28, 2012
*
David P. Berg
Director February 28, 2012
*
Charles A. Haggerty
Director February 28, 2012
*
Ronald T. LeMay
Director February 28, 2012
*
L. White Matthews, III
Director February 28, 2012
*
Trudy A. Rautio
Director February 28, 2012
*
Glen A. Taylor
Director February 28, 2012
*
Daryl J. White
Director February 28, 2012
*By: /s/ JOHN P. BREEDLOVE
John P. BreedloveAttorney-in-fact
101

EXHIBIT INDEX
ExhibitNumber Description of Exhibit
2.5 Purchase Agreement, dated October 5, 2011, by and between Imation Corp. and FF Realty LLC.
2.6 First Amendment to Purchase Agreement, dated January 5, 2012, by and between Imation Corp. and FF RealtyLLC.
2.7 Second Amendment to Purchase Agreement, dated January 31, 2012, by and between Imation Corp. and FFRealty LLC.
2.8 Third Amendment to Purchase Agreement, dated February 10, 2012, by and between Imation Corp. and FFRealty LLC.
21.1 Subsidiaries of Imation Corp
23.1 Consent of Independent Registered Public Accounting Firm
24.1 Power of Attorney
31.1 Certification Pursuant to Section 302 of the Sarbanes-Oxley Act of 2002
31.2 Certification Pursuant to Section 302 of the Sarbanes-Oxley Act of 2002
32.1 Certification Pursuant to Section 906 of the Sarbanes-Oxley Act of 2002
32.2 Certification Pursuant to Section 906 of the Sarbanes-Oxley Act of 2002
101 The following financial information from Imation Corp.’s Annual Report on Form 10-K for the year endedDecember 31, 2011, filed with the SEC on February 28, 2012, formatted in Extensible Business ReportingLanguage (XBRL): (i) the Consolidated Statements of Operations for the years ended December 31, 2011, 2010and 2009, (ii) the Consolidated Balance Sheets as of December 31, 2011 and 2010, (iii) the ConsolidatedStatements of Shareholders’ Equity and Comprehensive Income or the years ended December 31, 2011, 2010and 2009, (iv) the Consolidated Statements of Cash Flows for the years ended December 31, 2011, 2010 and2009, and Notes to Consolidated Financial Statements**
102

Exhibit 21.1
Subsidiaries of Imation Corp.
Country or State inWhich Subsidiary was
OrganizedPercentage of
Ownership
Imation Enterprises Corp U.S. 100Imation Electronics Mexico Mexico 100Imation Latin America Corp U.S. 100
Imation Mexico S.A. de C.V. Mexico 100Imation do Brasil Ltda Brazil 100Imation Chile S.A. Chile 100Imation Latin America Marketing S.A. Panama 100
Imation Mercosur Trading S.A. Uruguay 100Imation Funding Corp U.S. 100Imation Government LLC U.S. 100Memorex Products Inc. U.S. 100Imation Online Services Corporation U.S. 100IMN Data Storage LLC U.S. 100
Imation Data Storage Holdings CV Netherlands 100Imation Europe BV Netherlands 100Imation Holding BV Netherlands 100
TME GmbH Germany 100Imation U.K. Limited United Kingdom 100Imation S.r.l. Italy 100Imation Middle East FZE United Arab Emirates 100
Imation Polska Sp. Z.O.O. Poland 100Imation Holdings Pte Ltd. Singapore 100
Imation Asia Pacific Pte Ltd. Singapore 100Imation ANZ Pty Ltd. Australia 100Imation Singapore Pte Ltd. Singapore 100Imation (Malaysia) SDN BHD Malaysia 100Imation India Private Ltd. India 100Imation Corporation Japan Japan 100Imation Korea, Inc. South Korea 100Imation Hong Kong Ltd. Hong Kong 100Imation (Shanghai) Co. Ltd. China 100Imation (Guangzhou) International Co. Ltd. China 100Imation Information Technology (Beijing) Ltd. China 100Imation Taiwan Ltd. Taiwan 100Memorex Products (Taiwan) Inc. Taiwan 100
Imation (Thailand) Ltd. Thailand 100Imation Argentina S.A.C.I.F.I.A. Argentina 100Imation Colombia S.A. Colombia 100Imation Canada Inc. Canada 100Imation Ireland Ltd. Ireland 100Global Data Media FZ-LLC United Arab Emirates 51*
MBI International FZ-LLC United Arab Emirates 51*MBI International Services Private Ltd. India 51*MBI India Marketing Private Ltd. India 51*
Glyphics Media, Inc. U.S. 51*
* Global Data Media FZ-LLC and its subsidiaries are joint ventures.

Exhibit 23.1
Consent of Independent Registered Public Accounting Firm
We hereby consent to the incorporation by reference in the Registration Statements on Form S-8 (Registration Nos. 333-15273, 333-15275, 333-15277, 333-35591, 333-38196, 333-66030, 333-124634, 333-150693 and 333-173903), of ImationCorp. of our report dated February 28, 2012, relating to the financial statements and the effectiveness of internal control overfinancial reporting, which appears in this Form 10-K.
/s/ PricewaterhouseCoopers LLPPricewaterhouseCoopers LLPMinneapolis, MinnesotaFebruary 28, 2012

Exhibit 24.1
POWER OF ATTORNEY
KNOW ALL PERSONS BY THESE PRESENTS, that each person whose signature appears below hereby constitutesand appoints Mark E. Lucas, John P. Breedlove and Paul R. Zeller, and each of them, his or her true and lawful attorneys-in-fact and agents, each acting alone, with full power of substitution and resubstitution, for him or her and in his or her name,place and stead, in any and all capacities, to sign the 2011 Annual Report on Form 10-K of Imation Corp., and any and allamendments thereto, and to file the same, with all exhibits thereto and other documents in connection therewith, with theSecurities and Exchange Commission, granting unto said attorneys-in-fact and agents, each acting alone, full power andauthority to do and perform to all intents and purposes as he or she might or could do in person, hereby ratifying andconfirming all that said attorneys-in-fact and agents, each acting alone, or the substitutes for such attorneys-in-fact andagents, may lawfully do or cause to be done by virtue hereof.
Name Title Date
/S/ SCOTT J. ROBINSONScott J. Robinson
Vice President, Corporate Controller andChief Accounting Officer
(Principal Accounting Officer) February 8, 2012
/s/ DAVID P. BERGDavid P. Berg
Director February 8, 2012
/s/ CHARLES A. HAGGERTYCharles A. Haggerty
Director February 8, 2012
/s/ RONALD T. LEMAYRonald T. LeMay
Director February 8, 2012
/s/ L. WHITE MATTHEWS, IIIL. White Matthews, III
Director February 8, 2012
/s/ TRUDY A. RAUTIOTrudy A. Rautio
Director February 8, 2012
/s/ GLEN A. TAYLORGlen A. Taylor
Director February 8, 2012
/s/ DARYL J. WHITEDaryl J. White
Director February 8, 2012

Exhibit 31.1
Certification Pursuant to Section 302
of the Sarbanes-Oxley Act of 2002
I, Mark E. Lucas, certify that:
1. I have reviewed this annual report on Form 10-K of Imation Corp.;
2. Based on my knowledge, this report does not contain any untrue statement of a material fact or omit to state a material factnecessary to make the statements made, in light of the circumstances under which such statements were made, notmisleading with respect to the period covered by this report;
3. Based on my knowledge, the financial statements, and other financial information included in this report, fairly present in allmaterial respects the financial condition, results of operations and cash flows of the registrant as of, and for, the periodspresented in this report;
4. The registrant’s other certifying officer and I are responsible for establishing and maintaining disclosure controls andprocedures (as defined in Exchange Act Rules 13a-15(e) and 15d-15(e)) and internal control over financial reporting (asdefined in Exchange Act Rules 13a - 15(f) and 15d - 15(f)) for the registrant and have:
(a) Designed such disclosure controls and procedures, or caused such disclosure controls and procedures tobe designed under our supervision, to ensure that material information relating to the registrant, including itsconsolidated subsidiaries, is made known to us by others within those entities, particularly during the period inwhich this report is being prepared;
(b) Designed such internal control over financial reporting, or caused such internal control over financialreporting to be designed under our supervision, to provide reasonable assurance regarding the reliability offinancial reporting and the preparation of financial statements for external purposes in accordance with generallyaccepted accounting principles;
(c) Evaluated the effectiveness of the registrant’s disclosure controls and procedures and presented in thisreport our conclusions about the effectiveness of the disclosure controls and procedures, as of the end of theperiod covered by this report based on such evaluation; and
(d) Disclosed in this report any change in the registrant’s internal control over financial reporting thatoccurred during the registrant’s most recent fiscal quarter (the registrant’s fourth fiscal quarter in the case of anannual report) that has materially affected, or is reasonably likely to materially affect, the registrant’s internalcontrol over financial reporting; and
5. The registrant’s other certifying officer and I have disclosed, based on our most recent evaluation of internal control overfinancial reporting, to the registrant’s auditors and the audit committee of the registrant’s board of directors (or personsperforming the equivalent functions):
(a) All significant deficiencies and material weaknesses in the design or operation of internal control overfinancial reporting which are reasonably likely to adversely affect the registrant’s ability to record, process,summarize and report financial information; and
(b) Any fraud, whether or not material, that involves management or other employees who have a significantrole in the registrant’s internal control over financial reporting.
February 28, 2012
By: /s/ MARK E. LUCAS
Mark E. Lucas,President and Chief Executive Officer

Exhibit 31.2
Certification Pursuant to Section 302
of the Sarbanes-Oxley Act of 2002
I, Paul R. Zeller, certify that:
1. I have reviewed this annual report on Form 10-K of Imation Corp.;
2. Based on my knowledge, this report does not contain any untrue statement of a material fact or omit to state a material factnecessary to make the statements made, in light of the circumstances under which such statements were made, notmisleading with respect to the period covered by this report;
3. Based on my knowledge, the financial statements, and other financial information included in this report, fairly present in allmaterial respects the financial condition, results of operations and cash flows of the registrant as of, and for, the periodspresented in this report;
4. The registrant’s other certifying officer and I are responsible for establishing and maintaining disclosure controls andprocedures (as defined in Exchange Act Rules 13a-15(e) and 15d-15(e)) and internal control over financial reporting (asdefined in Exchange Act Rules 13a - 15(f) and 15d - 15(f)) for the registrant and have:
(a) Designed such disclosure controls and procedures, or caused such disclosure controls and procedures tobe designed under our supervision, to ensure that material information relating to the registrant, including itsconsolidated subsidiaries, is made known to us by others within those entities, particularly during the period inwhich this report is being prepared;
(b) Designed such internal control over financial reporting, or caused such internal control over financialreporting to be designed under our supervision, to provide reasonable assurance regarding the reliability offinancial reporting and the preparation of financial statements for external purposes in accordance with generallyaccepted accounting principles;
(c) Evaluated the effectiveness of the registrant’s disclosure controls and procedures and presented in thisreport our conclusions about the effectiveness of the disclosure controls and procedures, as of the end of theperiod covered by this report based on such evaluation; and
(d) Disclosed in this report any change in the registrant’s internal control over financial reporting thatoccurred during the registrant’s most recent fiscal quarter (the registrant’s fourth fiscal quarter in the case of anannual report) that has materially affected, or is reasonably likely to materially affect, the registrant’s internalcontrol over financial reporting; and
5. The registrant’s other certifying officer and I have disclosed, based on our most recent evaluation of internal control overfinancial reporting, to the registrant’s auditors and the audit committee of the registrant’s board of directors (or personsperforming the equivalent functions):
(a) All significant deficiencies and material weaknesses in the design or operation of internal control overfinancial reporting which are reasonably likely to adversely affect the registrant’s ability to record, process,summarize and report financial information; and
(b) Any fraud, whether or not material, that involves management or other employees who have a significantrole in the registrant’s internal control over financial reporting.
February 28, 2012
By: /s/ PAUL R. ZELLER
Paul R. Zeller,Senior Vice President and Chief Financial Officer

Exhibit 32.1
Certification Pursuant to
Section 906 of the Sarbanes-Oxley Act of 2002
In connection with the Annual Report of Imation Corp. (the “Company”) on Form 10-K for the period endedDecember 31, 2011, as filed with the Securities and Exchange Commission (the “Report”), I, Mark E. Lucas, President andChief Executive Officer of the Company, certify, pursuant to 18 U.S.C. Section 1350, as adopted pursuant to section 906 ofthe Sarbanes-Oxley Act of 2002, that:
(1) The Report fully complies with the requirements of section 13(a) or 15(d) of the Securities Exchange Act of1934; and
(2) The information contained in the Report fairly presents, in all material respects, the financial condition and results ofoperations of the Company.
February 28, 2012
/s/ MARK E. LUCAS
Mark E. Lucas,
President and Chief Executive Officer

Exhibit 32.2
Certification Pursuant to
Section 906 of the Sarbanes-Oxley Act of 2002
In connection with the Annual Report of Imation Corp. (the “Company”) on Form 10-K for the period endedDecember 31, 2011, as filed with the Securities and Exchange Commission (the “Report”), I, Paul R. Zeller, Senior VicePresident and Chief Financial Officer of the Company, certify, pursuant to 18 U.S.C. Section 1350, as adopted pursuant tosection 906 of the Sarbanes-Oxley Act of 2002, that:
(1) The Report fully complies with the requirements of section 13(a) or 15(d) of the Securities Exchange Act of1934; and
(2) The information contained in the Report fairly presents, in all material respects, the financial condition and results ofoperations of the Company.
February 28, 2012
/s/ PAUL R. ZELLER
Paul R. Zeller
Senior Vice President and Chief Financial Officer

THE IMATION SECURE PROMISE
Imation ensures the safety, privacy, and control of your digital content.
The world continues to create digital content at an amazing pace. In 2011 alone, more than 1.8 zettabytes — well over a trillion gigabytes — of new data was created.1 And whether this new data is business data or personal digital content, it must be stored. That’s why Imation provides a wide range of data storage solutions for both business and personal use.
But it’s not enough to simply store this data. From highly sensitive government information to a business’ customer records or a consumer’s personal data, this growing digital content must also be protected from loss or theft.
By adding encryption, authentication and central management features to its storage offerings, Imation is helping ensure the safety, privacy, and control of digital content. With Imation Secure technology, a consumer knows that his private information and identity are safeguarded. A small business owner can trust that her business content is protected, can be safely restored, and is accessible only to authorized users. And with Imation Secure, large enterprises and governments are confident that they will have control over devices and user actions that could create risks of data breach.
1 The 2011 Digital Universe Study: Extracting Value from Chaos, IDC, June 2011
Imation is a global scalable storage and data security company. The company’s portfolio includes tiered storage and security offerings for business and products designed to manage audio and video information in the home.
With a 60-year legacy of technology leadership, Imation maintains the number one global market share in recordable optical media and magnetic tape cartridges. Imation’s 2011 revenues were $1.29 billion, with approximately 60 percent of sales coming from outside the United States.
Imation reaches customers in more than 100 countries through a powerful global distribution network and well recognized brands, including Imation, Memorex, TDK Life on Record, and XtremeMac.
IMATION AT-A-GLANCE
ENCRYPTIONUNIFIED SECURITY
POLICY MANAGEMENT
IDENTITY AND ACCESS MANAGEMENT KEY MANAGEMENT
IMATION SECURE

SHAREHOLDER INFORMATIONThis Annual Report to Shareholders has been prepared to accompany the Report on Form
10-K, filed with the Securities and Exchange Commission on February 28, 2012. Further
information is available at [email protected] or through Imation’s shareholder
telephone line at 888-IMN-NYSE during the business hours of 7:00 a.m. to 5:30 p.m. (CST).
Annual Shareholders Meeting Wednesday, May 2, 2012, 9:00 a.m. (local time)
Sheraton St. Paul Woodbury Hotel | 676 Bielenberg Drive
Woodbury, MN 55125
Independent Registered Public Accounting Firm
PricewaterhouseCoopers LLP | 225 South Sixth Street, Suite 1400
Minneapolis, MN 55402
Transfer Agent Wells Fargo Bank, N.A. | PO Box 64874
St. Paul, MN 55164-0874
U.S. Telephone Number 800-468-9716
Outside U.S. 651-450-4064
Fax Number 651-450-4085
www.shareowneronline.com
Address for certificate changes:
Wells Fargo Bank, N.A. | 161 North Concord Exchange
South St. Paul, MN 55075
If you would like to receive our annual report and proxy materials electronically in the
future, go to our website imationcorp.com:
-- click-on-Investor-Relations-- click-on-Financial-and-Investor-Information-- click-on-Shareholder-Information,-and-- follow-the-prompts-to-submit-your-electronic-consent
SOUTH ASIA REGION
HEADQUARTERSSingapore
GLOBAL AND AMERICAS
HEADQUARTERSOakdale, MN, USA
EUROPE REGION
HEADQUARTERSAmsterdam,
The NetherlandsNORTH ASIA
REGION HEADQUARTERS
Tokyo, Japan
L. White Matthews, III
Non-Executive Chairman of the Board Retired Executive Vice President and Chief Financial Officer Ecolab Inc.
Former Executive Vice President and Chief Financial Officer Union Pacific Corporation
David P. Berg
President - International Outback Steak
Charles A. Haggerty
Chief Executive Officer Le Conte Associates, LLC
Former Chairman, President and Chief Executive Officer Western Digital Corporation
Ronald T. LeMay
Chairman Gogo
President and Managing Director OpenAir Equity Partners
Mark E. Lucas
President and Chief Executive Officer Imation Corp.
Trudy A. Rautio
Executive Vice President, Chief Financial Officer and Chief Administrative Officer Carlson
David B. Stevens
Chief Technology Officer and Vice President, Corporate Development Brocade Communications Systems, Inc.
Glen A. Taylor
Chairman Taylor Corporation
Owner Minnesota Timberwolves (NBA) / Lynx (WNBA)
Daryl J. White
Retired President and Chief Financial Officer Legerity, Inc.
Former Senior Vice President of Finance and Chief Financial Officer Compaq Computer Corporation
BOARD OF DIRECTORS
Imation Corp.
1 Imation Way | Oakdale, MN 55128-3414
651.704.4000 Phone 888.466.3456 Toll Free
imation.com
© Imation Corp. Imation, the Imation logo, InfiniVault, Memorex, the Memorex logo, XtremeMac, and the XtremeMac logo are trademarks of Imation Corp. and its subsidiaries. The TDK Life on Record logo is a trademark of TDK Corporation. IronKey is a registered trademark of IronKey, Inc. and used under limited license. All other trademarks are property of their respective owners.
The cover is printed on Pacesetter A2 gloss coated.
The paper holds the following certifications: