Embed Size (px)
Citation preview

Deutsche Bank
Executing on our strategic transformation
August 2021
Deutsche BankInvestor Relations
1 Who we are today
How we aim to improve returns for our shareholders2
Agenda
2
Appendix3
Deutsche BankInvestor Relations
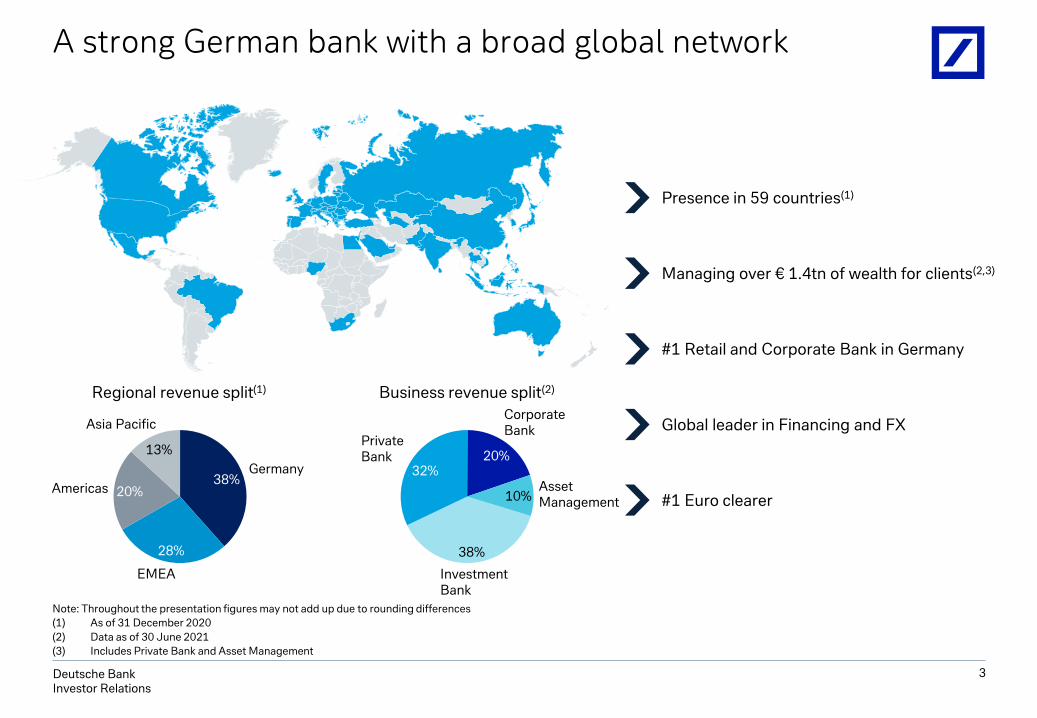
38%
28%
20%
13%
Germany
EMEA
Asia Pacific
Americas
38%
32%20%
10%
InvestmentBank
PrivateBank
CorporateBank
AssetManagement
Regional revenue split(1) Business revenue split(2)
A strong German bank with a broad global network
3
Note: Throughout the presentation figures may not add up due to rounding differences
(1) As of 31 December 2020
(2) Data as of 30 June 2021
(3) Includes Private Bank and Asset Management
Presence in 59 countries(1)
Managing over € 1.4tn of wealth for clients(2,3)
#1 Retail and Corporate Bank in Germany
Global leader in Financing and FX
#1 Euro clearer

Deutsche BankInvestor Relations
We have made material progress
Competitiveness and
stability of Core Bank
Disciplined
cost reductionGrow profitability
Return capital to
shareholders
€ 5.9bnLast 12 month adjusted profit
before tax for Core Bank -2022 targets and ambitions
well within reach
€ 5.0bnCommitted to distribute to
shareholders from 2022
73.2% CIRH1 2021 Core Bank cost
discipline drives cost-income-ratio towards 70% target
for 2022
9.3% RoTEH1 2021 Core Bank results
fully support our path to delivering 8% RoTE target
for 2022
Phase 3Sustainable profitability
Phase 1Stabilisation
Phase 2Transformation
✓ ✓
1 2 3 4
4
(1) Adjusted costs excluding transformation charges related to the strategic announcement on 7 Jul 2019

Deutsche BankInvestor Relations
A safer and more secure organization€ bn, at period end
5
(1) Fully loaded; 2007 ratio includes hybrid instruments as definition of CET1 ratio did not exist under the previous Basel regime
(2) Maximum Distributable Amount of 10.4%
(3) Liquidity reserves comprise of total stock of high-quality liquid assets (HQLA), including assets subject to transfer restrictions and other central bank eligible securities
(4) Most stable funding as a proportion of the total external funding profile. Most stable funding is defined as funds from Capital Markets & Equity, Private Bank and Corporate Bank
H1 20212007
13.7%~325bps above regulatory
requirements(2)
Common Equity Tier 1 capital ratio
8.6%(1)
254(3) Improved quality and cost of funding base
Liquidity reserves 65
992 Refocused on core businesses2,020Total assets
2020 comments
81%High quality
funding profile30%Most Stable Funding(4)

Deutsche BankInvestor Relations
Well positioned for key structural trends
6
1
Asset Management
Global Asset Manager with a diversified
product range
Strategic priorities:
− Expand partnerships
− ESG, Alternatives and Passive
Private Bank
Leading German retail bank with a
focused international advisory bank
and global wealth manager
Investment Bank
A leading global fixed income and
financing business; focused global O&A
franchise
Strategic priorities:
− Client reengagement
− Targeted transformation in FIC
Corporate Bank
Global “Hausbank” in Germany for 150
years with a leading network across
151 countries
Strategic priorities:
− Focus on Asia Pacific
− Targeted growth investments,
incl. payments
Strategic priorities:
− Loan volume and investment product growth
− Repricing

Deutsche BankInvestor Relations
Franchise strength drives revenue generationCore Bank revenues(1) excluding specific items, in € bn
7
1
(1) Corporate & Other revenues (Q2 2020: € (173)m, Q2 2021: € (7)m, H1 2019: € 187m, H1 2020: € (130)m, H1 2021: € (80)m) are not shown on this charts but are included in Core Bank totals
(2) 2019 figures based on reporting structure as disclosed in Annual Report 2020
Enhanced client focus
Focus on market leading businesses
Exit loss making businesses
Group
2.6
H1 2020
5.03.8
4.1
2.7
1.1
H1 2019(2)
4.1
1.1
12.7
2.5
5.5
4.1
1.3
H1 2021
Corporate Bank
Investment Bank
Private Bank
Asset Management
11.8
13.4
12.4 12.5 13.5
13%
On track to achieve revenue ambition for 2022

Deutsche BankInvestor Relations
Disciplined cost reduction€ bn
8
2
Adjusted costs ex. transformation charges(1)
(1) Adjusted costs excluding transformation charges and expenses eligible for reimbursement related to Prime Finance
22.8
21.5
19.4
9.8
2018 2019 2020 1H 2021
(3.4)
~80% of 2021 reductions already in run-rate
Preserve investments in controls and technology
Cost discipline drives cost-income-ratio towards 70% target for 2022
Deutsche BankInvestor Relations
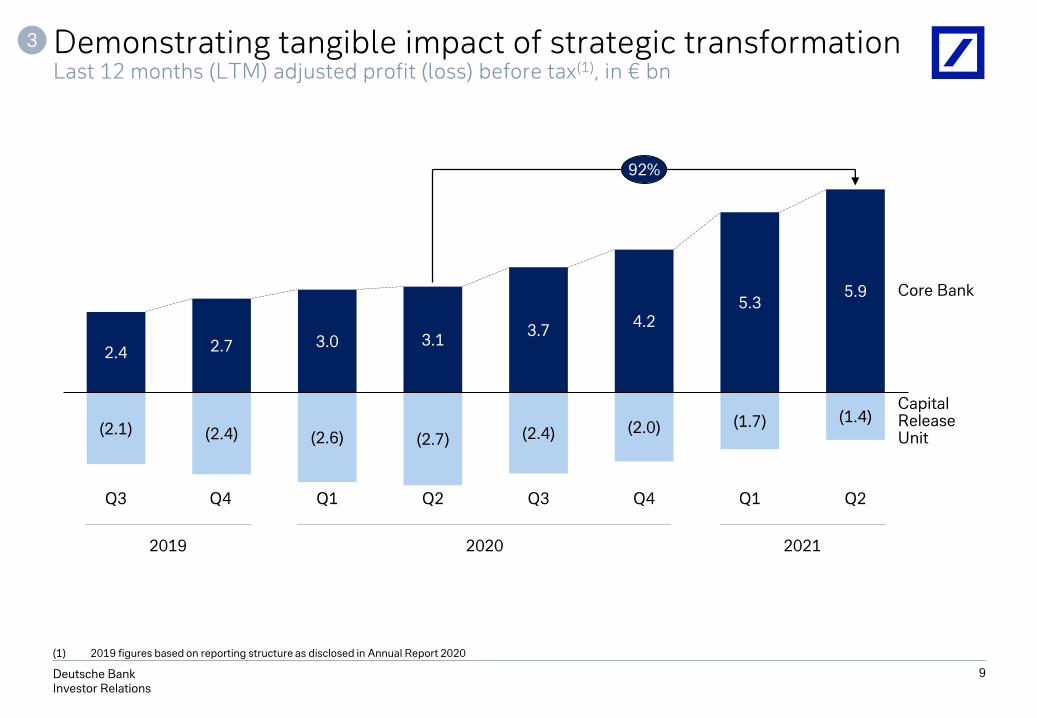
Demonstrating tangible impact of strategic transformationLast 12 months (LTM) adjusted profit (loss) before tax(1), in € bn
(1) 2019 figures based on reporting structure as disclosed in Annual Report 2020
9
3.0
Q1
3.1
(2.7)
Q2
(2.4)
3.7
Q3
2.4
4.2
Q4
(2.1) (1.7)
5.3
Q1
5.9
Q2
CapitalRelease Unit
Core Bank
Q3
2.7
(2.4)(1.4)
Q4
(2.6)(2.0)
92%
2019 2020 2021
3

Deutsche BankInvestor Relations
Committed to returning capital to shareholders
13.6% 13.6% 13.6%13.2%
20202018 Q2 20212019 2022target
>12.5% Minimum regulatory
requirement
10.4%
10
4
Common Equity Tier 1 (CET1) capital ratio
Committed to maintaining a CET1 ratio above 12.5% through transformation period
CET1 ratio gives sufficient headroom to support clients and absorb regulatory inflation
Remain committed to € 5bn of capital for distribution to shareholders from 2022

Deutsche BankInvestor Relations
Financial targets
11
Cost income ratio
CET1 ratio
Leverage ratio
70%
>12.5%
~4.5%
Group return on tangible equity
Core Bank return on tangible equity
8%
2022 targets
>9%

Deutsche BankInvestor Relations
1 Who we are today
How we aim to improve returns for our shareholders2
Agenda
12
Appendix3

Deutsche BankInvestor Relations
Underlying shareholder returns support 2022 targetsH1 2021 profit (loss) before tax, in € bn, unless stated otherwise
13
Reported Adjusted(1)
3.4
3.8
Reported
2.8
Adjusted(1) X
3.1
3.7
Adjustments:
▪ Transformation charges
▪ Restructuring and severance
▪ Revenue specific items
Unforeseen factors:
▪ BGH ruling
▪ Unplanned SRF charge increase(3)
▪ Additional deposit protection scheme cost
6.5% 7.6% 9.2%
Note: This page refers to the profit before tax and respective post-tax RoTE, which are shown on reported, adjusted, and adjusted ex unforeseen factors basis(1) Adjustments for both Group and Core Bank include the following for H1 2021: transformation charges, restructuring and severance, and revenue specific items(2) Unforeseen factors include the following for H1 2021: impact from the German Federal Court of Justice ruling in April 2021 relating to customer consent for pricing changes on current
accounts (herein after referred as “BGH ruling”), unplanned Single Resolution Fund (SRF) charge increase and additional deposit protection scheme cost(3) Unplanned SRF charge increase is defined as difference of SRF charge for H1 2021 versus the amount that was initially planned for that period as indicated in December 2020
9.3% 10.5%
Group Core Bank
Post-taxRoTE
Adjusted ex unforeseen factors(1)(2)

Deutsche BankInvestor Relations
2016 2017 2018 2019 2020 H1 2021
1.4
0.5 0.5 0.7
1.8
0.1
2016 2017 2018 2019 2020 H1 2021
32 13 13 17 41
Provisions for credit losses
3.1
0.70.3 0.4 0.4
4.3 3.8 4.0 3.6
2.2 2.3
2016 2017 2018 2019 2020 H1 2021
Market risk trading economic capital(2)
Disciplined risk managementIn € bn, unless stated otherwise
In bps of average loans(1)
7
0.3
(1) Loans gross of allowance at amortized cost
(2) Sum of traded market risk economic capital and traded default risk economic capital. Scope includes fair value banking book
(3) High-quality liquid assets
(4) For risk management purposes, operational risk includes legal risk arising from loss events for operational shortcomings but excludes business and reputational risk
14
Non-legal operational lossesLegal losses
Credit risk Market risk
Non-financial risk(4)
H1 2021
Liquidity risk
(3)
201
260229
189213 224
0
50
100
150
200
250
300
2016 2017 2018 2019 2020
120%
130%
140%
150%
HQLAs Liquidity coverage ratio, in %

Deutsche BankInvestor Relations
Share price at a discount to tangible book value per sharePrice to tangible book multiples as of 31 July 2021
15
(1) SX7P (Stoxx 600 Banks Index), BKX (KBW Bank Index); Source: Bloomberg
(2) Deutsche Bank share price € 10.52; Tangible book value per share € 23.71
Stock trades well below Tangible book value per share at ~44% vs ~74% for European banks (SX7P)(1) and ~69% premium for US banks (BKX)(1)
We are on a good path to our targeted 8% return on tangible equity in 2022
Well positioned for returns of capital to shareholders starting from 2022 given comfortable headroom above capital requirement
1.69x
0.44x
Deutsche Bank(2) Stoxx 600 Banks Index
KBW Bank Index
0.74x
Capital market perception improving

Deutsche BankInvestor Relations
Outlook
16
Continuing to work towards returning capital to shareholders starting from 2022
Sustainable revenue generation continues even in normalized environment
Improved credit environment leads to reduced CLP guidance of ~20bps for 2021
Cost discipline drives CIR towards 70% target despite uncontrollable items
Improved profitability supports the path to 8% RoTE target

Deutsche BankInvestor Relations
1 Who we are today
Agenda
17
How we aim to improve returns for our shareholders2
Appendix3
Deutsche BankInvestor Relations
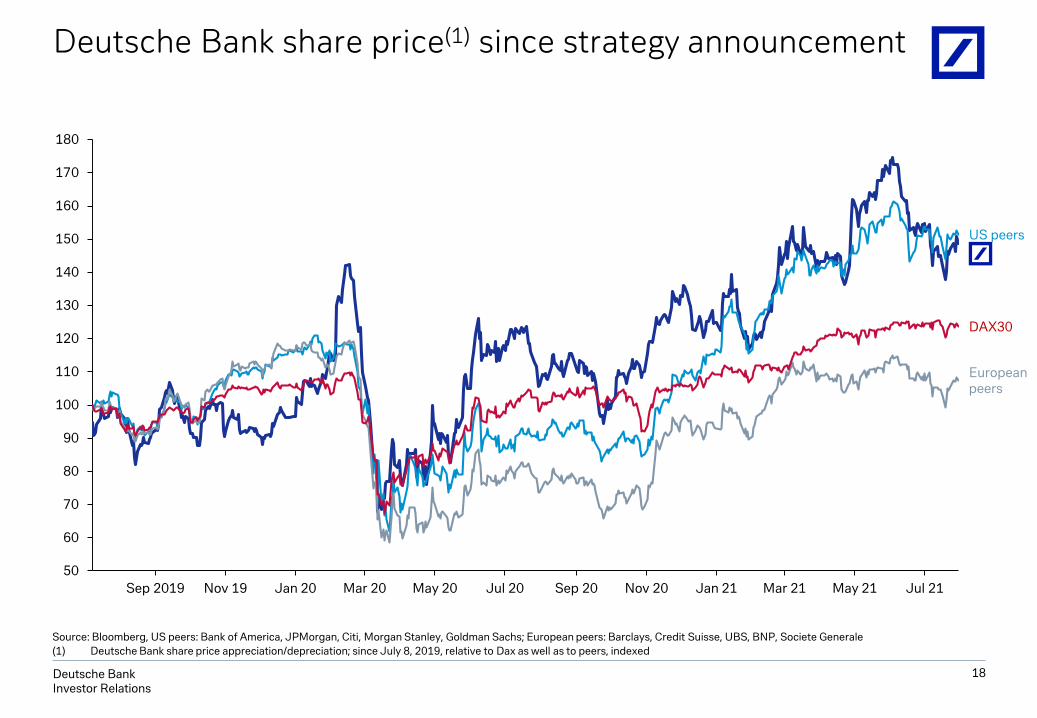
Deutsche Bank share price(1) since strategy announcement
18
50
60
70
80
90
100
110
120
130
140
150
160
170
180
Jul 21Nov 19 Jan 20 Jul 20 Jan 21Sep 2019 Mar 20 May 20 May 21Sep 20 Nov 20 Mar 21
US peers
Europeanpeers
DAX30
Source: Bloomberg, US peers: Bank of America, JPMorgan, Citi, Morgan Stanley, Goldman Sachs; European peers: Barclays, Credit Suisse, UBS, BNP, Societe Generale
(1) Deutsche Bank share price appreciation/depreciation; since July 8, 2019, relative to Dax as well as to peers, indexed

Deutsche BankInvestor Relations
Strong credit quality versus peersQ2 2021
19
Unsecured Consumer Lending(2) - % of total loans
Lo
an
Lo
ss R
ese
rve
s -
% o
f to
tal l
oa
ns
52%
21%
17%
8%
Germany
Europeex Germany
LatinAmerica
NorthAmerica
AsiaPacific
1%1%
Others
Strong correlation with share of consumer credit despite strong provisioning by US peers
Geographical composition of loan book(1)
(1) Loans at amortized cost. Data as of 31 December 2020
(2) Unsecured retail loans defined as retail loans excluding mortgages and excluding loans collateralized by securities
0.0%
1.0%
2.0%
3.0%
4.0%
0% 5% 10% 15% 20% 25% 30%
Deutsche BankInvestor Relations
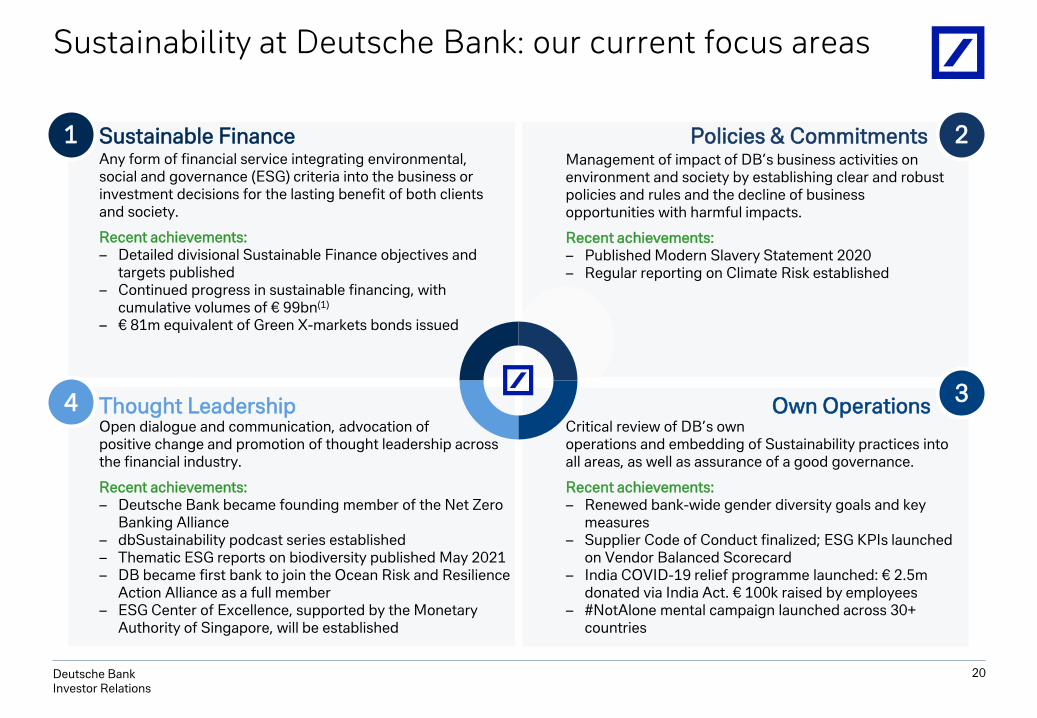
Sustainability at Deutsche Bank: our current focus areas
Any form of financial service integrating environmental, social and governance (ESG) criteria into the business or investment decisions for the lasting benefit of both clients and society.
Recent achievements: – Detailed divisional Sustainable Finance objectives and
targets published– Continued progress in sustainable financing, with
cumulative volumes of € 99bn(1)
– € 81m equivalent of Green X-markets bonds issued
1
4
2
3
Management of impact of DB’s business activities on environment and society by establishing clear and robust policies and rules and the decline of business opportunities with harmful impacts.
Recent achievements: – Published Modern Slavery Statement 2020 – Regular reporting on Climate Risk established
Open dialogue and communication, advocation of positive change and promotion of thought leadership across the financial industry.
Recent achievements: – Deutsche Bank became founding member of the Net Zero
Banking Alliance– dbSustainability podcast series established– Thematic ESG reports on biodiversity published May 2021– DB became first bank to join the Ocean Risk and Resilience
Action Alliance as a full member– ESG Center of Excellence, supported by the Monetary
Authority of Singapore, will be established
Critical review of DB’s own operations and embedding of Sustainability practices into all areas, as well as assurance of a good governance.
Recent achievements: – Renewed bank-wide gender diversity goals and key
measures – Supplier Code of Conduct finalized; ESG KPIs launched
on Vendor Balanced Scorecard– India COVID-19 relief programme launched: € 2.5m
donated via India Act. € 100k raised by employees– #NotAlone mental campaign launched across 30+
countries
Sustainable Finance
Thought Leadership Own Operations
Policies & Commitments
20

Deutsche BankInvestor Relations
UN sustainable development goals
Paris Pledge for Action• Business and Human Rights
• Responsible Banking
• Sustainable Development Goals
• International Bill of Rights
EU Transparency Register
Core Labor Standards of the International Labor Organization
Equator Principles
Global Reporting Initiatives
We support major international standards and guidelines
21

Deutsche BankInvestor Relations
Q2 2021 Q2 2020 Q1 2021
CB IB PB AM C&OCore Bank
CRU Group CB IB PB AM C&OCore Bank
CRU Group CB IB PB AM C&OCore Bank
CRU Group
Revenues 1,230 2,394 2,018 626 (7) 6,262 (24) 6,238 1,341 2,676 1,960 549 (173) 6,353 (66) 6,287 1,313 3,097 2,178 637 (74) 7,152 81 7,233
DVA - IB Other / CRU - (9) - - - (9) (1) (11) - (27) - - - (27) (23) (49) - (15) - - - (15) 2 (13)
Change in valuation of an investment - FIC S&T
- - - - - - - - - 42 - - - 42 - 42 - - - - - - - -
Sal. Oppenheim workout – IPB
- - 35 - - 35 - 35 - - 25 - - 25 - 25 - - 24 - - 24 - 24
Revenues ex specific items
1,230 2,403 1,984 626 (7) 6,236 (23) 6,214 1,341 2,661 1,934 549 (173) 6,312 (44) 6,269 1,313 3,112 2,153 637 (74) 7,142 79 7,222
Q2 2021 Q2 2020 Q1 2021
CB IB PB AM C&OCore Bank
CRU Group CB IB PB AM C&OCore Bank
CRU Group CB IB PB AM C&OCore Bank
CRU Group
Noninterest expenses 1,004 1,346 1,913 395 81 4,739 259 4,998 1,120 1,327 1,992 400 34 4,872 496 5,367 1,104 1,605 1,805 405 156 5,076 498 5,574
Impairment of goodwill and other intangible assets
- - - - - - - - - - - - - - - - - - - - - - - -
Litigation charges, net 2 5 128 1 11 146 2 148 81 2 75 (0) (1) 156 9 165 (0) 12 1 - 0 14 64 78
Restructuring and severance
18 24 76 1 (2) 116 8 123 10 16 136 18 2 182 3 185 25 7 11 6 8 57 0 58
Adjusted costs 984 1,318 1,710 394 72 4,478 249 4,727 1,029 1,309 1,781 382 33 4,534 484 5,018 1,080 1,586 1,792 400 147 5,005 434 5,439
Transformation charges 11 12 57 0 6 86 13 99 4 28 51 0 (42) 41 54 95 11 13 36 1 43 104 12 116
Adjusted costs extransformation charges
973 1,306 1,652 393 66 4,391 236 4,628 1,025 1,281 1,730 382 75 4,493 430 4,923 1,068 1,573 1,756 399 104 4,900 422 5,322
Specific revenue items and adjusted costs – Q2 2021In € m
22

Deutsche BankInvestor Relations
H1 2021 H1 2020
CB IB PB AM C&OCore Bank
CRU Group CB IB PB AM C&OCore Bank
CRU Group
Revenues 2,544 5,491 4,196 1,263 (80) 13,413 57 13,471 2,666 5,030 4,127 1,068 (130) 12,761 (123) 12,637
DVA - IB Other / CRU - (24) - - - (24) 0 (24) - 20 - - - 20 1 21
Change in valuation of an investment - FIC S&T
- - - - - - - - - 32 - - - 32 - 32
Sal. Oppenheim workout – IPB - - 59 - - 59 - 59 - - 42 - - 42 - 42
Revenues ex specific items 2,544 5,516 4,137 1,263 (80) 13,379 57 13,435 2,666 4,979 4,085 1,068 (130) 12,668 (124) 12,543
H1 2021 H1 2020
CB IB PB AM C&OCore Bank
CRU Group CB IB PB AM C&OCore Bank
CRU Group
Noninterest expenses 2,109 2,951 3,718 800 237 9,815 757 10,572 2,217 2,802 3,877 774 145 9,815 1,190 11,006
Impairment of goodwill and other intangible assets
- - - - - - - - - - - 0 - 0 - 0
Litigation charges, net 2 17 129 1 11 160 66 226 81 3 77 (0) 10 170 9 179
Restructuring and severance 43 31 87 6 6 173 8 181 21 14 202 25 4 266 7 273
Adjusted costs 2,064 2,904 3,502 793 220 9,482 683 10,165 2,116 2,785 3,598 749 131 9,379 1,174 10,554
Transformation charges 22 25 93 1 49 191 25 215 30 42 65 1 (41) 96 83 179
Adjusted costs ex transformation charges
2,042 2,878 3,409 792 170 9,292 658 9,950 2,086 2,743 3,533 748 173 9,284 1,091 10,375
Specific revenue items and adjusted costs – H1 2021In € m
23

Deutsche BankInvestor Relations
Adjusted profit (loss) before tax (PBT)In € m
24
Q2 2021 Q2 2020
Reported PBTSpecific
revenue items
Transfor-mation
charges
Goodwill impairments
Restructuring & severance
Adjusted PBT Reported PBTSpecific
revenue items
Transfor-mation
charges
Goodwill impairments
Restructuring & severance
Adjusted PBT
CB 246 - 11 - 18 274 78 - 4 - 10 92
IB 1,047 9 12 - 24 1,092 979 (16) 28 - 16 1,007
PB (11) (35) 57 - 76 87 (257) (25) 51 - 136 (95)
AM 180 - 0 - 1 181 114 - 0 - 18 132
C&O (39) - 6 - (2) (35) (165) - (42) - 2 (205)
Core Bank 1,423 (25) 86 - 116 1,600 749 (41) 41 - 182 931
CRU (258) 1 13 - 8 (236) (591) 23 54 - 3 (511)
Group 1,165 (24) 99 - 123 1,364 158 (18) 95 - 185 419
Q1 2021
Reported PBTSpecific
revenue items
Transfor-mation
charges
Goodwill impairments
Restructuring & severance
Adjusted PBT
CB 229 - 11 - 25 266
IB 1,490 15 13 - 7 1,526
PB 274 (24) 36 - 11 297
AM 183 - 1 - 6 190
C&O (178) - 43 - 8 (127)
Core Bank 1,999 (9) 104 - 57 2,151
CRU (410) (2) 12 - 0 (400)
Group 1,589 (11) 116 - 58 1,752

Deutsche BankInvestor Relations
Last 12 months (LTM) reconciliationIn € m
25
(1) 2019 figures based on reporting structure as disclosed in Annual Report 2020
(2) Q2 2020 LTM figures refer to the sum of Q3 2019, Q4 2019, Q1 2020 and Q2 2020
(3) Q2 2021 LTM figures refer to the sum of Q3 2020, Q4 2020, Q1 2021 and Q2 2021
Q3 2019(1) Q4 2019(1) Q1 2020 Q2 2020 Q3 2020 Q4 2020 Q1 2021 Q2 2021Q2 2020
LTM(2)Q2 2021
LTM(3)
Revenues
Core Bank 5,483 5,528 6,407 6,353 5,974 5,518 7,152 6,262 23,772 24,906
CRU (220) (180) (57) (66) (36) (65) 81 (24) (523) (44)
Group 5,262 5,349 6,350 6,287 5,938 5,453 7,233 6,238 23,248 24,862
Revenues ex. specific items
CB 1,324 1,286 1,325 1,341 1,255 1,242 1,313 1,230 5,276 5,040
IB 1,757 1,497 2,318 2,661 2,365 1,915 3,112 2,403 8,233 9,796
PB 2,023 1,982 2,151 1,934 2,029 1,986 2,153 1,984 8,091 8,152
AM 543 671 519 549 563 599 637 626 2,281 2,424
C&O (84) 44 43 (173) (243) (163) (74) (7) (170) (486)
Core Bank 5,564 5,479 6,355 6,312 5,968 5,579 7,142 6,236 23,711 24,926
CRU (120) (164) (81) (44) (34) (59) 79 (23) (409) (36)
Group 5,444 5,315 6,275 6,269 5,935 5,520 7,222 6,214 23,302 24,890
Adjusted costs ex. transformation charges
Core Bank (4,683) (4,603) (4,791) (4,493) (4,481) (4,372) (4,900) (4,391) (18,569) (18,144)
CRU (557) (499) (661) (430) (336) (317) (422) (236) (2,147) (1,311)
Group (5,240) (5,102) (5,452) (4,923) (4,816) (4,689) (5,322) (4,628) (20,716) (19,455)
Profit (loss) before tax
Core Bank 327 (435) 971 749 910 591 1,999 1,423 1,612 4,923
CRU (1,014) (858) (765) (591) (428) (417) (410) (258) (3,228) (1,512)
Group (687) (1,293) 206 158 482 175 1,589 1,165 (1,616) 3,411
Adjusted profit (loss) before tax
Core Bank 645 467 1,059 931 1,209 984 2,151 1,600 3,101 5,943
CRU (729) (713) (756) (511) (383) (363) (400) (236) (2,709) (1,382)
Group (84) (246) 303 419 826 621 1,752 1,364 392 4,562

Deutsche BankInvestor Relations
Transformation-related effectsIn € bn, unless stated otherwise
26
1.0
0.2
0.7
0.7 0.4
1.0
2.8
2021
0.0
0.0
0.1
0.2
2019
0.1
2020
0.20.2
0.2
0.1
0.1 0.1
2022
Deferred tax asset valuation
adjustment
Goodwill impairment(1)
Software impairment(3)
Real estate charges
Restructuring & severance(2)
Deferred Tax Asset valuation adjustment
Goodwill impairment
Software impairment/ accelerated amortization
Real estate charges
98%
100%
87%
82%
% of total 2019 –
Q2 2021
Total transformation-related effects 90%
2.9
1.0
0.5
1.9
2019 – 2022 expected
cumulative expenses
0.0
-
0.0
0.0
Q2 2021
Restructuring & severance
0.1
1.4 89%
No
no
pe
rati
ng
co
sts(4
)
Tra
nsf
orm
ati
on
c
ha
rge
s(5)
Other 0.0 0.4 47%
Other
2.8
1.0
0.4
1.6
2019 –Q2 2021
cumulative expenses
1.2
0.2
Note: Estimated restructuring and severance, impairments, deferred tax valuation adjustments and other transformation charges in future periods are preliminary and subject to change. Non-tax items are shown on a pre-tax basis
(1) Non tax-deductible
(2) Excludes H1 2019 restructuring & severance of € 0.1bn, prior to the strategic announcement on 7 Jul 2019
(3) Includes accelerated software amortization
(4) Excluded from adjusted costs
(5) Included in adjusted costs
Pre-tax
items

Deutsche BankInvestor Relations
We like to get in touch with you
27
Investor Relations contact details
Deutsche Bank AGInvestor Relations TeamTel: [email protected]
Links to key investor presentations:
• Q2 2021 Client and Creditor Overview (August 2021):https://investor-relations.db.com/files/documents/creditor-information/Client_and_Creditor_Presentation.pdf
• Q2 2021 results presentation (28 July 2021):https://investor-relations.db.com/reports-and-events/quarterly-results
• Investor Deep Dive (09 December 2020):https://www.db.com/ir/en/other-presentations-and-events.htm
• Risk Deep Dive (18 June 2020):https://www.db.com/ir/de/download/18_June_2020_Risk_Deep_Dive_vFinal1.pdf

Deutsche BankInvestor Relations
Cautionary statements
28
This presentation contains forward-looking statements. Forward-looking statements are statements that are not historical facts; they include statements
about our beliefs and expectations and the assumptions underlying them. These statements are based on plans, estimates and projections as they are
currently available to the management of Deutsche Bank. Forward-looking statements therefore speak only as of the date they are made, and we
undertake no obligation to update publicly any of them in light of new information or future events.
By their very nature, forward-looking statements involve risks and uncertainties. A number of important factors could therefore cause actual results to
differ materially from those contained in any forward-looking statement. Such factors include the conditions in the financial markets in Germany, in
Europe, in the United States and elsewhere from which we derive a substantial portion of our revenues and in which we hold a substantial portion of our
assets, the development of asset prices and market volatility, potential defaults of borrowers or trading counterparties, the implementation of our strategic
initiatives, the reliability of our risk management policies, procedures and methods, and other risks referenced in our filings with the U.S. Securities and
Exchange Commission. Such factors are described in detail in our SEC Form 20-F of 12 March 2021 under the heading “Risk Factors.” Copies of this
document are readily available upon request or can be downloaded from www.db.com/ir.
This presentation also contains non-IFRS financial measures. For a reconciliation to directly comparable figures reported under IFRS, to the extent such
reconciliation is not provided in this presentation, refer to the Q2 2021 Financial Data Supplement, which is accompanying this presentation and available
at www.db.com/ir.
Results are prepared in accordance with International Financial Reporting Standards (IFRS) as issued by the International Accounting Standards Board
(“IASB”) and endorsed by the European Union (“EU”), including, from 2020, application of portfolio fair value hedge accounting for non-maturing deposits
and fixed rate mortgages with pre-payment options (the “EU carve-out”). Fair value hedge accounting under the EU carve-out is employed to minimise
the accounting exposure to both positive and negative moves in interest rates in each tenor bucket thereby reducing the volatility of reported revenue
from Treasury activities. For the three-month period ended June 30, 2021, application of the EU carve out had a negative impact of € 5 million on profit
before taxes and of € 9 million on profit. For the same time period in 2020 the application of the EU carve out had a negative impact of € 55 million on
profit before taxes and of € 23 million on profit. For the six-month period ended June 30, 2021, application of the EU carve out had a negative impact of €
321 million on profit before taxes and of € 216 million on profit. For the same time period in 2020 the application of the EU carve out had a positive impact
of € 77 million on profit before taxes and of € 47 million on profit. The Group’s regulatory capital and ratios thereof are also reported on the basis of the EU
carve out version of IAS 39. The impact on profit also impacts the calculation of the CET1 capital ratio and had a negative impact of below one basis point
as of both the three-month period ended June 30, 2021 and the three-month period ended June 30, 2020. For the six-month period ended June 30, 2021,
application of the EU carve out had a negative impact on the CET1 capital ratio of 6 basis points and a positive impact of about one basis point for the six-
month period ended June 30, 2020. In any given period, the net effect of the EU carve-out can be positive or negative, depending on the fair market value
changes in the positions being hedged and the hedging instruments.


![Executing With Purpose · WPaP]LRP ZQ c Strategic Pillars: Advancing our Transformation with Purpose BP XLOP ^TRYT NLY_ ^_]TOP^ LOaLYNTYR Z`] ^_]L_PRTN _]LY^-formation in 2018 by](https://img.dokumen.tips/doc/110x75/5e552b1231240b0ad040ab04/executing-with-purpose-wpaplrp-zq-c-strategic-pillars-advancing-our-transformation.jpg)