Embed Size (px)
Citation preview
a n n u a l r e p o r t | 2 0 1 2
facebook.com/CokeConsolidated twitter.com/CokeCCBCC
Coca‑Cola Bottling Co. Consolidated 4100 Coca‑Cola Plaza | Charlotte, NC 28211
Mailing Address: Post Office Box 31487 | Charlotte, NC 28231
704.557.4400 www.CokeConsolidated.com

B o a r D o F D I r e C t o r S
J. Frank Harrison, IIIChairman of the Board of Directors
and Chief Executive Officer Coca‑Cola Bottling Co. Consolidated
H.W. McKay BelkManaging Director
HWMB Advisors, LLC
Alexander B. Cummings, Jr.Executive Vice President and
Chief Administrative Officer The Coca‑Cola Company
Sharon A. DeckerSecretary of Commerce State of North Carolina
William B. ElmoreVice Chairman of the Board of Directors
Coca‑Cola Bottling Co. Consolidated
Morgan H. EverettCommunity Relations Director
Coca‑Cola Bottling Co. Consolidated
Deborah H. EverhartAffiliate Broker
Real Estate Brokers LLC
Henry W. FlintPresident and
Chief Operating Officer Coca‑Cola Bottling Co. Consolidated
Dr. William H. JonesPresident
Columbia International University
James H. MorganChairman of the Board of Directors, Chief
Executive Officer and President Krispy Kreme Doughnuts, Inc.
John W. Murrey, IIIAssistant Professor
Appalachian School of Law
Dennis A. WickerPartner
Nelson, Mullins, Riley & Scarborough LLP Former Lieutenant Governor
State of North Carolina
e X e C u t I V e o F F I C e r S
J. Frank Harrison, IIIChairman of the Board of Directors and
Chief Executive Officer
Henry W. FlintPresident and Chief Operating Officer
William B. ElmoreVice Chairman of the Board of Directors
William J. BilliardVice President, Operations Finance and
Chief Accounting Officer
Robert G. ChamblessSenior Vice President, Sales and Marketing
Clifford M. Deal, IIIVice President and Treasurer
Norman C. GeorgePresident, BYB Brands, Inc.
James E. HarrisSenior Vice President, Shared Services and
Chief Financial Officer
David L. HopkinsSenior Vice President, Operations
Umesh M. KasbekarSenior Vice President, Planning
and Administration
David M. KatzSenior Vice President, Assistant to the
Chairman and Chief Executive Officer
Lauren C. SteeleSenior Vice President, Corporate Affairs
Michael A. StrongSenior Vice President, Human Resources
1
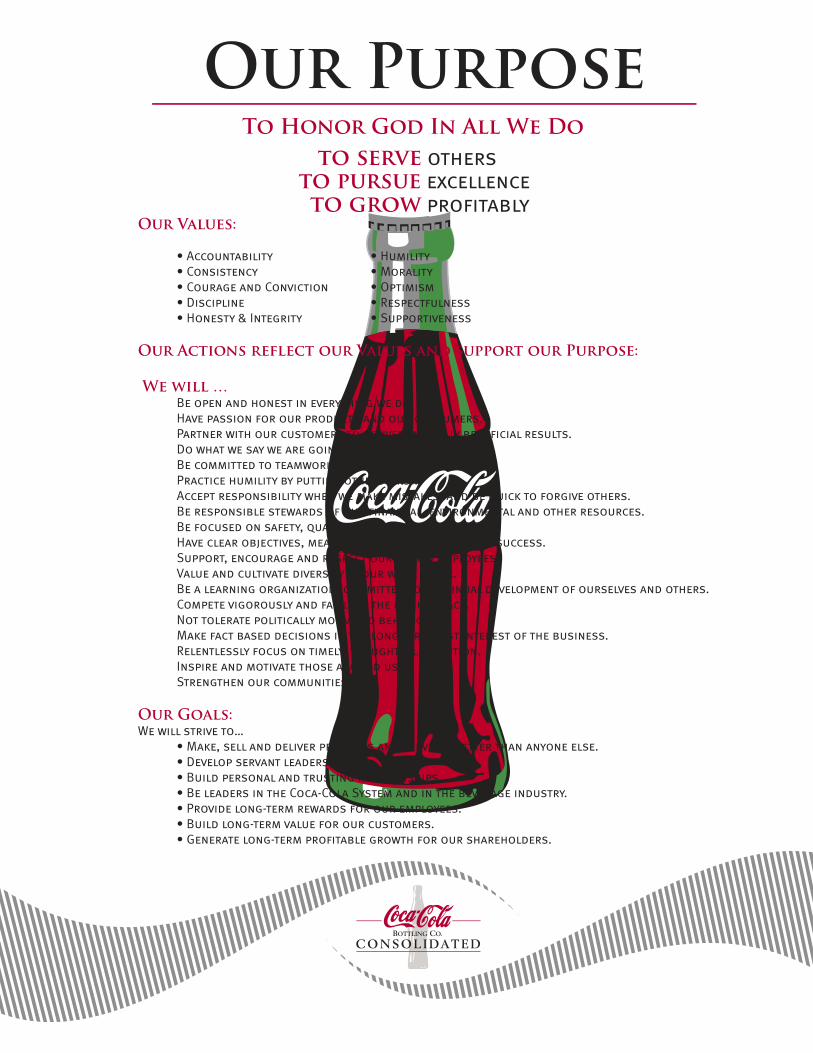
Our Purpose is clear: To Honor God in All We Do, To Serve Others, To Pursue Excellence and To Grow Profitably. Quite simply, this is how we approach our business.
We know that in order to continue to grow and thrive, we need to put our Purpose to work in our communities every day. Our Purpose drives the long-term vision for our business with clear objectives including:
• Being a model for servant leadership and service to others;• Being the most preferred and trusted relationship for our consumers, customers,
communities and other constituents;• Being a recognized industry leader in innovation and continuous improvement; and• Growing our revenue, profits and shareholder value.
In 2012, we made great progress on all these objectives, and we want to share some of our successes with you.
Being a Model for Servant leaderShip and Service to otherS
While much has changed in the past 110 years, one thing that has not changed is the Company’s commitment to service, which comes in many forms. Clearly, we are
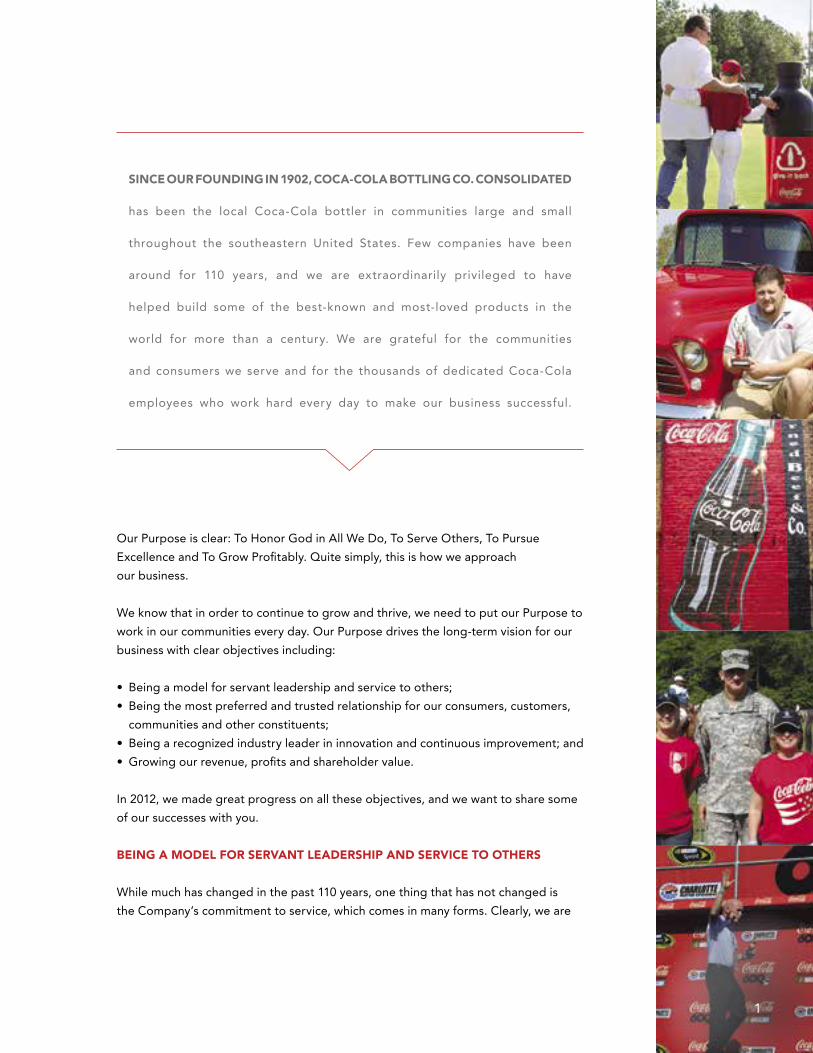
Since our founding in 1902, coca-cola Bottling co. conSolidated
has been the local Coca-Cola bottler in communities large and small
throughout the southeastern United States. Few companies have been
around for 110 years, and we are extraordinarily privileged to have
helped build some of the best-known and most-loved products in the
world for more than a century. We are grateful for the communities
and consumers we serve and for the thousands of dedicated Coca-Cola
employees who work hard every day to make our business successful.
F u l F i l l i n g O u r P u r P O s e
2
committed to serving our customers, but we are also called to serve our consumers, our communities and our employees. Through our stewardship initiative, Coke Cares, our Company and its employees serve the physical, emotional and spiritual needs of others by providing ongoing support for nonprofits, homeless shelters, schools, nursing homes and much more.
One example of an important Coke Cares initiative is our partnership with Chestnut Mountain Ranch in Morganton, W.V., a region enduring its
share of very tough economic times. The Ranch provides a faith-centered school and home for boys in crises and in need of hope and healing. Partnering with the boys’ families, the organization pursues family restoration and reunification through educational programs geared to help them develop spiritually, intellectually, physically, emotionally and socially. Its efforts inspired our West Virginia and Virginia teams to donate money, time and energy to build a much-needed, and first of its kind, boys’ dormitory at the ranch. We are privileged to hear success stories from many of
the young boys themselves – now teenagers excelling in both their personal and academic lives. Chestnut Mountain Ranch is just one example – our employees volunteer thousands of hours annually across our entire franchise to make a positive impact in our communities.
Being the MoSt Preferred and truSted relationShiP
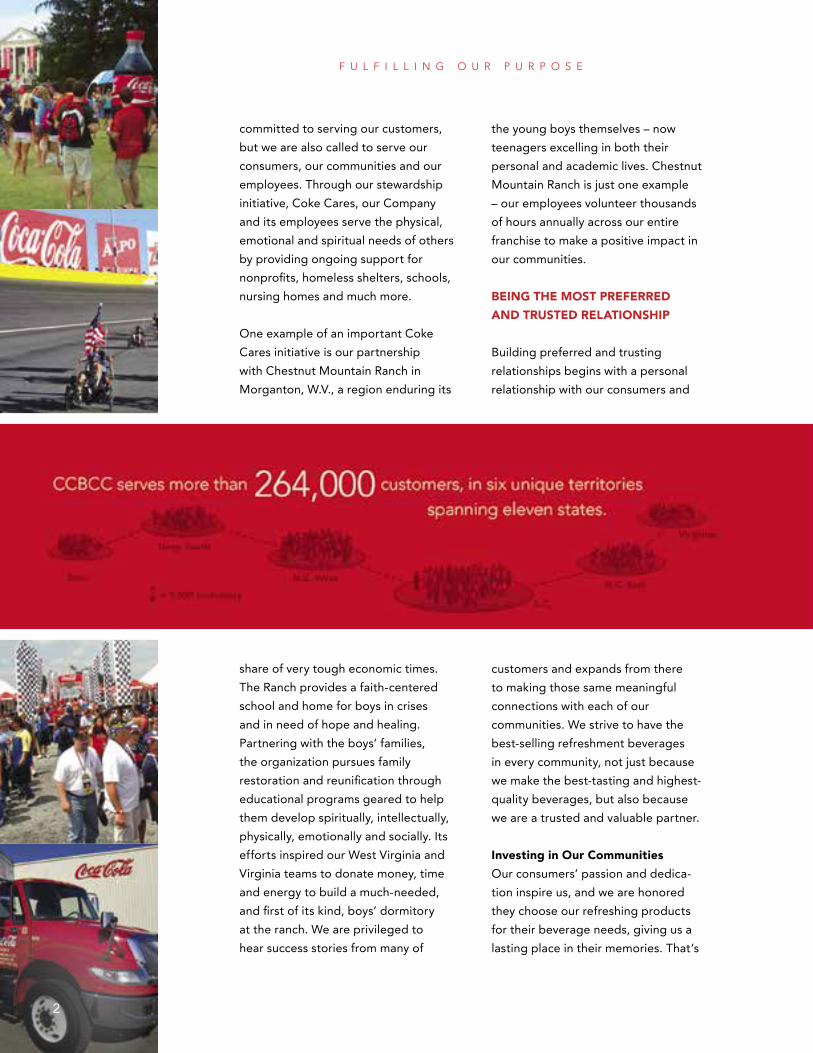
Building preferred and trusting relationships begins with a personal relationship with our consumers and
customers and expands from there to making those same meaningful connections with each of our communities. We strive to have the best-selling refreshment beverages in every community, not just because we make the best-tasting and highest-quality beverages, but also because we are a trusted and valuable partner.
investing in our communitiesOur consumers’ passion and dedica-tion inspire us, and we are honored they choose our refreshing products for their beverage needs, giving us a lasting place in their memories. That’s
4
F u l F i l l i n g O u r P u r P O s e
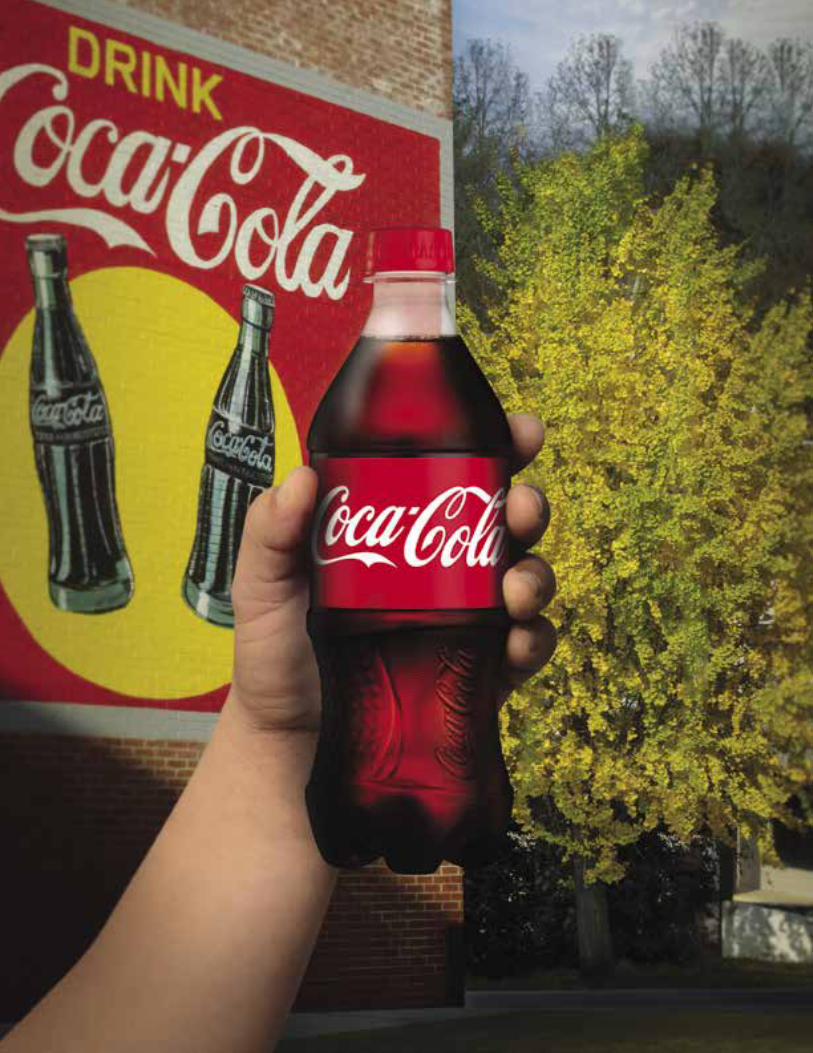
why it is such a pleasure when our local communities demonstrate an interest in restoring the historic Coca-Cola art-work displayed on the sides of down-town buildings and other community structures. Coke Consolidated is helping bring back a sense of heritage and pride by partnering with communi-ties to refurbish beautiful Coca-Cola signs to once again brighten local business districts.
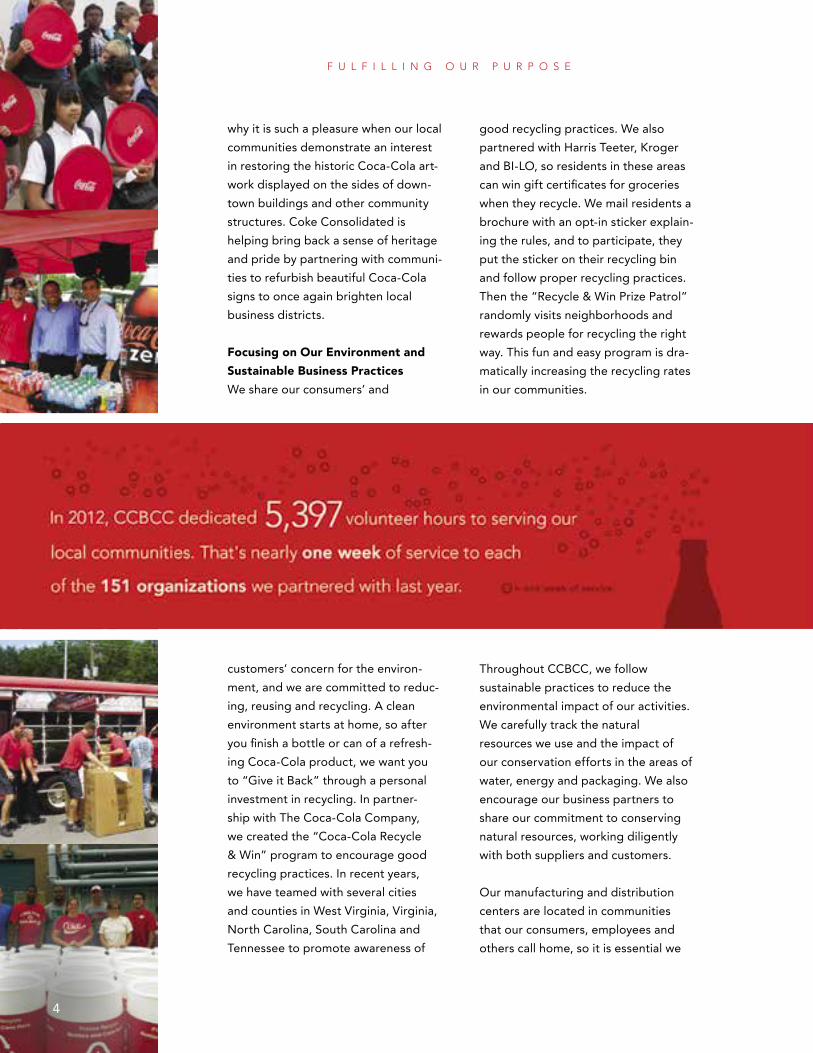
focusing on our environment and Sustainable Business PracticesWe share our consumers’ and
customers’ concern for the environ-ment, and we are committed to reduc-ing, reusing and recycling. A clean environment starts at home, so after you finish a bottle or can of a refresh-ing Coca-Cola product, we want you to “Give it Back” through a personal investment in recycling. In partner-ship with The Coca-Cola Company, we created the “Coca-Cola Recycle & Win” program to encourage good recycling practices. In recent years, we have teamed with several cities and counties in West Virginia, Virginia, North Carolina, South Carolina and Tennessee to promote awareness of
good recycling practices. We also partnered with Harris Teeter, Kroger and BI-LO, so residents in these areas can win gift certificates for groceries when they recycle. We mail residents a brochure with an opt-in sticker explain-ing the rules, and to participate, they put the sticker on their recycling bin and follow proper recycling practices. Then the “Recycle & Win Prize Patrol” randomly visits neighborhoods and rewards people for recycling the right way. This fun and easy program is dra-matically increasing the recycling rates in our communities.
Throughout CCBCC, we follow sustainable practices to reduce the environmental impact of our activities. We carefully track the natural resources we use and the impact of our conservation efforts in the areas of water, energy and packaging. We also encourage our business partners to share our commitment to conserving natural resources, working diligently with both suppliers and customers.
Our manufacturing and distribution centers are located in communities that our consumers, employees and others call home, so it is essential we

6
F u l F i l l i n g O u r P u r P O s e
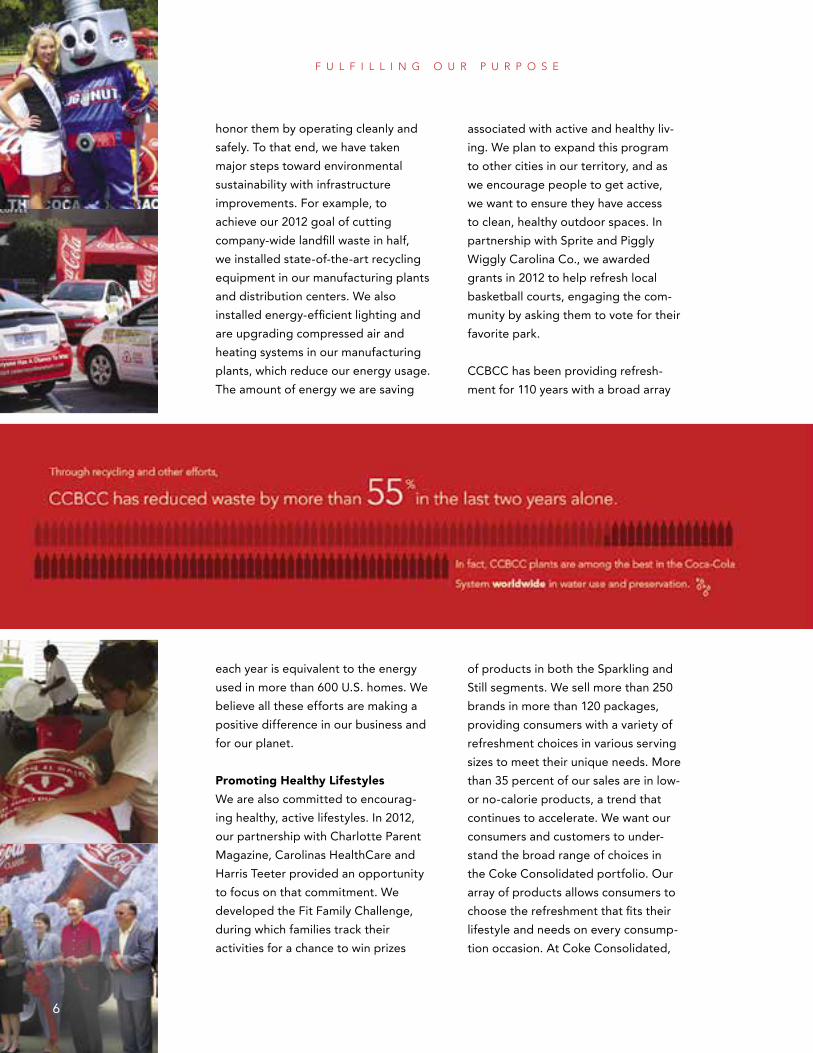
honor them by operating cleanly and safely. To that end, we have taken major steps toward environmental sustainability with infrastructure improvements. For example, to achieve our 2012 goal of cutting company-wide landfill waste in half, we installed state-of-the-art recycling equipment in our manufacturing plants and distribution centers. We also installed energy-efficient lighting and are upgrading compressed air and heating systems in our manufacturing plants, which reduce our energy usage. The amount of energy we are saving
each year is equivalent to the energy used in more than 600 U.S. homes. We believe all these efforts are making a positive difference in our business and for our planet.
Promoting healthy lifestylesWe are also committed to encourag-ing healthy, active lifestyles. In 2012, our partnership with Charlotte Parent Magazine, Carolinas HealthCare and Harris Teeter provided an opportunity to focus on that commitment. We developed the Fit Family Challenge, during which families track their activities for a chance to win prizes
associated with active and healthy liv-ing. We plan to expand this program to other cities in our territory, and as we encourage people to get active, we want to ensure they have access to clean, healthy outdoor spaces. In partnership with Sprite and Piggly Wiggly Carolina Co., we awarded grants in 2012 to help refresh local basketball courts, engaging the com-munity by asking them to vote for their favorite park.
CCBCC has been providing refresh-ment for 110 years with a broad array
of products in both the Sparkling and Still segments. We sell more than 250 brands in more than 120 packages, providing consumers with a variety of refreshment choices in various serving sizes to meet their unique needs. More than 35 percent of our sales are in low- or no-calorie products, a trend that continues to accelerate. We want our consumers and customers to under-stand the broad range of choices in the Coke Consolidated portfolio. Our array of products allows consumers to choose the refreshment that fits their lifestyle and needs on every consump-tion occasion. At Coke Consolidated,

8
F u l F i l l i n g O u r P u r P O s e
we aim to provide lots of refreshing choices – calories are optional.
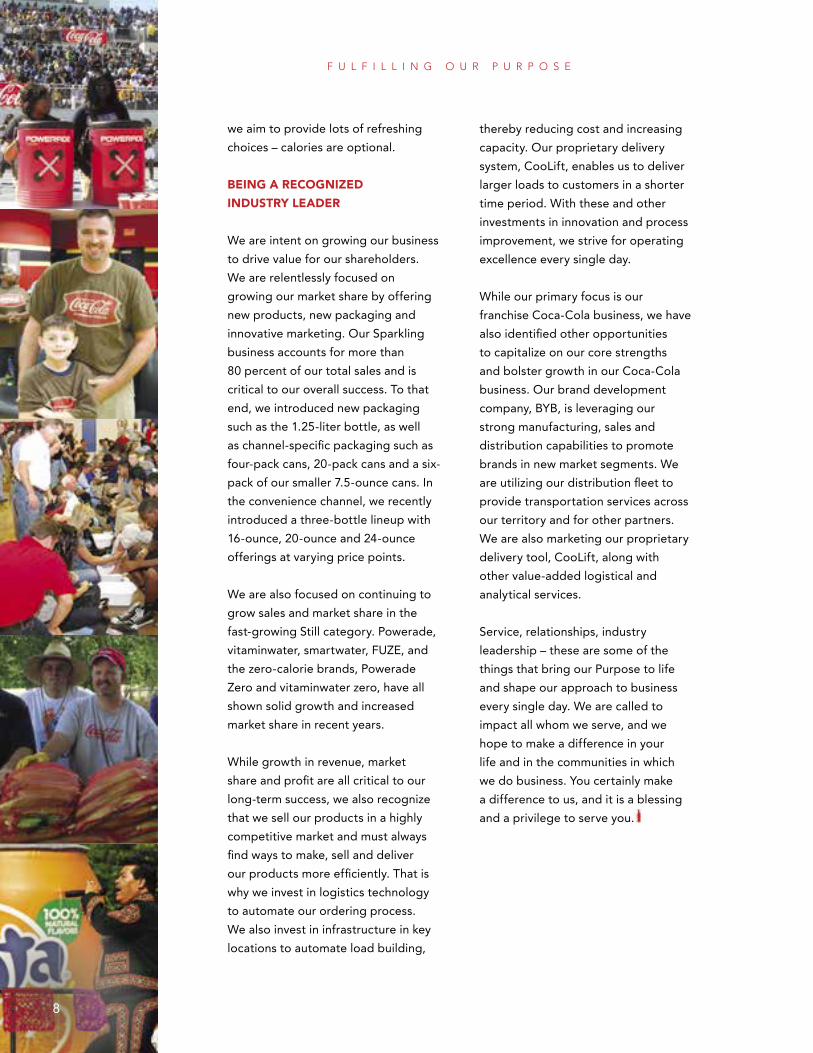
Being a recognized induStry leader
We are intent on growing our business to drive value for our shareholders. We are relentlessly focused on growing our market share by offering new products, new packaging and innovative marketing. Our Sparkling business accounts for more than 80 percent of our total sales and is critical to our overall success. To that end, we introduced new packaging such as the 1.25-liter bottle, as well as channel-specific packaging such as four-pack cans, 20-pack cans and a six-pack of our smaller 7.5-ounce cans. In the convenience channel, we recently introduced a three-bottle lineup with 16-ounce, 20-ounce and 24-ounce offerings at varying price points.
We are also focused on continuing to grow sales and market share in the fast-growing Still category. Powerade, vitaminwater, smartwater, FUZE, and the zero-calorie brands, Powerade Zero and vitaminwater zero, have all shown solid growth and increased market share in recent years.
While growth in revenue, market share and profit are all critical to our long-term success, we also recognize that we sell our products in a highly competitive market and must always find ways to make, sell and deliver our products more efficiently. That is why we invest in logistics technology to automate our ordering process. We also invest in infrastructure in key locations to automate load building,
thereby reducing cost and increasing capacity. Our proprietary delivery system, CooLift, enables us to deliver larger loads to customers in a shorter time period. With these and other investments in innovation and process improvement, we strive for operating excellence every single day.
While our primary focus is our franchise Coca-Cola business, we have also identified other opportunities to capitalize on our core strengths and bolster growth in our Coca-Cola business. Our brand development company, BYB, is leveraging our strong manufacturing, sales and distribution capabilities to promote brands in new market segments. We are utilizing our distribution fleet to provide transportation services across our territory and for other partners. We are also marketing our proprietary delivery tool, CooLift, along with other value-added logistical and analytical services.
Service, relationships, industry leadership – these are some of the things that bring our Purpose to life and shape our approach to business every single day. We are called to impact all whom we serve, and we hope to make a difference in your life and in the communities in which we do business. You certainly make a difference to us, and it is a blessing and a privilege to serve you.
1010
ear Shareholders,
Our operating results for 2012 reflect another solid year with growth in rev-enue and market share. These results also reflect an increase in operating costs due to investments we made in people and marketing, as well as the development of our long-term growth strategy.
The Company reported net income of $27.2 million, or basic net income
per share of $2.95, compared to net income of $28.6 million, or basic net income per share of $3.11 in 2011. The comparability of earnings between 2012 and 2011 was impacted by several unusual items. Our 2012 results included non-cash gains on our hedging programs of $0.3 million net of tax, or $0.03 per share. The results also include unfavorable adjust ments to income tax expense of $2.7 million, or $0.29 per share. Our 2011 results include non-cash losses on our hedging programs of $4.1 million net of tax, or $0.45 per share, and net unfavorable adjustments to income tax
expense of $0.6 million, or $0.06 per share. Excluding these unusual items, net income and basic net income per share for 2012 were $29.6 million and $3.21, compared to $33.3 million and $3.62 for 2011.
We were pleased with our top-line growth in 2012, with total revenues increasing by $53.2 million or 3.4 percent. The strong revenue growth was driven in part by gains in market share in our Sparkling portfolio
as a result of new products, new packaging and marketing innovation. We experienced market share growth in key channels including grocery, mass merchandisers and drugstores. Our gross margin for the year increased by $25.1 million, or 4.0 percent, due to strong revenue growth and lower-than-expected increases in our cost of sales. Our selling, delivery and administrative costs for the year were up by 4.4 percent.
Consistent with our Purpose, we are relentlessly focused on growing our business profitably. Profitable growth
dl e t t e r t O s h a r e h O l d e r s

1212
means growing revenue, operating more efficiently and continuing to strengthen our financial position.
growing revenue
We operate in highly competitive and developed markets. To continue growing, we utilize a focused strategy to increase market share and innovate in ways that drive consumer demand and customer value. Our volume growth for 2012 was approximately 1 percent, comprised of a decrease of less than 1 percent in our Sparkling beverages and an increase of more than 9 percent in our Still beverage portfolio, with Powerade, smartwater and vitaminwater leading that growth.
To spur growth in our Sparkling beverage portfolio, we introduced the 1.25-liter package in 2011, primarily as a take-home package for our large retailers. This package is generally priced at $0.99, which value-oriented consumers find attractive. In 2012, we expanded the distribution of the 1.25-liter package into the convenience channel, where it has become a highly competitive offering, helping us grow revenue and market share.
The convenience channel is our second-largest channel and very important to our goal of long-term profitable growth – driving profit for today, while creating the consumers of tomorrow. During the past several years, we have introduced new bottle sizes and price points for immediate consumption in this key channel with resulting market share gains in many of our territories. As
competitive dynamics change, our immediate consumption strategy will continue to evolve. In late 2012, we introduced a new three-bottle strategy designed for the differing needs of convenience shoppers: a 16-ounce offering in limited brands, generally value-priced at $0.99; a 20-ounce bottle competitively priced for frequent buyers; and a value-added 24-ounce package.
In recent years, we have seen our strongest growth in the value and drugstore channels, as consumers have migrated toward these channels. We created specific packaging for the value channel, since it has grown significantly with the economic chal-lenges of the past few years. Our 2012 performance in both these channels outpaced our overall performance.
We focus our marketing and promotional efforts in areas where we believe we can generate above average return on investment. In the past two years, we extended or entered into long-term commitments with many major colleges in our franchise territory. Our relationships with these colleges not only help us build brand awareness and loyalty among a key target group of consumers, but also provide us with valuable insight on our brands and consumer tastes.
iMProving efficiency and productivity
Along with growing our revenue, it is imperative that we continue to improve the efficiency and effectiveness of our business. During
l e t t e r t O s h a r e h O l d e r s
1414
the past several years, we have experienced significant increases in raw materials, packaging, fuel and other input costs. In the competitive market in which we operate, we cannot always pass additional costs to the customer. To offset higher costs, we continue to identify ways to leverage technology, develop new tools and enhance or change existing processes. Our focus on continuous improvement and productivity is company-wide, from sourcing and ordering raw materials to processing customer payments.
Delivery expenses are one of the larg-est items in our selling, delivery and administrative costs, and we have made significant progress in reducing or slowing the growth rate of these costs. Several years ago, we developed the proprietary delivery tool CooLift. This tool transformed the way we deliver product, moving away from traditional side-bay beverage trucks with drivers building loads at the customer site. We now primarily use a rear-loaded vehicle, from which our drivers can simply wheel a pre-built pallet into the customer’s store. CooLift has increased the number of cases delivered per stop,
while reducing miles driven and the number of delivery stops. CooLift also prompted changes in our warehouses and how we build loads for distribu-tion. In our largest distribution center in Charlotte, we installed an automated order-building system that has dramati-cally increased the number of cases the warehouse can handle. The increased capacity has allowed us to consolidate some smaller warehouses and serve additional territories directly from Charlotte. We are in the process of installing a second automated order-building system in Nashville, Tenn.,
and evaluating the economic benefits of installing systems in other areas in the future.
Our improved delivery and warehouse operations have provided other benefits including better inventory control, decreased shrinkage costs and a reduction in losses due to accidents. During the past five years, the number of workers’ compensation claims and vehicle accidents declined by more than 50 percent. Serving our employees begins with providing them a safe place to work. These are just a few examples of the ancillary benefits provided by
l e t t e r t O s h a r e h O l d e r s
15
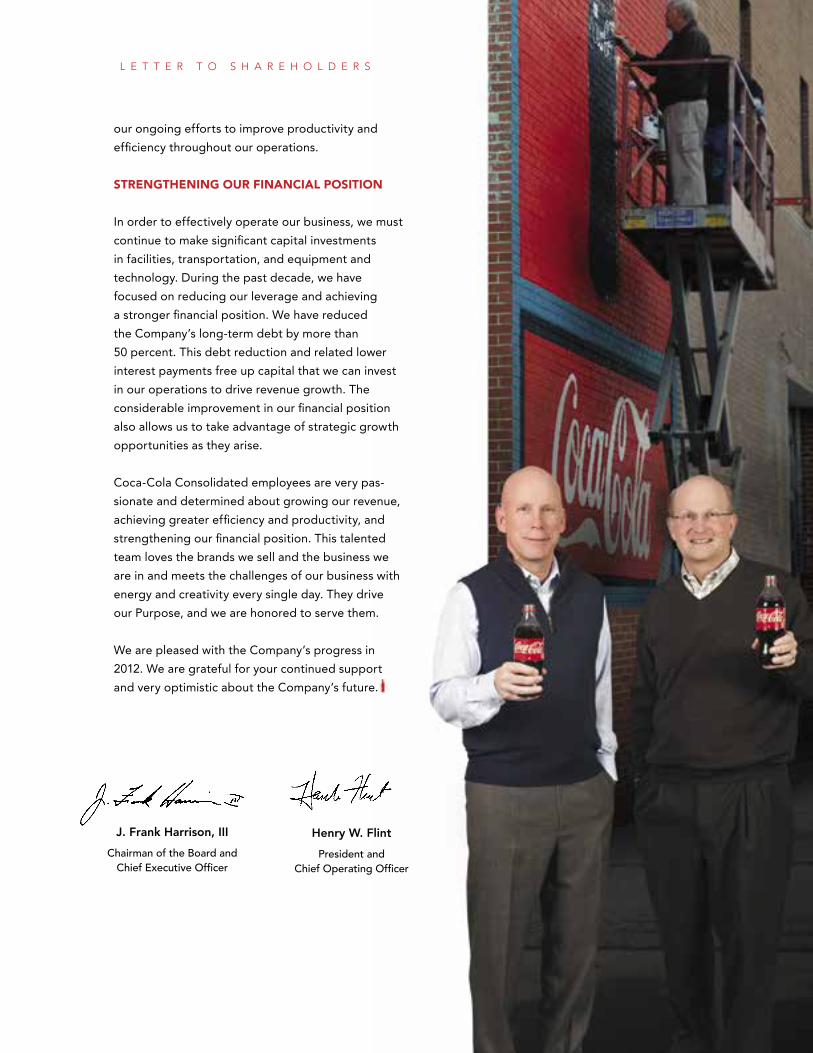
our ongoing efforts to improve productivity and efficiency throughout our operations.
Strengthening our financial PoSition
In order to effectively operate our business, we must continue to make significant capital investments in facilities, transportation, and equipment and technology. During the past decade, we have focused on reducing our leverage and achieving a stronger financial position. We have reduced the Company’s long-term debt by more than 50 percent. This debt reduction and related lower interest payments free up capital that we can invest in our operations to drive revenue growth. The considerable improvement in our financial position also allows us to take advantage of strategic growth opportunities as they arise.
Coca-Cola Consolidated employees are very pas-sionate and determined about growing our revenue, achieving greater efficiency and productivity, and strengthening our financial position. This talented team loves the brands we sell and the business we are in and meets the challenges of our business with energy and creativity every single day. They drive our Purpose, and we are honored to serve them.
We are pleased with the Company’s progress in 2012. We are grateful for your continued support and very optimistic about the Company’s future.
J. Frank Harrison, IIIChairman of the Board and
Chief Executive Officer
Henry W. FlintPresident and
Chief Operating Officer
l e t t e r t O s h a r e h O l d e r s
UNITED STATES SECURITIES AND EXCHANGE COMMISSIONWashington, D.C. 20549
FORM 10-KÍ ANNUAL REPORT PURSUANT TO SECTION 13 OR 15(d) OF THE SECURITIES EXCHANGE ACT OF 1934
For the fiscal year ended December 30, 2012Commission file number 0-9286
(Exact name of registrant as specified in its charter)
Delaware 56-0950585(State or other jurisdiction of (I.R.S. Employer
incorporation or organization) Identification Number)
4100 Coca-Cola Plaza, Charlotte, North Carolina 28211(Address of principal executive offices) (Zip Code)
(704) 557-4400(Registrant’s telephone number, including area code)
Securities Registered Pursuant to Section 12(b) of the Act:Title of Each Class Name of Each Exchange on Which Registered
Common Stock, $1.00 Par Value The NASDAQ Global Select Market
Securities Registered Pursuant to Section 12(g) of the Act:None
Indicate by check mark if the registrant is a well-known seasoned issuer, as defined in Rule 405 of the Securities Act. Yes ‘ No Í
Indicate by check mark if the registrant is not required to file reports pursuant to Section 13 or Section 15(d) of the Act. Yes ‘ No Í
Indicate by check mark whether the registrant (1) has filed all reports required to be filed by Section 13 or 15(d) of the SecuritiesExchange Act of 1934 during the preceding 12 months (or for such shorter period that the registrant was required to file such reports), and(2) has been subject to such filing requirements for the past 90 days. Yes Í No ‘
Indicate by check mark whether the registrant has submitted electronically and posted on its corporate Web site, if any, everyInteractive Data File required to be submitted and posted pursuant to Rule 405 of Regulation S-T (§232.405 of this chapter) during thepreceding 12 months (or for such shorter period that the registrant was required to submit and post such files). Yes Í No ‘
Indicate by check mark if disclosure of delinquent filers pursuant to Item 405 of Regulation S-K is not contained herein, and will notbe contained, to the best of registrant’s knowledge, in definitive proxy or information statements incorporated by reference in Part III ofthis Form 10-K or any amendment to this Form 10-K. Í
Indicate by check mark whether the registrant is a large accelerated filer, an accelerated filer, a non-accelerated filer or a smallerreporting company. See the definitions of “large accelerated filer,” “accelerated filer” and “smaller reporting company” in Rule 12b-2 ofthe Exchange Act.Large accelerated filer ‘ Accelerated filer Í Non-accelerated filer ‘ Smaller reporting company ‘
(Do not check if a smaller reporting company)
Indicate by check mark whether the registrant is a shell company (as defined in Rule 12b-2 of the Exchange Act). Yes ‘ No Í
State the aggregate market value of the voting and non-voting common equity held by non-affiliates computed by reference to theprice at which the common equity was last sold, or the average bid and asked price of such common equity, as of the last business day ofthe registrant’s most recently completed second fiscal quarter.
Market Value as ofJune 29, 2012
Common Stock, $l.00 Par Value $299,362,116Class B Common Stock, $l.00 Par Value *
* No market exists for the shares of Class B Common Stock, which is neither registered under Section 12 of the Act nor subject to Section 15(d) of the Act.The Class B Common Stock is convertible into Common Stock on a share-for-share basis at the option of the holder.
Indicate the number of shares outstanding of each of the registrant’s classes of common stock, as of the latest practicable date.
ClassOutstanding as of
March 1, 2013
Common Stock, $1.00 Par Value 7,141,447Class B Common Stock, $1.00 Par Value 2,088,842
Documents Incorporated by ReferencePortions of Proxy Statement to be filed pursuant to Section 14 of the Exchange Act with respect to the 2013 Annual
Meeting of Stockholders . . . . . . . . . . . . . . . . . . . . . . . . . . . . . . . . . . . . . . . . . . . . . . . . . . . . . . . . . . . . . . . . . . . . . . . Part III, Items 10-14
Table of Contents
Page
Part IItem 1. Business . . . . . . . . . . . . . . . . . . . . . . . . . . . . . . . . . . . . . . . . . . . . . . . . . . . . . . . . . . . . . . . . . . . . . . 1Item 1A. Risk Factors . . . . . . . . . . . . . . . . . . . . . . . . . . . . . . . . . . . . . . . . . . . . . . . . . . . . . . . . . . . . . . . . . . . 11Item 1B. Unresolved Staff Comments . . . . . . . . . . . . . . . . . . . . . . . . . . . . . . . . . . . . . . . . . . . . . . . . . . . . . . 18Item 2. Properties . . . . . . . . . . . . . . . . . . . . . . . . . . . . . . . . . . . . . . . . . . . . . . . . . . . . . . . . . . . . . . . . . . . . . 18Item 3. Legal Proceedings . . . . . . . . . . . . . . . . . . . . . . . . . . . . . . . . . . . . . . . . . . . . . . . . . . . . . . . . . . . . . . 20Item 4. Mine Safety Disclosures . . . . . . . . . . . . . . . . . . . . . . . . . . . . . . . . . . . . . . . . . . . . . . . . . . . . . . . . . 20
Executive Officers of the Company . . . . . . . . . . . . . . . . . . . . . . . . . . . . . . . . . . . . . . . . . . . . . . . . . 20
Part IIItem 5. Market for Registrant’s Common Equity, Related Stockholder Matters and Issuer Purchases of
Equity Securities . . . . . . . . . . . . . . . . . . . . . . . . . . . . . . . . . . . . . . . . . . . . . . . . . . . . . . . . . . . . . . . 22Item 6. Selected Financial Data . . . . . . . . . . . . . . . . . . . . . . . . . . . . . . . . . . . . . . . . . . . . . . . . . . . . . . . . . . 24Item 7. Management’s Discussion and Analysis of Financial Condition and Results of Operations . . . . . 25Item 7A. Quantitative and Qualitative Disclosures about Market Risk . . . . . . . . . . . . . . . . . . . . . . . . . . . . . 55Item 8. Financial Statements and Supplementary Data . . . . . . . . . . . . . . . . . . . . . . . . . . . . . . . . . . . . . . . . 56Item 9. Changes in and Disagreements with Accountants on Accounting and Financial Disclosure . . . . . 105Item 9A. Controls and Procedures . . . . . . . . . . . . . . . . . . . . . . . . . . . . . . . . . . . . . . . . . . . . . . . . . . . . . . . . . 105Item 9B. Other Information . . . . . . . . . . . . . . . . . . . . . . . . . . . . . . . . . . . . . . . . . . . . . . . . . . . . . . . . . . . . . . 105
Part IIIItem 10. Directors, Executive Officers and Corporate Governance . . . . . . . . . . . . . . . . . . . . . . . . . . . . . . . 106Item 11. Executive Compensation . . . . . . . . . . . . . . . . . . . . . . . . . . . . . . . . . . . . . . . . . . . . . . . . . . . . . . . . . 106Item 12. Security Ownership of Certain Beneficial Owners and Management and Related Stockholder
Matters . . . . . . . . . . . . . . . . . . . . . . . . . . . . . . . . . . . . . . . . . . . . . . . . . . . . . . . . . . . . . . . . . . . . . . . 106Item 13. Certain Relationships and Related Transactions, and Director Independence . . . . . . . . . . . . . . . . 106Item 14. Principal Accountant Fees and Services . . . . . . . . . . . . . . . . . . . . . . . . . . . . . . . . . . . . . . . . . . . . . 106
Part IVItem 15. Exhibits and Financial Statement Schedules . . . . . . . . . . . . . . . . . . . . . . . . . . . . . . . . . . . . . . . . . . 107
Signatures . . . . . . . . . . . . . . . . . . . . . . . . . . . . . . . . . . . . . . . . . . . . . . . . . . . . . . . . . . . . . . . . . . . . . 115
PART I
Item 1. Business
Introduction
Coca-Cola Bottling Co. Consolidated, a Delaware corporation (together with its majority-ownedsubsidiaries, the “Company”), produces, markets and distributes nonalcoholic beverages, primarily products ofThe Coca-Cola Company, Atlanta, Georgia (“The Coca-Cola Company”), which include some of the mostrecognized and popular beverage brands in the world. The Company, which was incorporated in 1980, and itspredecessors have been in the nonalcoholic beverage manufacturing and distribution business since 1902. TheCompany is the largest independent Coca-Cola bottler in the United States.
As of December 30, 2012, The Coca-Cola Company had a 34.8% interest in the Company’s outstandingCommon Stock, representing 5.1% of the total voting power of the Company’s Common Stock and Class BCommon Stock voting together as a single class. The Coca-Cola Company does not own any shares of Class BCommon Stock of the Company. J. Frank Harrison, III, the Company’s Chairman of the Board and ChiefExecutive Officer, currently owns or controls approximately 85% of the combined voting power of theCompany’s outstanding Common Stock and Class B Common Stock.
General
Nonalcoholic beverage products can be broken down into two categories:
• Sparkling beverages – beverages with carbonation, including energy drinks; and
• Still beverages – beverages without carbonation, including bottled water, tea, ready-to-drink coffee,enhanced water, juices and sports drinks.
Sales of sparkling beverages were approximately 82%, 83% and 83% of total net sales for fiscal 2012(“2012”), fiscal 2011 (“2011”) and fiscal 2010 (“2010”), respectively. Sales of still beverages wereapproximately 18%, 17% and 17% of total net sales for 2012, 2011 and 2010, respectively.
The Company holds Cola Beverage Agreements and Allied Beverage Agreements under which it produces,distributes and markets, in certain regions, sparkling beverages of The Coca-Cola Company. The Company alsoholds Still Beverage Agreements under which it distributes and markets in certain regions still beverages of TheCoca-Cola Company such as POWERade, vitaminwater and Minute Maid Juices To Go and produces, distributesand markets Dasani water products.
The Company holds agreements to produce, distribute and market Dr Pepper in some of its regions. TheCompany also distributes and markets various other products, including Monster Energy products and Sundrop,in one or more of the Company’s regions under agreements with the companies that hold and license the use oftheir trademarks for these beverages. In addition, the Company produces beverages for other Coca-Cola bottlers.In some instances, the Company distributes beverages without a written agreement.
The Company’s principal sparkling beverage is Coca-Cola. In each of the last three fiscal years, sales ofproducts bearing the “Coca-Cola” or “Coke” trademark have accounted for more than half of the Company’sbottle/can volume to retail customers. In total, products of The Coca-Cola Company accounted for approximately88% of the Company’s bottle/can volume to retail customers during 2012, 2011 and 2010.
The Company offers a range of flavors designed to meet the demands of the Company’s consumers. Themain packaging materials for the Company’s beverages are plastic bottles and aluminum cans. In addition, theCompany provides restaurants and other immediate consumption outlets with fountain products (“post-mix”).Fountain products are dispensed through equipment that mixes the fountain syrup with carbonated or still water,enabling fountain retailers to sell finished products to consumers in cups or glasses.
In recent years, the Company has developed and begun to market and distribute certain products which itowns. These products include Country Breeze tea, Tum-E Yummies, a vitamin-C enhanced flavored drink andFuel in a Bottle power shots. The Company markets and sells these products nationally.
1
The Coca-Cola Company acquired Coca-Cola Enterprises Inc. (“CCE”) on October 2, 2010. In connectionwith the transaction, CCE changed its name to Coca-Cola Refreshments USA, Inc. (“CCR”) and transferred itsbeverage operations outside of North America to an independent third party. As a result of the transaction, theNorth American operations of CCE are now included in CCR. CCE began distributing Tum-E Yummies in thefirst quarter of 2010 and CCR is continuing to do so nationally. Certain other Coca-Cola franchise bottlers arealso distributing Tum-E Yummies. References to “CCR” refer to CCR and CCE as it existed prior to theacquisition by The Coca-Cola Company.
The following table sets forth some of the Company’s most important products, including both products thatThe Coca-Cola Company and other beverage companies have licensed to the Company and products that theCompany owns.
The Coca-Cola Company
Sparkling Beverages(including Energy
Products) Still Beverages
Products Licensedby Other Beverage
CompaniesCompany Owned
Products
Coca-Cola glacéau smartwater Dr Pepper Tum-E YummiesDiet Coke glacéau vitaminwater Diet Dr Pepper Country Breeze teaCoca-Cola Zero Dasani Sundrop Fuel in a BottleSprite Dasani Flavors Monster EnergyFanta Flavors Powerade productsSprite Zero Powerade ZeroMello Yello Minute Maid AdultCherry Coke RefreshmentsSeagrams Ginger Ale Minute Maid JuicesCherry Coke Zero To GoDiet Coke Splenda® NesteaFresca Gold Peak teaPibb Xtra FUZEBarqs Root Beer V8 juice productsTAB from CampbellFull ThrottleNOS®
Beverage Agreements
The Company holds contracts with The Coca-Cola Company which entitle the Company to produce, marketand distribute in its exclusive territory The Coca-Cola Company’s nonalcoholic beverages in bottles, cans andfive gallon pressurized pre-mix containers. The Company has similar arrangements with Dr Pepper SnappleGroup, Inc. and other beverage companies.
Cola and Allied Beverage Agreements with The Coca-Cola Company.
The Company purchases concentrates from The Coca-Cola Company and produces, markets and distributes itsprincipal sparkling beverages within its territories under two basic forms of beverage agreements with TheCoca-Cola Company: (i) beverage agreements that cover sparkling beverages bearing the trademark “Coca-Cola” or“Coke” (the “Coca-Cola Trademark Beverages” and “Cola Beverage Agreements”), and (ii) beverage agreementsthat cover other sparkling beverages of The Coca-Cola Company (the “Allied Beverages” and “Allied BeverageAgreements”) (referred to collectively in this report as the “Cola and Allied Beverage Agreements”), although insome instances the Company distributes sparkling beverages without a written agreement. The Company is a partyto Cola Beverage Agreements and Allied Beverage Agreements for various specified territories.
Cola Beverage Agreements with The Coca-Cola Company.
Exclusivity. The Cola Beverage Agreements provide that the Company will purchase its entirerequirements of concentrates or syrups for Coca-Cola Trademark Beverages from The Coca-Cola Company at
2
prices, terms of payment, and other terms and conditions of supply determined from time-to-time by TheCoca-Cola Company at its sole discretion. The Company may not produce, distribute, or handle cola productsother than those of The Coca-Cola Company. The Company has the exclusive right to manufacture and distributeCoca-Cola Trademark Beverages for sale in authorized containers within its territories. The Coca-Cola Companymay determine, at its sole discretion, what types of containers are authorized for use with products of TheCoca-Cola Company. The Company may not sell Coca-Cola Trademark Beverages outside its territories.
Company Obligations. The Company is obligated to:
• maintain such plant and equipment, staff and distribution and vending facilities that are capable ofmanufacturing, packaging, and distributing Coca-Cola Trademark Beverages in accordance with the ColaBeverage Agreements and in sufficient quantities to satisfy fully the demand for these beverages in itsterritories;
• undertake adequate quality control measures and maintain sanitation standards prescribed by TheCoca-Cola Company;
• develop, stimulate and satisfy fully the demand for Coca-Cola Trademark Beverages in its territories;
• use all approved means and spend such funds on advertising and other forms of marketing as may bereasonably required to satisfy that objective; and
• maintain such sound financial capacity as may be reasonably necessary to ensure its performance of itsobligations to The Coca-Cola Company.
The Company is required to meet annually with The Coca-Cola Company to present its marketing,management, and advertising plans for the Coca-Cola Trademark Beverages for the upcoming year, includingfinancial plans showing that the Company has the consolidated financial capacity to perform its duties andobligations to The Coca-Cola Company. The Coca-Cola Company may not unreasonably withhold approval ofsuch plans. If the Company carries out its plans in all material respects, the Company will be deemed to havesatisfied its obligations to develop, stimulate, and satisfy fully the demand for the Coca-Cola TrademarkBeverages and to maintain the requisite financial capacity. Failure to carry out such plans in all material respectswould constitute an event of default that if not cured within 120 days of written notice of the failure would giveThe Coca-Cola Company the right to terminate the Cola Beverage Agreements. If the Company, at any time,fails to carry out a plan in all material respects in any geographic segment of its territory, as defined by TheCoca-Cola Company, and if such failure is not cured within six months of written notice of the failure, TheCoca-Cola Company may reduce the territory covered by that Cola Beverage Agreement by eliminating theportion of the territory in which such failure has occurred.
The Coca-Cola Company has no obligation under the Cola Beverage Agreements to participate with theCompany in expenditures for advertising and marketing. As it has in the past, The Coca-Cola Company maycontribute to such expenditures and undertake independent advertising and marketing activities, as well asadvertising and sales promotion programs which require mutual cooperation and financial support of theCompany. The future levels of marketing funding support and promotional funds provided by The Coca-ColaCompany may vary materially from the levels provided during the periods covered by the information includedin this report.
Acquisition of Other Bottlers. If the Company acquires control, directly or indirectly, of any bottler ofCoca-Cola Trademark Beverages, or any party controlling a bottler of Coca-Cola Trademark Beverages, theCompany must cause the acquired bottler to amend its agreement for the Coca-Cola Trademark Beverages toconform to the terms of the Cola Beverage Agreements.
Term and Termination. The Cola Beverage Agreements are perpetual, but they are subject to terminationby The Coca-Cola Company upon the occurrence of an event of default by the Company. Events of default withrespect to each Cola Beverage Agreement include:
• production, sale or ownership in any entity which produces or sells any cola product not authorized byThe Coca-Cola Company or a cola product that might be confused with or is an imitation of the tradedress, trademark, tradename or authorized container of a cola product of The Coca-Cola Company;
3
• insolvency, bankruptcy, dissolution, receivership, or the like;
• any disposition by the Company of any voting securities of any bottling company subsidiary without theconsent of The Coca-Cola Company; and
• any material breach of any of its obligations under that Cola Beverage Agreement that remainsunresolved for 120 days after written notice by The Coca-Cola Company.
If any Cola Beverage Agreement is terminated because of an event of default, The Coca-Cola Company hasthe right to terminate all other Cola Beverage Agreements the Company holds.
No Assignments. The Company is prohibited from assigning, transferring or pledging its Cola BeverageAgreements or any interest therein, whether voluntarily or by operation of law, without the prior consent of TheCoca-Cola Company.
Allied Beverage Agreements with The Coca-Cola Company.
The Allied Beverages are beverages of The Coca-Cola Company or its subsidiaries that are sparklingbeverages, but not Coca-Cola Trademark Beverages. The Allied Beverage Agreements contain provisions thatare similar to those of the Cola Beverage Agreements with respect to the sale of beverages outside its territories,authorized containers, planning, quality control, transfer restrictions, and related matters but have certainsignificant differences from the Cola Beverage Agreements.
Exclusivity. Under the Allied Beverage Agreements, the Company has exclusive rights to distribute theAllied Beverages in authorized containers in specified territories. Like the Cola Beverage Agreements, theCompany has advertising, marketing, and promotional obligations, but without restriction for most brands as tothe marketing of products with similar flavors, as long as there is no manufacturing or handling of other productsthat would imitate, infringe upon, or cause confusion with, the products of The Coca-Cola Company. TheCoca-Cola Company has the right to discontinue any or all Allied Beverages, and the Company has a right, butnot an obligation, under the Allied Beverage Agreements to elect to market any new beverage introduced by TheCoca-Cola Company under the trademarks covered by the respective Allied Beverage Agreements.
Term and Termination. Allied Beverage Agreements have a term of 10 years and are renewable by theCompany for an additional 10 years at the end of each term. Renewal is at the Company’s option. The Companycurrently intends to renew substantially all of the Allied Beverage Agreements as they expire. The AlliedBeverage Agreements are subject to termination in the event of default by the Company. The Coca-ColaCompany may terminate an Allied Beverage Agreement in the event of:
• insolvency, bankruptcy, dissolution, receivership, or the like;
• termination of a Cola Beverage Agreement by either party for any reason; or
• any material breach of any of the Company’s obligations under that Allied Beverage Agreement thatremains unresolved for 120 days after required prior written notice by The Coca-Cola Company.
Supplementary Agreement Relating to Cola and Allied Beverage Agreements with The Coca-Cola Company.
The Company and The Coca-Cola Company are also parties to a Letter Agreement (the “SupplementaryAgreement”) that modifies some of the provisions of the Cola and Allied Beverage Agreements. TheSupplementary Agreement provides that The Coca-Cola Company will:
• exercise good faith and fair dealing in its relationship with the Company under the Cola and AlliedBeverage Agreements;
• offer marketing funding support and exercise its rights under the Cola and Allied Beverage Agreements ina manner consistent with its dealings with comparable bottlers;
• offer to the Company any written amendment to the Cola and Allied Beverage Agreements (exceptamendments dealing with transfer of ownership) which it offers to any other bottler in the United States;and
4
• subject to certain limited exceptions, sell syrups and concentrates to the Company at prices no greaterthan those charged to other bottlers which are parties to contracts substantially similar to the Cola andAllied Beverage Agreements.
The Supplementary Agreement permits transfers of the Company’s capital stock that would otherwise belimited by the Cola and Allied Beverage Agreements.
Pricing of Coca-Cola Trademark Beverages and Allied Beverages.
Pursuant to the Cola and Allied Beverage Agreements, except as provided in the Supplementary Agreementand the Incidence Pricing Agreement (described below), The Coca-Cola Company establishes the prices chargedto the Company for concentrates of Coca-Cola Trademark Beverages and Allied Beverages. The Coca-ColaCompany has no rights under the beverage agreements to establish the resale prices at which the Company sellsits products.
The Company entered into an agreement (the “Incidence Pricing Agreement”) with The Coca-ColaCompany to test an incidence-based concentrate pricing model for 2008 for all Coca-Cola Trademark Beveragesand Allied Beverages for which the Company purchases concentrate from The Coca-Cola Company. During theterm of the Incidence Pricing Agreement, the pricing of the concentrates for the Coca-Cola Trademark Beveragesand Allied Beverages is governed by the Incidence Pricing Agreement rather than the Cola and Allied BeverageAgreements. The concentrate price The Coca-Cola Company charges under the Incidence Pricing Agreement isimpacted by a number of factors including the Company’s pricing of finished products, the channels in which thefinished products are sold and package mix. The Coca-Cola Company must give the Company at least 90 dayswritten notice before changing the price the Company pays for the concentrate. The Incidence Pricing Agreementhas been extended through December 31, 2013 under the same terms that were in effect for 2009 through 2012.
Still Beverage Agreements with The Coca-Cola Company.
The Company purchases and distributes certain still beverages such as sports drinks and juice drinks fromThe Coca-Cola Company, or its designees or joint ventures, and produces, markets and distributes Dasani waterproducts, pursuant to the terms of marketing and distribution agreements (the “Still Beverage Agreements”). Insome instances the Company distributes certain still beverages without a written agreement. The Still BeverageAgreements contain provisions that are similar to the Cola and Allied Beverage Agreements with respect toauthorized containers, planning, quality control, transfer restrictions, and related matters but have certainsignificant differences from the Cola and Allied Beverage Agreements.
Exclusivity. Unlike the Cola and Allied Beverage Agreements, which grant the Company exclusivity inthe distribution of the covered beverages in its territory, the Still Beverage Agreements grant exclusivity butpermit The Coca-Cola Company to test-market the still beverage products in its territory, subject to theCompany’s right of first refusal, and to sell the still beverages to commissaries for delivery to retail outlets in theterritory where still beverages are consumed on-premises, such as restaurants. The Coca-Cola Company must paythe Company certain fees for lost volume, delivery, and taxes in the event of such commissary sales. Approvedalternative route to market projects undertaken by the Company, The Coca-Cola Company, and other bottlers ofCoca-Cola products would, in some instances, permit delivery of certain products of The Coca-Cola Companyinto the territories of almost all bottlers, in exchange for compensation in most circumstances, despite the termsof the beverage agreements making such territories exclusive. Also, under the Still Beverage Agreements, theCompany may not sell other beverages in the same product category.
Pricing. The Coca-Cola Company, at its sole discretion, establishes the prices the Company must pay forthe still beverages or, in the case of Dasani, the concentrate or finished goods, but has agreed, under certaincircumstances for some products, to give the benefit of more favorable pricing if such pricing is offered to otherbottlers of Coca-Cola products.
Term. Each of the Still Beverage Agreements has a term of 10 or 15 years and is renewable by theCompany for an additional 10 years at the end of each term. The Company currently intends to renewsubstantially all of the Still Beverage Agreements as they expire.
5
Other Beverage Agreements with The Coca-Cola Company.
The Company has entered into a distribution agreement with Energy Brands, Inc. (“Energy Brands”), awholly owned subsidiary of The Coca-Cola Company. Energy Brands, also known as glacéau, is a producer anddistributor of branded enhanced water products including vitaminwater and smartwater. The agreement has aterm of 10 years, and will automatically renew for succeeding 10-year terms, subject to a 12-month nonrenewalnotification by the Company. The agreement covers most of the Company’s territories, requires the Company todistribute Energy Brands enhanced water products exclusively, and permits Energy Brands to distribute theproducts in some channels within the Company’s territories.
The Company is distributing fruit and vegetable juice beverages of the Campbell Soup Company(“Campbell”) under an interim subdistribution agreement with The Coca-Cola Company. The Campbell interimsubdistribution agreement may be terminated by either party upon 30 days written notice. The interim agreementcovers all of the Company’s territories, and permits Campbell and certain other sellers of Campbell beverages tocontinue distribution in the Company’s territories. The Company purchases Campbell beverages from asubsidiary of Campbell under a separate purchase agreement.
The Company also sells Coca-Cola and other post-mix products of The Coca-Cola Company on a non-exclusive basis. The Coca-Cola Company establishes the prices charged to the Company for post-mix products ofThe Coca-Cola Company. In addition, the Company produces some products for sale to other Coca-Cola bottlersand CCR. These sales have lower margins but allow the Company to achieve higher utilization of its productionequipment and facilities.
The Company entered into an agreement with The Coca-Cola Company regarding brand innovation anddistribution collaboration. Under the agreement, the Company grants The Coca-Cola Company the option topurchase any nonalcoholic beverage brands owned by the Company. The option is exercisable as to each brand ata formula-based price during the two-year period that begins after that brand has achieved a specified level of netoperating revenue or, if earlier, beginning five years after the introduction of that brand into the market with aminimum level of net operating revenue, with the exception that with respect to brands owned at the date of theletter agreement, the five-year period does not begin earlier than the date of the letter agreement.
Beverage Agreements with Other Licensors.
The Company has beverage agreements with Dr Pepper Snapple Group, Inc. for Dr Pepper and Sundropbrands which are similar to those for the Cola and Allied Beverage Agreements. These beverage agreements areperpetual in nature but may be terminated by the Company upon 90 days’ notice. The price the beveragecompanies may charge for syrup or concentrate is set by the beverage companies from time to time. Thesebeverage agreements also contain similar restrictions on the use of trademarks, approved bottles, cans and labelsand sale of imitations or substitutes as well as termination for cause provisions. The Company also sells post-mixproducts of Dr Pepper Snapple Group, Inc.
The Company is distributing Monster brand energy drinks under a distribution agreement with HansenBeverage Company, including Monster and Java Monster. The agreement contains provisions that are similar tothe Cola and Allied Beverage Agreements with respect to pricing, promotion, planning, territory and trademarkrestrictions, transfer restrictions, and related matters as well as termination for cause provisions. The agreementhas a 20 year term and will renew automatically. The agreement may be terminated without cause by either party.However, any such termination by Hansen Beverage Company requires compensation in the form of severancepayments to the Company under the terms of the agreement.
The territories covered by beverage agreements with other licensors are not always aligned with theterritories covered by the Cola and Allied Beverage Agreements but are generally within those territoryboundaries. Sales of beverages by the Company under these other agreements represented approximately 12% ofthe Company’s bottle/can volume to retail customers for 2012, 2011 and 2010.
6
Markets and Production and Distribution Facilities
The Company currently holds bottling rights from The Coca-Cola Company covering the majority of NorthCarolina, South Carolina and West Virginia, and portions of Alabama, Mississippi, Tennessee, Kentucky,Virginia, Pennsylvania, Georgia and Florida. The total population within the Company’s bottling territory isapproximately 20 million.
The Company currently operates in seven principal geographic markets. Certain information regarding eachof these markets follows:
1. North Carolina. This region includes the majority of North Carolina, including Raleigh, Greensboro,Winston-Salem, High Point, Hickory, Asheville, Fayetteville, Wilmington, Charlotte and the surroundingareas. The region has a population of approximately 9 million. A production/distribution facility is locatedin Charlotte and 12 sales distribution facilities are located in the region.
2. South Carolina. This region includes the majority of South Carolina, including Charleston,Columbia, Greenville, Myrtle Beach and the surrounding areas. The region has a population ofapproximately 4 million. There are 6 sales distribution facilities in the region.
3. South Alabama. This region includes a portion of southwestern Alabama, including Mobile andsurrounding areas, and a portion of southeastern Mississippi. The region has a population of approximately1 million. A production/distribution facility is located in Mobile and 4 sales distribution facilities are locatedin the region.
4. South Georgia. This region includes a small portion of eastern Alabama, a portion of southwesternGeorgia including Columbus and surrounding areas and a portion of the Florida Panhandle. This region hasa population of approximately 1 million. There are 4 sales distribution facilities located in the region.
5. Middle Tennessee. This region includes a portion of central Tennessee, including Nashville andsurrounding areas, a small portion of southern Kentucky and a small portion of northwest Alabama. Theregion has a population of approximately 2 million. A production/distribution facility is located in Nashvilleand 3 sales distribution facilities are located in the region.
6. Western Virginia. This region includes most of southwestern Virginia, including Roanoke andsurrounding areas, a portion of the southern piedmont of Virginia, a portion of northeastern Tennessee and aportion of southeastern West Virginia. The region has a population of approximately 2 million. Aproduction/distribution facility is located in Roanoke and 4 sales distribution facilities are located in theregion.
7. West Virginia. This region includes most of the state of West Virginia and a portion of southwesternPennsylvania. The region has a population of approximately 1 million. There are 8 sales distributionfacilities located in the region.
The Company is a member of South Atlantic Canners, Inc. (“SAC”), a manufacturing cooperative located inBishopville, South Carolina. All eight members of SAC are Coca-Cola bottlers and each member has equalvoting rights. The Company receives a fee for managing the day-to-day operations of SAC pursuant to amanagement agreement. Management fees earned from SAC were $1.5 million, $1.6 million and $1.5 million in2012, 2011 and 2010, respectively. SAC’s bottling lines supply a portion of the Company’s volume requirementsfor finished products. The Company has a commitment with SAC that requires minimum annual purchases of17.5 million cases of finished products through May 2014. Purchases from SAC by the Company for finishedproducts were $141 million, $134 million and $131 million in 2012, 2011 and 2010, respectively, or 27.5 millioncases, 26.2 million cases and 26.1 million cases of finished product, respectively.
Raw Materials
In addition to concentrates obtained from The Coca-Cola Company and other beverage companies for use inits beverage manufacturing, the Company also purchases sweetener, carbon dioxide, plastic bottles, cans,closures and other packaging materials as well as equipment for the production, distribution and marketing ofnonalcoholic beverages.
7
The Company purchases substantially all of its plastic bottles (12-ounce, 16-ounce, 20-ounce, 24-ounce,half-liter, 1-liter, 1.25-liter, 2-liter and 300 ml sizes) from manufacturing plants owned and operated bySoutheastern Container and Western Container, two entities owned by various Coca-Cola bottlers including theCompany. The Company currently obtains all of its aluminum cans (7.5-ounce, 12-ounce and 16-ounce sizes)from two domestic suppliers.
None of the materials or supplies used by the Company are currently in short supply, although the supply ofspecific materials (including plastic bottles, which are formulated using petroleum-based products) could beadversely affected by strikes, weather conditions, governmental controls or international or domestic geopoliticalor other events affecting or threatening to affect the supply of petroleum.
Along with all the other Coca-Cola bottlers in the United States, the Company is a member in Coca-ColaBottlers’ Sales and Services Company, LLC (“CCBSS”), which was formed in 2003 for the purposes offacilitating various procurement functions and distributing certain specified beverage products of The Coca-ColaCompany with the intention of enhancing the efficiency and competitiveness of the Coca-Cola bottling system inthe United States. CCBSS has negotiated the procurement for the majority of the Company’s raw materials(excluding concentrate) since 2004.
The Company is exposed to price risk on commodities such as aluminum, corn, PET resin (a petroleum-based product) and fuel which affects the cost of raw materials used in the production of finished products. TheCompany both produces and procures these finished products. Examples of the raw materials affected arealuminum cans and plastic bottles used for packaging and high fructose corn syrup used as a product ingredient.Further, the Company is exposed to commodity price risk on oil which impacts the Company’s cost of fuel usedin the movement and delivery of the Company’s products. The Company participates in commodity hedging andrisk mitigation programs administered both by CCBSS and by the Company itself. In addition, there is no limiton the price The Coca-Cola Company and other beverage companies can charge for concentrate, although, underthe Incidence Pricing Agreement, The Coca-Cola Company must give the Company at least 90 days writtennotice of a pricing change.
Customers and Marketing
The Company’s products are sold and distributed directly to retail stores and other outlets, including foodmarkets, institutional accounts and vending machine outlets. During 2012, approximately 68% of the Company’sbottle/can volume to retail customers was sold for future consumption. The remaining bottle/can volume to retailcustomers of approximately 32% was sold for immediate consumption, primarily through dispensing machinesowned either by the Company, retail outlets or third party vending companies. The Company’s largest customer,Wal-Mart Stores, Inc., accounted for approximately 22% of the Company’s total bottle/can volume to retailcustomers and the second largest customer, Food Lion, LLC, accounted for approximately 8% of the Company’stotal bottle/can volume to retail customers. Wal-Mart Stores, Inc. and Food Lion, LLC accounted forapproximately 15% and 6% of the Company’s total net sales, respectively. The loss of either Wal-Mart Stores,Inc. or Food Lion, LLC as customers would have a material adverse effect on the Company. All of theCompany’s beverage sales are to customers in the United States.
New product introductions, packaging changes and sales promotions have been the primary sales andmarketing practices in the nonalcoholic beverage industry in recent years and have required and are expected tocontinue to require substantial expenditures. Brand introductions from The Coca-Cola Company in recent yearsinclude Coca-Cola Zero, Dasani flavors, Full Throttle and Gold Peak tea products. In 2007, the Company begandistribution of its own products, Country Breeze tea and Tum-E Yummies. In 2011, the Company begandistribution of Fuel in a Bottle Energy Shot and Fuel in a Bottle Protein Shot. In addition, the Company alsobegan distribution of NOS® products (energy drinks from FUZE, a subsidiary of The Coca-Cola Company), juiceproducts from FUZE and V8 products from Campbell during 2007. In the fourth quarter of 2007, the Companybegan distribution of glacéau products, a wholly-owned subsidiary of The Coca-Cola Company that producesbranded enhanced beverages including vitaminwater and smartwater. The Company entered into a distributionagreement in October 2008 with subsidiaries of Hansen Natural Corporation, the developer, marketer, seller anddistributor of Monster Energy drinks, the leading volume brand in the U.S. energy drink category. Under this
8
agreement, the Company began distributing Monster Energy drinks in certain of the Company’s territories inNovember 2008. New packaging introductions include the 1.25-liter bottle in 2011, the 7.5-ounce sleek canduring 2010, the 2-liter contour bottle for Coca-Cola products during 2009 and the 20-ounce “grip” bottle during2007. During 2008, the Company tested the 16-ounce bottle/24-ounce bottle package in select convenience storesand introduced it companywide in 2009. New product and packaging introductions have resulted in increasedoperating costs for the Company due to special marketing efforts, obsolescence of replaced items and, in somecases, higher raw material costs.
The Company sells its products primarily in nonrefillable bottles and cans, in varying proportions frommarket to market. For example, there may be as many as 24 different packages for Diet Coke within a singlegeographic area. Bottle/can volume to retail customers during 2012 was approximately 46% cans, 53% bottlesand 1% other containers.
Advertising in various media, primarily television and radio, is relied upon extensively in the marketing ofthe Company’s products. The Coca-Cola Company and Dr Pepper Snapple Group, Inc. (the “BeverageCompanies”) make substantial expenditures on advertising in the Company’s territories. The Company has alsobenefited from national advertising programs conducted by the Beverage Companies. In addition, the Companyexpends substantial funds on its own behalf for extensive local sales promotions of the Company’s products.Historically, these expenses have been partially offset by marketing funding support which the BeverageCompanies provide to the Company in support of a variety of marketing programs, such as point-of-sale displaysand merchandising programs. However, the Beverage Companies are under no obligation to provide theCompany with marketing funding support in the future.
The substantial outlays which the Company makes for marketing and merchandising programs are generallyregarded as necessary to maintain or increase revenue, and any significant curtailment of marketing fundingsupport provided by the Beverage Companies for marketing programs which benefit the Company could have amaterial adverse effect on the operating and financial results of the Company.
Seasonality
Sales of the Company’s products are seasonal with the highest sales volume occurring in May, June, Julyand August. The Company has adequate production capacity to meet sales demand for sparkling and stillbeverages during these peak periods. See “Item 2. Properties” for information relating to utilization of theCompany’s production facilities. Sales volume can be impacted by weather conditions.
Competition
The nonalcoholic beverage market is highly competitive. The Company’s competitors include bottlers anddistributors of nationally advertised and marketed products, regionally advertised and marketed products, as wellas bottlers and distributors of private label beverages in supermarket stores. The sparkling beverage market(including energy products) comprised 83% of the Company’s bottle/can volume to retail customers in 2012. Ineach region in which the Company operates, between 85% and 95% of sparkling beverage sales in bottles, cansand other containers are accounted for by the Company and its principal competitors, which in each regionincludes the local bottler of Pepsi-Cola and, in some regions, the local bottler of Dr Pepper, Royal Crown and/or7-Up products.
The principal methods of competition in the nonalcoholic beverage industry are point-of-salemerchandising, new product introductions, new vending and dispensing equipment, packaging changes, pricing,price promotions, product quality, retail space management, customer service, frequency of distribution andadvertising. The Company believes it is competitive in its territories with respect to these methods ofcompetition.
Government Regulation
The production and marketing of beverages are subject to the rules and regulations of the United StatesFood and Drug Administration (“FDA”) and other federal, state and local health agencies. The FDA also
9
regulates the labeling of containers. In February 2013, health advocates and public health officials from majorcities in the United States submitted a petition requesting the FDA to regulate the amount of caloric sweeteners insparkling and other beverages. The FDA has not responded to the petition.
As a manufacturer, distributor and seller of beverage products of The Coca-Cola Company and other softdrink manufacturers in exclusive territories, the Company is subject to antitrust laws of general applicability.However, pursuant to the United States Soft Drink Interbrand Competition Act, soft drink bottlers such as theCompany may have an exclusive right to manufacture, distribute and sell a soft drink product in a definedgeographic territory if that soft drink product is in substantial and effective competition with other products ofthe same general class in the market. The Company believes such competition exists in each of the exclusivegeographic territories in the United States in which the Company operates.
From time to time, legislation has been proposed in Congress and by certain state and local governmentswhich would prohibit the sale of soft drink products in nonrefillable bottles and cans or require a mandatorydeposit as a means of encouraging the return of such containers in an attempt to reduce solid waste and litter. TheCompany is currently not impacted by this type of proposed legislation.
Soft drink and similar-type taxes have been in place in West Virginia and Tennessee for several years.Proposals have been introduced by members of Congress and certain state governments that would impose exciseand other special taxes on certain beverages that the Company sells. The Company cannot predict whether anysuch legislation will be enacted.
Some states and localities have also proposed barring the use of food stamps by recipients in theirjurisdictions to purchase some of the products the Company manufactures. The United States Department ofAgriculture rejected such a proposal by a major American city as recently as 2011.
The Company has experienced public policy challenges regarding the sale of soft drinks in schools,particularly elementary, middle and high schools. At December 30, 2012, a number of states had regulationsrestricting the sale of soft drinks and other foods in schools. Many of these restrictions have existed for severalyears in connection with subsidized meal programs in schools. The focus has more recently turned to the growinghealth, nutrition and obesity concerns of today’s youth. Restrictive legislation, if widely enacted, could have anadverse impact on the Company’s products, image and reputation.
The Company is subject to audit by taxing authorities in jurisdictions where it conducts business. Theseaudits may result in assessments that are subsequently resolved with the authorities or potentially through thecourts. Management believes the Company has adequately provided for any assessments that are likely to resultfrom these audits; however, final assessments, if any, could be different than the amounts recorded in theconsolidated financial statements.
Environmental Remediation
The Company does not currently have any material capital expenditure commitments for environmentalcompliance or environmental remediation for any of its properties. The Company does not believe compliancewith federal, state and local provisions that have been enacted or adopted regarding the discharge of materialsinto the environment, or otherwise relating to the protection of the environment, will have a material effect on itscapital expenditures, earnings or competitive position.
Employees
As of February 1, 2013, the Company had approximately 5,000 full-time employees, of whomapproximately 400 were union members. The total number of employees, including part-time employees, wasapproximately 6,500. Approximately 7% of the Company’s labor force is covered by collective bargainingagreements. One collective bargaining agreement covering approximately .4% of the Company’s employeesexpired during 2012 and the Company entered into a new agreement in 2012. Two collective bargainingagreements covering approximately .7% of the Company’s employees will expire during 2013.
10
Exchange Act Reports
The Company makes available free of charge through the Company’s Internet website,www.cokeconsolidated.com, the Company’s annual report on Form 10-K, quarterly reports on Form 10-Q,current reports on Form 8-K and all amendments to those reports as soon as reasonably practicable after suchmaterials are electronically filed with or furnished to the Securities and Exchange Commission (SEC). The SECmaintains an Internet website, www.sec.gov, which contains reports, proxy and information statements, and otherinformation filed electronically with the SEC. Any materials that the Company files with the SEC may also beread and copied at the SEC’s Public Reference Room, 100 F Street, N.E., Room 1580, Washington, D. C. 20549.
Information on the operations of the Public Reference Room is available by calling the SEC at 1-800-SEC-0330. The information provided on the Company’s website is not part of this report and is not incorporatedherein by reference.
Item 1A. Risk Factors
In addition to other information in this Form 10-K, the following risk factors should be considered carefullyin evaluating the Company’s business. The Company’s business, financial condition or results of operationscould be materially and adversely affected by any of these risks.
The Company may not be able to respond successfully to changes in the marketplace.
The Company operates in the highly competitive nonalcoholic beverage industry and faces strongcompetition from other general and specialty beverage companies. The Company’s response to continued andincreased customer and competitor consolidations and marketplace competition may result in lower thanexpected net pricing of the Company’s products. The Company’s ability to gain or maintain the Company’s shareof sales or gross margins may be limited by the actions of the Company’s competitors, which may haveadvantages in setting their prices due to lower raw material costs. Competitive pressures in the markets in whichthe Company operates may cause channel and product mix to shift away from more profitable channels andpackages. If the Company is unable to maintain or increase volume in higher-margin products and in packagessold through higher-margin channels (e.g., immediate consumption), pricing and gross margins could beadversely affected. The Company’s efforts to improve pricing may result in lower than expected sales volume.
Acquisitions of bottlers by their franchisors may lead to uncertainty in the Coca-Cola bottler system oradversely impact the Company.
The Coca-Cola Company acquired the North American operations of Coca-Cola Enterprises Inc. in 2010,and the Company’s primary competitors were acquired at approximately the same time by their franchisor. Thesetransactions may cause uncertainty within the Coca-Cola bottler system or adversely impact the Company and itsbusiness. At this time, it remains uncertain what the ultimate impact of these transactions will be on theCompany’s business and financial results.
Changes in how significant customers market or promote the Company’s products could reduce revenue.
The Company’s revenue is affected by how significant customers market or promote the Company’sproducts. Revenue has been negatively impacted by less aggressive price promotion by some retailers in thefuture consumption channels over the past several years. If the Company’s significant customers change themanner in which they market or promote the Company’s products, the Company’s revenue and profitabilitycould be adversely impacted.
Changes in the Company’s top customer relationships could impact revenues and profitability.
The Company is exposed to risks resulting from several large customers that account for a significantportion of its bottle/can volume and revenue. The Company’s two largest customers accounted for approximately30% of the Company’s 2012 bottle/can volume to retail customers and approximately 21% of the Company’stotal net sales. The loss of one or both of these customers could adversely affect the Company’s results of
11
operations. These customers typically make purchase decisions based on a combination of price, product quality,consumer demand and customer service performance and generally do not enter into long-term contracts. Inaddition, these significant customers may re-evaluate or refine their business practices related to inventories,product displays, logistics or other aspects of the customer-supplier relationship. The Company’s results ofoperations could be adversely affected if revenue from one or more of these customers is significantly reduced orif the cost of complying with these customers’ demands is significant. If receivables from one or more of thesecustomers become uncollectible, the Company’s results of operations may be adversely impacted. One of thesecustomers has announced store closing in the United States, but the Company has not determined if this couldaffect the Company’s results of operations.
Changes in public and consumer preferences related to nonalcoholic beverages could reduce demand forthe Company’s products and reduce profitability.
The Company’s business depends substantially on consumer tastes and preferences that change in oftenunpredictable ways. The success of the Company’s business depends in large measure on working with theBeverage Companies to meet the changing preferences of the broad consumer market. Health and wellness trendsthroughout the marketplace have resulted in a shift from sugar sparkling beverages to diet sparkling beverages,tea, sports drinks, enhanced water and bottled water over the past several years. Failure to satisfy changingconsumer preferences could adversely affect the profitability of the Company’s business.
The Company’s sales can be impacted by the health and stability of the general economy.
Unfavorable changes in general economic conditions, such as a recession or economic slowdown in thegeographic markets in which the Company does business, may have the temporary effect of reducing the demandfor certain of the Company’s products. For example, economic forces may cause consumers to shift away frompurchasing higher-margin products and packages sold through immediate consumption and other highlyprofitable channels. Adverse economic conditions could also increase the likelihood of customer delinquenciesand bankruptcies, which would increase the risk of uncollectibility of certain accounts. Each of these factorscould adversely affect the Company’s revenue, price realization, gross margins and overall financial conditionand operating results.
Miscalculation of the Company’s need for infrastructure investment could impact the Company’s financialresults.
Projected requirements of the Company’s infrastructure investments may differ from actual levels if theCompany’s volume growth is not as the Company anticipates. The Company’s infrastructure investments aregenerally long-term in nature; therefore, it is possible that investments made today may not generate the returnsexpected by the Company due to future changes in the marketplace. Significant changes from the Company’sexpected returns on cold drink equipment, fleet, technology and supply chain infrastructure investments couldadversely affect the Company’s consolidated financial results.
The Company’s inability to meet requirements under its beverage agreements could result in the loss ofdistribution rights.
Approximately 88% of the Company’s bottle/can volume to retail customers in 2012 consisted of productsof The Coca-Cola Company, which is the sole supplier of these products or of the concentrates or syrups requiredto manufacture these products. The remaining 12% of the Company’s bottle/can volume to retail customers in2012 consisted of products of other beverage companies and the Company’s own products. The Company mustsatisfy various requirements under its beverage agreements. Failure to satisfy these requirements could result inthe loss of distribution rights for the respective products.
12
Material changes in, or the Company’s inability to satisfy, the performance requirements for marketingfunding support, or decreases from historic levels of marketing funding support, could reduce theCompany’s profitability.
Material changes in the performance requirements, or decreases in the levels of marketing funding supporthistorically provided, under marketing programs with The Coca-Cola Company and other beverage companies,or the Company’s inability to meet the performance requirements for the anticipated levels of such marketingfunding support payments, could adversely affect the Company’s profitability. The Coca-Cola Company andother beverage companies are under no obligation to continue marketing funding support at historic levels.
Changes in The Coca-Cola Company’s and other beverage companies’ levels of advertising, marketingspending and product innovation could reduce the Company’s sales volume.
The Coca-Cola Company’s and other beverage companies’ levels of advertising, marketing spending andproduct innovation directly impact the Company’s operations. While the Company does not believe there will besignificant changes in the levels of marketing and advertising by the Beverage Companies, there can be noassurance that historic levels will continue. The Company’s volume growth will also continue to be dependent onproduct innovation by the Beverage Companies, especially The Coca-Cola Company. Decreases in marketing,advertising and product innovation by the Beverage Companies could adversely impact the profitability of theCompany.
The inability of the Company’s aluminum can or plastic bottle suppliers to meet the Company’s purchaserequirements could reduce the Company’s profitability.
The Company currently obtains all of its aluminum cans from two domestic suppliers and all of its plasticbottles from two domestic cooperatives. The inability of these aluminum can or plastic bottle suppliers to meetthe Company’s requirements for containers could result in short-term shortages until alternative sources ofsupply can be located. The Company attempts to mitigate these risks by working closely with key suppliers andby purchasing business interruption insurance where appropriate. Failure of the aluminum can or plastic bottlesuppliers to meet the Company’s purchase requirements could reduce the Company’s profitability.
The inability of the Company to offset higher raw material costs with higher selling prices, increased bottle/can volume or reduced expenses could have an adverse impact on the Company’s profitability.
Raw material costs, including the costs for plastic bottles, aluminum cans and high fructose corn syrup, havebeen subject to significant price volatility and have increased in recent years at faster rates than the general rateof inflation. In addition, there are no limits on the prices The Coca-Cola Company and other beverage companiescan charge for concentrate. If the Company cannot offset higher raw material costs with higher selling prices,increased sales volume or reductions in other costs, the Company’s profitability could be adversely affected.
The consolidation among suppliers of certain of the Company’s raw materials could have an adverse impacton the Company’s profitability.
In recent years, there has been consolidation among suppliers of certain of the Company’s raw materials.The reduction in the number of competitive sources of supply could have an adverse effect upon the Company’sability to negotiate the lowest costs and, in light of the Company’s relatively small in-plant raw materialinventory levels, has the potential for causing interruptions in the Company’s supply of raw materials.
The increasing reliance on purchased finished goods from external sources makes the Company subject toincremental risks that could have an adverse impact on the Company’s profitability.
With the introduction of FUZE, Campbell and glacéau products into the Company’s portfolio during 2007and Monster Energy products during 2008, the Company has become increasingly reliant on purchased finishedgoods from external sources versus the Company’s internal production. As a result, the Company is subject toincremental risk including, but not limited to, product availability, price variability, product quality andproduction capacity shortfalls for externally purchased finished goods.
13
Sustained increases in fuel prices or the inability of the Company to secure adequate supplies of fuel couldhave an adverse impact on the Company’s profitability.
The Company uses significant amounts of fuel in the distribution of its products. International or domesticgeopolitical or other events could impact the supply and cost of fuel and could impact the timely delivery of theCompany’s products to its customers. While the Company is working to reduce fuel consumption and managethe Company’s fuel costs, there can be no assurance that the Company will succeed in limiting the impact on theCompany’s business or future cost increases. The Company may use derivative instruments to hedge some or allof the Company’s projected diesel fuel and unleaded gasoline purchases. These derivative instruments relate tofuel used in the Company’s delivery fleet and other vehicles. Continued upward pressure in these costs couldreduce the profitability of the Company’s operations.
Sustained increases in workers’ compensation, employment practices and vehicle accident claims costscould reduce the Company’s profitability.
The Company uses various insurance structures to manage its workers’ compensation, auto liability,medical and other insurable risks. These structures consist of retentions, deductibles, limits and a diverse groupof insurers that serve to strategically transfer and mitigate the financial impact of losses. Losses are accrued usingassumptions and procedures followed in the insurance industry, adjusted for company-specific history andexpectations. Although the Company has actively sought to control increases in these costs, there can be noassurance that the Company will succeed in limiting future cost increases. Continued upward pressure in thesecosts could reduce the profitability of the Company’s operations.
Sustained increases in the cost of employee benefits could reduce the Company’s profitability.
The Company’s profitability is substantially affected by the cost of pension retirement benefits,postretirement medical benefits and current employees’ medical benefits. In recent years, the Company hasexperienced significant increases in these costs as a result of macro-economic factors beyond the Company’scontrol, including increases in health care costs, declines in investment returns on pension assets and changes indiscount rates used to calculate pension and related liabilities. Although the Company has actively sought tocontrol increases in these costs, there can be no assurance the Company will succeed in limiting future costincreases, and continued upward pressure in these costs could reduce the profitability of the Company’soperations.
On March 23, 2010, the Patient Protection and Affordable Care Act (“PPACA”) was signed into law. OnMarch 30, 2010, a companion bill, the Health Care and Education Reconciliation Act of 2010 (“ReconciliationAct”), was also signed into law. The PPACA and the Reconciliation Act, when taken together, representcomprehensive health care reform legislation that will likely affect the cost associated with providing employer-sponsored medical plans. The Company is continuing to assess the impact this legislation will have on theCompany’s employer-sponsored medical plans. Additionally, the PPACA and the Reconciliation Act includeprovisions that reduce the tax benefits available to employers that receive Medicare Part D subsidies.
Product liability claims brought against the Company or product recalls could negatively affect theCompany’s business, financial results and brand image.
The Company may be liable if the consumption of the Company’s products causes injury or illness. TheCompany may also be required to recall products if they become contaminated or are damaged or mislabeled. Asignificant product liability or other product-related legal judgment against the Company or a widespread recallof the Company’s products could negatively impact the Company’s business, financial results and brand image.
Cybersecurity risks - technology failures or cyberattacks on the Company’s systems could disrupt theCompany’s operations and negatively impact the Company’s business.
The Company increasingly relies on information technology systems to process, transmit and storeelectronic information. For example, the Company’s production and distribution facilities, inventory
14
management and driver handheld devices all utilize information technology to maximize efficiencies andminimize costs. Furthermore, a significant portion of the communication between personnel, customers andsuppliers depends on information technology. Like most companies, the Company’s information technologysystems may be vulnerable to interruption due to a variety of events beyond the Company’s control, including,but not limited to, natural disasters, terrorist attacks, telecommunications failures, computer viruses, hackers andother security issues. The Company has technology security initiatives and disaster recovery plans in place tomitigate the Company’s risk to these vulnerabilities, but these measures may not be adequate or implementedproperly to ensure that the Company’s operations are not disrupted.
Changes in interest rates could adversely affect the profitability of the Company.
As of December 30, 2012, $50.0 million of the Company’s debt and capital lease obligations of $493.0million were subject to changes in short-term interest rates. The Company’s $200 million revolving credit facilityand $20 million uncommitted line of credit are subject to changes in short-term interest rates. On December 30,2012, the Company had $30.0 million of outstanding borrowings on the $200 million revolving credit facility and$20.0 million of outstanding borrowing on the $20 million uncommitted line of credit. If interest rates increase inthe future, it could increase the Company’s borrowing cost and it could reduce the Company’s overallprofitability. The Company’s pension and postretirement medical benefits costs are subject to changes in interestrates. A decline in interest rates used to discount the Company’s pension and postretirement medical liabilitiescould increase the cost of these benefits and increase the overall liability.
The level of the Company’s debt could restrict the Company’s operating flexibility and limit the Company’sability to incur additional debt to fund future needs.
As of December 30, 2012, the Company had $493.0 million of debt and capital lease obligations. TheCompany’s level of debt requires the Company to dedicate a substantial portion of the Company’s future cashflows from operations to the payment of principal and interest, thereby reducing the funds available to theCompany for other purposes. The Company’s debt can negatively impact the Company’s operations by(1) limiting the Company’s ability and/or increasing the cost to obtain funding for working capital, capitalexpenditures and other general corporate purposes; (2) increasing the Company’s vulnerability to economicdownturns and adverse industry conditions by limiting the Company’s ability to react to changing economic andbusiness conditions; and (3) exposing the Company to a risk that a significant decrease in cash flows fromoperations could make it difficult for the Company to meet the Company’s debt service requirements.
Recent volatility in the financial markets may negatively impact the Company’s ability to access the creditmarkets.
Capital and credit markets have become increasingly volatile as a result of adverse conditions that causedthe failure and near failure of a number of large financial services companies. If the capital and credit marketscontinue to experience volatility, it is possible that the Company’s ability to access the credit markets may belimited by these factors at a time when the Company would like or need to do so. If the availability of funds islimited, the Company may incur increased costs associated with borrowing to meet the Company’s requirements.
On September 21, 2011, the Company entered into a $200 million five-year unsecured revolving creditagreement (“$200 million facility”). This replaced the previous $200 million five-year unsecured revolving creditagreement which had been scheduled to mature in 2012. The $200 million facility has a scheduled maturity dateof September 21, 2016. The Company repaid $150 million of Senior Notes which matured in 2012. TheCompany borrowed from its $200 million facility and its $20 million uncommitted line of credit and used cashflows generated by operations to fund the repayments. As of December 30, 2012, the Company had $170 millionavailable on its $200 million facility. The limitation of availability of funds could have an impact on theCompany’s ability to refinance maturing debt and/or react to changing economic and business conditions.
15
The Company’s credit rating could be negatively impacted by changes to The Coca-Cola Company’s creditrating.
The Company’s credit rating could be significantly impacted by capital management activities of TheCoca-Cola Company and/or changes in the credit rating of The Coca-Cola Company. A lower credit rating couldsignificantly increase the Company’s interest costs or could have an adverse effect on the Company’s ability toobtain additional financing at acceptable interest rates or to refinance existing debt.
Changes in legal contingencies could adversely impact the Company’s future profitability.
Changes from expectations for the resolution of outstanding legal claims and assessments could have amaterial adverse impact on the Company’s profitability and financial condition. In addition, the Company’sfailure to abide by laws, orders or other legal commitments could subject the Company to fines, penalties or otherdamages.
Legislative changes that affect the Company’s distribution, packaging and products could reduce demandfor the Company’s products or increase the Company’s costs.
The Company’s business model is dependent on the availability of the Company’s various products andpackages in multiple channels and locations to better satisfy the needs of the Company’s customers andconsumers. Laws that restrict the Company’s ability to distribute products in schools and other venues, as well aslaws that require deposits for certain types of packages or those that limit the Company’s ability to design newpackages or market certain packages, could negatively impact the financial results of the Company.
In addition, excise or other taxes imposed on the sale of certain of the Company’s products by the federalgovernment and certain state and local governments could cause consumers to shift away from purchasingproducts of the Company. If enacted, such taxes could materially affect the Company’s business and financialresults, particularly if they were enacted in a form that incorporated them into the shelf prices for the Company’sproducts.
Significant additional labeling or warning requirements may inhibit sales of affected products.
Various jurisdictions may seek to adopt significant additional product labeling or warning requirementsrelating to the content or perceived adverse health consequences of certain of the Company’s products. If thesetypes of requirements become applicable to one or more of the Company’s major products under current orfuture environmental or health laws or regulations, they may inhibit sales of such products.
Additional taxes resulting from tax audits could adversely impact the Company’s future profitability.
An assessment of additional taxes resulting from audits of the Company’s tax filings could have an adverseimpact on the Company’s profitability, cash flows and financial condition.
Natural disasters and unfavorable weather could negatively impact the Company’s future profitability.
Natural disasters or unfavorable weather conditions in the geographic regions in which the Company doesbusiness could have an adverse impact on the Company’s revenue and profitability. For example, prolongeddrought conditions in the geographic regions in which the Company does business could lead to restrictions onthe use of water, which could adversely affect the Company’s ability to manufacture and distribute products andthe Company’s cost to do so.
Global climate change or legal, regulatory, or market responses to such change could adversely impact theCompany’s future profitability.
The growing political and scientific sentiment is that increased concentrations of carbon dioxide and othergreenhouse gases in the atmosphere are influencing global weather patterns. Changing weather patterns, along
16
with the increased frequency or duration of extreme weather conditions, could impact the availability or increasethe cost of key raw materials that the Company uses to produce its products. In addition, the sale of theseproducts can be impacted by weather conditions.
Concern over climate change, including global warming, has led to legislative and regulatory initiativesdirected at limiting greenhouse gas (GHG) emissions. For example, the United States Environmental ProtectionAgency (USEPA) began imposing GHG regulations on utilities, refineries and major manufacturers in 2011.Although the immediate effect was minor, as such regulations apply only to those that are planning to build largenew facilities or materially modify existing ones, over the next decade the USEPA plan to extend the scope of theGHG regulations to cover virtually all sources of GHG’s. Those USEPA regulations or future laws enacted orregulations adopted that directly or indirectly affect the Company’s production, distribution, packaging, cost ofraw materials, fuel, ingredients and water could all impact the Company’s business and financial results.
Issues surrounding labor relations could adversely impact the Company’s future profitability and/or itsoperating efficiency.
Approximately 7% of the Company’s employees are covered by collective bargaining agreements. Theinability to renegotiate subsequent agreements on satisfactory terms and conditions could result in workinterruptions or stoppages, which could have a material impact on the profitability of the Company. Also, theterms and conditions of existing or renegotiated agreements could increase costs, or otherwise affect theCompany’s ability to fully implement operational changes to improve overall efficiency. One collectivebargaining agreement covering approximately .4% of the Company’s employees expired during 2012 and theCompany entered into a new agreement in 2012. Two collective bargaining agreements covering approximately.7% of the Company’s employees will expire during 2013.
The Company’s ability to change distribution methods and business practices could be negatively affectedby United States Coca-Cola bottler system disputes.
Litigation filed by some United States bottlers of Coca-Cola products indicates that disagreements may existwithin the Coca-Cola bottler system concerning distribution methods and business practices. Although thelitigation has been resolved, disagreements among various Coca-Cola bottlers could adversely affect theCompany’s ability to fully implement its business plans in the future.
Management’s use of estimates and assumptions could have a material effect on reported results.
The Company’s consolidated financial statements and accompanying notes to the consolidated financialstatements include estimates and assumptions by management that impact reported amounts. Actual results couldmaterially differ from those estimates.
Changes in accounting standards could affect the Company’s reported financial results.
New accounting standards or pronouncements that may become applicable to the Company from time totime, or changes in the interpretation of existing standards and pronouncements could have a significant effect onthe Company’s reported results for the affected periods.
Obesity and other health concerns may reduce demand for some of the Company’s products.
Consumers, public health officials, public health advocates and government officials are becomingincreasingly concerned about the public health consequences associated with obesity, particularly among youngpeople. In February 2013, a group of public health officials and health advocates submitted a petition to the FDArequesting that agency to regulate the amount of caloric sweeteners in sparkling and other beverages. The FDAhas not responded to the petition. In addition, some researchers, health advocates and dietary guidelines areencouraging consumers to reduce the consumption of sugar, including sugar sparkling beverages. Increasingpublic concern about these issues; possible new taxes and governmental regulations concerning the production,marketing, labeling or availability of the Company’s beverages; and negative publicity resulting from actual orthreatened legal actions against the Company or other companies in the same industry relating to the marketing,
17
labeling or sale of sugar sparkling beverages may reduce demand for these beverages, which could adverselyaffect the Company’s profitability.
The Company has experienced public policy challenges regarding the sale of soft drinks in schools,particularly elementary, middle and high schools.
A number of states have regulations restricting the sale of soft drinks and other foods in schools. Many ofthese restrictions have existed for several years in connection with subsidized meal programs in schools. Thefocus has more recently turned to the growing health, nutrition and obesity concerns of today’s youth. The impactof restrictive legislation, if widely enacted, could have an adverse impact on the Company’s products, image andreputation.
The concentration of the Company’s capital stock ownership with the Harrison family limits otherstockholders’ ability to influence corporate matters.
Members of the Harrison family, including the Company’s Chairman and Chief Executive Officer,J. Frank Harrison, III, beneficially own shares of Common Stock and Class B Common Stock representingapproximately 85% of the total voting power of the Company’s outstanding capital stock. In addition, threemembers of the Harrison family, including Mr. Harrison, III, serve on the Board of Directors of the Company. Asa result, members of the Harrison family have the ability to exert substantial influence or actual control over theCompany’s management and affairs and over substantially all matters requiring action by the Company’sstockholders. Additionally, as a result of the Harrison family’s significant beneficial ownership of the Company’soutstanding voting stock, the Company has relied on the “controlled company” exemption from certain corporategovernance requirements of The NASDAQ Stock Market LLC. This concentration of ownership may have theeffect of delaying or preventing a change in control otherwise favored by the Company’s other stockholders andcould depress the stock price. It also limits other stockholders’ ability to influence corporate matters and, as aresult, the Company may take actions that the Company’s other stockholders may not view as beneficial.
Item 1B. Unresolved Staff Comments
None.
Item 2. Properties
The principal properties of the Company include its corporate headquarters, four production/distributionfacilities and 41 sales distribution centers. The Company owns two production/distribution facilities and 33 salesdistribution centers, and leases its corporate headquarters, two production/distribution facilities, 8 salesdistribution centers and 3 additional storage warehouses.
The Company leases its 110,000 square foot corporate headquarters and a 65,000 square foot adjacent officebuilding from a related party. The lease has a fifteen-year term and expires in December 2021. Rental paymentsfor these facilities were $4.0 million in 2012.
The Company leases its 542,000 square foot Snyder Production Center and an adjacent 105,000 square footdistribution center in Charlotte, North Carolina from a related party pursuant to a lease with a ten-year termwhich expires in December 2020. Rental payments under this lease totaled $3.5 million in 2012.
The Company leases its 330,000 square foot production/distribution facility in Nashville, Tennessee. The leaserequires monthly payments through December 2014. Rental payments under this lease totaled $.5 million in 2012.
The Company leases a 278,000 square foot warehouse which serves as additional space for its Charlotte,North Carolina distribution center. The lease requires monthly payments through July 2022. Rental paymentsunder this lease totaled $.7 million in 2012.
The Company leases a 220,000 square foot sales distribution center in Lavergne, Tennessee. In the firstquarter of 2011, a new lease replaced the existing lease. The new lease requires monthly payments through 2026,but did not require rental payments for the first eleven months of the lease. Rental payments under the lease were$.6 million in 2012.
18
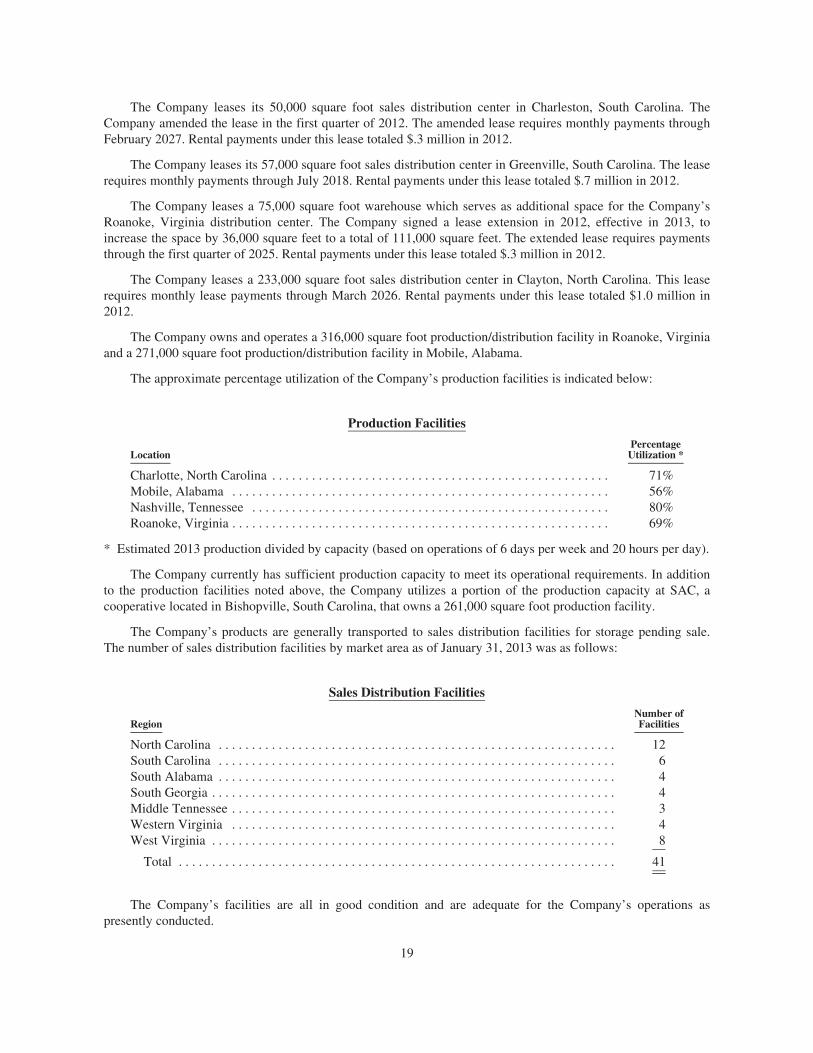
The Company leases its 50,000 square foot sales distribution center in Charleston, South Carolina. TheCompany amended the lease in the first quarter of 2012. The amended lease requires monthly payments throughFebruary 2027. Rental payments under this lease totaled $.3 million in 2012.
The Company leases its 57,000 square foot sales distribution center in Greenville, South Carolina. The leaserequires monthly payments through July 2018. Rental payments under this lease totaled $.7 million in 2012.
The Company leases a 75,000 square foot warehouse which serves as additional space for the Company’sRoanoke, Virginia distribution center. The Company signed a lease extension in 2012, effective in 2013, toincrease the space by 36,000 square feet to a total of 111,000 square feet. The extended lease requires paymentsthrough the first quarter of 2025. Rental payments under this lease totaled $.3 million in 2012.
The Company leases a 233,000 square foot sales distribution center in Clayton, North Carolina. This leaserequires monthly lease payments through March 2026. Rental payments under this lease totaled $1.0 million in2012.
The Company owns and operates a 316,000 square foot production/distribution facility in Roanoke, Virginiaand a 271,000 square foot production/distribution facility in Mobile, Alabama.
The approximate percentage utilization of the Company’s production facilities is indicated below:
Production Facilities
LocationPercentage
Utilization *
Charlotte, North Carolina . . . . . . . . . . . . . . . . . . . . . . . . . . . . . . . . . . . . . . . . . . . . . . . . . . . 71%Mobile, Alabama . . . . . . . . . . . . . . . . . . . . . . . . . . . . . . . . . . . . . . . . . . . . . . . . . . . . . . . . . 56%Nashville, Tennessee . . . . . . . . . . . . . . . . . . . . . . . . . . . . . . . . . . . . . . . . . . . . . . . . . . . . . . 80%Roanoke, Virginia . . . . . . . . . . . . . . . . . . . . . . . . . . . . . . . . . . . . . . . . . . . . . . . . . . . . . . . . . 69%
* Estimated 2013 production divided by capacity (based on operations of 6 days per week and 20 hours per day).
The Company currently has sufficient production capacity to meet its operational requirements. In additionto the production facilities noted above, the Company utilizes a portion of the production capacity at SAC, acooperative located in Bishopville, South Carolina, that owns a 261,000 square foot production facility.
The Company’s products are generally transported to sales distribution facilities for storage pending sale.The number of sales distribution facilities by market area as of January 31, 2013 was as follows:
Sales Distribution Facilities
RegionNumber ofFacilities
North Carolina . . . . . . . . . . . . . . . . . . . . . . . . . . . . . . . . . . . . . . . . . . . . . . . . . . . . . . . . . . . . 12South Carolina . . . . . . . . . . . . . . . . . . . . . . . . . . . . . . . . . . . . . . . . . . . . . . . . . . . . . . . . . . . . 6South Alabama . . . . . . . . . . . . . . . . . . . . . . . . . . . . . . . . . . . . . . . . . . . . . . . . . . . . . . . . . . . . 4South Georgia . . . . . . . . . . . . . . . . . . . . . . . . . . . . . . . . . . . . . . . . . . . . . . . . . . . . . . . . . . . . . 4Middle Tennessee . . . . . . . . . . . . . . . . . . . . . . . . . . . . . . . . . . . . . . . . . . . . . . . . . . . . . . . . . . 3Western Virginia . . . . . . . . . . . . . . . . . . . . . . . . . . . . . . . . . . . . . . . . . . . . . . . . . . . . . . . . . . 4West Virginia . . . . . . . . . . . . . . . . . . . . . . . . . . . . . . . . . . . . . . . . . . . . . . . . . . . . . . . . . . . . . 8
Total . . . . . . . . . . . . . . . . . . . . . . . . . . . . . . . . . . . . . . . . . . . . . . . . . . . . . . . . . . . . . . . . . . 41
The Company’s facilities are all in good condition and are adequate for the Company’s operations aspresently conducted.
19
The Company also operates approximately 1,900 vehicles in the sale and distribution of the Company’sbeverage products, of which approximately 1,200 are route delivery trucks. In addition, the Company ownsapproximately 187,000 beverage dispensing and vending machines for the sale of the Company’s products in theCompany’s bottling territories.
Item 3. Legal Proceedings
The Company is involved in various claims and legal proceedings which have arisen in the ordinary courseof its business. Although it is difficult to predict the ultimate outcome of these claims and legal proceedings,management believes that the ultimate disposition of these matters will not have a material adverse effect on thefinancial condition, cash flows or results of operations of the Company. No material amount of loss in excess ofrecorded amounts is believed to be reasonably possible as a result of these claims and legal proceedings.
Item 4. Mine Safety Disclosures
Not applicable.
Executive Officers of the Company
The following is a list of names and ages of all the executive officers of the Company indicating allpositions and offices with the Company held by each such person. All officers have served in their presentcapacities for the past five years except as otherwise stated.
J. FRANK HARRISON, III, age 58, is Chairman of the Board of Directors and Chief Executive Officer.Mr. Harrison, III was appointed Chairman of the Board of Directors in December 1996. Mr. Harrison, III servedas Vice Chairman from November 1987 through December 1996 and was appointed as the Company’s ChiefExecutive Officer in May 1994. He was first employed by the Company in 1977 and has served as a DivisionSales Manager and as a Vice President.
HENRY W. FLINT, age 58, is President and Chief Operating Officer, a position he has held since August2012. Previously, he was Vice Chairman of the Board of Directors of the Company, a position he held sinceApril 2007. Previously, he was Executive Vice President and Assistant to the Chairman of the Company, aposition to which he was appointed in July 2004. Prior to that, he was a Managing Partner at the law firm ofKennedy Covington Lobdell & Hickman, L.L.P. with which he was associated from 1980 to 2004.
WILLIAM B. ELMORE, age 57, is Vice Chairman of the Board of Directors, a position he has held sinceAugust 2012. Previously, he was President and Chief Operating Officer and a Director of the Company, positionshe has held since January 2001. Previously, he was Vice President, Value Chain from July 1999 and VicePresident, Business Systems from August 1998 to June 1999. He was Vice President, Treasurer from June 1996to July 1998. He was Vice President, Regional Manager for the Virginia Division, West Virginia Division andTennessee Division from August 1991 to May 1996.
WILLIAM J. BILLIARD, age 46, is Vice President, Operations Finance and Chief Accounting Officer.He was named Vice President of Operations Finance on November 1, 2010 and was appointed Chief AccountingOfficer on February 20, 2006. Previously, he was also Vice President and Corporate Controller of the Companyand was first employed by the Company on February 20, 2006. Before joining the Company, he was Senior VicePresident, Interim Chief Financial Officer and Corporate Controller of Portrait Corporation of America, Inc., aportrait photography studio company, from September 2005 to January 2006 and Senior Vice President,Corporate Controller from August 2001 to September 2005. Prior to that, he served as Vice President, ChiefFinancial Officer of Tailored Management, a long-term staffing company, from August 2000 to August 2001.Portrait Corporation of America, Inc. filed a voluntary petition for reorganization under Chapter 11 of the U.S.Bankruptcy Code in August 2006.
ROBERT G. CHAMBLESS, age 47, is Senior Vice President, Sales and Marketing, a position he has heldsince August 2010. Previously, he was Senior Vice President, Sales, a position he held since June 2008. He heldthe position of Vice President—Franchise Sales from early 2003 to June 2008 and Region Sales Manager
20
for our Southern Division between 2000 and 2003. He was Sales Manager in the Company’s Columbia, SouthCarolina branch between 1997 and 2000. He has served the Company in several other positions prior to thisposition and was first employed by the Company in 1986.
CLIFFORD M. DEAL, III, age 51, is Vice President and Treasurer, a position he has held since June1999. Previously, he was Director of Compensation and Benefits from October 1997 to May 1999. He wasCorporate Benefits Manager from December 1995 to September 1997 and was Manager of Tax Accounting fromNovember 1993 to November 1995.
NORMAN C. GEORGE, age 57, is President, BYB Brands, Inc, a wholly-owned subsidiary of theCompany that distributes and markets Tum-E Yummies and other products developed by the Company, aposition he has held since July 2006. Prior to that he was Senior Vice President, Chief Marketing and CustomerOfficer, a position he was appointed to in September 2001. Prior to that, he was Vice President, Marketing andNational Sales, a position he was appointed to in December 1999. Prior to that, he was Vice President, CorporateSales, a position he had held since August 1998. Previously, he was Vice President, Sales for the Carolinas SouthRegion, a position he held beginning in November 1991.
JAMES E. HARRIS, age 50, is Senior Vice President, Shared Services and Chief Financial Officer, aposition he has held since January 28, 2008. He served as a Director of the Company from August 2003 untilJanuary 25, 2008 and was a member of the Audit Committee and the Finance Committee. He served as ExecutiveVice President and Chief Financial Officer of MedCath Corporation, an operator of cardiovascular hospitals,from December 1999 to January 2008. From 1998 to 1999, he was Chief Financial Officer of Fresh Foods, Inc., amanufacturer of fully cooked food products. From 1987 to 1998, he served in several different officer positionswith The Shelton Companies, Inc. He also served two years with Ernst & Young LLP as a senior accountant.
DAVID L. HOPKINS, age 53, is Senior Vice President, Operations. He was named Senior Vice Presidentof Operations in May 2011. Prior to that, he was Vice President of Logistics from 2003 to 2011 and VicePresident of Operations from 1994 to 2003. He served as Vice President of Manufacturing from 1990 to 1994.His career with the Company began in 1988 as the Roanoke Plant Manager.
UMESH M. KASBEKAR, age 55, is Senior Vice President, Planning and Administration, a position he hasheld since January 1995. Prior to that, he was Vice President, Planning, a position he was appointed to inDecember 1988.
DAVID M. KATZ, age 44, is Senior Vice President, Assistant to the Chairman and Chief ExecutiveOfficer, a position he has held since January 2013. Previously, he was Senior Vice President Midwest Region forCoca-Cola Refreshments (“CCR”) a position he began in 2011. Prior to the formation of CCR, he was VicePresident, Sales Operations for Coca-Cola Enterprises Inc.’s (“CCE”) East Business Unit in 2010. In 2008 hewas promoted to President and Chief Executive Officer of Coca-Cola Bottlers’ Sales and Services Company,LLC. He began his Coca-Cola career in 1993 with CCE as a Logistics Consultant.
LAUREN C. STEELE, age 58, is Senior Vice President, Corporate Affairs, a position to which he wasappointed in March 2012. Prior to that he was Vice President of Corporate Affairs, a position he has held sinceMay 1989. He is responsible for governmental, media and community relations for the Company.
MICHAEL A. STRONG, age 59, is Senior Vice President, Human Resources, a position to which he wasappointed in March 2011. Previously, he was Vice President of Human Resources, a position to which he wasappointed in December 2009. He was Region Sales Manager for the North Carolina West Region from December2006 to November 2009. Prior to that, he served as Division Sales Manager and General Manager as well asother key sales related positions. He joined the Company in 1985 when the Company acquired Coca-ColaBottling Company in Mobile, Alabama, where he began his career.
21
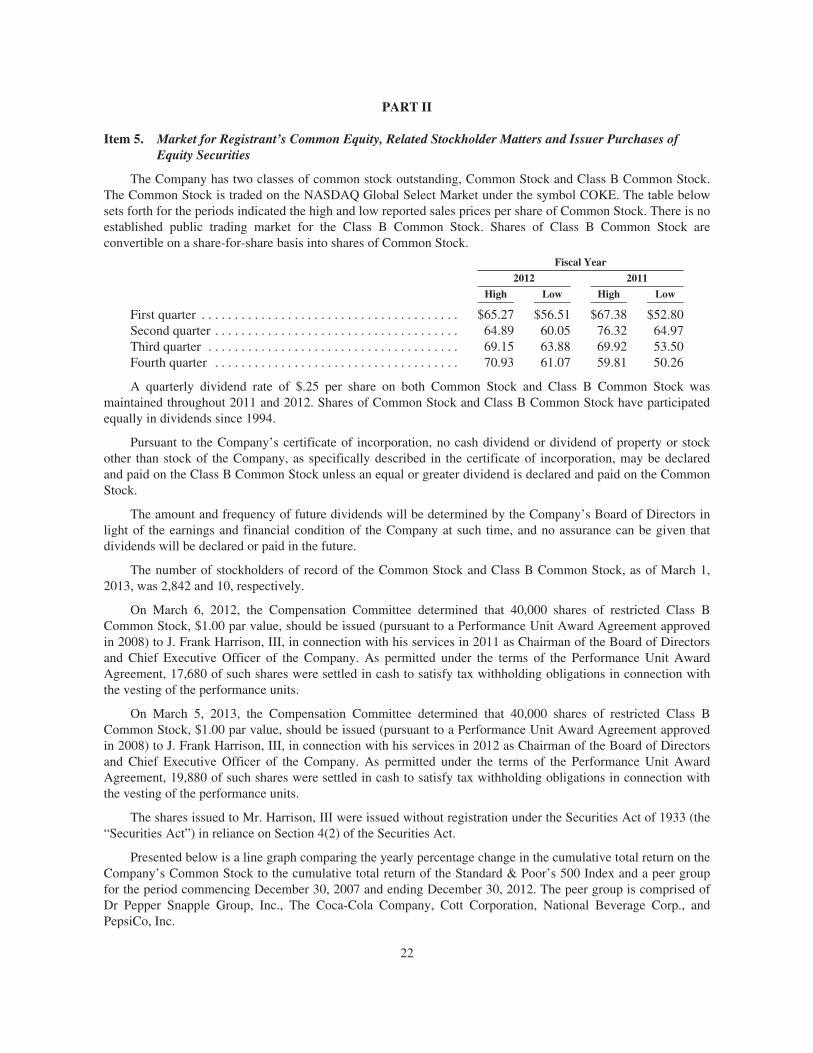
PART II
Item 5. Market for Registrant’s Common Equity, Related Stockholder Matters and Issuer Purchases ofEquity Securities
The Company has two classes of common stock outstanding, Common Stock and Class B Common Stock.The Common Stock is traded on the NASDAQ Global Select Market under the symbol COKE. The table belowsets forth for the periods indicated the high and low reported sales prices per share of Common Stock. There is noestablished public trading market for the Class B Common Stock. Shares of Class B Common Stock areconvertible on a share-for-share basis into shares of Common Stock.
Fiscal Year
2012 2011
High Low High Low
First quarter . . . . . . . . . . . . . . . . . . . . . . . . . . . . . . . . . . . . . . . $65.27 $56.51 $67.38 $52.80Second quarter . . . . . . . . . . . . . . . . . . . . . . . . . . . . . . . . . . . . . 64.89 60.05 76.32 64.97Third quarter . . . . . . . . . . . . . . . . . . . . . . . . . . . . . . . . . . . . . . 69.15 63.88 69.92 53.50Fourth quarter . . . . . . . . . . . . . . . . . . . . . . . . . . . . . . . . . . . . . 70.93 61.07 59.81 50.26
A quarterly dividend rate of $.25 per share on both Common Stock and Class B Common Stock wasmaintained throughout 2011 and 2012. Shares of Common Stock and Class B Common Stock have participatedequally in dividends since 1994.
Pursuant to the Company’s certificate of incorporation, no cash dividend or dividend of property or stockother than stock of the Company, as specifically described in the certificate of incorporation, may be declaredand paid on the Class B Common Stock unless an equal or greater dividend is declared and paid on the CommonStock.
The amount and frequency of future dividends will be determined by the Company’s Board of Directors inlight of the earnings and financial condition of the Company at such time, and no assurance can be given thatdividends will be declared or paid in the future.
The number of stockholders of record of the Common Stock and Class B Common Stock, as of March 1,2013, was 2,842 and 10, respectively.
On March 6, 2012, the Compensation Committee determined that 40,000 shares of restricted Class BCommon Stock, $1.00 par value, should be issued (pursuant to a Performance Unit Award Agreement approvedin 2008) to J. Frank Harrison, III, in connection with his services in 2011 as Chairman of the Board of Directorsand Chief Executive Officer of the Company. As permitted under the terms of the Performance Unit AwardAgreement, 17,680 of such shares were settled in cash to satisfy tax withholding obligations in connection withthe vesting of the performance units.
On March 5, 2013, the Compensation Committee determined that 40,000 shares of restricted Class BCommon Stock, $1.00 par value, should be issued (pursuant to a Performance Unit Award Agreement approvedin 2008) to J. Frank Harrison, III, in connection with his services in 2012 as Chairman of the Board of Directorsand Chief Executive Officer of the Company. As permitted under the terms of the Performance Unit AwardAgreement, 19,880 of such shares were settled in cash to satisfy tax withholding obligations in connection withthe vesting of the performance units.
The shares issued to Mr. Harrison, III were issued without registration under the Securities Act of 1933 (the“Securities Act”) in reliance on Section 4(2) of the Securities Act.
Presented below is a line graph comparing the yearly percentage change in the cumulative total return on theCompany’s Common Stock to the cumulative total return of the Standard & Poor’s 500 Index and a peer groupfor the period commencing December 30, 2007 and ending December 30, 2012. The peer group is comprised ofDr Pepper Snapple Group, Inc., The Coca-Cola Company, Cott Corporation, National Beverage Corp., andPepsiCo, Inc.
22
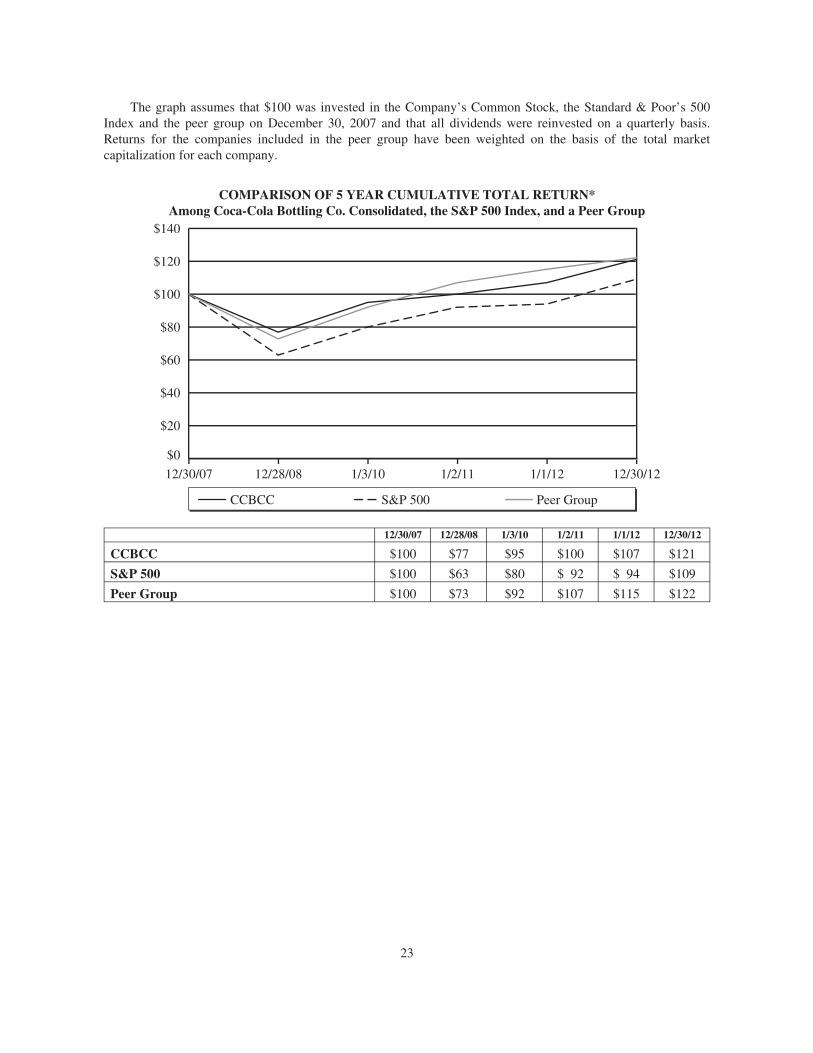
The graph assumes that $100 was invested in the Company’s Common Stock, the Standard & Poor’s 500Index and the peer group on December 30, 2007 and that all dividends were reinvested on a quarterly basis.Returns for the companies included in the peer group have been weighted on the basis of the total marketcapitalization for each company.
COMPARISON OF 5 YEAR CUMULATIVE TOTAL RETURN*Among Coca-Cola Bottling Co. Consolidated, the S&P 500 Index, and a Peer Group
12/30/121/1/121/2/111/3/1012/28/0812/30/07
CCBCC S&P 500 Peer Group
$0
$20
$40
$60
$80
$100
$120
$140
12/30/07 12/28/08 1/3/10 1/2/11 1/1/12 12/30/12
CCBCC $100 $77 $95 $100 $107 $121
S&P 500 $100 $63 $80 $ 92 $ 94 $109
Peer Group $100 $73 $92 $107 $115 $122
23
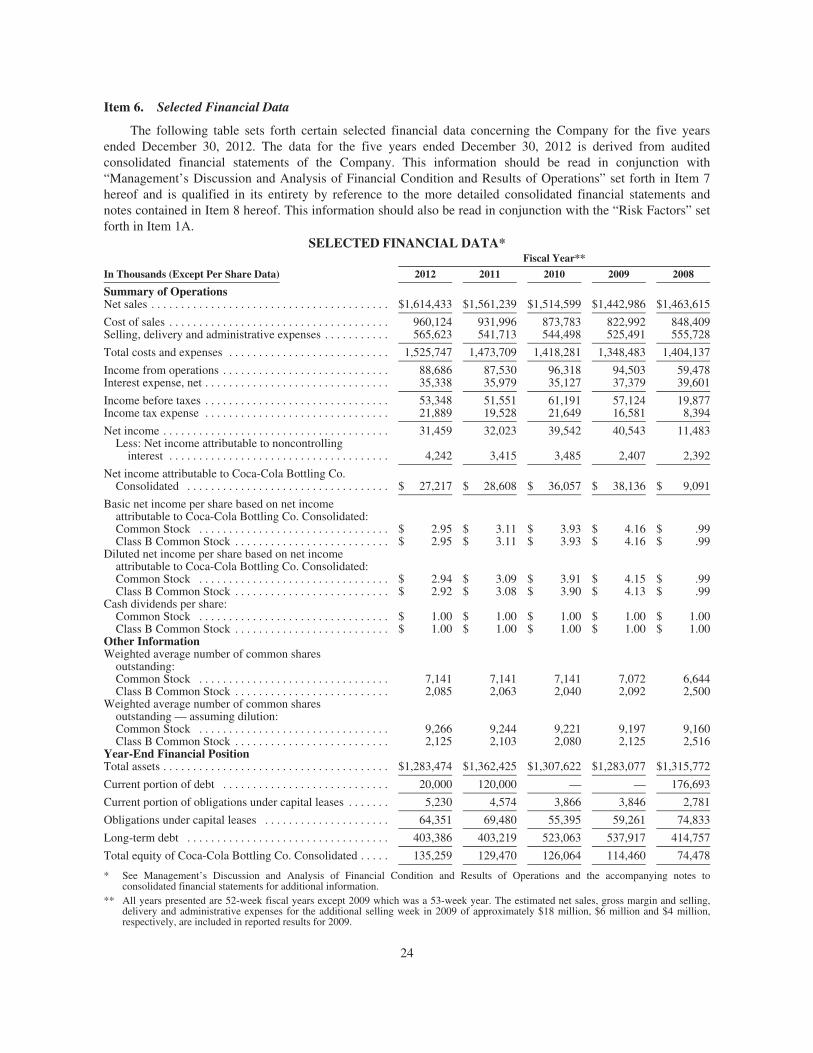
Item 6. Selected Financial Data
The following table sets forth certain selected financial data concerning the Company for the five yearsended December 30, 2012. The data for the five years ended December 30, 2012 is derived from auditedconsolidated financial statements of the Company. This information should be read in conjunction with“Management’s Discussion and Analysis of Financial Condition and Results of Operations” set forth in Item 7hereof and is qualified in its entirety by reference to the more detailed consolidated financial statements andnotes contained in Item 8 hereof. This information should also be read in conjunction with the “Risk Factors” setforth in Item 1A.
SELECTED FINANCIAL DATA*Fiscal Year**
In Thousands (Except Per Share Data) 2012 2011 2010 2009 2008
Summary of OperationsNet sales . . . . . . . . . . . . . . . . . . . . . . . . . . . . . . . . . . . . . . . . $1,614,433 $1,561,239 $1,514,599 $1,442,986 $1,463,615
Cost of sales . . . . . . . . . . . . . . . . . . . . . . . . . . . . . . . . . . . . . 960,124 931,996 873,783 822,992 848,409Selling, delivery and administrative expenses . . . . . . . . . . . 565,623 541,713 544,498 525,491 555,728
Total costs and expenses . . . . . . . . . . . . . . . . . . . . . . . . . . . 1,525,747 1,473,709 1,418,281 1,348,483 1,404,137
Income from operations . . . . . . . . . . . . . . . . . . . . . . . . . . . . 88,686 87,530 96,318 94,503 59,478Interest expense, net . . . . . . . . . . . . . . . . . . . . . . . . . . . . . . . 35,338 35,979 35,127 37,379 39,601
Income before taxes . . . . . . . . . . . . . . . . . . . . . . . . . . . . . . . 53,348 51,551 61,191 57,124 19,877Income tax expense . . . . . . . . . . . . . . . . . . . . . . . . . . . . . . . 21,889 19,528 21,649 16,581 8,394
Net income . . . . . . . . . . . . . . . . . . . . . . . . . . . . . . . . . . . . . . 31,459 32,023 39,542 40,543 11,483Less: Net income attributable to noncontrolling
interest . . . . . . . . . . . . . . . . . . . . . . . . . . . . . . . . . . . . . 4,242 3,415 3,485 2,407 2,392
Net income attributable to Coca-Cola Bottling Co.Consolidated . . . . . . . . . . . . . . . . . . . . . . . . . . . . . . . . . . $ 27,217 $ 28,608 $ 36,057 $ 38,136 $ 9,091
Basic net income per share based on net incomeattributable to Coca-Cola Bottling Co. Consolidated:Common Stock . . . . . . . . . . . . . . . . . . . . . . . . . . . . . . . . $ 2.95 $ 3.11 $ 3.93 $ 4.16 $ .99Class B Common Stock . . . . . . . . . . . . . . . . . . . . . . . . . . $ 2.95 $ 3.11 $ 3.93 $ 4.16 $ .99
Diluted net income per share based on net incomeattributable to Coca-Cola Bottling Co. Consolidated:Common Stock . . . . . . . . . . . . . . . . . . . . . . . . . . . . . . . . $ 2.94 $ 3.09 $ 3.91 $ 4.15 $ .99Class B Common Stock . . . . . . . . . . . . . . . . . . . . . . . . . . $ 2.92 $ 3.08 $ 3.90 $ 4.13 $ .99
Cash dividends per share:Common Stock . . . . . . . . . . . . . . . . . . . . . . . . . . . . . . . . $ 1.00 $ 1.00 $ 1.00 $ 1.00 $ 1.00Class B Common Stock . . . . . . . . . . . . . . . . . . . . . . . . . . $ 1.00 $ 1.00 $ 1.00 $ 1.00 $ 1.00
Other InformationWeighted average number of common shares
outstanding:Common Stock . . . . . . . . . . . . . . . . . . . . . . . . . . . . . . . . 7,141 7,141 7,141 7,072 6,644Class B Common Stock . . . . . . . . . . . . . . . . . . . . . . . . . . 2,085 2,063 2,040 2,092 2,500
Weighted average number of common sharesoutstanding — assuming dilution:Common Stock . . . . . . . . . . . . . . . . . . . . . . . . . . . . . . . . 9,266 9,244 9,221 9,197 9,160Class B Common Stock . . . . . . . . . . . . . . . . . . . . . . . . . . 2,125 2,103 2,080 2,125 2,516
Year-End Financial PositionTotal assets . . . . . . . . . . . . . . . . . . . . . . . . . . . . . . . . . . . . . . $1,283,474 $1,362,425 $1,307,622 $1,283,077 $1,315,772
Current portion of debt . . . . . . . . . . . . . . . . . . . . . . . . . . . . 20,000 120,000 — — 176,693
Current portion of obligations under capital leases . . . . . . . 5,230 4,574 3,866 3,846 2,781
Obligations under capital leases . . . . . . . . . . . . . . . . . . . . . 64,351 69,480 55,395 59,261 74,833
Long-term debt . . . . . . . . . . . . . . . . . . . . . . . . . . . . . . . . . . 403,386 403,219 523,063 537,917 414,757
Total equity of Coca-Cola Bottling Co. Consolidated . . . . . 135,259 129,470 126,064 114,460 74,478
* See Management’s Discussion and Analysis of Financial Condition and Results of Operations and the accompanying notes toconsolidated financial statements for additional information.
** All years presented are 52-week fiscal years except 2009 which was a 53-week year. The estimated net sales, gross margin and selling,delivery and administrative expenses for the additional selling week in 2009 of approximately $18 million, $6 million and $4 million,respectively, are included in reported results for 2009.
24
Item 7. Management’s Discussion and Analysis of Financial Condition and Results of Operations
Revision of Prior Period Financial Statements
During the fourth quarter of 2012, Coca-Cola Bottling Co. Consolidated (“the Company”) identified anerror in the treatment of a certain prior year deferred tax asset in the Consolidated Balance Sheets. This resultedin an understatement of the net noncurrent deferred income tax liability and an overstatement of retainedearnings, and therefore equity, for each of the impacted periods. This error affected the Consolidated BalanceSheets and Consolidated Statements of Changes in Stockholders’ Equity as presented in each of the quarters of2012, 2011 and 2010, including the year-end consolidated financial statements for 2011 and 2010. The Companyhas revised prior period financial statements to correct this immaterial error. Refer to Note 1 SignificantAccounting Policies — Revision of Prior Period Financial Statements for further details. This revision did notaffect the Company’s Consolidated Statements of Operations or Consolidated Statements of Cash Flows for anyof these periods. The discussion and analysis included herein is based on the financial results (and revisedConsolidated Balance Sheets and Consolidated Statements of Changes in Stockholders’ Equity) for the yearsended December 30, 2012, January 1, 2012 and January 2, 2011.
The following Management’s Discussion and Analysis of Financial Condition and Results of Operations(“M,D&A”) of Coca-Cola Bottling Co. Consolidated (the “Company”) should be read in conjunction with theconsolidated financial statements of the Company and the accompanying notes to the consolidated financialstatements. M,D&A includes the following sections:
• Our Business and the Nonalcoholic Beverage Industry — a general description of the Company’sbusiness and the nonalcoholic beverage industry.
• Areas of Emphasis — a summary of the Company’s key priorities.
• Overview of Operations and Financial Condition — a summary of key information and trends concerningthe financial results for the three years ended 2012.
• Discussion of Critical Accounting Policies, Estimates and New Accounting Pronouncements — adiscussion of accounting policies that are most important to the portrayal of the Company’s financialcondition and results of operations and that require critical judgments and estimates and the expectedimpact of new accounting pronouncements.
• Results of Operations — an analysis of the Company’s results of operations for the three years presentedin the consolidated financial statements.
• Financial Condition — an analysis of the Company’s financial condition as of the end of the last twoyears as presented in the consolidated financial statements.
• Liquidity and Capital Resources — an analysis of capital resources, cash sources and uses, investingactivities, financing activities, off-balance sheet arrangements, aggregate contractual obligations andhedging activities.
• Cautionary Information Regarding Forward-Looking Statements.
The fiscal years presented are the 52-week periods ended December 30, 2012 (“2012”), January 1, 2012(“2011”) and January 2, 2011 (“2010”). The Company’s fiscal year ends on the Sunday closest to December 31of each year.
The consolidated financial statements include the consolidated operations of the Company and its majority-owned subsidiaries including Piedmont Coca-Cola Bottling Partnership (“Piedmont”). Noncontrolling interestprimarily consists of The Coca-Cola Company’s interest in Piedmont, which was 22.7% for all periods presented.
Piedmont is the Company’s only significant subsidiary that has a noncontrolling interest. Noncontrollinginterest income of $4.2 million in 2012, $3.4 million in 2011 and $3.5 million in 2010 are included in net incomeon the Company’s consolidated statements of operations. In addition, the amount of consolidated net incomeattributable to both the Company and noncontrolling interest are shown on the Company’s consolidated
25
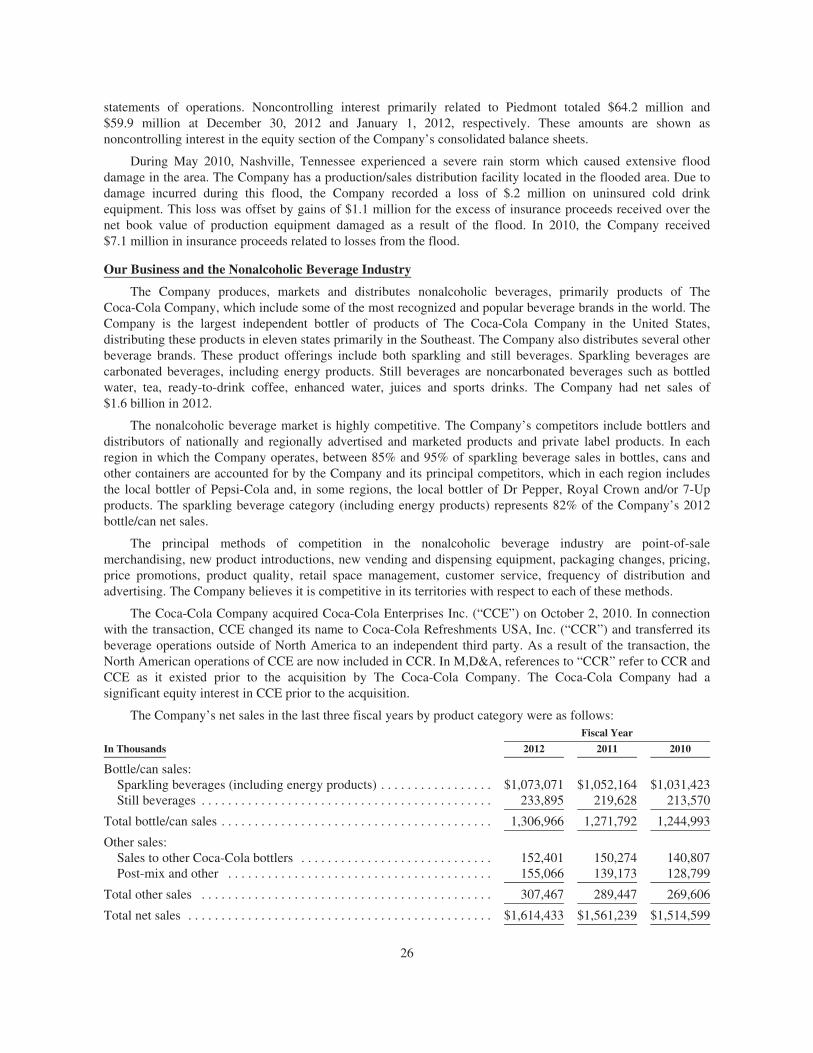
statements of operations. Noncontrolling interest primarily related to Piedmont totaled $64.2 million and$59.9 million at December 30, 2012 and January 1, 2012, respectively. These amounts are shown asnoncontrolling interest in the equity section of the Company’s consolidated balance sheets.
During May 2010, Nashville, Tennessee experienced a severe rain storm which caused extensive flooddamage in the area. The Company has a production/sales distribution facility located in the flooded area. Due todamage incurred during this flood, the Company recorded a loss of $.2 million on uninsured cold drinkequipment. This loss was offset by gains of $1.1 million for the excess of insurance proceeds received over thenet book value of production equipment damaged as a result of the flood. In 2010, the Company received$7.1 million in insurance proceeds related to losses from the flood.
Our Business and the Nonalcoholic Beverage Industry
The Company produces, markets and distributes nonalcoholic beverages, primarily products of TheCoca-Cola Company, which include some of the most recognized and popular beverage brands in the world. TheCompany is the largest independent bottler of products of The Coca-Cola Company in the United States,distributing these products in eleven states primarily in the Southeast. The Company also distributes several otherbeverage brands. These product offerings include both sparkling and still beverages. Sparkling beverages arecarbonated beverages, including energy products. Still beverages are noncarbonated beverages such as bottledwater, tea, ready-to-drink coffee, enhanced water, juices and sports drinks. The Company had net sales of$1.6 billion in 2012.
The nonalcoholic beverage market is highly competitive. The Company’s competitors include bottlers anddistributors of nationally and regionally advertised and marketed products and private label products. In eachregion in which the Company operates, between 85% and 95% of sparkling beverage sales in bottles, cans andother containers are accounted for by the Company and its principal competitors, which in each region includesthe local bottler of Pepsi-Cola and, in some regions, the local bottler of Dr Pepper, Royal Crown and/or 7-Upproducts. The sparkling beverage category (including energy products) represents 82% of the Company’s 2012bottle/can net sales.
The principal methods of competition in the nonalcoholic beverage industry are point-of-salemerchandising, new product introductions, new vending and dispensing equipment, packaging changes, pricing,price promotions, product quality, retail space management, customer service, frequency of distribution andadvertising. The Company believes it is competitive in its territories with respect to each of these methods.
The Coca-Cola Company acquired Coca-Cola Enterprises Inc. (“CCE”) on October 2, 2010. In connectionwith the transaction, CCE changed its name to Coca-Cola Refreshments USA, Inc. (“CCR”) and transferred itsbeverage operations outside of North America to an independent third party. As a result of the transaction, theNorth American operations of CCE are now included in CCR. In M,D&A, references to “CCR” refer to CCR andCCE as it existed prior to the acquisition by The Coca-Cola Company. The Coca-Cola Company had asignificant equity interest in CCE prior to the acquisition.
The Company’s net sales in the last three fiscal years by product category were as follows:Fiscal Year
In Thousands 2012 2011 2010
Bottle/can sales:Sparkling beverages (including energy products) . . . . . . . . . . . . . . . . . $1,073,071 $1,052,164 $1,031,423Still beverages . . . . . . . . . . . . . . . . . . . . . . . . . . . . . . . . . . . . . . . . . . . . 233,895 219,628 213,570
Total bottle/can sales . . . . . . . . . . . . . . . . . . . . . . . . . . . . . . . . . . . . . . . . . 1,306,966 1,271,792 1,244,993
Other sales:Sales to other Coca-Cola bottlers . . . . . . . . . . . . . . . . . . . . . . . . . . . . . 152,401 150,274 140,807Post-mix and other . . . . . . . . . . . . . . . . . . . . . . . . . . . . . . . . . . . . . . . . 155,066 139,173 128,799
Total other sales . . . . . . . . . . . . . . . . . . . . . . . . . . . . . . . . . . . . . . . . . . . . 307,467 289,447 269,606
Total net sales . . . . . . . . . . . . . . . . . . . . . . . . . . . . . . . . . . . . . . . . . . . . . . $1,614,433 $1,561,239 $1,514,599
26
Areas of Emphasis
Key priorities for the Company include revenue management, product innovation and beverage portfolioexpansion, distribution cost management, and productivity.
Revenue Management
Revenue management requires a strategy which reflects consideration for pricing of brands and packageswithin product categories and channels, highly effective working relationships with customers and disciplinedfact-based decision-making. Revenue management has been and continues to be a key driver which has asignificant impact on the Company’s results of operations.
Product Innovation and Beverage Portfolio Expansion
Innovation of both new brands and packages has been and will continue to be critical to the Company’soverall revenue. New packaging introductions include the 1.25-liter bottle in 2011, 7.5-ounce sleek can in 2010and the 2-liter contour bottle for Coca-Cola products during 2009.
The Company has invested in its own brand portfolio with products such as Tum-E Yummies, a vitamin Cenhanced flavored drink, Country Breeze tea and Fuel in a Bottle power shots. These brands enable the Companyto participate in strong growth categories and capitalize on distribution channels that include the Company’straditional Coca-Cola franchise territory as well as third party distributors outside the Company’s traditionalCoca-Cola franchise territory. While the growth prospects of Company-owned or exclusively licensed brandsappear promising, the cost of developing, marketing and distributing these brands is anticipated to be significantas well.
Distribution Cost Management
Distribution costs represent the costs of transporting finished goods from Company locations to customeroutlets. Total distribution costs amounted to $200.0 million, $191.9 million and $187.2 million in 2012, 2011 and2010, respectively. Over the past several years, the Company has focused on converting its distribution systemfrom a conventional routing system to a predictive system. This conversion to a predictive system has allowedthe Company to more efficiently handle increasing numbers of products. In addition, the Company has closed anumber of smaller sales distribution centers reducing its fixed warehouse-related costs.
The Company has three primary delivery systems for its current business:
• bulk delivery for large supermarkets, mass merchandisers and club stores;
• advanced sale delivery for convenience stores, drug stores, small supermarkets and on-premises accounts;and
• full service delivery for its full service vending customers.
Distribution cost management will continue to be a key area of emphasis for the Company.
Productivity
A key driver in the Company’s selling, delivery and administrative (“S,D&A”) expense management relatesto ongoing improvements in labor productivity and asset productivity.
Overview of Operations and Financial Condition
The following items affect the comparability of the financial results presented below:
2012
• a $.5 million pre-tax favorable mark-to-market adjustment to cost of sales related to the Company’s 2013commodity hedging program; and
• a $1.5 million debit to income tax expense to increase the valuation allowance for certain deferred taxassets of the Company.
27
2011
• a $6.7 million pre-tax unfavorable mark-to-market adjustment to cost of sales related to the Company’s2011 commodity hedging program;
• a $.2 million pre-tax unfavorable mark-to-market adjustment to S,D&A expenses related to theCompany’s 2011 commodity hedging program; and
• a $.9 million credit to income tax expense related to the reduction of the liability for uncertain taxpositions in 2011 due mainly to the expiration of applicable statute of limitations.
2010
• a $3.8 million pre-tax unfavorable mark-to-market adjustment to cost of sales related to the Company’s2010 and 2011 commodity hedging program;
• a $.9 million pre-tax favorable adjustment to cost of sales related to the gain on the replacement of flooddamaged production equipment;
• a $1.4 million pre-tax unfavorable mark-to-market adjustment to S,D&A expenses related to theCompany’s 2010 commodity hedging program;
• a $3.7 million pre-tax unfavorable adjustment to S,D&A expenses related to the impairment/accelerateddepreciation of property, plant and equipment;
• a $.5 million unfavorable adjustment to income tax expense related to the elimination of the deductionrelated to the Medicare Part D subsidy; and
• a $1.7 million credit to income tax expense related to the reduction of the liability for uncertain taxpositions in 2010 due mainly to the expiration of applicable statute of limitations.
The following overview is a summary of key information concerning the Company’s financial results for2012 compared to 2011 and 2010.
Fiscal Year
In Thousands (Except Per Share Data) 2012 2011 2010
Net sales . . . . . . . . . . . . . . . . . . . . . . . . . . . . . . . . . . . . . . . $1,614,433 $1,561,239 $1,514,599Cost of sales . . . . . . . . . . . . . . . . . . . . . . . . . . . . . . . . . . . . 960,124 931,996 873,783Gross margin . . . . . . . . . . . . . . . . . . . . . . . . . . . . . . . . . . . . 654,309 629,243 640,816S,D&A expenses . . . . . . . . . . . . . . . . . . . . . . . . . . . . . . . . . 565,623 541,713 544,498Income from operations . . . . . . . . . . . . . . . . . . . . . . . . . . . 88,686 87,530 96,318Interest expense, net . . . . . . . . . . . . . . . . . . . . . . . . . . . . . . 35,338 35,979 35,127Income before taxes . . . . . . . . . . . . . . . . . . . . . . . . . . . . . . 53,348 51,551 61,191Income tax expense . . . . . . . . . . . . . . . . . . . . . . . . . . . . . . . 21,889 19,528 21,649Net income . . . . . . . . . . . . . . . . . . . . . . . . . . . . . . . . . . . . . 31,459 32,023 39,542Net income attributable to the Company . . . . . . . . . . . . . . 27,217 28,608 36,057Basic net income per share:
Common Stock . . . . . . . . . . . . . . . . . . . . . . . . . . . . . . . . $ 2.95 $ 3.11 $ 3.93Class B Common Stock . . . . . . . . . . . . . . . . . . . . . . . . . . $ 2.95 $ 3.11 $ 3.93
Diluted net income per share:Common Stock . . . . . . . . . . . . . . . . . . . . . . . . . . . . . . . . $ 2.94 $ 3.09 $ 3.91Class B Common Stock . . . . . . . . . . . . . . . . . . . . . . . . . . $ 2.92 $ 3.08 $ 3.90
The Company’s net sales grew 6.6% from 2010 to 2012. The net sales increase was primarily due to anincrease in bottle/can sales price per unit and in bottle/can volume. Bottle/can sales price per unit increased 3.6%primarily due to a per unit increase in sparkling beverages except energy products. Bottle/can volume increasedby 1.3% primarily due to a 15.7% increase in still beverages partially offset by a 1.2% decrease in sparklingbeverages.
28
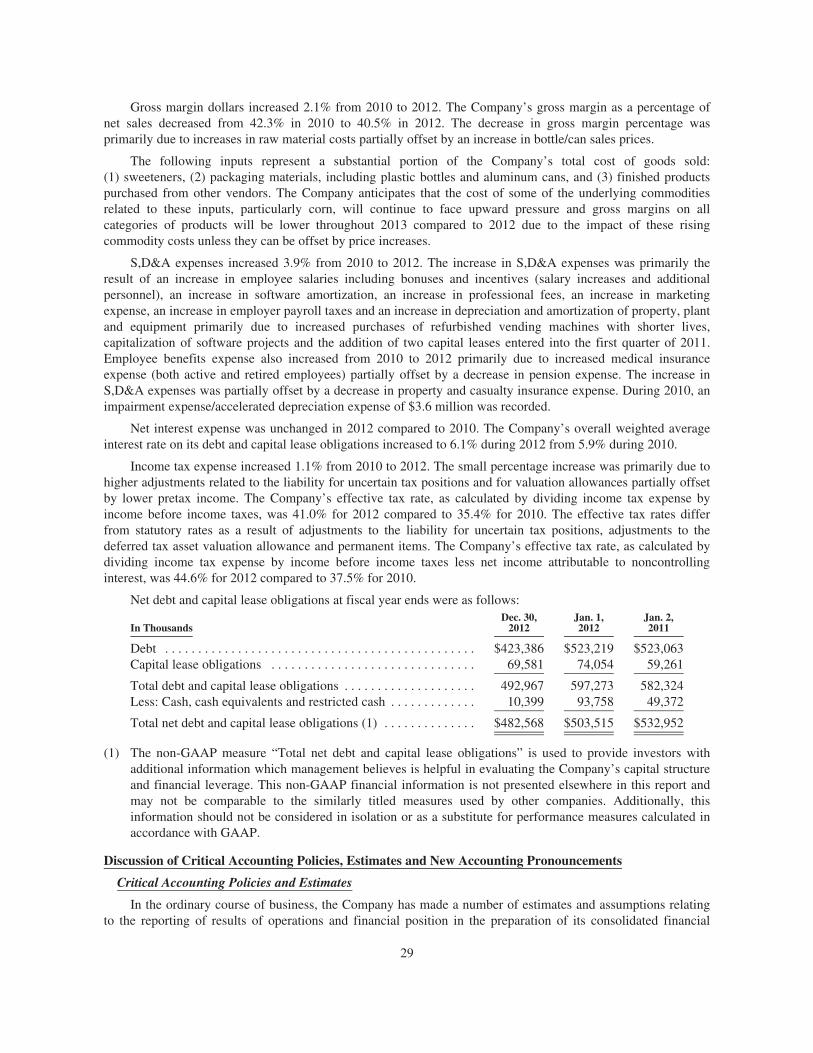
Gross margin dollars increased 2.1% from 2010 to 2012. The Company’s gross margin as a percentage ofnet sales decreased from 42.3% in 2010 to 40.5% in 2012. The decrease in gross margin percentage wasprimarily due to increases in raw material costs partially offset by an increase in bottle/can sales prices.
The following inputs represent a substantial portion of the Company’s total cost of goods sold:(1) sweeteners, (2) packaging materials, including plastic bottles and aluminum cans, and (3) finished productspurchased from other vendors. The Company anticipates that the cost of some of the underlying commoditiesrelated to these inputs, particularly corn, will continue to face upward pressure and gross margins on allcategories of products will be lower throughout 2013 compared to 2012 due to the impact of these risingcommodity costs unless they can be offset by price increases.
S,D&A expenses increased 3.9% from 2010 to 2012. The increase in S,D&A expenses was primarily theresult of an increase in employee salaries including bonuses and incentives (salary increases and additionalpersonnel), an increase in software amortization, an increase in professional fees, an increase in marketingexpense, an increase in employer payroll taxes and an increase in depreciation and amortization of property, plantand equipment primarily due to increased purchases of refurbished vending machines with shorter lives,capitalization of software projects and the addition of two capital leases entered into the first quarter of 2011.Employee benefits expense also increased from 2010 to 2012 primarily due to increased medical insuranceexpense (both active and retired employees) partially offset by a decrease in pension expense. The increase inS,D&A expenses was partially offset by a decrease in property and casualty insurance expense. During 2010, animpairment expense/accelerated depreciation expense of $3.6 million was recorded.
Net interest expense was unchanged in 2012 compared to 2010. The Company’s overall weighted averageinterest rate on its debt and capital lease obligations increased to 6.1% during 2012 from 5.9% during 2010.
Income tax expense increased 1.1% from 2010 to 2012. The small percentage increase was primarily due tohigher adjustments related to the liability for uncertain tax positions and for valuation allowances partially offsetby lower pretax income. The Company’s effective tax rate, as calculated by dividing income tax expense byincome before income taxes, was 41.0% for 2012 compared to 35.4% for 2010. The effective tax rates differfrom statutory rates as a result of adjustments to the liability for uncertain tax positions, adjustments to thedeferred tax asset valuation allowance and permanent items. The Company’s effective tax rate, as calculated bydividing income tax expense by income before income taxes less net income attributable to noncontrollinginterest, was 44.6% for 2012 compared to 37.5% for 2010.
Net debt and capital lease obligations at fiscal year ends were as follows:
In ThousandsDec. 30,
2012Jan. 1,2012
Jan. 2,2011
Debt . . . . . . . . . . . . . . . . . . . . . . . . . . . . . . . . . . . . . . . . . . . . . . . $423,386 $523,219 $523,063Capital lease obligations . . . . . . . . . . . . . . . . . . . . . . . . . . . . . . . 69,581 74,054 59,261
Total debt and capital lease obligations . . . . . . . . . . . . . . . . . . . . 492,967 597,273 582,324Less: Cash, cash equivalents and restricted cash . . . . . . . . . . . . . 10,399 93,758 49,372
Total net debt and capital lease obligations (1) . . . . . . . . . . . . . . $482,568 $503,515 $532,952
(1) The non-GAAP measure “Total net debt and capital lease obligations” is used to provide investors withadditional information which management believes is helpful in evaluating the Company’s capital structureand financial leverage. This non-GAAP financial information is not presented elsewhere in this report andmay not be comparable to the similarly titled measures used by other companies. Additionally, thisinformation should not be considered in isolation or as a substitute for performance measures calculated inaccordance with GAAP.
Discussion of Critical Accounting Policies, Estimates and New Accounting Pronouncements
Critical Accounting Policies and Estimates
In the ordinary course of business, the Company has made a number of estimates and assumptions relatingto the reporting of results of operations and financial position in the preparation of its consolidated financial
29
statements in conformity with accounting principles generally accepted in the United States of America. Actualresults could differ significantly from those estimates under different assumptions and conditions. The Companybelieves the following discussion addresses the Company’s most critical accounting policies, which are thosemost important to the portrayal of the Company’s financial condition and results of operations and requiremanagement’s most difficult, subjective and complex judgments, often as a result of the need to make estimatesabout the effect of matters that are inherently uncertain.
The Company did not make changes in any critical accounting policies during 2012. Any changes in criticalaccounting policies and estimates are discussed with the Audit Committee of the Board of Directors of theCompany during the quarter in which a change is contemplated and prior to making such change.
Allowance for Doubtful Accounts
The Company evaluates the collectibility of its trade accounts receivable based on a number of factors. Incircumstances where the Company becomes aware of a customer’s inability to meet its financial obligations tothe Company, a specific reserve for bad debts is estimated and recorded which reduces the recognized receivableto the estimated amount the Company believes will ultimately be collected. In addition to specific customeridentification of potential bad debts, bad debt charges are recorded based on the Company’s recent past losshistory and an overall assessment of past due trade accounts receivable outstanding.
The Company’s review of potential bad debts considers the specific industry in which a particular customeroperates, such as supermarket retailers, convenience stores and mass merchandise retailers, and the generaleconomic conditions that currently exist in that specific industry. The Company then considers the effects ofconcentration of credit risk in a specific industry and for specific customers within that industry.
Property, Plant and Equipment
Property, plant and equipment is recorded at cost and is depreciated on a straight-line basis over theestimated useful lives of such assets. Changes in circumstances such as technological advances, changes to theCompany’s business model or changes in the Company’s capital spending strategy could result in the actualuseful lives differing from the Company’s current estimates. Factors such as changes in the planned use ofmanufacturing equipment, cold drink dispensing equipment, transportation equipment, warehouse facilities orsoftware could also result in shortened useful lives. In those cases where the Company determines that the usefullife of property, plant and equipment should be shortened or lengthened, the Company depreciates the net bookvalue in excess of the estimated salvage value over its revised remaining useful life.
The Company evaluates the recoverability of the carrying amount of its property, plant and equipment whenevents or changes in circumstances indicate that the carrying amount of an asset or asset group may not berecoverable. These evaluations are performed at a level where independent cash flows may be attributed to eitheran asset or an asset group. If the Company determines that the carrying amount of an asset or asset group is notrecoverable based upon the expected undiscounted future cash flows of the asset or asset group, an impairmentloss is recorded equal to the excess of the carrying amounts over the estimated fair value of the long-lived assets.
During 2012, the Company performed a review of property, plant and equipment. As a result of this review,$.3 million was recorded to impairment expense for manufacturing equipment.
During 2011, the Company performed a review of property, plant and equipment and determined there wasno impairment to be recorded.
During 2010, the Company performed a review of property, plant and equipment. As a result of this review,$.9 million was recorded to impairment expense for five Company-owned sales distribution centers held-for-sale.The Company also recorded accelerated depreciation of $.5 million for certain other property, plant andequipment which was replaced in the first quarter of 2011. During 2010, the Company also determined thewarehouse operations in Sumter, South Carolina would be relocated to other facilities and recorded impairmentand accelerated depreciation of $2.2 million for the value of equipment and real estate related to the Sumter,South Carolina property.
30
Franchise Rights
The Company considers franchise rights with The Coca-Cola Company and other beverage companies to beindefinite lived because the agreements are perpetual or, when not perpetual, the Company anticipates theagreements will continue to be renewed upon expiration. The cost of renewals is minimal, and the Company hasnot had any renewals denied. The Company considers franchise rights as indefinite lived intangible assets and,therefore, does not amortize the value of such assets. Instead, franchise rights are tested at least annually forimpairment.
Impairment Testing of Franchise Rights and Goodwill
Generally accepted accounting principles (GAAP) requires testing of intangible assets with indefinite livesand goodwill for impairment at least annually. The Company conducts its annual impairment test as of the firstday of the fourth quarter of each fiscal year. The Company also reviews intangible assets with indefinite livesand goodwill for impairment if there are significant changes in business conditions that could result inimpairment. For both franchise rights and goodwill, when appropriate, the Company performs a qualitativeassessment to determine whether it is more likely than not that the fair value of the franchise rights or goodwill isbelow its carrying value.
When a quantitative analysis is considered necessary for the annual impairment analysis of franchise rights,the Company utilizes the Greenfield Method to estimate the fair value. The Greenfield Method assumes theCompany is starting new, owning only franchise rights, and makes investments required to build an operationcomparable to the Company’s current operations. The Company estimates the cash flows required to build acomparable operation and the available future cash flows from these operations. The cash flows are thendiscounted using an appropriate discount rate. The estimated fair value based upon the discounted cash flows isthen compared to the carrying value on an aggregated basis. After completing these analyses, there was noimpairment of the Company’s recorded franchise rights in 2012, 2011 or 2010. In addition to the discount rate,the estimated fair value includes a number of assumptions such as cost of investment to build a comparableoperation, projected net sales, cost of sales, operating expenses and income taxes. Changes in the assumptionsrequired to estimate the present value of the cash flows attributable to franchise rights could materially impactthe fair value estimate.
The Company has determined that it has one reporting unit for purposes of assessing goodwill for potentialimpairment. When a quantitative analysis is considered necessary for the annual impairment analysis ofgoodwill, the Company develops an estimated fair value for the reporting unit considering three differentapproaches:
• market value, using the Company’s stock price plus outstanding debt;
• discounted cash flow analysis; and
• multiple of earnings before interest, taxes, depreciation and amortization based upon relevant industrydata.
The estimated fair value of the reporting unit is then compared to its carrying amount including goodwill. Ifthe estimated fair value exceeds the carrying amount, goodwill will be considered not to be impaired and thesecond step of the GAAP impairment test is not necessary. If the carrying amount including goodwill exceeds itsestimated fair value, the second step of the impairment test is performed to measure the amount of theimpairment, if any. In the second step, a comparison is made between book value of goodwill to the implied fairvalue of goodwill. Implied fair value of goodwill is determined by comparing the fair value of the reporting unitto the book value of its net identifiable assets excluding goodwill. If the implied fair value of goodwill is belowthe book value of goodwill, an impairment loss would be recognized for the difference. Based on these analyses,there was no impairment of the Company’s recorded goodwill in 2012, 2011 or 2010. The Company does notbelieve that the reporting unit is at risk of impairment in the future. The discounted cash flow analysis includes anumber of assumptions such as weighted average cost of capital, projected sales volume, net sales, cost of salesand operating expenses. Changes in these assumptions could materially impact the fair value estimates.
31
The Company uses its overall market capitalization as part of its estimate of fair value of the reporting unitand in assessing the reasonableness of the Company’s internal estimates of fair value.
To the extent that actual and projected cash flows decline in the future, or if market conditions deterioratesignificantly, the Company may be required to perform an interim impairment analysis that could result in animpairment of franchise rights and goodwill. The Company has determined that there has not been an interimimpairment trigger since the first day of the fourth quarter of 2012 annual test date.
Income Tax Estimates
The Company records a valuation allowance to reduce the carrying value of its deferred tax assets if, basedon the weight of available evidence, it is determined that it is more likely than not that such assets will notultimately be realized. While the Company considers future taxable income and prudent and feasible tax planningstrategies in assessing the need for a valuation allowance, should the Company determine it will not be able torealize all or part of its net deferred tax assets in the future, an adjustment to the valuation allowance will becharged to income in the period in which such determination is made. A reduction in the valuation allowance andcorresponding adjustment to income may be required if the likelihood of realizing existing deferred tax assetsincreases to a more likely than not level. The Company regularly reviews the realizability of deferred tax assetsand initiates a review when significant changes in the Company’s business occur that could impact therealizability assessment.
In addition to a valuation allowance related to net operating loss carryforwards, the Company recordsliabilities for uncertain tax positions related to certain state and federal income tax positions. These liabilitiesreflect the Company’s best estimate of the ultimate income tax liability based on currently known facts andinformation. Material changes in facts or information as well as the expiration of the statute of limitations and/orsettlements with individual tax jurisdictions may result in material adjustments to these estimates in the future.The Company recorded net decreases to its liability for uncertain tax positions in 2011 and 2010 primarily as aresult of the expiration of the statute of limitations. The Company recorded a net increase to its liability foruncertain tax positions in 2012.
Revenue Recognition
Revenues are recognized when finished products are delivered to customers and both title and the risks andbenefits of ownership are transferred, price is fixed and determinable, collection is reasonably assured and, in thecase of full service vending, when cash is collected from the vending machines. Appropriate provision is madefor uncollectible accounts.
The Company receives service fees from The Coca-Cola Company related to the delivery of fountain syrupproducts to The Coca-Cola Company’s fountain customers. In addition, the Company receives service fees fromThe Coca-Cola Company related to the repair of fountain equipment owned by The Coca-Cola Company. Thefees received from The Coca-Cola Company for the delivery of fountain syrup products to their customers andthe repair of their fountain equipment are recognized as revenue when the respective services are completed.Service revenue represents approximately 1% of net sales.
The Company performs freight hauling and brokerage for third parties in addition to delivering its ownproducts. The freight charges are recognized as revenues when the delivery is complete. Freight revenue fromthird parties represents approximately 1% of net sales.
Revenues do not include sales or other taxes collected from customers.
Risk Management Programs
The Company uses various insurance structures to manage its workers’ compensation, auto liability,medical and other insurable risks. These structures consist of retentions, deductibles, limits and a diverse groupof insurers that serve to strategically transfer and mitigate the financial impact of losses. The Company usescommercial insurance for claims as a risk reduction strategy to minimize catastrophic losses. Losses are accrued
32
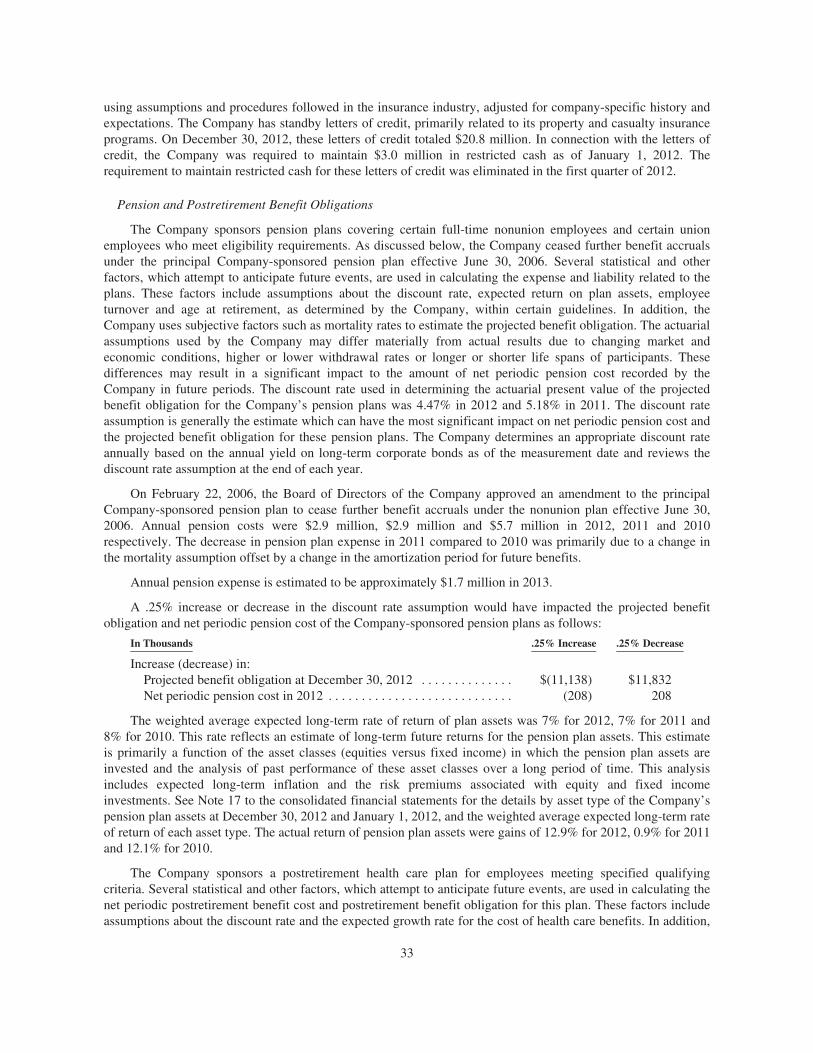
using assumptions and procedures followed in the insurance industry, adjusted for company-specific history andexpectations. The Company has standby letters of credit, primarily related to its property and casualty insuranceprograms. On December 30, 2012, these letters of credit totaled $20.8 million. In connection with the letters ofcredit, the Company was required to maintain $3.0 million in restricted cash as of January 1, 2012. Therequirement to maintain restricted cash for these letters of credit was eliminated in the first quarter of 2012.
Pension and Postretirement Benefit Obligations
The Company sponsors pension plans covering certain full-time nonunion employees and certain unionemployees who meet eligibility requirements. As discussed below, the Company ceased further benefit accrualsunder the principal Company-sponsored pension plan effective June 30, 2006. Several statistical and otherfactors, which attempt to anticipate future events, are used in calculating the expense and liability related to theplans. These factors include assumptions about the discount rate, expected return on plan assets, employeeturnover and age at retirement, as determined by the Company, within certain guidelines. In addition, theCompany uses subjective factors such as mortality rates to estimate the projected benefit obligation. The actuarialassumptions used by the Company may differ materially from actual results due to changing market andeconomic conditions, higher or lower withdrawal rates or longer or shorter life spans of participants. Thesedifferences may result in a significant impact to the amount of net periodic pension cost recorded by theCompany in future periods. The discount rate used in determining the actuarial present value of the projectedbenefit obligation for the Company’s pension plans was 4.47% in 2012 and 5.18% in 2011. The discount rateassumption is generally the estimate which can have the most significant impact on net periodic pension cost andthe projected benefit obligation for these pension plans. The Company determines an appropriate discount rateannually based on the annual yield on long-term corporate bonds as of the measurement date and reviews thediscount rate assumption at the end of each year.
On February 22, 2006, the Board of Directors of the Company approved an amendment to the principalCompany-sponsored pension plan to cease further benefit accruals under the nonunion plan effective June 30,2006. Annual pension costs were $2.9 million, $2.9 million and $5.7 million in 2012, 2011 and 2010respectively. The decrease in pension plan expense in 2011 compared to 2010 was primarily due to a change inthe mortality assumption offset by a change in the amortization period for future benefits.
Annual pension expense is estimated to be approximately $1.7 million in 2013.
A .25% increase or decrease in the discount rate assumption would have impacted the projected benefitobligation and net periodic pension cost of the Company-sponsored pension plans as follows:
In Thousands .25% Increase .25% Decrease
Increase (decrease) in:Projected benefit obligation at December 30, 2012 . . . . . . . . . . . . . . $(11,138) $11,832Net periodic pension cost in 2012 . . . . . . . . . . . . . . . . . . . . . . . . . . . . (208) 208
The weighted average expected long-term rate of return of plan assets was 7% for 2012, 7% for 2011 and8% for 2010. This rate reflects an estimate of long-term future returns for the pension plan assets. This estimateis primarily a function of the asset classes (equities versus fixed income) in which the pension plan assets areinvested and the analysis of past performance of these asset classes over a long period of time. This analysisincludes expected long-term inflation and the risk premiums associated with equity and fixed incomeinvestments. See Note 17 to the consolidated financial statements for the details by asset type of the Company’spension plan assets at December 30, 2012 and January 1, 2012, and the weighted average expected long-term rateof return of each asset type. The actual return of pension plan assets were gains of 12.9% for 2012, 0.9% for 2011and 12.1% for 2010.
The Company sponsors a postretirement health care plan for employees meeting specified qualifyingcriteria. Several statistical and other factors, which attempt to anticipate future events, are used in calculating thenet periodic postretirement benefit cost and postretirement benefit obligation for this plan. These factors includeassumptions about the discount rate and the expected growth rate for the cost of health care benefits. In addition,
33
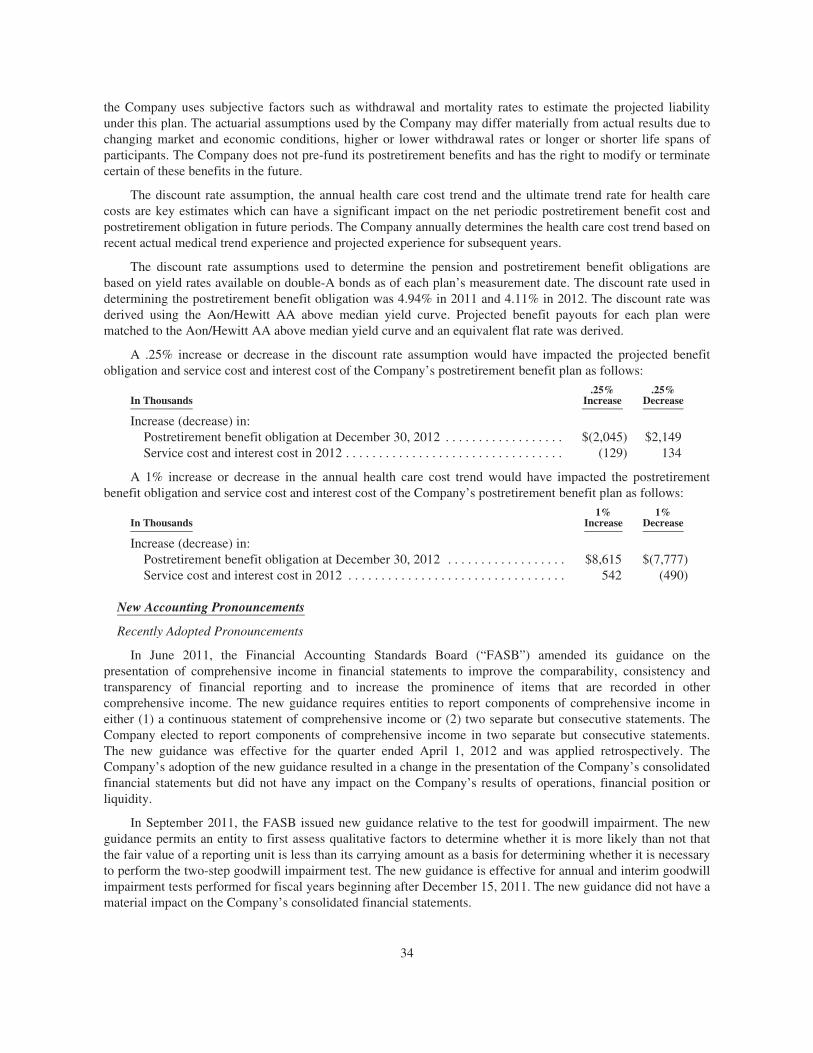
the Company uses subjective factors such as withdrawal and mortality rates to estimate the projected liabilityunder this plan. The actuarial assumptions used by the Company may differ materially from actual results due tochanging market and economic conditions, higher or lower withdrawal rates or longer or shorter life spans ofparticipants. The Company does not pre-fund its postretirement benefits and has the right to modify or terminatecertain of these benefits in the future.
The discount rate assumption, the annual health care cost trend and the ultimate trend rate for health carecosts are key estimates which can have a significant impact on the net periodic postretirement benefit cost andpostretirement obligation in future periods. The Company annually determines the health care cost trend based onrecent actual medical trend experience and projected experience for subsequent years.
The discount rate assumptions used to determine the pension and postretirement benefit obligations arebased on yield rates available on double-A bonds as of each plan’s measurement date. The discount rate used indetermining the postretirement benefit obligation was 4.94% in 2011 and 4.11% in 2012. The discount rate wasderived using the Aon/Hewitt AA above median yield curve. Projected benefit payouts for each plan werematched to the Aon/Hewitt AA above median yield curve and an equivalent flat rate was derived.
A .25% increase or decrease in the discount rate assumption would have impacted the projected benefitobligation and service cost and interest cost of the Company’s postretirement benefit plan as follows:
In Thousands.25%
Increase.25%
Decrease
Increase (decrease) in:Postretirement benefit obligation at December 30, 2012 . . . . . . . . . . . . . . . . . . $(2,045) $2,149Service cost and interest cost in 2012 . . . . . . . . . . . . . . . . . . . . . . . . . . . . . . . . . (129) 134
A 1% increase or decrease in the annual health care cost trend would have impacted the postretirementbenefit obligation and service cost and interest cost of the Company’s postretirement benefit plan as follows:
In Thousands1%
Increase1%
Decrease
Increase (decrease) in:Postretirement benefit obligation at December 30, 2012 . . . . . . . . . . . . . . . . . . $8,615 $(7,777)Service cost and interest cost in 2012 . . . . . . . . . . . . . . . . . . . . . . . . . . . . . . . . . 542 (490)
New Accounting Pronouncements
Recently Adopted Pronouncements
In June 2011, the Financial Accounting Standards Board (“FASB”) amended its guidance on thepresentation of comprehensive income in financial statements to improve the comparability, consistency andtransparency of financial reporting and to increase the prominence of items that are recorded in othercomprehensive income. The new guidance requires entities to report components of comprehensive income ineither (1) a continuous statement of comprehensive income or (2) two separate but consecutive statements. TheCompany elected to report components of comprehensive income in two separate but consecutive statements.The new guidance was effective for the quarter ended April 1, 2012 and was applied retrospectively. TheCompany’s adoption of the new guidance resulted in a change in the presentation of the Company’s consolidatedfinancial statements but did not have any impact on the Company’s results of operations, financial position orliquidity.
In September 2011, the FASB issued new guidance relative to the test for goodwill impairment. The newguidance permits an entity to first assess qualitative factors to determine whether it is more likely than not thatthe fair value of a reporting unit is less than its carrying amount as a basis for determining whether it is necessaryto perform the two-step goodwill impairment test. The new guidance is effective for annual and interim goodwillimpairment tests performed for fiscal years beginning after December 15, 2011. The new guidance did not have amaterial impact on the Company’s consolidated financial statements.
34
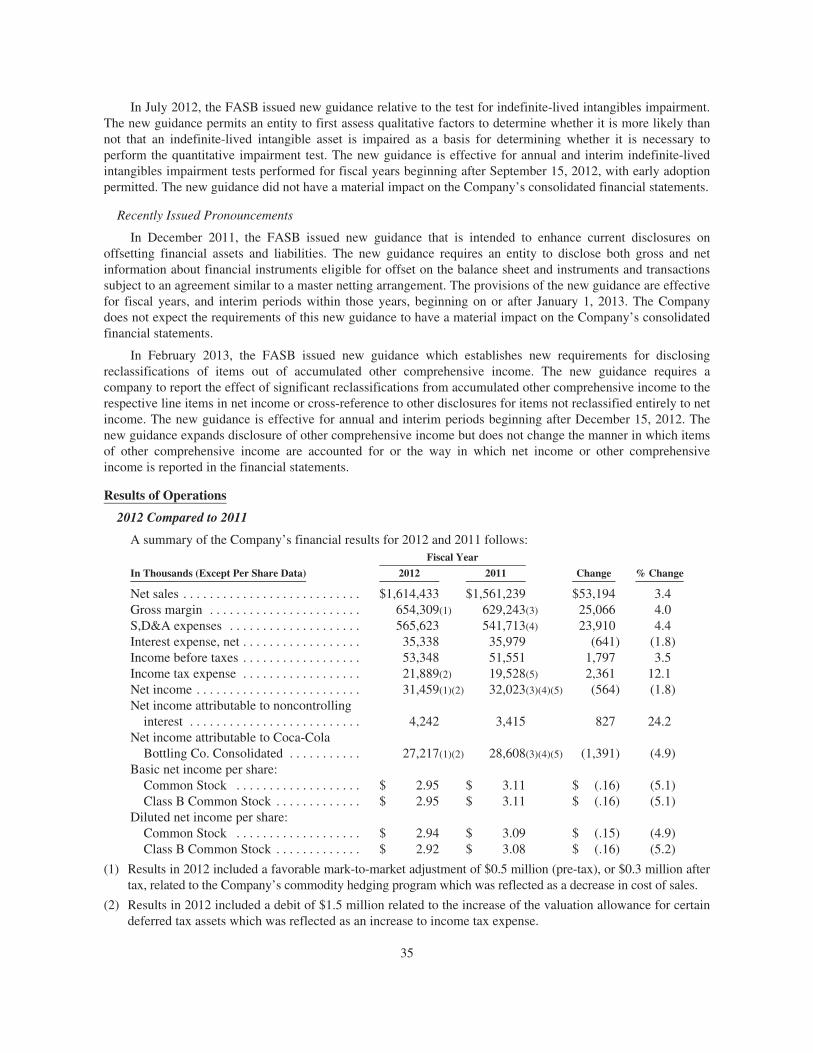
In July 2012, the FASB issued new guidance relative to the test for indefinite-lived intangibles impairment.The new guidance permits an entity to first assess qualitative factors to determine whether it is more likely thannot that an indefinite-lived intangible asset is impaired as a basis for determining whether it is necessary toperform the quantitative impairment test. The new guidance is effective for annual and interim indefinite-livedintangibles impairment tests performed for fiscal years beginning after September 15, 2012, with early adoptionpermitted. The new guidance did not have a material impact on the Company’s consolidated financial statements.
Recently Issued Pronouncements
In December 2011, the FASB issued new guidance that is intended to enhance current disclosures onoffsetting financial assets and liabilities. The new guidance requires an entity to disclose both gross and netinformation about financial instruments eligible for offset on the balance sheet and instruments and transactionssubject to an agreement similar to a master netting arrangement. The provisions of the new guidance are effectivefor fiscal years, and interim periods within those years, beginning on or after January 1, 2013. The Companydoes not expect the requirements of this new guidance to have a material impact on the Company’s consolidatedfinancial statements.
In February 2013, the FASB issued new guidance which establishes new requirements for disclosingreclassifications of items out of accumulated other comprehensive income. The new guidance requires acompany to report the effect of significant reclassifications from accumulated other comprehensive income to therespective line items in net income or cross-reference to other disclosures for items not reclassified entirely to netincome. The new guidance is effective for annual and interim periods beginning after December 15, 2012. Thenew guidance expands disclosure of other comprehensive income but does not change the manner in which itemsof other comprehensive income are accounted for or the way in which net income or other comprehensiveincome is reported in the financial statements.
Results of Operations
2012 Compared to 2011
A summary of the Company’s financial results for 2012 and 2011 follows:Fiscal Year
In Thousands (Except Per Share Data) 2012 2011 Change % Change
Net sales . . . . . . . . . . . . . . . . . . . . . . . . . . . $1,614,433 $1,561,239 $53,194 3.4Gross margin . . . . . . . . . . . . . . . . . . . . . . . 654,309(1) 629,243(3) 25,066 4.0S,D&A expenses . . . . . . . . . . . . . . . . . . . . 565,623 541,713(4) 23,910 4.4Interest expense, net . . . . . . . . . . . . . . . . . . 35,338 35,979 (641) (1.8)Income before taxes . . . . . . . . . . . . . . . . . . 53,348 51,551 1,797 3.5Income tax expense . . . . . . . . . . . . . . . . . . 21,889(2) 19,528(5) 2,361 12.1Net income . . . . . . . . . . . . . . . . . . . . . . . . . 31,459(1)(2) 32,023(3)(4)(5) (564) (1.8)Net income attributable to noncontrolling
interest . . . . . . . . . . . . . . . . . . . . . . . . . . 4,242 3,415 827 24.2Net income attributable to Coca-Cola
Bottling Co. Consolidated . . . . . . . . . . . 27,217(1)(2) 28,608(3)(4)(5) (1,391) (4.9)Basic net income per share:
Common Stock . . . . . . . . . . . . . . . . . . . $ 2.95 $ 3.11 $ (.16) (5.1)Class B Common Stock . . . . . . . . . . . . . $ 2.95 $ 3.11 $ (.16) (5.1)
Diluted net income per share:Common Stock . . . . . . . . . . . . . . . . . . . $ 2.94 $ 3.09 $ (.15) (4.9)Class B Common Stock . . . . . . . . . . . . . $ 2.92 $ 3.08 $ (.16) (5.2)
(1) Results in 2012 included a favorable mark-to-market adjustment of $0.5 million (pre-tax), or $0.3 million aftertax, related to the Company’s commodity hedging program which was reflected as a decrease in cost of sales.
(2) Results in 2012 included a debit of $1.5 million related to the increase of the valuation allowance for certaindeferred tax assets which was reflected as an increase to income tax expense.
35
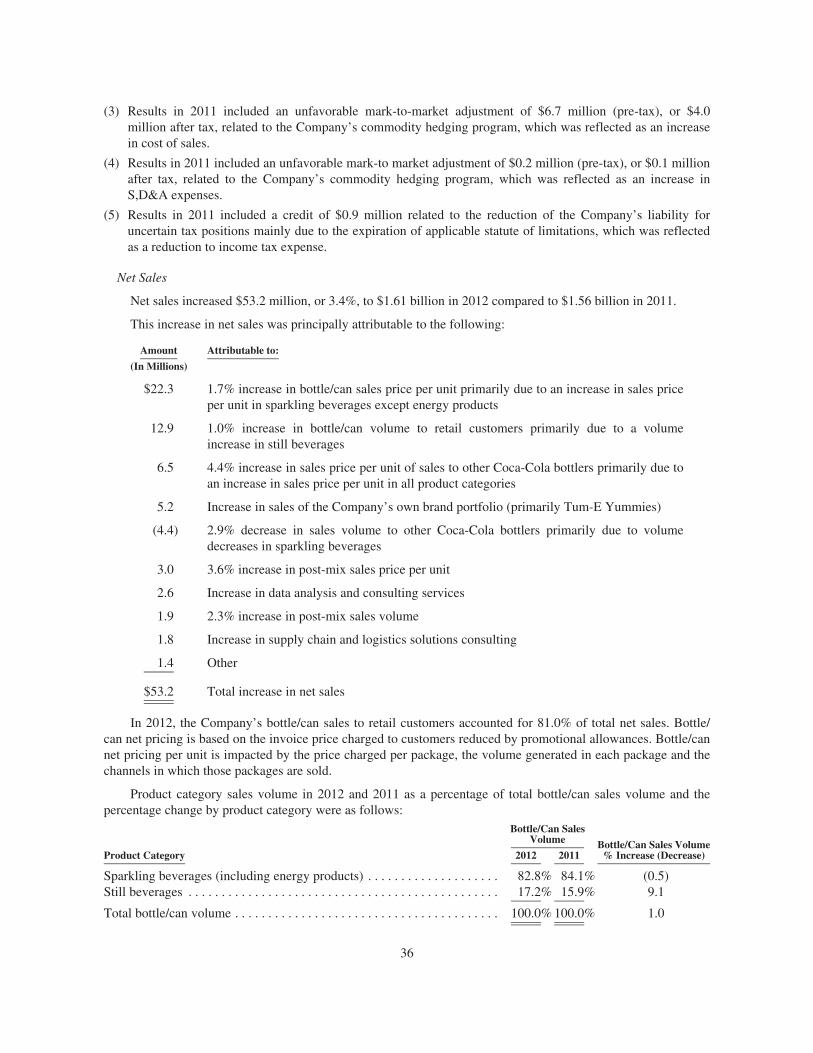
(3) Results in 2011 included an unfavorable mark-to-market adjustment of $6.7 million (pre-tax), or $4.0million after tax, related to the Company’s commodity hedging program, which was reflected as an increasein cost of sales.
(4) Results in 2011 included an unfavorable mark-to market adjustment of $0.2 million (pre-tax), or $0.1 millionafter tax, related to the Company’s commodity hedging program, which was reflected as an increase inS,D&A expenses.
(5) Results in 2011 included a credit of $0.9 million related to the reduction of the Company’s liability foruncertain tax positions mainly due to the expiration of applicable statute of limitations, which was reflectedas a reduction to income tax expense.
Net Sales
Net sales increased $53.2 million, or 3.4%, to $1.61 billion in 2012 compared to $1.56 billion in 2011.
This increase in net sales was principally attributable to the following:
Amount Attributable to:
(In Millions)
$22.3 1.7% increase in bottle/can sales price per unit primarily due to an increase in sales priceper unit in sparkling beverages except energy products
12.9 1.0% increase in bottle/can volume to retail customers primarily due to a volumeincrease in still beverages
6.5 4.4% increase in sales price per unit of sales to other Coca-Cola bottlers primarily due toan increase in sales price per unit in all product categories
5.2 Increase in sales of the Company’s own brand portfolio (primarily Tum-E Yummies)
(4.4) 2.9% decrease in sales volume to other Coca-Cola bottlers primarily due to volumedecreases in sparkling beverages
3.0 3.6% increase in post-mix sales price per unit
2.6 Increase in data analysis and consulting services
1.9 2.3% increase in post-mix sales volume
1.8 Increase in supply chain and logistics solutions consulting
1.4 Other
$53.2 Total increase in net sales
In 2012, the Company’s bottle/can sales to retail customers accounted for 81.0% of total net sales. Bottle/can net pricing is based on the invoice price charged to customers reduced by promotional allowances. Bottle/cannet pricing per unit is impacted by the price charged per package, the volume generated in each package and thechannels in which those packages are sold.
Product category sales volume in 2012 and 2011 as a percentage of total bottle/can sales volume and thepercentage change by product category were as follows:
Bottle/Can SalesVolume Bottle/Can Sales Volume
% Increase (Decrease)Product Category 2012 2011
Sparkling beverages (including energy products) . . . . . . . . . . . . . . . . . . . . 82.8% 84.1% (0.5)Still beverages . . . . . . . . . . . . . . . . . . . . . . . . . . . . . . . . . . . . . . . . . . . . . . . 17.2% 15.9% 9.1
Total bottle/can volume . . . . . . . . . . . . . . . . . . . . . . . . . . . . . . . . . . . . . . . . 100.0% 100.0% 1.0
36
The Company’s products are sold and distributed through various channels. They include selling directly toretail stores and other outlets such as food markets, institutional accounts and vending machine outlets. During2012, approximately 68% of the Company’s bottle/can volume was sold for future consumption, while theremaining bottle/can volume of approximately 32% was sold for immediate consumption. The Company’slargest customer, Wal-Mart Stores, Inc., accounted for approximately 22% of the Company’s total bottle/canvolume and approximately 15% of the Company’s total net sales during 2012. The Company’s second largestcustomer, Food Lion, LLC, accounted for approximately 8% of the Company’s total bottle/can volume andapproximately 6% of the Company’s total net sales during 2012. All of the Company’s beverage sales are tocustomers in the United States.
The Company recorded delivery fees in net sales of $7.0 million in 2012 and $7.1 million in 2011. Thesefees are used to offset a portion of the Company’s delivery and handling costs.
Cost of Sales
Cost of sales includes the following: raw material costs, manufacturing labor, manufacturing overheadincluding depreciation expense, manufacturing warehousing costs and shipping and handling costs related to themovement of finished goods from manufacturing locations to sales distribution centers.
Cost of sales increased 3.0%, or $28.1 million, to $960.1 million in 2012 compared to $932.0 million in2011.
This increase in cost of sales was principally attributable to the following:
Amount Attributable to:
(In Millions)
$22.1 Increases in raw material costs and increased purchases of finished products
7.6 1.0% increase in bottle/can volume to retail customers primarily due to a volumeincrease in still beverages
3.9 Decrease in marketing funding support received primarily from The Coca-ColaCompany
(4.3) 2.9% decrease in sales volume to other Coca-Cola bottlers primarily due to volumedecreases in sparkling beverages
(2.8) Decrease in cost due to the Company’s commodity hedging program
2.2 Increase in sales of the Company’s own brand portfolio (primarily Tum-E Yummies)
1.3 2.3% increase in post-mix sales volume
(1.9) Other
$28.1 Total increase in cost of sales
The following inputs represent a substantial portion of the Company’s total cost of goods sold:(1) sweeteners, (2) packaging materials, including plastic bottles and aluminum cans, and (3) finished productspurchased from other vendors. The Company anticipates that the cost of some of the underlying commoditiesrelated to these inputs, particularly corn, will continue to face upward pressure and gross margins on allcategories of products will be lower throughout 2013 compared to 2012 due to the impact of these risingcommodity costs unless they can be offset by price increases.
The Company entered into an agreement (the “Incidence Pricing Agreement”) in 2008 with The Coca-ColaCompany to test an incidence-based concentrate pricing model for 2008 for all Coca-Cola Trademark Beveragesand Allied Beverages for which the Company purchases concentrate from The Coca-Cola Company. During theterm of the Incidence Pricing Agreement, the pricing of the concentrates for the Coca-Cola Trademark Beverages
37
and Allied Beverages is governed by the Incidence Pricing Agreement rather than the Cola and Allied BeverageAgreements. The concentrate price under the Incidence Pricing Agreement is impacted by a number of factorsincluding the Company’s pricing of finished products, the channels in which the finished products are sold andpackage mix. The Coca-Cola Company must give the Company at least 90 days written notice before changingthe price the Company pays for the concentrate. The Incidence Pricing Agreement has been extended twice andwill remain in effect for the purchase of concentrate through December 31, 2013.
The Company relies extensively on advertising and sales promotion in the marketing of its products. TheCoca-Cola Company and other beverage companies that supply concentrates, syrups and finished products to theCompany make substantial marketing and advertising expenditures to promote sales in the local territories servedby the Company. The Company also benefits from national advertising programs conducted by The Coca-ColaCompany and other beverage companies. Certain of the marketing expenditures by The Coca-Cola Company andother beverage companies are made pursuant to annual arrangements. Although The Coca-Cola Company hasadvised the Company that it intends to continue to provide marketing funding support, it is not obligated to do sounder the Company’s Beverage Agreements. Significant decreases in marketing funding support from TheCoca-Cola Company or other beverage companies could adversely impact operating results of the Company inthe future.
Total marketing funding support from The Coca-Cola Company and other beverage companies, whichincludes direct payments to the Company and payments to the Company’s customers for marketing programs,was $53.6 million in 2012 compared to $57.5 million in 2011.
Gross Margin
Gross margin dollars increased 4.0%, or $25.1 million, to $654.3 million in 2012 compared to $629.2million in 2011. Gross margin as a percentage of net sales increased to 40.5% in 2012 from 40.3% in 2011.
This increase in gross margin was principally attributable to the following:Amount Attributable to:
(In Millions)
$22.3 1.7% increase in bottle/can sales price per unit primarily due to an increase in sales priceper unit in sparkling beverages except energy products
(22.1) Increases in raw material costs and increased purchases of finished products
6.5 4.4% increase in sales price per unit of sales to other Coca-Cola bottlers primarily due toan increase in sales price per unit in all product categories
5.3 1.0% increase in bottle/can volume to retail customers primarily due to a volumeincrease in still beverages
(3.9) Decrease in marketing funding support received primarily from The Coca-ColaCompany
3.0 Increase in sales of the Company’s own brand portfolio (primarily Tum-E Yummies)
3.0 3.6% increase in post-mix sales price per unit
2.8 Decrease in cost due to the Company’s commodity hedging program
2.6 Increase in data analysis and consulting services
1.8 Increase in supply chain and logistics solutions consulting
0.6 2.3% increase in post-mix sales volume
(0.1) 2.9% decrease in sales volume to other Coca-Cola bottlers primarily due to volumedecreases in sparkling beverages
3.3 Other
$25.1 Total increase in gross margin
38
The increase in gross margin percentage was primarily due to higher sales price per unit for bottle/canvolume and lower sales volume to other Coca-Cola bottlers which have a lower gross margin percentage partiallyoffset by higher costs of raw materials and increased purchases of finished products.
The Company’s gross margins may not be comparable to other peer companies, since some of them includeall costs related to their distribution network in cost of sales. The Company includes a portion of these costs inS,D&A expenses.
S,D&A Expenses
S,D&A expenses include the following: sales management labor costs, distribution costs from salesdistribution centers to customer locations, sales distribution center warehouse costs, depreciation expense relatedto sales centers, delivery vehicles and cold drink equipment, point-of-sale expenses, advertising expenses, colddrink equipment repair costs, amortization of intangibles and administrative support labor and operating costssuch as treasury, legal, information services, accounting, internal control services, human resources andexecutive management costs.
S,D&A expenses increased by $23.9 million, or 4.4%, to $565.6 million in 2012 from $541.7 million in2011. S,D&A expenses as a percentage of sales increased to 35.0% in 2012 from 34.7% in 2011.
This increase in S,D&A expenses was principally attributable to the following:
Amount Attributable to:
(In Millions)
$ 8.6 Increase in employee salaries including bonus and incentives due to normal salaryincreases and additional personnel
3.7 Increase in employee benefit costs primarily due to increased medical insurance (activeand retiree) offset by decreased 401(k) match expense
2.7 Increase in marketing expense primarily due to various marketing programs
2.4 Increase in professional and consulting expense
1.3 Increase in software amortization (continued investment in technology)
1.0 Increase in communication expense (primarily data)
0.8 Increase in employer payroll taxes
0.7 Increase in property and casualty insurance expense primarily due to an increase inworkers’ compensation claims
2.7 Other
$23.9 Total increase in S,D&A expenses
Shipping and handling costs related to the movement of finished goods from manufacturing locations tosales distribution centers are included in cost of sales. Shipping and handling costs related to the movement offinished goods from sales distribution centers to customer locations are included in S,D&A expenses and totaled$200.0 million and $191.9 million in 2012 and 2011, respectively.
The net impact of the Company’s commodity hedging program on S,D&A expenses was an increase of$.6 million in 2011. There was no impact on S,D&A expenses in 2012.
The Company’s expense recorded in S,D&A expenses related to the two Company-sponsored pension planswas $2.5 million in both 2012 and 2011.
The Company provides a 401(k) Savings Plan for substantially all of the Company’s full-time employeeswho are not covered by a collective bargaining agreement. The Company matched the first 3% of participants’
39
contributions for 2011 while maintaining the option to increase the matching contributions an additional 2%, fora total of 5%, for the Company’s employees based on the financial results for 2011. The 2% matchingcontributions were accrued during 2011 for a total accrual of $2.8 million. Based on the Company’s financialresults, the Company decided to increase the matching contributions for the additional 2% for the entire year of2011. The Company made this additional contribution payment for 2011 in the first quarter of 2012. During thefirst quarter of 2012, the Company decided to change the Company’s matching from fixed to discretionary andno longer match the first 3% of participants’ contributions while maintaining the option to make matchingcontributions for eligible participants of up to 5% based on the Company’s financial results for 2012 and futureyears. The 5% matching contributions were accrued (less 3% matching contributions paid in the first quarter of2012) during 2012 for a total accrual of $7.7 million. Based on the Company’s financial results, the Companydecided to make matching contributions of 5% of participants’ contributions for the entire year of 2012. TheCompany made this contribution payment for 2012 in the first quarter of 2013. The total expense for this benefitrecorded in S,D&A expenses was $7.2 million and $7.5 million in 2012 and 2011, respectively.
Interest Expense
Net interest expense decreased 1.8%, or $.6 million in 2012 compared to 2011. The decrease was primarilydue to the repayment at maturity of $150 million of Senior Notes in November 2012. This was partially offset bythe Company entering into two new capital leases in the first quarter of 2011. The Company’s overall weightedaverage interest rate on its debt and capital lease obligations increased to 6.1% during 2012 from 6.0% during2011. See the “Liquidity and Capital Resources – Hedging Activities Interest and Hedging” section of M,D&Afor additional information.
Income Taxes
The Company’s effective tax rate, as calculated by dividing income tax expense by income before incometaxes, for 2012 and 2011 was 41.0% and 37.9%, respectively. The increase in the effective tax rate for 2012resulted primarily from an increase in the liability for uncertain tax positions and an increase to the valuationallowance in 2012 as compared to 2011. The Company’s effective tax rate, as calculated by dividing income taxexpense by income before income taxes minus net income attributable to noncontrolling interest, for 2012 and2011 was 44.6% and 40.6%, respectively.
The Company increased its valuation allowance by $1.8 million for 2012. The net effect was an increase inincome tax expense due primarily to the Company’s assessment of its ability to use certain net operating losscarryforwards. In 2012, the Company increased its liability for uncertain tax positions by $.8 million resulting inan increase to income tax expense. In 2011, the Company reduced its liability for uncertain tax positions by$.2 million resulting in a decrease to income tax expense. See Note 14 to the consolidated financial statementsfor additional information.
The Company’s income tax assets and liabilities are subject to adjustment in future periods based on theCompany’s ongoing evaluations of such assets and liabilities and new information that becomes available to theCompany.
Noncontrolling Interest
The Company recorded net income attributable to noncontrolling interest of $4.2 million in 2012 comparedto $3.4 million in 2011 primarily related to the portion of Piedmont owned by The Coca-Cola Company.
40
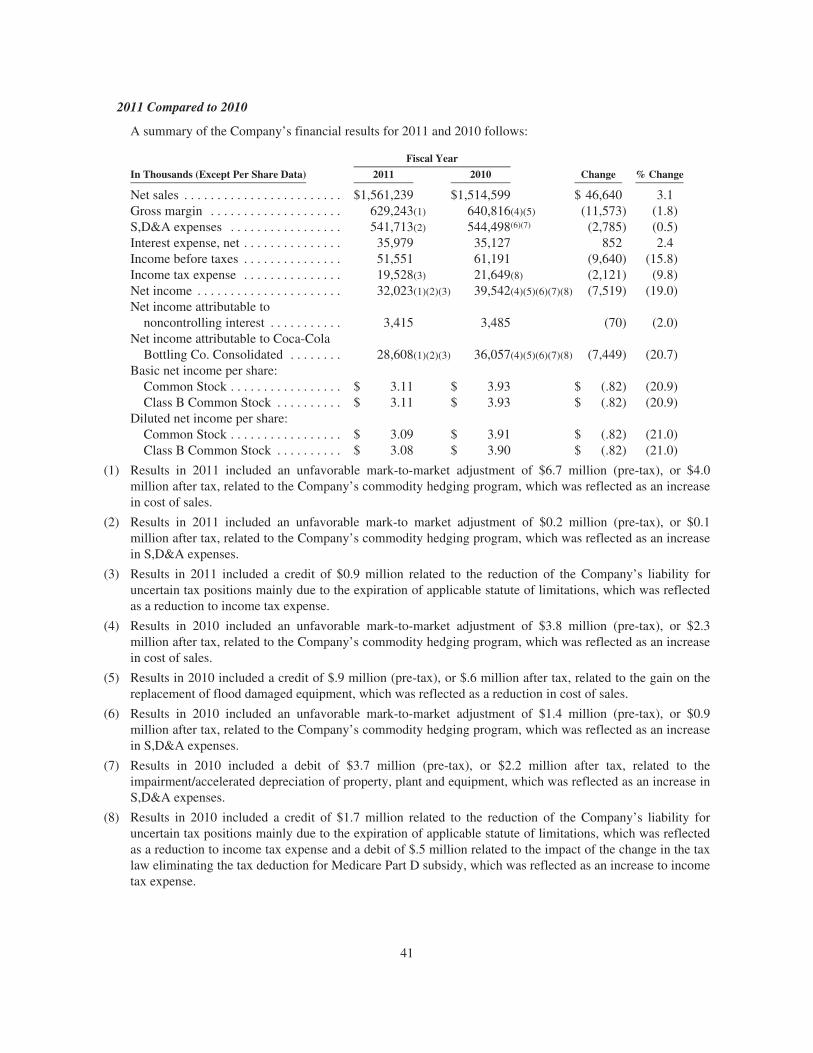
2011 Compared to 2010
A summary of the Company’s financial results for 2011 and 2010 follows:
Fiscal Year
In Thousands (Except Per Share Data) 2011 2010 Change % Change
Net sales . . . . . . . . . . . . . . . . . . . . . . . . $1,561,239 $1,514,599 $ 46,640 3.1Gross margin . . . . . . . . . . . . . . . . . . . . 629,243(1) 640,816(4)(5) (11,573) (1.8)S,D&A expenses . . . . . . . . . . . . . . . . . 541,713(2) 544,498(6)(7) (2,785) (0.5)Interest expense, net . . . . . . . . . . . . . . . 35,979 35,127 852 2.4Income before taxes . . . . . . . . . . . . . . . 51,551 61,191 (9,640) (15.8)Income tax expense . . . . . . . . . . . . . . . 19,528(3) 21,649(8) (2,121) (9.8)Net income . . . . . . . . . . . . . . . . . . . . . . 32,023(1)(2)(3) 39,542(4)(5)(6)(7)(8) (7,519) (19.0)Net income attributable to
noncontrolling interest . . . . . . . . . . . 3,415 3,485 (70) (2.0)Net income attributable to Coca-Cola
Bottling Co. Consolidated . . . . . . . . 28,608(1)(2)(3) 36,057(4)(5)(6)(7)(8) (7,449) (20.7)Basic net income per share:
Common Stock . . . . . . . . . . . . . . . . . $ 3.11 $ 3.93 $ (.82) (20.9)Class B Common Stock . . . . . . . . . . $ 3.11 $ 3.93 $ (.82) (20.9)
Diluted net income per share:Common Stock . . . . . . . . . . . . . . . . . $ 3.09 $ 3.91 $ (.82) (21.0)Class B Common Stock . . . . . . . . . . $ 3.08 $ 3.90 $ (.82) (21.0)
(1) Results in 2011 included an unfavorable mark-to-market adjustment of $6.7 million (pre-tax), or $4.0million after tax, related to the Company’s commodity hedging program, which was reflected as an increasein cost of sales.
(2) Results in 2011 included an unfavorable mark-to market adjustment of $0.2 million (pre-tax), or $0.1million after tax, related to the Company’s commodity hedging program, which was reflected as an increasein S,D&A expenses.
(3) Results in 2011 included a credit of $0.9 million related to the reduction of the Company’s liability foruncertain tax positions mainly due to the expiration of applicable statute of limitations, which was reflectedas a reduction to income tax expense.
(4) Results in 2010 included an unfavorable mark-to-market adjustment of $3.8 million (pre-tax), or $2.3million after tax, related to the Company’s commodity hedging program, which was reflected as an increasein cost of sales.
(5) Results in 2010 included a credit of $.9 million (pre-tax), or $.6 million after tax, related to the gain on thereplacement of flood damaged equipment, which was reflected as a reduction in cost of sales.
(6) Results in 2010 included an unfavorable mark-to-market adjustment of $1.4 million (pre-tax), or $0.9million after tax, related to the Company’s commodity hedging program, which was reflected as an increasein S,D&A expenses.
(7) Results in 2010 included a debit of $3.7 million (pre-tax), or $2.2 million after tax, related to theimpairment/accelerated depreciation of property, plant and equipment, which was reflected as an increase inS,D&A expenses.
(8) Results in 2010 included a credit of $1.7 million related to the reduction of the Company’s liability foruncertain tax positions mainly due to the expiration of applicable statute of limitations, which was reflectedas a reduction to income tax expense and a debit of $.5 million related to the impact of the change in the taxlaw eliminating the tax deduction for Medicare Part D subsidy, which was reflected as an increase to incometax expense.
41
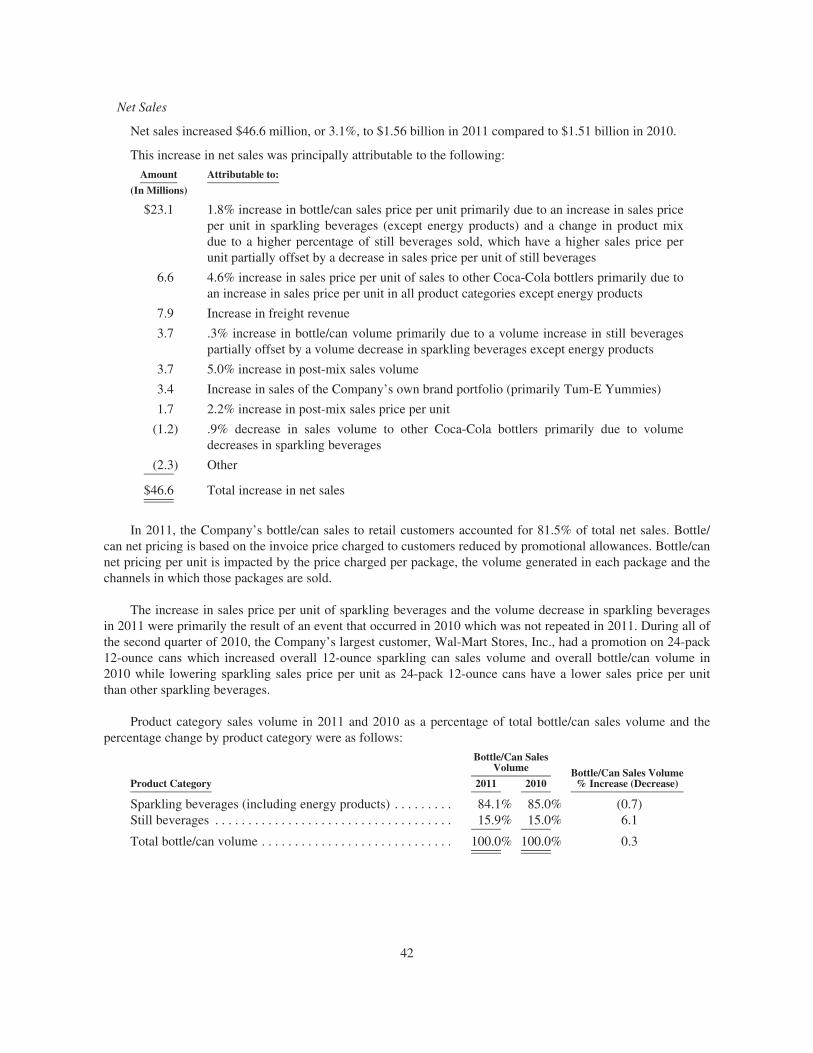
Net Sales
Net sales increased $46.6 million, or 3.1%, to $1.56 billion in 2011 compared to $1.51 billion in 2010.
This increase in net sales was principally attributable to the following:
Amount Attributable to:
(In Millions)
$23.1 1.8% increase in bottle/can sales price per unit primarily due to an increase in sales priceper unit in sparkling beverages (except energy products) and a change in product mixdue to a higher percentage of still beverages sold, which have a higher sales price perunit partially offset by a decrease in sales price per unit of still beverages
6.6 4.6% increase in sales price per unit of sales to other Coca-Cola bottlers primarily due toan increase in sales price per unit in all product categories except energy products
7.9 Increase in freight revenue
3.7 .3% increase in bottle/can volume primarily due to a volume increase in still beveragespartially offset by a volume decrease in sparkling beverages except energy products
3.7 5.0% increase in post-mix sales volume
3.4 Increase in sales of the Company’s own brand portfolio (primarily Tum-E Yummies)
1.7 2.2% increase in post-mix sales price per unit
(1.2) .9% decrease in sales volume to other Coca-Cola bottlers primarily due to volumedecreases in sparkling beverages
(2.3) Other
$46.6 Total increase in net sales
In 2011, the Company’s bottle/can sales to retail customers accounted for 81.5% of total net sales. Bottle/can net pricing is based on the invoice price charged to customers reduced by promotional allowances. Bottle/cannet pricing per unit is impacted by the price charged per package, the volume generated in each package and thechannels in which those packages are sold.
The increase in sales price per unit of sparkling beverages and the volume decrease in sparkling beveragesin 2011 were primarily the result of an event that occurred in 2010 which was not repeated in 2011. During all ofthe second quarter of 2010, the Company’s largest customer, Wal-Mart Stores, Inc., had a promotion on 24-pack12-ounce cans which increased overall 12-ounce sparkling can sales volume and overall bottle/can volume in2010 while lowering sparkling sales price per unit as 24-pack 12-ounce cans have a lower sales price per unitthan other sparkling beverages.
Product category sales volume in 2011 and 2010 as a percentage of total bottle/can sales volume and thepercentage change by product category were as follows:
Bottle/Can SalesVolume Bottle/Can Sales Volume
% Increase (Decrease)Product Category 2011 2010
Sparkling beverages (including energy products) . . . . . . . . . 84.1% 85.0% (0.7)Still beverages . . . . . . . . . . . . . . . . . . . . . . . . . . . . . . . . . . . . 15.9% 15.0% 6.1
Total bottle/can volume . . . . . . . . . . . . . . . . . . . . . . . . . . . . . 100.0% 100.0% 0.3
42
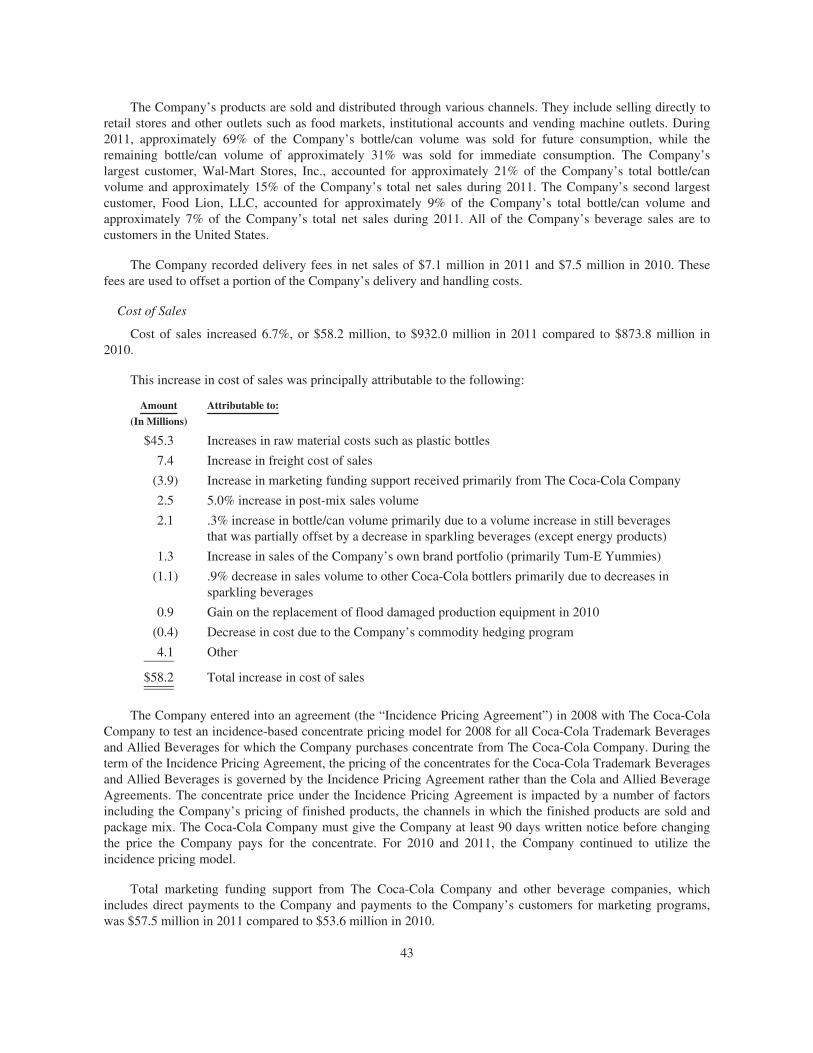
The Company’s products are sold and distributed through various channels. They include selling directly toretail stores and other outlets such as food markets, institutional accounts and vending machine outlets. During2011, approximately 69% of the Company’s bottle/can volume was sold for future consumption, while theremaining bottle/can volume of approximately 31% was sold for immediate consumption. The Company’slargest customer, Wal-Mart Stores, Inc., accounted for approximately 21% of the Company’s total bottle/canvolume and approximately 15% of the Company’s total net sales during 2011. The Company’s second largestcustomer, Food Lion, LLC, accounted for approximately 9% of the Company’s total bottle/can volume andapproximately 7% of the Company’s total net sales during 2011. All of the Company’s beverage sales are tocustomers in the United States.
The Company recorded delivery fees in net sales of $7.1 million in 2011 and $7.5 million in 2010. Thesefees are used to offset a portion of the Company’s delivery and handling costs.
Cost of Sales
Cost of sales increased 6.7%, or $58.2 million, to $932.0 million in 2011 compared to $873.8 million in2010.
This increase in cost of sales was principally attributable to the following:
Amount Attributable to:
(In Millions)
$45.3 Increases in raw material costs such as plastic bottles
7.4 Increase in freight cost of sales
(3.9) Increase in marketing funding support received primarily from The Coca-Cola Company
2.5 5.0% increase in post-mix sales volume
2.1 .3% increase in bottle/can volume primarily due to a volume increase in still beveragesthat was partially offset by a decrease in sparkling beverages (except energy products)
1.3 Increase in sales of the Company’s own brand portfolio (primarily Tum-E Yummies)
(1.1) .9% decrease in sales volume to other Coca-Cola bottlers primarily due to decreases insparkling beverages
0.9 Gain on the replacement of flood damaged production equipment in 2010
(0.4) Decrease in cost due to the Company’s commodity hedging program
4.1 Other
$58.2 Total increase in cost of sales
The Company entered into an agreement (the “Incidence Pricing Agreement”) in 2008 with The Coca-ColaCompany to test an incidence-based concentrate pricing model for 2008 for all Coca-Cola Trademark Beveragesand Allied Beverages for which the Company purchases concentrate from The Coca-Cola Company. During theterm of the Incidence Pricing Agreement, the pricing of the concentrates for the Coca-Cola Trademark Beveragesand Allied Beverages is governed by the Incidence Pricing Agreement rather than the Cola and Allied BeverageAgreements. The concentrate price under the Incidence Pricing Agreement is impacted by a number of factorsincluding the Company’s pricing of finished products, the channels in which the finished products are sold andpackage mix. The Coca-Cola Company must give the Company at least 90 days written notice before changingthe price the Company pays for the concentrate. For 2010 and 2011, the Company continued to utilize theincidence pricing model.
Total marketing funding support from The Coca-Cola Company and other beverage companies, whichincludes direct payments to the Company and payments to the Company’s customers for marketing programs,was $57.5 million in 2011 compared to $53.6 million in 2010.
43
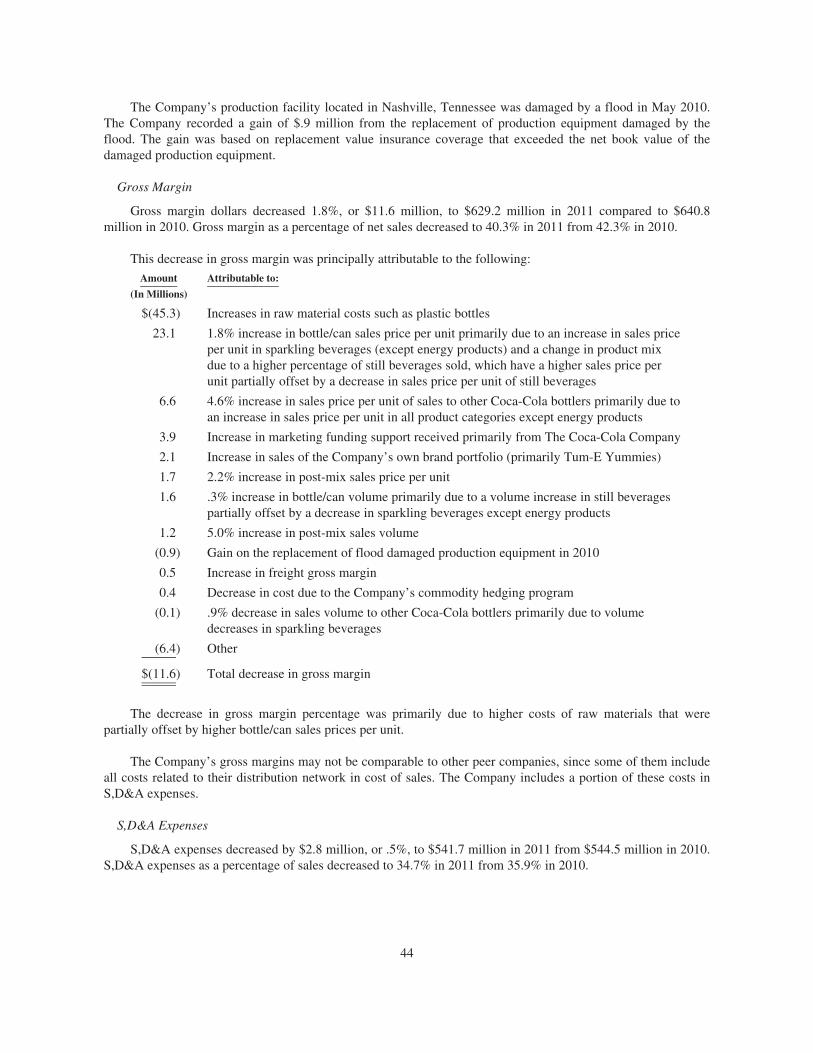
The Company’s production facility located in Nashville, Tennessee was damaged by a flood in May 2010.The Company recorded a gain of $.9 million from the replacement of production equipment damaged by theflood. The gain was based on replacement value insurance coverage that exceeded the net book value of thedamaged production equipment.
Gross Margin
Gross margin dollars decreased 1.8%, or $11.6 million, to $629.2 million in 2011 compared to $640.8million in 2010. Gross margin as a percentage of net sales decreased to 40.3% in 2011 from 42.3% in 2010.
This decrease in gross margin was principally attributable to the following:
Amount Attributable to:
(In Millions)
$(45.3) Increases in raw material costs such as plastic bottles
23.1 1.8% increase in bottle/can sales price per unit primarily due to an increase in sales priceper unit in sparkling beverages (except energy products) and a change in product mixdue to a higher percentage of still beverages sold, which have a higher sales price perunit partially offset by a decrease in sales price per unit of still beverages
6.6 4.6% increase in sales price per unit of sales to other Coca-Cola bottlers primarily due toan increase in sales price per unit in all product categories except energy products
3.9 Increase in marketing funding support received primarily from The Coca-Cola Company
2.1 Increase in sales of the Company’s own brand portfolio (primarily Tum-E Yummies)
1.7 2.2% increase in post-mix sales price per unit
1.6 .3% increase in bottle/can volume primarily due to a volume increase in still beveragespartially offset by a decrease in sparkling beverages except energy products
1.2 5.0% increase in post-mix sales volume
(0.9) Gain on the replacement of flood damaged production equipment in 2010
0.5 Increase in freight gross margin
0.4 Decrease in cost due to the Company’s commodity hedging program
(0.1) .9% decrease in sales volume to other Coca-Cola bottlers primarily due to volumedecreases in sparkling beverages
(6.4) Other
$(11.6) Total decrease in gross margin
The decrease in gross margin percentage was primarily due to higher costs of raw materials that werepartially offset by higher bottle/can sales prices per unit.
The Company’s gross margins may not be comparable to other peer companies, since some of them includeall costs related to their distribution network in cost of sales. The Company includes a portion of these costs inS,D&A expenses.
S,D&A Expenses
S,D&A expenses decreased by $2.8 million, or .5%, to $541.7 million in 2011 from $544.5 million in 2010.S,D&A expenses as a percentage of sales decreased to 34.7% in 2011 from 35.9% in 2010.
44
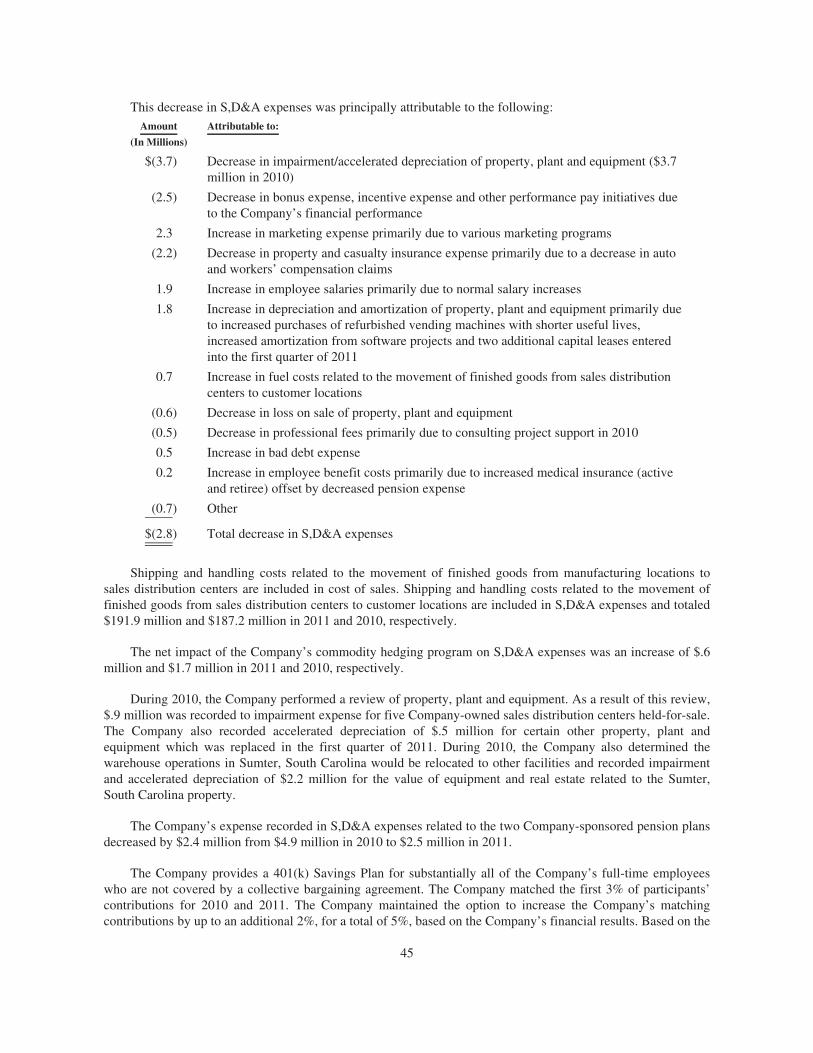
This decrease in S,D&A expenses was principally attributable to the following:Amount Attributable to:
(In Millions)
$(3.7) Decrease in impairment/accelerated depreciation of property, plant and equipment ($3.7million in 2010)
(2.5) Decrease in bonus expense, incentive expense and other performance pay initiatives dueto the Company’s financial performance
2.3 Increase in marketing expense primarily due to various marketing programs
(2.2) Decrease in property and casualty insurance expense primarily due to a decrease in autoand workers’ compensation claims
1.9 Increase in employee salaries primarily due to normal salary increases
1.8 Increase in depreciation and amortization of property, plant and equipment primarily dueto increased purchases of refurbished vending machines with shorter useful lives,increased amortization from software projects and two additional capital leases enteredinto the first quarter of 2011
0.7 Increase in fuel costs related to the movement of finished goods from sales distributioncenters to customer locations
(0.6) Decrease in loss on sale of property, plant and equipment
(0.5) Decrease in professional fees primarily due to consulting project support in 2010
0.5 Increase in bad debt expense
0.2 Increase in employee benefit costs primarily due to increased medical insurance (activeand retiree) offset by decreased pension expense
(0.7) Other
$(2.8) Total decrease in S,D&A expenses
Shipping and handling costs related to the movement of finished goods from manufacturing locations tosales distribution centers are included in cost of sales. Shipping and handling costs related to the movement offinished goods from sales distribution centers to customer locations are included in S,D&A expenses and totaled$191.9 million and $187.2 million in 2011 and 2010, respectively.
The net impact of the Company’s commodity hedging program on S,D&A expenses was an increase of $.6million and $1.7 million in 2011 and 2010, respectively.
During 2010, the Company performed a review of property, plant and equipment. As a result of this review,$.9 million was recorded to impairment expense for five Company-owned sales distribution centers held-for-sale.The Company also recorded accelerated depreciation of $.5 million for certain other property, plant andequipment which was replaced in the first quarter of 2011. During 2010, the Company also determined thewarehouse operations in Sumter, South Carolina would be relocated to other facilities and recorded impairmentand accelerated depreciation of $2.2 million for the value of equipment and real estate related to the Sumter,South Carolina property.
The Company’s expense recorded in S,D&A expenses related to the two Company-sponsored pension plansdecreased by $2.4 million from $4.9 million in 2010 to $2.5 million in 2011.
The Company provides a 401(k) Savings Plan for substantially all of the Company’s full-time employeeswho are not covered by a collective bargaining agreement. The Company matched the first 3% of participants’contributions for 2010 and 2011. The Company maintained the option to increase the Company’s matchingcontributions by up to an additional 2%, for a total of 5%, based on the Company’s financial results. Based on the
45
Company’s financial results, the Company decided to increase the matching contributions for the additional 2%for the entire year of 2010. The Company made these additional contribution payments for each quarter in 2010in the following quarter concluding with the fourth quarter of 2010 payment being made in the first quarter of2011. Based on the Company’s financial results, the Company decided to increase the matching contributions forthe additional 2% for the entire year of 2011. The 2% matching contributions were accrued during 2011. TheCompany made the additional contribution payment for 2011 in the first quarter of 2012. The total cost,including the 2% matching contributions for this benefit recorded in S,D&A expenses, was $7.5 million and $7.6million in 2011 and 2010, respectively.
Interest Expense
Net interest expense increased 2.4%, or $.9 million in 2011 compared to 2010. The increase was primarilydue to the Company entering into two new capital leases in the first quarter of 2011. The Company’s overallweighted average interest rate on its debt and capital lease obligations increased to 6.0% during 2011 from 5.9%during 2010. This increase is the result of the conversion of one of the Company’s capital leases from a floatingrate to a fixed rate in late 2010, combined with the Company’s use of short-term borrowings in 2010 at lowvariable rates relative to the fixed rates on the Company’s Senior Debt. See the “Liquidity and Capital Resources— Hedging Activities — Interest Rate Hedging” section of M,D&A for additional information.
Income Taxes
The Company’s effective tax rate, as calculated by dividing income tax expense by income before incometaxes, for 2011 and 2010 was 37.9% and 35.4%, respectively. The increase in the effective tax rate for 2011resulted primarily from a comparatively lower reduction in the liability for uncertain tax positions and anincrease to the valuation allowance in 2011 as compared to 2010. The Company’s effective tax rate, as calculatedby dividing income tax expense by income before income taxes minus net income attributable to noncontrollinginterest, for 2011 and 2010 was 40.6% and 37.5%, respectively.
During 2010, the Company reduced its liability for uncertain tax positions by $1.7 million resulting in adecrease in income tax expense. The reduction of the liability for uncertain tax positions was due primarily to theexpiration of the applicable statute of limitations. During 2011, the Company reduced its liability for uncertaintax positions by $.9 million resulting in a decrease in income tax expense. The reduction of the liability foruncertain tax positions was due primarily to the expiration of the applicable statute of limitations. See Note 14 tothe consolidated financial statements for additional information.
Noncontrolling Interest
The Company recorded net income attributable to noncontrolling interest of $3.4 million in 2011 comparedto $3.5 million in 2010 primarily related to the portion of Piedmont owned by The Coca-Cola Company.
Financial Condition
Total assets decreased to $1.28 billion at December 30, 2012 from $1.36 billion at January 1, 2012 primarilydue to a decrease in cash and cash equivalents (primarily due to the repayment of Senior Notes in November2012).
Net working capital, defined as current assets less current liabilities, increased by $6.6 million to $25.0million at December 30, 2012 from $18.4 million at January 1, 2012.
Significant changes in net working capital from January 1, 2012 to December 30, 2012 were as follows:
• A decrease in cash and cash equivalents of $80.4 million primarily due to the repayment of Senior Notesin November 2012.
• An increase in accounts receivable from The Coca-Cola Company and a decrease in accounts payable toThe Coca-Cola Company of $6.2 million and $6.3 million, respectively, primarily due to the timing ofpayments.
46
• A decrease in current portion of long-term debt of $100.0 million due to the repayment of $150 million ofSenior Notes that matured in November 2012. The Company had $20 million outstanding on anuncommitted line of credit at the end of 2012 that was used to repay the Senior Notes in November 2012.In 2011, $120 million of the $150 million Senior Notes due November 2012 was classified as current asthis was the expected amount to be paid from available cash plus amounts borrowed from anuncommitted line of credit. The remaining $30 million of Senior Notes due in 2012 was expected to bepaid from amounts to be borrowed on the Company’s $200 million five-year unsecured revolving creditfacility (“$200 million facility”).
• An increase in accounts payable, trade of $9.4 million primarily due to the timing of payments.
• An increase in other accrued liabilities of $6.9 million primarily due to an increase in employee benefitsaccruals and the timing of payments.
Debt and capital lease obligations were $493.0 million as of December 30, 2012 compared to $597.3 millionas of January 1, 2012. Debt and capital lease obligations as of December 30, 2012 and January 1, 2012 included$69.6 million and $74.1 million, respectively, of capital lease obligations related primarily to Company facilities.
Contributions to the Company’s pension plans were $25.0 million and $9.5 million in 2012 and 2011,respectively. The Company anticipates that contributions to the principal Company-sponsored pension plan in2013 will be in the range of $1 million to $5 million.
Liquidity and Capital Resources
Capital Resources
The Company’s sources of capital include cash flows from operations, available credit facilities and theissuance of debt and equity securities. Management believes the Company has sufficient financial resourcesavailable to finance its business plan, meet its working capital requirements and maintain an appropriate level ofcapital spending for at least the next 12 months. The amount and frequency of future dividends will bedetermined by the Company’s Board of Directors in light of the earnings and financial condition of the Companyat such time, and no assurance can be given that dividends will be declared or paid in the future.
As of December 30, 2012, the Company had $170 million available under the $200 million facility to meetits cash requirements. On September 21, 2011, the Company entered into the $200 million facility replacing theCompany’s previous $200 million five-year unsecured revolving credit facility, dated March 8, 2007, which hadbeen scheduled to mature in March 2012. The $200 million facility has a scheduled maturity date ofSeptember 21, 2016 and up to $25 million is available for the issuance of letters of credit. Borrowings under theagreement bear interest at a floating base rate or a floating Eurodollar rate plus an interest rate spread, dependenton the Company’s credit rating at the time of borrowing. The Company must pay an annual facility fee of .175%of the lenders’ aggregate commitments under the facility. The $200 million facility contains two financialcovenants: a cash flow/fixed charges ratio (“fixed charges coverage ratio”) and funded indebtedness/cash flowratio (“operating cash flow ratio”), each as defined in the credit agreement. The fixed charges coverage ratiorequires the Company to maintain a consolidated cash flow to fixed charges ratio of 1.5 to 1.0 or higher. Theoperating cash flow ratio requires the Company to maintain a debt to operating cash flow ratio of 6.0 to 1.0 orlower. The Company is currently in compliance with these covenants. These covenants do not currently, and theCompany does not anticipate they will, restrict its liquidity or capital resources. The Company currently believesthat all of the banks participating in the Company’s $200 million facility have the ability to and will meet anyfunding requests from the Company.
On February 10, 2010, the Company entered into an agreement for an uncommitted line of credit. Under thisagreement, which is still in place, the Company may borrow up to a total of $20 million for periods of 7 days, 30days, 60 days or 90 days at the discretion of the participating bank.
47
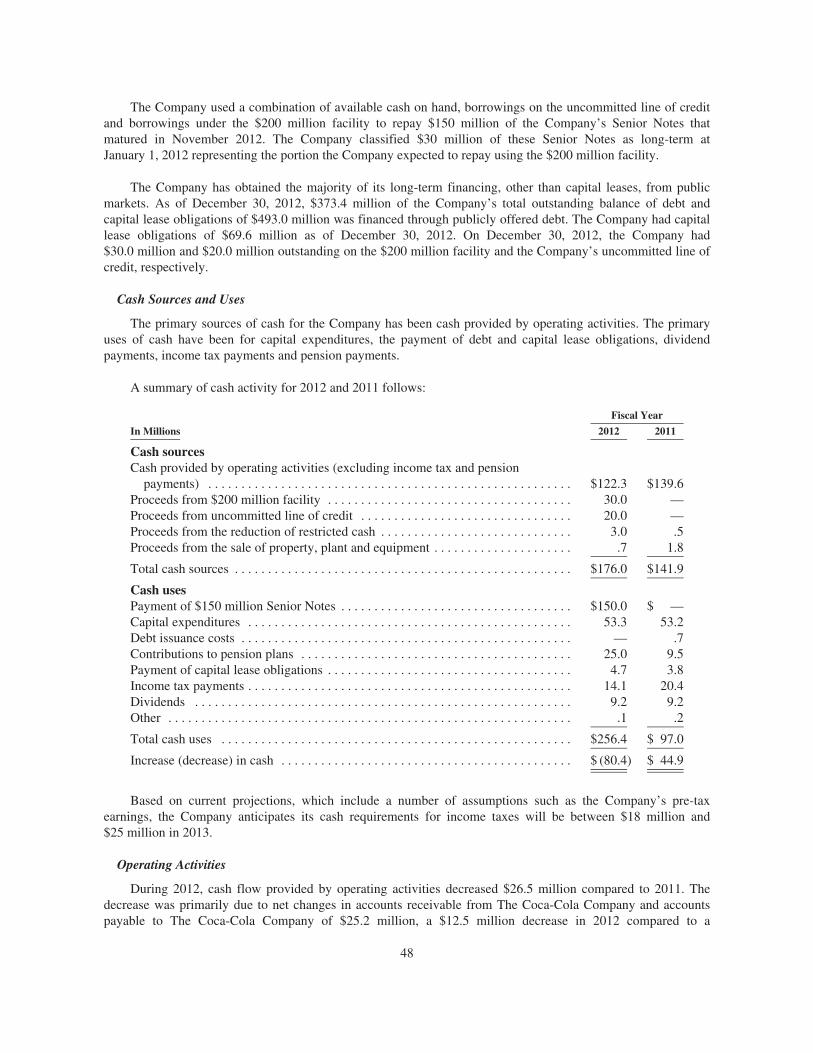
The Company used a combination of available cash on hand, borrowings on the uncommitted line of creditand borrowings under the $200 million facility to repay $150 million of the Company’s Senior Notes thatmatured in November 2012. The Company classified $30 million of these Senior Notes as long-term atJanuary 1, 2012 representing the portion the Company expected to repay using the $200 million facility.
The Company has obtained the majority of its long-term financing, other than capital leases, from publicmarkets. As of December 30, 2012, $373.4 million of the Company’s total outstanding balance of debt andcapital lease obligations of $493.0 million was financed through publicly offered debt. The Company had capitallease obligations of $69.6 million as of December 30, 2012. On December 30, 2012, the Company had$30.0 million and $20.0 million outstanding on the $200 million facility and the Company’s uncommitted line ofcredit, respectively.
Cash Sources and Uses
The primary sources of cash for the Company has been cash provided by operating activities. The primaryuses of cash have been for capital expenditures, the payment of debt and capital lease obligations, dividendpayments, income tax payments and pension payments.
A summary of cash activity for 2012 and 2011 follows:
Fiscal Year
In Millions 2012 2011
Cash sourcesCash provided by operating activities (excluding income tax and pension
payments) . . . . . . . . . . . . . . . . . . . . . . . . . . . . . . . . . . . . . . . . . . . . . . . . . . . . . . . $122.3 $139.6Proceeds from $200 million facility . . . . . . . . . . . . . . . . . . . . . . . . . . . . . . . . . . . . . 30.0 —Proceeds from uncommitted line of credit . . . . . . . . . . . . . . . . . . . . . . . . . . . . . . . . 20.0 —Proceeds from the reduction of restricted cash . . . . . . . . . . . . . . . . . . . . . . . . . . . . . 3.0 .5Proceeds from the sale of property, plant and equipment . . . . . . . . . . . . . . . . . . . . . .7 1.8
Total cash sources . . . . . . . . . . . . . . . . . . . . . . . . . . . . . . . . . . . . . . . . . . . . . . . . . . . $176.0 $141.9
Cash usesPayment of $150 million Senior Notes . . . . . . . . . . . . . . . . . . . . . . . . . . . . . . . . . . . $150.0 $ —Capital expenditures . . . . . . . . . . . . . . . . . . . . . . . . . . . . . . . . . . . . . . . . . . . . . . . . . 53.3 53.2Debt issuance costs . . . . . . . . . . . . . . . . . . . . . . . . . . . . . . . . . . . . . . . . . . . . . . . . . . — .7Contributions to pension plans . . . . . . . . . . . . . . . . . . . . . . . . . . . . . . . . . . . . . . . . . 25.0 9.5Payment of capital lease obligations . . . . . . . . . . . . . . . . . . . . . . . . . . . . . . . . . . . . . 4.7 3.8Income tax payments . . . . . . . . . . . . . . . . . . . . . . . . . . . . . . . . . . . . . . . . . . . . . . . . . 14.1 20.4Dividends . . . . . . . . . . . . . . . . . . . . . . . . . . . . . . . . . . . . . . . . . . . . . . . . . . . . . . . . . 9.2 9.2Other . . . . . . . . . . . . . . . . . . . . . . . . . . . . . . . . . . . . . . . . . . . . . . . . . . . . . . . . . . . . . .1 .2
Total cash uses . . . . . . . . . . . . . . . . . . . . . . . . . . . . . . . . . . . . . . . . . . . . . . . . . . . . . $256.4 $ 97.0
Increase (decrease) in cash . . . . . . . . . . . . . . . . . . . . . . . . . . . . . . . . . . . . . . . . . . . . $ (80.4) $ 44.9
Based on current projections, which include a number of assumptions such as the Company’s pre-taxearnings, the Company anticipates its cash requirements for income taxes will be between $18 million and$25 million in 2013.
Operating Activities
During 2012, cash flow provided by operating activities decreased $26.5 million compared to 2011. Thedecrease was primarily due to net changes in accounts receivable from The Coca-Cola Company and accountspayable to The Coca-Cola Company of $25.2 million, a $12.5 million decrease in 2012 compared to a
48
$12.7 million increase in 2011. Additionally, an increase in contributions to pension plans of $15.5 million, $25.0million in 2012 compared to $9.5 million in 2011 was offset by a decrease in income tax payments of $6.3million, $14.1 million paid in 2012 compared to $20.4 million in 2011.
Investing Activities
Additions to property, plant and equipment during 2012 were $61.5 million of which $14.4 million wereaccrued in accounts payable, trade as unpaid. This amount compared to $49.0 million in additions to property,plant and equipment during 2011 of which $6.2 million were accrued in accounts payable, trade as unpaid.Capital expenditures during 2012 were funded with cash flows from operations. The Company anticipates thatadditions to property, plant and equipment in 2013 will be in the range of $75 million to $85 million. Leasing isused for certain capital additions when considered cost effective relative to other sources of capital. TheCompany currently leases its corporate headquarters, two production facilities and several sales distributionfacilities and administrative facilities.
Financing Activities
As of December 30, 2012, the Company had $170 million available under the $200 million facility to meetits short-term borrowing requirements. On September 21, 2011, the Company entered into the $200 millionfacility replacing the Company’s previous $200 million five-year unsecured revolving credit facility, datedMarch 8, 2007, which had been scheduled to mature in March 2012. The $200 million facility has a scheduledmaturity date of September 21, 2016 and up to $25 million is available for the issuance of letters of credit.Borrowings under the agreement will bear interest at a floating base rate or a floating Eurodollar rate plus aninterest rate spread, dependent on the Company’s credit rating at the time of borrowing. The Company must payan annual facility fee of .175% of the lenders’ aggregate commitments under the facility. The $200 millionfacility contains two financial covenants: a cash flow/fixed charges ratio (“fixed charges coverage ratio”) andfunded indebtedness/cash flow ratio (“operating cash flow ratio”), each as defined in the credit agreement. Thefixed charges coverage ratio requires the Company to maintain a consolidated cash flow to fixed charges ratio of1.5 to 1.0 or higher. The operating cash flow ratio requires the Company to maintain a debt to operating cashflow ratio of 6.0 to 1.0 or lower. The Company is currently in compliance with these covenants. These covenantsdo not currently, and the Company does not anticipate they will, restrict its liquidity or capital resources. TheCompany currently believes that all of the banks participating in the Company’s new $200 million facility havethe ability to and will meet any funding requests from the Company. On December 30, 2012 the Company had$30.0 million outstanding borrowings under the $200 million facility. On January 1, 2012, the Company had nooutstanding borrowings on the $200 million facility.
On February 10, 2010, the Company entered into an agreement for an uncommitted line of credit. Under thisagreement, which is still in place, the Company may borrow up to a total of $20 million for periods of 7 days, 30days, 60 days or 90 days at the discretion of the participating bank. On December 30, 2012, the Company had$20.0 million outstanding under the uncommitted line of credit. On January 1, 2012, the Company had nooutstanding borrowings under the uncommitted line of credit.
The Company used a combination of available cash on hand, borrowings on the uncommitted line of creditand borrowings under the $200 million facility to repay $150 million of the Company’s Senior Notes thatmatured in November 2012. The Company had classified $30 million of these Senior Notes as long-term atJanuary 1, 2012 representing the portion the Company expected to repay using the $200 million facility.
All of the outstanding debt has been issued by the Company with none having been issued by any of theCompany’s subsidiaries. There are no guarantees of the Company’s debt. The Company or its subsidiaries haveentered into seven capital leases.
49
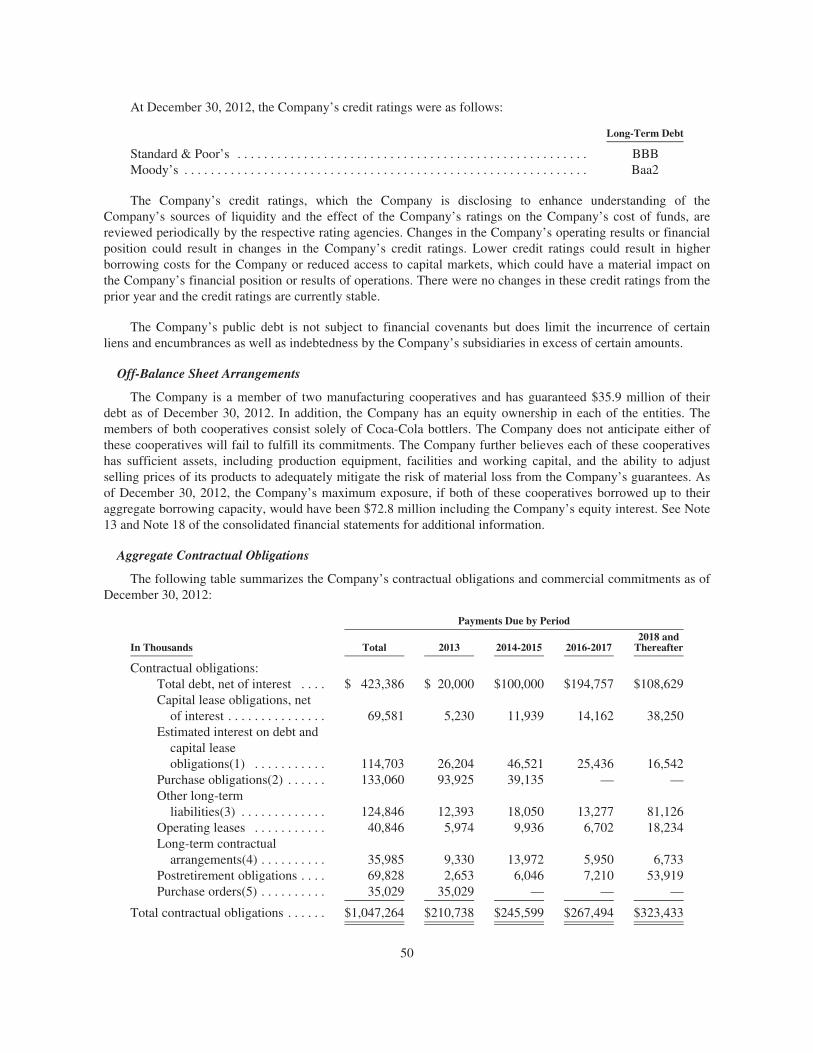
At December 30, 2012, the Company’s credit ratings were as follows:
Long-Term Debt
Standard & Poor’s . . . . . . . . . . . . . . . . . . . . . . . . . . . . . . . . . . . . . . . . . . . . . . . . . . . . . BBBMoody’s . . . . . . . . . . . . . . . . . . . . . . . . . . . . . . . . . . . . . . . . . . . . . . . . . . . . . . . . . . . . . Baa2
The Company’s credit ratings, which the Company is disclosing to enhance understanding of theCompany’s sources of liquidity and the effect of the Company’s ratings on the Company’s cost of funds, arereviewed periodically by the respective rating agencies. Changes in the Company’s operating results or financialposition could result in changes in the Company’s credit ratings. Lower credit ratings could result in higherborrowing costs for the Company or reduced access to capital markets, which could have a material impact onthe Company’s financial position or results of operations. There were no changes in these credit ratings from theprior year and the credit ratings are currently stable.
The Company’s public debt is not subject to financial covenants but does limit the incurrence of certainliens and encumbrances as well as indebtedness by the Company’s subsidiaries in excess of certain amounts.
Off-Balance Sheet Arrangements
The Company is a member of two manufacturing cooperatives and has guaranteed $35.9 million of theirdebt as of December 30, 2012. In addition, the Company has an equity ownership in each of the entities. Themembers of both cooperatives consist solely of Coca-Cola bottlers. The Company does not anticipate either ofthese cooperatives will fail to fulfill its commitments. The Company further believes each of these cooperativeshas sufficient assets, including production equipment, facilities and working capital, and the ability to adjustselling prices of its products to adequately mitigate the risk of material loss from the Company’s guarantees. Asof December 30, 2012, the Company’s maximum exposure, if both of these cooperatives borrowed up to theiraggregate borrowing capacity, would have been $72.8 million including the Company’s equity interest. See Note13 and Note 18 of the consolidated financial statements for additional information.
Aggregate Contractual Obligations
The following table summarizes the Company’s contractual obligations and commercial commitments as ofDecember 30, 2012:
Payments Due by Period
In Thousands Total 2013 2014-2015 2016-20172018 and
Thereafter
Contractual obligations:Total debt, net of interest . . . . $ 423,386 $ 20,000 $100,000 $194,757 $108,629Capital lease obligations, net
of interest . . . . . . . . . . . . . . . 69,581 5,230 11,939 14,162 38,250Estimated interest on debt and
capital leaseobligations(1) . . . . . . . . . . . 114,703 26,204 46,521 25,436 16,542
Purchase obligations(2) . . . . . . 133,060 93,925 39,135 — —Other long-term
liabilities(3) . . . . . . . . . . . . . 124,846 12,393 18,050 13,277 81,126Operating leases . . . . . . . . . . . 40,846 5,974 9,936 6,702 18,234Long-term contractual
arrangements(4) . . . . . . . . . . 35,985 9,330 13,972 5,950 6,733Postretirement obligations . . . . 69,828 2,653 6,046 7,210 53,919Purchase orders(5) . . . . . . . . . . 35,029 35,029 — — —
Total contractual obligations . . . . . . $1,047,264 $210,738 $245,599 $267,494 $323,433
50
(1) Includes interest payments based on contractual terms.
(2) Represents an estimate of the Company’s obligation to purchase 17.5 million cases of finished product on anannual basis through May 2014 from South Atlantic Canners, a manufacturing cooperative.
(3) Includes obligations under executive benefit plans, the liability to exit from a multi-employer pension planand other long-term liabilities.
(4) Includes contractual arrangements with certain prestige properties, athletic venues and other locations, andother long-term marketing commitments.
(5) Purchase orders include commitments in which a written purchase order has been issued to a vendor, but thegoods have not been received or the services performed.
The Company has $5.5 million of uncertain tax positions including accrued interest, as of December 30,2012 (excluded from other long-term liabilities in the table above because the Company is uncertain if or whensuch amounts will be recognized) of which $3.0 million would affect the Company’s effective tax rate ifrecognized. While it is expected that the amount of uncertain tax positions may change in the next 12 months, theCompany does not expect such change would have a significant impact on the consolidated financial statements.See Note 14 of the consolidated financial statements for additional information.
The Company is a member of Southeastern Container, a plastic bottle manufacturing cooperative, fromwhich the Company is obligated to purchase at least 80% of its requirements of plastic bottles for certaindesignated territories. This obligation is not included in the Company’s table of contractual obligations andcommercial commitments since there are no minimum purchase requirements. See Note 13 and Note 18 to theconsolidated financial statements for additional information related to Southeastern.
As of December 30, 2012, the Company had $20.8 million of standby letters of credit, primarily related toits property and casualty insurance programs. See Note 13 of the consolidated financial statements for additionalinformation related to commercial commitments, guarantees, legal and tax matters.
The Company contributed $25.0 million to its two Company-sponsored pension plans in 2012. Based oninformation currently available, the Company estimates it will be required to make cash contributions in 2013 inthe range of $1 million to $5 million to those two plans. Postretirement medical care payments are expected to beapproximately $3 million in 2013. See Note 17 to the consolidated financial statements for additional informationrelated to pension and postretirement obligations.
Hedging Activities
Interest Rate Hedging
The Company periodically uses interest rate hedging products to mitigate risk from interest rate fluctuations.The Company has historically altered its fixed/floating rate mix based upon anticipated cash flows fromoperations relative to the Company’s debt level and the potential impact of changes in interest rates on theCompany’s overall financial condition. Sensitivity analyses are performed to review the impact on theCompany’s financial position and coverage of various interest rate movements. The Company does not usederivative financial instruments for trading purposes nor does it use leveraged financial instruments.
The Company has not had any interest rate swap agreements outstanding since September 2008.
Interest expense was reduced by $1.1 million, $1.2 million and $1.2 million due to amortization of thedeferred gains on previously terminated interest rate swap agreements and forward interest rate agreementsduring 2012, 2011 and 2010, respectively. Interest expense will be reduced by the amortization of these deferredgains in 2013 through 2015 as follows: $.5 million, $.6 million, and $.1 million, respectively.
As of December 30, 2012 and January 1, 2012, the Company had a weighted average interest rate of 5.9%and 6.0%, respectively, for its outstanding debt and capital lease obligations. The Company’s overall weighted
51
average interest rate on its debt and capital lease obligations increased to 6.1% in 2012 from 6.0% in 2011. As ofDecember 30, 2012, $50.0 million of the Company’s debt and capital lease obligations of $493.0 million wasmaintained on a floating rate basis or was subject to changes in short-term interest rates.
Commodity Hedging
The Company entered into derivative instruments to hedge certain commodity purchases for 2013, 2011 and2010. The Company pays fees for these instruments which are amortized over the corresponding period of theinstrument. The Company accounts for its commodity hedges on a mark-to-market basis with any expense orincome reflected as an adjustment of cost of sales or S,D&A expenses.
The Company uses several different financial institutions for commodity derivative instruments to minimizethe concentration of credit risk. The Company has master agreements with the counterparties to its derivativefinancial agreements that provide for net settlement of derivative transactions.
The net impact of the commodity hedges was to decrease the cost of sales by $.5 million in 2012, increasethe cost of sales by $2.3 million in 2011 and increase the cost of sales by $2.6 million in 2010 and to increaseS,D&A expenses by $.6 million and $1.7 million in 2011 and 2010, respectively.
52
CAUTIONARY INFORMATION REGARDING FORWARD-LOOKING STATEMENTS
This Annual Report on Form 10-K, as well as information included in future filings by the Company withthe Securities and Exchange Commission and information contained in written material, press releases and oralstatements issued by or on behalf of the Company, contains, or may contain, forward-looking managementcomments and other statements that reflect management’s current outlook for future periods. These statementsinclude, among others, statements relating to:
• the Company’s belief that the covenants on its $200 million facility will not restrict its liquidity or capitalresources;
• the Company’s belief that other parties to certain contractual arrangements will perform their obligations;
• the Company’s potential marketing funding support from The Coca-Cola Company and other beveragecompanies;
• the Company’s belief that the risk of loss with respect to funds deposited with banks is minimal;
• the Company’s belief that disposition of certain claims and legal proceedings will not have a materialadverse effect on its financial condition, cash flows or results of operations and that no material amountof loss in excess of recorded amounts is reasonably possible as a result of these claims and legalproceedings;
• the Company’s belief that the Company has adequately provided for any ultimate amounts that are likelyto result from tax audits;
• the Company’s belief that the Company has sufficient resources available to finance its business plan,meet its working capital requirements and maintain an appropriate level of capital spending;
• the Company’s belief that the cooperatives whose debt the Company guarantees have sufficient assets andthe ability to adjust selling prices of their products to adequately mitigate the risk of material loss and thatthe cooperatives will perform their obligations under their debt commitments;
• the Company’s belief that certain franchise rights are perpetual or will be renewed upon expiration;
• the Company’s key priorities which are revenue management, product innovation and beverage portfolioexpansion, distribution cost management and productivity;
• the Company’s expectation that new product introductions, packaging changes and sales promotions willcontinue to require substantial expenditures;
• the Company’s belief that there is substantial and effective competition in each of the exclusivegeographic territories in the United States in which it operates for the purposes of the United States SoftDrink Interbrand Competition Act;
• the Company’s belief that it may market and sell nationally certain products it has developed and owns;
• the Company’s belief that cash requirements for income taxes will be in the range of $18 million to$25 million in 2013;
• the Company’s anticipation that pension expense related to the two Company-sponsored pension plans isestimated to be approximately $2 million in 2013;
• the Company’s belief that cash contributions in 2013 to its two Company-sponsored pension plans will bein the range of $1 million to $5 million;
• the Company’s belief that postretirement benefit payments are expected to be approximately $3 million in2013;
• the Company’s expectation that additions to property, plant and equipment in 2013 will be in the range of$75 million to $85 million;
53
• the Company’s belief that compliance with environmental laws will not have a material adverse effect onits capital expenditures, earnings or competitive position;
• the Company’s belief that the majority of its deferred tax assets will be realized;
• the Company’s intention to renew substantially all the Allied Beverage Agreements and Still BeverageAgreements as they expire;
• the Company’s beliefs and estimates regarding the impact of the adoption of certain new accountingpronouncements;
• the Company’s expectations that raw materials will rise significantly in 2013 and that gross margins willbe lower throughout 2013 compared to 2012, if these costs cannot be offset with price increases;
• the Company’s belief that innovation of new brands and packages will continue to be critical to theCompany’s overall revenue;
• the Company’s beliefs that the growth prospects of Company-owned or exclusive licensed brands appearpromising and the cost of developing, marketing and distributing these brands may be significant;
• the Company’s expectation that uncertain tax positions may change over the next 12 months but will nothave a significant impact on the consolidated financial statements;
• the Company’s belief that all of the banks participating in the Company’s $200 million facility have theability to and will meet any funding requests from the Company;
• the Company’s belief that it is competitive in its territories with respect to the principal methods ofcompetition in the nonalcoholic beverage industry;
• the Company’s hypothetical calculation of the impact of a 1% increase in interest rates on outstandingfloating rate debt and capital lease obligations for the next twelve months as of December 30, 2012; and
• the Company’s estimate that a 10% increase in the market price of certain commodities over the currentmarket prices would cumulatively increase costs during the next 12 months by approximately $23 millionassuming no change in volume.
These statements and expectations are based on currently available competitive, financial and economic dataalong with the Company’s operating plans, and are subject to future events and uncertainties that could causeanticipated events not to occur or actual results to differ materially from historical or anticipated results. Factorsthat could impact those differences or adversely affect future periods include, but are not limited to, the factorsset forth under Item 1A. — Risk Factors.
Caution should be taken not to place undue reliance on the Company’s forward-looking statements, whichreflect the expectations of management of the Company only as of the time such statements are made. TheCompany undertakes no obligation to publicly update or revise any forward-looking statements, whether as aresult of new information, future events or otherwise.
54
Item 7A. Quantitative and Qualitative Disclosures about Market Risk
The Company is exposed to certain market risks that arise in the ordinary course of business. The Companymay enter into derivative financial instrument transactions to manage or reduce market risk. The Company doesnot enter into derivative financial instrument transactions for trading purposes. A discussion of the Company’sprimary market risk exposure and interest rate risk is presented below.
Debt and Derivative Financial Instruments
The Company is subject to interest rate risk on its fixed and floating rate debt. The Company periodicallyuses interest rate hedging products to modify risk from interest rate fluctuations. The counterparties to theseinterest rate hedging arrangements were major financial institutions with which the Company also has otherfinancial relationships. The Company did not have any interest rate hedging products as of December 30, 2012.As of December 30, 2012, $50.0 million of the Company’s debt and capital lease obligations of $493.0 millionwere subject to changes in short-term interest rates.
As it relates to the Company’s variable rate debt, assuming no changes in the Company’s financial structure,if market interest rates average 1% more over the next twelve months than the interest rates as of December 30,2012, interest expense for the next twelve months would increase by approximately $.3 million. This amount wasdetermined by calculating the effect of the hypothetical interest rate on our variable rate debt. This calculated,hypothetical increase in interest expense for the following twelve months may be different from the actualincrease in interest expense from a 1% increase in interest rates due to varying interest rate reset dates on theCompany’s floating rate debt.
Raw Material and Commodity Prices
The Company is also subject to commodity price risk arising from price movements for certain commoditiesincluded as part of its raw materials. The Company manages this commodity price risk in some cases by enteringinto contracts with adjustable prices. The Company periodically uses derivative commodity instruments in themanagement of this risk. The Company estimates that a 10% increase in the market prices of these commoditiesover the current market prices would cumulatively increase costs during the next 12 months by approximately$23 million assuming no change in volume.
In the third quarter of 2012, the Company entered into agreements to hedge a portion of the Company’s2013 aluminum purchases. The Company paid a fee for these instruments which will be amortized over thecorresponding period of the instruments. The Company accounts for its aluminum hedges on a mark-to-marketbasis with any expense or income being reflected as an adjustment to cost of sales.
Effect of Changing Prices
The annual rate of inflation in the United States, as measured by year-over-year changes in the consumerprice index, was 1.7% in 2012 compared to 3.0% in 2011 and 1.5% in 2010. Inflation in the prices of thosecommodities important to the Company’s business is reflected in changes in the consumer price index, butcommodity prices are volatile and can and have in recent years increased at a faster rate than the rate of inflationas measured by the consumer price index.
The principal effect of inflation in both commodity and consumer prices on the Company’s operating resultsis to increase costs for both cost of sales and selling, delivery and administrative expenses. Although theCompany can offset these cost increases by increasing selling prices for its products, consumers may not have thebuying power to cover those increased costs and may reduce their volume of purchases of those products. In thatevent, selling price increases may not be sufficient to offset completely the Company’s cost increases.
55
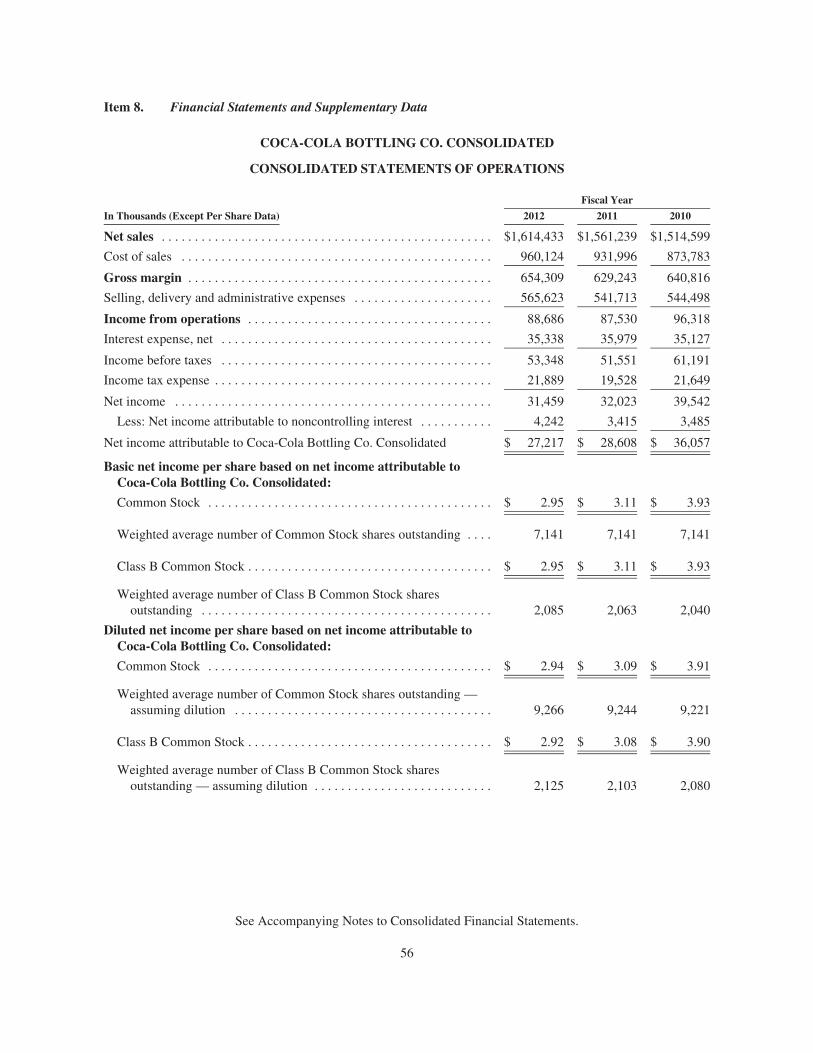
Item 8. Financial Statements and Supplementary Data
COCA-COLA BOTTLING CO. CONSOLIDATED
CONSOLIDATED STATEMENTS OF OPERATIONS
Fiscal Year
In Thousands (Except Per Share Data) 2012 2011 2010
Net sales . . . . . . . . . . . . . . . . . . . . . . . . . . . . . . . . . . . . . . . . . . . . . . . . . . $1,614,433 $1,561,239 $1,514,599
Cost of sales . . . . . . . . . . . . . . . . . . . . . . . . . . . . . . . . . . . . . . . . . . . . . . . 960,124 931,996 873,783
Gross margin . . . . . . . . . . . . . . . . . . . . . . . . . . . . . . . . . . . . . . . . . . . . . . 654,309 629,243 640,816
Selling, delivery and administrative expenses . . . . . . . . . . . . . . . . . . . . . 565,623 541,713 544,498
Income from operations . . . . . . . . . . . . . . . . . . . . . . . . . . . . . . . . . . . . . 88,686 87,530 96,318
Interest expense, net . . . . . . . . . . . . . . . . . . . . . . . . . . . . . . . . . . . . . . . . . 35,338 35,979 35,127
Income before taxes . . . . . . . . . . . . . . . . . . . . . . . . . . . . . . . . . . . . . . . . . 53,348 51,551 61,191
Income tax expense . . . . . . . . . . . . . . . . . . . . . . . . . . . . . . . . . . . . . . . . . . 21,889 19,528 21,649
Net income . . . . . . . . . . . . . . . . . . . . . . . . . . . . . . . . . . . . . . . . . . . . . . . . 31,459 32,023 39,542
Less: Net income attributable to noncontrolling interest . . . . . . . . . . . 4,242 3,415 3,485
Net income attributable to Coca-Cola Bottling Co. Consolidated $ 27,217 $ 28,608 $ 36,057
Basic net income per share based on net income attributable toCoca-Cola Bottling Co. Consolidated:
Common Stock . . . . . . . . . . . . . . . . . . . . . . . . . . . . . . . . . . . . . . . . . . . $ 2.95 $ 3.11 $ 3.93
Weighted average number of Common Stock shares outstanding . . . . 7,141 7,141 7,141
Class B Common Stock . . . . . . . . . . . . . . . . . . . . . . . . . . . . . . . . . . . . . $ 2.95 $ 3.11 $ 3.93
Weighted average number of Class B Common Stock sharesoutstanding . . . . . . . . . . . . . . . . . . . . . . . . . . . . . . . . . . . . . . . . . . . . 2,085 2,063 2,040
Diluted net income per share based on net income attributable toCoca-Cola Bottling Co. Consolidated:
Common Stock . . . . . . . . . . . . . . . . . . . . . . . . . . . . . . . . . . . . . . . . . . . $ 2.94 $ 3.09 $ 3.91
Weighted average number of Common Stock shares outstanding —assuming dilution . . . . . . . . . . . . . . . . . . . . . . . . . . . . . . . . . . . . . . . 9,266 9,244 9,221
Class B Common Stock . . . . . . . . . . . . . . . . . . . . . . . . . . . . . . . . . . . . . $ 2.92 $ 3.08 $ 3.90
Weighted average number of Class B Common Stock sharesoutstanding — assuming dilution . . . . . . . . . . . . . . . . . . . . . . . . . . . 2,125 2,103 2,080
See Accompanying Notes to Consolidated Financial Statements.
56
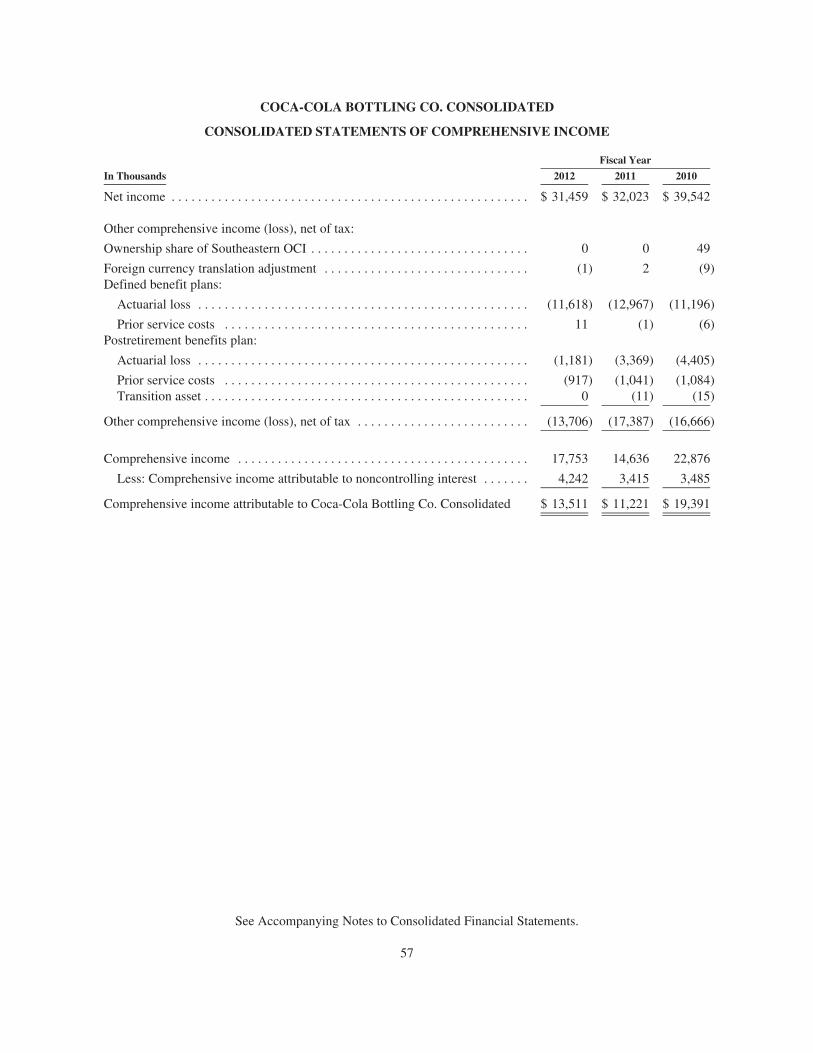
COCA-COLA BOTTLING CO. CONSOLIDATED
CONSOLIDATED STATEMENTS OF COMPREHENSIVE INCOME
Fiscal Year
In Thousands 2012 2011 2010
Net income . . . . . . . . . . . . . . . . . . . . . . . . . . . . . . . . . . . . . . . . . . . . . . . . . . . . . . $ 31,459 $ 32,023 $ 39,542
Other comprehensive income (loss), net of tax:
Ownership share of Southeastern OCI . . . . . . . . . . . . . . . . . . . . . . . . . . . . . . . . . 0 0 49
Foreign currency translation adjustment . . . . . . . . . . . . . . . . . . . . . . . . . . . . . . . (1) 2 (9)Defined benefit plans:
Actuarial loss . . . . . . . . . . . . . . . . . . . . . . . . . . . . . . . . . . . . . . . . . . . . . . . . . . (11,618) (12,967) (11,196)
Prior service costs . . . . . . . . . . . . . . . . . . . . . . . . . . . . . . . . . . . . . . . . . . . . . . 11 (1) (6)Postretirement benefits plan:
Actuarial loss . . . . . . . . . . . . . . . . . . . . . . . . . . . . . . . . . . . . . . . . . . . . . . . . . . (1,181) (3,369) (4,405)
Prior service costs . . . . . . . . . . . . . . . . . . . . . . . . . . . . . . . . . . . . . . . . . . . . . . (917) (1,041) (1,084)Transition asset . . . . . . . . . . . . . . . . . . . . . . . . . . . . . . . . . . . . . . . . . . . . . . . . . 0 (11) (15)
Other comprehensive income (loss), net of tax . . . . . . . . . . . . . . . . . . . . . . . . . . (13,706) (17,387) (16,666)
Comprehensive income . . . . . . . . . . . . . . . . . . . . . . . . . . . . . . . . . . . . . . . . . . . . 17,753 14,636 22,876
Less: Comprehensive income attributable to noncontrolling interest . . . . . . . 4,242 3,415 3,485
Comprehensive income attributable to Coca-Cola Bottling Co. Consolidated $ 13,511 $ 11,221 $ 19,391
See Accompanying Notes to Consolidated Financial Statements.
57
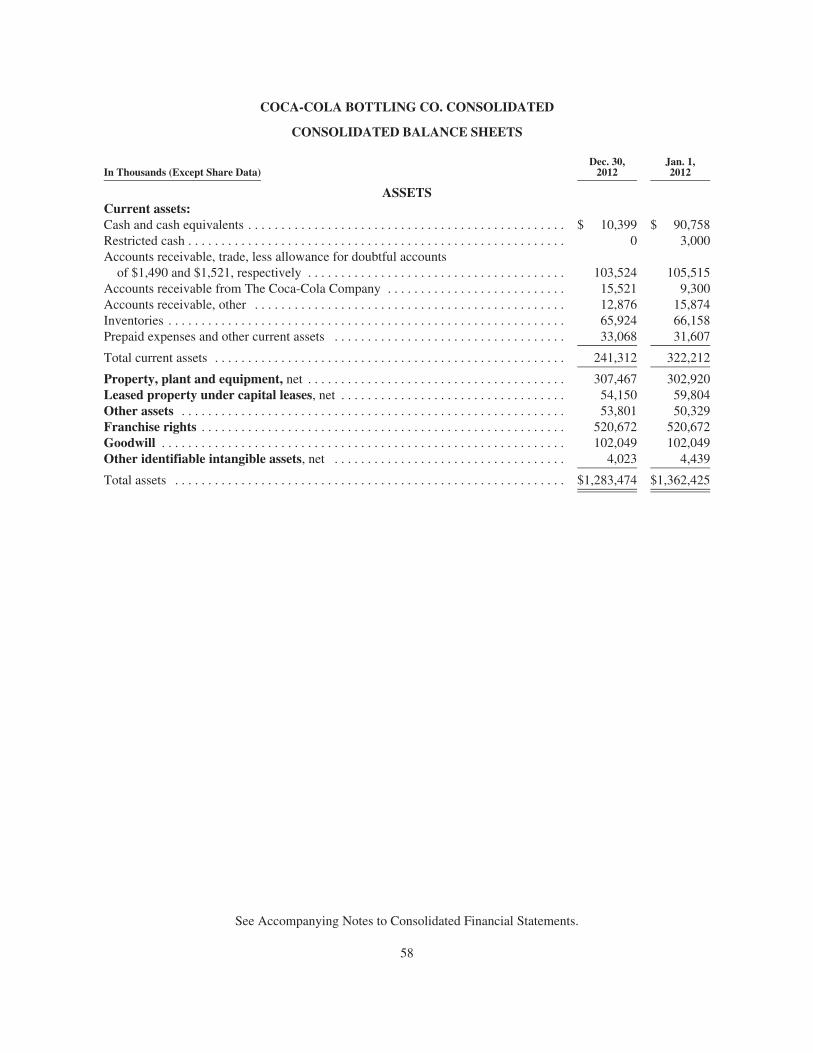
COCA-COLA BOTTLING CO. CONSOLIDATED
CONSOLIDATED BALANCE SHEETS
In Thousands (Except Share Data)Dec. 30,
2012Jan. 1,2012
ASSETSCurrent assets:Cash and cash equivalents . . . . . . . . . . . . . . . . . . . . . . . . . . . . . . . . . . . . . . . . . . . . . . . . $ 10,399 $ 90,758Restricted cash . . . . . . . . . . . . . . . . . . . . . . . . . . . . . . . . . . . . . . . . . . . . . . . . . . . . . . . . . 0 3,000Accounts receivable, trade, less allowance for doubtful accounts
of $1,490 and $1,521, respectively . . . . . . . . . . . . . . . . . . . . . . . . . . . . . . . . . . . . . . . 103,524 105,515Accounts receivable from The Coca-Cola Company . . . . . . . . . . . . . . . . . . . . . . . . . . . 15,521 9,300Accounts receivable, other . . . . . . . . . . . . . . . . . . . . . . . . . . . . . . . . . . . . . . . . . . . . . . . 12,876 15,874Inventories . . . . . . . . . . . . . . . . . . . . . . . . . . . . . . . . . . . . . . . . . . . . . . . . . . . . . . . . . . . . 65,924 66,158Prepaid expenses and other current assets . . . . . . . . . . . . . . . . . . . . . . . . . . . . . . . . . . . 33,068 31,607
Total current assets . . . . . . . . . . . . . . . . . . . . . . . . . . . . . . . . . . . . . . . . . . . . . . . . . . . . . 241,312 322,212
Property, plant and equipment, net . . . . . . . . . . . . . . . . . . . . . . . . . . . . . . . . . . . . . . . 307,467 302,920Leased property under capital leases, net . . . . . . . . . . . . . . . . . . . . . . . . . . . . . . . . . . 54,150 59,804Other assets . . . . . . . . . . . . . . . . . . . . . . . . . . . . . . . . . . . . . . . . . . . . . . . . . . . . . . . . . . 53,801 50,329Franchise rights . . . . . . . . . . . . . . . . . . . . . . . . . . . . . . . . . . . . . . . . . . . . . . . . . . . . . . . 520,672 520,672Goodwill . . . . . . . . . . . . . . . . . . . . . . . . . . . . . . . . . . . . . . . . . . . . . . . . . . . . . . . . . . . . . 102,049 102,049Other identifiable intangible assets, net . . . . . . . . . . . . . . . . . . . . . . . . . . . . . . . . . . . 4,023 4,439
Total assets . . . . . . . . . . . . . . . . . . . . . . . . . . . . . . . . . . . . . . . . . . . . . . . . . . . . . . . . . . . $1,283,474 $1,362,425
See Accompanying Notes to Consolidated Financial Statements.
58
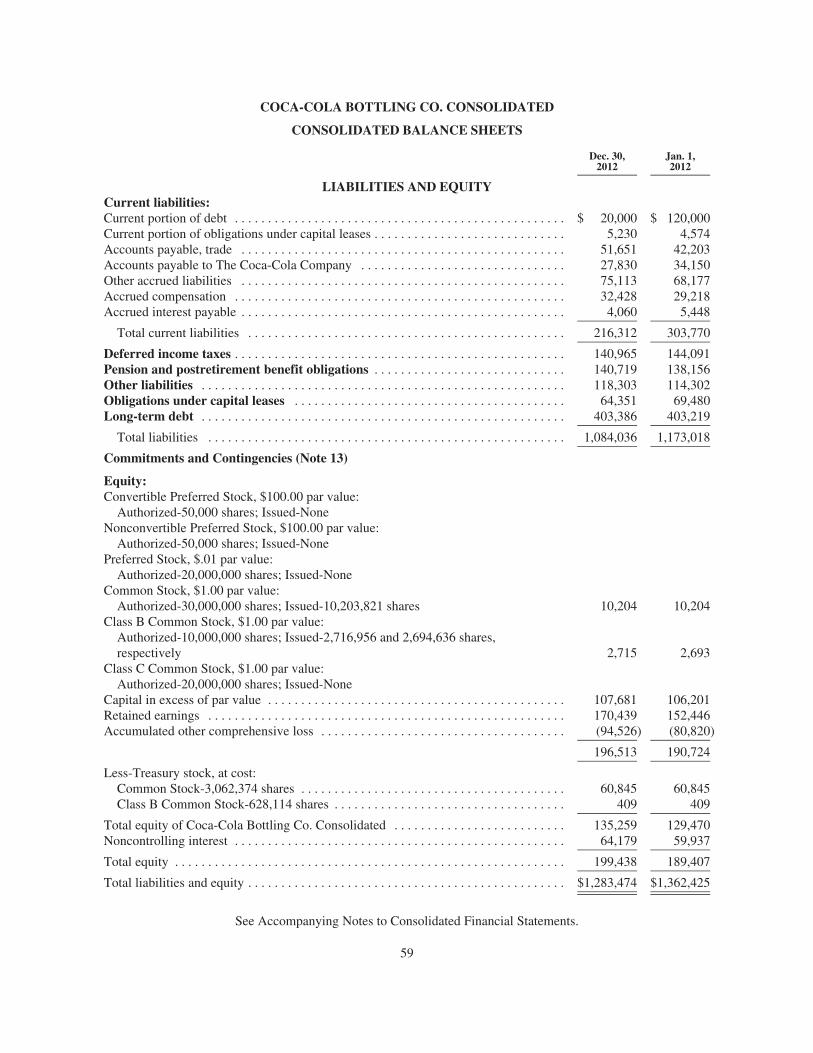
COCA-COLA BOTTLING CO. CONSOLIDATED
CONSOLIDATED BALANCE SHEETS
Dec. 30,2012
Jan. 1,2012
LIABILITIES AND EQUITYCurrent liabilities:Current portion of debt . . . . . . . . . . . . . . . . . . . . . . . . . . . . . . . . . . . . . . . . . . . . . . . . . . $ 20,000 $ 120,000Current portion of obligations under capital leases . . . . . . . . . . . . . . . . . . . . . . . . . . . . . 5,230 4,574Accounts payable, trade . . . . . . . . . . . . . . . . . . . . . . . . . . . . . . . . . . . . . . . . . . . . . . . . . 51,651 42,203Accounts payable to The Coca-Cola Company . . . . . . . . . . . . . . . . . . . . . . . . . . . . . . . 27,830 34,150Other accrued liabilities . . . . . . . . . . . . . . . . . . . . . . . . . . . . . . . . . . . . . . . . . . . . . . . . . 75,113 68,177Accrued compensation . . . . . . . . . . . . . . . . . . . . . . . . . . . . . . . . . . . . . . . . . . . . . . . . . . 32,428 29,218Accrued interest payable . . . . . . . . . . . . . . . . . . . . . . . . . . . . . . . . . . . . . . . . . . . . . . . . . 4,060 5,448
Total current liabilities . . . . . . . . . . . . . . . . . . . . . . . . . . . . . . . . . . . . . . . . . . . . . . . . 216,312 303,770
Deferred income taxes . . . . . . . . . . . . . . . . . . . . . . . . . . . . . . . . . . . . . . . . . . . . . . . . . . 140,965 144,091Pension and postretirement benefit obligations . . . . . . . . . . . . . . . . . . . . . . . . . . . . . 140,719 138,156Other liabilities . . . . . . . . . . . . . . . . . . . . . . . . . . . . . . . . . . . . . . . . . . . . . . . . . . . . . . . 118,303 114,302Obligations under capital leases . . . . . . . . . . . . . . . . . . . . . . . . . . . . . . . . . . . . . . . . . 64,351 69,480Long-term debt . . . . . . . . . . . . . . . . . . . . . . . . . . . . . . . . . . . . . . . . . . . . . . . . . . . . . . . 403,386 403,219
Total liabilities . . . . . . . . . . . . . . . . . . . . . . . . . . . . . . . . . . . . . . . . . . . . . . . . . . . . . . 1,084,036 1,173,018
Commitments and Contingencies (Note 13)
Equity:Convertible Preferred Stock, $100.00 par value:
Authorized-50,000 shares; Issued-NoneNonconvertible Preferred Stock, $100.00 par value:
Authorized-50,000 shares; Issued-NonePreferred Stock, $.01 par value:
Authorized-20,000,000 shares; Issued-NoneCommon Stock, $1.00 par value:
Authorized-30,000,000 shares; Issued-10,203,821 shares 10,204 10,204Class B Common Stock, $1.00 par value:
Authorized-10,000,000 shares; Issued-2,716,956 and 2,694,636 shares,respectively 2,715 2,693
Class C Common Stock, $1.00 par value:Authorized-20,000,000 shares; Issued-None
Capital in excess of par value . . . . . . . . . . . . . . . . . . . . . . . . . . . . . . . . . . . . . . . . . . . . . 107,681 106,201Retained earnings . . . . . . . . . . . . . . . . . . . . . . . . . . . . . . . . . . . . . . . . . . . . . . . . . . . . . . 170,439 152,446Accumulated other comprehensive loss . . . . . . . . . . . . . . . . . . . . . . . . . . . . . . . . . . . . . (94,526) (80,820)
196,513 190,724
Less-Treasury stock, at cost:Common Stock-3,062,374 shares . . . . . . . . . . . . . . . . . . . . . . . . . . . . . . . . . . . . . . . . 60,845 60,845Class B Common Stock-628,114 shares . . . . . . . . . . . . . . . . . . . . . . . . . . . . . . . . . . . 409 409
Total equity of Coca-Cola Bottling Co. Consolidated . . . . . . . . . . . . . . . . . . . . . . . . . . 135,259 129,470Noncontrolling interest . . . . . . . . . . . . . . . . . . . . . . . . . . . . . . . . . . . . . . . . . . . . . . . . . . 64,179 59,937
Total equity . . . . . . . . . . . . . . . . . . . . . . . . . . . . . . . . . . . . . . . . . . . . . . . . . . . . . . . . . . . 199,438 189,407
Total liabilities and equity . . . . . . . . . . . . . . . . . . . . . . . . . . . . . . . . . . . . . . . . . . . . . . . . $1,283,474 $1,362,425
See Accompanying Notes to Consolidated Financial Statements.
59
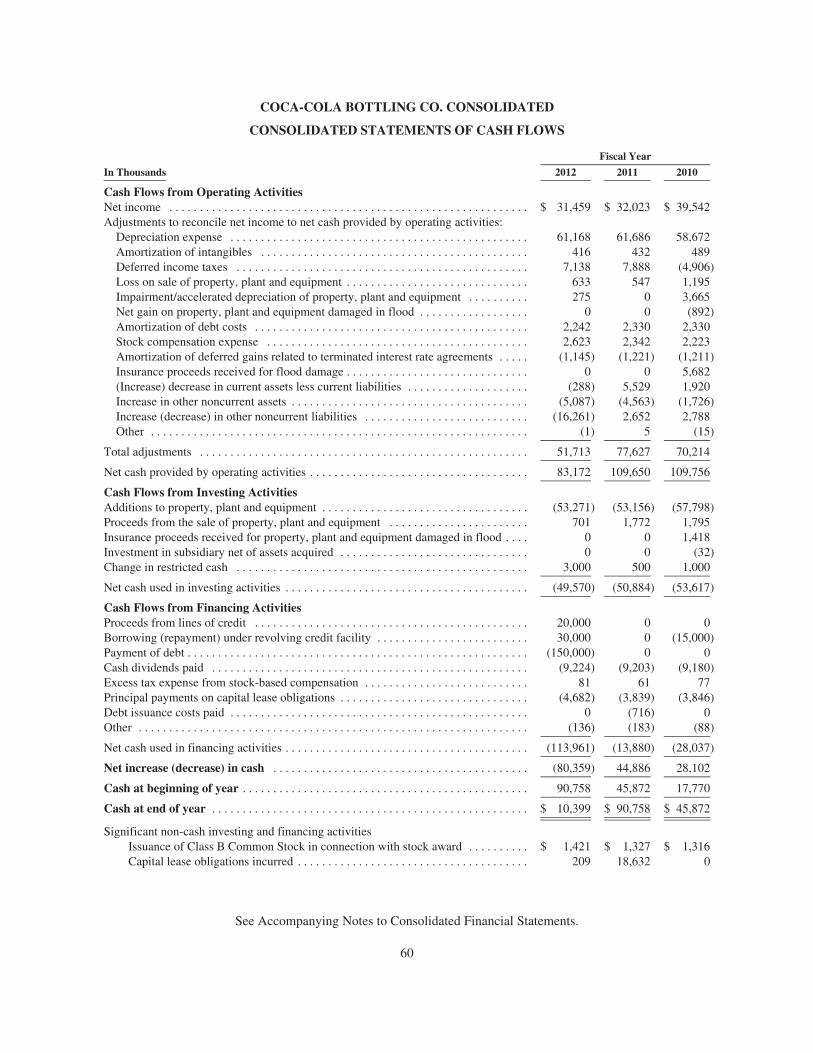
COCA-COLA BOTTLING CO. CONSOLIDATED
CONSOLIDATED STATEMENTS OF CASH FLOWS
Fiscal Year
In Thousands 2012 2011 2010
Cash Flows from Operating ActivitiesNet income . . . . . . . . . . . . . . . . . . . . . . . . . . . . . . . . . . . . . . . . . . . . . . . . . . . . . . . . . . . $ 31,459 $ 32,023 $ 39,542Adjustments to reconcile net income to net cash provided by operating activities:
Depreciation expense . . . . . . . . . . . . . . . . . . . . . . . . . . . . . . . . . . . . . . . . . . . . . . . . . 61,168 61,686 58,672Amortization of intangibles . . . . . . . . . . . . . . . . . . . . . . . . . . . . . . . . . . . . . . . . . . . . 416 432 489Deferred income taxes . . . . . . . . . . . . . . . . . . . . . . . . . . . . . . . . . . . . . . . . . . . . . . . . 7,138 7,888 (4,906)Loss on sale of property, plant and equipment . . . . . . . . . . . . . . . . . . . . . . . . . . . . . . 633 547 1,195Impairment/accelerated depreciation of property, plant and equipment . . . . . . . . . . 275 0 3,665Net gain on property, plant and equipment damaged in flood . . . . . . . . . . . . . . . . . . 0 0 (892)Amortization of debt costs . . . . . . . . . . . . . . . . . . . . . . . . . . . . . . . . . . . . . . . . . . . . . 2,242 2,330 2,330Stock compensation expense . . . . . . . . . . . . . . . . . . . . . . . . . . . . . . . . . . . . . . . . . . . 2,623 2,342 2,223Amortization of deferred gains related to terminated interest rate agreements . . . . . (1,145) (1,221) (1,211)Insurance proceeds received for flood damage . . . . . . . . . . . . . . . . . . . . . . . . . . . . . . 0 0 5,682(Increase) decrease in current assets less current liabilities . . . . . . . . . . . . . . . . . . . . (288) 5,529 1,920Increase in other noncurrent assets . . . . . . . . . . . . . . . . . . . . . . . . . . . . . . . . . . . . . . . (5,087) (4,563) (1,726)Increase (decrease) in other noncurrent liabilities . . . . . . . . . . . . . . . . . . . . . . . . . . . (16,261) 2,652 2,788Other . . . . . . . . . . . . . . . . . . . . . . . . . . . . . . . . . . . . . . . . . . . . . . . . . . . . . . . . . . . . . . (1) 5 (15)
Total adjustments . . . . . . . . . . . . . . . . . . . . . . . . . . . . . . . . . . . . . . . . . . . . . . . . . . . . . . 51,713 77,627 70,214
Net cash provided by operating activities . . . . . . . . . . . . . . . . . . . . . . . . . . . . . . . . . . . . 83,172 109,650 109,756
Cash Flows from Investing ActivitiesAdditions to property, plant and equipment . . . . . . . . . . . . . . . . . . . . . . . . . . . . . . . . . . (53,271) (53,156) (57,798)Proceeds from the sale of property, plant and equipment . . . . . . . . . . . . . . . . . . . . . . . 701 1,772 1,795Insurance proceeds received for property, plant and equipment damaged in flood . . . . 0 0 1,418Investment in subsidiary net of assets acquired . . . . . . . . . . . . . . . . . . . . . . . . . . . . . . . 0 0 (32)Change in restricted cash . . . . . . . . . . . . . . . . . . . . . . . . . . . . . . . . . . . . . . . . . . . . . . . . 3,000 500 1,000
Net cash used in investing activities . . . . . . . . . . . . . . . . . . . . . . . . . . . . . . . . . . . . . . . . (49,570) (50,884) (53,617)
Cash Flows from Financing ActivitiesProceeds from lines of credit . . . . . . . . . . . . . . . . . . . . . . . . . . . . . . . . . . . . . . . . . . . . . 20,000 0 0Borrowing (repayment) under revolving credit facility . . . . . . . . . . . . . . . . . . . . . . . . . 30,000 0 (15,000)Payment of debt . . . . . . . . . . . . . . . . . . . . . . . . . . . . . . . . . . . . . . . . . . . . . . . . . . . . . . . . (150,000) 0 0Cash dividends paid . . . . . . . . . . . . . . . . . . . . . . . . . . . . . . . . . . . . . . . . . . . . . . . . . . . . (9,224) (9,203) (9,180)Excess tax expense from stock-based compensation . . . . . . . . . . . . . . . . . . . . . . . . . . . 81 61 77Principal payments on capital lease obligations . . . . . . . . . . . . . . . . . . . . . . . . . . . . . . . (4,682) (3,839) (3,846)Debt issuance costs paid . . . . . . . . . . . . . . . . . . . . . . . . . . . . . . . . . . . . . . . . . . . . . . . . . 0 (716) 0Other . . . . . . . . . . . . . . . . . . . . . . . . . . . . . . . . . . . . . . . . . . . . . . . . . . . . . . . . . . . . . . . . (136) (183) (88)
Net cash used in financing activities . . . . . . . . . . . . . . . . . . . . . . . . . . . . . . . . . . . . . . . . (113,961) (13,880) (28,037)
Net increase (decrease) in cash . . . . . . . . . . . . . . . . . . . . . . . . . . . . . . . . . . . . . . . . . . (80,359) 44,886 28,102
Cash at beginning of year . . . . . . . . . . . . . . . . . . . . . . . . . . . . . . . . . . . . . . . . . . . . . . . 90,758 45,872 17,770
Cash at end of year . . . . . . . . . . . . . . . . . . . . . . . . . . . . . . . . . . . . . . . . . . . . . . . . . . . . $ 10,399 $ 90,758 $ 45,872
Significant non-cash investing and financing activitiesIssuance of Class B Common Stock in connection with stock award . . . . . . . . . . $ 1,421 $ 1,327 $ 1,316Capital lease obligations incurred . . . . . . . . . . . . . . . . . . . . . . . . . . . . . . . . . . . . . . 209 18,632 0
See Accompanying Notes to Consolidated Financial Statements.
60

COCA-COLA BOTTLING CO. CONSOLIDATED
CONSOLIDATED STATEMENTS OF CHANGES IN STOCKHOLDERS’ EQUITY
In Thousands(Except Share Data)
CommonStock
Class BCommon
Stock
Capital inExcess of
ParValue
RetainedEarnings
AccumulatedOther
ComprehensiveLoss
TreasuryStock
TotalEquity ofCCBCC
NoncontrollingInterest
TotalEquity
Balance on Jan. 3, 2010 . . . . . . . $10,204 $2,649 $103,464 $107,995 $(46,767) $(61,254) $116,291 $52,804 $169,095
Revision of prior period(Note 1) . . . . . . . . . . . . . . . . . (1,831) (1,831) (1,831)
Revised beginning balance . . . . . $10,204 $2,649 $103,464 $106,164 $(46,767) $(61,254) $114,460 $52,804 $167,264
Net income . . . . . . . . . . . . . . . . . 36,057 36,057 3,485 39,542Other comprehensive income
(loss), net of tax . . . . . . . . . . . (16,666) (16,666) (16,666)Acquisition of noncontrolling
interest . . . . . . . . . . . . . . . . . . 233 233Cash dividends paid
Common ($1 per share) . . . . . (7,141) (7,141) (7,141)Class B Common ($1 per
share) . . . . . . . . . . . . . . . . . (2,039) (2,039) (2,039)Issuance of 22,320 shares of
Class B Common Stock . . . . . 22 1,294 1,316 1,316Stock compensation
adjustment . . . . . . . . . . . . . . . 77 77 77
Balance on Jan. 2, 2011 . . . . . . . $10,204 $2,671 $104,835 $133,041 $(63,433) $(61,254) $126,064 $56,522 $182,586
Net income . . . . . . . . . . . . . . . . . 28,608 28,608 3,415 32,023Other comprehensive income
(loss), net of tax . . . . . . . . . . . (17,387) (17,387) (17,387)Cash dividends paid
Common ($1 per share) . . . . . (7,141) (7,141) (7,141)Class B Common ($1 per
share) . . . . . . . . . . . . . . . . . (2,062) (2,062) (2,062)Issuance of 22,320 shares of
Class B Common Stock . . . . . 22 1,305 1,327 1,327Stock compensation
adjustment . . . . . . . . . . . . . . . 61 61 61
Balance on Jan. 1, 2012 . . . . . . . $10,204 $2,693 $106,201 $152,446 $(80,820) $(61,254) $129,470 $59,937 $189,407
Net income . . . . . . . . . . . . . . . . . 27,217 27,217 4,242 31,459Other comprehensive income
(loss), net of tax . . . . . . . . . . . (13,706) (13,706) (13,706)Cash dividends paid
Common ($1 per share) . . . . . (7,141) (7,141) (7,141)Class B Common ($1 per
share) . . . . . . . . . . . . . . . . . (2,083) (2,083) (2,083)Issuance of 22,320 shares of
Class B Common Stock . . . . . 22 1,399 1,421 1,421Stock compensation
adjustment . . . . . . . . . . . . . . . 81 81 81
Balance on Dec. 30, 2012 . . . . . $10,204 $2,715 $107,681 $170,439 $(94,526) $(61,254) $135,259 $64,179 $199,438
See Accompanying Notes to Consolidated Financial Statements.
61
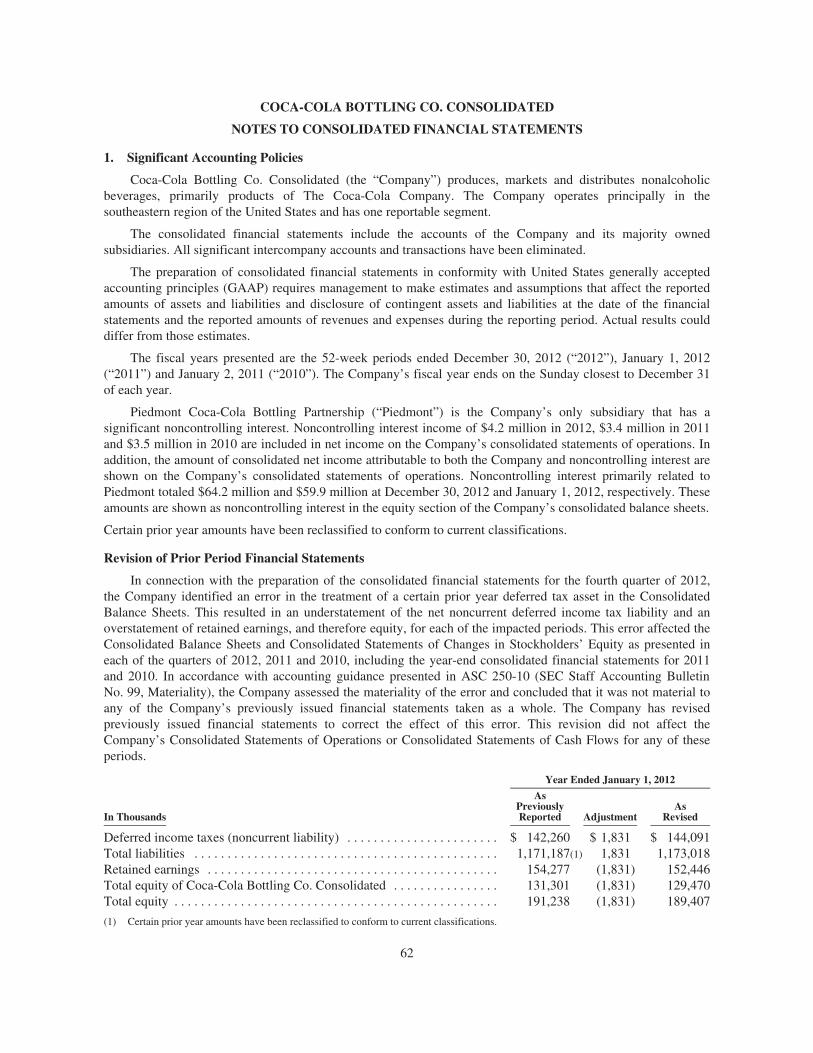
COCA-COLA BOTTLING CO. CONSOLIDATED
NOTES TO CONSOLIDATED FINANCIAL STATEMENTS
1. Significant Accounting Policies
Coca-Cola Bottling Co. Consolidated (the “Company”) produces, markets and distributes nonalcoholicbeverages, primarily products of The Coca-Cola Company. The Company operates principally in thesoutheastern region of the United States and has one reportable segment.
The consolidated financial statements include the accounts of the Company and its majority ownedsubsidiaries. All significant intercompany accounts and transactions have been eliminated.
The preparation of consolidated financial statements in conformity with United States generally acceptedaccounting principles (GAAP) requires management to make estimates and assumptions that affect the reportedamounts of assets and liabilities and disclosure of contingent assets and liabilities at the date of the financialstatements and the reported amounts of revenues and expenses during the reporting period. Actual results coulddiffer from those estimates.
The fiscal years presented are the 52-week periods ended December 30, 2012 (“2012”), January 1, 2012(“2011”) and January 2, 2011 (“2010”). The Company’s fiscal year ends on the Sunday closest to December 31of each year.
Piedmont Coca-Cola Bottling Partnership (“Piedmont”) is the Company’s only subsidiary that has asignificant noncontrolling interest. Noncontrolling interest income of $4.2 million in 2012, $3.4 million in 2011and $3.5 million in 2010 are included in net income on the Company’s consolidated statements of operations. Inaddition, the amount of consolidated net income attributable to both the Company and noncontrolling interest areshown on the Company’s consolidated statements of operations. Noncontrolling interest primarily related toPiedmont totaled $64.2 million and $59.9 million at December 30, 2012 and January 1, 2012, respectively. Theseamounts are shown as noncontrolling interest in the equity section of the Company’s consolidated balance sheets.
Certain prior year amounts have been reclassified to conform to current classifications.
Revision of Prior Period Financial Statements
In connection with the preparation of the consolidated financial statements for the fourth quarter of 2012,the Company identified an error in the treatment of a certain prior year deferred tax asset in the ConsolidatedBalance Sheets. This resulted in an understatement of the net noncurrent deferred income tax liability and anoverstatement of retained earnings, and therefore equity, for each of the impacted periods. This error affected theConsolidated Balance Sheets and Consolidated Statements of Changes in Stockholders’ Equity as presented ineach of the quarters of 2012, 2011 and 2010, including the year-end consolidated financial statements for 2011and 2010. In accordance with accounting guidance presented in ASC 250-10 (SEC Staff Accounting BulletinNo. 99, Materiality), the Company assessed the materiality of the error and concluded that it was not material toany of the Company’s previously issued financial statements taken as a whole. The Company has revisedpreviously issued financial statements to correct the effect of this error. This revision did not affect theCompany’s Consolidated Statements of Operations or Consolidated Statements of Cash Flows for any of theseperiods.
Year Ended January 1, 2012
In Thousands
AsPreviouslyReported Adjustment
AsRevised
Deferred income taxes (noncurrent liability) . . . . . . . . . . . . . . . . . . . . . . . $ 142,260 $ 1,831 $ 144,091Total liabilities . . . . . . . . . . . . . . . . . . . . . . . . . . . . . . . . . . . . . . . . . . . . . . 1,171,187(1) 1,831 1,173,018Retained earnings . . . . . . . . . . . . . . . . . . . . . . . . . . . . . . . . . . . . . . . . . . . . 154,277 (1,831) 152,446Total equity of Coca-Cola Bottling Co. Consolidated . . . . . . . . . . . . . . . . 131,301 (1,831) 129,470Total equity . . . . . . . . . . . . . . . . . . . . . . . . . . . . . . . . . . . . . . . . . . . . . . . . . 191,238 (1,831) 189,407
(1) Certain prior year amounts have been reclassified to conform to current classifications.
62
COCA-COLA BOTTLING CO. CONSOLIDATED
NOTES TO CONSOLIDATED FINANCIAL STATEMENTS
The Company’s significant accounting policies are as follows:
Cash and Cash Equivalents
Cash and cash equivalents include cash on hand, cash in banks and cash equivalents, which are highly liquiddebt instruments with maturities of less than 90 days. The Company maintains cash deposits with major bankswhich from time to time may exceed federally insured limits. The Company periodically assesses the financialcondition of the institutions and believes that the risk of any loss is minimal.
Credit Risk of Trade Accounts Receivable
The Company sells its products to supermarkets, convenience stores and other customers and extends credit,generally without requiring collateral, based on an ongoing evaluation of the customer’s business prospects andfinancial condition. The Company’s trade accounts receivable are typically collected within approximately 30 daysfrom the date of sale. The Company monitors its exposure to losses on trade accounts receivable and maintains anallowance for potential losses or adjustments. Past due trade accounts receivable balances are written off when theCompany’s collection efforts have been unsuccessful in collecting the amount due.
Inventories
Inventories are stated at the lower of cost or market. Cost is determined on the first-in, first-out method forfinished products and manufacturing materials and on the average cost method for plastic shells, plastic pallets andother inventories.
Property, Plant and Equipment
Property, plant and equipment are recorded at cost and depreciated using the straight-line method over theestimated useful lives of the assets. Leasehold improvements on operating leases are depreciated over the shorterof the estimated useful lives or the term of the lease, including renewal options the Company determines arereasonably assured. Additions and major replacements or betterments are added to the assets at cost. Maintenanceand repair costs and minor replacements are charged to expense when incurred. When assets are replaced orotherwise disposed, the cost and accumulated depreciation are removed from the accounts and the gains or losses,if any, are reflected in the statement of operations. Gains or losses on the disposal of manufacturing equipment andmanufacturing facilities are included in cost of sales. Gains or losses on the disposal of all other property, plantand equipment are included in selling, delivery and administrative (“S,D&A”) expenses. Disposals of property,plant and equipment generally occur when it is not cost effective to repair an asset.
The Company evaluates the recoverability of the carrying amount of its property, plant and equipment whenevents or changes in circumstances indicate that the carrying amount of an asset or asset group may not berecoverable. These evaluations are performed at a level where independent cash flows may be attributed to eitheran asset or an asset group. If the Company determines that the carrying amount of an asset or asset group is notrecoverable based upon the expected undiscounted future cash flows of the asset or asset group, an impairmentloss is recorded equal to the excess of the carrying amounts over the estimated fair value of the long-lived assets.
Leased Property Under Capital Leases
Leased property under capital leases is depreciated using the straight-line method over the lease term.
Internal Use Software
The Company capitalizes costs incurred in the development or acquisition of internal use software. TheCompany expenses costs incurred in the preliminary project planning stage. Costs, such as maintenance and
63
COCA-COLA BOTTLING CO. CONSOLIDATED
NOTES TO CONSOLIDATED FINANCIAL STATEMENTS
training, are also expensed as incurred. Capitalized costs are amortized over their estimated useful lives using thestraight-line method. Amortization expense, which is included in depreciation expense, for internal-use softwarewas $7.3 million, $7.0 million and $6.5 million in 2012, 2011 and 2010, respectively.
Franchise Rights and Goodwill
Under the provisions of generally accepted accounting principles (GAAP), all business combinations areaccounted for using the acquisition method and goodwill and intangible assets with indefinite useful lives are notamortized but instead are tested for impairment annually, or more frequently if facts and circumstances indicatesuch assets may be impaired. The only intangible assets the Company classifies as indefinite lived are franchiserights and goodwill. The Company performs its annual impairment test as of the first day of the fourth quarter ofeach year. For both franchise rights and goodwill, when appropriate, the Company performs a qualitativeassessment to determine whether it is more likely than not that the fair value of the franchise rights or goodwill isbelow its carrying value.
When a quantitative analysis is considered necessary for the annual impairment analysis of franchise rights,the Company utilizes the Greenfield Method to estimate the fair value. The Greenfield Method assumes theCompany is starting new, owning only franchise rights, and makes investments required to build an operationcomparable to the Company’s current operations. The Company estimates the cash flows required to build acomparable operation and the available future cash flows from these operations. The cash flows are thendiscounted using an appropriate discount rate. The estimated fair value based upon the discounted cash flows isthen compared to the carrying value on an aggregated basis.
The Company has determined that it has one reporting unit for purposes of assessing goodwill for potentialimpairment. When a quantitative analysis is considered necessary for the annual impairment analysis of goodwill,the Company develops an estimated fair value for the reporting unit considering three different approaches:
• market value, using the Company’s stock price plus outstanding debt;
• discounted cash flow analysis; and
• multiple of earnings before interest, taxes, depreciation and amortization based upon relevant industry data.
The estimated fair value of the reporting unit is then compared to its carrying amount including goodwill. Ifthe estimated fair value exceeds the carrying amount, goodwill is considered not impaired, and the second step ofthe impairment test is not necessary. If the carrying amount including goodwill exceeds its estimated fair value, thesecond step of the impairment test is performed to measure the amount of the impairment, if any. In the secondstep, a comparison is made between book value of goodwill to the implied fair value of goodwill. Implied fairvalue of goodwill is determined by comparing the fair value of the reporting unit to the book value of its netidentifiable assets excluding goodwill. If the implied fair value of goodwill is below the book value of goodwill, animpairment loss would be recognized for the difference.
The Company uses its overall market capitalization as part of its estimate of fair value of the reporting unitand in assessing the reasonableness of the Company’s internal estimates of fair value.
To the extent that actual and projected cash flows decline in the future, or if market conditions deterioratesignificantly, the Company may be required to perform an interim impairment analysis that could result in animpairment of franchise rights and goodwill.
Other Identifiable Intangible Assets
Other identifiable intangible assets primarily represent customer relationships and distribution rights and areamortized on a straight-line basis over their estimated useful lives.
64
COCA-COLA BOTTLING CO. CONSOLIDATED
NOTES TO CONSOLIDATED FINANCIAL STATEMENTS
Pension and Postretirement Benefit Plans
The Company has a noncontributory pension plan covering certain nonunion employees and onenoncontributory pension plan covering certain union employees. Costs of the plans are charged to currentoperations and consist of several components of net periodic pension cost based on various actuarial assumptionsregarding future experience of the plans. In addition, certain other union employees are covered by plans providedby their respective union organizations and the Company expenses amounts as paid in accordance with unionagreements. The Company recognizes the cost of postretirement benefits, which consist principally of medicalbenefits, during employees’ periods of active service.
Amounts recorded for benefit plans reflect estimates related to interest rates, investment returns, employeeturnover and health care costs. The discount rate assumptions used to determine the pension and postretirementbenefit obligations are based on yield rates available on double-A bonds as of each plan’s measurement date.
On February 22, 2006, the Board of Directors of the Company approved an amendment to the pension plancovering substantially all nonunion employees to cease further accruals under the plan effective June 30, 2006.
Income Taxes
Income taxes are accounted for under the asset and liability method. Deferred tax assets and liabilities arerecognized for the future tax consequences attributable to operating loss and tax credit carryforwards as well asdifferences between the financial statement carrying amounts of existing assets and liabilities and their respectivetax bases. The effect on deferred tax assets and liabilities of a change in tax rates is recognized in income in theperiod that includes the enactment date.
A valuation allowance will be provided against deferred tax assets, if the Company determines it is morelikely than not such assets will not ultimately be realized.
The Company does not recognize a tax benefit unless it concludes that it is more likely than not that thebenefit will be sustained on audit by the taxing authority based solely on the technical merits of the associated taxposition. If the recognition threshold is met, the Company recognizes a tax benefit measured at the largest amountof the tax benefit that, in the Company’s judgment, is greater than 50 percent likely to be realized. The Companyrecords interest and penalties related to uncertain tax positions in income tax expense.
Revenue Recognition
Revenues are recognized when finished products are delivered to customers and both title and the risks andbenefits of ownership are transferred, price is fixed and determinable, collection is reasonably assured and, in thecase of full service vending, when cash is collected from the vending machines. Appropriate provision is made foruncollectible accounts.
The Company receives service fees from The Coca-Cola Company related to the delivery of fountain syrupproducts to The Coca-Cola Company’s fountain customers. In addition, the Company receives service fees fromThe Coca-Cola Company related to the repair of fountain equipment owned by The Coca-Cola Company. The feesreceived from The Coca-Cola Company for the delivery of fountain syrup products to their customers and therepair of their fountain equipment are recognized as revenue when the respective services are completed. Servicerevenue represents approximately 1% of net sales.
The Company performs freight hauling and brokerage for third parties in addition to delivering its ownproducts. The freight charges are recognized as revenues when the delivery is complete. Freight revenue from thirdparties represents approximately 1% of net sales.
Revenues do not include sales or other taxes collected from customers.
65
COCA-COLA BOTTLING CO. CONSOLIDATED
NOTES TO CONSOLIDATED FINANCIAL STATEMENTS
Marketing Programs and Sales Incentives
The Company participates in various marketing and sales programs with The Coca-Cola Company and otherbeverage companies and arrangements with customers to increase the sale of its products by its customers. Amongthe programs negotiated with customers are arrangements under which allowances can be earned for attainingagreed-upon sales levels and/or for participating in specific marketing programs.
Coupon programs are also developed on a territory-specific basis. The cost of these various marketingprograms and sales incentives with The Coca-Cola Company and other beverage companies, included asdeductions to net sales, totaled $58.1 million, $53.0 million and $51.8 million in 2012, 2011 and 2010,respectively.
Marketing Funding Support
The Company receives marketing funding support payments in cash from The Coca-Cola Company and otherbeverage companies. Payments to the Company for marketing programs to promote the sale of bottle/can volumeand fountain syrup volume are recognized in earnings primarily on a per unit basis over the year as product is sold.Payments for periodic programs are recognized in the periods for which they are earned.
Under GAAP, cash consideration received by a customer from a vendor is presumed to be a reduction of theprices of the vendor’s products or services and is, therefore, to be accounted for as a reduction of cost of sales inthe statements of operations unless those payments are specific reimbursements of costs or payments for services.Payments the Company receives from The Coca-Cola Company and other beverage companies for marketingfunding support are classified as reductions of cost of sales.
Derivative Financial Instruments
The Company records all derivative instruments in the financial statements at fair value.
The Company uses derivative financial instruments to manage its exposure to movements in interest rates andcertain commodity prices. The use of these financial instruments modifies the Company’s exposure to these riskswith the intent of reducing risk over time. The Company does not use financial instruments for trading purposes,nor does it use leveraged financial instruments. Credit risk related to the derivative financial instruments ismanaged by requiring high credit standards for its counterparties and periodic settlements.
Interest Rate Hedges
The Company periodically enters into derivative financial instruments. The Company has standardizedprocedures for evaluating the accounting for financial instruments. These procedures include:
• Identifying and matching of the hedging instrument and the hedged item to ensure that significant featurescoincide such as maturity dates and interest reset dates;
• Identifying the nature of the risk being hedged and the Company’s intent for undertaking the hedge;
• Assessing the hedging instrument’s effectiveness in offsetting the exposure to changes in the hedged item’sfair value or variability to cash flows attributable to the hedged risk;
• Assessing evidence that, at the hedge’s inception and on an ongoing basis, it is expected that the hedgingrelationship will be highly effective in achieving an offsetting change in the fair value or cash flows thatare attributable to the hedged risk; and
• Maintaining a process to review all hedges on an ongoing basis to ensure continued qualification for hedgeaccounting.
66
COCA-COLA BOTTLING CO. CONSOLIDATED
NOTES TO CONSOLIDATED FINANCIAL STATEMENTS
To the extent the interest rate agreements meet the specified criteria, they are accounted for as either fair valueor cash flow hedges. Changes in the fair values of designated and qualifying fair value hedges are recognized inearnings as offsets to changes in the fair value of the related hedged liabilities. Changes in the fair value of cash flowhedging instruments are recognized in accumulated other comprehensive income and are subsequently reclassified toearnings as an adjustment to interest expense in the same periods the forecasted payments affect earnings.Ineffectiveness of a cash flow hedge, defined as the amount by which the change in the value of the hedge does notexactly offset the change in the value of the hedged item, is reflected in current results of operations.
The Company evaluates its mix of fixed and floating rate debt on an ongoing basis. Periodically, theCompany may terminate an interest rate derivative when the underlying debt remains outstanding in order toachieve its desired fixed/floating rate mix. Upon termination of an interest rate derivative accounted for as a cashflow hedge, amounts reflected in accumulated other comprehensive income are reclassified to earnings consistentwith the variability of the cash flows previously hedged, which is generally over the life of the related debt thatwas hedged. Upon termination of an interest rate derivative accounted for as a fair value hedge, the value of thehedge as recorded on the Company’s balance sheet is eliminated against either the cash received or cash paid forsettlement and the fair value adjustment of the related debt is amortized to earnings over the remaining life of thedebt instrument as an adjustment to interest expense.
Interest rate derivatives designated as cash flow hedges are used to hedge the variability of cash flows relatedto a specific component of the Company’s long-term debt. Interest rate derivatives designated as fair value hedgesare used to hedge the fair value of a specific component of the Company’s long-term debt. If the hedgedcomponent of long-term debt is repaid or refinanced, the Company generally terminates the related hedge due tothe fact the forecasted schedule of payments will not occur or the changes in fair value of the hedged debt will notoccur and the derivative will no longer qualify as a hedge. Any gain or loss on the termination of an interest ratederivative related to the repayment or refinancing of long-term debt is recognized currently in the Company’sstatement of operations as an adjustment to interest expense. In the event a derivative previously accounted for as ahedge was retained and did not qualify for hedge accounting, changes in the fair value would be recognized in thestatement of operations currently as an adjustment to interest expense.
Commodity Hedges
The Company may use derivative instruments to hedge some or all of the Company’s projected diesel fuel andunleaded gasoline purchases (used in the Company’s delivery fleet and other vehicles) and aluminum purchases. TheCompany generally pays a fee for these instruments which is amortized over the corresponding period of theinstrument. The Company accounts for its commodity hedges on a mark-to-market basis with any expense or incomereflected as an adjustment of related costs which are included in either cost of sales or S,D&A expenses.
Risk Management Programs
The Company uses various insurance structures to manage its workers’ compensation, auto liability, medicaland other insurable risks. These structures consist of retentions, deductibles, limits and a diverse group of insurersthat serve to strategically transfer and mitigate the financial impact of losses. The Company uses commercialinsurance for claims as a risk reduction strategy to minimize catastrophic losses. Losses are accrued usingassumptions and procedures followed in the insurance industry, adjusted for company-specific history andexpectations.
Cost of Sales
Cost of sales includes the following: raw material costs, manufacturing labor, manufacturing overheadincluding depreciation expense, manufacturing warehousing costs and shipping and handling costs related to themovement of finished goods from manufacturing locations to sales distribution centers.
67
COCA-COLA BOTTLING CO. CONSOLIDATED
NOTES TO CONSOLIDATED FINANCIAL STATEMENTS
Selling, Delivery and Administrative Expenses
S,D&A expenses include the following: sales management labor costs, distribution costs from salesdistribution centers to customer locations, sales distribution center warehouse costs, depreciation expense relatedto sales centers, delivery vehicles and cold drink equipment, point-of-sale expenses, advertising expenses, colddrink equipment repair costs, amortization of intangibles and administrative support labor and operating costs suchas treasury, legal, information services, accounting, internal control services, human resources and executivemanagement costs.
Shipping and Handling Costs
Shipping and handling costs related to the movement of finished goods from manufacturing locations to salesdistribution centers are included in cost of sales. Shipping and handling costs related to the movement of finishedgoods from sales distribution centers to customer locations are included in S,D&A expenses and were $200.0million, $191.9 million and $187.2 million in 2012, 2011 and 2010, respectively.
The Company recorded delivery fees in net sales of $7.0 million, $7.1 million and $7.5 million in 2012, 2011and 2010, respectively. These fees are used to offset a portion of the Company’s delivery and handling costs.
Stock Compensation with Contingent Vesting
On April 29, 2008, the stockholders of the Company approved a Performance Unit Award Agreement forJ. Frank Harrison, III, the Company’s Chairman of the Board of Directors and Chief Executive Officer, consisting of400,000 performance units (“Units”). Each Unit represents the right to receive one share of the Company’s Class BCommon Stock, subject to certain terms and conditions. The Units are subject to vesting in annual increments over aten-year period starting in fiscal year 2009. The number of Units that vest each year will equal the product of 40,000multiplied by the overall goal achievement factor (not to exceed 100%) under the Company’s Annual Bonus Plan.
Each annual 40,000 unit tranche has an independent performance requirement, as it is not established until theCompany’s Annual Bonus Plan targets are approved each year by the Compensation Committee of the Board ofDirectors. As a result, each 40,000 unit tranche is considered to have its own service inception date, grant-date andrequisite service period. The Company’s Annual Bonus Plan targets, which establish the performancerequirements for the Performance Unit Award Agreement, are approved by the Compensation Committee of theBoard of Directors in the first quarter of each year. The Performance Unit Award Agreement does not entitleMr. Harrison, III to participate in dividends or voting rights until each installment has vested and the shares areissued. Mr. Harrison, III may satisfy tax withholding requirements in whole or in part by requiring the Company tosettle in cash such number of units otherwise payable in Class B Common Stock to meet the maximum statutorytax withholding requirements. The Company recognizes compensation expense over the requisite service period(one fiscal year) based on the Company’s stock price at the end of each accounting period, unless the achievementof the performance requirement for the fiscal year is considered unlikely.
See Note 16 to the consolidated financial statements for additional information on Mr. Harrison, III’s stockcompensation program.
Net Income Per Share
The Company applies the two-class method for calculating and presenting net income per share. The two-class method is an earnings allocation formula that determines earnings per share for each class of common stockaccording to dividends declared (or accumulated) and participation rights in undistributed earnings. Under thismethod:
(a) Income from continuing operations (“net income”) is reduced by the amount of dividends declaredin the current period for each class of stock and by the contractual amount of dividends that must bepaid for the current period.
68
COCA-COLA BOTTLING CO. CONSOLIDATED
NOTES TO CONSOLIDATED FINANCIAL STATEMENTS
(b) The remaining earnings (“undistributed earnings”) are allocated to Common Stock and Class BCommon Stock to the extent that each security may share in earnings as if all of the earnings for theperiod had been distributed. The total earnings allocated to each security is determined by addingtogether the amount allocated for dividends and the amount allocated for a participation feature.
(c) The total earnings allocated to each security is then divided by the number of outstanding shares ofthe security to which the earnings are allocated to determine the earnings per share for the security.
(d) Basic and diluted earnings per share (“EPS”) data are presented for each class of common stock.
In applying the two-class method, the Company determined that undistributed earnings should be allocatedequally on a per share basis between the Common Stock and Class B Common Stock due to the aggregateparticipation rights of the Class B Common Stock (i.e., the voting and conversion rights) and the Company’shistory of paying dividends equally on a per share basis on the Common Stock and Class B Common Stock.
Under the Company’s certificate of incorporation, the Board of Directors may declare dividends on CommonStock without declaring equal or any dividends on the Class B Common Stock. Notwithstanding this provision,Class B Common Stock has voting and conversion rights that allow the Class B Common Stock to participateequally on a per share basis with the Common Stock.
The Class B Common Stock is entitled to 20 votes per share and the Common Stock is entitled to one vote pershare with respect to each matter to be voted upon by the stockholders of the Company. Except as otherwiserequired by law, the holders of the Class B Common Stock and Common Stock vote together as a single class onall matters submitted to the Company’s stockholders, including the election of the Board of Directors. As a result,the holders of the Class B Common Stock control approximately 85% of the total voting power of the stockholdersof the Company and control the election of the Board of Directors. The Board of Directors has declared and theCompany has paid dividends on the Class B Common Stock and Common Stock and each class of common stockhas participated equally in all dividends declared by the Board of Directors and paid by the Company since 1994.
The Class B Common Stock conversion rights allow the Class B Common Stock to participate in dividendsequally with the Common Stock. The Class B Common Stock is convertible into Common Stock on a one-for-oneper share basis at any time at the option of the holder. Accordingly, the holders of the Class B Common Stock canparticipate equally in any dividends declared on the Common Stock by exercising their conversion rights.
As a result of the Class B Common Stock’s aggregated participation rights, the Company has determined thatundistributed earnings should be allocated equally on a per share basis to the Common Stock and Class BCommon Stock under the two-class method.
Basic EPS excludes potential common shares that were dilutive and is computed by dividing net incomeavailable for common stockholders by the weighted average number of Common and Class B Common sharesoutstanding. Diluted EPS for Common Stock and Class B Common Stock gives effect to all securities representingpotential common shares that were dilutive and outstanding during the period.
2. Piedmont Coca-Cola Bottling Partnership
On July 2, 1993, the Company and The Coca-Cola Company formed Piedmont to distribute and marketnonalcoholic beverages primarily in portions of North Carolina and South Carolina. The Company provides aportion of the nonalcoholic beverage products to Piedmont at cost and receives a fee for managing the operationsof Piedmont pursuant to a management agreement. These intercompany transactions are eliminated in theconsolidated financial statements.
Noncontrolling interest as of December 30, 2012, January 1, 2012 and January 2, 2011 primarily representsthe portion of Piedmont which is owned by The Coca-Cola Company. The Coca-Cola Company’s interest inPiedmont was 22.7% in all periods reported.
69
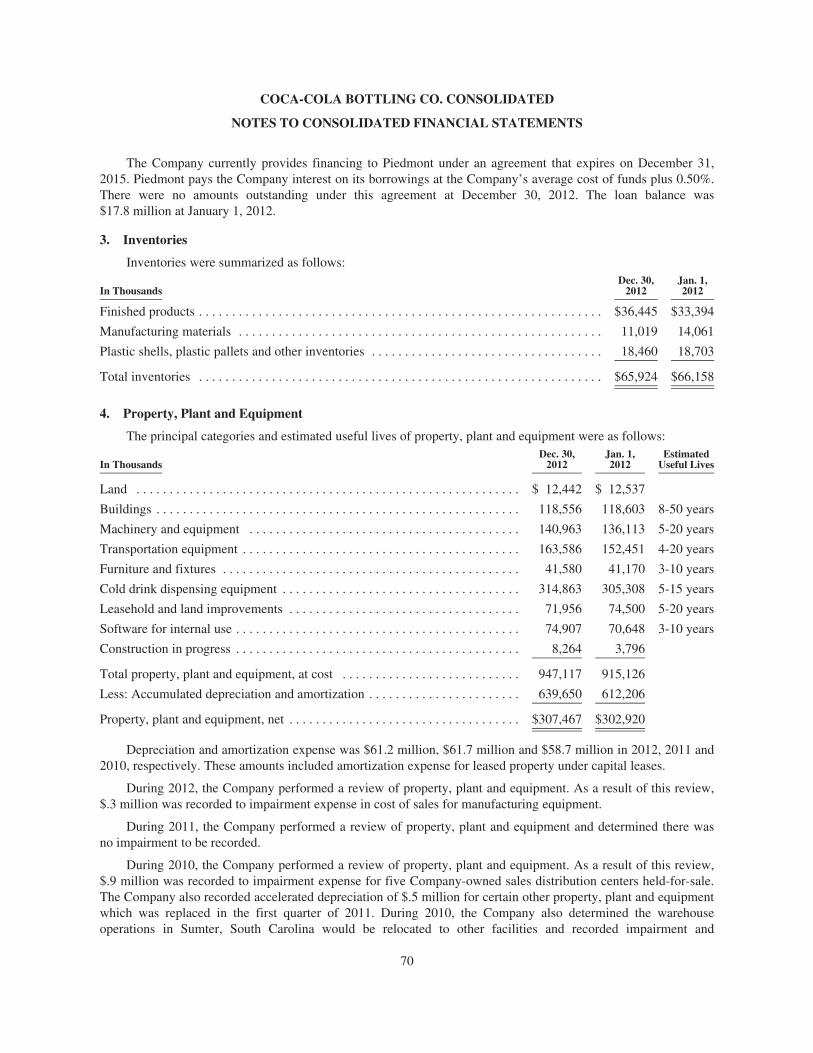
COCA-COLA BOTTLING CO. CONSOLIDATED
NOTES TO CONSOLIDATED FINANCIAL STATEMENTS
The Company currently provides financing to Piedmont under an agreement that expires on December 31,2015. Piedmont pays the Company interest on its borrowings at the Company’s average cost of funds plus 0.50%.There were no amounts outstanding under this agreement at December 30, 2012. The loan balance was$17.8 million at January 1, 2012.
3. Inventories
Inventories were summarized as follows:
In ThousandsDec. 30,
2012Jan. 1,2012
Finished products . . . . . . . . . . . . . . . . . . . . . . . . . . . . . . . . . . . . . . . . . . . . . . . . . . . . . . . . . . . . . $36,445 $33,394
Manufacturing materials . . . . . . . . . . . . . . . . . . . . . . . . . . . . . . . . . . . . . . . . . . . . . . . . . . . . . . . 11,019 14,061
Plastic shells, plastic pallets and other inventories . . . . . . . . . . . . . . . . . . . . . . . . . . . . . . . . . . . 18,460 18,703
Total inventories . . . . . . . . . . . . . . . . . . . . . . . . . . . . . . . . . . . . . . . . . . . . . . . . . . . . . . . . . . . . . $65,924 $66,158
4. Property, Plant and Equipment
The principal categories and estimated useful lives of property, plant and equipment were as follows:
In ThousandsDec. 30,
2012Jan. 1,2012
EstimatedUseful Lives
Land . . . . . . . . . . . . . . . . . . . . . . . . . . . . . . . . . . . . . . . . . . . . . . . . . . . . . . . . . . $ 12,442 $ 12,537
Buildings . . . . . . . . . . . . . . . . . . . . . . . . . . . . . . . . . . . . . . . . . . . . . . . . . . . . . . . 118,556 118,603 8-50 years
Machinery and equipment . . . . . . . . . . . . . . . . . . . . . . . . . . . . . . . . . . . . . . . . . 140,963 136,113 5-20 years
Transportation equipment . . . . . . . . . . . . . . . . . . . . . . . . . . . . . . . . . . . . . . . . . . 163,586 152,451 4-20 years
Furniture and fixtures . . . . . . . . . . . . . . . . . . . . . . . . . . . . . . . . . . . . . . . . . . . . . 41,580 41,170 3-10 years
Cold drink dispensing equipment . . . . . . . . . . . . . . . . . . . . . . . . . . . . . . . . . . . . 314,863 305,308 5-15 years
Leasehold and land improvements . . . . . . . . . . . . . . . . . . . . . . . . . . . . . . . . . . . 71,956 74,500 5-20 years
Software for internal use . . . . . . . . . . . . . . . . . . . . . . . . . . . . . . . . . . . . . . . . . . . 74,907 70,648 3-10 years
Construction in progress . . . . . . . . . . . . . . . . . . . . . . . . . . . . . . . . . . . . . . . . . . . 8,264 3,796
Total property, plant and equipment, at cost . . . . . . . . . . . . . . . . . . . . . . . . . . . 947,117 915,126
Less: Accumulated depreciation and amortization . . . . . . . . . . . . . . . . . . . . . . . 639,650 612,206
Property, plant and equipment, net . . . . . . . . . . . . . . . . . . . . . . . . . . . . . . . . . . . $307,467 $302,920
Depreciation and amortization expense was $61.2 million, $61.7 million and $58.7 million in 2012, 2011 and2010, respectively. These amounts included amortization expense for leased property under capital leases.
During 2012, the Company performed a review of property, plant and equipment. As a result of this review,$.3 million was recorded to impairment expense in cost of sales for manufacturing equipment.
During 2011, the Company performed a review of property, plant and equipment and determined there wasno impairment to be recorded.
During 2010, the Company performed a review of property, plant and equipment. As a result of this review,$.9 million was recorded to impairment expense for five Company-owned sales distribution centers held-for-sale.The Company also recorded accelerated depreciation of $.5 million for certain other property, plant and equipmentwhich was replaced in the first quarter of 2011. During 2010, the Company also determined the warehouseoperations in Sumter, South Carolina would be relocated to other facilities and recorded impairment and
70
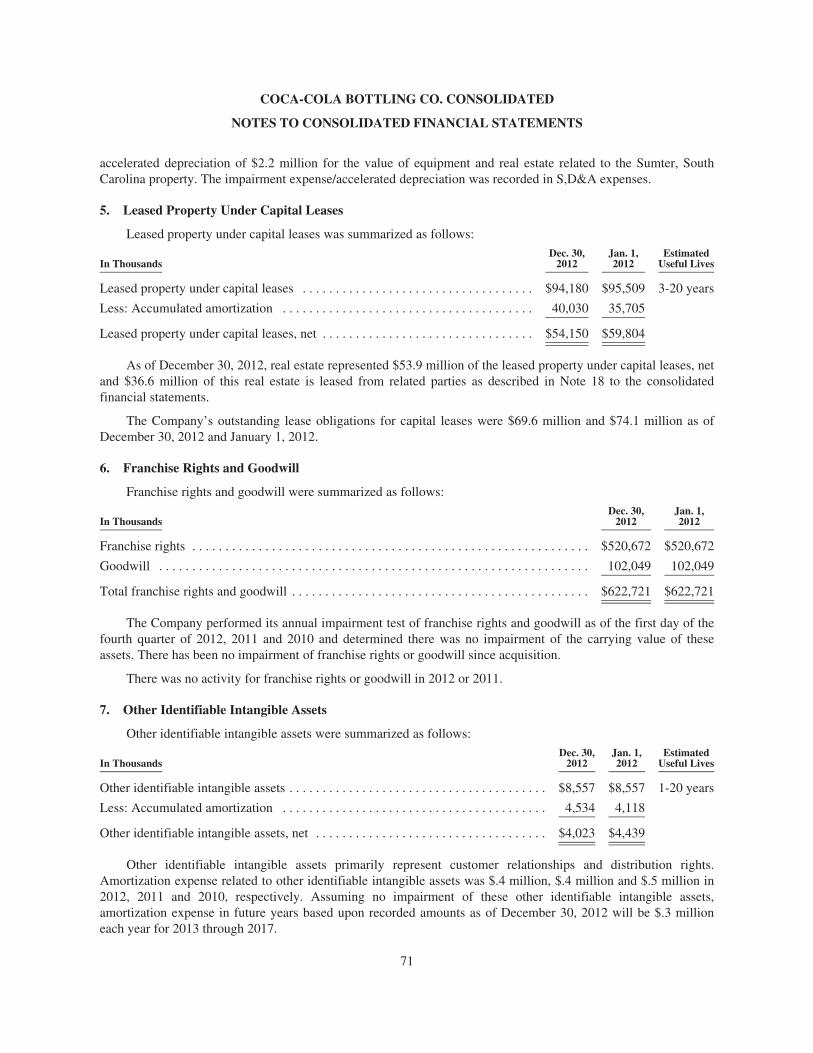
COCA-COLA BOTTLING CO. CONSOLIDATED
NOTES TO CONSOLIDATED FINANCIAL STATEMENTS
accelerated depreciation of $2.2 million for the value of equipment and real estate related to the Sumter, SouthCarolina property. The impairment expense/accelerated depreciation was recorded in S,D&A expenses.
5. Leased Property Under Capital Leases
Leased property under capital leases was summarized as follows:
In ThousandsDec. 30,
2012Jan. 1,2012
EstimatedUseful Lives
Leased property under capital leases . . . . . . . . . . . . . . . . . . . . . . . . . . . . . . . . . . . $94,180 $95,509 3-20 years
Less: Accumulated amortization . . . . . . . . . . . . . . . . . . . . . . . . . . . . . . . . . . . . . . 40,030 35,705
Leased property under capital leases, net . . . . . . . . . . . . . . . . . . . . . . . . . . . . . . . . $54,150 $59,804
As of December 30, 2012, real estate represented $53.9 million of the leased property under capital leases, netand $36.6 million of this real estate is leased from related parties as described in Note 18 to the consolidatedfinancial statements.
The Company’s outstanding lease obligations for capital leases were $69.6 million and $74.1 million as ofDecember 30, 2012 and January 1, 2012.
6. Franchise Rights and Goodwill
Franchise rights and goodwill were summarized as follows:
In ThousandsDec. 30,
2012Jan. 1,2012
Franchise rights . . . . . . . . . . . . . . . . . . . . . . . . . . . . . . . . . . . . . . . . . . . . . . . . . . . . . . . . . . . . $520,672 $520,672
Goodwill . . . . . . . . . . . . . . . . . . . . . . . . . . . . . . . . . . . . . . . . . . . . . . . . . . . . . . . . . . . . . . . . . 102,049 102,049
Total franchise rights and goodwill . . . . . . . . . . . . . . . . . . . . . . . . . . . . . . . . . . . . . . . . . . . . . $622,721 $622,721
The Company performed its annual impairment test of franchise rights and goodwill as of the first day of thefourth quarter of 2012, 2011 and 2010 and determined there was no impairment of the carrying value of theseassets. There has been no impairment of franchise rights or goodwill since acquisition.
There was no activity for franchise rights or goodwill in 2012 or 2011.
7. Other Identifiable Intangible Assets
Other identifiable intangible assets were summarized as follows:
In ThousandsDec. 30,
2012Jan. 1,2012
EstimatedUseful Lives
Other identifiable intangible assets . . . . . . . . . . . . . . . . . . . . . . . . . . . . . . . . . . . . . . . $8,557 $8,557 1-20 years
Less: Accumulated amortization . . . . . . . . . . . . . . . . . . . . . . . . . . . . . . . . . . . . . . . . 4,534 4,118
Other identifiable intangible assets, net . . . . . . . . . . . . . . . . . . . . . . . . . . . . . . . . . . . $4,023 $4,439
Other identifiable intangible assets primarily represent customer relationships and distribution rights.Amortization expense related to other identifiable intangible assets was $.4 million, $.4 million and $.5 million in2012, 2011 and 2010, respectively. Assuming no impairment of these other identifiable intangible assets,amortization expense in future years based upon recorded amounts as of December 30, 2012 will be $.3 millioneach year for 2013 through 2017.
71
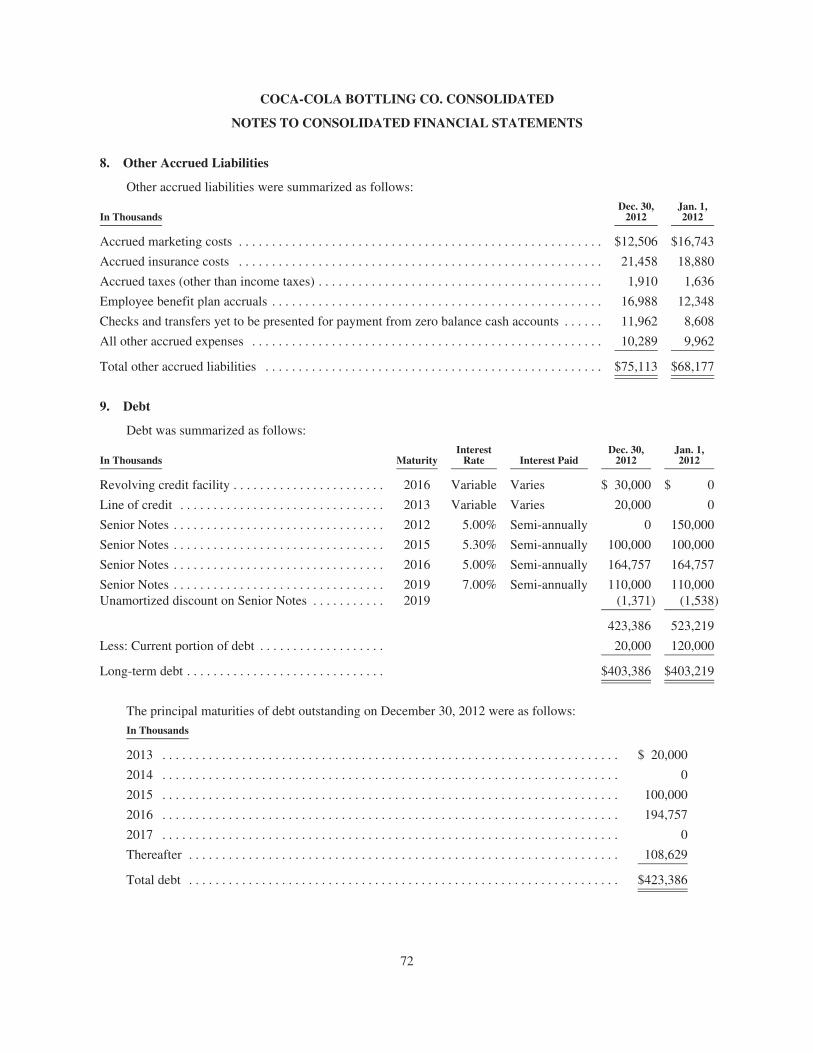
COCA-COLA BOTTLING CO. CONSOLIDATED
NOTES TO CONSOLIDATED FINANCIAL STATEMENTS
8. Other Accrued Liabilities
Other accrued liabilities were summarized as follows:
In ThousandsDec. 30,
2012Jan. 1,2012
Accrued marketing costs . . . . . . . . . . . . . . . . . . . . . . . . . . . . . . . . . . . . . . . . . . . . . . . . . . . . . . . $12,506 $16,743
Accrued insurance costs . . . . . . . . . . . . . . . . . . . . . . . . . . . . . . . . . . . . . . . . . . . . . . . . . . . . . . . 21,458 18,880
Accrued taxes (other than income taxes) . . . . . . . . . . . . . . . . . . . . . . . . . . . . . . . . . . . . . . . . . . . 1,910 1,636
Employee benefit plan accruals . . . . . . . . . . . . . . . . . . . . . . . . . . . . . . . . . . . . . . . . . . . . . . . . . . 16,988 12,348
Checks and transfers yet to be presented for payment from zero balance cash accounts . . . . . . 11,962 8,608
All other accrued expenses . . . . . . . . . . . . . . . . . . . . . . . . . . . . . . . . . . . . . . . . . . . . . . . . . . . . . 10,289 9,962
Total other accrued liabilities . . . . . . . . . . . . . . . . . . . . . . . . . . . . . . . . . . . . . . . . . . . . . . . . . . . $75,113 $68,177
9. Debt
Debt was summarized as follows:
In Thousands MaturityInterest
Rate Interest PaidDec. 30,
2012Jan. 1,2012
Revolving credit facility . . . . . . . . . . . . . . . . . . . . . . . 2016 Variable Varies $ 30,000 $ 0
Line of credit . . . . . . . . . . . . . . . . . . . . . . . . . . . . . . . 2013 Variable Varies 20,000 0
Senior Notes . . . . . . . . . . . . . . . . . . . . . . . . . . . . . . . . 2012 5.00% Semi-annually 0 150,000
Senior Notes . . . . . . . . . . . . . . . . . . . . . . . . . . . . . . . . 2015 5.30% Semi-annually 100,000 100,000
Senior Notes . . . . . . . . . . . . . . . . . . . . . . . . . . . . . . . . 2016 5.00% Semi-annually 164,757 164,757
Senior Notes . . . . . . . . . . . . . . . . . . . . . . . . . . . . . . . . 2019 7.00% Semi-annually 110,000 110,000Unamortized discount on Senior Notes . . . . . . . . . . . 2019 (1,371) (1,538)
423,386 523,219
Less: Current portion of debt . . . . . . . . . . . . . . . . . . . 20,000 120,000
Long-term debt . . . . . . . . . . . . . . . . . . . . . . . . . . . . . . $403,386 $403,219
The principal maturities of debt outstanding on December 30, 2012 were as follows:
In Thousands
2013 . . . . . . . . . . . . . . . . . . . . . . . . . . . . . . . . . . . . . . . . . . . . . . . . . . . . . . . . . . . . . . . . . . . . . $ 20,000
2014 . . . . . . . . . . . . . . . . . . . . . . . . . . . . . . . . . . . . . . . . . . . . . . . . . . . . . . . . . . . . . . . . . . . . . 0
2015 . . . . . . . . . . . . . . . . . . . . . . . . . . . . . . . . . . . . . . . . . . . . . . . . . . . . . . . . . . . . . . . . . . . . . 100,000
2016 . . . . . . . . . . . . . . . . . . . . . . . . . . . . . . . . . . . . . . . . . . . . . . . . . . . . . . . . . . . . . . . . . . . . . 194,757
2017 . . . . . . . . . . . . . . . . . . . . . . . . . . . . . . . . . . . . . . . . . . . . . . . . . . . . . . . . . . . . . . . . . . . . . 0
Thereafter . . . . . . . . . . . . . . . . . . . . . . . . . . . . . . . . . . . . . . . . . . . . . . . . . . . . . . . . . . . . . . . . . 108,629
Total debt . . . . . . . . . . . . . . . . . . . . . . . . . . . . . . . . . . . . . . . . . . . . . . . . . . . . . . . . . . . . . . . . . $423,386
72
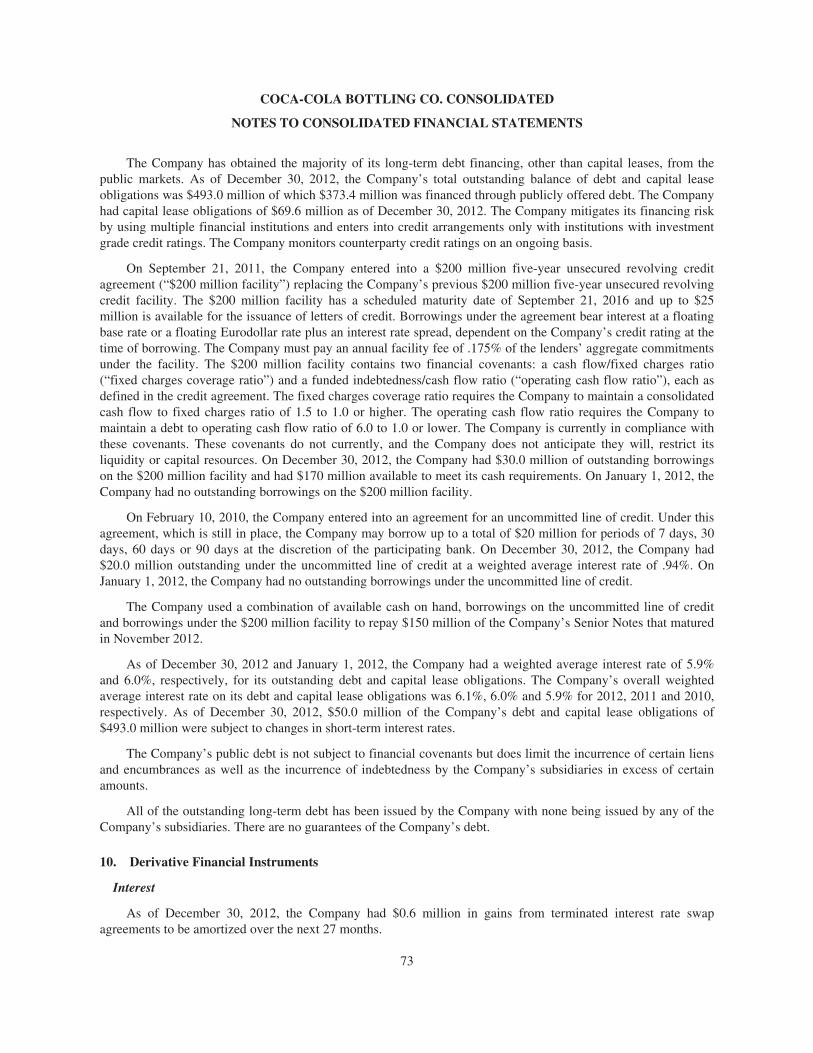
COCA-COLA BOTTLING CO. CONSOLIDATED
NOTES TO CONSOLIDATED FINANCIAL STATEMENTS
The Company has obtained the majority of its long-term debt financing, other than capital leases, from thepublic markets. As of December 30, 2012, the Company’s total outstanding balance of debt and capital leaseobligations was $493.0 million of which $373.4 million was financed through publicly offered debt. The Companyhad capital lease obligations of $69.6 million as of December 30, 2012. The Company mitigates its financing riskby using multiple financial institutions and enters into credit arrangements only with institutions with investmentgrade credit ratings. The Company monitors counterparty credit ratings on an ongoing basis.
On September 21, 2011, the Company entered into a $200 million five-year unsecured revolving creditagreement (“$200 million facility”) replacing the Company’s previous $200 million five-year unsecured revolvingcredit facility. The $200 million facility has a scheduled maturity date of September 21, 2016 and up to $25million is available for the issuance of letters of credit. Borrowings under the agreement bear interest at a floatingbase rate or a floating Eurodollar rate plus an interest rate spread, dependent on the Company’s credit rating at thetime of borrowing. The Company must pay an annual facility fee of .175% of the lenders’ aggregate commitmentsunder the facility. The $200 million facility contains two financial covenants: a cash flow/fixed charges ratio(“fixed charges coverage ratio”) and a funded indebtedness/cash flow ratio (“operating cash flow ratio”), each asdefined in the credit agreement. The fixed charges coverage ratio requires the Company to maintain a consolidatedcash flow to fixed charges ratio of 1.5 to 1.0 or higher. The operating cash flow ratio requires the Company tomaintain a debt to operating cash flow ratio of 6.0 to 1.0 or lower. The Company is currently in compliance withthese covenants. These covenants do not currently, and the Company does not anticipate they will, restrict itsliquidity or capital resources. On December 30, 2012, the Company had $30.0 million of outstanding borrowingson the $200 million facility and had $170 million available to meet its cash requirements. On January 1, 2012, theCompany had no outstanding borrowings on the $200 million facility.
On February 10, 2010, the Company entered into an agreement for an uncommitted line of credit. Under thisagreement, which is still in place, the Company may borrow up to a total of $20 million for periods of 7 days, 30days, 60 days or 90 days at the discretion of the participating bank. On December 30, 2012, the Company had$20.0 million outstanding under the uncommitted line of credit at a weighted average interest rate of .94%. OnJanuary 1, 2012, the Company had no outstanding borrowings under the uncommitted line of credit.
The Company used a combination of available cash on hand, borrowings on the uncommitted line of creditand borrowings under the $200 million facility to repay $150 million of the Company’s Senior Notes that maturedin November 2012.
As of December 30, 2012 and January 1, 2012, the Company had a weighted average interest rate of 5.9%and 6.0%, respectively, for its outstanding debt and capital lease obligations. The Company’s overall weightedaverage interest rate on its debt and capital lease obligations was 6.1%, 6.0% and 5.9% for 2012, 2011 and 2010,respectively. As of December 30, 2012, $50.0 million of the Company’s debt and capital lease obligations of$493.0 million were subject to changes in short-term interest rates.
The Company’s public debt is not subject to financial covenants but does limit the incurrence of certain liensand encumbrances as well as the incurrence of indebtedness by the Company’s subsidiaries in excess of certainamounts.
All of the outstanding long-term debt has been issued by the Company with none being issued by any of theCompany’s subsidiaries. There are no guarantees of the Company’s debt.
10. Derivative Financial Instruments
Interest
As of December 30, 2012, the Company had $0.6 million in gains from terminated interest rate swapagreements to be amortized over the next 27 months.
73
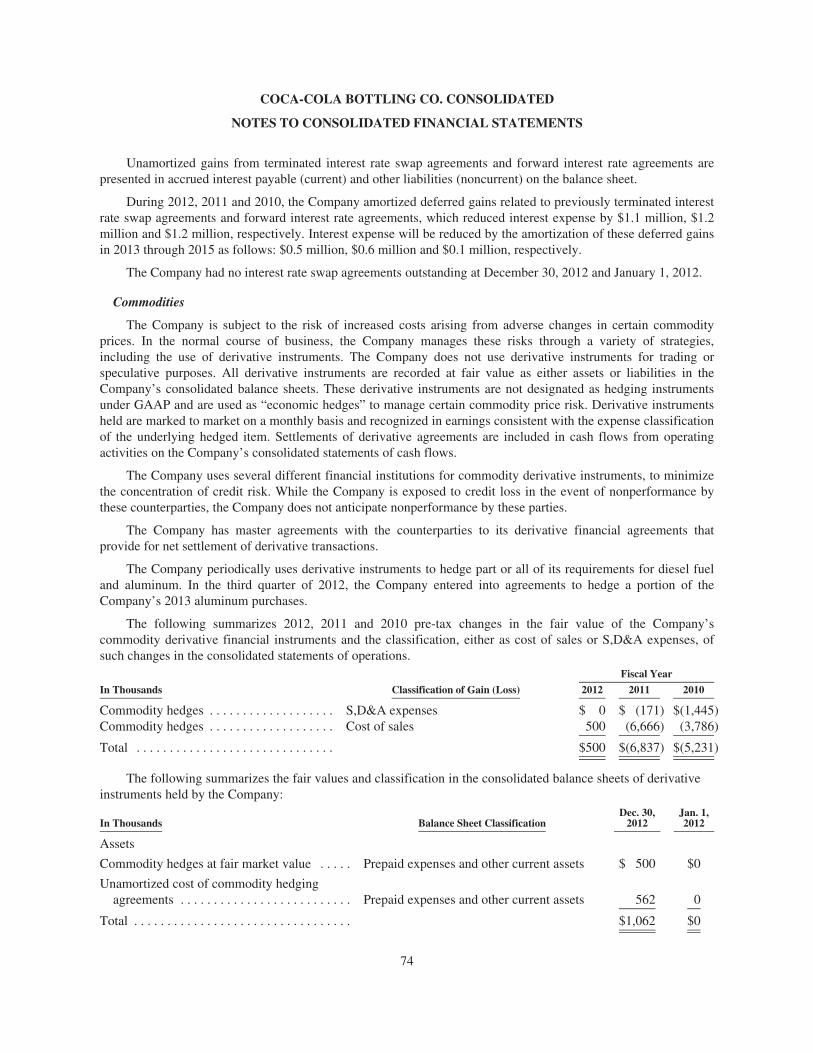
COCA-COLA BOTTLING CO. CONSOLIDATED
NOTES TO CONSOLIDATED FINANCIAL STATEMENTS
Unamortized gains from terminated interest rate swap agreements and forward interest rate agreements arepresented in accrued interest payable (current) and other liabilities (noncurrent) on the balance sheet.
During 2012, 2011 and 2010, the Company amortized deferred gains related to previously terminated interestrate swap agreements and forward interest rate agreements, which reduced interest expense by $1.1 million, $1.2million and $1.2 million, respectively. Interest expense will be reduced by the amortization of these deferred gainsin 2013 through 2015 as follows: $0.5 million, $0.6 million and $0.1 million, respectively.
The Company had no interest rate swap agreements outstanding at December 30, 2012 and January 1, 2012.
Commodities
The Company is subject to the risk of increased costs arising from adverse changes in certain commodityprices. In the normal course of business, the Company manages these risks through a variety of strategies,including the use of derivative instruments. The Company does not use derivative instruments for trading orspeculative purposes. All derivative instruments are recorded at fair value as either assets or liabilities in theCompany’s consolidated balance sheets. These derivative instruments are not designated as hedging instrumentsunder GAAP and are used as “economic hedges” to manage certain commodity price risk. Derivative instrumentsheld are marked to market on a monthly basis and recognized in earnings consistent with the expense classificationof the underlying hedged item. Settlements of derivative agreements are included in cash flows from operatingactivities on the Company’s consolidated statements of cash flows.
The Company uses several different financial institutions for commodity derivative instruments, to minimizethe concentration of credit risk. While the Company is exposed to credit loss in the event of nonperformance bythese counterparties, the Company does not anticipate nonperformance by these parties.
The Company has master agreements with the counterparties to its derivative financial agreements thatprovide for net settlement of derivative transactions.
The Company periodically uses derivative instruments to hedge part or all of its requirements for diesel fueland aluminum. In the third quarter of 2012, the Company entered into agreements to hedge a portion of theCompany’s 2013 aluminum purchases.
The following summarizes 2012, 2011 and 2010 pre-tax changes in the fair value of the Company’scommodity derivative financial instruments and the classification, either as cost of sales or S,D&A expenses, ofsuch changes in the consolidated statements of operations.
In Thousands Classification of Gain (Loss)
Fiscal Year
2012 2011 2010
Commodity hedges . . . . . . . . . . . . . . . . . . . S,D&A expenses $ 0 $ (171) $(1,445)Commodity hedges . . . . . . . . . . . . . . . . . . . Cost of sales 500 (6,666) (3,786)
Total . . . . . . . . . . . . . . . . . . . . . . . . . . . . . . $500 $(6,837) $(5,231)
The following summarizes the fair values and classification in the consolidated balance sheets of derivativeinstruments held by the Company:
In Thousands Balance Sheet ClassificationDec. 30,
2012Jan. 1,2012
Assets
Commodity hedges at fair market value . . . . . Prepaid expenses and other current assets $ 500 $0
Unamortized cost of commodity hedgingagreements . . . . . . . . . . . . . . . . . . . . . . . . . . Prepaid expenses and other current assets 562 0
Total . . . . . . . . . . . . . . . . . . . . . . . . . . . . . . . . . $1,062 $0
74
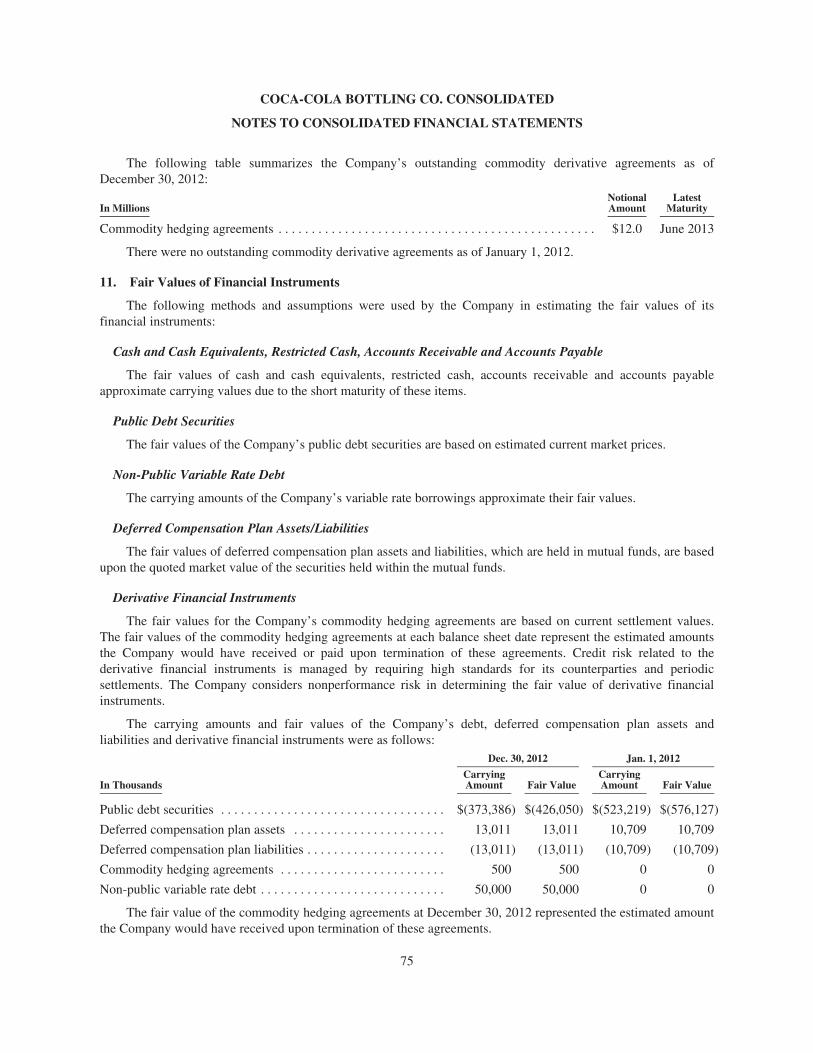
COCA-COLA BOTTLING CO. CONSOLIDATED
NOTES TO CONSOLIDATED FINANCIAL STATEMENTS
The following table summarizes the Company’s outstanding commodity derivative agreements as ofDecember 30, 2012:
In MillionsNotionalAmount
LatestMaturity
Commodity hedging agreements . . . . . . . . . . . . . . . . . . . . . . . . . . . . . . . . . . . . . . . . . . . . . . . . $12.0 June 2013
There were no outstanding commodity derivative agreements as of January 1, 2012.
11. Fair Values of Financial Instruments
The following methods and assumptions were used by the Company in estimating the fair values of itsfinancial instruments:
Cash and Cash Equivalents, Restricted Cash, Accounts Receivable and Accounts Payable
The fair values of cash and cash equivalents, restricted cash, accounts receivable and accounts payableapproximate carrying values due to the short maturity of these items.
Public Debt Securities
The fair values of the Company’s public debt securities are based on estimated current market prices.
Non-Public Variable Rate Debt
The carrying amounts of the Company’s variable rate borrowings approximate their fair values.
Deferred Compensation Plan Assets/Liabilities
The fair values of deferred compensation plan assets and liabilities, which are held in mutual funds, are basedupon the quoted market value of the securities held within the mutual funds.
Derivative Financial Instruments
The fair values for the Company’s commodity hedging agreements are based on current settlement values.The fair values of the commodity hedging agreements at each balance sheet date represent the estimated amountsthe Company would have received or paid upon termination of these agreements. Credit risk related to thederivative financial instruments is managed by requiring high standards for its counterparties and periodicsettlements. The Company considers nonperformance risk in determining the fair value of derivative financialinstruments.
The carrying amounts and fair values of the Company’s debt, deferred compensation plan assets andliabilities and derivative financial instruments were as follows:
Dec. 30, 2012 Jan. 1, 2012
In ThousandsCarryingAmount Fair Value
CarryingAmount Fair Value
Public debt securities . . . . . . . . . . . . . . . . . . . . . . . . . . . . . . . . . . $(373,386) $(426,050) $(523,219) $(576,127)
Deferred compensation plan assets . . . . . . . . . . . . . . . . . . . . . . . 13,011 13,011 10,709 10,709
Deferred compensation plan liabilities . . . . . . . . . . . . . . . . . . . . . (13,011) (13,011) (10,709) (10,709)
Commodity hedging agreements . . . . . . . . . . . . . . . . . . . . . . . . . 500 500 0 0
Non-public variable rate debt . . . . . . . . . . . . . . . . . . . . . . . . . . . . 50,000 50,000 0 0
The fair value of the commodity hedging agreements at December 30, 2012 represented the estimated amountthe Company would have received upon termination of these agreements.
75
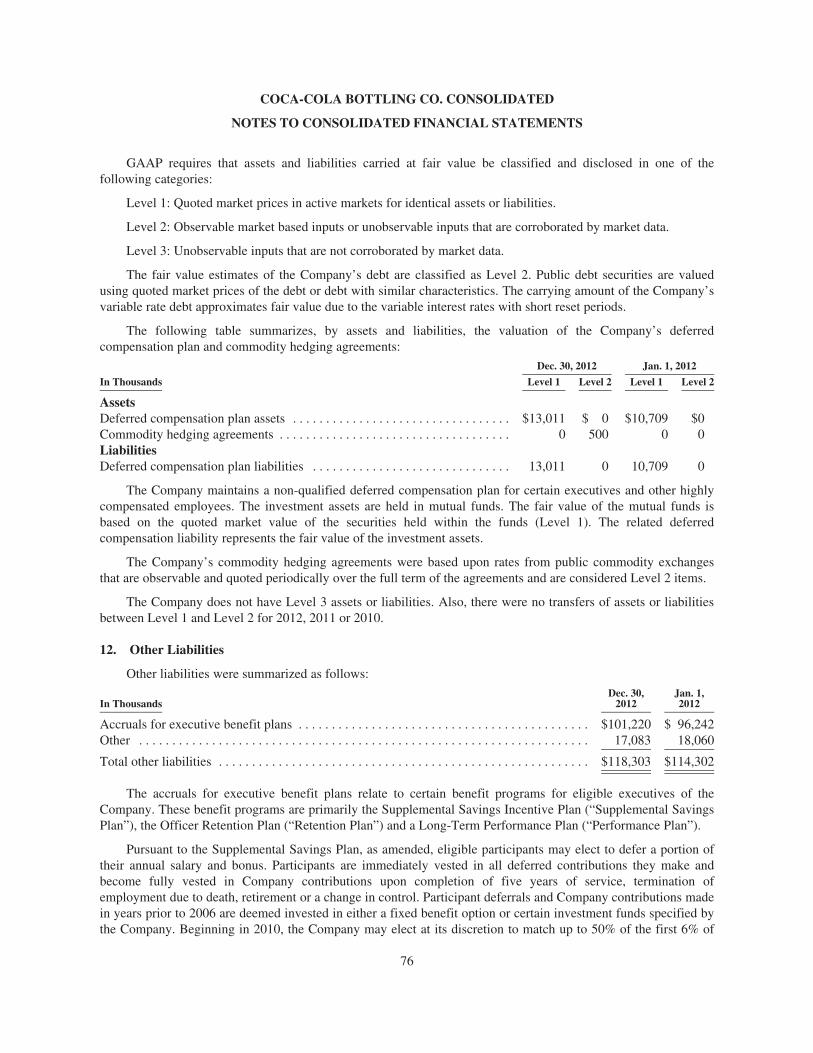
COCA-COLA BOTTLING CO. CONSOLIDATED
NOTES TO CONSOLIDATED FINANCIAL STATEMENTS
GAAP requires that assets and liabilities carried at fair value be classified and disclosed in one of thefollowing categories:
Level 1: Quoted market prices in active markets for identical assets or liabilities.
Level 2: Observable market based inputs or unobservable inputs that are corroborated by market data.
Level 3: Unobservable inputs that are not corroborated by market data.
The fair value estimates of the Company’s debt are classified as Level 2. Public debt securities are valuedusing quoted market prices of the debt or debt with similar characteristics. The carrying amount of the Company’svariable rate debt approximates fair value due to the variable interest rates with short reset periods.
The following table summarizes, by assets and liabilities, the valuation of the Company’s deferredcompensation plan and commodity hedging agreements:
Dec. 30, 2012 Jan. 1, 2012
In Thousands Level 1 Level 2 Level 1 Level 2
AssetsDeferred compensation plan assets . . . . . . . . . . . . . . . . . . . . . . . . . . . . . . . . . $13,011 $ 0 $10,709 $0Commodity hedging agreements . . . . . . . . . . . . . . . . . . . . . . . . . . . . . . . . . . . 0 500 0 0LiabilitiesDeferred compensation plan liabilities . . . . . . . . . . . . . . . . . . . . . . . . . . . . . . 13,011 0 10,709 0
The Company maintains a non-qualified deferred compensation plan for certain executives and other highlycompensated employees. The investment assets are held in mutual funds. The fair value of the mutual funds isbased on the quoted market value of the securities held within the funds (Level 1). The related deferredcompensation liability represents the fair value of the investment assets.
The Company’s commodity hedging agreements were based upon rates from public commodity exchangesthat are observable and quoted periodically over the full term of the agreements and are considered Level 2 items.
The Company does not have Level 3 assets or liabilities. Also, there were no transfers of assets or liabilitiesbetween Level 1 and Level 2 for 2012, 2011 or 2010.
12. Other Liabilities
Other liabilities were summarized as follows:
In ThousandsDec. 30,
2012Jan. 1,2012
Accruals for executive benefit plans . . . . . . . . . . . . . . . . . . . . . . . . . . . . . . . . . . . . . . . . . . . . $101,220 $ 96,242Other . . . . . . . . . . . . . . . . . . . . . . . . . . . . . . . . . . . . . . . . . . . . . . . . . . . . . . . . . . . . . . . . . . . . 17,083 18,060
Total other liabilities . . . . . . . . . . . . . . . . . . . . . . . . . . . . . . . . . . . . . . . . . . . . . . . . . . . . . . . . $118,303 $114,302
The accruals for executive benefit plans relate to certain benefit programs for eligible executives of theCompany. These benefit programs are primarily the Supplemental Savings Incentive Plan (“Supplemental SavingsPlan”), the Officer Retention Plan (“Retention Plan”) and a Long-Term Performance Plan (“Performance Plan”).
Pursuant to the Supplemental Savings Plan, as amended, eligible participants may elect to defer a portion oftheir annual salary and bonus. Participants are immediately vested in all deferred contributions they make andbecome fully vested in Company contributions upon completion of five years of service, termination ofemployment due to death, retirement or a change in control. Participant deferrals and Company contributions madein years prior to 2006 are deemed invested in either a fixed benefit option or certain investment funds specified bythe Company. Beginning in 2010, the Company may elect at its discretion to match up to 50% of the first 6% of
76
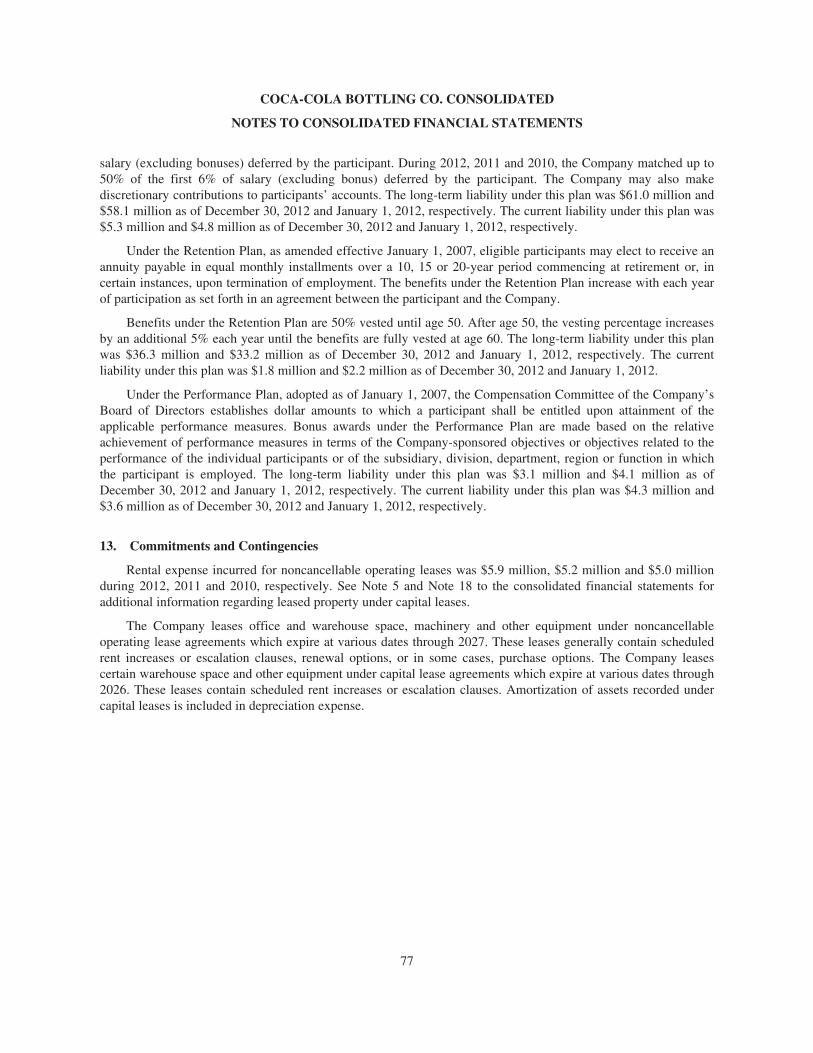
COCA-COLA BOTTLING CO. CONSOLIDATED
NOTES TO CONSOLIDATED FINANCIAL STATEMENTS
salary (excluding bonuses) deferred by the participant. During 2012, 2011 and 2010, the Company matched up to50% of the first 6% of salary (excluding bonus) deferred by the participant. The Company may also makediscretionary contributions to participants’ accounts. The long-term liability under this plan was $61.0 million and$58.1 million as of December 30, 2012 and January 1, 2012, respectively. The current liability under this plan was$5.3 million and $4.8 million as of December 30, 2012 and January 1, 2012, respectively.
Under the Retention Plan, as amended effective January 1, 2007, eligible participants may elect to receive anannuity payable in equal monthly installments over a 10, 15 or 20-year period commencing at retirement or, incertain instances, upon termination of employment. The benefits under the Retention Plan increase with each yearof participation as set forth in an agreement between the participant and the Company.
Benefits under the Retention Plan are 50% vested until age 50. After age 50, the vesting percentage increasesby an additional 5% each year until the benefits are fully vested at age 60. The long-term liability under this planwas $36.3 million and $33.2 million as of December 30, 2012 and January 1, 2012, respectively. The currentliability under this plan was $1.8 million and $2.2 million as of December 30, 2012 and January 1, 2012.
Under the Performance Plan, adopted as of January 1, 2007, the Compensation Committee of the Company’sBoard of Directors establishes dollar amounts to which a participant shall be entitled upon attainment of theapplicable performance measures. Bonus awards under the Performance Plan are made based on the relativeachievement of performance measures in terms of the Company-sponsored objectives or objectives related to theperformance of the individual participants or of the subsidiary, division, department, region or function in whichthe participant is employed. The long-term liability under this plan was $3.1 million and $4.1 million as ofDecember 30, 2012 and January 1, 2012, respectively. The current liability under this plan was $4.3 million and$3.6 million as of December 30, 2012 and January 1, 2012, respectively.
13. Commitments and Contingencies
Rental expense incurred for noncancellable operating leases was $5.9 million, $5.2 million and $5.0 millionduring 2012, 2011 and 2010, respectively. See Note 5 and Note 18 to the consolidated financial statements foradditional information regarding leased property under capital leases.
The Company leases office and warehouse space, machinery and other equipment under noncancellableoperating lease agreements which expire at various dates through 2027. These leases generally contain scheduledrent increases or escalation clauses, renewal options, or in some cases, purchase options. The Company leasescertain warehouse space and other equipment under capital lease agreements which expire at various dates through2026. These leases contain scheduled rent increases or escalation clauses. Amortization of assets recorded undercapital leases is included in depreciation expense.
77
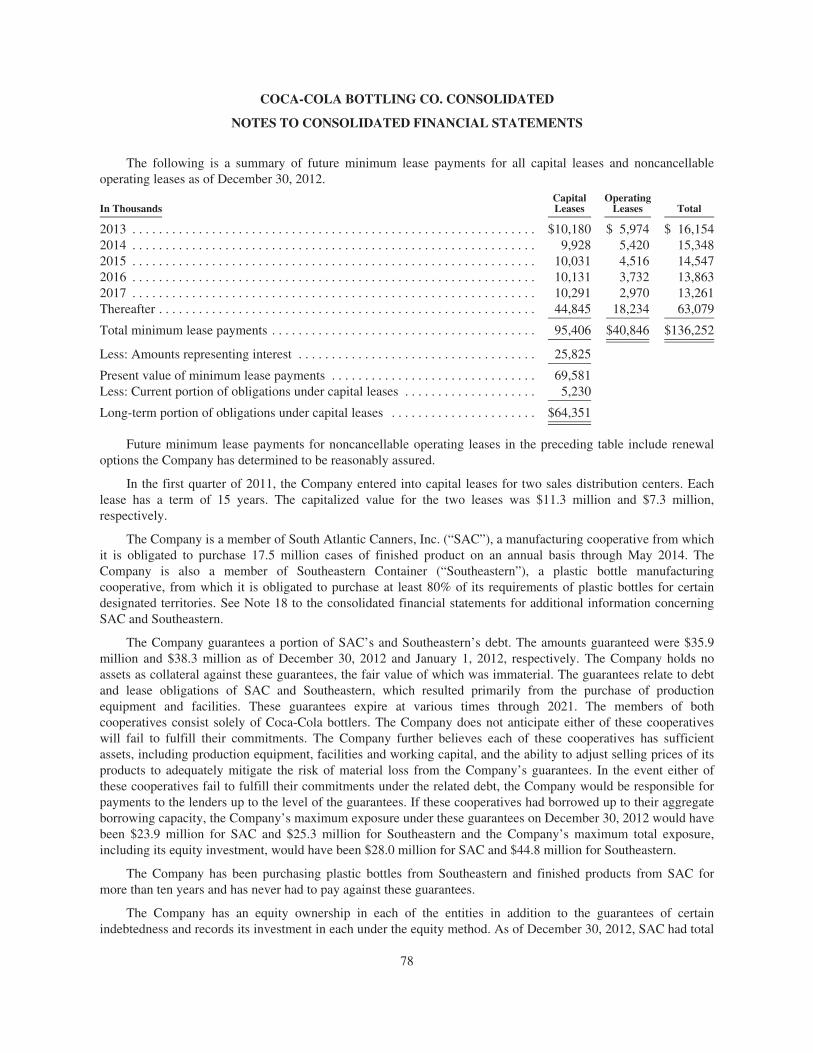
COCA-COLA BOTTLING CO. CONSOLIDATED
NOTES TO CONSOLIDATED FINANCIAL STATEMENTS
The following is a summary of future minimum lease payments for all capital leases and noncancellableoperating leases as of December 30, 2012.
In ThousandsCapitalLeases
OperatingLeases Total
2013 . . . . . . . . . . . . . . . . . . . . . . . . . . . . . . . . . . . . . . . . . . . . . . . . . . . . . . . . . . . . . $10,180 $ 5,974 $ 16,1542014 . . . . . . . . . . . . . . . . . . . . . . . . . . . . . . . . . . . . . . . . . . . . . . . . . . . . . . . . . . . . . 9,928 5,420 15,3482015 . . . . . . . . . . . . . . . . . . . . . . . . . . . . . . . . . . . . . . . . . . . . . . . . . . . . . . . . . . . . . 10,031 4,516 14,5472016 . . . . . . . . . . . . . . . . . . . . . . . . . . . . . . . . . . . . . . . . . . . . . . . . . . . . . . . . . . . . . 10,131 3,732 13,8632017 . . . . . . . . . . . . . . . . . . . . . . . . . . . . . . . . . . . . . . . . . . . . . . . . . . . . . . . . . . . . . 10,291 2,970 13,261Thereafter . . . . . . . . . . . . . . . . . . . . . . . . . . . . . . . . . . . . . . . . . . . . . . . . . . . . . . . . . 44,845 18,234 63,079
Total minimum lease payments . . . . . . . . . . . . . . . . . . . . . . . . . . . . . . . . . . . . . . . . 95,406 $40,846 $136,252
Less: Amounts representing interest . . . . . . . . . . . . . . . . . . . . . . . . . . . . . . . . . . . . 25,825
Present value of minimum lease payments . . . . . . . . . . . . . . . . . . . . . . . . . . . . . . . 69,581Less: Current portion of obligations under capital leases . . . . . . . . . . . . . . . . . . . . 5,230
Long-term portion of obligations under capital leases . . . . . . . . . . . . . . . . . . . . . . $64,351
Future minimum lease payments for noncancellable operating leases in the preceding table include renewaloptions the Company has determined to be reasonably assured.
In the first quarter of 2011, the Company entered into capital leases for two sales distribution centers. Eachlease has a term of 15 years. The capitalized value for the two leases was $11.3 million and $7.3 million,respectively.
The Company is a member of South Atlantic Canners, Inc. (“SAC”), a manufacturing cooperative from whichit is obligated to purchase 17.5 million cases of finished product on an annual basis through May 2014. TheCompany is also a member of Southeastern Container (“Southeastern”), a plastic bottle manufacturingcooperative, from which it is obligated to purchase at least 80% of its requirements of plastic bottles for certaindesignated territories. See Note 18 to the consolidated financial statements for additional information concerningSAC and Southeastern.
The Company guarantees a portion of SAC’s and Southeastern’s debt. The amounts guaranteed were $35.9million and $38.3 million as of December 30, 2012 and January 1, 2012, respectively. The Company holds noassets as collateral against these guarantees, the fair value of which was immaterial. The guarantees relate to debtand lease obligations of SAC and Southeastern, which resulted primarily from the purchase of productionequipment and facilities. These guarantees expire at various times through 2021. The members of bothcooperatives consist solely of Coca-Cola bottlers. The Company does not anticipate either of these cooperativeswill fail to fulfill their commitments. The Company further believes each of these cooperatives has sufficientassets, including production equipment, facilities and working capital, and the ability to adjust selling prices of itsproducts to adequately mitigate the risk of material loss from the Company’s guarantees. In the event either ofthese cooperatives fail to fulfill their commitments under the related debt, the Company would be responsible forpayments to the lenders up to the level of the guarantees. If these cooperatives had borrowed up to their aggregateborrowing capacity, the Company’s maximum exposure under these guarantees on December 30, 2012 would havebeen $23.9 million for SAC and $25.3 million for Southeastern and the Company’s maximum total exposure,including its equity investment, would have been $28.0 million for SAC and $44.8 million for Southeastern.
The Company has been purchasing plastic bottles from Southeastern and finished products from SAC formore than ten years and has never had to pay against these guarantees.
The Company has an equity ownership in each of the entities in addition to the guarantees of certainindebtedness and records its investment in each under the equity method. As of December 30, 2012, SAC had total
78
COCA-COLA BOTTLING CO. CONSOLIDATED
NOTES TO CONSOLIDATED FINANCIAL STATEMENTS
assets of approximately $46 million and total debt of approximately $22 million. SAC had total revenues for 2012of approximately $183 million. As of December 30, 2012, Southeastern had total assets of approximately $354million and total debt of approximately $161 million. Southeastern had total revenue for 2012 of approximately$720 million.
The Company has standby letters of credit, primarily related to its property and casualty insurance programs.On December 30, 2012, these letters of credit totaled $20.8 million. The Company was required to maintain $4.5million of restricted cash for letters of credit beginning in the second quarter of 2009 which was reduced to $3.5million in the second quarter of 2010 and to $3.0 million in the second quarter of 2011. The requirement tomaintain restricted cash for these letters of credit was eliminated in the first quarter of 2012.
The Company participates in long-term marketing contractual arrangements with certain prestige properties,athletic venues and other locations. The future payments related to these contractual arrangements as ofDecember 30, 2012 amounted to $36.0 million and expire at various dates through 2022.
During May 2010, Nashville, Tennessee experienced a severe rain storm which caused extensive flooddamage in the area. The Company has a production/sales distribution facility located in the flooded area. Due todamage incurred during this flood, the Company recorded a loss of approximately $.2 million on uninsured colddrink equipment. This loss was offset by gains of approximately $1.1 million for the excess of insurance proceedsreceived as compared to the net book value of equipment damaged as a result of the flood. In 2010, the Companyreceived $7.1 million in insurance proceeds related to insured losses from the flood. All receivables were recordedfor insured losses during fiscal 2010 and were collected in 2010.
The Company is involved in various claims and legal proceedings which have arisen in the ordinary course ofits business. Although it is difficult to predict the ultimate outcome of these claims and legal proceedings,management believes the ultimate disposition of these matters will not have a material adverse effect on thefinancial condition, cash flows or results of operations of the Company. No material amount of loss in excess ofrecorded amounts is believed to be reasonably possible as a result of these claims and legal proceedings.
The Company is subject to audit by tax authorities in jurisdictions where it conducts business. These auditsmay result in assessments that are subsequently resolved with the authorities or potentially through the courts.Management believes the Company has adequately provided for any assessments that are likely to result fromthese audits; however, final assessments, if any, could be different than the amounts recorded in the consolidatedfinancial statements.
79
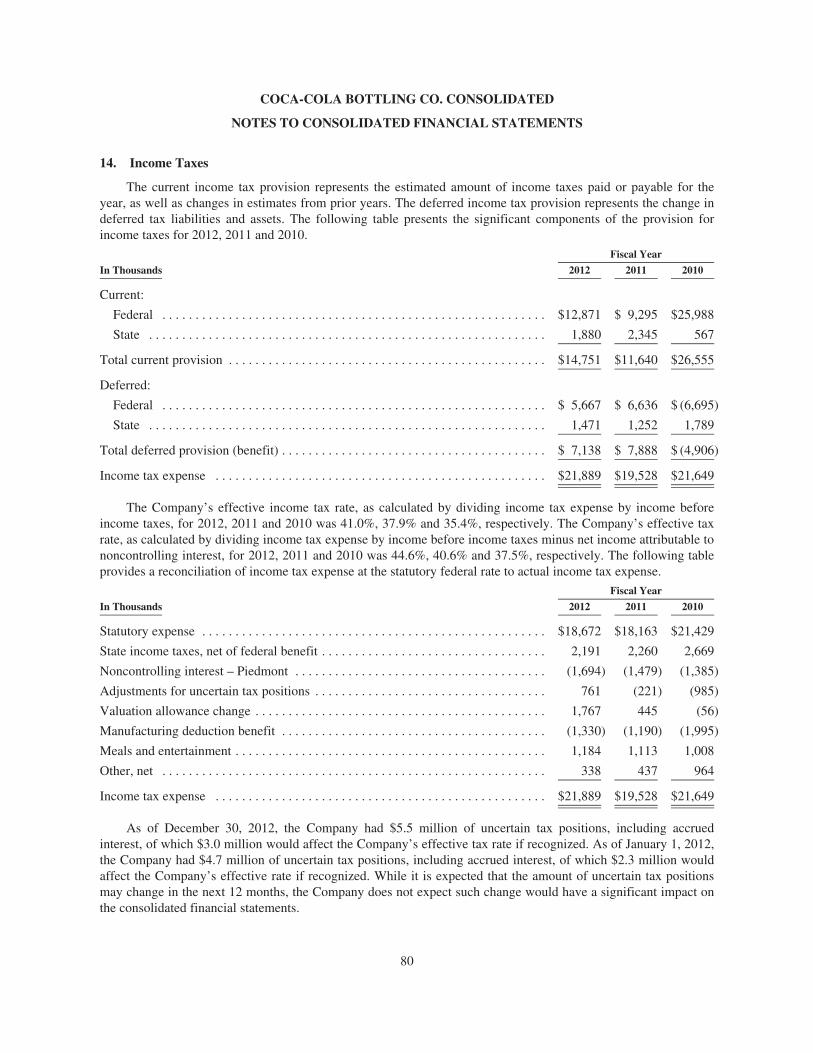
COCA-COLA BOTTLING CO. CONSOLIDATED
NOTES TO CONSOLIDATED FINANCIAL STATEMENTS
14. Income Taxes
The current income tax provision represents the estimated amount of income taxes paid or payable for theyear, as well as changes in estimates from prior years. The deferred income tax provision represents the change indeferred tax liabilities and assets. The following table presents the significant components of the provision forincome taxes for 2012, 2011 and 2010.
Fiscal Year
In Thousands 2012 2011 2010
Current:
Federal . . . . . . . . . . . . . . . . . . . . . . . . . . . . . . . . . . . . . . . . . . . . . . . . . . . . . . . . . . $12,871 $ 9,295 $25,988
State . . . . . . . . . . . . . . . . . . . . . . . . . . . . . . . . . . . . . . . . . . . . . . . . . . . . . . . . . . . . 1,880 2,345 567
Total current provision . . . . . . . . . . . . . . . . . . . . . . . . . . . . . . . . . . . . . . . . . . . . . . . . $14,751 $11,640 $26,555
Deferred:
Federal . . . . . . . . . . . . . . . . . . . . . . . . . . . . . . . . . . . . . . . . . . . . . . . . . . . . . . . . . . $ 5,667 $ 6,636 $ (6,695)
State . . . . . . . . . . . . . . . . . . . . . . . . . . . . . . . . . . . . . . . . . . . . . . . . . . . . . . . . . . . . 1,471 1,252 1,789
Total deferred provision (benefit) . . . . . . . . . . . . . . . . . . . . . . . . . . . . . . . . . . . . . . . . $ 7,138 $ 7,888 $ (4,906)
Income tax expense . . . . . . . . . . . . . . . . . . . . . . . . . . . . . . . . . . . . . . . . . . . . . . . . . . $21,889 $19,528 $21,649
The Company’s effective income tax rate, as calculated by dividing income tax expense by income beforeincome taxes, for 2012, 2011 and 2010 was 41.0%, 37.9% and 35.4%, respectively. The Company’s effective taxrate, as calculated by dividing income tax expense by income before income taxes minus net income attributable tononcontrolling interest, for 2012, 2011 and 2010 was 44.6%, 40.6% and 37.5%, respectively. The following tableprovides a reconciliation of income tax expense at the statutory federal rate to actual income tax expense.
Fiscal Year
In Thousands 2012 2011 2010
Statutory expense . . . . . . . . . . . . . . . . . . . . . . . . . . . . . . . . . . . . . . . . . . . . . . . . . . . . $18,672 $18,163 $21,429
State income taxes, net of federal benefit . . . . . . . . . . . . . . . . . . . . . . . . . . . . . . . . . . 2,191 2,260 2,669
Noncontrolling interest – Piedmont . . . . . . . . . . . . . . . . . . . . . . . . . . . . . . . . . . . . . . (1,694) (1,479) (1,385)
Adjustments for uncertain tax positions . . . . . . . . . . . . . . . . . . . . . . . . . . . . . . . . . . . 761 (221) (985)
Valuation allowance change . . . . . . . . . . . . . . . . . . . . . . . . . . . . . . . . . . . . . . . . . . . . 1,767 445 (56)
Manufacturing deduction benefit . . . . . . . . . . . . . . . . . . . . . . . . . . . . . . . . . . . . . . . . (1,330) (1,190) (1,995)
Meals and entertainment . . . . . . . . . . . . . . . . . . . . . . . . . . . . . . . . . . . . . . . . . . . . . . . 1,184 1,113 1,008
Other, net . . . . . . . . . . . . . . . . . . . . . . . . . . . . . . . . . . . . . . . . . . . . . . . . . . . . . . . . . . 338 437 964
Income tax expense . . . . . . . . . . . . . . . . . . . . . . . . . . . . . . . . . . . . . . . . . . . . . . . . . . $21,889 $19,528 $21,649
As of December 30, 2012, the Company had $5.5 million of uncertain tax positions, including accruedinterest, of which $3.0 million would affect the Company’s effective tax rate if recognized. As of January 1, 2012,the Company had $4.7 million of uncertain tax positions, including accrued interest, of which $2.3 million wouldaffect the Company’s effective rate if recognized. While it is expected that the amount of uncertain tax positionsmay change in the next 12 months, the Company does not expect such change would have a significant impact onthe consolidated financial statements.
80
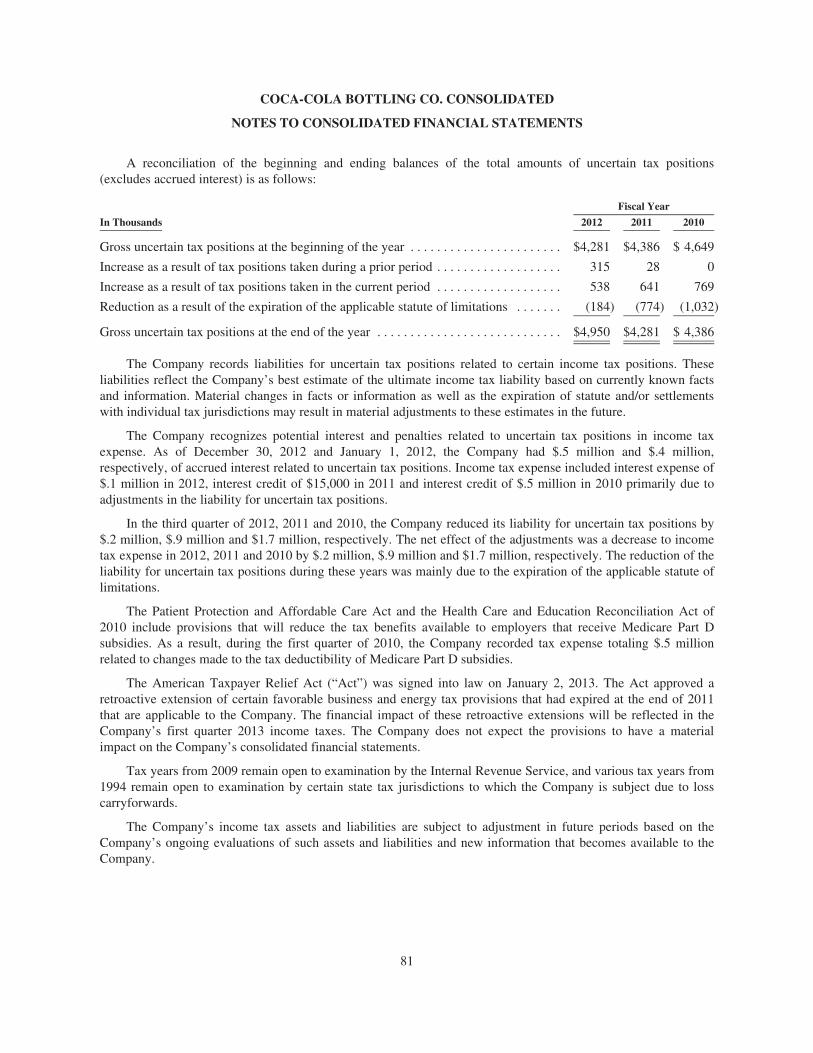
COCA-COLA BOTTLING CO. CONSOLIDATED
NOTES TO CONSOLIDATED FINANCIAL STATEMENTS
A reconciliation of the beginning and ending balances of the total amounts of uncertain tax positions(excludes accrued interest) is as follows:
Fiscal Year
In Thousands 2012 2011 2010
Gross uncertain tax positions at the beginning of the year . . . . . . . . . . . . . . . . . . . . . . . $4,281 $4,386 $ 4,649
Increase as a result of tax positions taken during a prior period . . . . . . . . . . . . . . . . . . . 315 28 0
Increase as a result of tax positions taken in the current period . . . . . . . . . . . . . . . . . . . 538 641 769
Reduction as a result of the expiration of the applicable statute of limitations . . . . . . . (184) (774) (1,032)
Gross uncertain tax positions at the end of the year . . . . . . . . . . . . . . . . . . . . . . . . . . . . $4,950 $4,281 $ 4,386
The Company records liabilities for uncertain tax positions related to certain income tax positions. Theseliabilities reflect the Company’s best estimate of the ultimate income tax liability based on currently known factsand information. Material changes in facts or information as well as the expiration of statute and/or settlementswith individual tax jurisdictions may result in material adjustments to these estimates in the future.
The Company recognizes potential interest and penalties related to uncertain tax positions in income taxexpense. As of December 30, 2012 and January 1, 2012, the Company had $.5 million and $.4 million,respectively, of accrued interest related to uncertain tax positions. Income tax expense included interest expense of$.1 million in 2012, interest credit of $15,000 in 2011 and interest credit of $.5 million in 2010 primarily due toadjustments in the liability for uncertain tax positions.
In the third quarter of 2012, 2011 and 2010, the Company reduced its liability for uncertain tax positions by$.2 million, $.9 million and $1.7 million, respectively. The net effect of the adjustments was a decrease to incometax expense in 2012, 2011 and 2010 by $.2 million, $.9 million and $1.7 million, respectively. The reduction of theliability for uncertain tax positions during these years was mainly due to the expiration of the applicable statute oflimitations.
The Patient Protection and Affordable Care Act and the Health Care and Education Reconciliation Act of2010 include provisions that will reduce the tax benefits available to employers that receive Medicare Part Dsubsidies. As a result, during the first quarter of 2010, the Company recorded tax expense totaling $.5 millionrelated to changes made to the tax deductibility of Medicare Part D subsidies.
The American Taxpayer Relief Act (“Act”) was signed into law on January 2, 2013. The Act approved aretroactive extension of certain favorable business and energy tax provisions that had expired at the end of 2011that are applicable to the Company. The financial impact of these retroactive extensions will be reflected in theCompany’s first quarter 2013 income taxes. The Company does not expect the provisions to have a materialimpact on the Company’s consolidated financial statements.
Tax years from 2009 remain open to examination by the Internal Revenue Service, and various tax years from1994 remain open to examination by certain state tax jurisdictions to which the Company is subject due to losscarryforwards.
The Company’s income tax assets and liabilities are subject to adjustment in future periods based on theCompany’s ongoing evaluations of such assets and liabilities and new information that becomes available to theCompany.
81
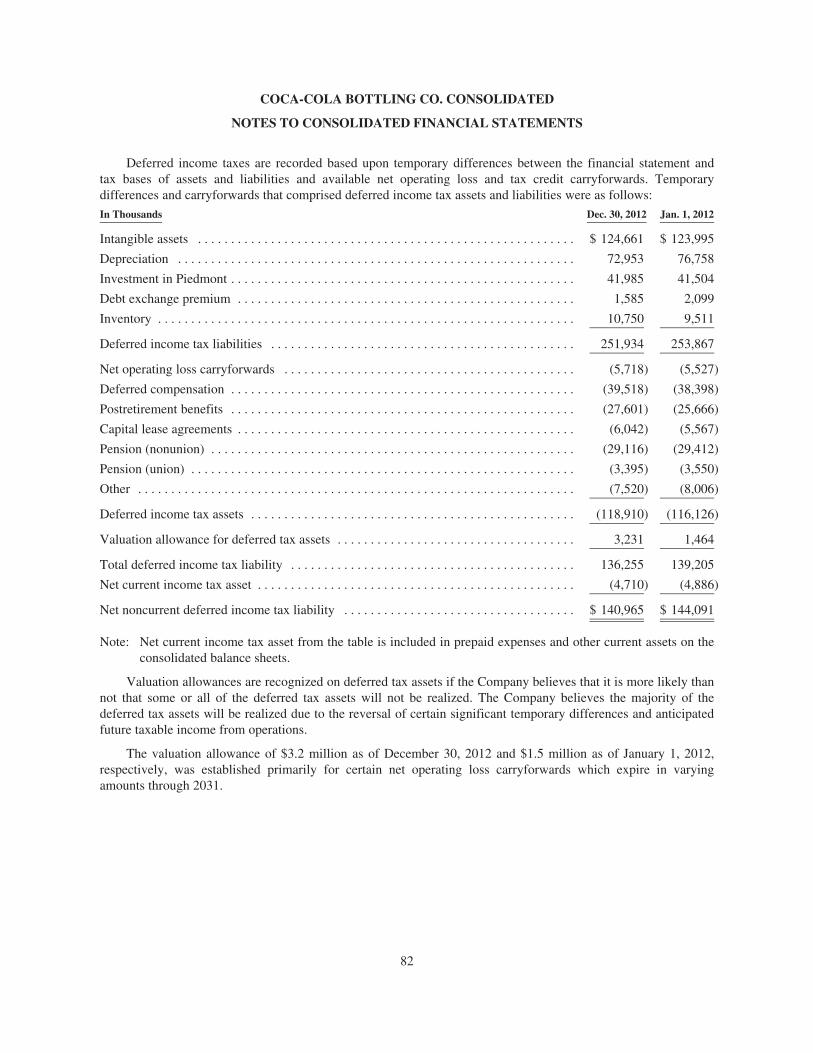
COCA-COLA BOTTLING CO. CONSOLIDATED
NOTES TO CONSOLIDATED FINANCIAL STATEMENTS
Deferred income taxes are recorded based upon temporary differences between the financial statement andtax bases of assets and liabilities and available net operating loss and tax credit carryforwards. Temporarydifferences and carryforwards that comprised deferred income tax assets and liabilities were as follows:
In Thousands Dec. 30, 2012 Jan. 1, 2012
Intangible assets . . . . . . . . . . . . . . . . . . . . . . . . . . . . . . . . . . . . . . . . . . . . . . . . . . . . . . . . . $ 124,661 $ 123,995
Depreciation . . . . . . . . . . . . . . . . . . . . . . . . . . . . . . . . . . . . . . . . . . . . . . . . . . . . . . . . . . . . 72,953 76,758
Investment in Piedmont . . . . . . . . . . . . . . . . . . . . . . . . . . . . . . . . . . . . . . . . . . . . . . . . . . . . 41,985 41,504
Debt exchange premium . . . . . . . . . . . . . . . . . . . . . . . . . . . . . . . . . . . . . . . . . . . . . . . . . . . 1,585 2,099
Inventory . . . . . . . . . . . . . . . . . . . . . . . . . . . . . . . . . . . . . . . . . . . . . . . . . . . . . . . . . . . . . . . 10,750 9,511
Deferred income tax liabilities . . . . . . . . . . . . . . . . . . . . . . . . . . . . . . . . . . . . . . . . . . . . . . 251,934 253,867
Net operating loss carryforwards . . . . . . . . . . . . . . . . . . . . . . . . . . . . . . . . . . . . . . . . . . . . (5,718) (5,527)
Deferred compensation . . . . . . . . . . . . . . . . . . . . . . . . . . . . . . . . . . . . . . . . . . . . . . . . . . . . (39,518) (38,398)
Postretirement benefits . . . . . . . . . . . . . . . . . . . . . . . . . . . . . . . . . . . . . . . . . . . . . . . . . . . . (27,601) (25,666)
Capital lease agreements . . . . . . . . . . . . . . . . . . . . . . . . . . . . . . . . . . . . . . . . . . . . . . . . . . . (6,042) (5,567)
Pension (nonunion) . . . . . . . . . . . . . . . . . . . . . . . . . . . . . . . . . . . . . . . . . . . . . . . . . . . . . . . (29,116) (29,412)
Pension (union) . . . . . . . . . . . . . . . . . . . . . . . . . . . . . . . . . . . . . . . . . . . . . . . . . . . . . . . . . . (3,395) (3,550)
Other . . . . . . . . . . . . . . . . . . . . . . . . . . . . . . . . . . . . . . . . . . . . . . . . . . . . . . . . . . . . . . . . . . (7,520) (8,006)
Deferred income tax assets . . . . . . . . . . . . . . . . . . . . . . . . . . . . . . . . . . . . . . . . . . . . . . . . . (118,910) (116,126)
Valuation allowance for deferred tax assets . . . . . . . . . . . . . . . . . . . . . . . . . . . . . . . . . . . . 3,231 1,464
Total deferred income tax liability . . . . . . . . . . . . . . . . . . . . . . . . . . . . . . . . . . . . . . . . . . . 136,255 139,205
Net current income tax asset . . . . . . . . . . . . . . . . . . . . . . . . . . . . . . . . . . . . . . . . . . . . . . . . (4,710) (4,886)
Net noncurrent deferred income tax liability . . . . . . . . . . . . . . . . . . . . . . . . . . . . . . . . . . . $ 140,965 $ 144,091
Note: Net current income tax asset from the table is included in prepaid expenses and other current assets on theconsolidated balance sheets.
Valuation allowances are recognized on deferred tax assets if the Company believes that it is more likely thannot that some or all of the deferred tax assets will not be realized. The Company believes the majority of thedeferred tax assets will be realized due to the reversal of certain significant temporary differences and anticipatedfuture taxable income from operations.
The valuation allowance of $3.2 million as of December 30, 2012 and $1.5 million as of January 1, 2012,respectively, was established primarily for certain net operating loss carryforwards which expire in varyingamounts through 2031.
82
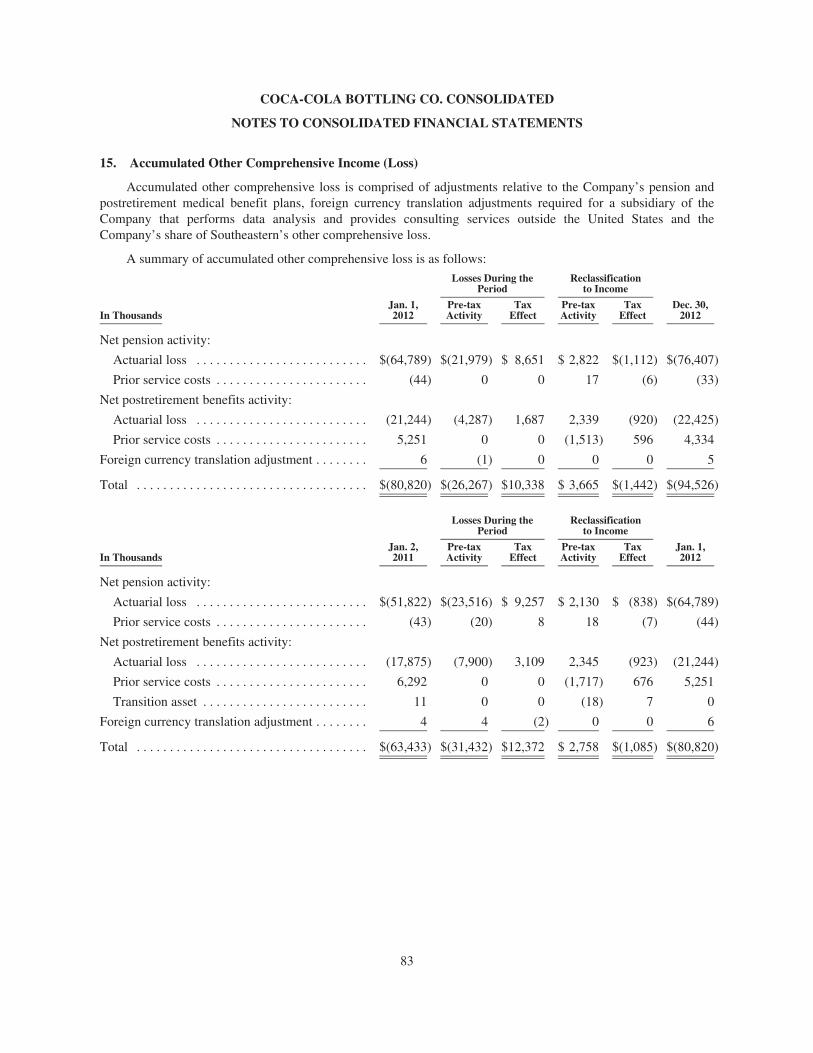
COCA-COLA BOTTLING CO. CONSOLIDATED
NOTES TO CONSOLIDATED FINANCIAL STATEMENTS
15. Accumulated Other Comprehensive Income (Loss)
Accumulated other comprehensive loss is comprised of adjustments relative to the Company’s pension andpostretirement medical benefit plans, foreign currency translation adjustments required for a subsidiary of theCompany that performs data analysis and provides consulting services outside the United States and theCompany’s share of Southeastern’s other comprehensive loss.
A summary of accumulated other comprehensive loss is as follows:
Losses During thePeriod
Reclassificationto Income
In ThousandsJan. 1,2012
Pre-taxActivity
TaxEffect
Pre-taxActivity
TaxEffect
Dec. 30,2012
Net pension activity:
Actuarial loss . . . . . . . . . . . . . . . . . . . . . . . . . . $(64,789) $(21,979) $ 8,651 $ 2,822 $(1,112) $(76,407)
Prior service costs . . . . . . . . . . . . . . . . . . . . . . . (44) 0 0 17 (6) (33)
Net postretirement benefits activity:
Actuarial loss . . . . . . . . . . . . . . . . . . . . . . . . . . (21,244) (4,287) 1,687 2,339 (920) (22,425)
Prior service costs . . . . . . . . . . . . . . . . . . . . . . . 5,251 0 0 (1,513) 596 4,334
Foreign currency translation adjustment . . . . . . . . 6 (1) 0 0 0 5
Total . . . . . . . . . . . . . . . . . . . . . . . . . . . . . . . . . . . $(80,820) $(26,267) $10,338 $ 3,665 $(1,442) $(94,526)
Losses During thePeriod
Reclassificationto Income
In ThousandsJan. 2,2011
Pre-taxActivity
TaxEffect
Pre-taxActivity
TaxEffect
Jan. 1,2012
Net pension activity:
Actuarial loss . . . . . . . . . . . . . . . . . . . . . . . . . . $(51,822) $(23,516) $ 9,257 $ 2,130 $ (838) $(64,789)
Prior service costs . . . . . . . . . . . . . . . . . . . . . . . (43) (20) 8 18 (7) (44)
Net postretirement benefits activity:
Actuarial loss . . . . . . . . . . . . . . . . . . . . . . . . . . (17,875) (7,900) 3,109 2,345 (923) (21,244)
Prior service costs . . . . . . . . . . . . . . . . . . . . . . . 6,292 0 0 (1,717) 676 5,251
Transition asset . . . . . . . . . . . . . . . . . . . . . . . . . 11 0 0 (18) 7 0
Foreign currency translation adjustment . . . . . . . . 4 4 (2) 0 0 6
Total . . . . . . . . . . . . . . . . . . . . . . . . . . . . . . . . . . . $(63,433) $(31,432) $12,372 $ 2,758 $(1,085) $(80,820)
83
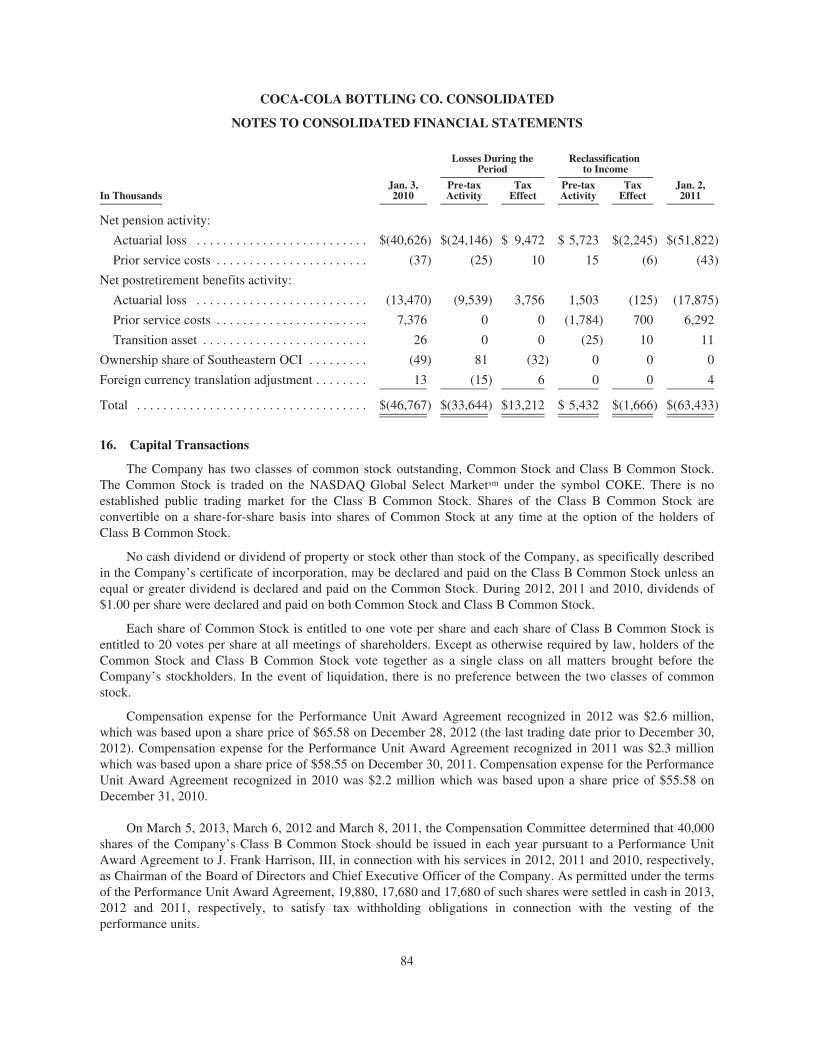
COCA-COLA BOTTLING CO. CONSOLIDATED
NOTES TO CONSOLIDATED FINANCIAL STATEMENTS
Losses During thePeriod
Reclassificationto Income
In ThousandsJan. 3,2010
Pre-taxActivity
TaxEffect
Pre-taxActivity
TaxEffect
Jan. 2,2011
Net pension activity:
Actuarial loss . . . . . . . . . . . . . . . . . . . . . . . . . . $(40,626) $(24,146) $ 9,472 $ 5,723 $(2,245) $(51,822)
Prior service costs . . . . . . . . . . . . . . . . . . . . . . . (37) (25) 10 15 (6) (43)
Net postretirement benefits activity:
Actuarial loss . . . . . . . . . . . . . . . . . . . . . . . . . . (13,470) (9,539) 3,756 1,503 (125) (17,875)
Prior service costs . . . . . . . . . . . . . . . . . . . . . . . 7,376 0 0 (1,784) 700 6,292
Transition asset . . . . . . . . . . . . . . . . . . . . . . . . . 26 0 0 (25) 10 11
Ownership share of Southeastern OCI . . . . . . . . . (49) 81 (32) 0 0 0
Foreign currency translation adjustment . . . . . . . . 13 (15) 6 0 0 4
Total . . . . . . . . . . . . . . . . . . . . . . . . . . . . . . . . . . . $(46,767) $(33,644) $13,212 $ 5,432 $(1,666) $(63,433)
16. Capital Transactions
The Company has two classes of common stock outstanding, Common Stock and Class B Common Stock.The Common Stock is traded on the NASDAQ Global Select Marketsm under the symbol COKE. There is noestablished public trading market for the Class B Common Stock. Shares of the Class B Common Stock areconvertible on a share-for-share basis into shares of Common Stock at any time at the option of the holders ofClass B Common Stock.
No cash dividend or dividend of property or stock other than stock of the Company, as specifically describedin the Company’s certificate of incorporation, may be declared and paid on the Class B Common Stock unless anequal or greater dividend is declared and paid on the Common Stock. During 2012, 2011 and 2010, dividends of$1.00 per share were declared and paid on both Common Stock and Class B Common Stock.
Each share of Common Stock is entitled to one vote per share and each share of Class B Common Stock isentitled to 20 votes per share at all meetings of shareholders. Except as otherwise required by law, holders of theCommon Stock and Class B Common Stock vote together as a single class on all matters brought before theCompany’s stockholders. In the event of liquidation, there is no preference between the two classes of commonstock.
Compensation expense for the Performance Unit Award Agreement recognized in 2012 was $2.6 million,which was based upon a share price of $65.58 on December 28, 2012 (the last trading date prior to December 30,2012). Compensation expense for the Performance Unit Award Agreement recognized in 2011 was $2.3 millionwhich was based upon a share price of $58.55 on December 30, 2011. Compensation expense for the PerformanceUnit Award Agreement recognized in 2010 was $2.2 million which was based upon a share price of $55.58 onDecember 31, 2010.
On March 5, 2013, March 6, 2012 and March 8, 2011, the Compensation Committee determined that 40,000shares of the Company’s Class B Common Stock should be issued in each year pursuant to a Performance UnitAward Agreement to J. Frank Harrison, III, in connection with his services in 2012, 2011 and 2010, respectively,as Chairman of the Board of Directors and Chief Executive Officer of the Company. As permitted under the termsof the Performance Unit Award Agreement, 19,880, 17,680 and 17,680 of such shares were settled in cash in 2013,2012 and 2011, respectively, to satisfy tax withholding obligations in connection with the vesting of theperformance units.
84
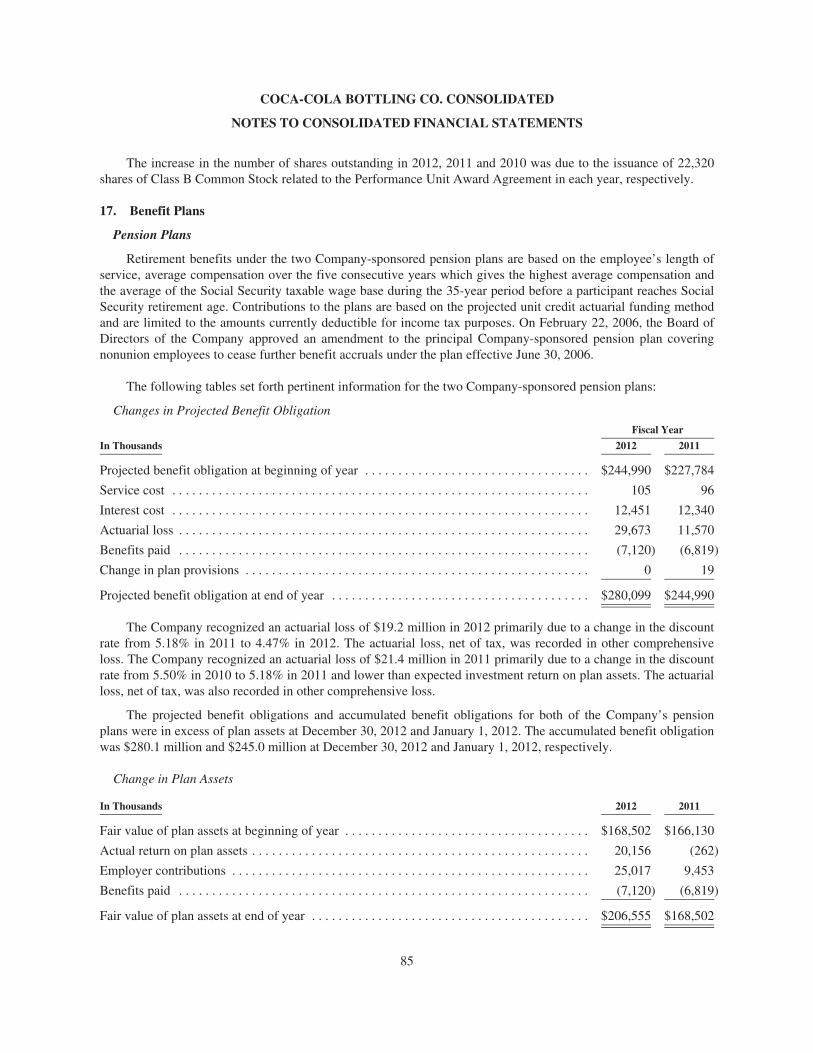
COCA-COLA BOTTLING CO. CONSOLIDATED
NOTES TO CONSOLIDATED FINANCIAL STATEMENTS
The increase in the number of shares outstanding in 2012, 2011 and 2010 was due to the issuance of 22,320shares of Class B Common Stock related to the Performance Unit Award Agreement in each year, respectively.
17. Benefit Plans
Pension Plans
Retirement benefits under the two Company-sponsored pension plans are based on the employee’s length ofservice, average compensation over the five consecutive years which gives the highest average compensation andthe average of the Social Security taxable wage base during the 35-year period before a participant reaches SocialSecurity retirement age. Contributions to the plans are based on the projected unit credit actuarial funding methodand are limited to the amounts currently deductible for income tax purposes. On February 22, 2006, the Board ofDirectors of the Company approved an amendment to the principal Company-sponsored pension plan coveringnonunion employees to cease further benefit accruals under the plan effective June 30, 2006.
The following tables set forth pertinent information for the two Company-sponsored pension plans:
Changes in Projected Benefit Obligation
Fiscal Year
In Thousands 2012 2011
Projected benefit obligation at beginning of year . . . . . . . . . . . . . . . . . . . . . . . . . . . . . . . . . . $244,990 $227,784
Service cost . . . . . . . . . . . . . . . . . . . . . . . . . . . . . . . . . . . . . . . . . . . . . . . . . . . . . . . . . . . . . . . 105 96
Interest cost . . . . . . . . . . . . . . . . . . . . . . . . . . . . . . . . . . . . . . . . . . . . . . . . . . . . . . . . . . . . . . . 12,451 12,340
Actuarial loss . . . . . . . . . . . . . . . . . . . . . . . . . . . . . . . . . . . . . . . . . . . . . . . . . . . . . . . . . . . . . . 29,673 11,570
Benefits paid . . . . . . . . . . . . . . . . . . . . . . . . . . . . . . . . . . . . . . . . . . . . . . . . . . . . . . . . . . . . . . (7,120) (6,819)
Change in plan provisions . . . . . . . . . . . . . . . . . . . . . . . . . . . . . . . . . . . . . . . . . . . . . . . . . . . . 0 19
Projected benefit obligation at end of year . . . . . . . . . . . . . . . . . . . . . . . . . . . . . . . . . . . . . . . $280,099 $244,990
The Company recognized an actuarial loss of $19.2 million in 2012 primarily due to a change in the discountrate from 5.18% in 2011 to 4.47% in 2012. The actuarial loss, net of tax, was recorded in other comprehensiveloss. The Company recognized an actuarial loss of $21.4 million in 2011 primarily due to a change in the discountrate from 5.50% in 2010 to 5.18% in 2011 and lower than expected investment return on plan assets. The actuarialloss, net of tax, was also recorded in other comprehensive loss.
The projected benefit obligations and accumulated benefit obligations for both of the Company’s pensionplans were in excess of plan assets at December 30, 2012 and January 1, 2012. The accumulated benefit obligationwas $280.1 million and $245.0 million at December 30, 2012 and January 1, 2012, respectively.
Change in Plan Assets
In Thousands 2012 2011
Fair value of plan assets at beginning of year . . . . . . . . . . . . . . . . . . . . . . . . . . . . . . . . . . . . . $168,502 $166,130
Actual return on plan assets . . . . . . . . . . . . . . . . . . . . . . . . . . . . . . . . . . . . . . . . . . . . . . . . . . . 20,156 (262)
Employer contributions . . . . . . . . . . . . . . . . . . . . . . . . . . . . . . . . . . . . . . . . . . . . . . . . . . . . . . 25,017 9,453
Benefits paid . . . . . . . . . . . . . . . . . . . . . . . . . . . . . . . . . . . . . . . . . . . . . . . . . . . . . . . . . . . . . . (7,120) (6,819)
Fair value of plan assets at end of year . . . . . . . . . . . . . . . . . . . . . . . . . . . . . . . . . . . . . . . . . . $206,555 $168,502
85
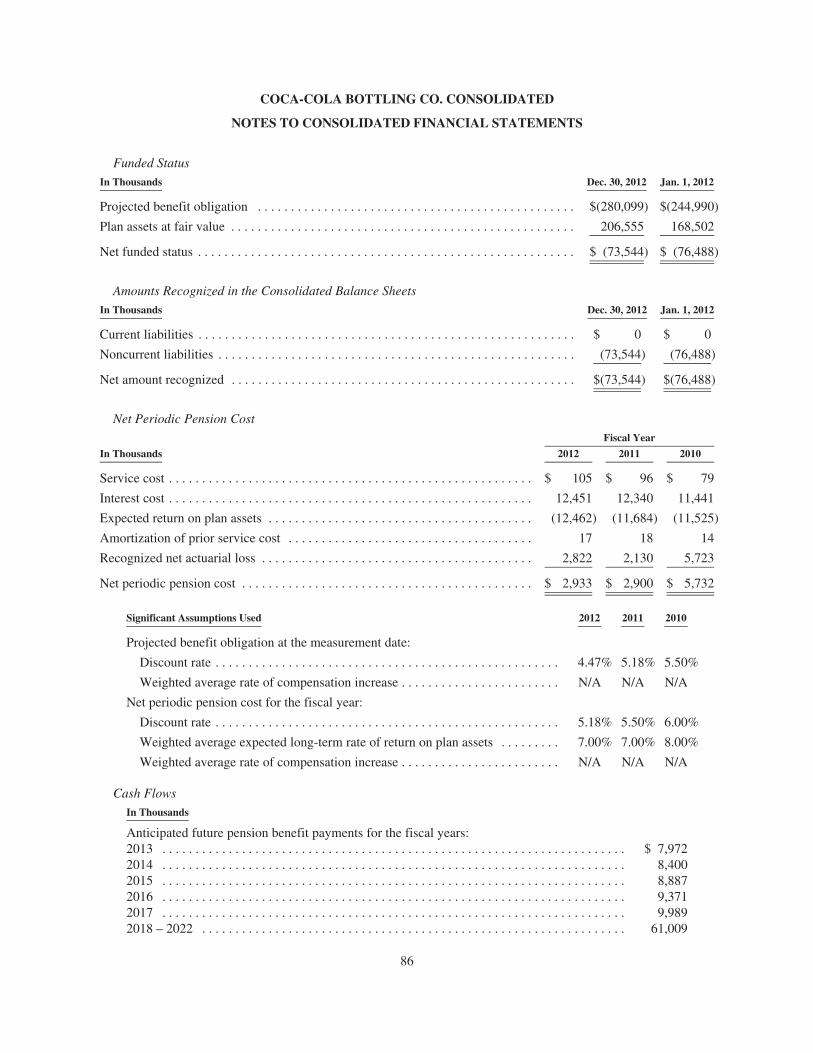
COCA-COLA BOTTLING CO. CONSOLIDATED
NOTES TO CONSOLIDATED FINANCIAL STATEMENTS
Funded StatusIn Thousands Dec. 30, 2012 Jan. 1, 2012
Projected benefit obligation . . . . . . . . . . . . . . . . . . . . . . . . . . . . . . . . . . . . . . . . . . . . . . . . $(280,099) $(244,990)
Plan assets at fair value . . . . . . . . . . . . . . . . . . . . . . . . . . . . . . . . . . . . . . . . . . . . . . . . . . . . 206,555 168,502
Net funded status . . . . . . . . . . . . . . . . . . . . . . . . . . . . . . . . . . . . . . . . . . . . . . . . . . . . . . . . . $ (73,544) $ (76,488)
Amounts Recognized in the Consolidated Balance SheetsIn Thousands Dec. 30, 2012 Jan. 1, 2012
Current liabilities . . . . . . . . . . . . . . . . . . . . . . . . . . . . . . . . . . . . . . . . . . . . . . . . . . . . . . . . . $ 0 $ 0
Noncurrent liabilities . . . . . . . . . . . . . . . . . . . . . . . . . . . . . . . . . . . . . . . . . . . . . . . . . . . . . . (73,544) (76,488)
Net amount recognized . . . . . . . . . . . . . . . . . . . . . . . . . . . . . . . . . . . . . . . . . . . . . . . . . . . . $(73,544) $(76,488)
Net Periodic Pension CostFiscal Year
In Thousands 2012 2011 2010
Service cost . . . . . . . . . . . . . . . . . . . . . . . . . . . . . . . . . . . . . . . . . . . . . . . . . . . . . . . $ 105 $ 96 $ 79
Interest cost . . . . . . . . . . . . . . . . . . . . . . . . . . . . . . . . . . . . . . . . . . . . . . . . . . . . . . . 12,451 12,340 11,441
Expected return on plan assets . . . . . . . . . . . . . . . . . . . . . . . . . . . . . . . . . . . . . . . . (12,462) (11,684) (11,525)
Amortization of prior service cost . . . . . . . . . . . . . . . . . . . . . . . . . . . . . . . . . . . . . 17 18 14
Recognized net actuarial loss . . . . . . . . . . . . . . . . . . . . . . . . . . . . . . . . . . . . . . . . . 2,822 2,130 5,723
Net periodic pension cost . . . . . . . . . . . . . . . . . . . . . . . . . . . . . . . . . . . . . . . . . . . . $ 2,933 $ 2,900 $ 5,732
Significant Assumptions Used 2012 2011 2010
Projected benefit obligation at the measurement date:
Discount rate . . . . . . . . . . . . . . . . . . . . . . . . . . . . . . . . . . . . . . . . . . . . . . . . . . . . 4.47% 5.18% 5.50%
Weighted average rate of compensation increase . . . . . . . . . . . . . . . . . . . . . . . . N/A N/A N/A
Net periodic pension cost for the fiscal year:
Discount rate . . . . . . . . . . . . . . . . . . . . . . . . . . . . . . . . . . . . . . . . . . . . . . . . . . . . 5.18% 5.50% 6.00%
Weighted average expected long-term rate of return on plan assets . . . . . . . . . 7.00% 7.00% 8.00%
Weighted average rate of compensation increase . . . . . . . . . . . . . . . . . . . . . . . . N/A N/A N/A
Cash FlowsIn Thousands
Anticipated future pension benefit payments for the fiscal years:2013 . . . . . . . . . . . . . . . . . . . . . . . . . . . . . . . . . . . . . . . . . . . . . . . . . . . . . . . . . . . . . . . . . . . . . . $ 7,9722014 . . . . . . . . . . . . . . . . . . . . . . . . . . . . . . . . . . . . . . . . . . . . . . . . . . . . . . . . . . . . . . . . . . . . . . 8,4002015 . . . . . . . . . . . . . . . . . . . . . . . . . . . . . . . . . . . . . . . . . . . . . . . . . . . . . . . . . . . . . . . . . . . . . . 8,8872016 . . . . . . . . . . . . . . . . . . . . . . . . . . . . . . . . . . . . . . . . . . . . . . . . . . . . . . . . . . . . . . . . . . . . . . 9,3712017 . . . . . . . . . . . . . . . . . . . . . . . . . . . . . . . . . . . . . . . . . . . . . . . . . . . . . . . . . . . . . . . . . . . . . . 9,9892018 – 2022 . . . . . . . . . . . . . . . . . . . . . . . . . . . . . . . . . . . . . . . . . . . . . . . . . . . . . . . . . . . . . . . . 61,009
86
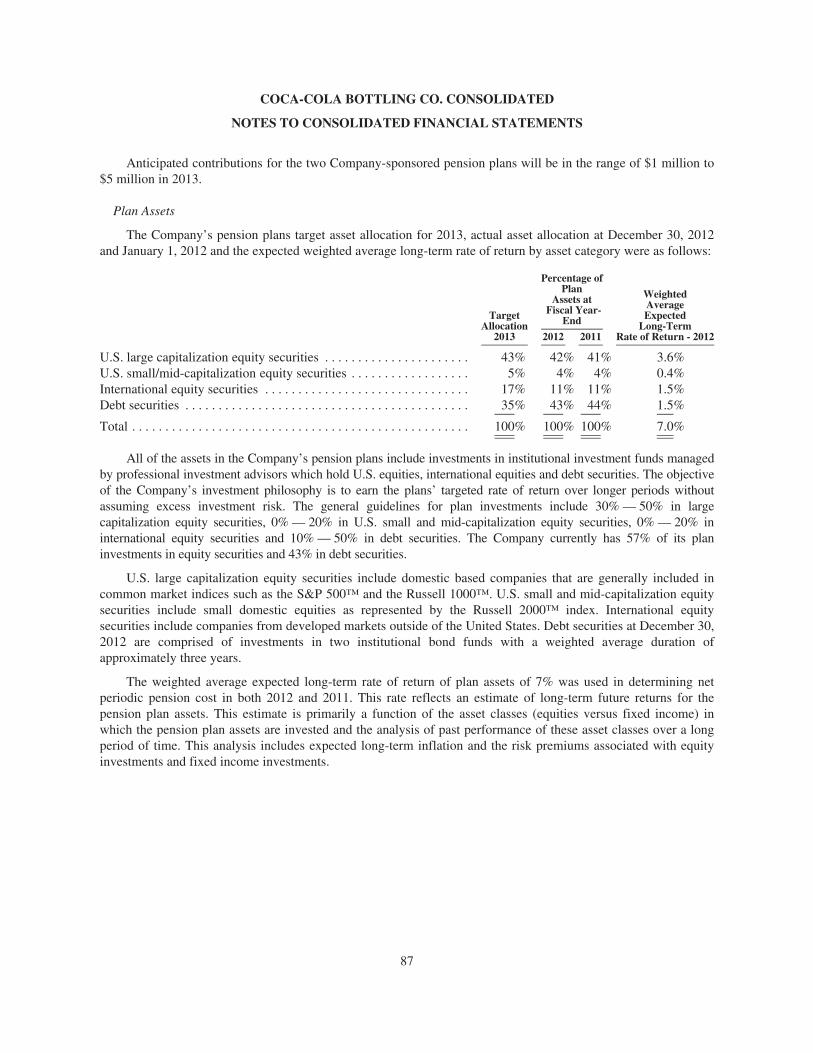
COCA-COLA BOTTLING CO. CONSOLIDATED
NOTES TO CONSOLIDATED FINANCIAL STATEMENTS
Anticipated contributions for the two Company-sponsored pension plans will be in the range of $1 million to$5 million in 2013.
Plan Assets
The Company’s pension plans target asset allocation for 2013, actual asset allocation at December 30, 2012and January 1, 2012 and the expected weighted average long-term rate of return by asset category were as follows:
TargetAllocation
2013
Percentage ofPlan
Assets atFiscal Year-
End
WeightedAverageExpected
Long-TermRate of Return - 20122012 2011
U.S. large capitalization equity securities . . . . . . . . . . . . . . . . . . . . . . 43% 42% 41% 3.6%U.S. small/mid-capitalization equity securities . . . . . . . . . . . . . . . . . . 5% 4% 4% 0.4%International equity securities . . . . . . . . . . . . . . . . . . . . . . . . . . . . . . . 17% 11% 11% 1.5%Debt securities . . . . . . . . . . . . . . . . . . . . . . . . . . . . . . . . . . . . . . . . . . . 35% 43% 44% 1.5%
Total . . . . . . . . . . . . . . . . . . . . . . . . . . . . . . . . . . . . . . . . . . . . . . . . . . . 100% 100% 100% 7.0%
All of the assets in the Company’s pension plans include investments in institutional investment funds managedby professional investment advisors which hold U.S. equities, international equities and debt securities. The objectiveof the Company’s investment philosophy is to earn the plans’ targeted rate of return over longer periods withoutassuming excess investment risk. The general guidelines for plan investments include 30% — 50% in largecapitalization equity securities, 0% — 20% in U.S. small and mid-capitalization equity securities, 0% — 20% ininternational equity securities and 10% — 50% in debt securities. The Company currently has 57% of its planinvestments in equity securities and 43% in debt securities.
U.S. large capitalization equity securities include domestic based companies that are generally included incommon market indices such as the S&P 500™ and the Russell 1000™. U.S. small and mid-capitalization equitysecurities include small domestic equities as represented by the Russell 2000™ index. International equitysecurities include companies from developed markets outside of the United States. Debt securities at December 30,2012 are comprised of investments in two institutional bond funds with a weighted average duration ofapproximately three years.
The weighted average expected long-term rate of return of plan assets of 7% was used in determining netperiodic pension cost in both 2012 and 2011. This rate reflects an estimate of long-term future returns for thepension plan assets. This estimate is primarily a function of the asset classes (equities versus fixed income) inwhich the pension plan assets are invested and the analysis of past performance of these asset classes over a longperiod of time. This analysis includes expected long-term inflation and the risk premiums associated with equityinvestments and fixed income investments.
87
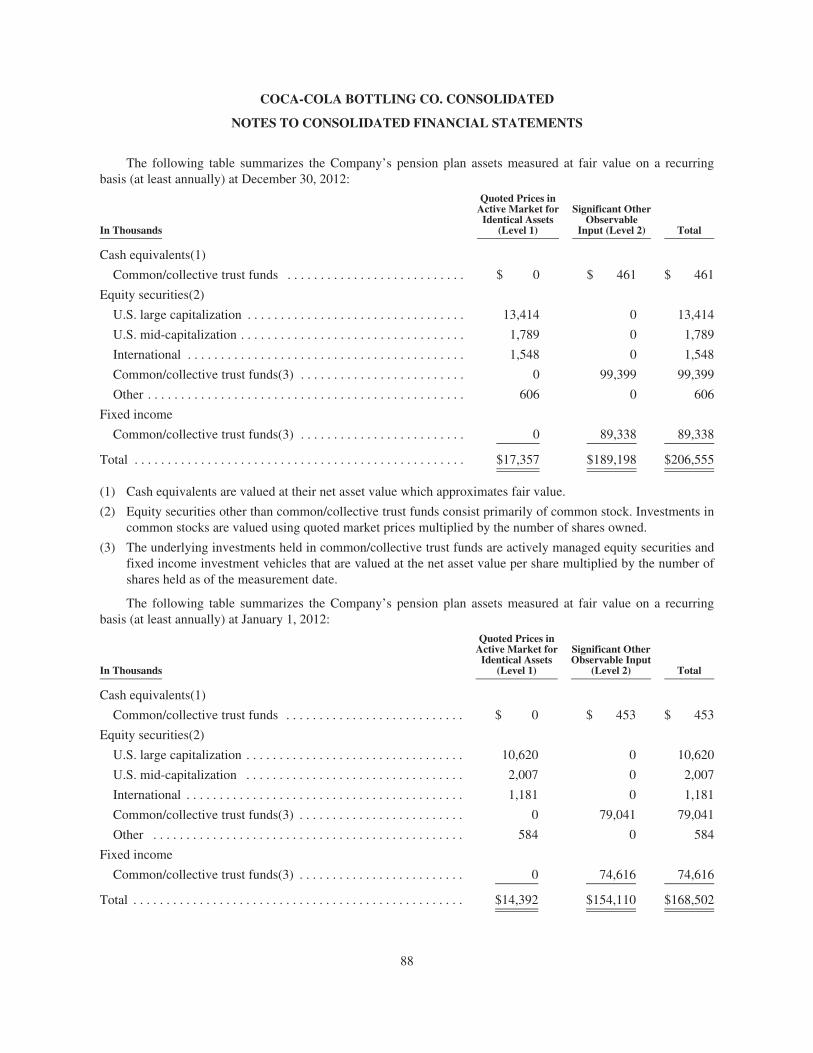
COCA-COLA BOTTLING CO. CONSOLIDATED
NOTES TO CONSOLIDATED FINANCIAL STATEMENTS
The following table summarizes the Company’s pension plan assets measured at fair value on a recurringbasis (at least annually) at December 30, 2012:
In Thousands
Quoted Prices inActive Market for
Identical Assets(Level 1)
Significant OtherObservable
Input (Level 2) Total
Cash equivalents(1)
Common/collective trust funds . . . . . . . . . . . . . . . . . . . . . . . . . . . $ 0 $ 461 $ 461
Equity securities(2)
U.S. large capitalization . . . . . . . . . . . . . . . . . . . . . . . . . . . . . . . . . 13,414 0 13,414
U.S. mid-capitalization . . . . . . . . . . . . . . . . . . . . . . . . . . . . . . . . . . 1,789 0 1,789
International . . . . . . . . . . . . . . . . . . . . . . . . . . . . . . . . . . . . . . . . . . 1,548 0 1,548
Common/collective trust funds(3) . . . . . . . . . . . . . . . . . . . . . . . . . 0 99,399 99,399
Other . . . . . . . . . . . . . . . . . . . . . . . . . . . . . . . . . . . . . . . . . . . . . . . . 606 0 606
Fixed income
Common/collective trust funds(3) . . . . . . . . . . . . . . . . . . . . . . . . . 0 89,338 89,338
Total . . . . . . . . . . . . . . . . . . . . . . . . . . . . . . . . . . . . . . . . . . . . . . . . . . $17,357 $189,198 $206,555
(1) Cash equivalents are valued at their net asset value which approximates fair value.
(2) Equity securities other than common/collective trust funds consist primarily of common stock. Investments incommon stocks are valued using quoted market prices multiplied by the number of shares owned.
(3) The underlying investments held in common/collective trust funds are actively managed equity securities andfixed income investment vehicles that are valued at the net asset value per share multiplied by the number ofshares held as of the measurement date.
The following table summarizes the Company’s pension plan assets measured at fair value on a recurringbasis (at least annually) at January 1, 2012:
In Thousands
Quoted Prices inActive Market for
Identical Assets(Level 1)
Significant OtherObservable Input
(Level 2) Total
Cash equivalents(1)
Common/collective trust funds . . . . . . . . . . . . . . . . . . . . . . . . . . . $ 0 $ 453 $ 453
Equity securities(2)
U.S. large capitalization . . . . . . . . . . . . . . . . . . . . . . . . . . . . . . . . . 10,620 0 10,620
U.S. mid-capitalization . . . . . . . . . . . . . . . . . . . . . . . . . . . . . . . . . 2,007 0 2,007
International . . . . . . . . . . . . . . . . . . . . . . . . . . . . . . . . . . . . . . . . . . 1,181 0 1,181
Common/collective trust funds(3) . . . . . . . . . . . . . . . . . . . . . . . . . 0 79,041 79,041
Other . . . . . . . . . . . . . . . . . . . . . . . . . . . . . . . . . . . . . . . . . . . . . . . 584 0 584
Fixed income
Common/collective trust funds(3) . . . . . . . . . . . . . . . . . . . . . . . . . 0 74,616 74,616
Total . . . . . . . . . . . . . . . . . . . . . . . . . . . . . . . . . . . . . . . . . . . . . . . . . . $14,392 $154,110 $168,502
88
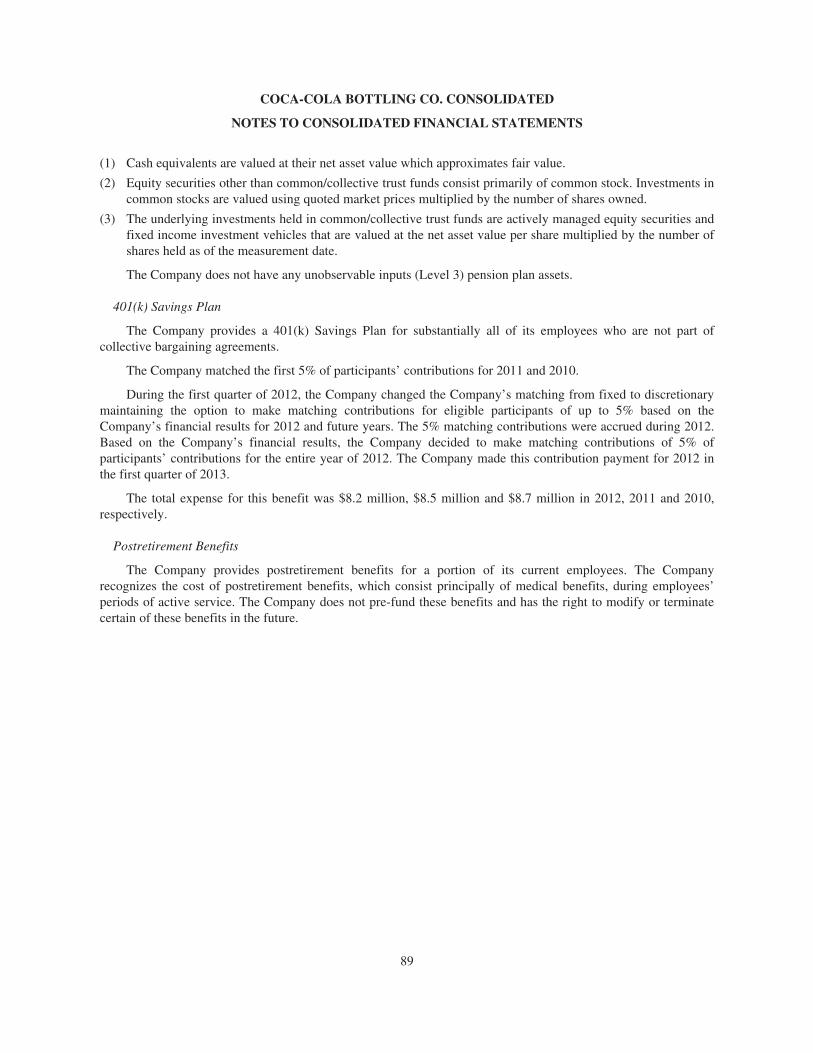
COCA-COLA BOTTLING CO. CONSOLIDATED
NOTES TO CONSOLIDATED FINANCIAL STATEMENTS
(1) Cash equivalents are valued at their net asset value which approximates fair value.
(2) Equity securities other than common/collective trust funds consist primarily of common stock. Investments incommon stocks are valued using quoted market prices multiplied by the number of shares owned.
(3) The underlying investments held in common/collective trust funds are actively managed equity securities andfixed income investment vehicles that are valued at the net asset value per share multiplied by the number ofshares held as of the measurement date.
The Company does not have any unobservable inputs (Level 3) pension plan assets.
401(k) Savings Plan
The Company provides a 401(k) Savings Plan for substantially all of its employees who are not part ofcollective bargaining agreements.
The Company matched the first 5% of participants’ contributions for 2011 and 2010.
During the first quarter of 2012, the Company changed the Company’s matching from fixed to discretionarymaintaining the option to make matching contributions for eligible participants of up to 5% based on theCompany’s financial results for 2012 and future years. The 5% matching contributions were accrued during 2012.Based on the Company’s financial results, the Company decided to make matching contributions of 5% ofparticipants’ contributions for the entire year of 2012. The Company made this contribution payment for 2012 inthe first quarter of 2013.
The total expense for this benefit was $8.2 million, $8.5 million and $8.7 million in 2012, 2011 and 2010,respectively.
Postretirement Benefits
The Company provides postretirement benefits for a portion of its current employees. The Companyrecognizes the cost of postretirement benefits, which consist principally of medical benefits, during employees’periods of active service. The Company does not pre-fund these benefits and has the right to modify or terminatecertain of these benefits in the future.
89
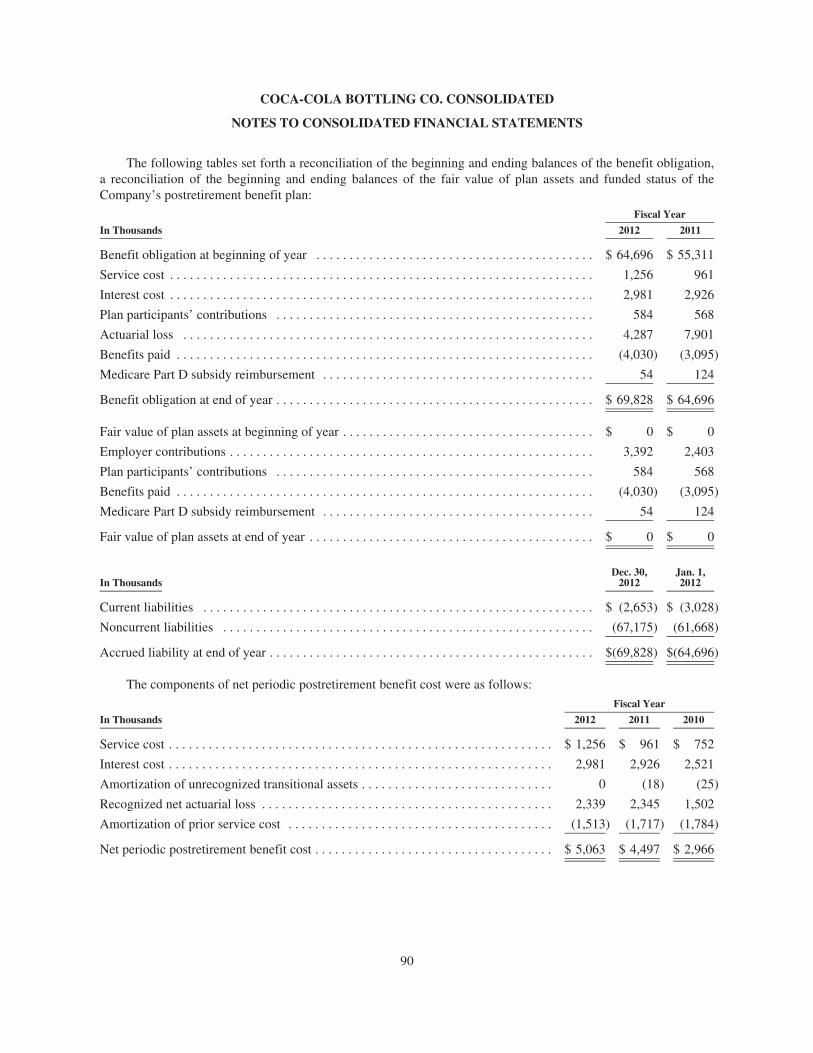
COCA-COLA BOTTLING CO. CONSOLIDATED
NOTES TO CONSOLIDATED FINANCIAL STATEMENTS
The following tables set forth a reconciliation of the beginning and ending balances of the benefit obligation,a reconciliation of the beginning and ending balances of the fair value of plan assets and funded status of theCompany’s postretirement benefit plan:
Fiscal Year
In Thousands 2012 2011
Benefit obligation at beginning of year . . . . . . . . . . . . . . . . . . . . . . . . . . . . . . . . . . . . . . . . . . $ 64,696 $ 55,311
Service cost . . . . . . . . . . . . . . . . . . . . . . . . . . . . . . . . . . . . . . . . . . . . . . . . . . . . . . . . . . . . . . . . 1,256 961
Interest cost . . . . . . . . . . . . . . . . . . . . . . . . . . . . . . . . . . . . . . . . . . . . . . . . . . . . . . . . . . . . . . . . 2,981 2,926
Plan participants’ contributions . . . . . . . . . . . . . . . . . . . . . . . . . . . . . . . . . . . . . . . . . . . . . . . . 584 568
Actuarial loss . . . . . . . . . . . . . . . . . . . . . . . . . . . . . . . . . . . . . . . . . . . . . . . . . . . . . . . . . . . . . . 4,287 7,901
Benefits paid . . . . . . . . . . . . . . . . . . . . . . . . . . . . . . . . . . . . . . . . . . . . . . . . . . . . . . . . . . . . . . . (4,030) (3,095)
Medicare Part D subsidy reimbursement . . . . . . . . . . . . . . . . . . . . . . . . . . . . . . . . . . . . . . . . . 54 124
Benefit obligation at end of year . . . . . . . . . . . . . . . . . . . . . . . . . . . . . . . . . . . . . . . . . . . . . . . . $ 69,828 $ 64,696
Fair value of plan assets at beginning of year . . . . . . . . . . . . . . . . . . . . . . . . . . . . . . . . . . . . . . $ 0 $ 0
Employer contributions . . . . . . . . . . . . . . . . . . . . . . . . . . . . . . . . . . . . . . . . . . . . . . . . . . . . . . . 3,392 2,403
Plan participants’ contributions . . . . . . . . . . . . . . . . . . . . . . . . . . . . . . . . . . . . . . . . . . . . . . . . 584 568
Benefits paid . . . . . . . . . . . . . . . . . . . . . . . . . . . . . . . . . . . . . . . . . . . . . . . . . . . . . . . . . . . . . . . (4,030) (3,095)
Medicare Part D subsidy reimbursement . . . . . . . . . . . . . . . . . . . . . . . . . . . . . . . . . . . . . . . . . 54 124
Fair value of plan assets at end of year . . . . . . . . . . . . . . . . . . . . . . . . . . . . . . . . . . . . . . . . . . . $ 0 $ 0
In ThousandsDec. 30,
2012Jan. 1,2012
Current liabilities . . . . . . . . . . . . . . . . . . . . . . . . . . . . . . . . . . . . . . . . . . . . . . . . . . . . . . . . . . . $ (2,653) $ (3,028)
Noncurrent liabilities . . . . . . . . . . . . . . . . . . . . . . . . . . . . . . . . . . . . . . . . . . . . . . . . . . . . . . . . (67,175) (61,668)
Accrued liability at end of year . . . . . . . . . . . . . . . . . . . . . . . . . . . . . . . . . . . . . . . . . . . . . . . . . $(69,828) $(64,696)
The components of net periodic postretirement benefit cost were as follows:
Fiscal Year
In Thousands 2012 2011 2010
Service cost . . . . . . . . . . . . . . . . . . . . . . . . . . . . . . . . . . . . . . . . . . . . . . . . . . . . . . . . . . $ 1,256 $ 961 $ 752
Interest cost . . . . . . . . . . . . . . . . . . . . . . . . . . . . . . . . . . . . . . . . . . . . . . . . . . . . . . . . . . 2,981 2,926 2,521
Amortization of unrecognized transitional assets . . . . . . . . . . . . . . . . . . . . . . . . . . . . . 0 (18) (25)
Recognized net actuarial loss . . . . . . . . . . . . . . . . . . . . . . . . . . . . . . . . . . . . . . . . . . . . 2,339 2,345 1,502
Amortization of prior service cost . . . . . . . . . . . . . . . . . . . . . . . . . . . . . . . . . . . . . . . . (1,513) (1,717) (1,784)
Net periodic postretirement benefit cost . . . . . . . . . . . . . . . . . . . . . . . . . . . . . . . . . . . . $ 5,063 $ 4,497 $ 2,966
90
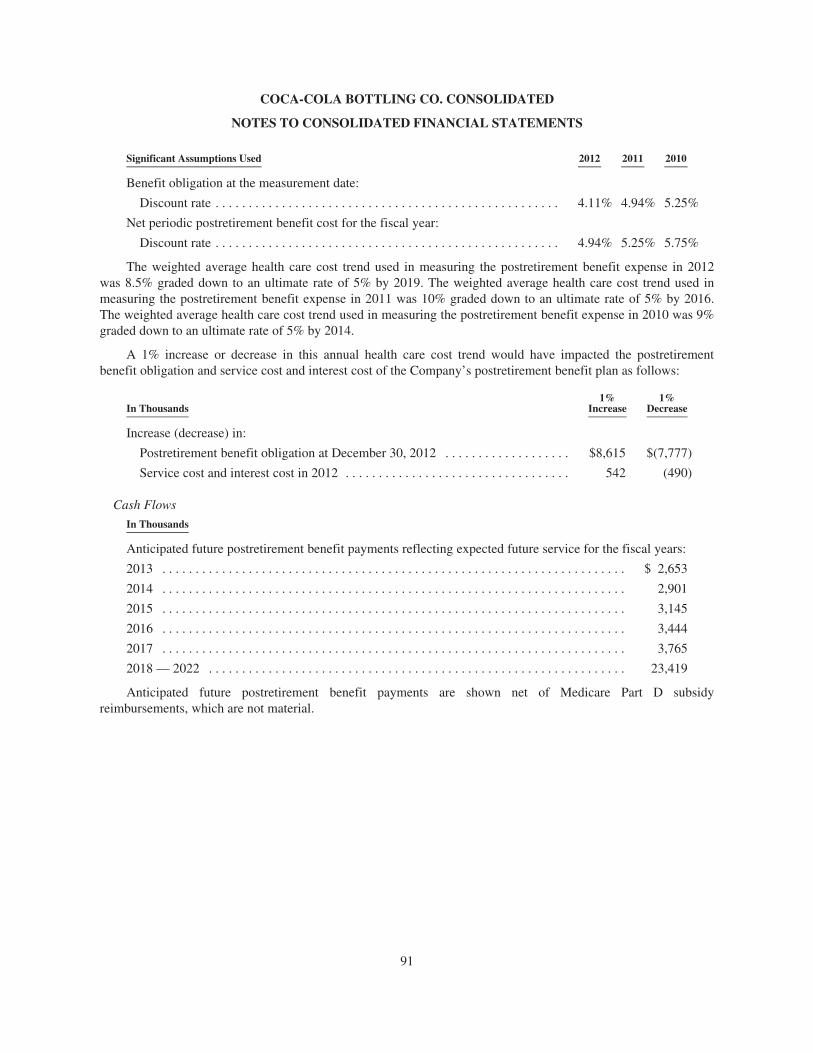
COCA-COLA BOTTLING CO. CONSOLIDATED
NOTES TO CONSOLIDATED FINANCIAL STATEMENTS
Significant Assumptions Used 2012 2011 2010
Benefit obligation at the measurement date:
Discount rate . . . . . . . . . . . . . . . . . . . . . . . . . . . . . . . . . . . . . . . . . . . . . . . . . . . . 4.11% 4.94% 5.25%
Net periodic postretirement benefit cost for the fiscal year:
Discount rate . . . . . . . . . . . . . . . . . . . . . . . . . . . . . . . . . . . . . . . . . . . . . . . . . . . . 4.94% 5.25% 5.75%
The weighted average health care cost trend used in measuring the postretirement benefit expense in 2012was 8.5% graded down to an ultimate rate of 5% by 2019. The weighted average health care cost trend used inmeasuring the postretirement benefit expense in 2011 was 10% graded down to an ultimate rate of 5% by 2016.The weighted average health care cost trend used in measuring the postretirement benefit expense in 2010 was 9%graded down to an ultimate rate of 5% by 2014.
A 1% increase or decrease in this annual health care cost trend would have impacted the postretirementbenefit obligation and service cost and interest cost of the Company’s postretirement benefit plan as follows:
In Thousands1%
Increase1%
Decrease
Increase (decrease) in:
Postretirement benefit obligation at December 30, 2012 . . . . . . . . . . . . . . . . . . . $8,615 $(7,777)
Service cost and interest cost in 2012 . . . . . . . . . . . . . . . . . . . . . . . . . . . . . . . . . . 542 (490)
Cash Flows
In Thousands
Anticipated future postretirement benefit payments reflecting expected future service for the fiscal years:
2013 . . . . . . . . . . . . . . . . . . . . . . . . . . . . . . . . . . . . . . . . . . . . . . . . . . . . . . . . . . . . . . . . . . . . . . $ 2,653
2014 . . . . . . . . . . . . . . . . . . . . . . . . . . . . . . . . . . . . . . . . . . . . . . . . . . . . . . . . . . . . . . . . . . . . . . 2,901
2015 . . . . . . . . . . . . . . . . . . . . . . . . . . . . . . . . . . . . . . . . . . . . . . . . . . . . . . . . . . . . . . . . . . . . . . 3,145
2016 . . . . . . . . . . . . . . . . . . . . . . . . . . . . . . . . . . . . . . . . . . . . . . . . . . . . . . . . . . . . . . . . . . . . . . 3,444
2017 . . . . . . . . . . . . . . . . . . . . . . . . . . . . . . . . . . . . . . . . . . . . . . . . . . . . . . . . . . . . . . . . . . . . . . 3,765
2018 — 2022 . . . . . . . . . . . . . . . . . . . . . . . . . . . . . . . . . . . . . . . . . . . . . . . . . . . . . . . . . . . . . . . 23,419
Anticipated future postretirement benefit payments are shown net of Medicare Part D subsidyreimbursements, which are not material.
91
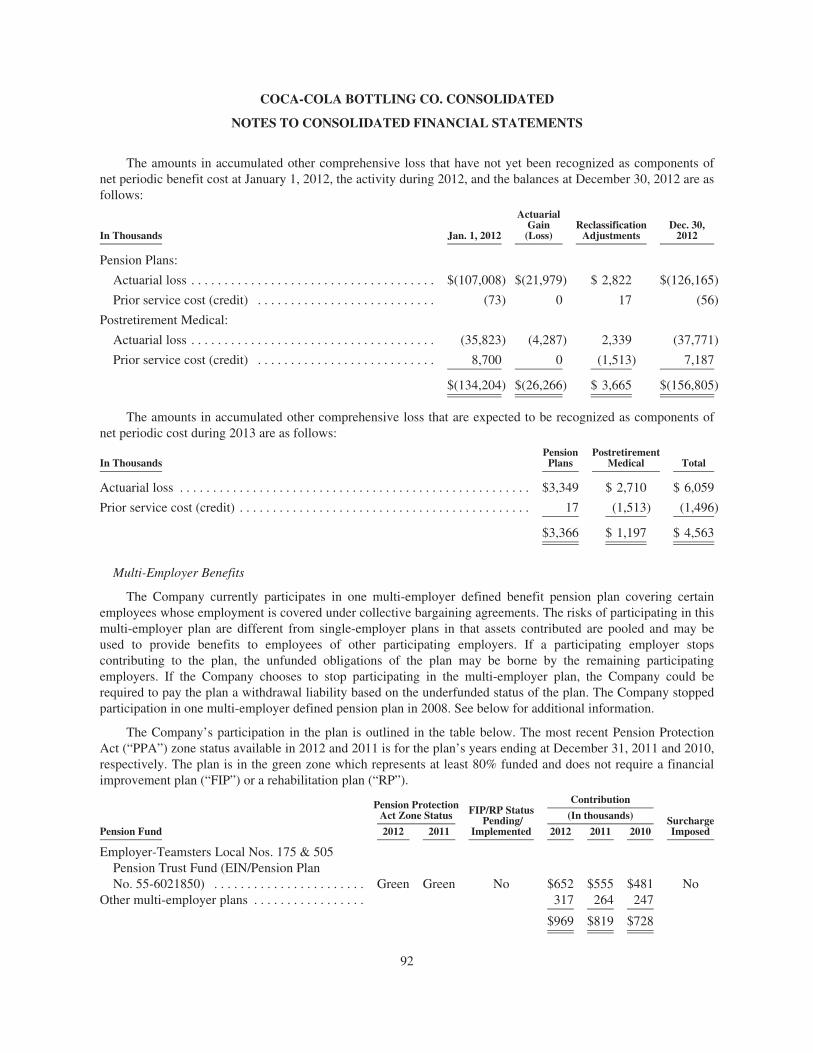
COCA-COLA BOTTLING CO. CONSOLIDATED
NOTES TO CONSOLIDATED FINANCIAL STATEMENTS
The amounts in accumulated other comprehensive loss that have not yet been recognized as components ofnet periodic benefit cost at January 1, 2012, the activity during 2012, and the balances at December 30, 2012 are asfollows:
In Thousands Jan. 1, 2012
ActuarialGain(Loss)
ReclassificationAdjustments
Dec. 30,2012
Pension Plans:
Actuarial loss . . . . . . . . . . . . . . . . . . . . . . . . . . . . . . . . . . . . . $(107,008) $(21,979) $ 2,822 $(126,165)
Prior service cost (credit) . . . . . . . . . . . . . . . . . . . . . . . . . . . (73) 0 17 (56)
Postretirement Medical:
Actuarial loss . . . . . . . . . . . . . . . . . . . . . . . . . . . . . . . . . . . . . (35,823) (4,287) 2,339 (37,771)
Prior service cost (credit) . . . . . . . . . . . . . . . . . . . . . . . . . . . 8,700 0 (1,513) 7,187
$(134,204) $(26,266) $ 3,665 $(156,805)
The amounts in accumulated other comprehensive loss that are expected to be recognized as components ofnet periodic cost during 2013 are as follows:
In ThousandsPensionPlans
PostretirementMedical Total
Actuarial loss . . . . . . . . . . . . . . . . . . . . . . . . . . . . . . . . . . . . . . . . . . . . . . . . . . . . . $3,349 $ 2,710 $ 6,059
Prior service cost (credit) . . . . . . . . . . . . . . . . . . . . . . . . . . . . . . . . . . . . . . . . . . . . 17 (1,513) (1,496)
$3,366 $ 1,197 $ 4,563
Multi-Employer Benefits
The Company currently participates in one multi-employer defined benefit pension plan covering certainemployees whose employment is covered under collective bargaining agreements. The risks of participating in thismulti-employer plan are different from single-employer plans in that assets contributed are pooled and may beused to provide benefits to employees of other participating employers. If a participating employer stopscontributing to the plan, the unfunded obligations of the plan may be borne by the remaining participatingemployers. If the Company chooses to stop participating in the multi-employer plan, the Company could berequired to pay the plan a withdrawal liability based on the underfunded status of the plan. The Company stoppedparticipation in one multi-employer defined pension plan in 2008. See below for additional information.
The Company’s participation in the plan is outlined in the table below. The most recent Pension ProtectionAct (“PPA”) zone status available in 2012 and 2011 is for the plan’s years ending at December 31, 2011 and 2010,respectively. The plan is in the green zone which represents at least 80% funded and does not require a financialimprovement plan (“FIP”) or a rehabilitation plan (“RP”).
Pension ProtectionAct Zone Status FIP/RP Status
Pending/Implemented
Contribution
SurchargeImposed
(In thousands)
Pension Fund 2012 2011 2012 2011 2010
Employer-Teamsters Local Nos. 175 & 505Pension Trust Fund (EIN/Pension PlanNo. 55-6021850) . . . . . . . . . . . . . . . . . . . . . . . Green Green No $652 $555 $481 No
Other multi-employer plans . . . . . . . . . . . . . . . . . 317 264 247
$969 $819 $728
92
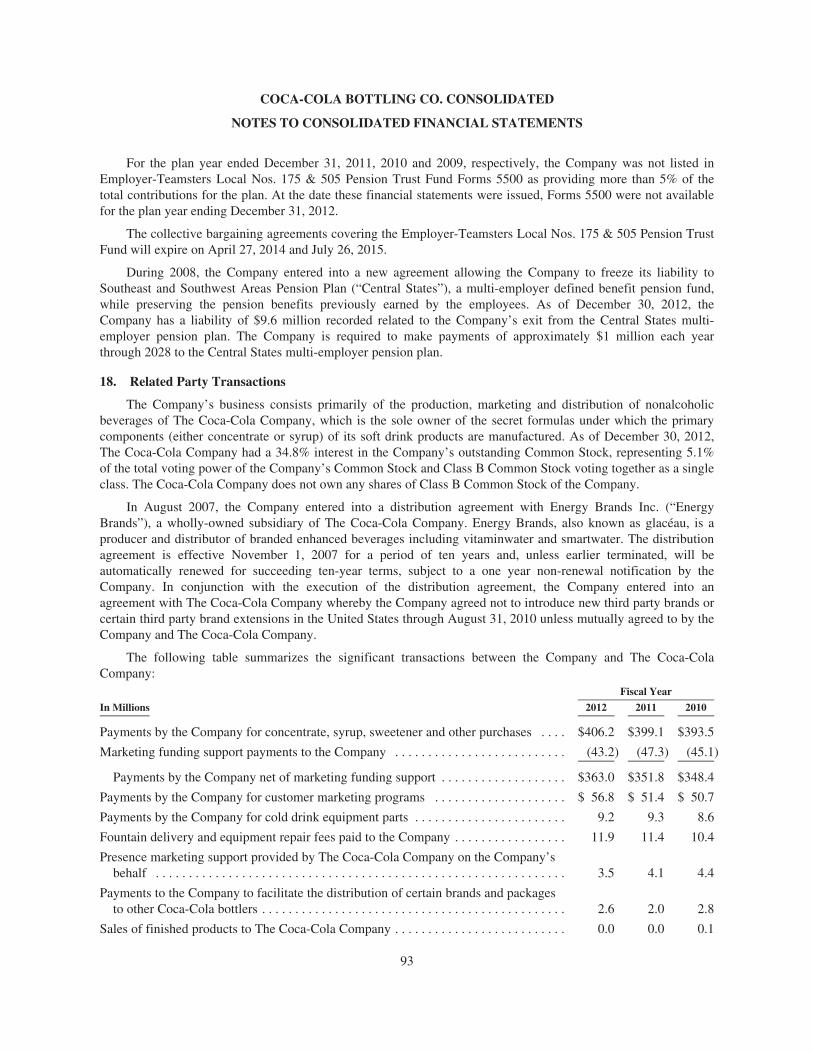
COCA-COLA BOTTLING CO. CONSOLIDATED
NOTES TO CONSOLIDATED FINANCIAL STATEMENTS
For the plan year ended December 31, 2011, 2010 and 2009, respectively, the Company was not listed inEmployer-Teamsters Local Nos. 175 & 505 Pension Trust Fund Forms 5500 as providing more than 5% of thetotal contributions for the plan. At the date these financial statements were issued, Forms 5500 were not availablefor the plan year ending December 31, 2012.
The collective bargaining agreements covering the Employer-Teamsters Local Nos. 175 & 505 Pension TrustFund will expire on April 27, 2014 and July 26, 2015.
During 2008, the Company entered into a new agreement allowing the Company to freeze its liability toSoutheast and Southwest Areas Pension Plan (“Central States”), a multi-employer defined benefit pension fund,while preserving the pension benefits previously earned by the employees. As of December 30, 2012, theCompany has a liability of $9.6 million recorded related to the Company’s exit from the Central States multi-employer pension plan. The Company is required to make payments of approximately $1 million each yearthrough 2028 to the Central States multi-employer pension plan.
18. Related Party Transactions
The Company’s business consists primarily of the production, marketing and distribution of nonalcoholicbeverages of The Coca-Cola Company, which is the sole owner of the secret formulas under which the primarycomponents (either concentrate or syrup) of its soft drink products are manufactured. As of December 30, 2012,The Coca-Cola Company had a 34.8% interest in the Company’s outstanding Common Stock, representing 5.1%of the total voting power of the Company’s Common Stock and Class B Common Stock voting together as a singleclass. The Coca-Cola Company does not own any shares of Class B Common Stock of the Company.
In August 2007, the Company entered into a distribution agreement with Energy Brands Inc. (“EnergyBrands”), a wholly-owned subsidiary of The Coca-Cola Company. Energy Brands, also known as glacéau, is aproducer and distributor of branded enhanced beverages including vitaminwater and smartwater. The distributionagreement is effective November 1, 2007 for a period of ten years and, unless earlier terminated, will beautomatically renewed for succeeding ten-year terms, subject to a one year non-renewal notification by theCompany. In conjunction with the execution of the distribution agreement, the Company entered into anagreement with The Coca-Cola Company whereby the Company agreed not to introduce new third party brands orcertain third party brand extensions in the United States through August 31, 2010 unless mutually agreed to by theCompany and The Coca-Cola Company.
The following table summarizes the significant transactions between the Company and The Coca-ColaCompany:
Fiscal Year
In Millions 2012 2011 2010
Payments by the Company for concentrate, syrup, sweetener and other purchases . . . . $406.2 $399.1 $393.5
Marketing funding support payments to the Company . . . . . . . . . . . . . . . . . . . . . . . . . . (43.2) (47.3) (45.1)
Payments by the Company net of marketing funding support . . . . . . . . . . . . . . . . . . . $363.0 $351.8 $348.4
Payments by the Company for customer marketing programs . . . . . . . . . . . . . . . . . . . . $ 56.8 $ 51.4 $ 50.7
Payments by the Company for cold drink equipment parts . . . . . . . . . . . . . . . . . . . . . . . 9.2 9.3 8.6
Fountain delivery and equipment repair fees paid to the Company . . . . . . . . . . . . . . . . . 11.9 11.4 10.4
Presence marketing support provided by The Coca-Cola Company on the Company’sbehalf . . . . . . . . . . . . . . . . . . . . . . . . . . . . . . . . . . . . . . . . . . . . . . . . . . . . . . . . . . . . . . 3.5 4.1 4.4
Payments to the Company to facilitate the distribution of certain brands and packagesto other Coca-Cola bottlers . . . . . . . . . . . . . . . . . . . . . . . . . . . . . . . . . . . . . . . . . . . . . . 2.6 2.0 2.8
Sales of finished products to The Coca-Cola Company . . . . . . . . . . . . . . . . . . . . . . . . . . 0.0 0.0 0.1
93
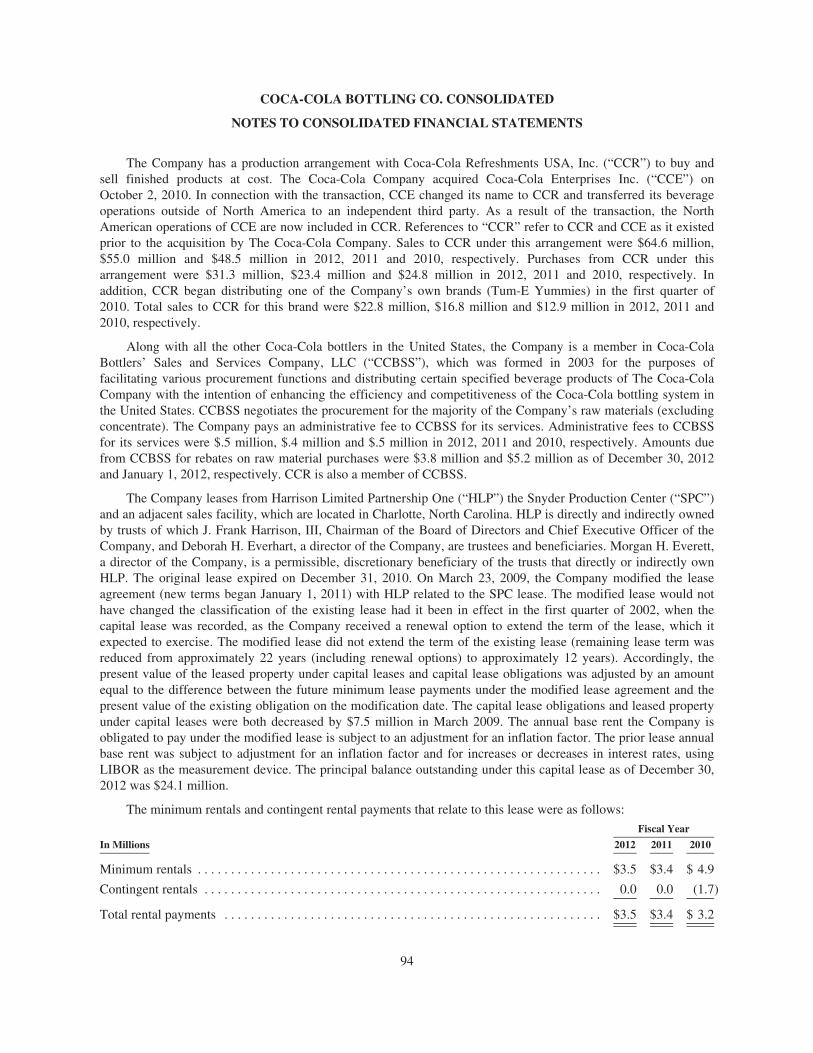
COCA-COLA BOTTLING CO. CONSOLIDATED
NOTES TO CONSOLIDATED FINANCIAL STATEMENTS
The Company has a production arrangement with Coca-Cola Refreshments USA, Inc. (“CCR”) to buy andsell finished products at cost. The Coca-Cola Company acquired Coca-Cola Enterprises Inc. (“CCE”) onOctober 2, 2010. In connection with the transaction, CCE changed its name to CCR and transferred its beverageoperations outside of North America to an independent third party. As a result of the transaction, the NorthAmerican operations of CCE are now included in CCR. References to “CCR” refer to CCR and CCE as it existedprior to the acquisition by The Coca-Cola Company. Sales to CCR under this arrangement were $64.6 million,$55.0 million and $48.5 million in 2012, 2011 and 2010, respectively. Purchases from CCR under thisarrangement were $31.3 million, $23.4 million and $24.8 million in 2012, 2011 and 2010, respectively. Inaddition, CCR began distributing one of the Company’s own brands (Tum-E Yummies) in the first quarter of2010. Total sales to CCR for this brand were $22.8 million, $16.8 million and $12.9 million in 2012, 2011 and2010, respectively.
Along with all the other Coca-Cola bottlers in the United States, the Company is a member in Coca-ColaBottlers’ Sales and Services Company, LLC (“CCBSS”), which was formed in 2003 for the purposes offacilitating various procurement functions and distributing certain specified beverage products of The Coca-ColaCompany with the intention of enhancing the efficiency and competitiveness of the Coca-Cola bottling system inthe United States. CCBSS negotiates the procurement for the majority of the Company’s raw materials (excludingconcentrate). The Company pays an administrative fee to CCBSS for its services. Administrative fees to CCBSSfor its services were $.5 million, $.4 million and $.5 million in 2012, 2011 and 2010, respectively. Amounts duefrom CCBSS for rebates on raw material purchases were $3.8 million and $5.2 million as of December 30, 2012and January 1, 2012, respectively. CCR is also a member of CCBSS.
The Company leases from Harrison Limited Partnership One (“HLP”) the Snyder Production Center (“SPC”)and an adjacent sales facility, which are located in Charlotte, North Carolina. HLP is directly and indirectly ownedby trusts of which J. Frank Harrison, III, Chairman of the Board of Directors and Chief Executive Officer of theCompany, and Deborah H. Everhart, a director of the Company, are trustees and beneficiaries. Morgan H. Everett,a director of the Company, is a permissible, discretionary beneficiary of the trusts that directly or indirectly ownHLP. The original lease expired on December 31, 2010. On March 23, 2009, the Company modified the leaseagreement (new terms began January 1, 2011) with HLP related to the SPC lease. The modified lease would nothave changed the classification of the existing lease had it been in effect in the first quarter of 2002, when thecapital lease was recorded, as the Company received a renewal option to extend the term of the lease, which itexpected to exercise. The modified lease did not extend the term of the existing lease (remaining lease term wasreduced from approximately 22 years (including renewal options) to approximately 12 years). Accordingly, thepresent value of the leased property under capital leases and capital lease obligations was adjusted by an amountequal to the difference between the future minimum lease payments under the modified lease agreement and thepresent value of the existing obligation on the modification date. The capital lease obligations and leased propertyunder capital leases were both decreased by $7.5 million in March 2009. The annual base rent the Company isobligated to pay under the modified lease is subject to an adjustment for an inflation factor. The prior lease annualbase rent was subject to adjustment for an inflation factor and for increases or decreases in interest rates, usingLIBOR as the measurement device. The principal balance outstanding under this capital lease as of December 30,2012 was $24.1 million.
The minimum rentals and contingent rental payments that relate to this lease were as follows:
Fiscal Year
In Millions 2012 2011 2010
Minimum rentals . . . . . . . . . . . . . . . . . . . . . . . . . . . . . . . . . . . . . . . . . . . . . . . . . . . . . . . . . . . . . $3.5 $3.4 $ 4.9
Contingent rentals . . . . . . . . . . . . . . . . . . . . . . . . . . . . . . . . . . . . . . . . . . . . . . . . . . . . . . . . . . . . 0.0 0.0 (1.7)
Total rental payments . . . . . . . . . . . . . . . . . . . . . . . . . . . . . . . . . . . . . . . . . . . . . . . . . . . . . . . . . $3.5 $3.4 $ 3.2
94
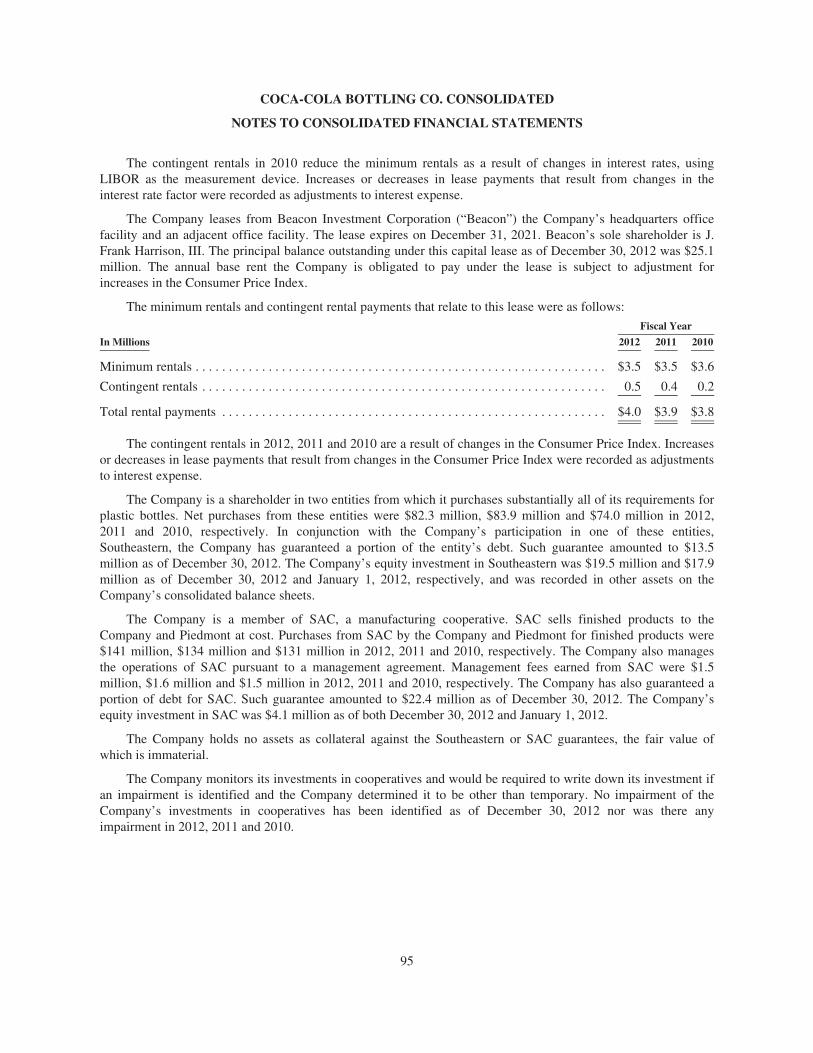
COCA-COLA BOTTLING CO. CONSOLIDATED
NOTES TO CONSOLIDATED FINANCIAL STATEMENTS
The contingent rentals in 2010 reduce the minimum rentals as a result of changes in interest rates, usingLIBOR as the measurement device. Increases or decreases in lease payments that result from changes in theinterest rate factor were recorded as adjustments to interest expense.
The Company leases from Beacon Investment Corporation (“Beacon”) the Company’s headquarters officefacility and an adjacent office facility. The lease expires on December 31, 2021. Beacon’s sole shareholder is J.Frank Harrison, III. The principal balance outstanding under this capital lease as of December 30, 2012 was $25.1million. The annual base rent the Company is obligated to pay under the lease is subject to adjustment forincreases in the Consumer Price Index.
The minimum rentals and contingent rental payments that relate to this lease were as follows:
Fiscal Year
In Millions 2012 2011 2010
Minimum rentals . . . . . . . . . . . . . . . . . . . . . . . . . . . . . . . . . . . . . . . . . . . . . . . . . . . . . . . . . . . . . . $3.5 $3.5 $3.6
Contingent rentals . . . . . . . . . . . . . . . . . . . . . . . . . . . . . . . . . . . . . . . . . . . . . . . . . . . . . . . . . . . . . 0.5 0.4 0.2
Total rental payments . . . . . . . . . . . . . . . . . . . . . . . . . . . . . . . . . . . . . . . . . . . . . . . . . . . . . . . . . . $4.0 $3.9 $3.8
The contingent rentals in 2012, 2011 and 2010 are a result of changes in the Consumer Price Index. Increasesor decreases in lease payments that result from changes in the Consumer Price Index were recorded as adjustmentsto interest expense.
The Company is a shareholder in two entities from which it purchases substantially all of its requirements forplastic bottles. Net purchases from these entities were $82.3 million, $83.9 million and $74.0 million in 2012,2011 and 2010, respectively. In conjunction with the Company’s participation in one of these entities,Southeastern, the Company has guaranteed a portion of the entity’s debt. Such guarantee amounted to $13.5million as of December 30, 2012. The Company’s equity investment in Southeastern was $19.5 million and $17.9million as of December 30, 2012 and January 1, 2012, respectively, and was recorded in other assets on theCompany’s consolidated balance sheets.
The Company is a member of SAC, a manufacturing cooperative. SAC sells finished products to theCompany and Piedmont at cost. Purchases from SAC by the Company and Piedmont for finished products were$141 million, $134 million and $131 million in 2012, 2011 and 2010, respectively. The Company also managesthe operations of SAC pursuant to a management agreement. Management fees earned from SAC were $1.5million, $1.6 million and $1.5 million in 2012, 2011 and 2010, respectively. The Company has also guaranteed aportion of debt for SAC. Such guarantee amounted to $22.4 million as of December 30, 2012. The Company’sequity investment in SAC was $4.1 million as of both December 30, 2012 and January 1, 2012.
The Company holds no assets as collateral against the Southeastern or SAC guarantees, the fair value ofwhich is immaterial.
The Company monitors its investments in cooperatives and would be required to write down its investment ifan impairment is identified and the Company determined it to be other than temporary. No impairment of theCompany’s investments in cooperatives has been identified as of December 30, 2012 nor was there anyimpairment in 2012, 2011 and 2010.
95
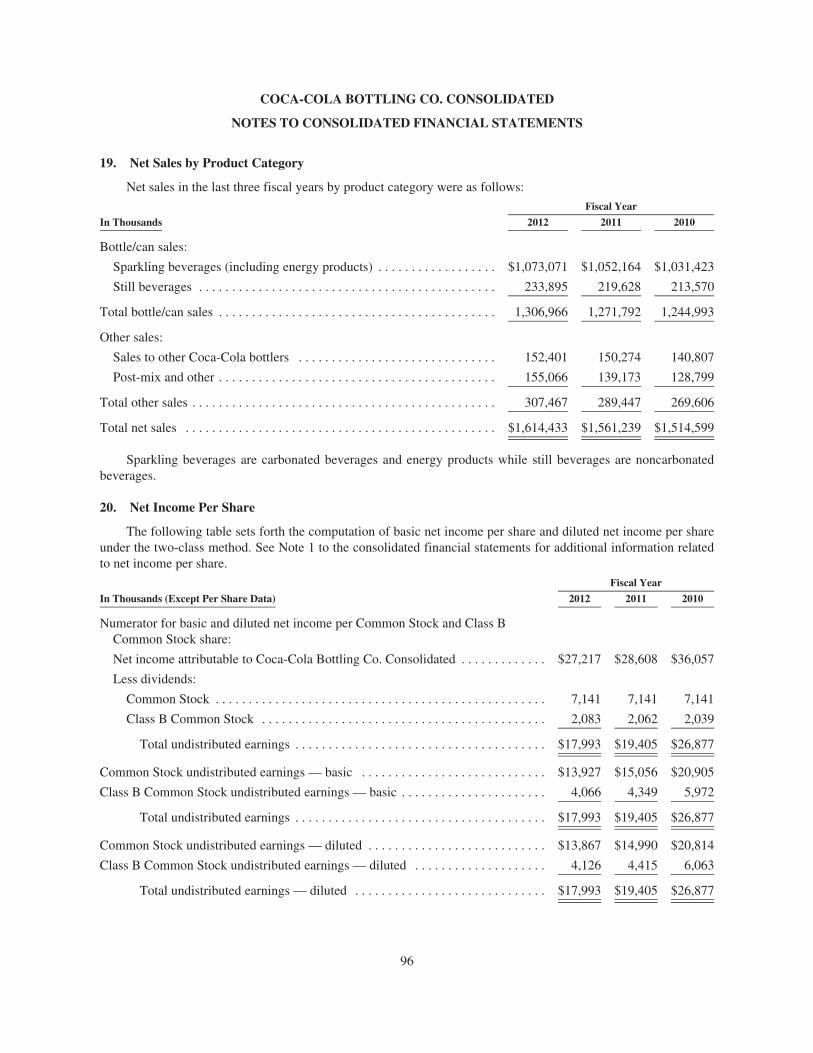
COCA-COLA BOTTLING CO. CONSOLIDATED
NOTES TO CONSOLIDATED FINANCIAL STATEMENTS
19. Net Sales by Product Category
Net sales in the last three fiscal years by product category were as follows:
Fiscal Year
In Thousands 2012 2011 2010
Bottle/can sales:
Sparkling beverages (including energy products) . . . . . . . . . . . . . . . . . . $1,073,071 $1,052,164 $1,031,423
Still beverages . . . . . . . . . . . . . . . . . . . . . . . . . . . . . . . . . . . . . . . . . . . . . 233,895 219,628 213,570
Total bottle/can sales . . . . . . . . . . . . . . . . . . . . . . . . . . . . . . . . . . . . . . . . . . 1,306,966 1,271,792 1,244,993
Other sales:
Sales to other Coca-Cola bottlers . . . . . . . . . . . . . . . . . . . . . . . . . . . . . . 152,401 150,274 140,807
Post-mix and other . . . . . . . . . . . . . . . . . . . . . . . . . . . . . . . . . . . . . . . . . . 155,066 139,173 128,799
Total other sales . . . . . . . . . . . . . . . . . . . . . . . . . . . . . . . . . . . . . . . . . . . . . . 307,467 289,447 269,606
Total net sales . . . . . . . . . . . . . . . . . . . . . . . . . . . . . . . . . . . . . . . . . . . . . . . $1,614,433 $1,561,239 $1,514,599
Sparkling beverages are carbonated beverages and energy products while still beverages are noncarbonatedbeverages.
20. Net Income Per Share
The following table sets forth the computation of basic net income per share and diluted net income per shareunder the two-class method. See Note 1 to the consolidated financial statements for additional information relatedto net income per share.
Fiscal Year
In Thousands (Except Per Share Data) 2012 2011 2010
Numerator for basic and diluted net income per Common Stock and Class BCommon Stock share:
Net income attributable to Coca-Cola Bottling Co. Consolidated . . . . . . . . . . . . . $27,217 $28,608 $36,057
Less dividends:
Common Stock . . . . . . . . . . . . . . . . . . . . . . . . . . . . . . . . . . . . . . . . . . . . . . . . . . 7,141 7,141 7,141
Class B Common Stock . . . . . . . . . . . . . . . . . . . . . . . . . . . . . . . . . . . . . . . . . . . 2,083 2,062 2,039
Total undistributed earnings . . . . . . . . . . . . . . . . . . . . . . . . . . . . . . . . . . . . . . $17,993 $19,405 $26,877
Common Stock undistributed earnings — basic . . . . . . . . . . . . . . . . . . . . . . . . . . . . $13,927 $15,056 $20,905
Class B Common Stock undistributed earnings — basic . . . . . . . . . . . . . . . . . . . . . . 4,066 4,349 5,972
Total undistributed earnings . . . . . . . . . . . . . . . . . . . . . . . . . . . . . . . . . . . . . . $17,993 $19,405 $26,877
Common Stock undistributed earnings — diluted . . . . . . . . . . . . . . . . . . . . . . . . . . . $13,867 $14,990 $20,814
Class B Common Stock undistributed earnings — diluted . . . . . . . . . . . . . . . . . . . . 4,126 4,415 6,063
Total undistributed earnings — diluted . . . . . . . . . . . . . . . . . . . . . . . . . . . . . $17,993 $19,405 $26,877
96
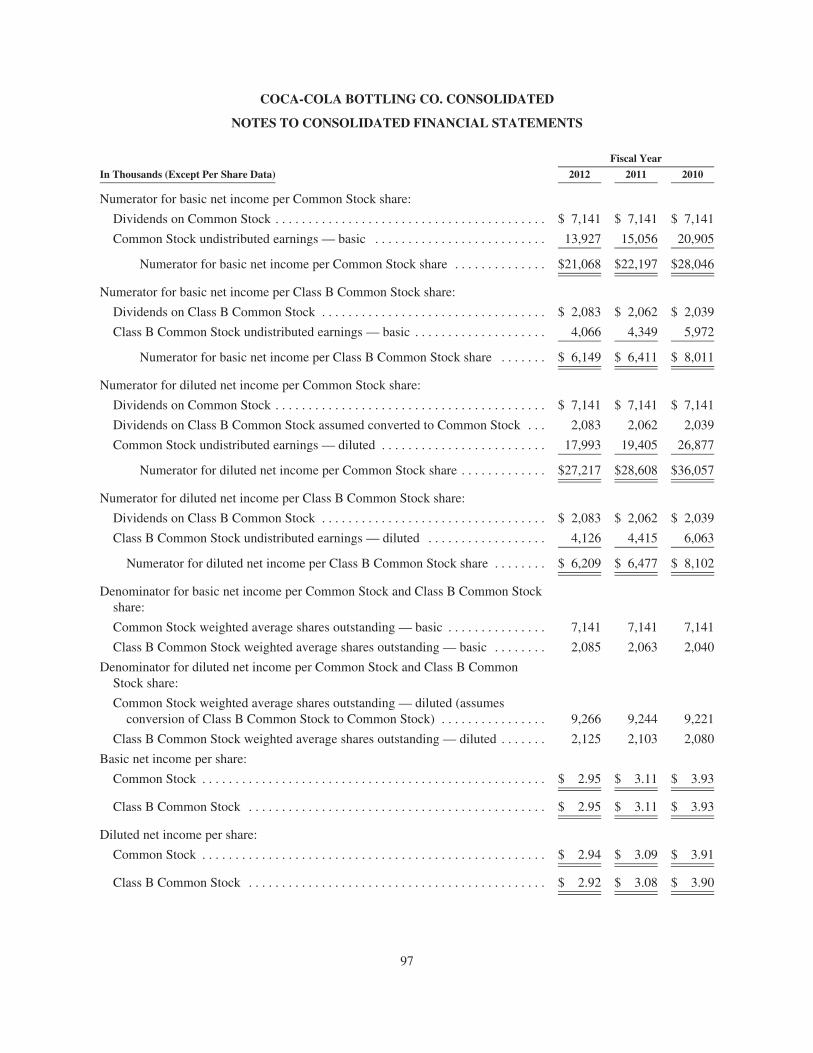
COCA-COLA BOTTLING CO. CONSOLIDATED
NOTES TO CONSOLIDATED FINANCIAL STATEMENTS
Fiscal Year
In Thousands (Except Per Share Data) 2012 2011 2010
Numerator for basic net income per Common Stock share:
Dividends on Common Stock . . . . . . . . . . . . . . . . . . . . . . . . . . . . . . . . . . . . . . . . . $ 7,141 $ 7,141 $ 7,141
Common Stock undistributed earnings — basic . . . . . . . . . . . . . . . . . . . . . . . . . . 13,927 15,056 20,905
Numerator for basic net income per Common Stock share . . . . . . . . . . . . . . $21,068 $22,197 $28,046
Numerator for basic net income per Class B Common Stock share:
Dividends on Class B Common Stock . . . . . . . . . . . . . . . . . . . . . . . . . . . . . . . . . . $ 2,083 $ 2,062 $ 2,039
Class B Common Stock undistributed earnings — basic . . . . . . . . . . . . . . . . . . . . 4,066 4,349 5,972
Numerator for basic net income per Class B Common Stock share . . . . . . . $ 6,149 $ 6,411 $ 8,011
Numerator for diluted net income per Common Stock share:
Dividends on Common Stock . . . . . . . . . . . . . . . . . . . . . . . . . . . . . . . . . . . . . . . . . $ 7,141 $ 7,141 $ 7,141
Dividends on Class B Common Stock assumed converted to Common Stock . . . 2,083 2,062 2,039
Common Stock undistributed earnings — diluted . . . . . . . . . . . . . . . . . . . . . . . . . 17,993 19,405 26,877
Numerator for diluted net income per Common Stock share . . . . . . . . . . . . . $27,217 $28,608 $36,057
Numerator for diluted net income per Class B Common Stock share:
Dividends on Class B Common Stock . . . . . . . . . . . . . . . . . . . . . . . . . . . . . . . . . . $ 2,083 $ 2,062 $ 2,039
Class B Common Stock undistributed earnings — diluted . . . . . . . . . . . . . . . . . . 4,126 4,415 6,063
Numerator for diluted net income per Class B Common Stock share . . . . . . . . $ 6,209 $ 6,477 $ 8,102
Denominator for basic net income per Common Stock and Class B Common Stockshare:
Common Stock weighted average shares outstanding — basic . . . . . . . . . . . . . . . 7,141 7,141 7,141
Class B Common Stock weighted average shares outstanding — basic . . . . . . . . 2,085 2,063 2,040
Denominator for diluted net income per Common Stock and Class B CommonStock share:
Common Stock weighted average shares outstanding — diluted (assumesconversion of Class B Common Stock to Common Stock) . . . . . . . . . . . . . . . . 9,266 9,244 9,221
Class B Common Stock weighted average shares outstanding — diluted . . . . . . . 2,125 2,103 2,080
Basic net income per share:
Common Stock . . . . . . . . . . . . . . . . . . . . . . . . . . . . . . . . . . . . . . . . . . . . . . . . . . . . $ 2.95 $ 3.11 $ 3.93
Class B Common Stock . . . . . . . . . . . . . . . . . . . . . . . . . . . . . . . . . . . . . . . . . . . . . $ 2.95 $ 3.11 $ 3.93
Diluted net income per share:
Common Stock . . . . . . . . . . . . . . . . . . . . . . . . . . . . . . . . . . . . . . . . . . . . . . . . . . . . $ 2.94 $ 3.09 $ 3.91
Class B Common Stock . . . . . . . . . . . . . . . . . . . . . . . . . . . . . . . . . . . . . . . . . . . . . $ 2.92 $ 3.08 $ 3.90
97
COCA-COLA BOTTLING CO. CONSOLIDATED
NOTES TO CONSOLIDATED FINANCIAL STATEMENTS
NOTES TO TABLE
(1) For purposes of the diluted net income per share computation for Common Stock, shares of Class B CommonStock are assumed to be converted; therefore, 100% of undistributed earnings is allocated to Common Stock.
(2) For purposes of the diluted net income per share computation for Class B Common Stock, weighted averageshares of Class B Common Stock are assumed to be outstanding for the entire period and not converted.
(3) Denominator for diluted net income per share for Common Stock and Class B Common Stock includes thediluted effect of shares relative to the Performance Unit Award.
21. Risks and Uncertainties
Approximately 88% of the Company’s 2012 bottle/can volume to retail customers are products of The Coca-Cola Company, which is the sole supplier of these products or of the concentrates or syrups required tomanufacture these products. The remaining 12% of the Company’s 2012 bottle/can volume to retail customers areproducts of other beverage companies or those owned by the Company. The Company has beverage agreementsunder which it has various requirements to meet. Failure to meet the requirements of these beverage agreementscould result in the loss of distribution rights for the respective product.
The Company’s products are sold and distributed directly by its employees to retail stores and other outlets.During 2012, approximately 68% of the Company’s bottle/can volume to retail customers was sold for futureconsumption, while the remaining bottle/can volume to retail customers of approximately 32% was sold forimmediate consumption. The Company’s largest customers, Wal-Mart Stores, Inc. and Food Lion, LLC, accountedfor accounted approximately 22% and 8%, respectively, of the Company’s total bottle/can volume during 2012;approximately 21% and 9%, respectively, of the Company’s total bottle/can volume to retail customers during2011; and approximately 24% and 10%, respectively, of the Company’s total bottle/can volume to retail customersduring 2010. Wal-Mart Stores, Inc. accounted for approximately 15%, 15% and 17% of the Company’s total netsales during 2012, 2011 and 2010, respectively. No other customer represented greater than 10% of the Company’stotal net sales for any years presented.
The Company obtains all of its aluminum cans from two domestic suppliers. The Company currently obtainsall of its plastic bottles from two domestic entities. See Note 13 and Note 18 of the consolidated financialstatements for additional information.
The Company is exposed to price risk on such commodities as aluminum, corn and resin which affects thecost of raw materials used in the production of finished products. The Company both produces and procures thesefinished products. Examples of the raw materials affected are aluminum cans and plastic bottles used forpackaging and high fructose corn syrup used as a product ingredient. Further, the Company is exposed tocommodity price risk on crude oil which impacts the Company’s cost of fuel used in the movement and delivery ofthe Company’s products. The Company participates in commodity hedging and risk mitigation programsadministered both by CCBSS and by the Company. In addition, there is no limit on the price The Coca-ColaCompany and other beverage companies can charge for concentrate.
Certain liabilities of the Company are subject to risk of changes in both long-term and short-term interestrates. These liabilities include floating rate debt, retirement benefit obligations and the Company’s pensionliability.
Approximately 7% of the Company’s labor force is covered by collective bargaining agreements. Onecollective bargaining agreement covering approximately .4% of the Company’s employees expired during 2012and the Company entered into a new agreement in 2012. Two collective bargaining agreements coveringapproximately .7% of the Company’s employees will expire during 2013.
98
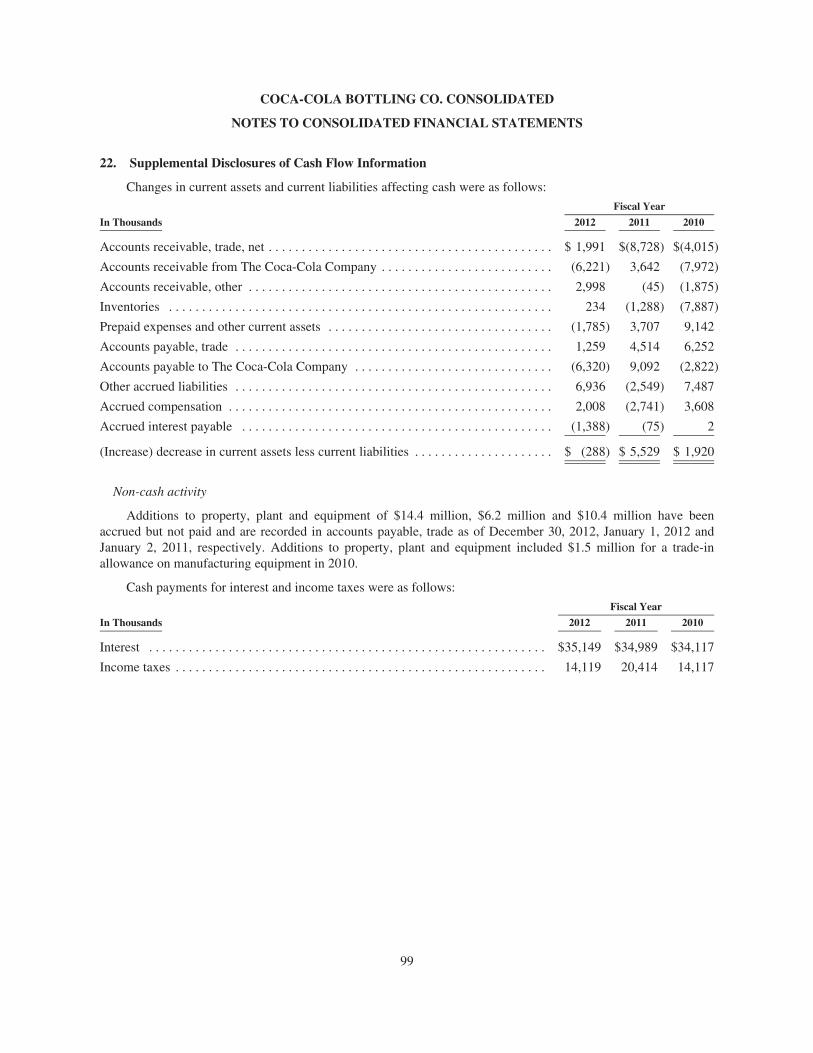
COCA-COLA BOTTLING CO. CONSOLIDATED
NOTES TO CONSOLIDATED FINANCIAL STATEMENTS
22. Supplemental Disclosures of Cash Flow Information
Changes in current assets and current liabilities affecting cash were as follows:
Fiscal Year
In Thousands 2012 2011 2010
Accounts receivable, trade, net . . . . . . . . . . . . . . . . . . . . . . . . . . . . . . . . . . . . . . . . . . . $ 1,991 $(8,728) $(4,015)
Accounts receivable from The Coca-Cola Company . . . . . . . . . . . . . . . . . . . . . . . . . . (6,221) 3,642 (7,972)
Accounts receivable, other . . . . . . . . . . . . . . . . . . . . . . . . . . . . . . . . . . . . . . . . . . . . . . 2,998 (45) (1,875)
Inventories . . . . . . . . . . . . . . . . . . . . . . . . . . . . . . . . . . . . . . . . . . . . . . . . . . . . . . . . . . 234 (1,288) (7,887)
Prepaid expenses and other current assets . . . . . . . . . . . . . . . . . . . . . . . . . . . . . . . . . . (1,785) 3,707 9,142
Accounts payable, trade . . . . . . . . . . . . . . . . . . . . . . . . . . . . . . . . . . . . . . . . . . . . . . . . 1,259 4,514 6,252
Accounts payable to The Coca-Cola Company . . . . . . . . . . . . . . . . . . . . . . . . . . . . . . (6,320) 9,092 (2,822)
Other accrued liabilities . . . . . . . . . . . . . . . . . . . . . . . . . . . . . . . . . . . . . . . . . . . . . . . . 6,936 (2,549) 7,487
Accrued compensation . . . . . . . . . . . . . . . . . . . . . . . . . . . . . . . . . . . . . . . . . . . . . . . . . 2,008 (2,741) 3,608
Accrued interest payable . . . . . . . . . . . . . . . . . . . . . . . . . . . . . . . . . . . . . . . . . . . . . . . (1,388) (75) 2
(Increase) decrease in current assets less current liabilities . . . . . . . . . . . . . . . . . . . . . $ (288) $ 5,529 $ 1,920
Non-cash activity
Additions to property, plant and equipment of $14.4 million, $6.2 million and $10.4 million have beenaccrued but not paid and are recorded in accounts payable, trade as of December 30, 2012, January 1, 2012 andJanuary 2, 2011, respectively. Additions to property, plant and equipment included $1.5 million for a trade-inallowance on manufacturing equipment in 2010.
Cash payments for interest and income taxes were as follows:
Fiscal Year
In Thousands 2012 2011 2010
Interest . . . . . . . . . . . . . . . . . . . . . . . . . . . . . . . . . . . . . . . . . . . . . . . . . . . . . . . . . . . . $35,149 $34,989 $34,117
Income taxes . . . . . . . . . . . . . . . . . . . . . . . . . . . . . . . . . . . . . . . . . . . . . . . . . . . . . . . . 14,119 20,414 14,117
99
COCA-COLA BOTTLING CO. CONSOLIDATED
NOTES TO CONSOLIDATED FINANCIAL STATEMENTS
23. New Accounting Pronouncements
Recently Adopted Pronouncements
In June 2011, the Financial Accounting Standards Board (“FASB”) amended its guidance on the presentationof comprehensive income in financial statements to improve the comparability, consistency and transparency offinancial reporting and to increase the prominence of items that are recorded in other comprehensive income. Thenew guidance requires entities to report components of comprehensive income in either (1) a continuous statementof comprehensive income or (2) two separate but consecutive statements. The Company elected to reportcomponents of comprehensive income in two separate but consecutive statements. The new guidance was effectivefor the quarter ended April 1, 2012 and was applied retrospectively. The Company’s adoption of the new guidanceresulted in a change in the presentation of the Company’s consolidated financial statements but did not have anyimpact on the Company’s results of operations, financial position or liquidity.
In September 2011, the FASB issued new guidance relative to the test for goodwill impairment. The newguidance permits an entity to first assess qualitative factors to determine whether it is more likely than not that thefair value of a reporting unit is less than its carrying amount as a basis for determining whether it is necessary toperform the two-step goodwill impairment test. The new guidance is effective for annual and interim goodwillimpairment tests performed for fiscal years beginning after December 15, 2011. The new guidance did not have amaterial impact on the Company’s consolidated financial statements.
In July 2012, the FASB issued new guidance relative to the test for indefinite-lived intangibles impairment.The new guidance permits an entity to first assess qualitative factors to determine whether it is more likely thannot that an indefinite-lived intangible asset is impaired as a basis for determining whether it is necessary toperform the quantitative impairment test. The new guidance is effective for annual and interim indefinite-livedintangibles impairment tests performed for fiscal years beginning after September 15, 2012, with early adoptionpermitted. The new guidance did not have a material impact on the Company’s consolidated financial statements.
Recently Issued Pronouncements
In December 2011, the FASB issued new guidance that is intended to enhance current disclosures onoffsetting financial assets and liabilities. The new guidance requires an entity to disclose both gross and netinformation about financial instruments eligible for offset on the balance sheet and instruments and transactionssubject to an agreement similar to a master netting arrangement. The provisions of the new guidance are effectivefor fiscal years, and interim periods within those years, beginning on or after January 1, 2013. The Company doesnot expect the requirements of this new guidance to have a material impact on the Company’s consolidatedfinancial statements.
In February 2013, the FASB issued new guidance which establishes new requirements for disclosingreclassifications of items out of accumulated other comprehensive income. The new guidance requires a companyto report the effect of significant reclassifications from accumulated other comprehensive income to the respectiveline items in net income or cross-reference to other disclosures for items not reclassified entirely to net income.The new guidance is effective for annual and interim periods beginning after December 15, 2012. The newguidance expands disclosure of other comprehensive income but does not change the manner in which items ofother comprehensive income are accounted for or the way in which net income or other comprehensive income isreported in the financial statements.
100
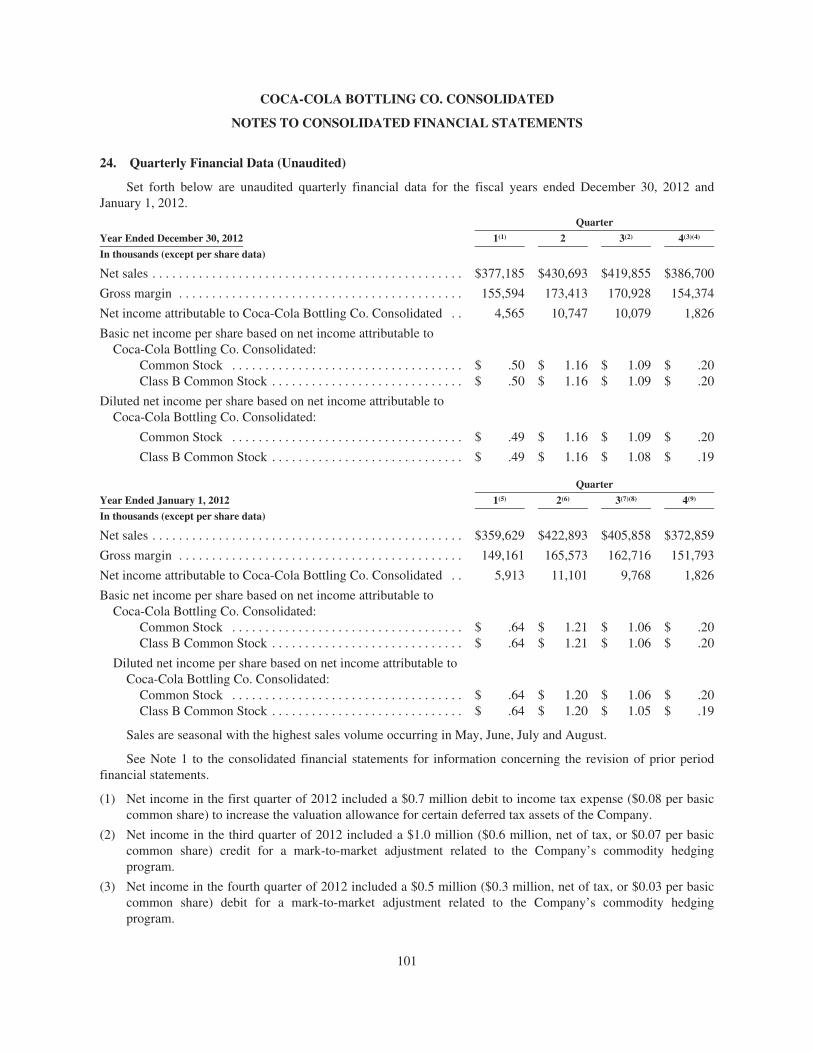
COCA-COLA BOTTLING CO. CONSOLIDATED
NOTES TO CONSOLIDATED FINANCIAL STATEMENTS
24. Quarterly Financial Data (Unaudited)
Set forth below are unaudited quarterly financial data for the fiscal years ended December 30, 2012 andJanuary 1, 2012.
Quarter
Year Ended December 30, 2012 1(1) 2 3(2) 4(3)(4)
In thousands (except per share data)
Net sales . . . . . . . . . . . . . . . . . . . . . . . . . . . . . . . . . . . . . . . . . . . . . . . $377,185 $430,693 $419,855 $386,700
Gross margin . . . . . . . . . . . . . . . . . . . . . . . . . . . . . . . . . . . . . . . . . . . 155,594 173,413 170,928 154,374
Net income attributable to Coca-Cola Bottling Co. Consolidated . . 4,565 10,747 10,079 1,826
Basic net income per share based on net income attributable toCoca-Cola Bottling Co. Consolidated:
Common Stock . . . . . . . . . . . . . . . . . . . . . . . . . . . . . . . . . . . $ .50 $ 1.16 $ 1.09 $ .20Class B Common Stock . . . . . . . . . . . . . . . . . . . . . . . . . . . . . $ .50 $ 1.16 $ 1.09 $ .20
Diluted net income per share based on net income attributable toCoca-Cola Bottling Co. Consolidated:
Common Stock . . . . . . . . . . . . . . . . . . . . . . . . . . . . . . . . . . . $ .49 $ 1.16 $ 1.09 $ .20
Class B Common Stock . . . . . . . . . . . . . . . . . . . . . . . . . . . . . $ .49 $ 1.16 $ 1.08 $ .19
Quarter
Year Ended January 1, 2012 1(5) 2(6) 3(7)(8) 4(9)
In thousands (except per share data)
Net sales . . . . . . . . . . . . . . . . . . . . . . . . . . . . . . . . . . . . . . . . . . . . . . . $359,629 $422,893 $405,858 $372,859
Gross margin . . . . . . . . . . . . . . . . . . . . . . . . . . . . . . . . . . . . . . . . . . . 149,161 165,573 162,716 151,793
Net income attributable to Coca-Cola Bottling Co. Consolidated . . 5,913 11,101 9,768 1,826
Basic net income per share based on net income attributable toCoca-Cola Bottling Co. Consolidated:
Common Stock . . . . . . . . . . . . . . . . . . . . . . . . . . . . . . . . . . . $ .64 $ 1.21 $ 1.06 $ .20Class B Common Stock . . . . . . . . . . . . . . . . . . . . . . . . . . . . . $ .64 $ 1.21 $ 1.06 $ .20
Diluted net income per share based on net income attributable toCoca-Cola Bottling Co. Consolidated:
Common Stock . . . . . . . . . . . . . . . . . . . . . . . . . . . . . . . . . . . $ .64 $ 1.20 $ 1.06 $ .20Class B Common Stock . . . . . . . . . . . . . . . . . . . . . . . . . . . . . $ .64 $ 1.20 $ 1.05 $ .19
Sales are seasonal with the highest sales volume occurring in May, June, July and August.
See Note 1 to the consolidated financial statements for information concerning the revision of prior periodfinancial statements.
(1) Net income in the first quarter of 2012 included a $0.7 million debit to income tax expense ($0.08 per basiccommon share) to increase the valuation allowance for certain deferred tax assets of the Company.
(2) Net income in the third quarter of 2012 included a $1.0 million ($0.6 million, net of tax, or $0.07 per basiccommon share) credit for a mark-to-market adjustment related to the Company’s commodity hedgingprogram.
(3) Net income in the fourth quarter of 2012 included a $0.5 million ($0.3 million, net of tax, or $0.03 per basiccommon share) debit for a mark-to-market adjustment related to the Company’s commodity hedgingprogram.
101
COCA-COLA BOTTLING CO. CONSOLIDATED
NOTES TO CONSOLIDATED FINANCIAL STATEMENTS
(4) Net income in the fourth quarter of 2012 included a $0.6 million debit to income tax expense ($0.07 per basiccommon share) to increase the valuation allowance for certain deferred tax assets of the Company.
(5) Net income in the first quarter of 2011 included a $0.5 million ($0.3 million, net of tax, or $0.03 per basiccommon share) debit for a mark-to-market adjustment related to the Company’s commodity hedgingprogram.
(6) Net income in the second quarter of 2011 included a $1.7 million ($1.0 million, net of tax, or $0.11 per basiccommon share) debit for a mark-to-market adjustment related to the Company’s commodity hedgingprogram.
(7) Net income for the third quarter of 2011 included a $1.8 million ($1.2 million, net of tax, or $0.12 per basiccommon share) debit for a mark-to-market adjustment related to the Company’s commodity hedgingprogram.
(8) Net income in the third quarter of 2011 included a $0.9 million credit to income tax expense ($0.10 per basiccommon share) related to the reduction of the liability for uncertain tax positions due mainly to the expirationof applicable statute of limitations.
(9) Net income in the fourth quarter of 2011 included a $2.6 million ($1.6 million, net of tax, or $0.17 per basiccommon share) debit for a mark-to-market adjustment related to the Company’s commodity hedgingprogram.
102
Management’s Report on Internal Control over Financial Reporting
Management of Coca-Cola Bottling Co. Consolidated (the “Company”) is responsible for establishing andmaintaining adequate internal control over financial reporting as defined in Rules 13a-15(f) and 15d-15(f) underthe Exchange Act. The Company’s internal control over financial reporting is a process designed under thesupervision of the Company’s chief executive and chief financial officers to provide reasonable assuranceregarding the reliability of financial reporting and the preparation of the Company’s consolidated financialstatements for external purposes in accordance with the U.S. generally accepted accounting principles. TheCompany’s internal control over financial reporting includes policies and procedures that:
(i) pertain to the maintenance of records that, in reasonable detail, accurately and fairly reflecttransactions and dispositions of assets of the Company;
(ii) provide reasonable assurance that transactions are recorded as necessary to permit preparation offinancial statements in accordance with U.S. generally accepted accounting principles, and that receipts andexpenditures are being made only in accordance with authorizations of management and the directors of theCompany; and
(iii) provide reasonable assurance regarding prevention or timely detection of unauthorized acquisition,use or disposition of the Company’s assets that could have a material effect on the Company’s financialstatements.
Because of its inherent limitations, internal control over financial reporting may not prevent or detect allmisstatements. Also, projections of any evaluation of effectiveness to future periods are subject to the risk thatcontrols may become inadequate due to changes in conditions, or that the degree of compliance with the policiesor procedures may deteriorate.
As of December 30, 2012, management assessed the effectiveness of the Company’s internal control overfinancial reporting based on the framework established in Internal Control – Integrated Framework issued by theCommittee of Sponsoring Organizations of the Treadway Commission (COSO). Based on this assessment,management determined that the Company’s internal control over financial reporting as of December 30, 2012 waseffective.
The effectiveness of the Company’s internal control over financial reporting as of December 30, 2012, hasbeen audited by PricewaterhouseCoopers LLP, an independent registered public accounting firm, as stated in theirreport appearing on page 104.
March 14, 2013
103
Report of Independent Registered Public Accounting Firm
To the Board of Directors and Stockholders of Coca-Cola Bottling Co. Consolidated:
In our opinion, the consolidated financial statements listed in the index appearing under Item 15(a)(1) presentfairly, in all material respects, the financial position of Coca-Cola Bottling Co. Consolidated and its subsidiaries atDecember 30, 2012 and January 1, 2012, and the results of their operations and their cash flows for each of thethree years in the period ended December 30, 2012 in conformity with accounting principles generally accepted inthe United States of America. In addition, in our opinion, the financial statement schedule listed in the indexappearing under Item 15(a)(2) presents fairly, in all material respects, the information set forth therein when readin conjunction with the related consolidated financial statements. Also in our opinion, the Company maintained, inall material respects, effective internal control over financial reporting as of December 30, 2012, based on criteriaestablished in Internal Control—Integrated Framework issued by the Committee of Sponsoring Organizations ofthe Treadway Commission (COSO). The Company’s management is responsible for these financial statements andthe financial statement schedule, for maintaining effective internal control over financial reporting and for itsassessment of the effectiveness of internal control over financial reporting, included in the accompanyingManagement’s Report on Internal Control over Financial Reporting. Our responsibility is to express opinions onthese financial statements, on the financial statement schedule, and on the Company’s internal control overfinancial reporting based on our integrated audits. We conducted our audits in accordance with the standards of thePublic Company Accounting Oversight Board (United States). Those standards require that we plan and performthe audits to obtain reasonable assurance about whether the financial statements are free of material misstatementand whether effective internal control over financial reporting was maintained in all material respects. Our auditsof the financial statements included examining, on a test basis, evidence supporting the amounts and disclosures inthe financial statements, assessing the accounting principles used and significant estimates made by management,and evaluating the overall financial statement presentation. Our audit of internal control over financial reportingincluded obtaining an understanding of internal control over financial reporting, assessing the risk that a materialweakness exists, and testing and evaluating the design and operating effectiveness of internal control based on theassessed risk. Our audits also included performing such other procedures as we considered necessary in thecircumstances. We believe that our audits provide a reasonable basis for our opinions.
A company’s internal control over financial reporting is a process designed to provide reasonable assuranceregarding the reliability of financial reporting and the preparation of financial statements for external purposes inaccordance with generally accepted accounting principles. A company’s internal control over financial reportingincludes those policies and procedures that (i) pertain to the maintenance of records that, in reasonable detail,accurately and fairly reflect the transactions and dispositions of the assets of the company; (ii) provide reasonableassurance that transactions are recorded as necessary to permit preparation of financial statements in accordancewith generally accepted accounting principles, and that receipts and expenditures of the company are being madeonly in accordance with authorizations of management and directors of the company; and (iii) provide reasonableassurance regarding prevention or timely detection of unauthorized acquisition, use, or disposition of thecompany’s assets that could have a material effect on the financial statements.
Because of its inherent limitations, internal control over financial reporting may not prevent or detectmisstatements. Also, projections of any evaluation of effectiveness to future periods are subject to the risk thatcontrols may become inadequate because of changes in conditions, or that the degree of compliance with thepolicies or procedures may deteriorate.
Charlotte, North CarolinaMarch 14, 2013
104
The financial statement schedule required by Regulation S-X is set forth in response to Item 15 below.
The supplementary data required by Item 302 of Regulation S-K is set forth in Note 24 to the consolidatedfinancial statements.
Item 9. Changes in and Disagreements with Accountants on Accounting and Financial Disclosure
Not applicable.
Item 9A. Controls and Procedures
As of the end of the period covered by this report, the Company carried out an evaluation, under thesupervision and with the participation of the Company’s management, including the Company’s Chief ExecutiveOfficer and Chief Financial Officer, of the effectiveness of the design and operation of the Company’s “disclosurecontrols and procedures” (as defined in Rule 13a-15(e) of the Securities Exchange Act of 1934 (the “ExchangeAct”)) pursuant to Rule 13a-15(b) of the Exchange Act. Based upon that evaluation, the Chief Executive Officerand Chief Financial Officer concluded that the Company’s disclosure controls and procedures were effective as ofDecember 30, 2012.
See page 103 for “Management’s Report on Internal Control over Financial Reporting.” See page 104 for the“Report of Independent Registered Public Accounting Firm.”
There has been no change in the Company’s internal control over financial reporting during the quarter endedDecember 30, 2012 that has materially affected, or is reasonably likely to materially affect, the Company’s internalcontrol over financial reporting.
Item 9B. Other Information
Not applicable.
105
PART III
Item 10. Directors, Executive Officers and Corporate Governance
For information with respect to the executive officers of the Company, see “Executive Officers of theCompany” included as a separate item at the end of Part I of this Report. For information with respect to theDirectors of the Company, see the “Proposal 1: Election of Directors” section of the Proxy Statement for the 2013Annual Meeting of Stockholders, which is incorporated herein by reference. For information with respect toSection 16 reports, see the “Additional Information About Directors and Executive Officers — Section 16(a)Beneficial Ownership Reporting Compliance” section of the Proxy Statement for the 2013 Annual Meeting ofStockholders, which is incorporated herein by reference. For information with respect to the Audit Committee ofthe Board of Directors, see the “Corporate Governance — Board Committees” section of the Proxy Statement forthe 2013 Annual Meeting of Stockholders, which is incorporated herein by reference.
The Company has adopted a Code of Ethics for Senior Financial Officers, which is intended to qualify as a“code of ethics” within the meaning of Item 406 of Regulation S-K of the Exchange Act (the “Code of Ethics”).The Code of Ethics applies to the Company’s Chief Executive Officer; Chief Operating Officer; Chief FinancialOfficer; Chief Accounting Officer; Vice President and Treasurer and any other person performing similarfunctions. The Code of Ethics is available on the Company’s website at www.cokeconsolidated.com. TheCompany intends to disclose any substantive amendments to, or waivers from, its Code of Ethics on its website orin a report on Form 8-K.
Item 11. Executive Compensation
For information with respect to executive and director compensation, see the “Executive CompensationTables,” “Additional Information About Directors and Executive Officers — Compensation Committee Interlocksand Insider Participation,” “Compensation Committee Report,” “Director Compensation” and “CorporateGovernance — The Board’s Role in Risk Oversight” sections of the Proxy Statement for the 2013 Annual Meetingof Stockholders, which are incorporated herein by reference.
Item 12. Security Ownership of Certain Beneficial Owners and Management and Related Stockholder Matters
For information with respect to security ownership of certain beneficial owners and management, see the“Principal Stockholders” and “Security Ownership of Directors and Executive Officers” sections of the ProxyStatement for the 2013 Annual Meeting of Stockholders, which are incorporated herein by reference. Forinformation with respect to securities authorized for issuance under equity compensation plans, see the “EquityCompensation Plan Information” section of the Proxy Statement for the 2013 Annual Meeting of Stockholders,which is incorporated herein by reference.
Item 13. Certain Relationships and Related Transactions, and Director Independence
For information with respect to certain relationships and related transactions, see the “Related PersonTransactions” section of the Proxy Statement for the 2013 Annual Meeting of Stockholders, which is incorporatedherein by reference. For certain information with respect to director independence, see the disclosures in the“Corporate Governance” section of the Proxy Statement for the 2013 Annual Meeting of Stockholders regardingdirector independence, which are incorporated herein by reference.
Item 14. Principal Accountant Fees and Services
For information with respect to principal accountant fees and services, see “Proposal 2: Ratification of theAppointment of Independent Registered Public Accounting Firm” of the Proxy Statement for the 2013 AnnualMeeting of Stockholders, which is incorporated herein by reference.
106
PART IV
Item 15. Exhibits and Financial Statement Schedules
(a) List of documents filed as part of this report.
1. Financial Statements
Consolidated Statements of OperationsConsolidated Statements of Comprehensive IncomeConsolidated Balance SheetsConsolidated Statements of Cash FlowsConsolidated Statements of Changes in Stockholders’ EquityNotes to Consolidated Financial StatementsManagement’s Report on Internal Control over Financial ReportingReport of Independent Registered Public Accounting Firm
2. Financial Statement Schedule
Schedule II — Valuation and Qualifying Accounts and Reserves
All other financial statements and schedules not listed have been omitted because the requiredinformation is included in the consolidated financial statements or the notes thereto, or is not applicableor required.
3. Listing of Exhibits
The agreements included in the following exhibits to this report are included to provide information regardingtheir terms and are not intended to provide any other factual or disclosure information about the Company or theother parties to the agreements. Some of the agreements contain representations and warranties by each of theparties to the applicable agreements. These representations and warranties have been made solely for the benefit ofthe other parties to the applicable agreements and:
• should not in all instances be treated as categorical statements of fact, but rather as a way of allocating therisk to one of the parties if those statements prove to be inaccurate;
• may have been qualified by disclosures that were made to the other party in connection with thenegotiation of the applicable agreement, which disclosures are not necessarily reflected in the agreement;
• may apply standards of materiality in a way that is different from what may be viewed as material to you orother investors; and
• were made only as of the date of the applicable agreement or such other date or dates as may be specifiedin the agreement and are subject to more recent developments.
Accordingly, these representations and warranties may not describe the actual state of affairs as of the datethey were made or at any other time.
107
Exhibit Index
Number DescriptionIncorporated by Reference
or Filed Herewith
(3.1) Restated Certificate of Incorporation of the Company. Exhibit 3.1 to the Company’sQuarterly Report on Form 10-Qfor the quarter ended June 29,2003 (File No. 0-9286).
(3.2) Amended and Restated Bylaws of the Company. Exhibit 3.1 to the Company’sCurrent Report on Form 8-Kfiled on December 10, 2007(File No. 0-9286).
(4.1) Specimen of Common Stock Certificate. Exhibit 4.1 to the Company’sRegistration Statement on FormS-1 as filed on May 31, 1985(File No. 2-97822).
(4.2) Supplemental Indenture, dated as of March 3, 1995, between theCompany and Citibank, N.A. (as successor to NationsBank ofGeorgia, National Association, the initial trustee).
Exhibit 4.2 to the Company’sAnnual Report on Form 10-Kfor the fiscal year endedDecember 29, 2002(File No. 0-9286).
(4.3) Officers’ Certificate pursuant to Sections 102 and 301 of theIndenture, dated as of July 20, 1994, as supplemented and restated bythe Supplemental Indenture, dated as of March 3, 1995, between theCompany and The Bank of New York Mellon Trust Company, N.A.,as successor trustee, relating to the establishment of the Company’s$110,000,000 aggregate principal amount of 7.00% Senior Notesdue 2019.
Exhibit 4.2 to the Company’sQuarterly Report on Form 10-Qfor the quarter ended July 4,2010 (File No. 0-9286).
(4.4) Resolutions adopted by Executive Committee of the Board ofDirectors of the Company related to the establishment of theCompany’s $110,000,000 aggregate principal amount of 7.00%Senior Notes due 2019.
Exhibit 4.3 to the Company’sQuarterly Report on Form 10-Qfor the quarter ended July 4,2010 (File No. 0-9286).
(4.5) Form of the Company’s 5.30% Senior Notes due 2015. Exhibit 4.1 to the Company’sCurrent Report on Form 8-Kfiled on March 27, 2003 (FileNo. 0-9286).
(4.6) Form of the Company’s 5.00% Senior Notes due 2016. Exhibit 4.1 to the Company’sQuarterly Report on Form 10-Qfor the quarter ended October 2,2005 (File No. 0-9286).
(4.7) Form of the Company’s 7.00% Senior Notes due 2019. Exhibit 4.1 to the Company’sCurrent Report on Form 8-Kfiled on April 7, 2009 (File No.0-9286).
(4.8) Third Amended and Restated Promissory Note, dated as of June 16,2010, by and between the Company and Piedmont Coca-ColaBottling Partnership.
Exhibit 4.1 to the Company’sQuarterly Report on Form 10-Qfor the quarter ended July 4,2010 (File No. 0-9286).
(4.9) The registrant, by signing this report, agrees to furnish the Securitiesand Exchange Commission, upon its request, a copy of anyinstrument which defines the rights of holders of long-term debt of
108
Number DescriptionIncorporated by Reference
or Filed Herewith
the registrant and its consolidated subsidiaries which authorizes atotal amount of securities not in excess of 10 percent of the totalassets of the registrant and its subsidiaries on a consolidated basis.
(10.1) U.S. $200,000,000 Credit Agreement, dated as of September 21,2011, by and among the Company, the banks named therein andJP Morgan Chase Bank, N.A., as Administrative Agent.
Exhibit 10.1 to the Company’sQuarterly Report on Form 10-Qfor the quarter ended October 2,2011 (File No. 0-9286).
(10.2) Amended and Restated Guaranty Agreement, effective as of July 15,1993, made by the Company and each of the other guarantor partiesthereto in favor of Trust Company Bank and Teachers Insurance andAnnuity Association of America.
Exhibit 10.10 to the Company’sAnnual Report on Form 10-Kfor the fiscal year endedDecember 29, 2002(File No. 0-9286).
(10.3) Amended and Restated Guaranty Agreement, dated as of May 18,2000, made by the Company in favor of Wachovia Bank, N.A.
Exhibit 10.17 to the Company’sAnnual Report on Form 10-Kfor the fiscal year endedDecember 30, 2001(File No. 0-9286).
(10.4) Guaranty Agreement, dated as of December 1, 2001, made by theCompany in favor of Wachovia, Bank, N.A.
Exhibit 10.18 to the Company’sAnnual Report on Form 10-Kfor the fiscal year endedDecember 30, 2001(File No. 0-9286).
(10.5) Amended and Restated Stock Rights and Restrictions Agreement,dated February 19, 2009, by and among the Company, TheCoca-Cola Company, Carolina Coca-Cola Bottling Investments, Inc.and J. Frank Harrison, III.
Exhibit 10.1 to the Company’sCurrent Report on Form 8-Kfiled on February 19, 2009 (FileNo. 0-9286).
(10.6) Termination of Irrevocable Proxy and Voting Agreement, datedFebruary 19, 2009, by and between The Coca-Cola Company andJ. Frank Harrison, III.
Exhibit 10.2 to the Company’sCurrent Report on Form 8-Kfiled on February 19, 2009 (FileNo. 0-9286).
(10.7) Form of Master Bottle Contract (“Cola Beverage Agreement”),made and entered into, effective January 27, 1989, between TheCoca-Cola Company and the Company, together with Form of HomeMarket Amendment to Master Bottle Contract, effective as ofOctober 29, 1999.
Exhibit 10.1 to the Company’sQuarterly Report on Form 10-Qfor the quarter ended October 3,2010 (File No. 0-9286).
(10.8) Form of Allied Bottle Contract (“Allied Beverage Agreement”),made and entered into, effective January 11, 1990, between TheCoca-Cola Company and the Company (as successor to Coca-ColaBottling Company of Anderson, S.C.).
Exhibit 10.2 to the Company’sQuarterly Report on Form 10-Qfor the quarter ended October 3,2010 (File No. 0-9286).
(10.9) Letter Agreement, dated January 27, 1989, between The Coca-ColaCompany and the Company, modifying the Cola BeverageAgreements and Allied Beverage Agreements.
Exhibit 10.3 to the Company’sQuarterly Report on Form 10-Qfor the quarter ended October 3,2010 (File No. 0-9286).
(10.10) Form of Marketing and Distribution Agreement (“Still BeverageAgreement”), made and entered into effective October 1, 2000,between The Coca-Cola Company and the Company (as successorto Metrolina Bottling Company), with respect to Dasani.
Exhibit 10.4 to the Company’sQuarterly Report on Form 10-Qfor the quarter ended October 3,2010 (File No. 0-9286).
109
Number DescriptionIncorporated by Reference
or Filed Herewith
(10.11) Form of Letter Agreement, dated December 10, 2001, betweenThe Coca-Cola Company and the Company, together with LetterAgreement, dated December 14, 1994, modifying the Still BeverageAgreements.
Exhibit 10.5 to the Company’sQuarterly Report on Form 10-Qfor the quarter ended October 3,2010 (File No. 0-9286).
(10.12) Incidence Pricing Letter Agreement (“Pricing Agreement”), datedMarch 16, 2009, between The Coca-Cola Company, by and throughits Coca-Cola North America division, and the Company. **
Exhibit 10.6 to the Company’sQuarterly Report on Form 10-Qfor the quarter ended October 3,2010 (File No. 0-9286).
(10.13) Amendment No. 2 to Pricing Agreement, dated December 15, 2011,between the Company and The Coca-Cola Company, by and throughits Coca-Cola North America division.
Exhibit 10.1 to the Company’sCurrent Report on Form 8-Kfiled on December 22, 2011(File No. 0-9286).
(10.14) Letter Agreement, dated as of March 10, 2008, by and between theCompany and The Coca-Cola Company.**
Exhibit 10.1 to the Company’sQuarterly Report on Form 10-Qfor the quarter ended March 30,2008 (File No. 0-9286).
(10.15) Lease, dated as of January 1, 1999, by and between the Companyand Ragland Corporation.
Exhibit 10.5 to the Company’sAnnual Report on Form 10-Kfor the fiscal year endedDecember 31, 2000(File No. 0-9286).
(10.16) First Amendment to Lease and First Amendment to Memorandum ofLease, dated as of August 30, 2002, between the Company andRagland Corporation.
Exhibit 10.33 to the Company’sAnnual Report on Form 10-Kfor the fiscal year endedDecember 29, 2002(File No. 0-9286).
(10.17) Lease Agreement, dated as of March 23, 2009, between theCompany and Harrison Limited Partnership One.
Exhibit 10.1 to the Company’sCurrent Report on Form 8-Kfiled on March 26, 2009 (FileNo. 0-9286).
(10.18) Lease Agreement, dated as of December 18, 2006, between CCBCCOperations, LLC and Beacon Investment Corporation.
Exhibit 10.1 to the Company’sCurrent Report on Form 8-Kfiled on December 21, 2006(File No. 0-9286).
(10.19) Limited Liability Company Operating Agreement of Coca-ColaBottlers’ Sales & Services Company LLC, made as of January 1,2003, by and between Coca-Cola Bottlers’ Sales & ServicesCompany LLC and Consolidated Beverage Co., a wholly-ownedsubsidiary of the Company.
Exhibit 10.35 to the Company’sAnnual Report on Form 10-Kfor the fiscal year endedDecember 29, 2002(File No. 0-9286).
(10.20) Partnership Agreement of Piedmont Coca-Cola Bottling Partnership(formerly known as Carolina Coca-Cola Bottling Partnership), datedas of July 2, 1993, by and among Carolina Coca-Cola BottlingInvestments, Inc., Coca-Cola Ventures, Inc., Coca-Cola Bottling Co.Affiliated, Inc., Fayetteville Coca-Cola Bottling Company andPalmetto Bottling Company.
Exhibit 10.7 to the Company’sAnnual Report on Form 10-Kfor the fiscal year endedDecember 29, 2002(File No. 0-9286).
110
Number DescriptionIncorporated by Reference
or Filed Herewith
(10.21) Master Amendment to Partnership Agreement, ManagementAgreement and Definition and Adjustment Agreement, dated as ofJanuary 2, 2002, by and among Piedmont Coca-Cola BottlingPartnership, CCBC of Wilmington, Inc., The Coca-Cola Company,Piedmont Partnership Holding Company, Coca-Cola Ventures, Inc.and the Company.
Exhibit 10.1 to the Company’sCurrent Report on Form 8-Kfiled on January 14, 2002 (FileNo. 0-9286).
(10.22) Fourth Amendment to Partnership Agreement, dated as of March 28,2003, by and among Piedmont Coca-Cola Bottling Partnership,Piedmont Partnership Holding Company and Coca-Cola Ventures,Inc.
Exhibit 4.2 to the Company’sQuarterly Report on Form 10-Qfor the quarter ended March 30,2003 (File No. 0-9286).
(10.23) Management Agreement, dated as of July 2, 1993, by and among theCompany, Piedmont Coca-Cola Bottling Partnership (formerlyknown as Carolina Coca-Cola Bottling Partnership), CCBC ofWilmington, Inc., Carolina Coca-Cola Bottling Investments, Inc.,Coca-Cola Ventures, Inc. and Palmetto Bottling Company.
Exhibit 10.8 to the Company’sAnnual Report on Form 10-Kfor the fiscal year endedDecember 29, 2002(File No. 0-9286).
(10.24) First Amendment to Management Agreement (relating to theManagement Agreement designated as Exhibit 10.23 of this ExhibitIndex) effective as of January 1, 2001.
Exhibit 10.14 to the Company’sAnnual Report on Form 10-Kfor the fiscal year endedDecember 31, 2000(File No. 0-9286).
(10.25) Management Agreement, dated as of June 1, 2004, by and amongCCBCC Operations, LLC, a wholly-owned subsidiary of theCompany, and South Atlantic Canners, Inc.
Exhibit 10.1 to the Company’sQuarterly Report on Form 10-Qfor the quarter ended June 27,2004 (File No. 0-9286).
(10.26) Agreement, dated as of March 1, 1994, between the Company andSouth Atlantic Canners, Inc.
Exhibit 10.12 to the Company’sAnnual Report on Form 10-Kfor the fiscal year endedDecember 29, 2002(File No. 0-9286).
(10.27) Coca-Cola Bottling Co. Consolidated Amended and Restated AnnualBonus Plan, effective January 1, 2012.*
Appendix C to the Company’sProxy Statement for the 2012Annual Meeting ofStockholders (File No. 0-9286).
(10.28) Coca-Cola Bottling Co. Consolidated Amended and RestatedLong-Term Performance Plan, effective January 1, 2012.*
Appendix D to the Company’sProxy Statement for the 2012Annual Meeting ofStockholders (File No. 0-9286).
(10.29) Form of Long-Term Performance Plan Bonus Award Agreement.* Exhibit 10.2 to the Company’sQuarterly Report on Form 10-Qfor the quarter ended July 4,2010 (File No. 0-9286).
(10.30) Performance Unit Award Agreement, dated February 27, 2008.* Appendix A to the Company’sProxy Statement for the 2008Annual Meeting ofStockholders (File No. 0-9286).
111
Number DescriptionIncorporated by Reference
or Filed Herewith
(10.31) Coca-Cola Bottling Co. Consolidated Supplemental SavingsIncentive Plan, as amended and restated effective November 1,2011.*
Exhibit 10.31 to the Company’sAnnual Report on Form 10-Kfor the fiscal year endedJanuary 1, 2012(File No. 0-9286).
(10.32) Coca-Cola Bottling Co. Consolidated Director Deferral Plan,effective January 1, 2005.*
Exhibit 10.17 to the Company’sAnnual Report on Form 10-Kfor the fiscal year endedJanuary 1, 2006(File No. 0-9286).
(10.33) Coca-Cola Bottling Co. Consolidated Officer Retention Plan, asamended and restated effective January 1, 2007.*
Exhibit 10.4 to the Company’sQuarterly Report on Form 10-Qfor the quarter ended April 1,2007 (File No. 0-9286).
(10.34) Amendment No. 1 to Coca-Cola Bottling Co. Consolidated OfficerRetention Plan, as amended and restated effective January 1, 2009. *
Exhibit 10.32 to the Company’sAnnual Report on Form 10-Kfor the fiscal year endedDecember 28, 2008(File No. 0-9286).
(10.35) Life Insurance Benefit Agreement, effective as of December 28,2003, by and between the Company and Jan M. Harrison, Trusteeunder the J. Frank Harrison, III 2003 Irrevocable Trust, John R.Morgan, Trustee under the Harrison Family 2003 Irrevocable Trust,and J. Frank Harrison, III.*
Exhibit 10.37 to the Company’sAnnual Report on Form 10-Kfor the fiscal year endedDecember 28, 2003(File No. 0-9286).
(10.36) Form of Amended and Restated Split-Dollar and DeferredCompensation Replacement Benefit Agreement, effective as ofNovember 1, 2005, between the Company and eligible employeesof the Company.*
Exhibit 10.24 to the Company’sAnnual Report on Form 10-Kfor the fiscal year endedJanuary 1, 2006(File No. 0-9286).
(10.37) Form of Split-Dollar and Deferred Compensation ReplacementBenefit Agreement Election Form and Agreement Amendment,effective as of June 20, 2005, between the Company and certainexecutive officers of the Company.*
Exhibit 10.1 to the Company’sCurrent Report on Form 8-Kfiled on June 24, 2005 (File No.0-9286).
(12) Ratio of earnings to fixed charges. Filed herewith.(21) List of subsidiaries. Filed herewith.(31.1) Certification pursuant to Section 302 of the Sarbanes- Oxley Act
of 2002.Filed herewith.
(31.2) Certification pursuant to Section 302 of the Sarbanes- Oxley Actof 2002.
Filed herewith.
(32) Certification pursuant to 18 U.S.C. Section 1350, as adoptedpursuant to Section 906 of the Sarbanes-Oxley Act of 2002.
Filed herewith.
(101) Financial statement from the annual report on Form 10-K ofCoca-Cola Bottling Co. Consolidated for the fiscal year endedDecember 30, 2012, filed on March 14, 2013, formatted in XBRL(Extensible Business Reporting Language): (i) the ConsolidatedStatements of Operations; (ii) the Consolidated Statements ofComprehensive Income; (iii) the Consolidated Balance Sheets; (iv)the Consolidated Statements of Cash Flows; (v) the ConsolidatedStatements of Changes in Equity and (vi) the Notes to theConsolidated Financial Statements.
112
* Management contracts and compensatory plans and arrangements required to be filed as exhibits to thisform pursuant to Item 15(c) of this report.
** Certain portions of the exhibit have been omitted and filed separately with the Securities and ExchangeCommission. Confidential treatment has been requested for such portions of the exhibit.
(b) Exhibits.
See Item 15(a)3
(c) Financial Statement Schedules.
See Item 15(a)2
113
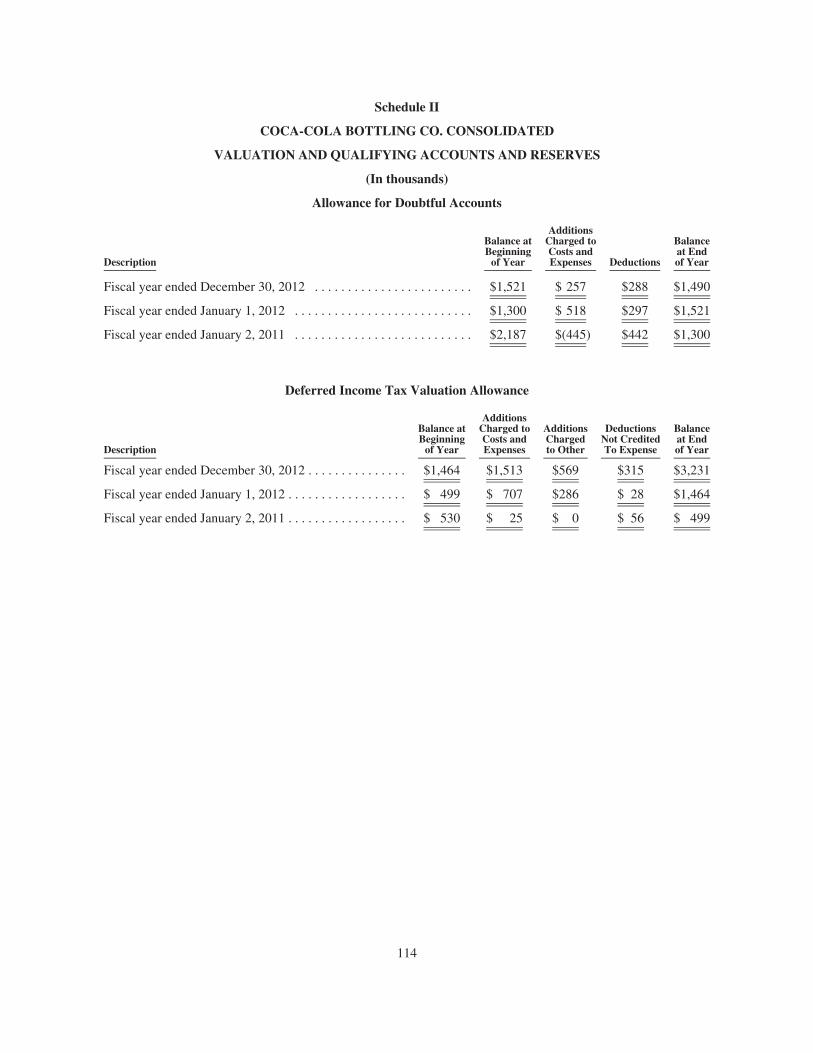
Schedule II
COCA-COLA BOTTLING CO. CONSOLIDATED
VALUATION AND QUALIFYING ACCOUNTS AND RESERVES
(In thousands)
Allowance for Doubtful Accounts
Description
Balance atBeginning
of Year
AdditionsCharged toCosts andExpenses Deductions
Balanceat Endof Year
Fiscal year ended December 30, 2012 . . . . . . . . . . . . . . . . . . . . . . . . $1,521 $ 257 $288 $1,490
Fiscal year ended January 1, 2012 . . . . . . . . . . . . . . . . . . . . . . . . . . . $1,300 $ 518 $297 $1,521
Fiscal year ended January 2, 2011 . . . . . . . . . . . . . . . . . . . . . . . . . . . $2,187 $(445) $442 $1,300
Deferred Income Tax Valuation Allowance
Description
Balance atBeginning
of Year
AdditionsCharged toCosts andExpenses
AdditionsChargedto Other
DeductionsNot CreditedTo Expense
Balanceat Endof Year
Fiscal year ended December 30, 2012 . . . . . . . . . . . . . . . $1,464 $1,513 $569 $315 $3,231
Fiscal year ended January 1, 2012 . . . . . . . . . . . . . . . . . . $ 499 $ 707 $286 $ 28 $1,464
Fiscal year ended January 2, 2011 . . . . . . . . . . . . . . . . . . $ 530 $ 25 $ 0 $ 56 $ 499
114
SIGNATURES
Pursuant to the requirements of Section 13 or 15(d) of the Securities Exchange Act of 1934, the registranthas duly caused this report to be signed on its behalf by the undersigned, thereunto duly authorized.
COCA-COLA BOTTLING CO. CONSOLIDATED
(REGISTRANT)
Date: March 14, 2013 By: /s/ J. Frank Harrison, IIIJ. Frank Harrison, III
Chairman of the Board of Directorsand Chief Executive Officer
Pursuant to the requirements of the Securities Exchange Act of 1934, this report has been signed below bythe following persons on behalf of the registrant and in the capacities and on the dates indicated.
Signature Title Date
By: /s/ J. FRANK HARRISON, IIIJ. Frank Harrison, III
Chairman of the Board of Directors,Chief Executive Officer and Director
March 14, 2013
By: /s/ H. W. MCKAY BELK
H. W. McKay Belk
Director March 14, 2013
By: /s/ ALEXANDER B. CUMMINGS, JR.Alexander B. Cummings, Jr.
Director March 14, 2013
By: /s/ SHARON A. DECKER
Sharon A. Decker
Director March 14, 2013
By: /s/ WILLIAM B. ELMORE
William B. Elmore
Vice Chairman of the Board of Directorsand Director
March 14, 2013
By: /s/ MORGAN H. EVERETT
Morgan H. Everett
Director of Community Relationsand Director
March 14, 2013
By: /s/ DEBORAH H. EVERHART
Deborah H. Everhart
Director March 14, 2013
By: /s/ HENRY W. FLINT
Henry W. Flint
President, Chief Operating Officerand Director
March 14, 2013
By: /s/ WILLIAM H. JONES
William H. Jones
Director March 14, 2013
By: /s/ JAMES H. MORGAN
James H. Morgan
Director March 14, 2013
By: /s/ JOHN W. MURREY, IIIJohn W. Murrey, III
Director March 14, 2013
By: /s/ DENNIS A. WICKER
Dennis A. Wicker
Director March 14, 2013
By: /s/ JAMES E. HARRIS
James E. Harris
Senior Vice President, Shared Services andChief Financial Officer
March 14, 2013
By: /s/ WILLIAM J. BILLIARD
William J. Billiard
Vice President, Operations Finance andChief Accounting Officer
March 14, 2013
115
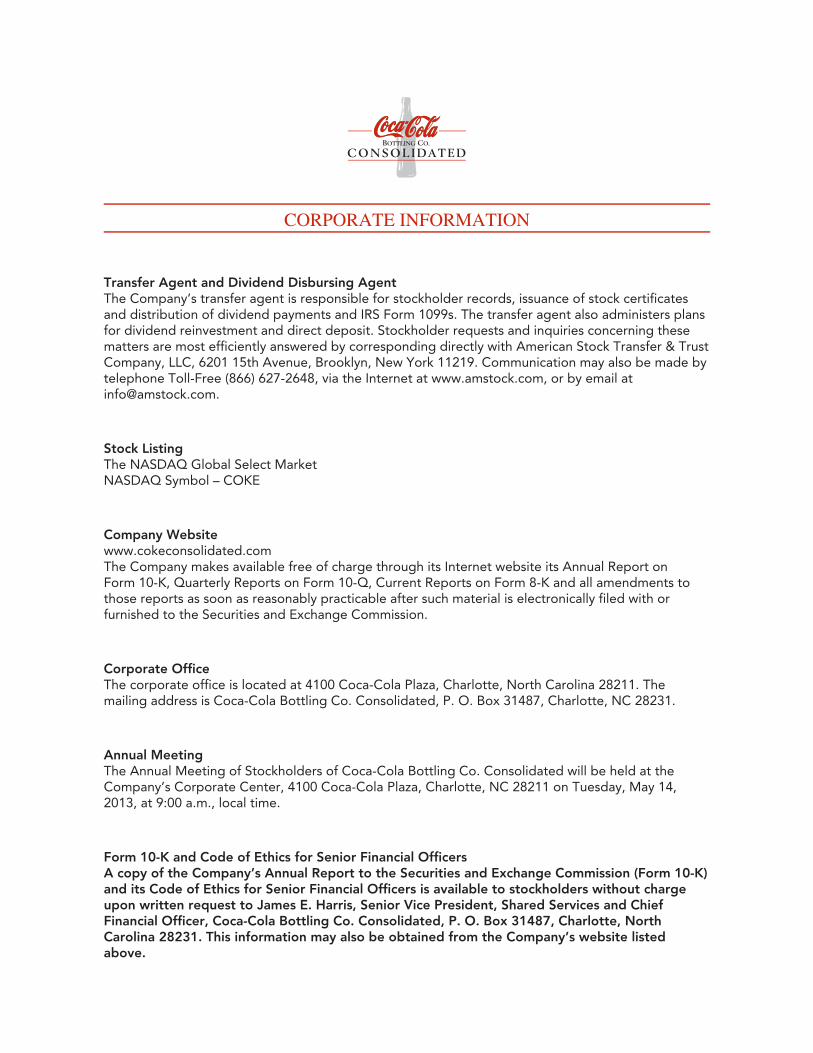
CORPORATE INFORMATION
Transfer Agent and Dividend Disbursing AgentThe Company’s transfer agent is responsible for stockholder records, issuance of stock certificatesand distribution of dividend payments and IRS Form 1099s. The transfer agent also administers plansfor dividend reinvestment and direct deposit. Stockholder requests and inquiries concerning thesematters are most efficiently answered by corresponding directly with American Stock Transfer & TrustCompany, LLC, 6201 15th Avenue, Brooklyn, New York 11219. Communication may also be made bytelephone Toll-Free (866) 627-2648, via the Internet at www.amstock.com, or by email [email protected].
Stock ListingThe NASDAQ Global Select MarketNASDAQ Symbol – COKE
Company Websitewww.cokeconsolidated.comThe Company makes available free of charge through its Internet website its Annual Report onForm 10-K, Quarterly Reports on Form 10-Q, Current Reports on Form 8-K and all amendments tothose reports as soon as reasonably practicable after such material is electronically filed with orfurnished to the Securities and Exchange Commission.
Corporate OfficeThe corporate office is located at 4100 Coca-Cola Plaza, Charlotte, North Carolina 28211. Themailing address is Coca-Cola Bottling Co. Consolidated, P. O. Box 31487, Charlotte, NC 28231.
Annual MeetingThe Annual Meeting of Stockholders of Coca-Cola Bottling Co. Consolidated will be held at theCompany’s Corporate Center, 4100 Coca-Cola Plaza, Charlotte, NC 28211 on Tuesday, May 14,2013, at 9:00 a.m., local time.
Form 10-K and Code of Ethics for Senior Financial OfficersA copy of the Company’s Annual Report to the Securities and Exchange Commission (Form 10-K)and its Code of Ethics for Senior Financial Officers is available to stockholders without chargeupon written request to James E. Harris, Senior Vice President, Shared Services and ChiefFinancial Officer, Coca-Cola Bottling Co. Consolidated, P. O. Box 31487, Charlotte, NorthCarolina 28231. This information may also be obtained from the Company’s website listedabove.
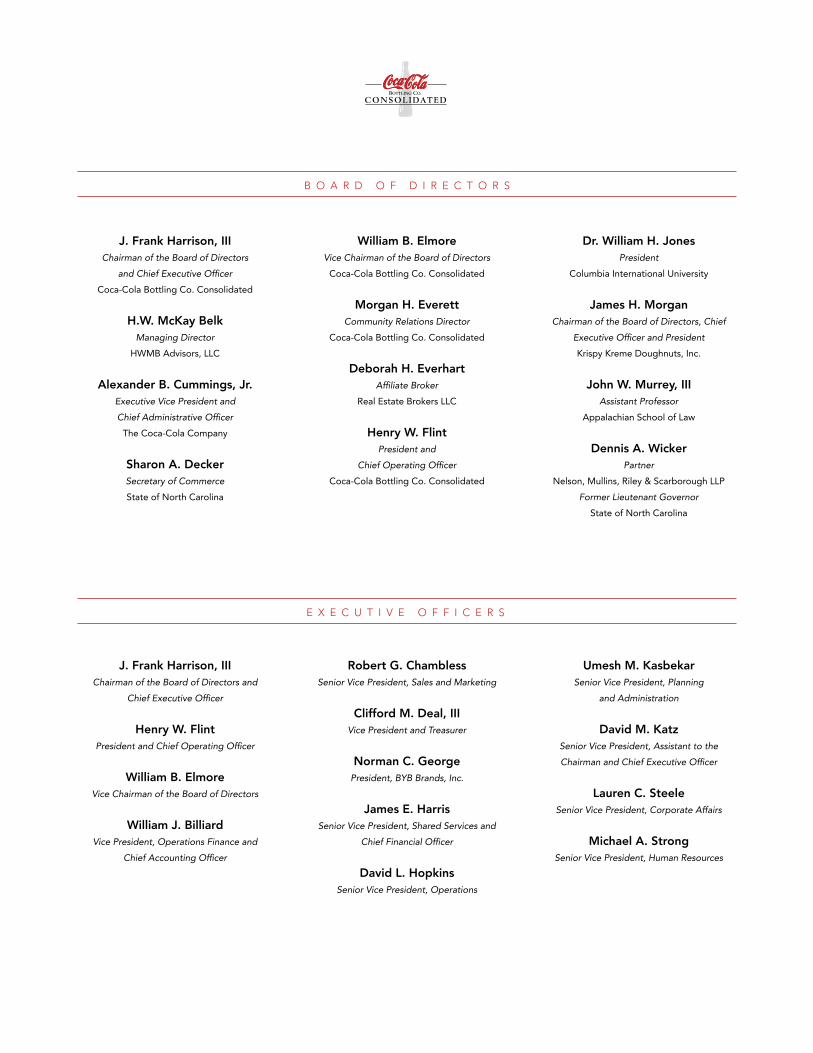
B o a r D o F D I r e C t o r S
J. Frank Harrison, IIIChairman of the Board of Directors
and Chief Executive Officer Coca‑Cola Bottling Co. Consolidated
H.W. McKay BelkManaging Director
HWMB Advisors, LLC
Alexander B. Cummings, Jr.Executive Vice President and
Chief Administrative Officer The Coca‑Cola Company
Sharon A. DeckerSecretary of Commerce State of North Carolina
William B. ElmoreVice Chairman of the Board of Directors
Coca‑Cola Bottling Co. Consolidated
Morgan H. EverettCommunity Relations Director
Coca‑Cola Bottling Co. Consolidated
Deborah H. EverhartAffiliate Broker
Real Estate Brokers LLC
Henry W. FlintPresident and
Chief Operating Officer Coca‑Cola Bottling Co. Consolidated
Dr. William H. JonesPresident
Columbia International University
James H. MorganChairman of the Board of Directors, Chief
Executive Officer and President Krispy Kreme Doughnuts, Inc.
John W. Murrey, IIIAssistant Professor
Appalachian School of Law
Dennis A. WickerPartner
Nelson, Mullins, Riley & Scarborough LLP Former Lieutenant Governor
State of North Carolina
e X e C u t I V e o F F I C e r S
J. Frank Harrison, IIIChairman of the Board of Directors and
Chief Executive Officer
Henry W. FlintPresident and Chief Operating Officer
William B. ElmoreVice Chairman of the Board of Directors
William J. BilliardVice President, Operations Finance and
Chief Accounting Officer
Robert G. ChamblessSenior Vice President, Sales and Marketing
Clifford M. Deal, IIIVice President and Treasurer
Norman C. GeorgePresident, BYB Brands, Inc.
James E. HarrisSenior Vice President, Shared Services and
Chief Financial Officer
David L. HopkinsSenior Vice President, Operations
Umesh M. KasbekarSenior Vice President, Planning
and Administration
David M. KatzSenior Vice President, Assistant to the
Chairman and Chief Executive Officer
Lauren C. SteeleSenior Vice President, Corporate Affairs
Michael A. StrongSenior Vice President, Human Resources
a n n u a l r e p o r t | 2 0 1 2
facebook.com/CokeConsolidated twitter.com/CokeCCBCC
Coca‑Cola Bottling Co. Consolidated 4100 Coca‑Cola Plaza | Charlotte, NC 28211
Mailing Address: Post Office Box 31487 | Charlotte, NC 28231
704.557.4400 www.CokeConsolidated.com