Embed Size (px)
Citation preview

Dollar G
eneral Corporation • 20
15 Annual R
eport and 2016 Proxy Statem
ent
2015ANNUALREPORT
100 Mission RidgeGoodlettsville, Tennessee 37072
(615) 855-4000www.dollargeneral.com
AND 2016 PROXY STATEMENT

ANNUAL MEETINGDollar General Corporation’s annual meeting of share-
holders is scheduled for 9:00 a.m. Central Time on
Wednesday May 25, 2016, at:
Goodlettsville City Hall Auditorium
105 South Main Street, Goodlettsville, TN 37072
Shareholders of record as of March 17, 2016 are entitled
to vote at the meeting.
NYSE: DGThe common stock of Dollar General Corporation is
traded on the New York Stock Exchange under the trading
symbol “DG.” The number of shareholders of record as of
March 17, 2016 was 1,879.
STOCK PERFORMANCE GRAPHThe graph below shows a comparison of Dollar General’s
cumulative total shareholder return on common stock
with the cumulative total returns of the S&P 500 index
and the S&P Retailing index. The graph tracks the per-
formance of a $100 investment in Dollar General com-
mon stock and in each index (with the reinvestment of
all dividends) from January 28, 2011 to January 29, 2016.
COMPARISON OF CUMULATIVE TOTAL RETURN
The stock price performance included in this graph is not necessarily indicative of future stock price performance.
S&P Retailing IndexS&P 500 Index
$150
$200
$100
$250
$300
1/28/11 2/3/12 2/1/13 1/31/14 1/30/15 1/29/16
Dollar General Corporation
$147.68
$115.66
$104.22 $121.71
$149.35
$162.96 $198.31
$147.89
$189.57
$236.13
$168.93
$227.53
$266.71
$167.81
$266.59
Dollar General
S&P 500 Index
S&P Retailing Index
$100
$100
$100
1/28/11 2/3/12 2/1/13 1/31/14 1/30/15 1/29/16
Cautionary Language Regarding Forward-Looking Statements: All forward-looking information in this report should be read with, and is qualifi ed in its entirety by, the Cautionary Disclosure Regarding Forward-Looking Statements and the Risk Factors disclosures set forth in the Introduction and in Item 1A, respectively, of the Form 10-K included elsewhere in this report.
The information contained on or connected to our Internet websites is not incorporated by reference into this report and should not be considered part of this or any other report that we fi le with or furnish to the SEC.
$20.4
2015
$14.8
2011
$16.0
2012
$17.5
2013
$18.9
2014
11,789
2014
12,483
2015
9,937
2011
10,506
2012
11,132
2013
$4,709
2014
$6,087
2015
$1,050
2011
$2,181
2012
$3,394
2013
2.8%
2014
2.8%
2015
6.0%
2011
4.7%
2012
3.3%
2013
NET SALES (IN BILLIONS)
ENDING STORE COUNT
SAME-STORE SALES GROWTH
Fiscal 2011 includes 53 weeks, while all other years presented contain 52 weeks. Sales in the 2011 53rd
week were $289 million.
Dollar General Corporation has been delivering value to shoppers for over 75 years. Dollar General helps shoppers Save time. Save money. Every day!® by o� ering products that are frequently used and replenished, such as food, snacks, health and beauty aids, cleaning supplies, clothing for the family, housewares and seasonal items at low everyday prices in convenient neighborhood locations. With 12,483 stores in 43 states as of January 29, 2016, Dollar General is among the largest discount retailers
in the United States. In addition to high quality private brands, Dollar General sells products from America’s most-trusted manufacturers such as Procter & Gamble, Kimberly-Clark, Unilever, Kellogg’s, General Mills, Nabisco, Hanes, PepsiCo and Coca-Cola.
Learn more about Dollar Generaland shop online at:
www.dollargeneral.com
ABOUT DOLLAR GENERAL
336
654
89362
164 31
28
41
733
708
188
451 428
210456
493
22
41113
14
353
66
436
411
666644
1,296
389
658
334198
457
24
7
5
97
24
80
555
30016
28
223
28
4187
126
STORES
DISTRIBUTION CENTER
12,483TOTAL STORES | TOTAL STATES: 43
as of January 29, 2016
CUMULATIVE CASH FROM OPERATIONS (IN MILLIONS)
12,483TOTAL STORES | TOTAL STATES: 43
as of January 29, 2016

improve adult and youth literacy, and with the support of our stores and our customers, we also raised funds for St. Jude Children’s Hospital, Autism Speaks and the American Red Cross.
I have a clear vision for the future of Dollar General to strengthen our business and continue on a path of sustainable, profitable growth. We will focus on four key priorities:
1. Driving profitable sales growth. To drive profitable sales growth, we will deliver on our brand promise of everyday low prices and will continue to focus on improving our on-shelf availability and customer experience. To a greater degree than we have in past years, our sales-driving category initiatives will be implemented across not just new stores, relocations and remodels, but also to our mature store base. We have ongoing opportunities for gross margin expansion through improvements in inventory shrink reduction, global sourcing, private brands penetration, distribution and transportation e�ciencies and non-consumable sales.
2. Capturing growth opportunities. Given our strong new store returns, our plan is to open 900 new stores in 2016. We are accelerating our square footage growth with a new store format for all new stores, relocations and remodels. The updated format will allow for an expansion in products we know our customer wants and will provide a more customer-friendly layout including a faster checkout.
3. Enhancing our position as a low-cost operator. We have undertaken zero-based budgeting to provide additional flexibility, reinvest savings and drive growth. We are also focused on work elimination to keep the business simple.
4. Investing in our people as a competitive advantage. Our strategy is focused on talent selection and employee development through great onboarding, training and open communication. We are committed to helping our employees develop their talents and gain additional skills and experiences to grow their careers at Dollar General. Their success is key to our success as a company.
At Dollar General, we have a business model that is proven and resilient. As a team, I am confident we are well-positioned to drive long-term shareholder value as we look to capture growth opportunities and invest in the future. I thank you for your continued support.
Respectfully,
This has been a strong year at Dollar General. Despite many changes within the retail landscape throughout 2015, our business continued to drive profitable sales growth, meet the needs of our customers and create long-term shareholder value. I am excited and honored to have been named chief executive o�cer of Dollar General in June of last year. Our company has a unique culture of Serving Others, a rich history and a very bright future. Our values and our mission of service are at the core of our success. Our business strategies, how we utilize technology and how we serve our customers will continue to evolve as we leverage our competitive advantages. Within the small-box discount retail sector, we have an opportunity to strengthen our leadership position and grow our market share.
2015 was another record year for Dollar General as our associates served millions of customers resulting in over 1.8 billion transactions. We made targeted investments in store labor to improve our in-stock position and implemented merchandising initiatives to improve category management and enhance the overall shopping experience.
Highlights of 2015 Compared to 2014
• Net sales increased by 7.7 percent to $20.4 billion or $226 per square foot.
• Same-stores sales grew 2.8 percent over 2014, marking our 26th consecutive year of same-store sales growth.
• We reported net income of $1.17 billion or $3.95 per diluted share, an increase of 13 percent.
• Cash flow from operations was $1.4 billion, an increase of $63 million.
The refinement of our merchandise o�erings and increased utilization of store square footage helped drive increases in both customer tra�c and average transaction amount for the 32nd consecutive quarter over prior year quarter. We invested in new store growth, opening 730 new stores in addition to completing our 13th distribution center in San Antonio, Texas. Our ongoing commitment to increasing long-term shareholder value is evidenced by the $1.6 billion return of cash to our shareholders in 2015 through the repurchase of nearly 18 million shares of our common stock and the initiation of a regular quarterly cash dividend.
As CEO, I have had the opportunity to travel throughout the United States visiting both our consumers and our store employees. It is clear to me that our culture of Serving Others is very meaningful to the local communities and the individuals we employ and serve. In 2015, we partnered with the Dollar General Literacy Foundation, the Dollar General Employee Assistance Foundation, our customers and our vendors to donate over $17.3 million to charitable organizations and individuals in need. Nearly 80 percent of that giving was directed to nonprofit organizations and schools to help
Todd J. VasosCHIEF EXECUTIVE OFFICER April 8, 2016
TO OUR FELLOW SHAREHOLDERS, CUSTOMERS & EMPLOYEES


ProxyStatement &
Meeting Notice


8APR201014561687
29MAR201618415070
Dollar General Corporation100 Mission Ridge
Goodlettsville, Tennessee 37072
Dear Fellow Shareholder:
The 2016 Annual Meeting of Shareholders of Dollar General Corporation will be held onWednesday, May 25, 2016, at 9:00 a.m., Central Time, at Goodlettsville City Hall Auditorium,105 South Main Street, Goodlettsville, Tennessee. All shareholders of record at the close of business onMarch 17, 2016 are invited to attend the annual meeting. For security reasons, however, to gainadmission to the meeting you may be required to present photo identification and comply with othersecurity measures.
At this year’s meeting, you will have an opportunity to vote on the matters described in ouraccompanying Notice of Annual Meeting of Shareholders and Proxy Statement. Our 2015 AnnualReport and our Annual Report on Form 10-K for the fiscal year ended January 29, 2016 alsoaccompany this letter.
Your interest in Dollar General and your vote are very important to us. We encourage you toread the Proxy Statement and vote your proxy as soon as possible so your vote can be represented atthe annual meeting. You may vote your proxy via the Internet or telephone, or if you received a papercopy of the proxy materials by mail, you may vote by mail by completing and returning a proxy card.
On behalf of the Board of Directors, thank you for your continued support of Dollar General.
Sincerely,
Michael M. CalbertChairman of the Board
April 8, 2016


8APR201014561687
6APR201023125201
Dollar General Corporation100 Mission Ridge
Goodlettsville, Tennessee 37072
NOTICE OF ANNUAL MEETING OF SHAREHOLDERS
DATE: Wednesday, May 25, 2016
TIME: 9:00 a.m., Central Time
PLACE: Goodlettsville City Hall Auditorium105 South Main StreetGoodlettsville, Tennessee
ITEMS OF BUSINESS: 1) To elect as directors the 8 nominees listed in the proxy statement
2) To ratify the appointment of the independent registered publicaccounting firm for fiscal 2016
3) To transact any other business that may properly come before theannual meeting and any adjournments of that meeting
WHO MAY VOTE: Shareholders of record at the close of business on March 17, 2016
By Order of the Board of Directors,
Goodlettsville, Tennessee Christine L. ConnollyApril 8, 2016 Corporate Secretary
Please vote your proxy as soon as possible even if you expect to attend the annual meeting in person. Youmay vote your proxy via the Internet or by phone by following the instructions on the notice of internetavailability or proxy card, or if you received a paper copy of these proxy materials by mail, you may voteby mail by completing and returning the enclosed proxy card in the enclosed reply envelope. No postage isnecessary if the proxy is mailed within the United States. You may revoke your proxy by following theinstructions listed on page 3 of the proxy statement.


Proxy
DOLLAR GENERAL CORPORATION
Proxy Statement for2016 Annual Meeting of Shareholders
TABLE OF CONTENTS
General Information . . . . . . . . . . . . . . . . . . . . . . . . . . . . . . . . . . . . . . . . . . . . . . . . . . . . . . . . . 1Voting Matters . . . . . . . . . . . . . . . . . . . . . . . . . . . . . . . . . . . . . . . . . . . . . . . . . . . . . . . . . . . . . 2Proposal 1: Election of Directors . . . . . . . . . . . . . . . . . . . . . . . . . . . . . . . . . . . . . . . . . . . . . . . . 5Corporate Governance . . . . . . . . . . . . . . . . . . . . . . . . . . . . . . . . . . . . . . . . . . . . . . . . . . . . . . . 11Director Compensation . . . . . . . . . . . . . . . . . . . . . . . . . . . . . . . . . . . . . . . . . . . . . . . . . . . . . . . 16Director Independence . . . . . . . . . . . . . . . . . . . . . . . . . . . . . . . . . . . . . . . . . . . . . . . . . . . . . . . 19Transactions with Management and Others . . . . . . . . . . . . . . . . . . . . . . . . . . . . . . . . . . . . . . . . . 21Executive Compensation . . . . . . . . . . . . . . . . . . . . . . . . . . . . . . . . . . . . . . . . . . . . . . . . . . . . . . 22
Compensation Discussion and Analysis . . . . . . . . . . . . . . . . . . . . . . . . . . . . . . . . . . . . . . . . . . . 22Compensation Committee Report . . . . . . . . . . . . . . . . . . . . . . . . . . . . . . . . . . . . . . . . . . . . . . . 33Summary Compensation Table . . . . . . . . . . . . . . . . . . . . . . . . . . . . . . . . . . . . . . . . . . . . . . . . . 34Grants of Plan-Based Awards in Fiscal 2015 . . . . . . . . . . . . . . . . . . . . . . . . . . . . . . . . . . . . . . . 37Outstanding Equity Awards at 2015 Fiscal Year-End . . . . . . . . . . . . . . . . . . . . . . . . . . . . . . . . . . 38Option Exercises and Stock Vested During Fiscal 2015 . . . . . . . . . . . . . . . . . . . . . . . . . . . . . . . . 40Pension Benefits Fiscal 2015 . . . . . . . . . . . . . . . . . . . . . . . . . . . . . . . . . . . . . . . . . . . . . . . . . . . 41Nonqualified Deferred Compensation Fiscal 2015 . . . . . . . . . . . . . . . . . . . . . . . . . . . . . . . . . . . . 41Potential Payments upon Termination or Change in Control . . . . . . . . . . . . . . . . . . . . . . . . . . . . . 42Compensation Committee Interlocks and Insider Participation . . . . . . . . . . . . . . . . . . . . . . . . . . . 50Compensation Risk Considerations . . . . . . . . . . . . . . . . . . . . . . . . . . . . . . . . . . . . . . . . . . . . . . 50
Security Ownership . . . . . . . . . . . . . . . . . . . . . . . . . . . . . . . . . . . . . . . . . . . . . . . . . . . . . . . . . . 51Security Ownership of Certain Beneficial Owners . . . . . . . . . . . . . . . . . . . . . . . . . . . . . . . . . . . . 51Security Ownership of Officers and Directors . . . . . . . . . . . . . . . . . . . . . . . . . . . . . . . . . . . . . . . 52
Audit Committee Report . . . . . . . . . . . . . . . . . . . . . . . . . . . . . . . . . . . . . . . . . . . . . . . . . . . . . . 53Proposal 2: Ratification of Appointment of Auditors . . . . . . . . . . . . . . . . . . . . . . . . . . . . . . . . . . 54Fees Paid to Auditors . . . . . . . . . . . . . . . . . . . . . . . . . . . . . . . . . . . . . . . . . . . . . . . . . . . . . . . . 55Section 16(a) Beneficial Ownership Reporting Compliance . . . . . . . . . . . . . . . . . . . . . . . . . . . . . 56Shareholder Proposals for 2017 Annual Meeting . . . . . . . . . . . . . . . . . . . . . . . . . . . . . . . . . . . . . 56Appendix A . . . . . . . . . . . . . . . . . . . . . . . . . . . . . . . . . . . . . . . . . . . . . . . . . . . . . . . . . . . . . . . 57
IMPORTANT NOTICE REGARDING AVAILABILITY OF PROXY MATERIALS FOR THESHAREHOLDER MEETING TO BE HELD ON MAY 25, 2016
This Proxy Statement, our 2015 Annual Report and a form of proxy card are available atwww.proxyvote.com. You will need your Notice of Internet Availability or proxy card to access the proxymaterials.
As permitted by rules adopted by the Securities and Exchange Commission (‘‘SEC’’), we arefurnishing our proxy materials over the Internet to some of our shareholders. This means that someshareholders will not receive paper copies of these documents. Instead, these shareholders will receiveonly a Notice of Internet Availability containing instructions on how to access the proxy materials overthe Internet. The Notice of Internet Availability also contains instructions on how each of thoseshareholders can request a paper copy of our proxy materials, including the Proxy Statement, our 2015Annual Report and a proxy card. Shareholders who do not receive a Notice of Internet Availability willreceive a paper copy of the proxy materials by mail, unless they have previously requested delivery ofproxy materials electronically. If you received only the Notice of Internet Availability and would like toreceive a paper copy of the proxy materials, the notice contains instructions on how you can requestcopies of these documents.

Proxy
GENERAL INFORMATION
What is this document?
This document is the Proxy Statement of Dollar General Corporation for the Annual Meetingof Shareholders to be held on Wednesday, May 25, 2016. We will begin mailing printed copies of thisdocument or the Notice of Internet Availability to shareholders on or about April 8, 2016. We areproviding this document to solicit your proxy to vote upon certain matters at the annual meeting.
We refer to our company as ‘‘we,’’ ‘‘us’’ or ‘‘Dollar General.’’ Unless otherwise noted orrequired by context, ‘‘2016,’’ ‘‘2015,’’ ‘‘2014,’’ ‘‘2013,’’ and ‘‘2012’’ refer to our fiscal years ending orended February 3, 2017, January 29, 2016, January 30, 2015, January 31, 2014, and February 1, 2013,respectively.
What is a proxy, who is asking for it, and who is paying for the cost to solicit it?
A proxy is your legal designation of another person, called a ‘‘proxy,’’ to vote your stock. Thedocument that designates someone as your proxy is also called a proxy or a proxy card.
Our directors, officers and employees are soliciting your proxy on behalf of our Board ofDirectors. Dollar General will pay all solicitation expenses. We will not additionally compensate thesepersons to solicit your proxy but will reimburse them for any out-of-pocket expenses they incur. Wealso may reimburse custodians and nominees for their expenses in sending proxy materials to beneficialowners.
Who may attend the annual meeting?
Only shareholders, their proxy holders and our invited guests may attend the meeting. If yourshares are registered in the name of a broker, trust, bank or other nominee, you will need to bring aproxy or a letter from that record holder or your most recent brokerage account statement thatconfirms your ownership of those shares as of March 17, 2016. For security reasons, we also mayrequire photo identification for admission.
Where can I find directions to the annual meeting?
Directions to Goodlettsville City Hall, where we will hold the annual meeting, are posted onthe ‘‘Investor Information’’ section of our website located at www.dollargeneral.com.
Will the annual meeting be webcast?
Yes. You are invited to visit the ‘‘Conference Calls and Investor Events’’ section of the‘‘Investor Information’’ section of our website located at www.dollargeneral.com at 9:00 a.m., CentralTime, on May 25, 2016 to access the live webcast of the annual meeting. An archived copy of thewebcast will be available on our website for at least 60 days. The information on our website, however,is not incorporated by reference into, and does not form a part of, this proxy statement.
What is Dollar General Corporation and where is it located?
Dollar General has been delivering value to shoppers for over 75 years. Dollar General helpsshoppers Save time. Save money. Every day!� by offering products that are frequently used andreplenished, such as food, snacks, health and beauty aids, cleaning supplies, clothing for the family,housewares and seasonal items at low everyday prices in convenient neighborhood locations. DollarGeneral operates 12,575 stores in 43 states as of February 26, 2016. Our principal executive offices arelocated at 100 Mission Ridge, Goodlettsville, Tennessee 37072. Our telephone number is 615-855-4000.
Where is Dollar General common stock traded?
Our stock is traded on the New York Stock Exchange (‘‘NYSE’’) under the symbol ‘‘DG.’’
1

Prox
y
VOTING MATTERS
How many votes must be present to hold the annual meeting?
A quorum, consisting of the presence in person or by proxy of the holders of a majority ofshares of our common stock outstanding on March 17, 2016, must exist to conduct any business at themeeting.
What if a quorum is not present at the annual meeting?
If a quorum is not present at the meeting, any officer entitled to preside at or to act asSecretary of the meeting shall have power to adjourn the meeting from time to time until a quorum ispresent.
What am I voting on?
You will be asked to vote on:
• the election of 8 directors; and
• the ratification of the appointment of our independent registered public accounting firm(the ‘‘independent auditor’’) for 2016.
May other matters be raised at the annual meeting?
We are unaware of other matters to be acted upon at the meeting. Under Tennessee law andour governing documents, no other non-procedural business may be raised at the meeting unless propernotice has been given to shareholders. If other business is properly raised, your proxies have authorityto vote as they think best, including to adjourn the meeting.
Who is entitled to vote at the annual meeting?
You may vote if you owned shares of Dollar General common stock at the close of business onMarch 17, 2016. As of that date, there were 286,669,916 shares of Dollar General common stockoutstanding and entitled to vote. Each share is entitled to one vote on each matter.
What is the difference between a ‘‘shareholder of record’’ and a ‘‘street name’’ holder?
You are a ‘‘shareholder of record’’ if your shares are registered directly in your name withWells Fargo Shareowner Services, our transfer agent. You are a ‘‘street name’’ holder if your shares areheld in the name of a brokerage firm, bank, trust or other nominee as custodian.
How do I vote?
If you are a shareholder of record, you may vote your proxy over the telephone or Internet or,if you received printed proxy materials, by marking, signing, dating and returning the printed proxycard in the enclosed envelope. Please refer to the instructions on the Notice of Internet Availability orproxy card, as applicable. Alternatively, you may vote in person at the meeting.
If you are a street name holder, your broker, bank, or other nominee will provide materialsand instructions for voting your shares. You may vote in person at the meeting if you obtain and bringto the meeting a legal proxy from your broker, banker, trustee or other nominee giving you the right tovote the shares.
2

Proxy
What if I receive more than one Notice of Internet Availability or proxy card?
You will receive multiple Notices of Internet Availability or proxy cards if you hold shares indifferent ways (e.g., joint tenancy, trusts, custodial accounts, etc.) or in multiple accounts. Street nameholders will receive the Notice of Internet Availability or proxy card or other voting information, alongwith voting instructions, from their brokers. Please vote the shares represented by each Notice ofInternet Availability or proxy card you receive to ensure that all your shares are voted.
How will my proxy be voted?
The persons named on the proxy card will vote your proxy as you direct or, if you return asigned proxy card or complete the Internet or telephone voting procedures but do not specify how youwant to vote your shares: ‘‘FOR’’ all directors nominated and ‘‘FOR’’ ratification of Ernst &Young LLP as our independent auditor for 2016.
Can I change my mind and revoke my proxy?
Yes. A shareholder of record may revoke a proxy given pursuant to this solicitation by:
• signing a valid, later-dated proxy card and submitting it so that it is received before theannual meeting in accordance with the instructions included in the proxy card;
• at or before the annual meeting, submitting to our Corporate Secretary a written notice ofrevocation dated later than the date of the proxy;
• submitting a later-dated vote by telephone or Internet no later than 11:59 p.m., Easterntime, on May 24, 2016; or
• attending the annual meeting and voting in person.
Your attendance at the annual meeting, by itself, will not revoke your proxy.
A street name holder may revoke a proxy given pursuant to this solicitation by following theinstructions of the bank, broker, trustee or other nominee who holds his or her shares.
How many votes are needed to elect directors?
To be elected at the annual meeting, a nominee must receive the affirmative vote of a majorityof votes cast by holders of shares entitled to vote at the meeting. Under our Amended and RestatedCharter, the ‘‘affirmative vote of a majority of votes cast’’ means that the number of votes cast in favorof a nominee’s election exceeds the number of votes cast against his or her election. You may vote infavor of or against the election of each nominee, or you may elect to abstain from voting your shares.
What happens if a director fails to receive the required vote for election?
An incumbent director who does not receive the required vote for election at the annualmeeting must promptly tender a resignation as a director for the Board’s consideration pursuant to ourBoard-approved director resignation policy outlined in our Corporate Governance Guidelines. Eachdirector standing for re-election at the annual meeting has agreed to resign, effective upon the Board’sacceptance of such resignation, if he or she does not receive a majority vote. If the Board rejects theoffered resignation, the director will continue to serve until the next annual shareholders’ meeting anduntil his or her successor is duly elected or his or her earlier resignation or removal in accordance withour Amended and Restated Bylaws (‘‘Bylaws’’). If the Board accepts the offered resignation, the Board,in its sole discretion, may fill the resulting vacancy or decrease the size of the Board.
3
Prox
y
How many votes are needed to approve other matters?
The proposal to ratify the appointment of our independent auditor for 2016 will be approved ifthe votes cast in favor of such proposal exceed the votes cast against it.
With respect to this proposal, and any other matter properly brought before the annualmeeting, you may vote in favor of or against the proposal, or you may elect to abstain from voting yourshares.
What are broker non-votes?
Although your broker is the record holder of any shares that you hold in street name, it mustvote those shares pursuant to your instructions. If you do not provide instructions, your broker mayexercise discretionary voting power over your shares for ‘‘routine’’ items but not for ‘‘non-routine’’items. The election of directors is considered to be a non-routine item, while the ratification of theappointment of our independent auditor is considered to be a routine matter.
‘‘Broker non-votes’’ occur when shares held of record by a broker are not voted on a matterbecause the broker has not received voting instructions from the beneficial owner and either lacks ordeclines to exercise the authority to vote the shares in its discretion.
How will abstentions and broker non-votes be treated?
Abstentions and broker non-votes, if any, will be treated as shares that are present and entitledto vote for purposes of determining whether a quorum is present but will not be counted as votes casteither in favor of or against a particular proposal and will have no effect on the outcome of aparticular proposal.
Will my vote be confidential?
Proxy instructions, ballots and voting tabulations that identify individual shareholders arehandled in a manner that is intended to protect your voting privacy. Your vote will not be intentionallydisclosed either within Dollar General or to third parties, except (1) as necessary to meet applicablelegal requirements; (2) in a dispute regarding authenticity of proxies and ballots; (3) in the case of acontested proxy solicitation, if the other party soliciting proxies does not agree to comply with theconfidential voting policy; (4) to allow for the tabulation of votes and certification of the vote; (5) tofacilitate a successful proxy solicitation; or (6) when a shareholder makes a written comment on theproxy card or otherwise communicates the vote to management.
4

Proxy
PROPOSAL 1:ELECTION OF DIRECTORS
What is the structure of the Board of Directors?
Our Board of Directors must consist of 1 to 15 directors, with the exact number, currentlyfixed at 8, set by the Board. All directors are elected annually by our shareholders.
Who are the nominees this year?
The nominees for the Board of Directors consist of the 8 current directors. If elected, eachnominee would hold office until the 2017 annual meeting of shareholders and until his or her successoris elected and qualified, subject to any earlier resignation or removal. These nominees, their ages at thedate of this proxy statement and the calendar year in which they first became a director are listed inthe table below.
Name Age Director Since
Warren F. Bryant 70 2009Michael M. Calbert 53 2007Sandra B. Cochran 57 2012Patricia D. Fili-Krushel 62 2012Paula A. Price 54 2014William C. Rhodes, III 50 2009David B. Rickard 69 2010Todd J. Vasos 54 2015
What are the backgrounds of this year’s nominees?
Mr. Bryant served as the President and Chief Executive Officer of Longs Drug StoresCorporation, a retail drugstore chain on the West Coast and in Hawaii, from 2002 through 2008 and asits Chairman of the Board from 2003 through his retirement in 2008. Prior to joining Longs DrugStores, he served as a Senior Vice President of The Kroger Co., a retail grocery chain, from 1999 to2002. Mr. Bryant is a director of Office Depot, Inc. and Loblaw Companies Limited of Canada andserved as a director of OfficeMax Incorporated from 2004 to 2013.
Mr. Calbert has served as our Chairman of the Board since January 30, 2016. He joinedKKR & Co. L.P. (‘‘KKR’’) in January 2000 and was directly involved with several KKR portfoliocompanies until his retirement in January 2014. Mr. Calbert led the Retail industry team within KKR’sPrivate Equity platform prior to his retirement and served as a consultant to KKR from his retirementuntil June 2015. Mr. Calbert joined Randall’s Food Markets beginning in 1994 and served as the ChiefFinancial Officer from 1997 until it was sold in September 1999. Mr. Calbert also previously worked asa certified public accountant and consultant with Arthur Andersen Worldwide from 1985 to 1994,where his primary focus was the retail and consumer industry. He previously served as our Chairman ofthe Board from July 2007 until December 2008 and as our lead director from March 2013 until hisre-appointment as our Chairman of the Board in January 2016.
Ms. Cochran has served as a director and as President and Chief Executive Officer of CrackerBarrel Old Country Store, Inc. since September 2011. She joined Cracker Barrel in April 2009 asExecutive Vice President and Chief Financial Officer, and was named President and Chief OperatingOfficer in November 2010. She was previously Chief Executive Officer at book retailerBooks-A-Million, Inc. from February 2004 to April 2009. She also served as that company’s President(August 1999—February 2004), Chief Financial Officer (September 1993—August 1999) and VicePresident of Finance (August 1992—September 1993). Ms. Cochran has over 20 years of experience inthe retail industry. Ms. Cochran has served as a director of Lowe’s Companies, Inc. since January 2016.
5

Prox
y
Ms. Fili-Krushel is the former Executive Vice President for NBCUniversal where she served asa strategist and key advisor to the CEO of NBCUniversal from April 2015 to November 2015. Sheserved as Chairman of NBCUniversal News Group, a division of NBCUniversal Media, LLC, composedof NBC News, CNBC, MSNBC and the Weather Channel, from July 2012 until April 2015. Shepreviously served as Executive Vice President of NBCUniversal (January 2011—July 2012) with a broadportfolio of functions reporting to her, including operations and technical services, business strategy,human resources and legal. Prior to NBCUniversal, Ms. Fili-Krushel was Executive Vice President ofAdministration at Time Warner Inc. (July 2001—December 2010) where her responsibilities includedoversight of philanthropy, corporate social responsibility, human resources, worldwide recruitment,employee development and growth, compensation and benefits, and security. Before joining TimeWarner in July 2001, Ms. Fili-Krushel had been Chief Executive Officer of WebMD Health Corp. sinceApril 2000. From July 1998 to April 2000, Ms. Fili-Krushel was President of the ABC TelevisionNetwork, and from 1993 to 1998 she served as President of ABC Daytime. Before joining ABC, shehad been with Lifetime Television since 1988. Prior to Lifetime, Ms. Fili-Krushel held several positionswith Home Box Office. Before joining HBO, Ms. Fili-Krushel worked for ABC Sports in variouspositions.
Ms. Price has been Senior Lecturer at Harvard Business School in the Accounting andManagement Unit since July 2014. She was Executive Vice President and Chief Financial Officer ofAhold USA from May 2009 until January 2014. At Ahold, which operates more than 700 supermarketsunder the Stop & Shop, Giant and Martin’s names as well as the Peapod online grocery deliveryservice, Ms. Price was responsible for finance, accounting and shared services, strategic planning, realestate development, store format and construction, and information technology. Before joining Ahold,she was the Senior Vice President, Controller and Chief Accounting Officer at CVS HealthCorporation (formerly CVS Caremark Corporation) from July 2006 until August 2008. Earlier in hercareer, Ms. Price served as the Chief Financial Officer for the Institutional Trust Services division ofJPMorgan Chase (from August 2002 until September 2005), and held several other senior managementpositions in the U.S. and the U.K. in the financial services and consumer packaged goods industries. Acertified public accountant, she began her career at Arthur Andersen & Co. Ms. Price has also servedas a director of Accenture plc since May 2014 and Western Digital Corporation since July 2014 andserved as a director of Charming Shoppes, Inc. (Lane Bryant, Catherine’s, Fashion Bug, Cacique andFigi’s brands) from March 2011 until it was sold in June 2012.
Mr. Rhodes was elected Chairman of AutoZone, Inc., a specialty retailer and distributor ofautomotive replacement parts and accessories, in June 2007. He has served as President and ChiefExecutive Officer and as a director of AutoZone since 2005. Prior to his appointment as President andChief Executive Officer, Mr. Rhodes was Executive Vice President—Store Operations and Commercial.Prior to 2004, he had been Senior Vice President—Supply Chain and Information Technology since2002, and prior thereto had been Senior Vice President—Supply Chain since 2001. Prior to that time,he served in various capacities with AutoZone since 1994, including Vice President—Stores in 2000,Senior Vice President—Finance and Vice President—Finance in 1999, and Vice President—OperationsAnalysis and Support from 1997 to 1999. Prior to 1994, Mr. Rhodes was a manager with Ernst &Young LLP.
Mr. Rickard served as the Executive Vice President, Chief Financial Officer and ChiefAdministrative Officer of CVS Health Corporation (formerly CVS Caremark Corporation), a retailpharmacy chain and provider of healthcare services and pharmacy benefits management, fromSeptember 1999 until his retirement in December 2009. Prior to joining CVS, Mr. Rickard was theSenior Vice President and Chief Financial Officer of RJR Nabisco Holdings Corporation from March1997 to August 1999. Previously, he was Executive Vice President of International Distillers andVintners Americas. Mr. Rickard is a director of Harris Corporation and Jones Lang LaSalleIncorporated.
6

Proxy
Mr. Vasos has served as Chief Executive Officer and a member of our Board since June 3, 2015.He joined Dollar General in December 2008 as Executive Vice President, Division President and ChiefMerchandising Officer. He was promoted to Chief Operating Officer in November 2013. Prior tojoining Dollar General, Mr. Vasos served in executive positions with Longs Drug Stores Corporationfor seven years, including Executive Vice President and Chief Operating Officer (February 2008through November 2008) and Senior Vice President and Chief Merchandising Officer (2001—2008),where he was responsible for all pharmacy and front-end marketing, merchandising, procurement,supply chain, advertising, store development, store layout and space allocation, and the operation ofthree distribution centers. He also previously served in leadership positions at Phar-Mor Food andDrug Inc. and Eckerd Corporation.
How are directors identified and nominated?
All nominees for election as directors at the annual meeting currently serve on our Board ofDirectors and were nominated by the Board for election or re-election, as applicable, upon therecommendation of the Nominating and Governance Committee (the ‘‘Nominating Committee’’). TheNominating Committee is responsible for identifying, evaluating and recommending director candidates,while our Board is responsible for nominating the director slate for election at the annual meeting.
The Nominating Committee’s charter and our Corporate Governance Guidelines require theNominating Committee to consider candidates submitted by our shareholders in accordance with thenotice provisions of our Bylaws (see ‘‘Can shareholders nominate directors?’’ below) and to apply thesame criteria to the evaluation of those candidates as it applies to other director candidates. TheNominating Committee also may use a variety of other methods to identify potential directorcandidates, such as recommendations by our directors, management, or third-party search firms.
Our employment agreement with Mr. Vasos requires the Board or a duly authorized committeeof the Board to nominate him to serve as a member of our Board each year that he is slated forre-election to the Board. Our failure to do so could give rise to a claim for breach of contract and mayconstitute good reason for employment termination by Mr. Vasos under the employment agreement.
How are nominees evaluated; what are the minimum qualifications?
Subject to Mr. Vasos’s employment agreement discussed above, the Nominating Committee ischarged with recommending to the Board of Directors only those candidates that it believes arequalified to serve as Board members consistent with the criteria for selection of new directors adoptedfrom time to time by the Board and who have not achieved the age of 76, unless the Board hasapproved an exception to this limit on a case by case basis. If a waiver is granted, it will be reviewedannually.
We have a written policy to endeavor to achieve a mix of Board members that represent adiversity of background and experience in areas that are relevant to our business. To implement thispolicy, the Committee assesses diversity by evaluating each candidate’s individual qualifications in thecontext of how that candidate would relate to the Board as a whole and also considers more traditionalconcepts of diversity. The Committee periodically assesses the effectiveness of this policy by consideringwhether the Board as a whole represents such diverse experience and composition and byrecommending to the Board changes to the criteria for selection of new directors as appropriate. TheCommittee recommends candidates, including those submitted by shareholders, only if it believes thecandidate’s knowledge, experience and expertise would strengthen the Board and that the candidate iscommitted to representing the long-term interests of all Dollar General shareholders.
7

Prox
y
The Nominating Committee assesses a candidate’s independence, background and experience,as well as the current Board’s skill needs and diversity. With respect to incumbent directors consideredfor re-election, the Committee also assesses each director’s meeting attendance record and suitabilityfor continued service. In addition, the Committee determines that all nominees are in a position todevote an adequate amount of time to the effective performance of director duties and possess thefollowing characteristics: integrity and accountability, informed judgment, financial literacy, acooperative approach, a record of achievement, loyalty, and the ability to consult with and advisemanagement.
What particular experience, qualifications, attributes or skills led the Board of Directors to concludethat each nominee should serve as a director of Dollar General?
Our Board of Directors believes that each of the nominees can devote an adequate amount oftime to the effective performance of director duties and possesses the minimum qualifications identifiedabove. The Board has determined that the nominees, as a whole, complement each other, meet theBoard’s skill needs, and represent diverse experience at policy-making levels in areas relevant to ourbusiness. The Board also considered the following in determining that the nominees should serve asdirectors of Dollar General:
Mr. Bryant has over 40 years of retail experience, including experience in marketing,merchandising, operations and finance. His substantial experience in leadership and policy-making rolesat other retail companies, together with his current and former experience as a board member forcertain other retailers, provides him with an extensive understanding of our industry, as well as withvaluable executive management skills and the ability to effectively advise our CEO.
Mr. Calbert has considerable experience in managing private equity portfolio companies and isfamiliar with corporate finance and strategic business planning activities. As the former head of KKR’sRetail industry team, Mr. Calbert has a strong background and extensive experience in advising andmanaging companies in the retail industry, including evaluating business strategies, financial plans andstructures, and management teams. His former service on the board of directors of Academy, Ltd., Petsat Home Group Plc., Shoppers Drug Mart Corporation, Toys ‘‘R’’ Us, Inc. and US Foods, Inc. furtherstrengthens his knowledge and experience within the retail industry. Mr. Calbert also has a significantfinancial and accounting background evidenced by his prior experience as the chief financial officer of aretail company and his 10 years of practice as a certified public accountant.
Ms. Cochran brings over 20 years of retail experience to Dollar General as a result of hercurrent and former roles at Cracker Barrel Old Country Store and her former roles atBooks-A-Million. This experience allows her to provide additional support and perspective to our CEOand our Board. In addition, Ms. Cochran’s industry and executive experience provides leadership,consensus-building, strategic planning, risk management and budgeting skills. Ms. Cochran also hassignificant financial experience, having served as the chief financial officer of two public companies andas vice president, corporate finance of SunTrust Securities, Inc., and our Board has determined that shequalifies as an audit committee financial expert.
Ms. Fili-Krushel’s background increases the breadth of experience of our Board as a result ofher extensive executive experience overseeing the business strategy, philanthropy, corporate socialresponsibility, human resources, recruitment, employee growth and development, compensation andbenefits, and legal functions at large public companies in the media industry. In addition, herunderstanding of consumer behavior based on her knowledge of viewership patterns and preferencesprovides additional perspective to our Board in understanding our customer base.
8

Proxy
Ms. Price brings broad experience across finance, general management and strategy gainedfrom her service in senior executive and management positions at major corporations across severalindustries, including as Chief Financial Officer of Ahold USA before her retirement in 2014.Ms. Price’s numerous years of experience as a certified public accountant, former chief financial officerand former chief accounting officer provide our Board with valuable experience and insight intoaccounting and finance matters, and consequently, our Board has determined that Ms. Price is an auditcommittee financial expert. She also brings to our Board a valuable perspective as a member of thefaculty at Harvard Business School and from her service as a board member of several publiccompanies.
Mr. Rhodes has over 20 years of experience in the retail industry, including extensive experiencein operations, supply chain and finance, among other areas. This background serves as a strongfoundation for offering invaluable perspective and expertise to our CEO and our Board. In addition,his experience as a board chairman and chief executive officer of a public retail company providesleadership, consensus-building, strategic planning and budgeting skills, as well as extensiveunderstanding of both short- and long-term issues confronting the retail industry. Mr. Rhodes also hasa strong financial background.
Mr. Rickard held senior management and executive positions for much of his 38 years in thecorporate world. He has significant retail experience and a diverse retail industry background, includingprevious experience serving on the board of another retail company. He also has an extensive financialand accounting background, having served as the chief financial officer of two public companies,including a large retailer. As a result, our Board has determined that Mr. Rickard is an auditcommittee financial expert and has elected him to serve as the Chairman of the Audit Committee.Mr. Rickard’s financial experience within the retail industry also brings expertise and perspective to ourBoard’s discussions regarding strategic planning and budgeting.
Mr. Vasos has extensive retail experience, including over seven years with Dollar General. Hisexperience overseeing the merchandising, operations, marketing, advertising, procurement, supply chain,store development, store layout and space allocation functions of other retail companies bolstersMr. Vasos’s thorough understanding of all key areas of our business. In addition, Mr. Vasos’s service inleadership and policy-making positions of other retail companies has provided him with the necessaryleadership skills to effectively guide and oversee the direction of Dollar General and with theconsensus-building skills required to lead our management team.
Acting upon the Nominating Committee’s recommendation, and after concluding that thesenominees possess the appropriate experience, qualifications, attributes and skills, our Board hasunanimously nominated these individuals to be elected by our shareholders at our annual meeting.
Can shareholders nominate directors?
Yes. Shareholders can nominate directors by following the procedures outlined in our Bylaws.In short, the shareholder must deliver a written notice to our Corporate Secretary at 100 MissionRidge, Goodlettsville, TN 37072 for receipt no earlier than the close of business on the 120th day andnot later than the close of business on the 90th day prior to the first anniversary of the prior year’sannual meeting. However, if the meeting is held more than 30 days before or more than 60 days aftersuch anniversary date, the notice must be received no earlier than the close of business on the120th day and not later than the close of business on the 90th day prior to the date of such annualmeeting. If the first public announcement of the annual meeting date is less than 100 days prior to thedate of such annual meeting, the notice must be received by the 10th day following the publicannouncement date.
9

Prox
y
The notice must contain all information required by our Bylaws about the shareholderproposing the nominee and about the nominee, which generally includes:
• the nominee’s name, age, business and residence addresses, and principal occupation oremployment;
• the class and number of shares of Dollar General common stock beneficially owned by thenominee and by the shareholder proposing the nominee;
• any other information relating to the nominee that is required to be disclosed in proxysolicitations with respect to nominees for election as directors pursuant to Regulation 14Aof the Securities Exchange Act of 1934 (including the nominee’s written consent to beingnamed in the proxy statement as a nominee and to serving as a director, if elected);
• the name and address of the shareholder proposing the nominee as they appear on ourrecord books, and the name and address of the beneficial holder (if applicable);
• any other interests of the proposing shareholder or the proposing shareholder’s immediatefamily in the securities of Dollar General, including interests the value of which is based onincreases or decreases in the value of securities of Dollar General or the payment ofdividends by Dollar General;
• a description of all compensatory arrangements or understandings between the proposingshareholder and each nominee; and
• a description of all arrangements or understandings between the proposing shareholder andeach nominee and any other person pursuant to which the nomination is to be made bythe shareholder.
You should consult our Bylaws, posted on the ‘‘Investor Information—Corporate Governance’’section of our website located at www.dollargeneral.com, for more detailed information regarding theprocess by which shareholders may nominate directors, as the information above is a summary only. Noshareholder nominees have been proposed for this year’s annual meeting.
What if a nominee is unwilling or unable to serve?
That is not expected to occur. If it does, the persons designated as proxies on the proxy cardare authorized to vote your proxy for a substitute designated by our Board of Directors.
Are there any familial relationships between any of the nominees?
There are no familial relationships between any of the nominees or between any of thenominees and any of our executive officers.
What does the Board of Directors recommend?
Our Board unanimously recommends that you vote FOR the election of each of the directornominees.
10

Proxy
CORPORATE GOVERNANCE
Does the Board of Directors have standing Audit, Compensation and Nominating Committees?
Yes. Our Board of Directors has a standing Audit Committee, Compensation Committee andNominating Committee. The Board has adopted a written charter for each of these committees, whichare available on the ‘‘Investor Information—Corporate Governance’’ section of our website located atwww.dollargeneral.com. Current information regarding each of these committees is set forth below.
Name ofCommittee & Members Committee Functions
AUDIT: • Selects the independent auditorMr. Rickard, Chairman • Discusses with management the qualifications and experience of theMr. Bryant lead audit partner candidate(s) (the committee’s Chairman alsoMs. Cochran interviews the lead director candidate(s))Ms. Price • Pre-approves the independent auditor’s audit engagement fees and
terms and all permitted non-audit services and fees• Reviews an annual report describing the independent auditor’s internal
quality control procedures and any material issues raised by its mostrecent review of internal quality controls
• Annually evaluates the independent auditor’s qualifications,performance and independence, annually evaluates the lead auditpartner, and periodically considers whether there should be a regularrotation of such firm
• Discusses the audit scope and any audit problems or difficulties• Sets policies regarding the hiring of current and former employees of
the independent auditor• Discusses the annual audited and quarterly unaudited financial
statements with management and the independent auditor• Discusses types of information to be disclosed in earnings press
releases and provided to analysts and rating agencies• Discusses policies governing the process by which risk assessment and
risk management are to be undertaken• Reviews CEO/CFO disclosures regarding any significant deficiencies or
material weaknesses in our internal control over financial reporting• Reviews internal audit activities, projects and budget• Establishes procedures for receipt, retention and treatment of
complaints we receive regarding accounting or internal controls• Discusses with our general counsel legal matters having an impact on
financial statements• Performs an annual self-evaluation• Furnishes the committee report required in our proxy statement• Evaluates and makes recommendations concerning shareholder
proposals relating to matters within the committee’s expertise• Periodically reviews and reassesses the committee’s charter
11

Prox
y
Name ofCommittee & Members Committee Functions
COMPENSATION: • Reviews and approves corporate goals and objectives relevant to theMr. Bryant, Chairman compensation of our CEOMs. Fili-Krushel • Determines the compensation of our executive officers (subject, in theMr. Rhodes case of the CEO’s compensation, to ratification by the independent
directors) and recommends the compensation of our directors to theBoard for approval
• Recommends, when appropriate, changes to our compensationphilosophy and principles
• Establishes our short-term incentive compensation program for seniorofficers
• Establishes our long-term incentive compensation program andapproves equity-based awards under such program
• Oversees the share ownership guidelines and holding requirements forBoard members and senior officers
• Oversees the process for evaluating our senior officers• Reviews and discusses with management, prior to the filing of the
proxy statement, the disclosure regarding executive compensation,including the Compensation Discussion and Analysis and compensationtables (in addition to preparing a report on executive compensation forthe proxy statement)
• Selects and determines the fees of its compensation consultant• Oversees and evaluates the independence of its compensation
consultant and other advisors• Performs an annual self-evaluation• Evaluates and makes recommendations concerning shareholder
proposals relating to matters within the committee’s expertise• Periodically reviews and reassesses the committee’s charter
NOMINATING AND • Develops and recommends criteria for selecting new directorsGOVERNANCE: • Screens and recommends to our Board individuals qualified to become
Mr. Rhodes, Chairman members of our BoardMs. Cochran • Recommends the structure and membership of Board committeesMs. Fili-Krushel • Recommends persons to fill Board and committee vacancies
• Develops and recommends Corporate Governance Guidelines andcorporate governance practices
• Oversees the process governing the annual evaluation of the Board andits individual members
• Performs an annual self-evaluation• Evaluates and makes recommendations concerning shareholder
proposals relating to matters within the committee’s expertise• Periodically reviews and reassesses the committee’s charter
12
Proxy
Does Dollar General have an audit committee financial expert serving on its Audit Committee?
Yes. Our Board has designated each of Mr. Rickard, Ms. Cochran and Ms. Price as an auditcommittee financial expert and has determined that each is independent as defined in NYSE listingstandards and in our Corporate Governance Guidelines. Such experts have the same responsibilities asthe other Audit Committee members. They are not our auditors or accountants, do not perform ‘‘fieldwork’’ and are not employees. The SEC has determined that designation as an audit committeefinancial expert will not cause a person to be deemed to be an ‘‘expert’’ for any purpose.
How often did the Board and its committees meet in 2015?
During 2015, our Board, Audit Committee, Compensation Committee and NominatingCommittee met 10, 5, 6 and 4 times, respectively. Each incumbent director attended at least 75% ofthe total of all meetings of the Board and all committees on which he or she served which were heldduring the period for which he or she was a director and a member of each applicable committee.
What is Dollar General’s policy regarding Board member attendance at the annual meeting?
Our Board of Directors has adopted a policy that all directors should attend annualshareholders’ meetings unless attendance is not feasible due to unavoidable circumstances. All personsserving as Board members at the time attended the 2015 annual shareholders’ meeting.
Does Dollar General combine the positions of Chairman and CEO?
No. As part of the transition of the CEO role from Mr. Richard W. Dreiling to Mr. Vasos inJune 2015, the Board separated the positions of Chairman and CEO, and Mr. Dreiling continued toserve in the Chairman position until January 2016. Following Mr. Dreiling’s tenure as Chairman, and toafford Mr. Vasos the opportunity to focus his time and energy on managing our business, the Boarddetermined to continue to separate the positions of Chairman and CEO and appointed Mr. Calbert, anindependent director and the lead director at the time, to the Chairman role effective January 30, 2016.This decision further allows our Chairman to devote his time and attention to matters of Boardoversight and governance. The Board recognizes that no single leadership model is right for allcompanies and at all times, and the Board will review its leadership structure as appropriate to ensureit continues to be in the best interests of Dollar General and our shareholders.
To further promote effective independent Board leadership, the Board has adopted a numberof additional governance practices, including:
• Ensuring opportunity after each regularly scheduled Board meeting for executive sessionsof the independent directors and, if not all non-management directors are independent, ofthe non-management directors. Mr. Calbert, as Chairman and formerly as lead director,presides over such executive sessions.
• Conducting annual performance evaluations of the CEO.
• Conducting annual Board and committee performance self-evaluations by the Board andeach standing committee.
Does the Board of Directors evaluate the performance of Board members?
Yes. The Nominating Committee is responsible for overseeing the evaluation of the Board ofDirectors. As part of this responsibility, in addition to approving an evaluation process to be followedfor the Board and each standing committee, the Nominating Committee encourages our directors toprovide candid feedback on any member of the Board to the Chairman of the Nominating Committeeor the Chairman of the Board. The Chairman of the Nominating Committee and the Chairman of the
13

Prox
y
Board meet at least annually to review all such feedback and any other information related to theperformance of our Board members and to discuss what, if any, response or other follow-up action isappropriate and in Dollar General’s best interests.
What is the Board of Director’s role in risk oversight?
Our Board of Directors and its committees have an important role in our risk oversightprocess. Our Board regularly reviews with management our financial and business strategies, includingrelevant material risks as appropriate. Our General Counsel also periodically provides information tothe Board regarding our insurance coverage and programs as well as litigation risks.
The Audit Committee discusses our policies with respect to risk assessment and riskmanagement, primarily through oversight of our enterprise risk management program. Our InternalAudit department coordinates that program, which entails review and documentation of ourcomprehensive risk management practices. The program evaluates internal and external risks, identifiesmitigation strategies, and assesses the remaining residual risk. The program is updated throughinterviews with senior management and our Board, review of strategic initiatives, evaluation of thefiscal budget, review of upcoming legislative or regulatory changes, review of certain internal metricsand review of other outside information concerning business, financial, legal, reputational, and otherrisks. The results are presented to the Audit Committee at least annually. Quarterly, the categories withhigh residual risk, along with their mitigation strategies, are reviewed individually. Our AuditCommittee also quarterly reviews metrics and information pertaining to information security risks andmitigation.
Our Compensation Committee is responsible for overseeing the management of risks relatingto our executive compensation program. As discussed under ‘‘Executive Compensation—CompensationRisk Considerations’’ below, the Compensation Committee also participates in periodic assessments ofthe risks relating to our overall compensation programs.
While the Audit Committee and the Compensation Committee oversee the risk areas identifiedabove, the entire Board is regularly informed about risks through the committee reporting process. Thisenables the Board and its committees to coordinate the risk oversight role, particularly with respect torisk interrelationships. Our Board believes this division of risk management responsibilities effectivelyaddresses the material risks facing Dollar General. Accordingly, the risk oversight role of our Boardand its committees has not had any effect on our Board’s leadership structure.
Does Dollar General have a management succession plan?
Yes. Our Corporate Governance Guidelines require our Board of Directors to coordinate withour CEO to ensure that a formalized process governs long-term management development andsuccession. Our Board formally reviews our management succession plan at least annually. Ourcomprehensive program encompasses not only our CEO and other executive officers but all employeesthrough the front-line supervisory level. The program focuses on key succession elements, includingidentification of potential successors for positions where it has been determined that internal successionis appropriate, assessment of each potential successor’s level of readiness, and preparation of individualgrowth and development plans. With respect to CEO succession planning, our long-term businessstrategy is also considered. In addition, we maintain at all times, and review with the Boardperiodically, a confidential procedure for the timely and efficient transfer of the CEO’s responsibilitiesin the event of an emergency or his sudden incapacitation or departure.
14

Proxy
Are there share ownership guidelines and holding requirements for Board members and seniorofficers?
Yes. Details of our share ownership guidelines and holding requirements for Board membersand senior officers are included in our Corporate Governance Guidelines. See ‘‘CompensationDiscussion and Analysis’’ and ‘‘Director Compensation’’ for more information on such ownershipguidelines and holding requirements for senior officers and Board members, respectively.
How can I communicate with the Board of Directors?
Our Board-approved process for security holders and other interested parties to contact theBoard of Directors, a particular director, or the non-management directors or the independentdirectors as a group is described on www.dollargeneral.com under ‘‘Investor Information—CorporateGovernance.’’
Where can I find more information about Dollar General’s corporate governance practices?
Our governance-related information is posted on www.dollargeneral.com under ‘‘InvestorInformation—Corporate Governance,’’ including our Corporate Governance Guidelines, Code ofBusiness Conduct and Ethics, the charter of each of the Audit Committee, the CompensationCommittee and the Nominating Committee, and the name(s) of the persons chosen to lead theexecutive sessions of the non-management directors and of the independent directors. This informationis available in print to any shareholder who sends a written request to: Investor Relations, DollarGeneral Corporation, 100 Mission Ridge, Goodlettsville, TN 37072.
15

Prox
y
DIRECTOR COMPENSATION
The following table and text summarize the compensation earned by or paid to each of ournon-employee Board members for 2015. Messrs. Dreiling and Vasos were not separately compensatedfor their service on the Board; their executive compensation is discussed under ‘‘ExecutiveCompensation’’ below. We have omitted the columns pertaining to non-equity incentive plancompensation and change in pension value and nonqualified deferred compensation earnings becausethey are inapplicable.
Fiscal 2015 Director Compensation
FeesEarnedor Paid Stock Option All Otherin Cash Awards Awards Compensation Total
Name ($)(1) ($)(2) ($)(3) ($)(4) ($)
Warren F. Bryant 111,000 121,591 — 2,961 235,552Michael M. Calbert 110,000 121,591 — 3,625 235,216Sandra B. Cochran 88,000 121,591 — 2,371 211,962Patricia D. Fili-Krushel 91,000 121,591 — 2,277 214,868Paula A. Price 85,000 121,591 — 1,753 208,344William C. Rhodes, III 103,000 121,591 — 2,127 226,718David B. Rickard 107,500 121,591 — 4,116 233,207
(1) In addition to the annual Board retainer, the following directors were paid for the following number of excess meetings:Mr. Bryant (4); Ms. Cochran (2); Ms. Fili-Krushel (4); and Mr. Rhodes (2). Messrs. Bryant, Rhodes and Rickard alsoreceived an annual retainer for service as the Chairman of the Compensation Committee, the Nominating Committee andthe Audit Committee, respectively, and Mr. Calbert received an annual retainer for service as the Lead Director.Mr. Calbert deferred all of his fiscal 2015 fees under the Non-Employee Director Deferred Compensation Plan discussedbelow.
(2) Represents the grant date fair value of restricted stock units (‘‘RSUs’’) awarded to each director on May 27, 2015,computed in accordance with FASB ASC Topic 718. Information regarding assumptions made in the valuation of theseawards is included in Note 10 of the annual consolidated financial statements in our Annual Report on Form 10-K for thefiscal year ended January 29, 2016, filed with the SEC on March 22, 2016 (our ‘‘2015 Form 10-K’’). As of January 29, 2016,each of the persons listed in the table above had the following total unvested RSUs outstanding (including additional RSUscredited as a result of dividend equivalents earned with respect to the RSUs): each of Messrs. Bryant, Calbert, Rhodes andRickard and Ms. Fili-Krushel (2,609); Ms. Cochran (2,977); and Ms. Price (2,277).
(3) There were no stock options awarded to any director listed in the table above during fiscal 2015, as the Board chose toeliminate stock option awards as part of director compensation beginning in fiscal 2015. As of January 29, 2016, each of thepersons listed in the table above had the following total unexercised stock options outstanding (whether or not thenexercisable): each of Messrs. Bryant, Calbert and Rhodes (21,756); Ms. Cochran (13,120); Ms. Fili-Krushel (12,892);Ms. Price (4,795); and Mr. Rickard (21,513).
(4) Represents the dollar value of dividends paid, accumulated or credited on unvested RSUs. Perquisites and personalbenefits, if any, totaled less than $10,000 per director and therefore are not included in the table.
16

Proxy
We do not compensate for Board service any director who also serves as our employee. We willreimburse directors for certain fees and expenses incurred in connection with continuing educationseminars and for travel and related expenses related to Dollar General business.
Each non-employee director will receive payment (prorated as applicable) for a fiscal year inquarterly installments of the following cash compensation, as applicable, along with an annual award ofRSUs, payable in shares of our common stock, under our Amended and Restated 2007 Stock IncentivePlan having the following estimated value:
Per MeetingFee for
Audit Compensation Nominating Meetings EstimatedLead Committee Committee Committee Attended in Value of
Board Director Chairman Chairman Chairman Excess of 16 EquityFiscal Retainer Retainer Retainer Retainer Retainer During FY AwardYear ($) ($) ($) ($) ($) ($) ($)
2015 85,000 25,000 22,500 20,000 15,000 1,500 125,0002016 85,000 N/A(1) 22,500 20,000 15,000 1,500 135,000
(1) Because the Chairman of the Board is an independent director, we do not intend to re-appoint a lead director in fiscal2016. In lieu of an additional cash retainer for this service, the Chairman of the Board will receive an annual Chairmanretainer delivered in the form of RSUs, payable in shares of our common stock under our Amended and Restated 2007Stock Incentive Plan and scheduled to vest on the first anniversary of the grant date, subject to certain accelerated vestingconditions, having an estimated value of $200,000.
The RSUs are awarded annually to those non-employee directors who are elected or re-electedat the shareholders’ meeting and to any new director appointed after the annual shareholders’ meetingbut before February 1 of a given year. Beginning with the 2015 award, the RSUs are scheduled to veston the first anniversary of the grant date subject to full acceleration of vesting upon death, disability (asdefined in the applicable award agreement) or voluntary departure from the Board. Directors may electto defer receipt of shares underlying the RSUs.
These fees and equity award values and the mix of equity, including the changes in directorcompensation identified below, were recommended each year by the Compensation Committee, andapproved by the Board, after taking into account market benchmarking data, Meridian’srecommendations, the input of the CEO and the Chief People Officer (with respect to 2015 and prioryears) and, for the additional equity award to the Chairman in 2016, the amount of time anticipated tobe devoted to the mentoring of a new CEO. Although the Committee may solicit and consider theinput of our CEO and our Chief People Officer, it and the Board retain and exercise ultimate decision-making authority regarding director compensation.
As a result of such considerations, (1) as previously disclosed, the equity mix was changedbeginning in 2015 to deliver all of the equity value in RSUs as opposed to the 2014 equity mix whichconsisted of 60% stock options and 40% RSUs; and (2) the estimated value of the equity award wasincreased beginning in fiscal 2016.
Up to 100% of cash fees earned for Board services in a fiscal year may be deferred under theNon-Employee Director Deferred Compensation Plan. Benefits are payable upon separation fromservice in the form, as elected by the director at the time of deferral, of a lump sum distribution ormonthly payments for 5, 10 or 15 years. Participating directors can direct the hypothetical investment ofdeferred fees into funds identical to those offered in our 401(k) Plan and will be credited with thedeemed investment gains and losses. The amounts deferred, along with deemed investment gains andlosses, are credited to a liability account. The amount of the benefit will vary depending on the fees thedirector has deferred and the deemed investment gains and losses. Benefits upon death are payable tothe director’s named beneficiary. In the event of a director’s disability (as defined in the Non-Employee
17

Prox
y
Director Deferred Compensation Plan), the unpaid benefit will be paid in a lump sum. Participantdeferrals are not contributed to a trust, and all benefits are paid from Dollar General’s general assets.
Our non-employee directors are subject to share ownership guidelines, expressed as a multipleof the annual cash retainer payable for service on our Board, and holding requirements. The currentownership guideline is 5 times (increased from a multiple of 4 times in December 2015). At least 1times such annual cash retainer should be acquired prior to or as soon as practicable after joining theBoard, and the remainder should be acquired within 5 years of election to the Board. When theownership guideline is increased, incumbent non-employee directors are allowed an additional year toacquire the incremental multiple. Each non-employee director is required to retain ownership of 50%of all net after-tax shares granted by Dollar General until he or she reaches the share ownership target.Please see our Corporate Governance Guidelines for additional information. Administrative detailspertaining to these matters are established by the Compensation Committee.
18

Proxy
DIRECTOR INDEPENDENCE
Is Dollar General subject to the NYSE governance rules regarding director independence?
Yes. A majority of our directors must be independent in accordance with the independencerequirements set forth in the NYSE listing standards. In addition, the Audit Committee, theCompensation Committee and the Nominating Committee must be composed solely of independentdirectors to comply with such listing standards and, in the case of the Audit Committee, with SECrules. The NYSE listing standards define specific relationships that disqualify directors from beingindependent and further require that for a director to qualify as ‘‘independent,’’ the Board mustaffirmatively determine that the director has no material relationship with Dollar General. The SEC’srules and the NYSE listing standards contain separate definitions of independence for members ofaudit committees and compensation committees, respectively.
How does the Board of Directors determine director independence?
The Board of Directors affirmatively determines the independence of each director anddirector nominee in accordance with guidelines it has adopted, which include all elements ofindependence set forth in the NYSE listing standards and SEC rules as well as certain Board-adoptedcategorical independence standards. These guidelines are contained in our Corporate GovernanceGuidelines, which are posted on the ‘‘Investor Information—Corporate Governance’’ section of ourwebsite located at www.dollargeneral.com.
The Board first considers whether any director or nominee has a relationship covered by theNYSE listing standards that would prohibit an independence finding for Board or committee purposes.The Board then analyzes any relationship of the remaining eligible directors and nominees with DollarGeneral or our management that falls outside the parameters of the Board’s separately adoptedcategorical independence standards to determine whether or not that relationship is material. TheBoard may determine that a director or nominee who has a relationship outside such parameters isnonetheless independent because the relationship is not considered to be material. Any director whohas a material relationship with Dollar General or its management is not considered to be independent.Absent special circumstances, the Board does not consider or analyze any relationship that falls withinthe parameters of the Board’s separately adopted categorical independence standards.
Are all of the directors and nominees independent?
No. Our Board of Directors consists of Warren F. Bryant, Michael M. Calbert, Sandra B.Cochran, Patricia D. Fili-Krushel, Paula A. Price, William C. Rhodes, David B. Rickard and Todd J.Vasos. Messrs. Rickard and Bryant and Mss. Cochran and Price serve on our Audit Committee,Messrs. Bryant and Rhodes and Ms. Fili-Krushel serve on our Compensation Committee, andMr. Rhodes and Mss. Cochran and Fili-Krushel serve on our Nominating Committee. Richard W.Dreiling served on our Board and as its Chairman through January 29, 2016.
Our Board has affirmatively determined that Messrs. Bryant, Calbert, Rhodes and Rickard andMss. Cochran, Fili-Krushel and Price, but not Messrs. Dreiling and Vasos, are independent from ourmanagement under both the NYSE listing standards and our additional standards. Except as describedbelow, any relationship between an independent director and Dollar General or our management fellwithin the Board-adopted categorical standards and, accordingly, was not reviewed or considered by ourBoard. The Board has also determined that the current members of the Audit Committee, theCompensation Committee and the Nominating Committee meet the independence requirements formembership on those committees set forth in the NYSE listing standards, our additional standards and,as to the Audit Committee, SEC rules.
19

Prox
y
In reaching the determination that Ms. Cochran is independent, the Board considered thatMs. Cochran’s brother, Stephen Brophy, had served as a non-executive vice president of Dollar Generalfrom 2009 until October 2015 and as a non-officer level employee since October 2015. For 2015,Mr. Brophy earned from Dollar General total cash compensation (comprised of his base salary andbonus compensation) of less than $325,000 and received an annual equity award consisting of 3,583non-qualified stock options, a target award of 433 performance share units, or ‘‘PSUs’’ (452 PSUs wereultimately earned as a result of our adjusted EBITDA and adjusted ROIC performance), and 433RSUs. In March 2016, Mr. Brophy received an annual equity award consisting of 1,958 non-qualifiedstock options, a target award of 224 PSUs, and 224 RSUs. All equity awards were granted on termsconsistent with the annual equity awards received by all Dollar General employees at the same jobgrade level as Mr. Brophy and on terms substantially similar to the forms of award agreements on filewith the SEC. We expect Mr. Brophy’s total cash compensation for 2016 to not exceed $270,000.
Mr. Brophy also is eligible to participate in employee benefits plans and programs available toour other full-time employees. Ms. Cochran does not participate in any decision-making related toMr. Brophy’s compensation or performance evaluations. Mr. Brophy’s cash compensation and equityawards were approved by the Compensation Committee pursuant to our related-party transactionsapproval policy.
20

Proxy
TRANSACTIONS WITH MANAGEMENT AND OTHERS
Does the Board of Directors have a related-party transactions approval policy?
Yes. Our Board of Directors has adopted a written policy for the review, approval orratification of ‘‘related party’’ transactions. A ‘‘related party’’ for this purpose includes our directors,director nominees, executive officers and greater than 5% shareholders, and any of their immediatefamily members, and a ‘‘transaction’’ includes one in which (1) the total amount may exceed $120,000,(2) Dollar General is a participant, and (3) a related party will have a direct or indirect materialinterest (other than as a director or a less than 10% owner of another entity, or both).
The policy requires prior Board approval for all known related party transactions, subject tocertain exceptions identified below. In addition, at least annually after receiving a list of immediatefamily members from our directors and executive officers, relevant internal departments determinewhether any transactions were unknowingly entered into with a related party and the Board ispresented with a list of such transactions, subject to certain exceptions identified below, for review. Therelated party may not participate in any discussion or approval of the transaction and must provide tothe Board all material information concerning the transaction.
Each of our Chairman and our CEO is authorized to approve a related party transaction inwhich he is not involved if the total anticipated amount is less than $1 million and he informs theBoard of the transaction. In addition, the transactions below are deemed pre-approved without Boardreview or approval:
• Transactions involving a total amount that does not exceed the greater of $1 million or 2%of the entity’s annual consolidated revenues (total consolidated assets in the case of alender) if no related party who is an individual participates in the actual provision ofservices or goods to, or negotiations with, us on the entity’s behalf or receives specialcompensation or benefit as a result.
• Charitable contributions if the total amount does not exceed 2% of the recipient’s totalannual receipts and no related party who is an individual participates in the grant decisionor receives any special compensation or benefit as a result.
• Transactions where the interest arises solely from share ownership in Dollar General andall of our shareholders receive the same benefit on a pro rata basis.
• Transactions where the rates or charges are determined by competitive bid.
• Transactions for services as a common or contract carrier or public utility at rates orcharges fixed in conformity with law or governmental authority.
• Transactions involving services as a bank depositary of funds, transfer agent, registrar,trustee under a trust indenture, or similar services.
• Compensatory transactions available on a nondiscriminatory basis to all salaried employeesgenerally, ordinary course business travel expenses and reimbursements, or compensatoryarrangements to directors, director nominees or officers that have been approved by theBoard or an authorized committee.
What related-party transactions existed in 2015 or are planned for 2016?
Other than compensation paid or to be paid during 2015 and 2016 to one of our non-executiveemployees who is a family member of Ms. Cochran, as discussed further under ‘‘DirectorIndependence’’ above, there are no transactions that have occurred since the beginning of 2015, or anycurrently proposed transactions, that involve Dollar General and exceed $120,000 and in which arelated party had or has a direct or indirect material interest.
21

Prox
y
EXECUTIVE COMPENSATION
This section provides details of the compensation for fiscal 2015 for our named executiveofficers: Todd Vasos, Chief Executive Officer; Richard Dreiling, former Chairman, Chief ExecutiveOfficer and Senior Advisor; John Garratt, Executive Vice President and Chief Financial Officer; DavidTehle, former Executive Vice President and Chief Financial Officer; John Flanigan, Executive VicePresident, Global Supply Chain; Robert Ravener, Executive Vice President and Chief People Officer;Rhonda Taylor, Executive Vice President and General Counsel; and Gregory Sparks, former ExecutiveVice President, Store Operations.
Compensation Discussion and Analysis
Overview
Our executive compensation program is designed to serve the long-term interests of ourshareholders. To deliver superior shareholder returns, we believe it is critical to offer a competitivecompensation package that will attract, retain and motivate experienced executives with the requisiteexpertise. Our program is designed to balance the short-term and long-term components and thusincent achievement of our annual and long-term business strategies, to pay for performance and tomaintain our competitive position in the market in which we compete for executive talent.
Compensation Best Practices. We strive to align our executives’ interests with those of ourshareholders and to follow sound corporate governance practices.
Compensation Practice Dollar General Policy
Pay for Performance � A significant portion of targeted direct compensationis linked to the financial performance of key metrics.All of our annual bonus compensation and asignificant majority of our equity incentivecompensation are performance based. See ‘‘Pay forPerformance.’’
Robust share ownership guidelines and � Our share ownership guidelines and holdingholding requirements requirements create further alignment with
shareholders’ long-term interests. See ‘‘ShareOwnership Guidelines and Holding Requirements.’’
No hedging or pledging Dollar General � Our policy prohibits executive officers and Boardsecurities or holding Dollar General members from hedging their ownership of our stock,securities in margin accounts pledging our securities as collateral, and holding our
securities in a margin account. See ‘‘Policy AgainstHedging and Pledging Transactions.’’
No excise tax gross-ups and minimal � We do not provide tax gross-up payments other thanincome tax gross-ups on relocation-related items.
No repricing or cash buyout of � Our equity incentive plan prohibits repricingunderwater stock options without underwater stock options, reducing the exercise priceshareholder approval of stock options or replacing awards with cash or
another award type, without shareholder approval.
Annual compensation risk assessment � At least annually, our Compensation Committeeassesses the risk of our compensation program.
Independent compensation consultant � Our Compensation Committee retains anindependent consultant to provide advice on executiveand non-employee director compensation matters.
22

Proxy
29MAR201619275050 29MAR201619275213
Pay for Performance. Consistent with our philosophy, and as illustrated below, a significantportion of annualized target total direct compensation for our named executive officers in 2015 wasperformance based and exposed to fluctuations in our stock price.
CEO Other NEOs(Average)
Salary12%
STI12%
LTI76%
Variable/At-Risk: 88%
Salary26%
STI17%
LTI57%
Variable/At-Risk: 74%
‘‘CEO’’ reflects compensation for Mr. Vasos and not Mr. Dreiling; ‘‘Other NEOs’’ reflects compensation only for the othernamed executive officers who remained employed after the end of fiscal 2015 (i.e., Messrs. Garratt, Flanigan and Ravener andMs. Taylor).STI—Short-Term Cash Incentive (Teamshare bonus program)LTI—Long-Term Equity Incentive
The following payouts were earned as a result of strong performance versus the financialtargets used for our 2015 performance-based compensation:
• Teamshare Bonus Program: Participants earned a payout under our annual Teamsharebonus program of 109.2% of the target payout level based on achieving adjusted EBIT (asdefined and calculated for purposes of the Teamshare bonus program) of $1.957 billion, or100.92% of the adjusted EBIT target (see ‘‘Short-Term Cash Incentive Plan’’).
• Performance Share Units: The awards granted in March 2015 were earned at 104.5% oftarget, based on achieving adjusted EBITDA of $2.347 billion, or 100% of the adjustedEBITDA target, and Adjusted ROIC of 19.14%, or 100.5% of the adjusted ROIC target,in each case as defined and calculated in the PSU award agreements (see ‘‘Long-TermEquity Incentive Program’’).
Significant Compensation-Related Actions. The most significant recent compensation-relatedactions pertaining to our named executive officers include:
• In March 2015, the Compensation Committee approved an employment transitionagreement and related compensation to ensure Mr. Dreiling’s smooth transition from ChiefExecutive Officer through his January 29, 2016 retirement date. See ‘‘CEO EmploymentTransition Agreement.’’
• In June 2015, Mr. Vasos was promoted from Chief Operating Officer to Chief ExecutiveOfficer (‘‘CEO’’), and the Compensation Committee approved his revised compensationpackage as discussed in more detail below.
• In December 2015, Mr. Garratt was promoted to Chief Financial Officer to fill the vacancycreated by Mr. Tehle’s retirement in July 2015, and the Compensation Committeeapproved a new compensation package for Mr. Garratt as discussed in more detail below.
23

Prox
y
• The equity awards granted in March 2016 include a ‘‘double-trigger’’ provision whichrequires a termination event within a certain period of time following a change in controlin order for vesting to accelerate in connection with the change in control.
Shareholder Response. The most recent shareholder advisory vote on our named executiveofficer compensation was held in 2014, based on the three-year frequency approved by our shareholdersin 2011. Excluding abstentions and broker non-votes, 96.0% of total votes were cast in support of theprogram. Because we viewed this outcome as overwhelmingly supportive of our compensation policiesand practices, we did not believe the vote required consideration of changes to the program. The nextshareholder advisory vote on our named executive officer compensation will be held at our 2017 annualmeeting of shareholders.
Philosophy and Objectives
We strive to attract, retain and motivate persons with superior ability, to reward outstandingperformance, and to align the long-term interests of our named executive officers with those of ourshareholders. The material compensation principles applicable to the compensation of our namedexecutive officers are outlined below:
• In determining total compensation, we consider the reasonable range of the median ofcomparable positions at companies within our market comparator group, but we makeadjustments based on circumstances, such as unique job descriptions and responsibilities aswell as our particular niche in the retail sector, that are not reflected in the market data.For competitive or other reasons, our levels of total compensation or any component ofcompensation may exceed or be below the median range of our market comparator group.
• We set base salaries to reflect the responsibilities, experience, performance andcontributions of the named executive officers and the salaries for comparable benchmarkedpositions, while maintaining an appropriate balance between base salary and incentivecompensation.
• We reward named executive officers who enhance our performance by linking cash andequity incentives to the achievement of our financial goals.
• We promote share ownership to align the interests of our named executive officers withthose of our shareholders.
• In approving compensation arrangements, we consider recent compensation history,including special or unusual compensation payments.
We have employment agreements with the named executive officers to promote executivecontinuity, aid in retention and secure valuable protections for Dollar General, such as non-compete,non-solicitation and confidentiality obligations.
Oversight and Process
Oversight. The Compensation Committee of our Board of Directors, consisting entirely ofindependent directors, determines and approves the compensation of our named executive officers.Beginning in 2016, such determination pertaining to the level of CEO compensation will be subject toratification by the independent members of the Board.
Use of Outside Advisors. The Compensation Committee has selected Meridian CompensationPartners (‘‘Meridian’’) to serve as its compensation consultant and has determined that Meridian isindependent and that its work has not raised any conflicts of interest. Meridian (or its predecessor) hasserved as the Committee’s consultant since 2007 and was re-selected in 2014 after the Committeeconducted an extensive review and request for proposal process. A Meridian representative attends
24

Proxy
Committee meetings and private sessions if the Committee requests, and Committee members are freeto consult directly with Meridian as desired.
The Committee (or its Chairman) determines the scope of Meridian’s services and hasapproved a written agreement that details the terms under which Meridian will provide independentadvice to the Committee. The approved scope generally includes availability for Committee meetingattendance and associated preparation work; assistance with risk assessment and with decision makingregarding executive and director compensation matters; advising on our Board and executive payphilosophy, compensation market comparator group, incentive plan design, emerging best practices andchanges in the regulatory environment; and providing competitive market studies. Meridian, along withmanagement, also prepares benchmarking data for consideration by the Committee in making decisionson items such as base salary, the Teamshare bonus program, and the long-term incentive program.
Management’s Role. Financial performance targets used in our incentive compensationprograms typically are derived from our annual financial plan that is prepared by our executivemanagement team and reviewed and approved by our Board of Directors. Messrs. Dreiling, Vasos andRavener and non-executive members of the human resources group provide assistance to theCompensation Committee and Meridian regarding executive compensation matters, includingconducting research, compiling data and making recommendations regarding amount, mix and programstructure alternatives, market comparator group composition and compensation-related governancepractices, as well as providing information to and coordinating with Meridian as requested, andMs. Taylor may provide legal advice to the Committee regarding executive compensation matters andcontractual arrangements from time to time. Although these recommendations may impact each ofsuch officers’ compensation to the extent they participate in the plans and programs, none of suchofficers make recommendations regarding their specific compensation. For the role of management innamed executive officers’ performance evaluations, see ‘‘Use of Performance Evaluations’’ below.Although the Committee values and solicits management’s input, it retains and exercises sole authorityto make decisions regarding named executive officer compensation.
Use of Performance Evaluations. The Compensation Committee, together with the Chairmanof the Board, assesses the performance of the CEO, and the CEO evaluates and reports to theCommittee on the performance of each of the other named executive officers, in each case versuspreviously established goals. These evaluations are subjective; no objective criteria or relative weightingis assigned to any individual goal or factor.
The Committee historically has used the overall performance rating as an eligibility thresholdfor an annual base salary increase and Teamshare bonus payment. Although an unsatisfactory ratinggenerally would preclude an annual base salary increase or a Teamshare bonus payment, performanceratings have not been used to determine the amount of the Teamshare bonus payment for a namedexecutive officer. Rather, such amount has been determined solely based upon the level of achievementof the applicable financial performance measure and the terms of the Teamshare bonus programdescribed below.
In addition to functioning as an eligibility threshold, the performance rating may impact theamount of a named executive officer’s annual base salary increase. The Committee typically starts withthe percentage base salary increase that equals the overall budgeted increase for our U.S.-basedemployee population, and considers whether adjustments are necessary to reflect performance,responsibilities or qualifications; to bring pay within a reasonable range of the market comparatorgroup; due to a change in role or duties; to achieve a better balance between base salary and incentivecompensation; or for other reasons the Committee believes justify a variance from the overall budgetedincrease.
An unsatisfactory performance rating also would result in a reduction in the number, or a totalelimination, of RSUs and stock options awarded to the named executive officer in the following year.
25

Prox
y
None of the named executive officers received an unsatisfactory performance rating for either2014 or, for those who remained employed in 2016 and therefore underwent a performance evaluation,in 2015.
Use of Market Benchmarking Data. The Compensation Committee approves, periodicallyreviews, and utilizes a market comparator group when making compensation decisions (see ‘‘Philosophyand Objectives’’). The market comparator group consists of companies selected according to theirsimilarity to our operations, services, revenues, markets, availability of information, and any otherinformation the Committee deems appropriate. Such companies are likely to have executive positionscomparable in breadth, complexity and scope of responsibility to ours.
Our market comparator group for 2015 compensation decisions consisted of:
AutoZone Family Dollar Office Depot StaplesJ.C. Penney The Gap Macy’s Ross StoresTJX Companies Kohl’s Starbucks L BrandsDollar Tree Rite Aid Yum! Brands
For each named executive officer position below CEO, the Committee biennially considersmarket comparator group data provided by Meridian. In alternating years, the Committee instead usesprior year data after applying an aging factor recommended by Meridian. Meridian annually providesmarket data for the CEO to ensure that the Committee is aware of any significant movement in CEOcompensation levels within the market comparator group. For the 2015 named executive officercompensation decisions, the Committee considered data provided by Meridian using Aon Hewitt’sdatabase for the 2015 market comparator group. For Messrs. Flanigan, Ravener and Sparks, for whominsufficient market comparator group data was available, the Committee used data from a broadergroup of retailers comprising a subset of companies included within the Aon Hewitt TotalCompensation MeasurementTM (TCM) database. A list of such companies is included as Appendix Aattached to this proxy statement. In determining the short-term cash and long-term equity targets fornamed executive officer positions below Chief Operating Officer, the Committee considers blendedmarket values for comparable positions, rather than values for individual positions, provided in the dataabove from Meridian.
Elements of Named Executive Officer Compensation
We provide compensation in the form of base salary, short-term cash incentives, long-termequity incentives, benefits and limited perquisites. We believe each of these elements is a necessarycomponent of the total compensation package and is consistent with compensation programs atcompanies with whom we compete both for business and talent.
In connection with his planned retirement on January 29, 2016, all decisions regardingMr. Dreiling’s 2015 compensation were negotiated in connection with his employment transitionagreement. Accordingly, with certain exceptions that are specifically identified, the discussion below of2015 compensation decisions and related actions excludes those pertaining to Mr. Dreiling, which areinstead discussed under ‘‘CEO Employment Transition Agreement’’ below.
In addition, each of Messrs. Vasos and Garratt received compensation adjustments during theyear as a result of their promotions. To determine such compensation adjustments, the CompensationCommittee evaluated the appropriate level of total compensation as well as the appropriate level andmix of compensation elements considering the market comparator group data and each such officer’slevel of experience and qualifications and recent compensation. In addition, for Mr. Garratt’sshort-term and long-term incentive compensation, the Committee considered the target levelsapplicable to our other executive vice presidents. The resulting promotion-related adjustments are setforth in the discussion below.
26

Proxy
Base Salary. Base salary promotes our recruiting and retention objectives by reflecting thesalaries for comparable positions in the competitive marketplace, rewarding strong performance, andproviding a stable and predictable income source for our executives. Our employment agreements withthe named executive officers set forth minimum base salary levels, but the Compensation Committeeretains sole discretion to increase these levels from time to time.
(a) Routine Salary Adjustments. Our Compensation Committee routinely considers annualbase salary adjustments in March. In light of the market benchmarking data and each named executiveofficer’s 2014 satisfactory performance rating, all such officers received the 2.95% base salary increasethat was budgeted for our U.S. based employee population. Ms. Taylor, who was promoted to ExecutiveVice President in March 2015, received an additional 13.72% base salary increase (for a totaladjustment of 16.67%) in recognition of her role and to maintain her total compensation within areasonable range of the market median for her new position, and Mr. Garratt, who served as SeniorVice President at the time, received an additional 0.29% base salary increase (for a total adjustment of3.24%) in further recognition of his 2014 performance (see ‘‘Use of Performance Evaluations’’ and‘‘Use of Market Benchmarking Data’’). The Committee chose to forego any adjustments beyond the2.95% increase to Mr. Vasos’s base salary until it was determined whether he would succeedMr. Dreiling as CEO.
(b) Non-Routine Salary Adjustments. As a result of the evaluations discussed abovepertaining to their promotions, Mr. Vasos received a salary increase from $791,042 to $1,000,000 andMr. Garratt received a salary increase from $309,708 to $500,000, in each case effective upon theapplicable promotion date and to reflect his new role and expanded responsibilities and to providecompensation that was more appropriately aligned with the market comparator group data for his newrole.
Short-Term Cash Incentive Plan. Our short-term cash incentive plan, called Teamshare, isestablished under our shareholder-approved Amended and Restated Annual Incentive Plan. TheTeamshare program provides an opportunity to receive a cash bonus payment equal to a certainpercentage of base salary based upon Dollar General’s achievement of one or more pre-establishedfinancial performance targets. Accordingly, Teamshare fulfills an important part of our pay forperformance philosophy while aligning the interests of our named executive officers and ourshareholders.
(a) 2015 Teamshare Structure. The Compensation Committee uses adjusted EBIT as theTeamshare financial performance measure because it is a comprehensive measure of our corporateperformance and so is aligned with our shareholders’ interests. For purposes of the 2015 Teamshareprogram, adjusted EBIT is defined as our operating profit as calculated in accordance with U.S.generally accepted accounting principles, but excludes:
• the impact of (a) costs, fees and expenses directly related to consideration, negotiation,preparation, or consummation of any transaction that results in a Change in Control(within the meaning of our Amended and Restated 2007 Stock Incentive Plan) or to anysecurities offering; (b) gain or loss recognized as a result of any derivative instrumenttransactions or hedging activities; (c) gains or losses associated with any early retirement ofdebt; (d) charges resulting from significant natural disasters; and (e) any significant gainsor losses associated with our LIFO computation; and
• unless disallowed by the Committee, (a) non-cash asset impairments; (b) any significantloss as a result of an individual litigation, judgment or lawsuit settlement; (c) charges forbusiness restructurings; (d) losses due to new or modified tax, legislation or accountingchanges enacted after the start of fiscal 2015; (e) significant tax settlements; and (f) anysignificant unplanned items of a non-recurring or extraordinary nature.
27

Prox
y
The Committee used our 2015 annual financial plan adjusted EBIT target of $1.939 billion asthe target for the 2015 Teamshare program and retained the threshold (below which no bonus may beearned) and maximum (above which no further bonus may be earned) performance levels at 90% and120% of the target level, respectively. These threshold and maximum performance levels had been usedin the prior year Teamshare program to more closely reflect the practices of our market comparatorgroup. Payouts for financial performance are based on actual results and are interpolated on astraight-line basis between threshold and target and between target and maximum.
The bonus payable to each named executive officer upon achieving the target level of financialperformance is equal to the applicable percentage of base salary shown in the table below. The targetpayout percentage of salary for Mr. Vasos was increased from 80% to 100% and for each ofMr. Garratt and Ms. Taylor from 50% to 65% in connection with their promotions. Except for thepromotion-related decisions, these percentages for each named executive officer remained unchangedfrom those in effect at the end of the prior year based on the Committee’s review of the marketcomparator group data. The promotion-related decisions for Messrs. Vasos and Garratt weredetermined as a result of the evaluations discussed above.
Target % ofName Base Salary*
Mr. Vasos 80/100Mr. Garratt/Ms. Taylor 50/65All other named executive officers 65
* Percentages for Messrs. Vasos and Garratt and Ms. Taylor are those in effect for each position heldduring 2015. The actual payout for each such officer is pro-rated for time in each position held during2015. For all named executive officers, payout percentages at the threshold and maximum performancelevels would be calculated at 50% and 300%, respectively, of the applicable target percentage of basesalary.
(b) 2015 Teamshare Results. The Compensation Committee certified the adjusted EBITperformance result at $1.957 billion (100.92% of target) resulting in 2015 Teamshare payouts to each ofMessrs. Vasos, Garratt, Flanigan and Ravener and Ms. Taylor of 109.2% of the target percentages setforth in the table above. Such amounts are reflected in the ‘‘Non-Equity Incentive Plan Compensation’’column of the Summary Compensation Table. Messrs. Tehle and Sparks were ineligible to receive apayout under the terms of the Teamshare program because they were not employed with us on thepayment date.
Long-Term Equity Incentive Program. Long-term equity incentives are an important part of ourpay for performance philosophy and are designed to motivate named executive officers to focus onlong-term success for shareholders while rewarding them for a long-term commitment to us. TheCompensation Committee considers annual equity awards each March at its regular quarterly meetingand considers special equity awards as necessary in connection with one-time events such as a new hireor promotion. Equity awards are made under our shareholder-approved Amended and Restated 2007Stock Incentive Plan.
(a) 2015 Annual Equity Awards. Each year, the Compensation Committee determines atargeted equity award value for each named executive officer derived from benchmarking informationand the appropriate mix of vehicles in which to deliver such targeted value (see ‘‘Use of MarketBenchmarking Data’’). In 2015, the targeted value for each named executive officer was unchangedfrom the prior year based on the Committee’s review of the market comparator group data and, forMr. Vasos, a decision to defer consideration of any increase until it was determined whether he wouldsucceed Mr. Dreiling as CEO. In addition, as in the prior year, the targeted value was delivered 50% inoptions, 25% in PSUs and 25% in RSUs, which the Committee previously determined appropriately
28
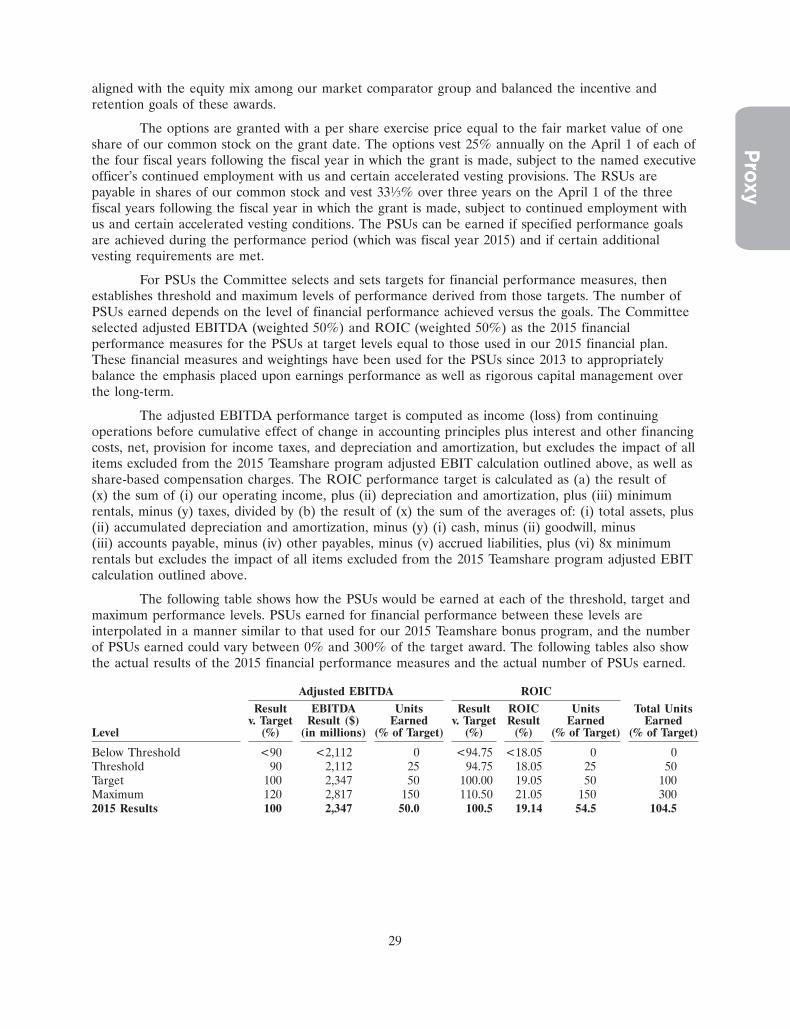
Proxy
aligned with the equity mix among our market comparator group and balanced the incentive andretention goals of these awards.
The options are granted with a per share exercise price equal to the fair market value of oneshare of our common stock on the grant date. The options vest 25% annually on the April 1 of each ofthe four fiscal years following the fiscal year in which the grant is made, subject to the named executiveofficer’s continued employment with us and certain accelerated vesting provisions. The RSUs arepayable in shares of our common stock and vest 331⁄3% over three years on the April 1 of the threefiscal years following the fiscal year in which the grant is made, subject to continued employment withus and certain accelerated vesting conditions. The PSUs can be earned if specified performance goalsare achieved during the performance period (which was fiscal year 2015) and if certain additionalvesting requirements are met.
For PSUs the Committee selects and sets targets for financial performance measures, thenestablishes threshold and maximum levels of performance derived from those targets. The number ofPSUs earned depends on the level of financial performance achieved versus the goals. The Committeeselected adjusted EBITDA (weighted 50%) and ROIC (weighted 50%) as the 2015 financialperformance measures for the PSUs at target levels equal to those used in our 2015 financial plan.These financial measures and weightings have been used for the PSUs since 2013 to appropriatelybalance the emphasis placed upon earnings performance as well as rigorous capital management overthe long-term.
The adjusted EBITDA performance target is computed as income (loss) from continuingoperations before cumulative effect of change in accounting principles plus interest and other financingcosts, net, provision for income taxes, and depreciation and amortization, but excludes the impact of allitems excluded from the 2015 Teamshare program adjusted EBIT calculation outlined above, as well asshare-based compensation charges. The ROIC performance target is calculated as (a) the result of(x) the sum of (i) our operating income, plus (ii) depreciation and amortization, plus (iii) minimumrentals, minus (y) taxes, divided by (b) the result of (x) the sum of the averages of: (i) total assets, plus(ii) accumulated depreciation and amortization, minus (y) (i) cash, minus (ii) goodwill, minus(iii) accounts payable, minus (iv) other payables, minus (v) accrued liabilities, plus (vi) 8x minimumrentals but excludes the impact of all items excluded from the 2015 Teamshare program adjusted EBITcalculation outlined above.
The following table shows how the PSUs would be earned at each of the threshold, target andmaximum performance levels. PSUs earned for financial performance between these levels areinterpolated in a manner similar to that used for our 2015 Teamshare bonus program, and the numberof PSUs earned could vary between 0% and 300% of the target award. The following tables also showthe actual results of the 2015 financial performance measures and the actual number of PSUs earned.
Adjusted EBITDA ROICResult EBITDA Units Result ROIC Units Total Units
v. Target Result ($) Earned v. Target Result Earned EarnedLevel (%) (in millions) (% of Target) (%) (%) (% of Target) (% of Target)
Below Threshold <90 <2,112 0 <94.75 <18.05 0 0Threshold 90 2,112 25 94.75 18.05 25 50Target 100 2,347 50 100.00 19.05 50 100Maximum 120 2,817 150 110.50 21.05 150 3002015 Results 100 2,347 50.0 100.5 19.14 54.5 104.5
29

Prox
y
Name 2015 PSUs Earned
Mr. Vasos 5,650Mr. Tehle* 0Mr. Garratt 1,261Mr. Flanigan 4,143Mr. Ravener 4,143Ms. Taylor 4,143Mr. Sparks* 0
* Messrs. Tehle and Sparks forfeited the 2015 PSUs upon leaving Dollar General.
One-third of the earned PSUs vested on the last day of the one-year performance period, andthe remaining two-thirds will vest equally on each of April 1, 2017 and April 1, 2018, subject to thenamed executive officer’s continued employment with us and certain accelerated vesting provisions. Allvested PSUs will be settled in shares of our common stock.
(b) 2015 Special Equity Awards. In recognition of their new roles and increasedresponsibilities, and considering the market comparator group data in light of their experience andqualifications (see ‘‘Use of Market Benchmarking Data’’), the Compensation Committee approvedspecial equity awards to each of Messrs. Vasos and Garratt.
Upon his promotion to CEO, Mr. Vasos received an award of non-qualified stock optionshaving an approximate value of $5 million to purchase 256,682 shares of our common stock. Subject tocertain limited vesting acceleration events, such options are scheduled to vest ratably in installments of331⁄3% on each of the third, fourth and fifth anniversaries of the June 3, 2015 grant date, subject toMr. Vasos’ continued employment with us and holding requirements through the fifth anniversary ofthe grant date. The options will terminate no later than ten years from the grant date.
Upon his promotion to Chief Financial Officer, Mr. Garratt received an award of non-qualifiedstock options having an approximate value of $124,000 to purchase 7,829 shares of our common stock.Subject to certain limited vesting acceleration events, such options are scheduled to vest ratably ininstallments of 25% on each of the first four anniversaries of the December 2, 2015 grant date, subjectto Mr. Garratt’s continued employment with us. The options will terminate no later than ten yearsfrom the grant date.
(c) 2012 Performance-Based Restricted Stock Award. In March 2012 the CompensationCommittee awarded Mr. Dreiling 326,037 performance-based restricted shares of our common stockwhich could be earned by achieving certain earnings per share (‘‘EPS’’) performance targets for fiscalyears 2014 and 2015, subject to certain adjustments, derived from our long-term financial plan on thegrant date. As previously disclosed, half of the award vested after the end of our 2014 fiscal year as aresult of meeting the financial target. Mr. Dreiling forfeited the remaining half as a result of hisretirement prior to the 2015 adjusted EPS certification date.
(d) Share Ownership Guidelines and Holding Requirements. As shown below, we haveadopted share ownership guidelines and holding requirements for senior officers. The share ownershipguideline is a multiple of annual base salary as in effect on April 1, 2013 (or, if later, the hire orpromotion date). The ownership levels are to be achieved within 5 years of the later of April 1, 2013 orthe April 1 next following such person’s hire or promotion date.
Officer Level Multiple of Base Salary
CEO 5XEVP 3XSVP 2X
30
Proxy
Each senior officer is required to retain ownership of 50% of all net after-tax shares acquiredfrom Dollar General until he or she reaches the target ownership level. Administrative detailspertaining to these matters are established by the Compensation Committee.
(e) Policy Against Hedging and Pledging Transactions. Our policy prohibits Board membersand executive officers from (1) pledging Dollar General securities as collateral, (2) holding DollarGeneral securities in a margin account, and (3) hedging their ownership of Dollar General stock, suchas entering into or trading prepaid variable forward contracts, equity swaps, collars, puts, calls, options(other than those granted by us) or other derivative instruments related to Dollar General stock.
Benefits and Perquisites. Our named executive officers participate in certain benefits on thesame terms that are offered to all of our salaried employees. We also provide them with limitedadditional benefits and perquisites for retention and recruiting purposes, to replace benefitopportunities lost due to regulatory limits, and to enhance their ability to focus on our business. We donot provide tax gross-up payments on any benefits and perquisites other than relocation-related items.The primary additional benefits and perquisites include the following:
• We provide a Compensation Deferral Plan (the ‘‘CDP’’) and, for named executive officershired or promoted prior to May 28, 2008, a defined contribution Supplemental ExecutiveRetirement Plan (the ‘‘SERP,’’ and together with the CDP, the ‘‘CDP/SERP Plan’’).
• We pay the premiums for a life insurance benefit equal to 2.5 times base salary up to amaximum of $3 million.
• We pay administrative fees for short-term disability coverage, which provides incomereplacement of up to 70% of monthly base salary in the case of a short-term disability. Wealso pay the premiums under a group long-term disability plan, which provides 60% ofbase salary up to a maximum of $400,000.
• We provide a relocation assistance program under a policy applicable to officer-levelemployees.
• We provide personal financial and estate planning and tax preparation services through athird party.
CEO Employment Transition Agreement. As previously disclosed, Mr. Dreiling retired onJanuary 29, 2016 (the ‘‘Retirement Date’’). In light of his announced retirement plans, theCompensation Committee did not undertake performance reviews for Mr. Dreiling for 2014 or 2015,but rather deemed his performance to be satisfactory and determined his 2015 compensation as part ofour negotiated employment transition agreement with him, effective March 10, 2015. The terms of theemployment transition agreement were negotiated to secure Mr. Dreiling’s services through theRetirement Date and ensure a smooth transition to his successor, and we believe the employmenttransition agreement successfully achieved those goals. Mr. Dreiling served as our CEO until weappointed Mr. Vasos as his successor. Thereafter, Mr. Dreiling served as Senior Advisor and as amember and Chairman of the Board through the Retirement Date. Mr. Dreiling remains subject to thebusiness protections contained in the employment transition agreement, including non-competition andnon-solicitation provisions, for two years following the Retirement Date.
Pursuant to the employment transition agreement:
• Mr. Dreiling received the same 2.95% base salary increase in 2015 that was budgeted forour entire U.S.-based employee population.
• Mr. Dreiling participated in the 2015 Teamshare program at the same threshold (50% oftarget), target (130%) and maximum (300% of target) base salary percentage levels as theprior year, and we waived the requirement to be employed on the payment date. As
31

Prox
y
discussed above, the Committee certified the adjusted EBIT performance result at$1.957 billion (100.92% of target) resulting in a 2015 Teamshare payout to Mr. Dreiling of109.2% of his 130% target.
• In lieu of receiving an annual equity award in 2015 under our long-term incentive program,Mr. Dreiling instead was awarded 57,670 RSUs, with an approximate value of $4 million(the ‘‘Transition RSU Award’’).
• Mr. Dreiling retained coverage through the Retirement Date under all employee benefitplans and was entitled to all welfare, fringe and other benefits and perquisites that wereavailable to all of our other executives.
• Mr. Dreiling was entitled to limited additional perquisites, including reimbursement for upto $15,000 of legal expenses for review of the employment transition agreement (which hedid not use), payment of the premiums on his portable long-term disability insurancethrough the Retirement Date, and personal use of our corporate airplane for his and hisspouse’s travel between Nashville, Tennessee, and Livermore, California, while hecontinued to serve as CEO, limited to no more than 100 hours total and 16 hours permonth.
• Mr. Dreiling’s outstanding equity awards will continue to vest, if at all, in accordance withthe terms of the applicable award agreements.
The Transition RSU Award is a time-based award that vested in full as of the RetirementDate. Fifty percent of the award was paid on the first anniversary of the grant date and the remaining50% will be paid on the second anniversary of the grant date, subject to accelerated payment in theevent of death or disability or a change in control prior to a payment date, in each case as defined inthe award agreement. The Transition RSU Award is payable in an equal number of shares of DollarGeneral common stock, subject to reduction, cancellation, forfeiture or recoupment, in whole or inpart, upon various events specified in the award agreement, including but not limited to the breach ofthe business protection provisions set forth in the employment transition agreement.
Severance Arrangements
As noted above, we have an employment agreement with each of our named executive officersand an employment transition agreement with Mr. Dreiling that, among other things, provide for suchexecutive’s rights upon a termination of employment in exchange for valuable business protectionprovisions for us. We believe that reasonable severance benefits are appropriate to protect the namedexecutive officer against circumstances over which he or she does not have control and as considerationfor the promises of non-disclosure, non-competition, non-solicitation and non-interference that werequire in our employment agreements. A change in control, by itself (‘‘single trigger’’), does nottrigger any severance provision applicable to our named executive officers, except for the provisionsrelated to outstanding long-term equity awards granted prior to 2016. The 2016 annual equity awardsdo not provide for single trigger vesting acceleration but rather require a termination event within acertain period of time following a change in control to accelerate vesting of such equity awards.
As discussed elsewhere in this proxy statement, Messrs. Dreiling, Tehle and Sparks left DollarGeneral in fiscal 2015. Payments and other benefits to each such former officer in connection withthese employment separations are itemized under ‘‘Potential Payments upon Termination or Change inControl as of January 29, 2016’’ below.
32

Proxy
Considerations Associated with Regulatory Requirements
Under Section 162(m) of the Internal Revenue Code, we generally may not take a taxdeduction for individual compensation over $1 million paid in any taxable year to each of the personswho were, at the end of the fiscal year, our CEO or one of the other named executive officers (otherthan our Chief Financial Officer). As a result, we may not deduct any salary, signing bonus or otherannual compensation paid or imputed to such covered officers that causes non-performance-basedcompensation to exceed the $1 million limit. Certain performance-based compensation is exempt fromthe deduction limit.
We believe that our Amended and Restated 2007 Stock Incentive Plan and our Amended andRestated Annual Incentive Plan currently satisfy the requirements of Section 162(m). As a result, wemay deduct compensation expense realized in connection with any (1) payments made under ourTeamshare program, (2) stock options and stock appreciation rights, and (3) performance-basedrestricted stock and RSU awards. However, restricted stock or RSUs that solely vest over time are not‘‘performance-based compensation’’ under Section 162(m), and we will be unable to deductcompensation expense realized in connection with those time-vested awards to persons covered bySection 162(m) to the extent their non-performance-based compensation exceeds $1 million. Ourpolicies do not restrict the Compensation Committee from exercising discretion to approvecompensation packages that may result in certain non-deductible compensation expenses but that theCommittee nonetheless determines to be in our shareholders’ best interests.
The Committee administers our executive compensation program with the good faith intentionof complying with Section 409A of the Internal Revenue Code, which relates to the taxation ofnonqualified deferred compensation arrangements.
Compensation Committee Report
The Compensation Committee of our Board of Directors reviewed and discussed withmanagement the Compensation Discussion and Analysis required by Item 402(b) of Regulation S-Kand, based on such review and discussions, the Compensation Committee recommended to the Boardthat the Compensation Discussion and Analysis be included in this document.
This report has been furnished by the members of the Compensation Committee:
• Warren F. Bryant, Chairman
• Patricia D. Fili-Krushel
• William C. Rhodes, III
The above Compensation Committee Report does not constitute soliciting material and should notbe deemed filed or incorporated by reference into any other Dollar General filing under the Securities Act of1933 or the Securities Exchange Act of 1934, except to the extent Dollar General specifically incorporatesthis report by reference therein.
33

Prox
y
Summary Compensation Table
The following table summarizes compensation paid to or earned by our named executiveofficers in each of the 2015, 2014 and 2013 fiscal years. We have omitted from this table the columnsfor Bonus and Change in Pension Value and Nonqualified Deferred Compensation Earnings becausethey are inapplicable.
Non-EquityIncentive
Stock Option Plan All OtherSalary Awards Awards Compensation Compensation Total
Name and Principal Position(1) Year ($)(2) ($)(3) ($)(4) ($)(5) ($) ($)
Todd J. Vasos, 2015 926,605 808,022 5,932,285 956,548 99,541(6) 8,723,001Chief Executive Officer 2014 765,342 821,048 653,913 521,486 67,422 2,829,211
2013 699,549 625,574 422,846 — 72,464 1,820,433
Richard W. Dreiling, 2015 1,361,760 4,309,102 — 1,942,422 604,587(7) 8,217,871Former Chairman, 2014 1,323,789 3,503,208 2,790,016 1,465,747 681,392 9,764,152Chief Executive Officer & 2013 1,291,515 3,440,634 2,059,459 — 855,567 7,647,175Senior Advisor
John W. Garratt, 2015 339,405 180,374 303,694 199,223 66,150(8) 1,088,846Executive Vice President &Chief Financial Officer
David M. Tehle, 2015 309,572 592,530 599,657 — 32,819(9) 1,534,578Former Executive Vice President & 2014 727,140 602,090 479,529 402,558 136,438 2,347,755Chief Financial Officer 2013 709,413 625,574 374,452 — 172,598 1,882,037
John W. Flanigan, 2015 477,339 592,530 599,657 340,439 101,901(10) 2,111,866Executive Vice President, 2014 464,029 602,090 479,529 256,895 86,989 1,889,532Global Supply Chain 2013 452,716 625,574 374,452 — 105,319 1,558,061
Robert D. Ravener, 2015 521,999 592,530 599,657 372,291 50,700(11) 2,137,177Executive Vice President &Chief People Officer
Rhonda M. Taylor, 2015 515,645 592,530 599,657 362,026 66,702(12) 2,136,560Executive Vice President &General Counsel
Gregory A. Sparks, 2015 233,567 592,530 599,657 — 823,980(13) 2,249,734Former Executive Vice President, 2014 635,676 602,090 479,529 351,922 56,960 2,126,177Store Operations 2013 620,178 625,574 374,452 — 300,228 1,920,432
(1) Mr. Vasos served as Executive Vice President, Division President and Chief Merchandising Officer until November 2013when he was promoted to Chief Operating Officer, then served in that position until his promotion to CEO in June 2015.Mr. Dreiling served as Chairman and CEO until June 2015 and then as Chairman and Senior Advisor until his retirementon January 29, 2016. Mr. Garratt joined Dollar General in October 2014 and served as Senior Vice President, Finance andStrategy, until July 2015 when he assumed the role of interim Chief Financial Officer. He was promoted to Executive VicePresident and Chief Financial Officer in December 2015. He was not a named executive officer for 2014. Mr. Tehle servedas Executive Vice President and Chief Financial Officer until his departure on June 30, 2015. Mr. Ravener and Ms. Taylorjoined Dollar General in August 2008 and March 2000, respectively, but were not named executive officers for 2014 or2013. Mr. Sparks served as Executive Vice President, Store Operations, until his departure on June 9, 2015.
(2) Each named executive officer deferred under the CDP and contributed to our 401(k) Plan a portion of salary earned ineach of the fiscal years for which salaries are reported above for the applicable named executive officer. The amounts ofthe fiscal 2015 salary deferrals under the CDP are included in the Nonqualified Deferred Compensation Table.
(3) The amounts reported represent the respective aggregate grant date fair value of PSUs and RSUs awarded in each fiscalyear for which compensation is required to be reported in the table for each named executive officer, in each casecomputed in accordance with FASB ASC Topic 718. The PSUs are subject to performance conditions, and the reportedvalue at the grant date is based upon the probable outcome of such conditions on such date. The values of the PSUs at the
34

Proxy
grant date assuming that the highest level of performance conditions will be achieved are as follows for each fiscal yearrequired to be reported for each applicable named executive officer:
Fiscal Mr. Vasos Mr. Dreiling Mr. Garratt Mr. Tehle Mr. Flanigan Mr. Ravener Ms. Taylor Mr. SparksYear ($) ($) ($) ($) ($) ($) ($) ($)
2015 1,212,033 N/A 270,561 888,794 888,794 888,794 888,794 888,7942014 1,234,699 5,268,189 N/A 905,481 905,481 N/A N/A 905,4812013 623,987 3,431,879 N/A 623,987 623,987 N/A N/A 623,987
Information regarding the assumptions made in the valuation of these awards is set forth in Note 10 of the annualconsolidated financial statements in our 2015 Form 10-K.
(4) The amounts reported represent the respective aggregate grant date fair value of stock options awarded to the applicablenamed executive officer in the fiscal year indicated, computed in accordance with FASB ASC Topic 718. Informationregarding assumptions made in the valuation of these awards is set forth in Note 10 of the annual consolidated financialstatements in our 2015 Form 10-K.
(5) Represents amounts earned pursuant to our Teamshare bonus program for each fiscal year reported. See the discussion ofthe ‘‘Short-Term Cash Incentive Plan’’ and ‘‘CEO Employment Transition Agreement’’ in ‘‘Compensation Discussion andAnalysis’’ above. None of the named executive officers deferred any portion of the Teamshare bonus payments reportedabove under the CDP.
(6) Includes $32,115 and $14,167, respectively, for our match contributions to the CDP and the 401(k) Plan; $1,306 forpremiums paid under our life insurance program; and $51,953 which represents the aggregate incremental cost of providingcertain perquisites, including $21,470 for personal security services for a limited duration, $19,514 for financial and estateplanning services, $5,000 for the reimbursement of legal expenses incurred in connection with the negotiation of hisemployment agreement and other amounts for perquisites which individually did not equal or exceed the greater of $25,000or 10% of total perquisites, including premiums paid under our group long-term disability program, costs associated withattendance by him and his guests at sporting events, miscellaneous gifts, nominal incremental costs incurred for a guest toaccompany him on business and an administrative fee for coverage under our short-term disability program, as well asparticipation in a group umbrella liability insurance program offered at no incremental cost to Dollar General through athird party vendor at a group rate paid by the executive and coverage under our business travel accident insurance forwhich Dollar General incurs no incremental cost for participation by the named executive officers in addition to certainother employees.
(7) Includes $268,303 for our contribution to the SERP and $54,675 and $13,690, respectively, for our match contributions tothe CDP and the 401(k) Plan; $1,692 for premiums paid under our life insurance program; $143,456 for cash dividendsaccumulated on shares of unvested restricted stock that were ultimately forfeited with the shares of unvested restrictedstock upon Mr. Dreiling’s retirement; and $122,771 which represents the aggregate incremental cost of providing certainperquisites, including $79,539 for costs associated with personal airplane usage, $19,437 for costs associated with financialand estate planning services, $12,118 for a retirement gift, $8,417 for premiums paid under a personal portable long-termdisability policy, and other amounts for perquisites which individually did not equal or exceed the greater of $25,000 or10% of total perquisites, including premiums paid under our group long-term disability program, costs associated withattendance by him and his guests at sporting events, miscellaneous gifts and an administrative fee for coverage under ourshort-term disability program, as well as participation in a group umbrella liability insurance program which is offered at noincremental cost to Dollar General through a third party vendor at a group rate paid by the executive and coverage underour business travel accident insurance for which Dollar General incurs no incremental cost for participation by the namedexecutive officers in addition to certain other employees. The aggregate incremental cost related to the personal airplaneusage was calculated using costs we would not have incurred but for the personal usage (including costs incurred as a resultof ‘‘deadhead’’ legs of personal flights), including fuel costs, variable maintenance costs, crew expenses, landing, parking andother associated fees, supplies and catering costs.
(8) Includes $1,979 for our match contributions to the 401(k) Plan; $7,080 for tax gross-ups related to relocation; $478 forpremiums paid under our life insurance program; and $56,613 which represents the aggregate incremental cost of providingcertain perquisites, including $53,672 for costs associated with relocation and other amounts for perquisites whichindividually did not equal or exceed the greater of $25,000 or 10% of total perquisites, including premiums paid under ourgroup long-term disability program, costs associated with attendance by him and his guests at sporting events, miscellaneousgifts and an administrative fee for coverage under our short-term disability program, as well as coverage under our businesstravel accident insurance for which Dollar General incurs no incremental cost for participation by the named executiveofficers in addition to certain other employees. The aggregate incremental cost related to relocation included expensesassociated with physical movement of his household goods and costs incurred in connection with the sale of his formerhome (such as appraisals, inspections, pre-title expenses, title and deed costs, broker’s commission, document preparationfees, recording fees and legal fees) and the purchase of his new home (including a one percent origination fee).
35

Prox
y
(9) Includes $5,270 and $10,289, respectively, for our match contributions to the CDP and the 401(k) Plan; $437 for premiumspaid under our life insurance program; and $16,823 which represents the aggregate incremental cost of providing certainperquisites, including $8,115 for financial and estate planning services, $8,200 for a retirement gift and other amounts forperquisites which individually did not equal or exceed the greater of $25,000 or 10% of total perquisites, includingpremiums paid under our group long-term disability program, miscellaneous gifts and an administrative fee for coverageunder our short-term disability program, as well as participation in a group umbrella liability insurance program offered atno incremental cost to Dollar General through a third party vendor at a group rate paid by the executive and coverageunder our business travel accident insurance for which Dollar General incurs no incremental cost for participation by thenamed executive officers in addition to certain other employees.
(10) Includes $54,982 for our contribution to the SERP and $10,560 and $13,404, respectively, for our match contributions to theCDP and the 401(k) Plan; $673 for premiums paid under our life insurance program; and $22,282 which represents theaggregate incremental cost of providing certain perquisites, including $19,514 for financial and estate planning services andother amounts for perquisites which individually did not equal or exceed the greater of $25,000 or 10% of total perquisites,including premiums paid under our group long-term disability program, a directed donation to charity, costs associated withattendance by him and his guests at sporting events, miscellaneous gifts and an administrative fee for coverage under ourshort-term disability program, as well as participation in a group umbrella liability insurance program offered at noincremental cost to Dollar General through a third party vendor at a group rate paid by the executive and coverage underour business travel accident insurance for which Dollar General incurs no incremental cost for participation by the namedexecutive officers in addition to certain other employees.
(11) Includes $12,787 and $13,309, respectively, for our match contributions to the CDP and the 401(k) Plan; $737 for premiumspaid under our life insurance program; and $23,867 which represents the aggregate incremental cost of providing certainperquisites, including $19,514 for financial and estate planning services and other amounts for perquisites which individuallydid not equal or exceed the greater of $25,000 or 10% of total perquisites, including premiums paid under our grouplong-term disability program, an executive physical, costs associated with attendance by him and his guests at sportingevents, miscellaneous gifts, nominal incremental costs incurred for his spouse to accompany him on business and anadministrative fee for coverage under our short-term disability program, as well as participation in a group umbrella liabilityinsurance program offered at no incremental cost to Dollar General through a third party vendor at a group rate paid bythe executive and coverage under our business travel accident insurance for which Dollar General incurs no incrementalcost for participation by the named executive officers in addition to certain other employees.
(12) Includes $52,521 for our contribution to the SERP and $13,453 for our match contributions to the 401(k) Plan; and $728for premiums paid under our life insurance program. Perquisites and personal benefits totaled less than $10,000 andaccordingly are not included in the table.
(13) Includes $1,088 and $10,724, respectively, for our match contributions to the CDP and the 401(k) Plan; $305 for premiumspaid under our life insurance program; $811,863 earned or paid for fiscal 2015 in connection with his departure from DollarGeneral equal to the sum of: (i) $420,326 representing the earned portion of the salary continuation payments, (ii) $362,303representing two times the average percentage of his target bonus paid or to be paid to employees at the same job gradelevel under the annual bonus program for officers for the two fiscal years immediately preceding fiscal 2015, (iii) $19,234representing two times our annual contribution for his participation in our pharmacy, medical, dental and vision benefitsprograms and (iv) $10,000 for outplacement services. See ‘‘Potential Payments upon Termination or Change in Control’’below. Perquisites and personal benefits totaled less than $10,000 and accordingly are not included in the table.
36

Proxy
Grants of Plan-Based Awards in Fiscal 2015
The table below shows each named executive officer’s fiscal 2015 Teamshare bonus opportunityunder ‘‘Estimated Possible Payouts Under Non-Equity Incentive Plan Awards.’’ Actual bonus amountsearned by such officers under the fiscal 2015 Teamshare program are shown in the SummaryCompensation Table and, for those who received such payments, represent prorated payment on agraduated scale for financial performance between the target and maximum performance levels. See‘‘Short-Term Cash Incentive Plan’’ in ‘‘Compensation Discussion and Analysis’’ for discussion of suchTeamshare program.
The table below also shows information regarding equity awards made to our named executiveofficers for fiscal 2015, all of which were granted pursuant to our Amended and Restated 2007 StockIncentive Plan. The awards listed under ‘‘Estimated Possible Payouts Under Equity Incentive PlanAwards’’ include the threshold, target and maximum number of PSUs which could be earned by eachapplicable named executive officer based upon the level of achievement of fiscal 2015 financialperformance measures. The awards listed under ‘‘All Other Stock Awards’’ represent RSUs payable inshares of common stock on a one-for-one basis that vest over time, and the awards listed under ‘‘AllOther Option Awards’’ include non-qualified stock options that vest over time, in each case based uponthe applicable named executive officer’s continued employment by Dollar General. See ‘‘Long-TermEquity Incentive Program’’ and ‘‘CEO Employment Transition Agreement’’ in ‘‘CompensationDiscussion and Analysis’’ above for further discussion of these awards.
All Other All OtherStock Option Grant
Awards: Awards: Exercise Date FairNumber Number of or Base Value ofEstimated Possible Payouts Under Estimated Possible Payouts Under
of Shares Securities Price of Stock andNon-Equity Incentive Plan Awards Equity Incentive Plan AwardsDate of of Stock Underlying Option Option
Grant Committee Threshold Target Maximum Threshold Target Maximum or Units Options Awards AwardsName Date Action ($) ($) ($) (#) (#) (#) (#) (#) ($/Sh)(1) ($)(2)
Mr. Vasos — — 437,965 875,930 2,627,790 — — — — — — —3/17/15 3/17/15 — — — — — — — 44,786 74.72 817,7163/17/15 3/17/15 — — — — — — 5,407 — — 404,0113/17/15 3/17/15 — — — 2,704 5,407 16,221 — — — 404,011
6/3/15 5/27/15 — — — — — — — 256,682 76.00 5,114,569
Mr. Dreiling — — 889,357 1,778,715 5,336,144 — — — — — — —3/17/15 3/17/15 — — — — — — 57,670 — — 4,309,102
Mr. Garratt — — 91,216 182,433 547,298 — — — — — — —3/17/15 3/17/15 — — — — — — — 10,002 74.72 182,6203/17/15 3/17/15 — — — — — — 1,207 — — 90,1873/17/15 3/17/15 — — — 604 1,207 3,621 — — — 90,18712/2/15 12/1/15 — — — — — — — 7,829 65.35 121,075
Mr. Tehle — — 244,256 488,513 1,465,538 — — — — — — —3/17/15 3/17/15 — — — — — — — 32,843 74.72 599,6573/17/15 3/17/15 — — — — — — 3,965 — — 296,2653/17/15 3/17/15 — — — 1,983 3,965 11,895 — — — 296,265
Mr. Flanigan — — 155,874 311,747 935,241 — — — — — — —3/17/15 3/17/15 — — — — — — — 32,843 74.72 599,6573/17/15 3/17/15 — — — — — — 3,965 — — 296,2653/17/15 3/17/15 — — — 1,983 3,965 11,895 — — — 296,265
Mr. Ravener — — 170,457 340,915 1,022,744 — — — — — — —3/17/15 3/17/15 — — — — — — — 32,843 74.72 599,6573/17/15 3/17/15 — — — — — — 3,965 — — 296,2653/17/15 3/17/15 — — — 1,983 3,965 11,895 — — — 296,265
Ms. Taylor — — 165,757 331,514 994,543 — — — — — — —3/17/15 3/17/15 — — — — — — — 32,843 74.72 599,6573/17/15 3/17/15 — — — — — — 3,965 — — 296,2653/17/15 3/17/15 — — — 1,983 3,965 11,895 — — — 296,265
Mr. Sparks — — 213,532 427,064 1,281,193 — — — — — — —3/17/15 3/17/15 — — — — — — — 32,843 74.72 599,6573/17/15 3/17/15 — — — — — — 3,965 — — 296,2653/17/15 3/17/15 — — — 1,983 3,965 11,895 — — — 296,265
(1) The per share exercise price was calculated based on the closing market price of one share of our common stock on the date of grant as reported by theNYSE.
(2) Represents the aggregate grant date fair value of each equity award, computed in accordance with FASB ASC Topic 718. For equity awards that are subject toperformance conditions, the value at the grant date is based upon the probable outcome of such conditions. For information regarding the assumptions made inthe valuation of these awards, see Note 10 of the annual consolidated financial statements included in our 2015 Form 10-K.
37

Prox
y
Outstanding Equity Awards at 2015 Fiscal Year-End
The table below sets forth information regarding awards granted under our Amended andRestated 2007 Stock Incentive Plan and held by our named executive officers as of the end of fiscal2015. The $7.9975 exercise price in the table below reflects an adjustment made in connection with aspecial dividend paid to our shareholders in September 2009 to reflect the effects of such dividend onsuch options, as required by the terms of such options. In October 2009, we completed a reverse splitof 1 share for each 1.75 shares of common stock outstanding. The exercise prices of, and number ofshares outstanding under, our equity awards existing at the time of the reverse stock split wereretroactively adjusted to reflect the reverse split and are reflected below. We have omitted from thistable all columns for ‘‘Equity Incentive Plan Awards’’ because they are inapplicable.
Option Awards Stock Awards
Number of Number of Number of Shares Market Value ofSecurities Underlying Securities Underlying Option or Units of Shares or UnitsUnexercised Options Unexercised Options Exercise Option Stock That Have of Stock That
(#) (#) Price Expiration Not Vested Have Not VestedName Exercisable Unexercisable ($) Date (#) ($)
Mr. Vasos 28,080(1) 9,360(1) 45.25 03/20/2022 — —13,746(2) 13,746(2) 48.11 03/18/2023 — —
1,440(3) 1,440(3) 56.48 12/03/2023 — —9,483(4) 28,443(4) 57.91 03/18/2024 — —
— 44,786(5) 74.72 03/17/2025 — —— 256,682(6) 76.00 06/03/2025 — —— — — — 854(7) 64,101(7)
— — — — 4,506(8) 338,220(8)
— — — — 3,766(9) 282,676(9)
— — — — 2,172(10) 163,030(10)
— — — — 4,714(11) 353,833(11)
— — — — 5,407(12) 405,849(12)
Mr. Dreiling — 57,056(1) 45.25 03/20/2022 — —— 37,801(2) 48.11 03/18/2023 — —— 40,454(4) 57.91 03/18/2024 — —
Mr. Garratt 1,260(13) 3,771(13) 66.69 12/03/2024 — —— 10,002(5) 74.72 03/17/2025 — —— 7,829(14) 65.35 12/02/2025 — —— — — — 840(9) 63,050(9)
— — — — 1,207(12) 90,597(12)
Mr. Tehle — — — — — —
Mr. Flanigan 28,080(1) 9,360(1) 45.25 03/20/2022 — —13,746(2) 13,746(2) 48.11 03/18/2023 — —
6,953(4) 20,859(4) 57.91 03/18/2024 — —— 32,843(5) 74.72 03/17/2025 — —— — — — 854(7) 64,101(7)
— — — — 3,304(8) 247,998(8)
— — — — 2,762(9) 207,316(9)
— — — — 2,172(10) 163,030(10)
— — — — 3,456(11) 259,407(11)
— — — — 3,965(12) 297,613(12)
Mr. Ravener 3,094(15) — 7.9975 08/28/2018 — —18,094(16) — 7.9975 12/19/2018 — —49,019(17) — 25.25 03/24/2020 — —28,080(1) 9,360(1) 45.25 03/20/2022 — —13,746(2) 13,746(2) 48.11 03/18/2023 — —
6,953(4) 20,859(4) 57.91 03/18/2024 — —— 32,843(5) 74.72 03/17/2025 — —— — — — 854(7) 64,101(7)
— — — — 3,304(8) 247,998(8)
— — — — 2,762(9) 207,316(9)
— — — — 2,172(10) 163,030(10)
— — — — 3,456(11) 259,407(11)
— — — — 3,965(12) 297,613(12)
38

Proxy
Option Awards Stock Awards
Number of Number of Number of Shares Market Value ofSecurities Underlying Securities Underlying Option or Units of Shares or UnitsUnexercised Options Unexercised Options Exercise Option Stock That Have of Stock That
(#) (#) Price Expiration Not Vested Have Not VestedName Exercisable Unexercisable ($) Date (#) ($)
Ms. Taylor 10,284(18) — 25.25 03/24/2020 — —3,547(1) 1,182(1) 45.25 03/20/2022 — —1,501(2) 1,498(2) 48.11 03/18/2023 — —3,454(19) 3,454(19) 54.48 05/28/2023 — —2,119(4) 6,351(4) 57.91 03/18/2024 — —
— 32,843(5) 74.72 03/17/2025 — —— — — — 93(7) 6,981(7)
— — — — 1,006(8) 75,510(8)
— — — — 2,762(9) 207,316(9)
— — — — 237(10) 17,789(10)
— — — — 1,052(11) 78,963(11)
— — — — 3,965(12) 297,613(12)
Mr. Sparks — — — — — —
(1) These options are part of a grant of time-based options with a vesting schedule of 25% per year on each of the first fouranniversaries of March 20, 2012, subject to certain accelerated vesting provisions as described in ‘‘Potential Payments uponTermination or Change in Control’’ below.
(2) These options are part of a grant of time-based options with a vesting schedule of 25% per year on each of the first fouranniversaries of March 18, 2013, subject to certain accelerated vesting provisions as described in ‘‘Potential Payments uponTermination or Change in Control’’ below.
(3) These options are part of a grant of time-based options with a vesting schedule of 25% per year on each of the first fouranniversaries of December 3, 2013, subject to certain accelerated vesting provisions as described in ‘‘Potential Paymentsupon Termination or Change in Control’’ below.
(4) These options are part of a grant of time-based options with a vesting schedule of 25% per year on each of the first fouranniversaries of March 18, 2014, subject to certain accelerated vesting provisions as described in ‘‘Potential Payments uponTermination or Change in Control’’ below.
(5) These options are part of a grant of time-based options with a vesting schedule of 25% per year on April 1 of 2016, 2017,2018 and 2019, subject to certain accelerated vesting provisions as described in ‘‘Potential Payments upon Termination orChange in Control’’ below.
(6) These options are part of a grant of time-based options with a vesting schedule of 331⁄3% per year on each of the third,fourth and fifth anniversaries of June 3, 2015, subject to certain accelerated vesting provisions as described in ‘‘PotentialPayments upon Termination or Change in Control’’ below.
(7) Represents PSUs, to be paid in an equal number of shares of our common stock, earned as a result of our performanceversus certain adjusted EBITDA and ROIC targets for fiscal 2013 and scheduled to vest on March 18, 2016, subject tocertain accelerated vesting provisions as described in ‘‘Potential Payments upon Termination or Change in Control’’ below.The market value was computed by multiplying the number of such units by the closing market price of one share of ourcommon stock on January 29, 2016.
(8) Represents PSUs, to be paid in an equal number of shares of our common stock, earned as a result of our performanceversus certain adjusted EBITDA and ROIC targets for fiscal 2014 and scheduled to vest 50% per year on March 18, 2016and March 18, 2017, subject to certain accelerated vesting provisions as described in ‘‘Potential Payments upon Terminationor Change in Control’’ below. The market value was computed by multiplying the number of such units by the closingmarket price of one share of our common stock on January 29, 2016.
(9) Represents PSUs, to be paid in an equal number of shares of our common stock, earned as a result of our performanceversus certain adjusted EBITDA and ROIC targets for fiscal 2015 and scheduled to vest 50% per year on April 1, 2017 andApril 1, 2018, subject to certain accelerated vesting provisions as described in ‘‘Potential Payments upon Termination orChange in Control’’ below. The market value was computed by multiplying the number of units by the closing market priceof one share of our common stock on January 29, 2016.
(10) Represents RSUs, to be paid in an equal number of shares of our common stock, which are scheduled to vest on March 18,2016, subject to certain accelerated vesting provisions as described in ‘‘Potential Payments upon Termination or Change inControl’’ below. The market value was computed by multiplying the number of such units by the closing market price ofone share of our common stock on January 29, 2016.
(11) Represents RSUs, to be paid in an equal number of shares of our common stock, which are scheduled to vest 50% per yearon March 18, 2016 and March 18, 2017, subject to certain accelerated vesting provisions as described in ‘‘PotentialPayments upon Termination or Change in Control’’ below. The market value was computed by multiplying the number ofsuch units by the closing market price of one share of our common stock on January 29, 2016.
39

Prox
y
(12) Represents RSUs, to be paid in an equal number of shares of our common stock, which are scheduled to vest in threeequal installments on April 1, 2016, April 1, 2017 and April 1, 2018, subject to certain accelerated vesting provisions asdescribed in ‘‘Potential Payments upon Termination or Change in Control’’ below. The market value was computed bymultiplying the number of such units by the closing market price of one share of our common stock on January 29, 2016.
(13) These options are part of a grant of time-based options with a vesting schedule of 25% per year on each of the first fouranniversaries of December 3, 2014, subject to certain accelerated vesting provisions as described in ‘‘Potential Paymentsupon Termination or Change in Control’’ below.
(14) These options are part of a grant of time-based options with a vesting schedule of 25% per year on each of the first fouranniversaries of December 2, 2015, subject to certain accelerated vesting provisions as described in ‘‘Potential Paymentsupon Termination or Change in Control’’ below.
(15) These options vested on August 25, 2013.
(16) These options vested in increments of 208 shares on April 3, 2013; 1,029 shares on April 22, 2013; 4,680 shares on July 11,2013; 11,428 shares on August 25, 2013; and 749 shares on December 11, 2013.
(17) These options vested in increments of 6,516 shares on February 1, 2013; 13,422 shares on each of March 24, 2013,January 31, 2014 and March 24, 2014; and 2,237 shares on January 30, 2015.
(18) These options vested in increments of 1,072 shares on January 28, 2011; 1,286 shares on each of March 24, 2011,February 3, 2012 and March 24, 2012; 1,285 shares on each of February 1, 2013, March 24, 2013, January 31, 2014 andMarch 24, 2014; and 214 shares on January 30, 2015.
(19) These options are part of a grant of time-based options with a vesting schedule of 25% per year on each of the first fouranniversaries of May 28, 2013, subject to certain accelerated vesting provisions as described in ‘‘Potential Payments uponTermination or Change in Control’’ below.
Option Exercises and Stock Vested During Fiscal 2015
Option Awards Stock AwardsNumber of Number of
Shares SharesAcquired on Value Realized Acquired on Value Realized
Exercise on Exercise Vesting on VestingName (#)(1) ($)(2) (#)(3) ($)(4)
Mr. Vasos — — 9,414 709,937Mr. Dreiling 398,880 13,206,896 296,797 21,638,854Mr. Garratt — — 421 31,600Mr. Tehle 48,779 1,399,187 6,902 521,179Mr. Flanigan 28,449 1,437,362 8,283 624,837Mr. Ravener — — 8,283 624,837Ms. Taylor — — 2,509 188,803Mr. Sparks 48,779 1,426,209 6,902 521,179
(1) Represents the gross number of option shares exercised, without deduction for shares that may have been surrendered orwithheld to satisfy the exercise price or applicable tax withholding obligations.
(2) Value realized is calculated by multiplying the gross number of options exercised by the difference between the marketprice of our common stock on the date of exercise and the exercise price.
(3) Represents the gross number of shares acquired upon vesting of PSUs and RSUs, without deduction for shares that mayhave been withheld to satisfy applicable tax withholding obligations. For Mr. Dreiling, the reported amounts include sharesunderlying RSUs that vested on January 29, 2016 but are subject to delayed payment, including 57,670 RSUs scheduled tobe paid 50% on March 17, 2016 and 50% on March 17, 2017, and 22,005 RSUs scheduled to be paid on July 30, 2016, ineach case subject to certain accelerated payment provisions.
(4) Value realized is calculated by multiplying the gross number of shares vested by the closing market price of our commonstock on the vesting date. As discussed in more detail in footnote 3, for Mr. Dreiling, the reported value realized includesthe value associated with shares underlying RSUs that vested on January 29, 2016 but are subject to delayed payment.
40

Proxy
Pension BenefitsFiscal 2015
We have omitted the Pension Benefits table because it is inapplicable.
Nonqualified Deferred CompensationFiscal 2015
Information regarding each named executive officer’s participation in our CDP/SERP Plan isincluded in the following table. The material terms of the CDP/SERP Plan are described after thetable. Please also see ‘‘Benefits and Perquisites’’ in ‘‘Compensation Discussion and Analysis’’ above.
Executive Registrant Aggregate Aggregate AggregateContributions Contributions Earnings Withdrawals/ Balance
in Last FY in Last FY in Last FY Distributions at Last FYEName ($)(1) ($)(2) ($)(3) ($)(4) ($)(5)
Mr. Vasos 46,330 32,115 (10,963) — 533,614Mr. Dreiling 62,387 322,977 18,456 — 2,880,653Mr. Garratt 2,083 — 25 — 2,108Mr. Tehle 15,479 5,270 (135,029) (1,980,227) 0Mr. Flanigan 21,869 65,541 (13,666) — 618,838Mr. Ravener 26,100 12,787 (10,107) — 333,425Ms. Taylor 2,188 52,521 (6,662) — 208,177Mr. Sparks 11,678 1,088 10 (116,204) 0
(1) All of the reported amounts for each named executive officer are reported in the Summary Compensation Table as‘‘Salary’’ for 2015.
(2) Reported as ‘‘All Other Compensation’’ in the Summary Compensation Table.
(3) The amounts shown are not reported in the Summary Compensation Table because they do not represent above-market orpreferential earnings.
(4) Each distribution was made following Messrs. Tehle’s and Sparks’s respective service termination pursuant to prior electionsmade under the CDP/SERP Plan.
(5) Of the amounts reported, the following were previously reported as compensation to the named executive officer for yearsprior to 2015 in a Summary Compensation Table: Mr. Vasos ($374,751); Mr. Dreiling ($2,183,084); Mr. Tehle ($1,475,241);Mr. Flanigan ($149,969); Mr. Ravener ($31,747); each of Mr. Garratt and Ms. Taylor ($0); and Mr. Sparks ($102,228).
Pursuant to the CDP, each named executive officer may annually elect to defer up to 65% ofhis base salary if his compensation exceeds the limit set forth in Section 401(a)(17) of the InternalRevenue Code, and up to 100% of his bonus pay if his compensation equals or exceeds the highlycompensated limit under Section 414(q)(1)(B) of the Internal Revenue Code. We currently match basepay deferrals at a rate of 100%, up to 5% of annual salary, with annual salary offset by the amount ofmatch-eligible salary under the 401(k) Plan. All named executive officers are 100% vested in allcompensation and matching deferrals and earnings on those deferrals.
Pursuant to the SERP, we make an annual contribution equal to a certain percentage of aparticipant’s annual salary and bonus to all participants who are actively employed in an eligible jobgrade on January 1 and continue to be employed as of December 31 of a given year. Persons hiredafter May 27, 2008, including Messrs. Vasos, Garratt, Ravener and Sparks, are not eligible toparticipate in the SERP. The contribution percentage is based on age, years of service and job grade.The fiscal 2015 contribution percentage was 9.5% for Mr. Dreiling and 7.5% for each of Mr. Flaniganand Ms. Taylor. Mr. Tehle was not eligible for a fiscal 2015 SERP contribution because he was notemployed as of December 31, 2015. All applicable named executive officers are 100% vested in theirrespective SERP amounts.
41

Prox
y
The amounts deferred or contributed to the CDP/SERP Plan are credited to a liability account,which is then invested at the participant’s option in an account that mirrors the performance of a fundor funds selected by the Compensation Committee or its delegate. Beginning on August 2, 2008, thesefunds are identical to the funds offered in our 401(k) Plan.
A participant who ceases employment with at least 10 years of service or after reaching age 50and whose CDP account balance or SERP account balance exceeds $25,000 may elect for that accountbalance to be paid in cash by (a) lump sum, (b) monthly installments over a 5, 10 or 15-year period or(c) a combination of lump sum and installments. Otherwise, payment is made in a lump sum. Thevested amount will be payable at the time designated by the CDP/SERP Plan upon the participant’stermination of employment. A participant’s CDP/SERP benefit normally is payable in the followingFebruary if employment ceases during the first 6 months of a calendar year or is payable in thefollowing August if employment ceases during the last 6 months of a calendar year. However,participants may elect to receive an in-service lump sum distribution of vested amounts credited to theCDP account, provided that the date of distribution is no sooner than 5 years after the end of the yearin which the amounts were deferred. In addition, a participant who is actively employed may request an‘‘unforeseeable emergency hardship’’ in-service lump sum distribution of vested amounts credited to theparticipant’s CDP account. Account balances are payable in cash.
As a result of our change in control which occurred in 2007, the CDP/SERP Plan liabilitiesthrough July 6, 2007 were fully funded into an irrevocable rabbi trust. We also funded into the rabbitrust deferrals into the CDP/SERP Plan between July 6, 2007 and October 15, 2007. All CDP/SERPPlan liabilities incurred on or after October 15, 2007 are unfunded.
Potential Payments upon Termination or Change in Control
Our agreements with our named executive officers and certain plans and programs in whichour named executive officers participate, in each case as in effect at the end of our 2015 fiscal year,provide for benefits or payments upon certain employment termination or change in control events.These benefits and payments are discussed below except to the extent a benefit or payment is availablegenerally to all salaried employees and does not discriminate in favor of our executive officers or to theextent already discussed under ‘‘Nonqualified Deferred Compensation Fiscal 2015’’ above. Becauseeach of Messrs. Dreiling’s, Tehle’s and Sparks’s employment ended on or before the end of our 2015fiscal year, we discuss below only the payments each has received or will receive in connectiontherewith.
Payments to Mr. Dreiling
Mr. Dreiling retired on January 29, 2016. Pursuant to the terms of his employment transitionagreement with us, effective March 10, 2015, Mr. Dreiling was entitled to receive a fiscal 2015Teamshare bonus payment to the extent earned as a result of the achievement of the fiscal 2015financial performance goal and payable at the same time as payments are made to other Teamshareparticipants as discussed in ‘‘Compensation Discussion and Analysis’’ and reflected in the ‘‘Non-EquityIncentive Plan Compensation’’ column of the Summary Compensation Table.
Mr. Dreiling’s outstanding stock options, 2013 PSUs and 2014 PSUs (defined below), andRSUs (other than the Transition RSU Award) were treated as described below under ‘‘Payments UponTermination Due to Retirement.’’
The Transition RSU Award fully vested on January 29, 2016 and is scheduled to be paid as to50% of the award on each of the first two anniversaries of the March 17, 2015 grant date, subject toreduction, cancellation, forfeiture or recoupment, in whole or in part, upon various events specified inthe award agreement, including the breach of any of the business protection provisions set forth in hisemployment transition agreement. Such RSUs are subject to accelerated payment in the event of death
42
Proxy
or disability (in which event payment will be made within 90 days following such event) or a change incontrol (in which event the payment will be made upon the change in control), in each case prior to anoriginally scheduled payment date. Disability and change in control are defined in the equity awardagreement.
Finally, upon his retirement Mr. Dreiling forfeited the unvested portion of the performance-based restricted stock awarded to him in 2012.
Mr. Dreiling is subject to various business protection provisions substantially as described forthe other named executive officers below under ‘‘Payments Upon Voluntary Termination—VoluntaryTermination with Good Reason or After Failure to Renew the Employment Agreement.’’
Payments to Mr. Tehle
Mr. Tehle’s service termination date was June 30, 2015, and his departure was treated as avoluntary termination without good reason under all applicable plans and agreements. His outstandingequity awards were treated as described below under ‘‘Payments Upon Voluntary Termination—Voluntary Termination without Good Reason.’’
Payments to Mr. Sparks
Mr. Sparks’ service termination date was June 9, 2015. He received or will receive severancepayments and benefits, and his outstanding equity awards were treated, as described under ‘‘PaymentsUpon Involuntary Termination—Involuntary Termination without Cause.’’
Payments Upon Termination Due to Death or Disability
Pre-2012 Equity Awards. Mr. Ravener and Ms. Taylor have options outstanding that weregranted prior to 2012. All such options are fully vested and generally may be exercised for a period ofone year from termination of employment due to death or disability (as defined in the applicable awardagreement) unless such options have expired earlier.
Post-2011 Equity Awards. If a named executive officer’s employment with us terminates due todeath or disability (as defined in the applicable award agreement):
• Stock Options. Any outstanding unvested stock option shall become immediately vestedand exercisable with respect to 100% of the shares subject to the option immediately priorto such event, and such vested options may be exercised until the first anniversary of theemployment termination date.
• Performance Share Units. PSUs were awarded in fiscal 2013 (‘‘2013 PSUs’’), fiscal 2014(‘‘2014 PSUs’’) and, except for Mr. Dreiling, fiscal 2015 (‘‘2015 PSUs’’) to each namedexecutive who was employed by us at the time of the applicable award.
� If such termination had occurred before January 29, 2016 for the 2015 PSUs, apro-rated portion (based on months employed during the one year performanceperiod) of one-third of the 2015 PSUs earned based on performance during theentire performance period would have become vested and nonforfeitable (unlesspreviously vested or forfeited) as of January 29, 2016 and would have been paidon April 1, 2016. If such termination had occurred on or after January 29, 2016for the 2015 PSUs and before April 1, 2016, the participant would have receivedthe one-third of the 2015 PSUs earned that are described above, withoutproration.
� If such termination occurs after March 18, 2014 for the 2013 PSUs, March 18,2015 for the 2014 PSUs or April 1, 2016 for the 2015 PSUs, any remaining earned
43

Prox
y
but unvested PSUs from such awards shall become vested and nonforfeitable as ofthe date of such event and shall be paid within 30 days thereafter. Otherwise, anyearned but unvested PSUs from such awards shall be forfeited and cancelled onthe date of the termination of employment.
• Restricted Stock Units. Any outstanding RSUs will become fully vested and nonforfeitableupon such death or disability and will be paid within 30 days (for RSUs granted prior to2015) or 90 days (for RSUs granted in 2015) following the date of death or disability.
Other Payments. In the event of death, a named executive officer’s beneficiary will receivepayments under our group life insurance program in an amount, up to a maximum of $3 million, equalto 2.5 times such officer’s annual base salary. In addition, in the event of disability (as defined in thegoverning document), a named executive officer would receive 60% of covered monthly earnings up to$20,000 per month under our long-term disability insurance program. In the event of death or disability(as defined in the CDP/SERP Plan), a named executive officer’s CDP/SERP Plan benefit will becomefully vested (to the extent not already vested) and will be payable in a lump sum within 60 days afterthe end of the calendar quarter in which such termination event occurs, provided that we may delaypayment in the event of disability until as soon as reasonably practicable after receipt of the disabilitydetermination by the Social Security Administration. Additionally, in the event of death on or after thelast day of a fiscal year, a named executive officer will receive payment for his or her incentive bonusearned for that fiscal year under the terms of our Teamshare program (which otherwise generallyrequires that a participant remain employed on the payment date to be entitled to any incentive bonusearned for that fiscal year).
Payments Upon Termination Due to Retirement
Except as provided immediately below with respect to stock options, PSUs and RSUs awardedafter 2011, retirement (as defined in the applicable governing document) is not treated differently fromany other voluntary termination without good reason (as defined under the relevant agreements, and asdiscussed below under ‘‘Payments Upon Voluntary Termination’’) under any of our plans or agreementsfor named executive officers.
In the event a named executive officer retires:
• Stock Options. The portion of the stock options that would have become vested andexercisable within the one year period following the retirement date if such officer hadremained employed with us shall remain outstanding for a period of one year following theretirement date and shall become vested and exercisable on the anniversary of the grantdate that falls within the one year period following the retirement date (but only to theextent such portion has not otherwise terminated or become exercisable). However, ifduring such one year period a change in control occurs or the officer dies or incurs adisability, such portion shall instead become immediately vested and exercisable (but onlyto the extent such portion has not otherwise terminated). Otherwise, any option which isunvested and unexercisable on the termination date shall immediately expire withoutpayment. The officer may exercise the option to the extent vested and exercisable any timeprior to the fifth anniversary of the retirement date, but no later than the 10th anniversaryof the grant date.
• Performance Share Units.
� For the 2015 PSUs, if such retirement had occurred before January 29, 2016, oron or after January 29, 2016 and before April 1, 2016, the vesting and payment ofPSUs from such award would have been identical to the vesting and payment of
44

Proxy
PSUs in the death and disability scenarios discussed above for the 2015 PSUsduring these time periods.
� If such retirement had occurred after March 19, 2015 but before March 18, 2016for the 2014 PSUs or occurs after April 2, 2016 but before April 1, 2017 for the2015 PSUs, an additional one-third of earned PSUs from such awards wouldbecome vested and nonforfeitable and would be paid on the retirement date. Ifsuch retirement occurs after March 19, 2015 but before March 18, 2016 for the2013 PSUs, after March 19, 2016 but before March 18, 2017 for the 2014 PSUs,and after April 2, 2017 but before April 1, 2018 for the 2015 PSUs, an additionalone-third of earned PSUs from such awards would become vested andnonforfeitable and would be paid on the retirement date. Otherwise, any earnedbut unvested PSUs from such awards shall be forfeited and cancelled on theretirement date.
• Restricted Stock Units. The one-third of the outstanding RSUs that would have becomevested and nonforfeitable on the next immediately following vesting date if such officer hadremained employed through such date will become vested and nonforfeitable upon suchretirement (provided that if the retirement occurs on a vesting date no accelerated vestingwill occur, but rather the officer shall be entitled only to the portion of the RSUs thatwere scheduled to vest on such vesting date) and will be paid six months and one dayfollowing the retirement date.
Payments Upon Voluntary Termination
The payments to be made to a named executive officer upon voluntary termination varydepending upon whether the resignation occurs with or without ‘‘good reason’’ (as defined in theapplicable agreement) or after our failure to offer to renew, extend or replace the applicableemployment agreement under certain circumstances.
Voluntary Termination with Good Reason or After Failure to Renew the Employment Agreement.If a named executive officer resigns with good reason (as defined in the applicable equity awardagreement), he or she will forfeit all then unvested equity awards and generally may exercise any vestedoptions up to 90 days following the resignation date, but in no event later than the 10th anniversary ofthe grant date. To the extent Mr. Vasos exercises prior to June 3, 2020 any of the options awarded onJune 3, 2015, he will be required to hold any net shares acquired upon the exercise until June 3, 2020.If a named executive officer resigns under the circumstances described in (2) below, his or her equitywill be treated as described under ‘‘Voluntary Termination without Good Reason’’ below.
If a named executive officer resigns (1) with good reason (as defined in the applicableemployment agreement) after giving 30 days (90 days in the case of Mr. Vasos) written notice within30 days after the event purported to give rise to the claim for good reason and opportunity for us tocure any such claimed event within 30 days after receiving such notice, or (2) within 60 days (90 days inthe case of Mr. Vasos) of our failure to offer to renew, extend or replace his or her employmentagreement before, at or within 6 months (one year in the case of Mr. Vasos) after the end of theagreement’s term (unless we enter into a mutually acceptable severance arrangement or the resignationis a result of the named executive officer’s retirement or termination other than for good reason), thenin each case the named executive officer will receive the following benefits generally on or beginningon the 60th day after termination of employment but contingent upon the execution and effectiveness ofa release of certain claims against us and our affiliates in the form attached to the employmentagreement:
45

Prox
y
• Continuation of base salary, generally as in effect immediately before the termination, for24 months payable in accordance with our normal payroll cycle and procedures. With theexception of Mr. Vasos, the amount of any payment or entitlement to payment of the basesalary continuation shall be forfeited or, if paid, subject to recovery if and to the extent anybase salary is earned as a result of subsequent employment during the 24 months after thetermination date.
• A lump sum payment of two times the average percentage of the named executive officer’starget bonus paid or to be paid to employees at the same job grade level as the namedexecutive officer (if any) under the annual bonus program for officers for the two fiscalyears immediately preceding the fiscal year in which the termination date occurs (forMr. Vasos, such lump sum payment instead will equal two times his annual target bonus inrespect of the fiscal year in which his termination occurs). Mr. Vasos also will receive alump sum payment, payable when annual bonuses are paid to our other senior executives,of a pro-rata portion of the annual bonus, if any, that he would have been entitled toreceive for the fiscal year of termination, if such termination had not occurred, based onour performance for the fiscal year in which his employment terminates, multiplied by afraction, the numerator of which is the number of days during which he was employed byus in the fiscal year and the denominator of which is 365.
• A lump sum payment of two times our annual contribution that would have been made inrespect of the plan year in which such termination occurs for the named executive officer’sparticipation in our pharmacy, medical, dental and vision benefits programs.
• Reasonable outplacement services for one year or, if earlier, until subsequent employment.
Note that any amounts owed to a named executive officer in the form of salary continuationthat would otherwise have been paid during the 60 day period after employment termination willinstead be payable in a single lump sum on the 60th day after such termination date and the remainderwill be paid in the form of salary continuation payments over the remaining 24 month period as setforth above.
However, in certain cases, some or all of the payments and benefits provided on termination ofemployment may be delayed for six months following termination to comply with the requirements ofSection 409A of the Internal Revenue Code. Any payment required to be delayed would be paid at theend of the six-month period in a lump sum, and any payments due after the six-month period would bepaid at the normal payment date provided for under the applicable employment agreement.
The named executive officer will forfeit any unpaid severance amounts, and we retain anyother rights we have available under law or equity, upon a material breach of any continuing obligationunder the applicable employment agreement or the release, which include the following businessprotection provisions:
• The named executive officer must maintain the confidentiality of, and refrain fromdisclosing or using, our (a) trade secrets for any period of time as the information remainsa trade secret under applicable law and (b) confidential information for a period of twoyears following the employment termination date.
• For a period of two years after the employment termination date, the named executiveofficer may not accept or work in a ‘‘competitive position’’ within any state in which wemaintain stores at the time of his or her termination date or any state in which we havespecific plans to open stores within six months of that date. For this purpose, ‘‘competitiveposition’’ means any employment, consulting, advisory, directorship, agency, promotional orindependent contractor arrangement between the named executive officer and any personengaged wholly or in material part in the business in which we are engaged (including, but
46

Proxy
not limited to, those entities identified in the applicable employment agreement), or anyperson then planning to enter the discount consumable basics retail business, if the namedexecutive officer is required to perform services which are substantially similar to those heor she provided or directed at any time while employed by us.
• For a period of two years after the employment termination date, the named executiveofficer may not actively recruit or induce any of our exempt employees to ceaseemployment with us.
• For a period of two years after the employment termination date, the named executiveofficer may not solicit or communicate with any person or entity who has a businessrelationship with us and with whom the named executive officer had contact whileemployed by us, if it would likely interfere with our business relationships or result in anunfair competitive advantage over us.
Voluntary Termination without Good Reason. If a named executive officer resigns without goodreason, he or she will forfeit all then unvested equity awards and all vested but unexercised options thatwere granted prior to 2012. The named executive officer generally may exercise any vested options thatwere granted after 2011 up to 90 days following the resignation date, but in any event prior to the10th anniversary of the grant date. To the extent Mr. Vasos exercises prior to June 3, 2020 any of theoptions awarded on June 3, 2015, he will be required to hold any net shares acquired upon the exerciseuntil June 3, 2020.
Payments Upon Involuntary Termination
The payments to be made to a named executive officer upon involuntary termination varydepending upon whether termination is with or without ‘‘cause’’ (as defined in each named executiveofficer’s employment agreement or equity award agreement, as applicable).
Involuntary Termination for Cause. Upon an involuntary termination for cause, a namedexecutive officer will forfeit all unvested equity grants and all vested but unexercised options.
Involuntary Termination without Cause. Upon an involuntary termination without cause, anamed executive officer:
• Will forfeit all then unvested equity awards.
• Generally may exercise any vested options up to 90 days following the termination date,but in any event prior to the 10th anniversary of the grant date. To the extent Mr. Vasosexercises prior to June 3, 2020 any of the options awarded on June 3, 2015, he will berequired to hold any net shares acquired upon the exercise until June 3, 2020.
• Will receive the same severance payments and benefits on the same terms and conditions(except for the notice and cure provisions) as described under ‘‘Voluntary Termination withGood Reason or After Failure to Renew the Employment Agreement’’ above.
Payments After a Change in Control
Upon a change in control (as defined under the applicable governing document), regardless ofwhether the named executive officer’s employment terminates:
• All options will vest and become immediately exercisable as to 100% of the shares subjectto such options immediately prior to the change in control.
• If the change in control occurs on or before the completion of the applicable performanceperiod, and the named executive officer has remained continuously employed until the
47

Prox
y
change in control, all unvested PSUs that have not previously been forfeited willimmediately be deemed earned at the target level and shall vest, become nonforfeitableand be paid upon the change in control.
• If the change in control occurs after completion of the applicable performance period, andthe named executive officer has remained continuously employed until the change incontrol, all previously earned but unvested PSUs that have not previously been forfeitedwill immediately vest, become nonforfeitable and be paid upon the change in control.
• All outstanding RSUs will become vested and nonforfeitable and will be paid upon thechange in control.
• All CDP/SERP Plan benefits will become fully vested (to the extent not already vested).
Upon an involuntary termination without cause or a resignation for good reason following thechange in control, a named executive officer will receive the same severance payments and benefits asdescribed above under ‘‘Voluntary Termination with Good Reason or After Failure to Renew theEmployment Agreement.’’ However, a named executive officer will have one year from the terminationdate in which to exercise vested options that were granted after 2011 if he or she resigns or isinvoluntarily terminated within two years of the change in control under any scenario other thanretirement or involuntary termination with cause (in which respective cases, he or she will have fiveyears from the retirement date to exercise vested options and will forfeit any vested but unexercisedoptions held at the time of the termination with cause).
In the event of a change in control as defined in Section 280G of the Internal Revenue Code,each named executive officer’s employment agreement provides for capped payments (taking intoconsideration all payments and benefits covered by Section 280G of the Internal Revenue Code) of $1less than the amount that would trigger the ‘‘golden parachute’’ excise tax under federal income taxrules (the ‘‘excise tax’’) unless he or she signs a release and the after-tax benefit would be at least$50,000 more than it would be without the payments being capped. In such case, such officer’spayments and benefits would not be capped and such officer would be responsible for the payment ofthe excise tax. We would not pay any additional amount to cover the excise tax.
Except for Messrs. Dreiling and Sparks, for whom a separate table is provided below to reflectactual payments based upon their respective termination scenarios, and Mr. Tehle, who is not includedin the table because he received no such payments as a result of his service termination, the followingtable reflects potential payments to each named executive officer in various termination and change incontrol scenarios based on compensation, benefit, and equity levels in effect on, and assuming thescenario was effective as of, January 29, 2016. For stock valuations, we have used the closing price ofour stock on the NYSE on January 29, 2016 ($75.06). The tables below report only amounts that areincreased, accelerated or otherwise paid or owed as a result of the applicable scenario and, as a result,exclude earned but unpaid base salary through the employment termination date and equity awards andCDP/SERP Plan benefits that had vested prior to the event. For more information regarding the CDP/SERP Plan benefits, see ‘‘Nonqualified Deferred Compensation Fiscal 2015’’ above. The tables alsoexclude any amounts that are available generally to all salaried employees and do not discriminate infavor of our executive officers. Other than with respect to Messrs. Dreiling and Sparks, the amountsshown are merely estimates. We cannot determine actual amounts to be paid until a termination orchange in control scenario occurs.
48

Proxy
Potential Payments to Named Executive Officers Upon Occurrence ofVarious Termination Events as of January 29, 2016
InvoluntaryWithout
Voluntary Cause orWithout Voluntary Involuntary
Good With Good With Change inDeath Disability Retirement Reason Reason Cause Control
Name/Item ($) ($) ($)(1) ($) ($) ($) ($)
Mr. VasosEquity Vesting Due to Event 2,476,593 2,476,593 n/a n/a n/a n/a 2,910,140Cash Severance 956,548 n/a n/a n/a 4,956,548 n/a 4,956,548Health Payment n/a n/a n/a n/a 10,623 n/a 10,623Outplacement(2) n/a n/a n/a n/a 8,500 n/a 8,500Life Insurance Proceeds 2,500,000 n/a n/a n/a n/a n/a n/aTotal 5,933,141 2,476,593 n/a n/a 4,975,671 n/a 7,885,811
Mr. GarrattEquity Vesting Due to Event 233,181 233,181 n/a n/a n/a n/a 292,178Cash Severance 199,223 n/a n/a n/a 1,275,716 n/a 1,275,716Health Payment n/a n/a n/a n/a 20,822 n/a 20,822Outplacement(2) n/a n/a n/a n/a 8,500 n/a 8,500Life Insurance Proceeds 1,250,000 n/a n/a n/a n/a n/a n/aTotal 1,682,404 233,181 n/a n/a 1,305,038 n/a 1,597,217
Mr. FlaniganEquity Vesting Due to Event 2,030,184 2,030,184 1,270,082 n/a n/a n/a 2,348,138Cash Severance 340,439 n/a n/a n/a 1,223,695 n/a 1,223,695Health Payment n/a n/a n/a n/a 10,623 n/a 10,623Outplacement(2) n/a n/a n/a n/a 8,500 n/a 8,500Life Insurance Proceeds 1,200,000 n/a n/a n/a n/a n/a n/aTotal 3,570,623 2,030,184 1,270,082 n/a 1,242,818 n/a 3,590,956
Mr. RavenerEquity Vesting Due to Event 2,030,184 2,030,184 n/a n/a n/a n/a 2,348,138Cash Severance 372,291 n/a n/a n/a 1,338,186 n/a 1,338,186Health Payment n/a n/a n/a n/a 20,102 n/a 20,102Outplacement(2) n/a n/a n/a n/a 8,500 n/a 8,500Life Insurance Proceeds 1,312,000 n/a n/a n/a n/a n/a n/aTotal 3,714,475 2,030,184 n/a n/a 1,366,788 n/a 3,714,925
Ms. TaylorEquity Vesting Due to Event 809,535 809,535 n/a n/a n/a n/a 1,041,245Cash Severance 362,026 n/a n/a n/a 1,339,502 n/a 1,339,502Health Payment n/a n/a n/a n/a 19,705 n/a 19,705Outplacement(2) n/a n/a n/a n/a 8,500 n/a 8,500Life Insurance Proceeds 1,313,000 n/a n/a n/a n/a n/a n/aTotal 2,484,561 809,535 n/a n/a 1,367,707 n/a 2,408,953
(1) Mr. Flanigan was the only named executive officer other than Mr. Dreiling who was eligible for retirement on January 29,2016.
(2) Estimated based on information provided by our outplacement services provider.
49

Prox
y
Actual Payments to Messrs. Dreiling and Sparks
Payments inConnection with
Mr. Dreiling(1) Retirement
Equity Vesting Due to Event $10,467,726Fiscal 2015 Teamshare Payout $ 1,942,422Cash Severance n/aHealth Continuation n/aOutplacement n/aLife Insurance Proceeds n/aTotal $12,410,148
Payments inConnection with
InvoluntaryTermination Without
Mr. Sparks(2) Cause
Equity Vesting Due to Event n/aCash Severance $1,676,348Health Payment $ 19,234Outplacement $ 10,000Life Insurance Proceeds n/aTotal $1,705,582
(1) See ‘‘Payments to Mr. Dreiling’’ above.
(2) See ‘‘Payments to Mr. Sparks’’ above.
Compensation Committee Interlocks and Insider Participation
Each of Messrs. Bryant and Rhodes and Ms. Fili-Krushel was a member of our CompensationCommittee during 2015. None of these persons (1) was at any time during 2015 an officer or employeeof Dollar General or any of our subsidiaries; (2) was at any time prior to 2015 an officer of DollarGeneral or any of our subsidiaries; or (3) had any relationship requiring disclosure under the section ofthis document entitled ‘‘Transactions with Management and Others.’’ Also, none of our executiveofficers serves, or in the past fiscal year has served, as a director of, or as a member of thecompensation committee (or other board committee performing equivalent functions) of, any entitythat has one or more of its executive officers serving as a director of Dollar General or as a member ofour Compensation Committee.
Compensation Risk Considerations
In December 2015, our Compensation Committee, with input from its compensation consultantand management, reviewed our compensation policies and practices for all employees, includingexecutive officers, to assess the risks that may arise from our compensation programs. The assessmentincluded a review of our compensation programs for certain design features which could potentiallyencourage excessive risk-taking or otherwise generate risk to Dollar General. As a result of thatassessment, the Compensation Committee concluded, after considering the degree to which identifiedrisk-aggravating factors were offset by risk-mitigating factors, that the net risks created by our overallcompensation program were not reasonably likely to have a material adverse effect on Dollar General.The Compensation Committee rolled forward this assessment in March 2016 to consider any changesto the compensation program since December 2015 and reached the same conclusion as it reached inDecember 2015.
50

Proxy
SECURITY OWNERSHIP
For purposes of the tables below, a person is a ‘‘beneficial owner’’ of a security over which thatperson has or shares voting or investment power or which that person has the right to acquirebeneficial ownership within 60 days. Unless otherwise noted, to our knowledge these persons have solevoting and investment power over the shares listed. Percentage computations are based on 286,669,916shares of our common stock outstanding as of March 17, 2016.
Security Ownership of Certain Beneficial Owners
The following table shows the amount of our common stock beneficially owned as of March 17,2016 by those known by us to beneficially own more than 5% of our common stock.
Amount and Nature ofName and Address of Beneficial Owner Beneficial Ownership Percent of Class
BlackRock, Inc.(1) 25,701,473 9.0%GIC Private Limited(2) 22,673,678 7.9%The Vanguard Group(3) 20,122,432 7.0%
(1) BlackRock, Inc., through various subsidiaries, has sole power to vote or direct the vote of 22,776,178 shares and sole powerto dispose or direct the disposition of 25,701,473 shares. The address of BlackRock, Inc. is 55 East 52nd Street, New York,New York 10055. All information is based solely on Amendment No. 1 to Statement on Schedule 13G filed on January 26,2016.
(2) GIC Private Limited (‘‘GIC’’) is a fund manager with two clients—the Government of Singapore (‘‘GoS’’) and theMonetary Authority of Singapore (‘‘MAS’’). Under the investment management agreement with GoS, GIC has been giventhe sole discretion to exercise the voting rights attached to, and the disposition of, any shares managed on behalf of GoS.As such, GIC has the sole power to vote and dispose of the 17,057,026 securities beneficially owned by it. GIC sharespower to vote and dispose of 5,616,152 securities beneficially owned by it with MAS. GIC disclaims membership in a group.The address of GIC is 168, Robinson Road, #37-01, Capital Tower, Singapore 068912. All information is based solely onAmendment No. 1 to Statement on Schedule 13G filed on February 2, 2016.
(3) The Vanguard Group has sole power to vote or direct the vote over 555,340 shares, shared power to vote or direct the voteover 30,500 shares, sole power to dispose or direct the disposition of 19,543,480 shares, and shared power to dispose ordirect the disposition of 578,952 shares. Vanguard Fiduciary Trust Company, a wholly owned subsidiary of The VanguardGroup, Inc., is the beneficial owner of 458,352 shares as a result of its serving as investment manager of collective trustaccounts, and Vanguard Investments Australia, Ltd., a wholly-owned subsidiary of The Vanguard Group, Inc., is thebeneficial owner of 217,588 shares as a result of its serving as investment manager of Australian investment offerings. Theaddress of The Vanguard Group is 100 Vanguard Blvd, Malvern, Pennsylvania 19355. All information is based solely onAmendment No. 2 to Statement on Schedule 13G filed on February 11, 2016.
51

Prox
y
Security Ownership of Officers and Directors
The following table shows the amount of our common stock beneficially owned as of March 17,2016 by our current directors and our named executive officers individually and by our current directorsand all of our current executive officers as a group. Unless otherwise noted, these persons may becontacted at our executive offices.
Amount and Nature of Percent ofName of Beneficial Owner Beneficial Ownership Class
Warren F. Bryant(1)(2) 25,357 *Michael M. Calbert(1)(2)(3) 69,371 *Sandra B. Cochran(1)(2) 12,107 *Patricia D. Fili-Krushel(1) 10,735 *Paula A. Price(1)(2) 3,446 *William C. Rhodes, III(1)(2)(4) 41,342 *David B. Rickard(1)(2) 25,573 *Todd J. Vasos(1) 144,601 *Richard W. Dreiling(1) 152,049 *John W. Garratt(1) 4,586 *David M. Tehle — —John W. Flanigan(1) 53,877 *Robert D. Ravener(1) 168,885 *Rhonda M. Taylor(1) 37,853 *Gregory A. Sparks — —All current directors and executive officers as a group
(15 persons)(1)(2)(3)(4) 630,172 *
* Denotes less than 1% of class.
(1) Includes the following number of shares underlying RSUs (including additional RSUs credited as a result of dividendequivalents earned with respect to the RSUs) that are or could be settleable within 60 days of March 17, 2016 overwhich the person will not have voting or investment power until the RSUs are settled: Mr. Bryant (3,011); Mr. Calbert(4,179); Ms. Cochran (2,050); Ms. Price and Mr. Rhodes (1,682); Mr. Rickard (5,190); Mr. Vasos (6,332); Mr. Garratt(403); Messrs. Flanigan and Ravener (5,223); Ms. Taylor (2,086); and all current directors and executive officers as agroup (38,651). Also includes the following number of shares subject to options either currently exercisable orexercisable within 60 days of March 17, 2016 over which the person will not have voting or investment power until theoptions are exercised: each of Messrs. Bryant, Calbert and Rhodes (15,088); Ms. Cochran (6,426); Ms. Fili-Krushel(6,255); Ms. Price (1,201); Mr. Rickard (14,845); Mr. Vasos (89,661); Mr. Dreiling (135,311); Mr. Garratt (3,762);Mr. Flanigan (38,352); Mr. Ravener (150,385); Ms. Taylor (30,808); and all current directors and executive officers as agroup (402,636). Further includes the following number of shares underlying earned PSUs that are or could besettleable within 60 days of March 17, 2016 over which the person will not have voting or investment power until thePSUs are settled: Mr. Vasos (4,991); Mr. Garratt (421); Mr. Flanigan (6,920); Mr. Ravener (3,887); Ms. Taylor (1,977);and all current directors and executive officers as a group (19,380). The shares described in this note are consideredoutstanding for the purpose of computing the percentage of outstanding stock owned by each named person and by thegroup but not for the purpose of computing the percentage ownership of any other person.
(2) Share totals have been rounded to the nearest whole share to simplify reporting.
(3) Mr. Calbert shares voting and investment power over 38,000 shares with his spouse, Barbara Calbert, as co-trustee ofThe Michael and Barbara Calbert 2007 Joint Revocable Trust.
(4) Mr. Rhodes shares voting and investment power over 23,597 shares with his spouse, Amy Rhodes, as power of attorneyof The Amy Plunkett Rhodes Revocable Living Trust, dated July 30, 2014.
52

Proxy
AUDIT COMMITTEE REPORT
The Audit Committee of our Board of Directors has:
• reviewed and discussed with management the audited financial statements for the fiscalyear ended January 29, 2016,
• discussed with Ernst & Young LLP, our independent registered public accounting firm, thematters required to be discussed by the Statement on Auditing Standards No. 16,Communication with Audit Committees, as adopted by the Public Company AccountingOversight Board,
• received the written disclosures and the letter from Ernst & Young LLP required byapplicable requirements of the Public Company Accounting Oversight Board regarding theindependent registered public accounting firm’s communications with the Audit Committeeconcerning independence, and
• discussed with Ernst & Young LLP their independence from Dollar General and itsmanagement.
Based on these reviews and discussions, the Audit Committee unanimously recommended tothe Board of Directors that Dollar General’s audited financial statements be included in the AnnualReport on Form 10-K for the fiscal year ended January 29, 2016 for filing with the SEC.
While the Audit Committee has the responsibilities and powers set forth in its charter, theAudit Committee does not have the duty to plan or conduct audits or to determine that DollarGeneral’s financial statements are complete, accurate, or in accordance with generally acceptedaccounting principles. Dollar General’s management and independent auditor have this responsibility.The Audit Committee also does not have the duty to assure compliance with laws and regulations orwith the policies of the Board of Directors.
This report has been furnished by the members of the Audit Committee:
• David B. Rickard, Chairman
• Warren F. Bryant
• Sandra B. Cochran
• Paula A. Price
The above Audit Committee Report does not constitute soliciting material and should not bedeemed filed or incorporated by reference into any other Dollar General filing under the Securities Act of1933 or the Securities Exchange Act of 1934, except to the extent Dollar General specifically incorporatesthis report by reference therein.
53

Prox
y
PROPOSAL 2:RATIFICATION OF APPOINTMENT OF AUDITORS
Who is responsible for the selection of the independent auditor?
The Audit Committee is directly responsible for the appointment, compensation, retention andoversight of the independent auditor that is retained to audit our financial statements.
Was the Audit Committee involved in the lead audit partner selection process?
Yes. Prior to the selection of the current lead audit partner, the Chairman of the AuditCommittee interviewed the lead audit partner candidates, and the Audit Committee discussed withmanagement such candidates’ qualifications and experience.
Does the Audit Committee evaluate the independent auditor and the lead audit partner?
Yes. The Audit Committee annually evaluates the lead audit partner, as well as theindependent auditor’s qualifications, performance and independence. The evaluation, which includesthe input of management, entails consideration of a broad range of factors, including the quality ofservices and sufficiency of resources that have been provided; the skills, knowledge and experience ofthe firm and the audit team; the effectiveness and sufficiency of communications and interactions;independence and level of objectivity and professional skepticism; reasonableness of fees; and otherfactors.
Who has the Audit Committee selected as the independent registered public accounting firm?
After conducting the evaluation process discussed above, the Audit Committee selectedErnst & Young LLP as our independent auditor for the 2016 fiscal year. Ernst & Young LLP hasserved in that capacity since October 2001. The Audit Committee and the Board of Directors believethat the continued retention of Ernst & Young LLP is in the best interests of Dollar General and ourshareholders.
Will representatives of Ernst & Young LLP attend the annual meeting?
Representatives of Ernst & Young LLP have been requested and are expected to attend theannual meeting. These representatives will have the opportunity to make a statement if they so desireand are expected to be available to respond to appropriate questions.
What does the Board of Directors recommend?
Our Board unanimously recommends that you vote FOR the ratification of Ernst &Young LLP as our independent auditor for the 2016 fiscal year. The Audit Committee is not bound bya vote either for or against the firm. If the shareholders do not ratify this appointment, our AuditCommittee will consider that result in selecting our independent auditor in the future.
54

Proxy
FEES PAID TO AUDITORS
What fees were paid to the independent auditor in 2015 and 2014?
The table below lists the aggregate fees for professional audit services rendered to us byErnst & Young LLP for the audit of our consolidated financial statements for the past two fiscal yearsand fees billed for other services rendered by Ernst & Young LLP during the past two fiscal years:
Service 2015 Aggregate Fees Billed ($) 2014 Aggregate Fees Billed ($)
Audit Fees(1) 2,272,623 2,071,205Audit-Related Fees(2) 32,000 30,000Tax Fees(3) 1,910,042 1,652,136All Other Fees(4) 1,995 1,920
(1) Represents for each fiscal year the aggregate fees billed for professional services for the audit of our annualfinancial statements and review of financial statements included in our Forms 10-Q and services that are normallyprovided in connection with statutory and regulatory filings or engagements.
(2) Represents for each fiscal year the aggregate fees billed for assurance and related services that are reasonablyrelated to the performance of the audit or review of our financial statements. The fees for each year relate to theemployee benefit plan audit.
(3) 2015 and 2014 fees relate primarily to tax compliance services, which represented $1,805,042 and $1,547,136 in2015 and 2014, respectively, for work related to work opportunity tax credit assistance and foreign sourcing offices’tax compliance. The remaining tax fees for each such year are for tax advisory services related to inventory.
(4) 2015 and 2014 fees are for a subscription fee to an on-line accounting research tool.
How does the Audit Committee pre-approve services provided by the independent auditor?
The Audit Committee pre-approves all audit and permissible non-audit services provided byour independent auditor. Where feasible, the Committee considers and, when appropriate,pre-approves services at regularly scheduled meetings after disclosure by management and theindependent auditor of the nature of the proposed services, the estimated fees (when available), andtheir opinions that the services will not impair the independence of the independent auditor. TheCommittee’s Chairman (or any Committee member if the Chairman is unavailable) may pre-approvesuch services between Committee meetings, and must report to the Committee at its next meeting withrespect to all services so pre-approved. The Committee pre-approved 100% of the services provided byErnst & Young LLP during 2015 and 2014.
55

Prox
y
SECTION 16(a) BENEFICIAL OWNERSHIPREPORTING COMPLIANCE
The U.S. securities laws require our executive officers, directors, and greater than 10%shareholders to file reports of ownership and changes in ownership on Forms 3, 4 and 5 with the SEC.Based solely upon a review of these reports furnished to us during and with respect to 2015, or writtenrepresentations that no Form 5 reports were required, we believe that each of those persons filed, on atimely basis, the reports required by Section 16(a) of the Exchange Act, except that (1) Ms. Price filed1 late Form 4 to report 1 open market purchase of shares of Dollar General common stock; and (2) asa result of an administrative oversight, Mr. Vasos filed 1 late Form 4 to correct the number of shares ofDollar General common stock underlying an RSU and stock option grant and the number of securitiesbeneficially owned after such transaction, which were previously incorrectly reported on a timely-filedForm 4.
SHAREHOLDER PROPOSALSFOR 2017 ANNUAL MEETING
To be considered for inclusion in our proxy materials relating to the 2017 annual meeting ofshareholders, eligible shareholders must submit proposals that comply with relevant SEC regulations forour receipt by December 9, 2016. To introduce other new business at the 2017 annual meeting, youmust deliver written notice to us no earlier than the close of business on January 25, 2017 and no laterthan the close of business on February 24, 2017, and comply with the advance notice provisions of ourBylaws. If we do not receive a properly submitted shareholder proposal by February 24, 2017, then theproxies held by our management may provide the discretion to vote against such shareholder proposaleven though the proposal is not discussed in our proxy materials sent in connection with the 2017annual meeting of shareholders.
Shareholder proposals should be mailed to Corporate Secretary, Dollar General Corporation,100 Mission Ridge, Goodlettsville, Tennessee 37072. Shareholder proposals that are not included in ourproxy materials will not be considered at any annual meeting of shareholders unless such proposalshave complied with the requirements of our Bylaws.
56

Proxy
Appendix A
Subset of Companies from Aon Hewitt Total Compensation MeasurementTM (TCM)Database Used for Certain Officers
Academy Sports & Outdoors, Ltd. Lowe’s Companies, Inc.ANN INC. Macy’s Inc.Belk, Inc. McDonald’s CorporationBest Buy Co., Inc. Meijer, Inc.BJ’s Wholesale Club, Inc. The Neiman Marcus Group, Inc.The Bon-Ton Stores Office Depot, Inc.Brinker International Inc. OfficeMax IncorporatedCDW Corporation Papa John’s International, Inc.The Children’s Place Retail Stores PetSmart, Inc.Coach, Inc. Pier 1 Imports, Inc.CVS PVH Corp.Delhaize America Rent-A-CenterDomino’s Pizza, Inc. Rite Aid CorporationDSW Inc. Safeway Inc.Eddie Bauer Inc. Sears Holdings CorporationFollett Corporation Sonic Automotive, Inc.FTD, Inc. Starbucks CorporationGenuine Parts Company SUPERVALU INC.The Home Depot, Inc. Target CorporationHot Topic, Inc. Ulta Salon, Cosmetics & Fragrance, Inc.Hy-Vee, Inc. Wal-Mart Stores, Inc.J. C. Penney Company, Inc. Walgreen CompanyJack in the Box Inc. Wegmans Food Markets, Inc.Jo-Ann Stores, LLC The Wendy’s CompanyThe Kroger Co. Williams-Sonoma, Inc.L.L. Bean, Inc. YUM Brands, Inc.
Zale Corporation
57


10-K


10-K
UNITED STATESSECURITIES AND EXCHANGE COMMISSION
Washington, D.C. 20549
FORM 10-KANNUAL REPORT PURSUANT TO SECTION 13 OR 15(d) OF THE
SECURITIES EXCHANGE ACT OF 1934
For the fiscal year ended January 29, 2016
Commission file number: 001-11421
DOLLAR GENERAL CORPORATION(Exact name of registrant as specified in its charter)
TENNESSEE 61-0502302(State or other jurisdiction of (I.R.S. Employerincorporation or organization) Identification No.)
100 MISSION RIDGEGOODLETTSVILLE, TN 37072
(Address of principal executive offices, zip code)
Registrant’s telephone number, including area code: (615) 855-4000
Securities registered pursuant to Section 12(b) of the Act:
Title of each class Name of the exchange on which registered
Common Stock, par value $0.875 per share New York Stock Exchange
Securities registered pursuant to Section 12(g) of the Act: None
Indicate by check mark if the registrant is a well-known seasoned issuer, as defined in Rule 405 of the SecuritiesAct. Yes � No �
Indicate by check mark if the registrant is not required to file reports pursuant to Section 13 or 15(d) of theAct. Yes � No �
Indicate by check mark whether the registrant (1) has filed all reports required to be filed by Section 13 or 15(d) ofthe Securities Exchange Act of 1934 during the preceding 12 months (or for such shorter period that the registrant wasrequired to file such reports), and (2) has been subject to such filing requirements for the past 90 days. Yes � No �
Indicate by check mark whether the registrant has submitted electronically and posted on its corporate Web site, ifany, every Interactive Data File required to be submitted and posted pursuant to Rule 405 of Regulation S-T during thepreceding 12 months (or for such shorter period that the registrant was required to submit and post suchfiles). Yes � No �
Indicate by check mark if disclosure of delinquent filers pursuant to Item 405 of Regulation S-K is not containedherein, and will not be contained, to the best of registrant’s knowledge, in definitive proxy or information statementsincorporated by reference in Part III of this Form 10-K or any amendment to this Form 10-K. �
Indicate by check mark whether the registrant is a large accelerated filer, an accelerated filer, a non-acceleratedfiler, or a smaller reporting company. See the definitions of ‘‘large accelerated filer,’’ ‘‘accelerated filer’’ and ‘‘smallerreporting company’’ in Rule 12b-2 of the Exchange Act.
Large accelerated filer � Accelerated filer � Non-accelerated filer � Smaller reporting company �
Indicate by check mark whether the registrant is a shell company (as defined in Rule 12b-2 of the ExchangeAct). Yes � No �
The aggregate fair market value of the registrant’s common stock outstanding and held by non-affiliates as ofJuly 31, 2015 was $23.66 billion calculated using the closing market price of our common stock as reported on the NYSEon such date ($80.37). For this purpose, directors, executive officers and greater than 10% record shareholders areconsidered the affiliates of the registrant.
The registrant had 286,468,872 shares of common stock outstanding as of March 15, 2016.
DOCUMENTS INCORPORATED BY REFERENCE
Certain of the information required in Part III of this Form 10-K is incorporated by reference to the Registrant’sdefinitive proxy statement to be filed for the Annual Meeting of Shareholders to be held on May 25, 2016.


10-K
INTRODUCTION
General
This report contains references to years 2016, 2015, 2014, 2013, 2012, and 2011, which representfiscal years ending or ended February 3, 2017, January 29, 2016, January 30, 2015, January 31, 2014,February 1, 2013, and February 3, 2012, respectively. Our fiscal year ends on the Friday closest toJanuary 31. 2016 will consist and 2011 consisted of 53 weeks, while each of the remaining years listedwere 52-week years. All of the discussion and analysis in this report should be read with, and isqualified in its entirety by, the Consolidated Financial Statements and related notes.
Solely for convenience, our trademarks and tradenames may appear in this report withoutthe � or � symbol which is not intended to indicate that we will not assert, to the fullest extent underapplicable law, our rights or the right to these trademarks and tradenames.
Cautionary Disclosure Regarding Forward-Looking Statements
We include ‘‘forward-looking statements’’ within the meaning of the federal securities lawsthroughout this report, particularly under the headings ‘‘Business,’’ ‘‘Management’s Discussion andAnalysis of Financial Condition and Results of Operations,’’ and ‘‘Note 8—Commitments andContingencies,’’ among others. You can identify these statements because they are not limited tohistorical fact or they use words such as ‘‘may,’’ ‘‘will,’’ ‘‘should,’’ ‘‘could,’’ ‘‘would,’’ ‘‘believe,’’‘‘anticipate,’’ ‘‘project,’’ ‘‘plan,’’ ‘‘expect,’’ ‘‘estimate,’’ ‘‘forecast,’’ ‘‘goal,’’ ‘‘potential,’’ ‘‘opportunity,’’‘‘intend,’’ ‘‘predict,’’ ‘‘committed,’’ ‘‘will likely result,’’ or ‘‘will continue’’ and similar expressions thatconcern our strategy, plans, intentions or beliefs about future occurrences or results. For example, allstatements relating to our estimated and projected expenditures, cash flows, results of operations,financial condition and liquidity; our plans, objectives and expectations for future operations, growth orinitiatives; or the expected outcome or effect of legislative or regulatory changes or initiatives, pendingor threatened litigation or audits are forward-looking statements.
All forward-looking statements are subject to risks and uncertainties that may change at any time,so our actual results may differ materially from those that we expected. We derive many of thesestatements from our operating budgets and forecasts, which are based on many detailed assumptionsthat we believe are reasonable. However, it is very difficult to predict the effect of known factors, andwe cannot anticipate all factors that could affect our actual results.
Important factors that could cause actual results to differ materially from the expectationsexpressed in our forward-looking statements are disclosed under ‘‘Risk Factors’’ in Part I, Item 1A andelsewhere in this document (including, without limitation, in conjunction with the forward-lookingstatements themselves and under the heading ‘‘Critical Accounting Policies and Estimates’’). Allforward-looking statements are qualified in their entirety by these and other cautionary statements thatwe make from time to time in our other SEC filings and public communications. You should evaluatesuch statements in the context of these risks and uncertainties. These factors may not contain all of thefactors that are important to you. We cannot assure you that we will realize the results or developmentswe anticipate or, even if substantially realized, that they will result in the consequences or affect us inthe way we expect. Forward-looking statements are made only as of the date hereof. We undertake noobligation to publicly update or revise any forward-looking statement as a result of new information,future events or otherwise, except as otherwise required by law.
1

10-K
PART I
ITEM 1. BUSINESS
General
We are among the largest discount retailers in the United States by number of stores, with12,575 stores located in 43 states as of February 26, 2016, with the greatest concentration of stores inthe southern, southwestern, midwestern and eastern United States. We offer a broad selection ofmerchandise, including consumables, seasonal, home products and apparel. Our merchandise includeshigh quality national brands from leading manufacturers, as well as comparable quality private brandselections with prices at substantial discounts to national brands. We offer our merchandise at everydaylow prices through our convenient small-box locations.
Our History
J.L. Turner founded our Company in 1939 as J.L. Turner and Son, Wholesale. We wereincorporated as a Kentucky corporation under the name J.L. Turner & Son, Inc. in 1955, when weopened our first Dollar General store. We changed our name to Dollar General Corporation in 1968and reincorporated in 1998 as a Tennessee corporation. Our common stock was publicly traded from1968 until July 2007, when we merged with an entity controlled by investment funds affiliated withKohlberg Kravis Roberts & Co. L.P., or KKR. In November 2009 our common stock again becamepublicly traded, and in December 2013 the entity controlled by investment funds affiliated with KKRsold its remaining shares of our common stock.
Our Business Model
Our long history of profitable growth is founded on a commitment to a relatively simple businessmodel: providing a broad base of customers with their basic everyday and household needs,supplemented with a variety of general merchandise items, at everyday low prices in convenientlylocated, small-box stores. We continually evaluate the needs and demands of our customers and modifyour merchandise selections and pricing accordingly, while remaining focused on increasing profitabilityand returns for our shareholders.
Our operating priorities are summarized as follows: 1) driving profitable sales growth, 2) capturinggrowth opportunities, 3) enhancing our position as a low-cost operator, and 4) investing in our peopleas a competitive advantage. For more information on these operating priorities, see Management’sDiscussion and Analysis of Financial Condition and Results of Operations, under the heading‘‘Executive Overview’’, included in Part II, Item 7 of this report.
In fiscal year 2015, we achieved our 26th consecutive year of same-store sales growth. This growth,which has taken place in a variety of economic conditions, suggests that we have a less cyclical businessmodel than most retailers and, we believe, is a result of our compelling value and convenienceproposition.
Compelling Value and Convenience Proposition. Our ability to deliver highly competitive prices inconvenient locations and our easy ‘‘in and out’’ shopping format create a compelling shoppingexperience that distinguishes us from other discount retailers as well as convenience, drug and groceryretailers. Our slogan ‘‘Save time. Save money. Every day!’’ summarizes our appeal to customers. Webelieve our ability to effectively deliver both value and convenience allows us to succeed in smallmarkets with limited shopping alternatives, as well as to profitably coexist alongside larger retailers in
2

10-K
more competitive markets. Our value and convenience proposition is evidenced by the followingattributes of our business model:
• Convenient Locations. Our stores are conveniently located in a variety of rural, suburban andurban communities. We seek to locate our stores in close proximity to our customers, whichdrives customer loyalty and trip frequency and makes us an attractive alternative to largediscount and other large-box retail and grocery stores.
• Time-Saving Shopping Experience. We also provide customers with a highly convenient, easy tonavigate shopping experience. Our small box stores are easy to get in and out of quickly. Ourproduct offering includes most necessities, such as basic packaged and refrigerated food anddairy products, cleaning supplies, paper products, health and beauty care items, greeting cards,basic apparel, housewares, hardware and automotive supplies, among others. Our convenienthours and broad merchandise offering allow our customers to fulfill their routine shoppingrequirements and minimize their need to shop elsewhere.
• Everyday Low Prices on Quality Merchandise. Our research indicates that we offer a priceadvantage over most food and drug retailers and that our prices are highly competitive with eventhe largest discount retailers. Our ability to offer everyday low prices on quality merchandise issupported by our low-cost operating structure and our strategy to maintain a limited number ofitems per merchandise category, which we believe helps us maintain strong purchasing power.We offer quality nationally advertised brands at these everyday low prices in addition to offeringour own comparable quality private brands at value prices.
Substantial Growth Opportunities. We believe we have substantial long-term growth potential in theU.S. We have identified significant opportunities to add new stores in both existing and new markets.In addition, we have opportunities to relocate or remodel locations within our existing store base tobetter serve our customers. Our attractive store economics, including a relatively low initial investmentand simple, low-cost operating model have allowed us to grow our store base to current levels andprovide us significant opportunities to continue our profitable store growth strategy.
Our Merchandise
We offer a focused assortment of everyday necessities, which drive frequent customer visits, andkey items in a broad range of general merchandise categories. Our product assortment provides theopportunity for our customers to address most of their basic shopping needs with one trip. We sellhigh-quality nationally advertised brands from leading manufacturers. Additionally, our private brandconsumables offer even greater value with options to purchase value items and national brandequivalent products at substantial discounts to the national brand.
Consumables is our largest merchandise category and has become a larger percentage of our totalsales in recent years as indicated in the table below. Consumables include paper and cleaning products(such as paper towels, bath tissue, paper dinnerware, trash and storage bags, laundry and other homecleaning supplies); packaged food (such as cereals, canned soups and vegetables, condiments, spices,sugar and flour); perishables (such as milk, eggs, bread, frozen meals, beer and wine); snacks (such ascandy, cookies, crackers, salty snacks and carbonated beverages); health and beauty (such asover-the-counter medicines and personal care products, such as soap, body wash, shampoo, dentalhygiene and foot care products); pet (such as pet supplies and pet food); and tobacco products.
Seasonal products include decorations, toys, batteries, small electronics, greeting cards, stationery,prepaid phones and accessories, gardening supplies, hardware, automotive and home office supplies.
Home products include kitchen supplies, cookware, small appliances, light bulbs, storagecontainers, frames, candles, craft supplies and kitchen, bed and bath soft goods.
3

10-K
Apparel includes casual everyday apparel for infants, toddlers, girls, boys, women and men, as wellas socks, underwear, disposable diapers, shoes and accessories.
The percentage of net sales of each of our four categories of merchandise for the fiscal yearsindicated below was as follows:
2015 2014 2013
Consumables . . . . . . . . . . . . . . . . . . . . . . . . . . . . . . . . . . . . . 75.9% 75.7% 75.2%Seasonal . . . . . . . . . . . . . . . . . . . . . . . . . . . . . . . . . . . . . . . . 12.4% 12.4% 12.9%Home products . . . . . . . . . . . . . . . . . . . . . . . . . . . . . . . . . . . 6.3% 6.4% 6.4%Apparel . . . . . . . . . . . . . . . . . . . . . . . . . . . . . . . . . . . . . . . . . 5.4% 5.5% 5.5%
Our seasonal and home products categories typically account for the highest gross profit margins,and the consumables category typically accounts for the lowest gross profit margin.
The Dollar General Store
The typical Dollar General store is operated by a store manager, one or more assistant storemanagers, and three or more sales associates. Our stores generally feature a low-cost, no frills buildingwith limited maintenance capital, low operating costs, and a focused merchandise offering within abroad range of categories, allowing us to deliver low retail prices while generating strong cash flowsand investment returns. Our stores average approximately 7,400 square feet of selling space andapproximately 70% of our stores are located in towns of 20,000 or fewer people. We generally have hadgood success in locating suitable store sites in the past, and we believe that there is ample opportunityfor new store growth in existing and new markets. In addition, we believe we have significantopportunities available for our relocation and remodel programs.
Our store growth over the past three years is summarized in the following table:
Stores at NetBeginning Stores Stores Store Stores at
Year of Year Opened Closed Increase End of Year
2013 . . . . . . . . . . . . . . . . . . . . . . . 10,506 650 24 626 11,1322014 . . . . . . . . . . . . . . . . . . . . . . . 11,132 700 43 657 11,7892015 . . . . . . . . . . . . . . . . . . . . . . . 11,789 730 36 694 12,483
Our Customers
Our customers seek value and convenience. Depending on their financial situation and geographicproximity, customers’ reliance on Dollar General varies from fill-in shopping, to making periodic tripsto stock up on household items, to making weekly or more frequent trips to meet most essential needs.We generally locate our stores and plan our merchandise selections to best serve the needs of our corecustomers, the low and fixed income households often underserved by other retailers, and we arefocused on helping them make the most of their spending dollars. At the same time, however, loyalDollar General shoppers from a wide range of income brackets and life stages appreciate our qualitymerchandise as well as our attractive value and convenience proposition.
Our Suppliers
We purchase merchandise from a wide variety of suppliers and maintain direct buying relationshipswith many producers of national brand merchandise. Despite our broad offering, we maintain only alimited number of items per category, giving us a pricing advantage in dealing with our suppliers. Ourlargest and second largest suppliers each accounted for approximately 7% of our purchases in 2015.
4

10-K
Our private brands come from a diversified supplier base. We directly imported approximately 6% ofour purchases at cost in 2015.
We have consistently managed to obtain sufficient quantities of core merchandise and believe that,if one or more of our current sources of supply became unavailable, we would generally be able toobtain alternative sources without experiencing a substantial disruption of our business. However, suchalternative sources could increase our merchandise costs or reduce the quality of our merchandise, andan inability to obtain alternative sources could adversely affect our sales.
Distribution and Transportation
Our stores are currently supported by thirteen distribution centers located strategically throughoutour geographic footprint. We recently broke ground on our fourteenth distribution center in Wisconsin.We lease additional temporary warehouse space as necessary to support our distribution needs. Wecontinually analyze and rebalance the network to ensure that it remains efficient and provides theservice our stores require. See ‘‘—Properties’’ for additional information pertaining to our distributioncenters.
Most of our merchandise flows through our distribution centers and is delivered to our stores bythird-party trucking firms, utilizing our trailers. In addition, vendors or third-party distributors shipcertain food items and other merchandise directly to our stores.
Seasonality
Our business is seasonal to a certain extent. Generally, our highest sales volume occurs in thefourth quarter, which includes the Christmas selling season, and the lowest occurs in the first quarter.In addition, our quarterly results can be affected by the timing of certain holidays, the timing of newstore openings and store closings, and the amount of sales contributed by new and existing stores. Wetypically purchase substantial amounts of inventory in the third quarter and incur higher shipping andpayroll costs in anticipation of increased sales activity during the fourth quarter. See Note 14 to theconsolidated financial statements for additional information.
Our Competition
We operate in the basic discount consumer goods market, which is highly competitive with respectto price, store location, merchandise quality, assortment and presentation, in-stock consistency, andcustomer service. We compete with discount stores and with many other retailers, including massmerchandise, warehouse club, grocery, drug, convenience, variety and other specialty stores. Theseother retail companies operate stores in many of the areas where we operate, and many of themengage in extensive advertising and marketing efforts. Our direct competitors include Family Dollar,Dollar Tree, Fred’s, 99 Cents Only and various local, independent operators, as well as Walmart, Target,Kroger, Aldi, Walgreens, CVS, and Rite Aid, among others. Certain of our competitors have greaterfinancial, distribution, marketing and other resources than we do.
We differentiate ourselves from other forms of retailing by offering consistently low prices in aconvenient, small-store format. We believe that our prices are competitive due in part to our low-costoperating structure and the relatively limited assortment of products offered. Purchasing large volumesof merchandise within our focused assortment in each merchandise category allows us to keep ouraverage costs low, contributing to our ability to offer competitive everyday low prices to our customers.See ‘‘—Our Business Model’’ above for further discussion of our competitive situation.
5

10-K
Our Employees
As of February 26, 2016, we employed approximately 113,400 full-time and part-time employees,including divisional and regional managers, district managers, store managers, other store personneland distribution center and administrative personnel. We have increasingly focused on recruiting,training, motivating and retaining employees, and we believe that the quality, performance and moraleof our employees have increased as a result. We currently are not a party to any collective bargainingagreements.
Our Trademarks
We own marks that are registered with the United States Patent and Trademark Office and areprotected under applicable intellectual property laws, including without limitation the trademarksDollar General�, Dollar General Market�, Clover Valley�, DG�, DG Deals�, Forever Pals�,I*Magine�, OT Sport�, Smart & Simple�, trueliving�, Sweet Smiles�, Open Trails�, Bobbie Brooks�,Comfort Bay�, Holiday Style�, Swiggles�, More Deals For Your Dollar. Every Day!�, The Fast Way ToSave�, Save Time. Save Money. Every Day!�, and Ever PetTM along with variations and formatives ofthese trademarks as well as certain other trademarks. We attempt to obtain registration of ourtrademarks whenever practicable and to pursue vigorously any infringement of those marks. Ourtrademark registrations have various expiration dates; however, assuming that the trademarkregistrations are properly renewed, they have a perpetual duration.
We also hold an exclusive license to the Rexall brand through March 5, 2020.
Available Information
Our Internet website address is www.dollargeneral.com. We file with or furnish to the Securitiesand Exchange Commission (the ‘‘SEC’’) annual reports on Form 10-K, quarterly reports on Form 10-Q,current reports on Form 8-K, and amendments to those reports, proxy statements and annual reports toshareholders, and, from time to time, registration statements and other documents. These documentsare available free of charge to investors on or through the Investor Information section of our websiteas soon as reasonably practicable after we electronically file them with or furnish them to the SEC. Inaddition, the public may read and copy any of the materials we file with the SEC at the SEC’s PublicReference Room at 100 F Street, NE, Washington DC 20549. The public may obtain information onthe operation of the Public Reference Room by calling the SEC at 1-800-SEC-0330. The SECmaintains an internet site that contains reports, proxy and information statements and otherinformation regarding issuers, such as Dollar General, that file electronically with the SEC. The addressof that website is http://www.sec.gov.
6

10-K
ITEM 1A. RISK FACTORS
You should carefully consider the risks described below and the other information contained in thisreport and other filings that we make from time to time with the SEC, including our consolidatedfinancial statements and accompanying notes. Any of the following risks could materially and adverselyaffect our business, financial condition, results of operations or liquidity. These risks are not the onlyrisks we face. Our business, financial condition, results of operations or liquidity could also be adverselyaffected by additional factors that apply to all companies generally or by risks not currently known tous or that we currently view to be immaterial. We can provide no assurance and make norepresentation that our risk mitigation efforts, although we believe they are reasonable, will besuccessful.
Economic conditions and other economic factors may adversely affect our financial performance andother aspects of our business by negatively impacting our customers’ disposable income or discretionaryspending, increasing our costs of goods sold and selling, general and administrative expenses, and adverselyaffecting our sales or profitability.
We believe many of our customers have fixed or low incomes and generally have limiteddiscretionary spending dollars. Any factor that could adversely affect that disposable income woulddecrease our customers’ spending and could cause our customers to shift their spending to productsother than those sold by us or to our less profitable product choices, all of which could result in lowernet sales, decreases in inventory turnover, greater markdowns on inventory, a change in the mix ofproducts we sell, and a reduction in profitability due to lower margins. Factors that could reduce ourcustomers’ disposable income and over which we exercise no influence include but are not limited toadverse economic conditions such as increased or sustained high unemployment or underemploymentlevels, inflation, increases in fuel or other energy costs and interest rates, lack of available credit,consumer debt levels, higher tax rates and other changes in tax laws, concerns over governmentmandated participation in health insurance programs and increasing healthcare costs, and decreases ingovernment subsidies such as unemployment and food assistance programs.
Many of the factors identified above that affect disposable income, as well as commodity rates,transportation costs (including the costs of diesel fuel), costs of labor, insurance and healthcare, foreignexchange rate fluctuations, lease costs, measures that create barriers to or increase the costs associatedwith international trade, changes in other laws and regulations and other economic factors, also affectour cost of goods sold and our selling, general and administrative expenses, and may have otheradverse consequences which we are unable to fully anticipate or control, all of which may adverselyaffect our sales or profitability. We have limited or no ability to control many of these factors.
Our plans depend significantly on strategies and initiatives designed to increase sales and improve theefficiencies, costs and effectiveness of our operations, and failure to achieve or sustain these plans could affectour performance adversely.
We have strategies and initiatives (such as those relating to merchandising, sourcing, shrink, privatebrand, distribution and transportation, store operations, store formats, budgeting and expensereduction, and real estate) in various stages of testing, evaluation, and implementation, upon which weexpect to rely to continue to improve our results of operations and financial condition and to achieveour financial plans. These initiatives are inherently risky and uncertain, even when tested successfully,in their application to our business in general. It is possible that successful testing can result partiallyfrom resources and attention that cannot be duplicated in broader implementation, particularly in lightof the diverse geographic locations of our stores and the decentralized nature of our field management.General implementation also may be negatively affected by other risk factors described herein.Successful systemwide implementation relies on consistency of training, stability of workforce, ease ofexecution, and the absence of offsetting factors that can influence results adversely. Failure to achieve
7

10-K
successful implementation of our initiatives or the cost of these initiatives exceeding management’sestimates could adversely affect our business, results of operations and financial condition.
The success of our merchandising initiatives, particularly those with respect to non-consumablemerchandise and store-specific products and allocations, depends in part upon our ability to predictconsistently and successfully the products that our customers will demand and to identify and timelyrespond to evolving trends in demographics and consumer preferences, expectations and needs. If weare unable to select products that are attractive to customers, to timely obtain such products at coststhat allow us to sell them at an acceptable profit, or to effectively market such products, our sales,market share and profitability could be adversely affected. If our merchandising efforts in thenon-consumables area or the higher margin areas within consumables are unsuccessful, we could befurther adversely affected by our inability to offset the lower margins associated with our consumablesbusiness. Further, our merchandising efforts in the consumables area, including tobacco products, maynot generate the net sales growth and increase customer traffic to the levels needed to offset the lowermargins generated by sales of consumables and maintain our targeted gross profit margins.
If we cannot open, relocate or remodel stores profitably and on schedule, our planned future growth willbe impeded, which would adversely affect sales.
Our ability to open, relocate and remodel profitable stores is a key component of our plannedfuture growth. Our ability to timely open stores and to expand into additional market areas depends inpart on the following factors: the availability of attractive store locations; the absence of entitlementprocess or occupancy delays; the ability to negotiate acceptable lease and development terms; theability to hire and train new personnel, especially store managers, in a cost effective manner; the abilityto identify customer demand in different geographic areas; general economic conditions; and theavailability of capital funding for expansion. Many of these factors also affect our ability to successfullyrelocate stores, and many of them are beyond our control.
Delays or failures in opening new stores or completing relocations or remodels, or achieving lowerthan expected sales in these projects, could materially adversely affect our growth and/or profitability.We also may not anticipate all of the challenges imposed by the expansion of our operations and, as aresult, may not meet our targets for opening new stores, remodeling or relocating stores or expandingprofitably.
Some new stores and future new store opportunities may be located in areas, including but notlimited to new states or metro urban areas, where we have limited or no meaningful experience orbrand recognition. Those areas may have different competitive and market conditions, consumer tastesand discretionary spending patterns than our existing markets, as well as higher cost of entry. Thesefactors may cause our new stores to be initially less successful than stores in our existing markets, whichcould slow future growth in these areas.
Many new stores will be located in areas where we have existing stores. Although we haveexperience in these areas, increasing the number of locations in these markets may result in inadvertentoversaturation and temporarily or permanently divert customers and sales from our existing stores,thereby adversely affecting our overall financial performance.
Our profitability may be negatively affected by inventory shrinkage.
We are subject to the risk of inventory loss and theft. We experience significant inventoryshrinkage and cannot be sure that incidences of inventory loss and theft will decrease in the future orthat the measures we are taking will effectively reduce the problem of inventory shrinkage. Althoughsome level of inventory shrinkage is an unavoidable cost of doing business, if we were to experiencehigher rates of inventory shrinkage or incur increased security or other costs to combat inventory theft,our results of operations and financial condition could be affected adversely.
8

10-K
We face intense competition that could limit our growth opportunities and adversely impact our financialperformance.
The retail business is highly competitive with respect to price, store location, merchandise quality,assortment and presentation, in-stock consistency, customer service, aggressive promotional activity,customers, and employees. We compete with discount stores and with many other retailers, includingmass merchandise, warehouse club, grocery, drug, convenience, variety and other specialty stores. Thiscompetitive environment subjects us to the risk of adverse impact to our financial performance becauseof the lower prices, and thus the lower margins, that may be required to maintain our competitiveposition. Also, companies like ours, due to customer demographics and other factors, may have limitedability to increase prices in response to increased costs without losing competitive position. Thislimitation may adversely affect our margins and financial performance. Certain of our competitors havegreater financial, distribution, marketing and other resources than we do and may be able to securebetter arrangements with suppliers than we can. If we fail to respond effectively to competitivepressures and changes in the retail markets, it could adversely affect our financial performance.
Competition for customers has intensified as competitors have moved into, or increased theirpresence in, our geographic markets and from the use of mobile and web-based technology that facilitatesonline shopping and real-time product and price comparisons. We expect this competition to continue toincrease. We remain vulnerable to the marketing power and high level of consumer recognition of largercompetitors and to the risk that these competitors or others could venture into our industry in asignificant way, including through the introduction of new store formats. Further, consolidation within thediscount retail industry could significantly alter the competitive dynamics of the retail marketplace. Thisconsolidation may result in competitors with greatly improved financial resources, improved access tomerchandise, greater market penetration and other improvements in their competitive positions, as wellas result in the provision of a wider variety of products and services at competitive prices by theseconsolidated companies, which could adversely affect our financial performance.
Our private brands may not maintain broad market acceptance and may increase the risks we face.
The sale of private brand items is an important component of our sales growth and gross profit rateenhancement plans. We have invested in our development and procurement resources and marketingefforts relating to these private brand offerings. We believe that our success in maintaining broad marketacceptance of our private brands depends on many factors, including pricing, our costs, quality andcustomer perception. We may not achieve or maintain our expected sales for our private brands. The saleand expansion of our private brand offerings also subjects us to certain risks, such as: potential productliability risks and mandatory or voluntary product recalls; our ability to successfully protect ourproprietary rights and successfully navigate and avoid claims related to the proprietary rights of thirdparties; our ability to successfully administer and comply with applicable contractual obligations and legaland regulatory requirements; and other risks generally encountered by entities that source, sell andmarket exclusive branded offerings for retail. An increase in sales of our private brands may alsoadversely affect sales of our vendors’ products, which, in turn, could adversely affect our relationship withcertain of our vendors. Any failure to appropriately address some or all of these risks could have asignificant adverse effect on our business, results of operations and financial condition.
A significant disruption to our distribution network, to the capacity of our distribution centers or to thetimely receipt of inventory could adversely impact sales or increase our transportation costs, which woulddecrease our profits.
We rely on our distribution and transportation network to provide goods to our stores in a timelyand cost-effective manner. Using various modes of transportation, including ocean, rail, and truck, weand our vendors move goods from vendor locations to our distribution centers. Deliveries to our storesoccur from our distribution centers or directly from our vendors. Any disruption, unanticipated or
9

10-K
unusual expense or operational failure related to this process could affect store operations negatively.For example, delivery delays or increases in transportation costs (including through increased fuel costs,increased carrier rates or driver wages as a result of driver shortages, a decrease in transportationcapacity for overseas shipments, or work stoppages or slowdowns) could significantly decrease ourability to make sales and earn profits. Labor shortages or work stoppages in the transportation industryor long-term disruptions to the national and international transportation infrastructure that lead todelays or interruptions of deliveries or which would necessitate our securing alternative labor orshipping suppliers could also increase our costs or otherwise negatively affect our business.
We maintain a network of distribution facilities and are moving forward with plans to build newfacilities to support our growth objectives. Delays in opening distribution centers could adversely affectour future financial performance by slowing store growth, which may in turn reduce revenue growth, orby increasing transportation costs. In addition, distribution-related construction or expansion projectsentail risks that could cause delays and cost overruns, such as: shortages of materials or skilled labor;work stoppages; unforeseen construction, scheduling, engineering, environmental or geologicalproblems; weather interference; fires or other casualty losses; and unanticipated cost increases. Thecompletion date and ultimate cost of these projects could differ significantly from initial expectationsdue to construction-related or other reasons. We cannot guarantee that any project will be completedon time or within established budgets.
Risks associated with or faced by our suppliers could adversely affect our financial performance.
The products we sell are sourced from a wide variety of domestic and international suppliers, andwe are dependent on our vendors to supply merchandise in a timely and efficient manner. In 2015, ourlargest and second largest suppliers each accounted for 7% of our purchases. We have not experiencedany difficulty in obtaining sufficient quantities of core merchandise and believe that, if one or more ofour current sources of supply became unavailable, we would generally be able to obtain alternativesources without experiencing a substantial disruption of our business. However, such alternative sourcescould increase our merchandise costs, result in a temporary reduction in store inventory levels, andreduce the quality of our merchandise, and an inability to obtain alternative sources could adverselyaffect our sales. Additionally, if a supplier fails to deliver on its commitments, whether due to financialdifficulties or other reasons, we could experience merchandise out-of-stocks that could lead to lost salesand damage to our reputation.
We directly imported approximately 6% of our purchases (measured at cost) in 2015, but many ofour domestic vendors directly import their products or components of their products. Changes to theprices and flow of these goods for any reason, such as political unrest or acts of war, currencyfluctuations, disruptions in maritime lanes, port labor disputes, and economic conditions and instabilityin the countries in which foreign suppliers are located, the financial instability of suppliers, suppliers’failure to meet our standards, issues with labor practices of our suppliers or labor problems they mayexperience (such as strikes, stoppages or slowdowns, which could also increase labor costs during andfollowing the disruption), the availability and cost of raw materials to suppliers, increased import duties,merchandise quality or safety issues, transport availability and cost, increases in wage rates and taxes,transport security, inflation, and other factors relating to the suppliers and the countries in which theyare located or from which they import, are beyond our control and could adversely affect ouroperations and profitability. While we are working to reduce our dependency on goods produced inChina, a substantial amount of our imported merchandise still comes from China, and thus, a change inthe Chinese leadership, economic and market conditions, internal economic stimulus actions, orcurrency or other policies, as well as increases in costs of labor and wage taxes, could negatively impactour merchandise costs. In addition, the United States’ foreign trade policies, tariffs and otherimpositions on imported goods, trade sanctions imposed on certain countries, the limitation on theimportation of certain types of goods or of goods containing certain materials from other countries and
10
10-K
other factors relating to foreign trade and port labor agreements are beyond our control. These andother factors affecting our suppliers and our access to products could adversely affect our business andfinancial performance. As we increase our imports of merchandise from foreign vendors, the risksassociated with these imports also will increase, and we may be exposed to additional or different risksas we increase imports of goods produced in countries other than China.
Product liability and food safety claims could adversely affect our business, reputation and financialperformance.
Despite our best efforts to ensure the quality, safety and freshness of the products that we sell inall of our stores, we may be subject to product liability claims from customers or actions required orpenalties assessed by government agencies relating to products, including but not limited to foodproducts that are recalled, defective or otherwise alleged to be harmful. Such claims may result fromtampering by unauthorized third parties, product contamination or spoilage, including the presence offoreign objects, substances, chemicals, other agents, or residues introduced during the growing, storage,handling and transportation phases.
All of our vendors and their products must comply with applicable product and food safety laws,and we are dependent on them to ensure that the products we buy comply with all applicable safetystandards. We seek but may not be successful in obtaining contractual indemnification and insurancecoverage from our suppliers. If we do not have adequate contractual indemnification or insuranceavailable, such claims could have a material adverse effect on our business, financial condition andresults of operations. Our ability to obtain indemnification from foreign suppliers may be hindered bythe manufacturers’ lack of understanding of U.S. product liability or other laws, which may result inour having to respond to claims or complaints from customers as if we were the manufacturer. Evenwith adequate insurance and indemnification, such claims could significantly damage our reputation andconsumer confidence in our products. Our litigation expenses could increase as well, which also couldhave a materially negative impact on our results of operations even if a product liability claim isunsuccessful or is not fully pursued.
We are subject to governmental regulations, procedures and requirements. A significant change in, ornoncompliance with, these regulations could have a material adverse effect on our financial performance.
Our business is subject to numerous and increasing federal, state and local laws and regulations.We routinely incur significant costs in complying with these regulations. The complexity of theregulatory environment in which we operate and the related cost of compliance are increasing due toexpanding and additional legal and regulatory requirements and increased enforcement efforts. Newlaws or regulations, particularly those dealing with environmental compliance, product safety, foodsafety, information security and privacy, and labor and employment, among others, or changes inexisting laws and regulations, particularly those governing the sale of products or employee wages, mayresult in significant added expenses or may require extensive system and operating changes that may bedifficult to implement and/or could materially increase our cost of doing business. Untimely complianceor noncompliance with applicable regulations or untimely or incomplete execution of a requiredproduct recall, can result in the imposition of penalties, including loss of licenses or significant fines ormonetary penalties, class action litigation or other litigation, in addition to reputational damage.Additionally, changes in tax laws, the interpretation of existing laws, or our failure to sustain ourreporting positions on examination could adversely affect our effective tax rate.
Litigation may adversely affect our business, results of operations and financial condition.
Our business is subject to the risk of litigation by employees, consumers, suppliers, competitors,shareholders, government agencies and others through private actions, class actions, administrativeproceedings, regulatory actions or other litigation. Nationally, the number of employment-related class
11

10-K
actions filed each year has continued to increase, and recent changes and proposed changes in federaland state laws, regulations and agency guidance may cause claims to rise even more. The outcome oflitigation, particularly class action lawsuits, regulatory actions and intellectual property claims, isdifficult to assess or quantify. Plaintiffs in these types of lawsuits may seek recovery of very large orindeterminate amounts, and the magnitude of the potential loss relating to these lawsuits may remainunknown for substantial periods of time. In addition, certain of these lawsuits, if decided adversely tous or settled by us, may result in liability material to our financial statements as a whole or maynegatively affect our operating results if changes to our business operations are required. The cost todefend future litigation may be significant. There also may be adverse publicity associated withlitigation that could negatively affect customer perception of our business, regardless of whether theallegations are valid or whether we are ultimately found liable. As a result, litigation may adverselyaffect our business, results of operations and financial condition. See Note 8 to the consolidatedfinancial statements for further details regarding certain of these pending matters.
Natural disasters (whether or not caused by climate change), unusual weather conditions, pandemicoutbreaks, terrorist acts, and global political events could disrupt business and result in lower sales andotherwise adversely affect our financial performance.
The occurrence of one or more natural disasters, such as hurricanes, fires, floods, tornadoes andearthquakes, unusual weather conditions, pandemic outbreaks, terrorist acts or disruptive globalpolitical events, such as civil unrest in countries in which our suppliers are located, or similardisruptions could adversely affect our business and financial performance. Uncharacteristic orsignificant weather conditions can affect consumer shopping patterns, which could lead to lost sales orgreater than expected markdowns and adversely affect our short-term results of operations. To theextent these events result in the closure of one or more of our distribution centers, a significantnumber of stores, or our corporate headquarters or impact one or more of our key suppliers, ouroperations and financial performance could be materially adversely affected through an inability tomake deliveries or provide other support functions to our stores and through lost sales. In addition,these events could result in increases in fuel (or other energy) prices or a fuel shortage, delays inopening new stores, the temporary lack of an adequate work force in a market, the temporary orlong-term disruption in the supply of products from some domestic and overseas suppliers, thetemporary disruption in the transport of goods from overseas, delay in the delivery of goods to ourdistribution centers or stores, the inability of customers to reach or have transportation to our storesdirectly affected by such events, the temporary reduction in the availability of products in our storesand disruption of our utility services or to our information systems. These events also can have indirectconsequences such as increases in the costs of insurance if they result in significant loss of property orother insurable damage.
Material damage or interruptions to our information systems as a result of external factors, staffingshortages or challenges or difficulties in maintaining or updating our existing technology or developing orimplementing new technology could have a material adverse effect on our business or results of operations.
We depend on a variety of information technology systems for the efficient functioning of ourbusiness and are continually improving our information processes and computer systems to better runour business. These technology initiatives may not deliver desired results or may do so on a delayedschedule. Additionally, such systems are subject to damage or interruption from power outages,computer and telecommunications failures, computer viruses, cybersecurity breaches, natural disastersand human error. Damage or interruption to these systems may require a significant investment to fixor replace them, and we may suffer interruptions in our operations in the interim, may experience lossor corruption of critical data and may receive negative publicity, all of which could have a materialadverse effect on our business or results of operations.
12

10-K
We also rely heavily on our information technology staff. Failure to meet these staffing needs maynegatively affect our ability to fulfill our technology initiatives while continuing to provide maintenanceon existing systems. We rely on certain vendors to maintain and periodically upgrade many of thesesystems so that they can continue to support our business. The software programs supporting many ofour systems were licensed to us by independent software developers. The inability of these developersor us to continue to maintain and upgrade these information systems and software programs woulddisrupt or reduce the efficiency of our operations if we were unable to convert to alternate systems inan efficient and timely manner. In addition, costs and potential problems and interruptions associatedwith the implementation of new or upgraded systems and technology or with maintenance or adequatesupport of existing systems could also disrupt or reduce the efficiency of our operations.
Failure to attract, train and retain qualified employees while controlling labor costs, as well as otherlabor issues, could adversely affect our financial performance.
Our future growth and performance and positive customer experience depends on our ability toattract, train, retain and motivate qualified employees, many of whom are in positions with historicallyhigh rates of turnover. Our ability to meet our labor needs, while controlling our labor costs, is subjectto many external factors, including competition for and availability of qualified personnel in a givenmarket, unemployment levels within those markets, prevailing wage rates, minimum wage laws, healthand other insurance costs, changes in employment and labor laws (including changes in the process forour employees to join a union) or other workplace regulations (including changes in ‘‘entitlement’’programs such as health insurance and paid leave programs), and our reputation and relevance withinthe labor market. If we are unable to attract and retain adequate numbers of qualified employees, ouroperations, customer service levels and support functions could suffer. To the extent a significantportion of our employee base unionizes, or attempts to unionize, our labor costs could increase. Inaddition, anticipated regulatory changes relating to the overtime exemptions under the Fair LaborStandards Act could result in increased labor costs to our business and negatively affect our operatingresults if changes to our business operation are required. Our ability to pass along labor costs to ourcustomers is constrained by our everyday low price model, and we may not be able to offset the costselsewhere in our business.
Our success depends on our executive officers and other key personnel. If we lose key personnel or areunable to hire additional qualified personnel, our business may be harmed.
Our future success depends to a significant degree on the skills, experience and efforts of ourexecutive officers and other key personnel. The unexpected loss of the services of any of our executiveofficers could have an adverse effect on our operations. There can be no assurance that our executivesuccession planning, retention or hiring efforts will be successful. Competition for skilled andexperienced management personnel is intense, and our future success will also depend on our ability toattract and retain qualified personnel, and a failure to attract and retain new qualified personnel couldhave an adverse effect on our operations. We do not currently maintain key person life insurancepolicies with respect to our executive officers or key personnel.
Our cash flows from operations may be negatively affected if we are not successful in managing ourinventory balances.
Our inventory balance represented approximately 54% of our total assets exclusive of goodwill andother intangible assets as of January 29, 2016. Efficient inventory management is a key component ofour business success and profitability. To be successful, we must maintain sufficient inventory levels andan appropriate product mix to meet our customers’ demands without allowing those levels to increaseto such an extent that the costs to store and hold the goods unduly impacts our financial results or thatsubjects us to the risk of increased inventory shrinkage. If our buying decisions do not accurately
13

10-K
predict customer trends, we inappropriately price products or our expectations about customerspending levels are inaccurate, we may have to take unanticipated markdowns to dispose of the excessinventory, which also can adversely impact our financial results. We continue to focus on ways toreduce these risks, but we cannot make assurances that we will be successful in our inventorymanagement. If we are not successful in managing our inventory balances, our cash flows fromoperations may be negatively affected.
Because our business is seasonal to a certain extent, with the highest volume of net sales during thefourth quarter, adverse events during the fourth quarter could materially affect our financial statements as awhole.
We generally recognize our highest volume of net sales during the Christmas selling season, whichoccurs in the fourth quarter of our fiscal year. In anticipation of this holiday, we purchase substantialamounts of seasonal inventory. Adverse events, such as deteriorating economic conditions, highunemployment, high gas prices, public transportation disruptions, or unusual or unanticipated adverseweather could result in lower-than-planned sales during the holiday season. An excess of seasonalmerchandise inventory could result if our net sales during the Christmas selling season fall belowseasonal norms or expectations. If our fourth quarter sales results were substantially below expectations,our financial performance and operating results could be adversely affected by unanticipatedmarkdowns, especially in seasonal merchandise.
Our current insurance program may expose us to unexpected costs and negatively affect our financialperformance.
Our insurance coverage reflects deductibles, self-insured retentions, limits of liability and similarprovisions that we believe are prudent based on the dispersion of our operations. However, there aretypes of losses we may incur but against which we cannot be insured or which we believe are noteconomically reasonable to insure, such as losses due to acts of war, employee and certain other crime,certain wage and hour and other employment-related claims, including class actions, and some naturaldisasters. If we incur these losses and they are material, our business could suffer. Certain materialevents may result in sizable losses for the insurance industry and adversely impact the availability ofadequate insurance coverage or result in excessive premium increases. To offset negative insurancemarket trends, we may elect to self-insure, accept higher deductibles or reduce the amount of coveragein response to these market changes. In addition, we self-insure a significant portion of expected lossesunder our workers’ compensation, automobile liability, general liability and group health insuranceprograms. Unanticipated changes in any applicable actuarial assumptions and management estimatesunderlying our recorded liabilities for these losses, including expected increases in medical andindemnity costs, could result in materially different expenses than expected under these programs,which could have a material adverse effect on our results of operations and financial condition.Although we continue to maintain property insurance for catastrophic events at our store supportcenter and distribution centers, we are effectively self-insured for other property losses. If weexperience a greater number of these losses than we anticipate, our financial performance could beadversely affected.
Any failure to maintain the security of information we hold relating to our customers, employees andvendors, whether as a result of cybersecurity attacks or otherwise, could expose us to litigation, governmentenforcement actions and costly response measures, and could materially disrupt our operations and harm ourreputation and sales.
In connection with sales, we transmit confidential credit and debit card information. We also haveaccess to, collect or maintain certain private or confidential information regarding our customers,employees and vendors, as well as our business. Additionally, under certain circumstances, we may
14

10-K
share information with vendors that assist us in conducting our business (for example, third-partyvendors assist us in the transmittal of credit and debit card information in connection with sales), asrequired by law, or with the permission of the individual. While we have implemented procedures andtechnology intended to protect and safeguard our information and require appropriate controls of ourvendors, it is possible that computer hackers and others might compromise our security measures orthose of our technology and other vendors in the future and obtain the personal information of ourcustomers, employees and vendors that we hold or our business information, as cyberattacks are rapidlyevolving and becoming increasingly sophisticated. Moreover, employee error or malfeasance or otherirregularities may result in a defeat of our or our third-party vendors’ security measures and breach ouror our third-party vendors’ information systems.
Because we accept debit and credit cards for payment, we are subject to the Payment CardIndustry Data Security Standards (‘‘PCI DSS’’), issued by the Payment Card Industry SecurityStandards Council. PCI DSS contains compliance guidelines and standards with regard to our securitysurrounding the physical and electronic storage, processing, and transmission of cardholder data.Additionally, we have implemented technology in all of our stores to allow for the acceptance ofEuropay, Mastercard and Visa (EMV) credit transactions. Complying with PCI DSS standards andimplementing related procedures, technology and information security measures require significantresources and ongoing attention. However, even as we comply with PCI DSS standards and offerEMV technology in our stores, we may be vulnerable to, and unable to detect and appropriatelyrespond to, data security breaches and data loss, including cybersecurity attacks or other breach ofcardholder data.
A security breach of any kind (whether experienced by us or one of our vendors), which could beundetected for a period of time, or any failure by us to comply with the applicable privacy andinformation security laws, regulations and standards could expose us to risks of data loss, litigation,government enforcement actions, fines or penalties, and costly response measures (including, forexample, providing notification to, and credit monitoring services for, affected customers, as well asfurther upgrades to our security measures) which may not be covered by or may exceed the coveragelimits of our insurance policies, and could materially disrupt our operations. Any resulting negativemedia attention and publicity could significantly harm our reputation which could cause us to losemarket share as a result of customers discontinuing the use of debit or credit cards in our stores or notshopping in our stores altogether and could have a material adverse effect on our business andfinancial performance.
Deterioration in market conditions or changes in our credit profile could adversely affect our businessoperations and financial condition.
We rely on the positive cash flow we generate from our operating activities and our access to thecredit and capital markets to fund our operations, growth strategy, and return of cash to ourshareholders through share repurchases and dividends. Changes in the credit and capital markets,including market disruptions, limited liquidity and interest rate fluctuations, may increase the cost offinancing or restrict our access to these potential sources of future liquidity. Our continued access tothese liquidity sources on favorable terms depends on multiple factors, including our operatingperformance and our credit ratings. Our debt securities currently have an investment grade rating, anda downgrade of this rating likely would negatively impact our access to the debt capital markets andincrease our cost of borrowing. As a result, any disruptions or turmoil in the debt markets or anydowngrade of our credit ratings could adversely affect our business operations and financial conditionand our ability to return cash to our shareholders. There can be no assurances that our ability to obtainadditional financing through the debt markets will not be adversely impacted by economic conditions orthat we will be able to maintain or improve our current credit ratings.
15

10-K
New accounting guidance or changes in the interpretation or application of existing accounting guidancecould adversely affect our financial performance.
The implementation of new accounting standards will require extensive systems, internal processand other changes that could increase our operating costs, and also will result in changes to ourfinancial statements. In particular, the implementation of accounting standards related to leases, asrecently issued by the Financial Accounting Standards Board are expected to require us to makesignificant changes to our lease management, fixed asset, and other accounting systems, and will resultin significant changes to our financial statements.
U.S. generally accepted accounting principles and related accounting pronouncements,implementation guidelines and interpretations with regard to a wide range of matters that are relevantto our business involve many subjective assumptions, estimates and judgments by our management.Changes in these rules or their interpretation or changes in underlying assumptions, estimates orjudgments by our management could significantly change our reported or expected financialperformance. The outcome of such changes could include litigation or regulatory actions which couldhave an adverse effect on our financial condition and results of operations.
ITEM 1B. UNRESOLVED STAFF COMMENTS
None.
ITEM 2. PROPERTIES
As of February 26, 2016, we operated 12,575 retail stores located in 43 states as follows:
State Number of Stores State Number of Stores
Alabama . . . . . . . . . . . 658 Nebraska . . . . . . . . . . . 99Arizona . . . . . . . . . . . . 89 Nevada . . . . . . . . . . . . 24Arkansas . . . . . . . . . . . 365 New Hampshire . . . . . . 17California . . . . . . . . . . . 170 New Jersey . . . . . . . . . . 87Colorado . . . . . . . . . . . 30 New Mexico . . . . . . . . . 84Connecticut . . . . . . . . . 29 New York . . . . . . . . . . 337Delaware . . . . . . . . . . . 42 North Carolina . . . . . . . 674Florida . . . . . . . . . . . . . 738 Ohio . . . . . . . . . . . . . . 659Georgia . . . . . . . . . . . . 711 Oklahoma . . . . . . . . . . 391Illinois . . . . . . . . . . . . . 454 Oregon . . . . . . . . . . . . 7Indiana . . . . . . . . . . . . 434 Pennsylvania . . . . . . . . . 556Iowa . . . . . . . . . . . . . . 189 Rhode Island . . . . . . . . 4Kansas . . . . . . . . . . . . . 210 South Carolina . . . . . . . 457Kentucky . . . . . . . . . . . 458 South Dakota . . . . . . . . 26Louisiana . . . . . . . . . . . 494 Tennessee . . . . . . . . . . . 655Maine . . . . . . . . . . . . . 14 Texas . . . . . . . . . . . . . . 1,301Maryland . . . . . . . . . . . 113 Utah . . . . . . . . . . . . . . 7Massachusetts . . . . . . . . 22 Vermont . . . . . . . . . . . 30Michigan . . . . . . . . . . . 356 Virginia . . . . . . . . . . . . 336Minnesota . . . . . . . . . . 73 West Virginia . . . . . . . . 199Mississippi . . . . . . . . . . 414 Wisconsin . . . . . . . . . . . 126Missouri . . . . . . . . . . . . 436
Most of our stores are located in leased premises. Individual store leases vary as to their terms,rental provisions and expiration dates. Many stores are subject to build-to-suit arrangements withlandlords, which typically carry a primary lease term of up to 15 years with multiple renewal options.
16

10-K
We also have stores subject to shorter-term leases and many of these leases have renewal options. Asignificant portion of our new stores are subject to build-to-suit arrangements.
As of February 26, 2016, we operated thirteen distribution centers, as described in the followingtable:
Year Approximate Square Number ofLocation Opened Footage Stores Served
Scottsville, KY . . . . . . . . . . . . . . . . . . . . . 1959 720,000 786Ardmore, OK . . . . . . . . . . . . . . . . . . . . . . 1994 1,310,000 1,442South Boston, VA . . . . . . . . . . . . . . . . . . . 1997 1,250,000 922Indianola, MS . . . . . . . . . . . . . . . . . . . . . . 1998 820,000 934Fulton, MO . . . . . . . . . . . . . . . . . . . . . . . 1999 1,150,000 1,256Alachua, FL . . . . . . . . . . . . . . . . . . . . . . . 2000 980,000 1,012Zanesville, OH . . . . . . . . . . . . . . . . . . . . . 2001 1,170,000 1,161Jonesville, SC . . . . . . . . . . . . . . . . . . . . . . 2005 1,120,000 1,141Marion, IN . . . . . . . . . . . . . . . . . . . . . . . . 2006 1,110,000 1,267Bessemer, AL . . . . . . . . . . . . . . . . . . . . . . 2012 940,000 1,160Lebec, CA . . . . . . . . . . . . . . . . . . . . . . . . 2012 600,000 321Bethel, PA . . . . . . . . . . . . . . . . . . . . . . . . 2014 1,000,000 872San Antonio, TX . . . . . . . . . . . . . . . . . . . 2016 920,000 301
We lease the distribution centers located in California, Oklahoma, Mississippi and Missouri andown the remaining distribution centers in the table above. Approximately 7.25 acres of the land onwhich our Kentucky distribution center is located is subject to a ground lease. As of January 29, 2016,we leased approximately 745,000 square feet of additional temporary warehouse space to support ourdistribution needs.
Our executive offices are located in approximately 302,000 square feet of owned buildings andapproximately 56,000 square feet of leased office space in Goodlettsville, Tennessee.
ITEM 3. LEGAL PROCEEDINGS
The information contained in Note 8 to the consolidated financial statements under the heading‘‘Legal proceedings’’ contained in Part II, Item 8 of this report is incorporated herein by this reference.
ITEM 4. MINE SAFETY DISCLOSURES
None.
17

10-K
EXECUTIVE OFFICERS OF THE REGISTRANT
Information regarding our current executive officers as of March 15, 2016 is set forth below. Eachof our executive officers serves at the discretion of our Board of Directors and is elected annually bythe Board to serve until a successor is duly elected. There are no familial relationships between any ofour directors or executive officers.
Name Age Position
Todd J. Vasos . . . . . . . . . . . . . . . . . . . . 54 Chief Executive Officer and DirectorJohn W. Garratt . . . . . . . . . . . . . . . . . . 47 Executive Vice President and Chief Financial OfficerJohn W. Flanigan . . . . . . . . . . . . . . . . . 64 Executive Vice President, Global Supply ChainJeffery C. Owen . . . . . . . . . . . . . . . . . . 46 Executive Vice President, Store OperationsRobert D. Ravener . . . . . . . . . . . . . . . . 57 Executive Vice President and Chief People OfficerRhonda M. Taylor . . . . . . . . . . . . . . . . . 48 Executive Vice President and General CounselJames W. Thorpe . . . . . . . . . . . . . . . . . 57 Executive Vice President, Chief Merchandising OfficerAnita C. Elliott . . . . . . . . . . . . . . . . . . . 51 Senior Vice President and Chief Accounting Officer
Mr. Vasos has served as Chief Executive Officer and a member of our Board since June 3, 2015.He joined Dollar General in December 2008 as Executive Vice President, Division President and ChiefMerchandising Officer. He was promoted to Chief Operating Officer in November 2013. Prior tojoining Dollar General, Mr. Vasos served in executive positions with Longs Drug Stores Corporationfor 7 years, including Executive Vice President and Chief Operating Officer (February 2008 throughNovember 2008) and Senior Vice President and Chief Merchandising Officer (2001 - 2008), where hewas responsible for all pharmacy and front-end marketing, merchandising, procurement, supply chain,advertising, store development, store layout and space allocation, and the operation of threedistribution centers. He also previously served in leadership positions at Phar-Mor Food and Drug Inc.and Eckerd Corporation.
Mr. Garratt has served as Executive Vice President and Chief Financial Officer since December 2,2015. He joined Dollar General in October 2014 as Senior Vice President, Finance & Strategy andsubsequently served as Interim Chief Financial Officer from July 2015 to December 2015. Prior tojoining Dollar General, Mr. Garratt held various positions of increasing responsibility with Yum!Brands, Inc., one of the world’s largest restaurant companies, between May 2004 and October 2014,holding leadership positions in corporate strategy and financial planning. He served as Vice President,Finance and Division Controller for the KFC division and earlier for the Pizza Hut division and forYum Restaurants International between October 2013 and October 2014. He also served as the SeniorDirector, Yum Corporate Strategy, from March 2010 to October 2013, reporting directly to thecorporate Chief Financial Officer and leading corporate strategy as well as driving key cross-divisionalinitiatives. Mr. Garratt served in various other financial positions at Yum from May 2004 to March2010. He served as Plant Controller for Alcoa Inc. between April 2002 and May 2004, and held variousfinancial management positions at General Electric from March 1999 to April 2002. He began hiscareer in May 1990 at Alcoa, where he served for approximately nine years.
Mr. Flanigan joined Dollar General as Senior Vice President, Global Supply Chain in May 2008.He was promoted to Executive Vice President in March 2010. Mr. Flanigan plans to retire from DollarGeneral effective April 29, 2016. He has almost 30 years of management experience in retail logistics.Prior to joining Dollar General, he was Group Vice President of Logistics and Distribution for LongsDrug Stores Corporation, an operator of a chain of retail drug stores on the West Coast and Hawaii,from October 2005 to April 2008. In this role, he was responsible for overseeing warehousing, inboundand outbound transportation and facility maintenance to service over 500 retail outlets. FromSeptember 2001 to October 2005, he served as the Vice President of Logistics for Safeway Inc., a foodand drug retailer, where he oversaw distribution of food products from Safeway distribution centers toall retail outlets, inbound traffic and transportation. He also has held distribution and logistics
18

10-K
leadership positions at Vons—a Safeway company, Specialized Distribution Management Inc., andCrum & Crum Logistics.
Mr. Owen returned to Dollar General in June 2015 as Executive Vice President of StoreOperations, with over 21 years of previous employment experience with the Company. Prior to hisdeparture from Dollar General in July 2014, he was Senior Vice President, Store Operations. Prior toAugust 2011, Mr. Owen served as Vice President, Division Manager. From November 2006 to March2007, he served as Retail Division Manager. Prior to November 2006, he was Senior Director,Operations Process Improvement. Mr. Owen served the Company in various operations roles ofincreasing importance and responsibility from December 1992 to September 2004. Mr. Owen has servedas a director of Kirkland’s Inc. since March 30, 2015.
Mr. Ravener joined Dollar General as Senior Vice President and Chief People Officer in August2008. He was promoted to Executive Vice President in March 2010. Prior to joining Dollar General, heserved in human resources executive roles with Starbucks Corporation, a roaster, marketer and retailerof specialty coffee, from September 2005 until August 2008 as the Senior Vice President of U.S.Partner Resources and, prior to that, as the Vice President, Partner Resources—Eastern Division. Asthe Senior Vice President of U.S. Partner Resources at Starbucks, Mr. Ravener oversaw all aspects ofhuman resources activity for more than 10,000 stores. Prior to serving at Starbucks, Mr. Ravener heldVice President of Human Resources roles for The Home Depot Inc., a home improvement retailer, atits Store Support Center and a domestic field division from April 2003 to September 2005.Mr. Ravener also served in executive roles in both human resources and operations at Footstar, Inc.and roles of increasing leadership at PepsiCo, Inc.
Ms. Taylor has served as Executive Vice President and General Counsel since March 17, 2015. Shejoined Dollar General as an Employment Attorney in March 2000 and was subsequently promoted toSenior Employment Attorney in 2001, Deputy General Counsel in 2004, Vice President and AssistantGeneral Counsel in March 2010, and Senior Vice President and General Counsel in June 2013. Prior tojoining Dollar General, she practiced law with Ogletree, Deakins, Nash, Smoak & Stewart, P.C., whereshe specialized in labor law and employment litigation. She has also held attorney positions withFord & Harrison LLP and Stokes & Bartholomew.
Mr. Thorpe returned to Dollar General in August 2015 as Executive Vice President and ChiefMerchandising Officer, with over six years of previous employment experience with the Company. Hepreviously served as Senior Vice President, General Merchandise Manager, from May 2006 when hejoined the Company until his departure in July 2012. Following his departure from Dollar General,Mr. Thorpe provided on a limited ad-hoc basis certain retail industry consulting services as President ofJW Thorpe & Associates, Inc. Prior to Dollar General, he served in various positions of increasingimportance and responsibility with Sears Holdings Corporation, a leading integrated retailer, fromMarch 1991 to May 2006 where his last position was Vice President and General MerchandiseManager—Hard Home of Sears Home Group. Prior to Sears, he worked as a Marketing ProgramManager for Zenith Data Systems, a personal computer development and sales company, from July1990 to February 1991. He began his career at The MAXIMA Corporation, an information technologyservices company, where he held various project administration and analyst positions.
Ms. Elliott has served as Senior Vice President and Chief Accounting Officer since December 2,2015. She joined Dollar General as Senior Vice President and Controller in August 2005. Prior tojoining Dollar General, she served as Vice President and Controller of Big Lots, Inc., a closeoutretailer, from May 2001 to August 2005, where she was responsible for accounting operations, financialreporting and internal audit. Prior to serving at Big Lots, she served as Vice President and Controllerfor Jitney-Jungle Stores of America, Inc., a grocery retailer, from April 1998 to March 2001. At Jitney-Jungle, Ms. Elliott was responsible for the accounting operations and the internal and external financialreporting functions. Prior to serving at Jitney-Jungle, she practiced public accounting for 12 years, 6 ofwhich were with Ernst & Young LLP.
19

10-K
PART II
ITEM 5. MARKET FOR REGISTRANT’S COMMON EQUITY, RELATED STOCKHOLDERMATTERS AND ISSUER PURCHASES OF EQUITY SECURITIES
Market Information
Our common stock is traded on the New York Stock Exchange under the symbol ‘‘DG.’’ The highand low sales prices during each quarter in fiscal 2015 and 2014 were as follows:
First Second Third Fourth2015 Quarter Quarter Quarter Quarter
High . . . . . . . . . . . . . . . . . . . . . . . . . . . . . . . . $76.99 $81.42 $81.15 $75.14Low . . . . . . . . . . . . . . . . . . . . . . . . . . . . . . . . . $65.86 $71.44 $64.66 $59.75
First Second Third Fourth2014 Quarter Quarter Quarter Quarter
High . . . . . . . . . . . . . . . . . . . . . . . . . . . . . . . . $61.18 $65.99 $65.10 $71.78Low . . . . . . . . . . . . . . . . . . . . . . . . . . . . . . . . . $54.43 $53.00 $55.48 $62.50
On March 15, 2016, our stock price at the close of the market was $85.04 and there wereapproximately 1,874 shareholders of record of our common stock.
Dividends
On March 8, 2016, our Board of Directors declared a quarterly cash dividend of $0.25 per share,to be paid on April 12, 2016 to shareholders of record of our common stock on March 29, 2016. Wepaid quarterly cash dividends of $0.22 per share in 2015. Prior to March 2015, we had not declared orpaid recurring dividends since March 2007. While the Board intends to continue regular quarterly cashdividends, the declaration and payment of future cash dividends are subject to the Board’s discretionbased on an evaluation of our earnings performance, financial condition, capital needs and otherrelevant factors.
Issuer Purchases of Equity Securities
The following table contains information regarding purchases of our common stock made duringthe quarter ended January 29, 2016 by or on behalf of Dollar General or any ‘‘affiliated purchaser,’’ asdefined by Rule 10b-18(a)(3) of the Securities Exchange Act of 1934:
Total Number Approximateof Shares Dollar ValuePurchased of Shares that May
Total Number of Average as Part of Publicly Yet Be PurchasedShares Price Paid Announced Plans or Under the Plans
Period Purchased per Share Programs(a) or Programs(a)
10/31/15 - 11/30/15 . . . . . . . . . . . . . . . — $ — — $214,007,00012/01/15 - 12/31/15 . . . . . . . . . . . . . . . 4,128,913 $70.29 4,128,913 $923,803,00001/01/16 - 01/29/16 . . . . . . . . . . . . . . . — $ — — $923,803,000Total . . . . . . . . . . . . . . . . . . . . . . . . . 4,128,913 $70.29 4,128,913 $923,803,000
(a) A $500 million share repurchase program was publicly announced on September 5, 2012, andincreases in the authorization under such program were announced on March 25, 2013($500 million increase), December 5, 2013 ($1.0 billion increase), March 12, 2015 ($1.0 billionincrease) and December 3, 2015 ($1.0 billion increase). Under the authorization, purchases may bemade in the open market or in privately negotiated transactions from time to time subject tomarket and other conditions. This repurchase authorization has no expiration date.
20

10-K
ITEM 6. SELECTED FINANCIAL DATA
The following table sets forth selected consolidated financial information of Dollar GeneralCorporation as of the dates and for the periods indicated. The selected historical statement ofoperations data and statement of cash flows data for the fiscal years ended January 29, 2016,January 30, 2015, and January 31, 2014 and balance sheet data as of January 29, 2016 and January 30,2015, have been derived from our historical audited consolidated financial statements includedelsewhere in this report. The selected historical statement of operations data and statement of cashflows data for the fiscal years ended February 1, 2013 and February 3, 2012 and balance sheet data asof January 31, 2014, February 1, 2013, and February 3, 2012 presented in this table have been derivedfrom audited consolidated financial statements not included in this report.
The information set forth below should be read in conjunction with, and is qualified by referenceto, the Consolidated Financial Statements and related notes included in Part II, Item 8 of this reportand the Management’s Discussion and Analysis of Financial Condition and Results of Operations
21

10-K
included in Part II, Item 7 of this report. Certain financial disclosures relating to prior periods havebeen reclassified to conform to the current year presentation.
Year Ended(Amounts in millions, excluding per share data, January 29, January 30, January 31, February 1, February 3,number of stores, selling square feet, and net sales 2016 2015 2014 2013 2012(1)per square foot)
Statement of Income Data:Net sales . . . . . . . . . . . . . . . . . . . . . . . . . $20,368.6 $18,909.6 $17,504.2 $16,022.1 $14,807.2Cost of goods sold . . . . . . . . . . . . . . . . . . 14,062.5 13,107.1 12,068.4 10,936.7 10,109.3
Gross profit . . . . . . . . . . . . . . . . . . . . . . . 6,306.1 5,802.5 5,435.7 5,085.4 4,697.9Selling, general and administrative expenses 4,365.8 4,033.4 3,699.6 3,430.1 3,207.1
Operating profit . . . . . . . . . . . . . . . . . . . . 1,940.3 1,769.1 1,736.2 1,655.3 1,490.8Interest expense . . . . . . . . . . . . . . . . . . . . 86.9 88.2 89.0 127.9 204.9Other (income) expense . . . . . . . . . . . . . . 0.3 — 18.9 30.0 60.6
Income before income taxes . . . . . . . . . . . 1,853.0 1,680.9 1,628.3 1,497.4 1,225.3Income tax expense . . . . . . . . . . . . . . . . . . 687.9 615.5 603.2 544.7 458.6
Net income . . . . . . . . . . . . . . . . . . . . . . . $ 1,165.1 $ 1,065.3 $ 1,025.1 $ 952.7 $ 766.7
Earnings per share—basic . . . . . . . . . . . . . $ 3.96 $ 3.50 $ 3.17 $ 2.87 $ 2.25Earnings per share—diluted . . . . . . . . . . . . 3.95 3.49 3.17 2.85 2.22Dividends per share . . . . . . . . . . . . . . . . . 0.88 — — — —Statement of Cash Flows Data:Net cash provided by (used in):
Operating activities . . . . . . . . . . . . . . . . $ 1,378.0 $ 1,314.7 $ 1,213.1 $ 1,131.4 $ 1,050.5Investing activities . . . . . . . . . . . . . . . . . (503.4) (371.7) (250.0) (569.8) (513.8)Financing activities . . . . . . . . . . . . . . . . (1,296.5) (868.8) (598.3) (546.8) (908.0)
Total capital expenditures . . . . . . . . . . . . . (504.8) (374.0) (538.4) (571.6) (514.9)Other Financial and Operating Data:Same store sales growth(2) . . . . . . . . . . . . 2.8% 2.8% 3.3% 4.7% 6.0%Same store sales(2) . . . . . . . . . . . . . . . . . . $19,254.3 $17,818.7 $16,365.5 $14,992.7 $13,626.7Number of stores included in same store
sales calculation . . . . . . . . . . . . . . . . . . . 11,706 11,052 10,387 9,783 9,254Number of stores (at period end) . . . . . . . . 12,483 11,789 11,132 10,506 9,937Selling square feet (in thousands at period
end) . . . . . . . . . . . . . . . . . . . . . . . . . . . 92,477 87,205 82,012 76,909 71,774Net sales per square foot(3) . . . . . . . . . . . $ 226 $ 223 $ 220 $ 216 $ 213Consumables sales . . . . . . . . . . . . . . . . . . 75.9% 75.7% 75.2% 73.9% 73.2%Seasonal sales . . . . . . . . . . . . . . . . . . . . . . 12.4% 12.4% 12.9% 13.6% 13.8%Home products sales . . . . . . . . . . . . . . . . . 6.3% 6.4% 6.4% 6.6% 6.8%Apparel sales . . . . . . . . . . . . . . . . . . . . . . 5.4% 5.5% 5.5% 5.9% 6.2%Rent expense . . . . . . . . . . . . . . . . . . . . . . $ 856.9 $ 785.2 $ 686.9 $ 614.3 $ 542.3Balance Sheet Data (at period end):Cash and cash equivalents and short-term
investments . . . . . . . . . . . . . . . . . . . . . . $ 157.9 $ 579.8 $ 505.6 $ 140.8 $ 126.1Total assets . . . . . . . . . . . . . . . . . . . . . . . . 11,251.0 11,208.6 10,848.2 10,340.8 9,663.6Long-term debt(4) . . . . . . . . . . . . . . . . . . 2,970.6 2,725.1 2,799.5 2,745.3 2,593.6Total shareholders’ equity . . . . . . . . . . . . . 5,377.9 5,710.0 5,402.2 4,985.3 4,674.6
(1) The fiscal year ended February 3, 2012 was comprised of 53 weeks.
22

10-K
(2) Same-store sales are calculated based upon stores that were open at least 13 full fiscal months andremain open at the end of the reporting period. We include stores that have been remodeled,expanded or relocated in our same-store sales calculation. When applicable, we exclude the salesin the non-comparable week of a 53-week year from the same-store sales calculation.
(3) Net sales per square foot was calculated based on total sales for the preceding 12 months as of theending date of the reporting period divided by the average selling square footage during theperiod, including the end of the fiscal year, the beginning of the fiscal year, and the end of each ofour three interim fiscal quarters.
(4) Debt issuance costs are reflected as a deduction from the corresponding debt liability for allperiods presented.
Year Ended
January 29, January 30, January 31, February 1, February 3,2016 2015 2014 2013 2012
Ratio of earnings to fixedcharges(1): . . . . . . . . . . . . . . . . 4.5x 4.4x 4.7x 4.7x 3.8x
(1) For purposes of computing the ratio of earnings to fixed charges, (a) earnings consist ofincome (loss) before income taxes, plus fixed charges less capitalized expenses related toindebtedness (amortization expense for capitalized interest is not significant) and (b) fixedcharges consist of interest expense (whether expensed or capitalized), the amortization of debtissuance costs and discounts related to indebtedness, and the interest portion of rent expense.
23

10-K
ITEM 7. MANAGEMENT’S DISCUSSION AND ANALYSIS OF FINANCIAL CONDITION ANDRESULTS OF OPERATIONS
This discussion and analysis should be read with, and is qualified in its entirety by, the ConsolidatedFinancial Statements and the notes thereto. It also should be read in conjunction with the CautionaryDisclosure Regarding Forward-Looking Statements and the Risk Factors disclosures set forth in theIntroduction and in Item 1A of this report, respectively.
Executive Overview
We are among the largest discount retailers in the United States by number of stores, with 12,575stores located in 43 states as of February 26, 2016, with the greatest concentration of stores in thesouthern, southwestern, midwestern and eastern United States. We offer a broad selection ofmerchandise, including consumable products such as food, paper and cleaning products, health andbeauty products and pet supplies, and non-consumable products such as seasonal merchandise, homedecor and domestics, and basic apparel. Our merchandise includes high-quality national brands fromleading manufacturers, as well as comparable quality and value private brand selections with prices atsubstantial discounts to national brands. We offer our customers these national brand and private brandproducts at everyday low prices (typically $10 or less) in our convenient small-box locations, with sellingspace averaging approximately 7,400 square feet per store.
Because the customers we serve are value-conscious, many with low or fixed incomes, we havealways been intensely focused on helping them make the most of their spending dollars. We believe ourconvenient store format and broad selection of high-quality products at compelling values have drivenour substantial growth and financial success over the years. Like other retailers, we have been operatingfor several years in an environment with ongoing macroeconomic challenges and uncertainties. Ourcore customers are often the first to be affected by negative or uncertain economic conditions such asunemployment and fluctuating food, energy and medical costs, and the last to feel the effects ofimproving economic conditions. Our customer has experienced both positive and negative generaleconomic factors during 2015, such as lower gasoline prices and unemployment rates coupled withrising rents and medical costs. The overall financial impact of these factors to our customers has beeninconsistent and their duration is unknown.
Our operating priorities continue to evolve as we consistently strive to improve our performancewhile retaining our customer-centric focus. We are keenly focused on executing the following priorities:1) driving profitable sales growth, 2) capturing growth opportunities, 3) enhancing our position as alow-cost operator, and 4) investing in our people as a competitive advantage.
We seek to drive profitable sales growth through initiatives such as improvement in our in-stockposition, as well as an ongoing focus on enhancing our margins while maintaining both everyday lowprice and affordability.
• Our in-stock improvement initiative is designed to ensure the right products are available on theshelf when our customers shop in our stores. To support this initiative and improve overallcustomer satisfaction, we are selectively investing incremental labor hours in those stores wherewe believe such increases will generate positive financial returns. As of the end of 2015, thisretail labor hour investment had been implemented across over 3,100 stores. We have adisciplined approach to this labor investment and are able to quickly evaluate whether it deliverson our profitability expectations, reallocating resources as necessary.
• We demonstrate our commitment to the affordability needs of our core customer by pricingmore than 75% of our stock-keeping units at $5 or less as of the end of 2015. However, as wework to provide everyday low prices and meet our customers’ affordability needs, we also remainfocused on enhancing our margins through effective category management, inventory shrinkreduction initiatives, private brands penetration, efforts to improve distribution and
24
10-K
transportation efficiencies, global sourcing, and pricing and markdown optimization. With respectto category management, the mix of sales affects profitability because the gross marginassociated with sales within our consumables category generally is lower than that associatedwith sales within our non-consumables categories. Even within each category, however, there arevarying levels of gross margin associated with the specific items. With respect to inventory shrinkreduction, the progress in 2015 was broad-based with shrink declining across all four productcategories. For a discussion of the sales mix, as well as the results of certain other margin-related initiatives in 2015, see ‘‘Results of Operations’’ below.
The degree of success of these initiatives is often reflected in our same-store sales results and inthe level of improvement in shopper frequency and number of items sold and average transactionamount. For the 2015 fourth quarter, we believe these ongoing initiatives helped to drive thesame-store sales growth in three out of our four product categories, reflecting increases in bothcustomer traffic and average transaction amount for the 32nd consecutive quarter when compared to theprior year quarter.
To support our other operating priorities we also are focused on capturing growth opportunities andinnovating within our channel. We continued to expand our store count, opening 730 stores during 2015.We also have continued our store remodeling efforts and remodeled or relocated a total of 881 storesduring 2015. In fiscal 2016, we have plans to open 900 stores and to relocate or remodel 875 stores, and weplan to maintain our accelerated square footage growth of approximately six to eight percent during 2017.We continue to innovate within our channel, and during 2016 we will implement the DG16 store format.This store format will include additional cooler doors, a redesigned queueing area, and other enhancementsthat are focused on meeting the evolving demands of our core customer while also delivering on ouroperating priorities. In addition, we are testing a smaller format store (less than 6,000 square feet) whichwe believe could allow us to capture growth opportunities in metropolitan areas.
We have established a position as a low-cost operator, continuously seeking ways to control costs thatdo not affect our customer’s shopping experience. We have enhanced this position during the latter part of2015 and into 2016 through our zero-based budgeting initiative, streamlining our business while alsoreducing expenses. Our goal is to lower the same-store sales growth required to leverage selling, generaland administrative (‘‘SG&A’’) expenses. As part of this initiative we reduced approximately 255 positionswithin our corporate support function in the third quarter of 2015 and expect to reinvest a portion of thesesavings in the business as we deem appropriate. In addition, at the store level, we remain committed tosimplifying or eliminating various tasks so that those time savings can be reinvested by our store managersin other areas such as ensuring customer service, improved in-stock levels, and improved store standards.We will continue to seek additional opportunities to enhance our low-cost position.
Our employees are a competitive advantage, and we are always searching for ways to continueinvesting in them. Our training programs are continually evolving, as we work to ensure that ouremployees have the tools necessary to be successful in their positions. We invest in our employees in aneffort to create an environment that attracts and retains talented personnel, as we believe that,particularly at the store level, employees who are promoted from within generally have longer tenuresand are greater contributors to improvements in our financial performance. Furthermore, we believethat reducing our store manager turnover likely results in improved store financial performance inareas such as shrink and sales. We have also implemented training programs for high-potentialemployees, and believe that these and other efforts will produce a more stable, engaged workforce.
Our continued focus on these four operating priorities, coupled with strong cash flow managementand share repurchases resulted in solid overall operating and financial performance in 2015 ascompared to 2014 as follows. Basis points, as referred to below, are equal to 0.01 percent of net sales.
• Net sales in 2015 increased 7.7% over 2014. Sales in same-stores increased 2.8%, with increasesin both customer traffic and average transaction amount. Consumables represented 76% of sales
25

10-K
in 2015. Departments with the most significant increases in net sales were candy and snacks,perishables, tobacco, and food. Average sales per square foot in 2015 were $226, up from $223in 2014.
• Operating profit increased 9.7% to $1.94 billion, or 9.5% of sales, compared to $1.77 billion, or9.4% of sales in 2014. The increase in our operating profit rate was attributable to a 27 basis-point increase in our gross profit rate, which was partially offset by a 10 basis-point increase inSG&A.
• Our gross profit rate increased by 27 basis points due primarily to lower transportation costs anda lower rate of inventory shrinkage.
• The increase in SG&A, as a percentage of sales, was due primarily to increases in incentivecompensation expense, repairs and maintenance expense and occupancy costs. For other factors,see the detailed discussion that follows.
• Interest expense decreased by $1.3 million in 2015 to $86.9 million. Total long-term obligationsas of January 29, 2016 were $2.97 billion.
• We reported net income of $1.17 billion, or $3.95 per diluted share, for 2015, compared to netincome of $1.07 billion, or $3.49 per diluted share, for 2014. Stock repurchase activity during2014 and 2015 contributed to the increase in diluted earnings per share.
• We generated approximately $1.38 billion of cash flows from operating activities in 2015, anincrease of 4.8% compared to 2014. We primarily utilized our cash flows from operatingactivities to invest in the growth of our business, repurchase our common stock, and payquarterly cash dividends.
• Inventory turnover was 4.7 times on a rolling four-quarter basis. Inventories increased 4.3% on aper store basis over 2014.
• During 2015 we opened 730 new stores, remodeled or relocated 881 stores, and closed 36 stores.
Also in 2015, we repurchased approximately 17.6 million shares of our outstanding common stockfor $1.3 billion.
In 2016, we plan to continue to focus on our four key operating priorities. We expect our salesgrowth in 2016 to again be driven primarily by consumables, although we expect non-consumables salesto continue to contribute to our profitable sales growth. Same-store sales growth is key to achieving ourobjectives, and we have implemented targeted actions to drive same-store sales in 2016, such asupdating our customer segmentation to gain deeper insights into the spending habits for each of ourcore customer segments. This helps drive our category management process, as we optimize ourassortment and expand into those categories that are most likely to drive traffic to our stores. Ourcontinued focus on on-shelf availability and affordability also should assist in growing transactions andnumber of items sold. Our new store format will offer a total of 22 cooler doors, an increase of sixcooler doors as compared to our previous new store format and will be utilized for all new stores,relocations and remodels.
Other key 2016 initiatives include our zero-based budgeting initiative, which we expect to takecosts out of the business that do not affect the customer experience, ongoing supply chainimprovements, and investing in our people. In addition, we plan to continue to repurchase shares ofour common stock and pay quarterly cash dividends, subject to Board discretion, to further enhanceshareholder return. However, we are facing potential regulatory changes relating to overtimeexemptions under the Fair Labor Standards Act, which, if implemented, are expected to increase ourlabor costs and negatively affect our operating results.
Readers should refer to the detailed discussion of our operating results below for additional commentson financial performance in the current year periods as compared with the prior year periods.
26

10-K
Results of Operations
Accounting Periods. The following text contains references to years 2015, 2014, and 2013, whichrepresent fiscal years ended January 29, 2016, January 30, 2015, and January 31, 2014, respectively. Ourfiscal year ends on the Friday closest to January 31. All referenced fiscal years were 52-week accountingperiods.
Seasonality. The nature of our business is seasonal to a certain extent. Primarily because of salesof holiday-related merchandise, sales in our fourth quarter (November, December and January) havehistorically been higher than sales achieved in each of the first three quarters of the fiscal year.Expenses, and to a greater extent operating profit, vary by quarter. Results of a period shorter than afull year may not be indicative of results expected for the entire year. Furthermore, the seasonal natureof our business may affect comparisons between periods. For more information about the seasonality ofour business, see ‘‘Seasonality’’ included in Part 1, Item 1 of this report.
The following table contains results of operations data for fiscal years 2015, 2014 and 2013, andthe dollar and percentage variances among those years.
2015 vs. 2014 2014 vs. 2013
Amount % Amount %(amounts in millions, except per share 2015 2014 2013 Change Change Change Changeamounts)Net sales by category:Consumables . . . . . . . . . . . . . . . . $15,457.6 $14,321.1 $13,161.8 $1,136.5 7.9% $1,159.3 8.8%% of net sales . . . . . . . . . . . . . . . 75.89% 75.73% 75.19%Seasonal . . . . . . . . . . . . . . . . . . . 2,522.7 2,345.0 2,259.5 177.7 7.6 85.5 3.8% of net sales . . . . . . . . . . . . . . . 12.39% 12.40% 12.91%Home products . . . . . . . . . . . . . . 1,289.4 1,205.4 1,115.6 84.1 7.0 89.7 8.0% of net sales . . . . . . . . . . . . . . . 6.33% 6.37% 6.37%Apparel . . . . . . . . . . . . . . . . . . . 1,098.8 1,038.1 967.2 60.7 5.8 71.0 7.3% of net sales . . . . . . . . . . . . . . . 5.39% 5.49% 5.53%
Net sales . . . . . . . . . . . . . . . . . . $20,368.6 $18,909.6 $17,504.2 $1,459.0 7.7% $1,405.4 8.0%Cost of goods sold . . . . . . . . . . . . 14,062.5 13,107.1 12,068.4 955.4 7.3 1,038.7 8.6% of net sales . . . . . . . . . . . . . . . 69.04% 69.31% 68.95%
Gross profit . . . . . . . . . . . . . . . . 6,306.1 5,802.5 5,435.7 503.6 8.7 366.8 6.7% of net sales . . . . . . . . . . . . . . . 30.96% 30.69% 31.05%Selling, general and administrative
expenses . . . . . . . . . . . . . . . . . 4,365.8 4,033.4 3,699.6 332.4 8.2 333.9 9.0% of net sales . . . . . . . . . . . . . . . 21.43% 21.33% 21.14%
Operating profit . . . . . . . . . . . . . 1,940.3 1,769.1 1,736.2 171.2 9.7 32.9 1.9% of net sales . . . . . . . . . . . . . . . 9.53% 9.36% 9.92%Interest expense . . . . . . . . . . . . . . 86.9 88.2 89.0 (1.3) (1.5) (0.8) (0.8)% of net sales . . . . . . . . . . . . . . . 0.43% 0.47% 0.51%Other (income) expense . . . . . . . . 0.3 — 18.9 0.3 — (18.9) (100.0)% of net sales . . . . . . . . . . . . . . . 0.00% 0.00% 0.11%
Income before income taxes . . . . . 1,853.0 1,680.9 1,628.3 172.2 10.2 52.5 3.2% of net sales . . . . . . . . . . . . . . . 9.10% 8.89% 9.30%Income taxes . . . . . . . . . . . . . . . . 687.9 615.5 603.2 72.4 11.8 12.3 2.0% of net sales . . . . . . . . . . . . . . . 3.38% 3.26% 3.45%
Net income . . . . . . . . . . . . . . . . . $ 1,165.1 $ 1,065.3 $ 1,025.1 $ 99.7 9.4% $ 40.2 3.9%% of net sales . . . . . . . . . . . . . . . 5.72% 5.63% 5.86%
Diluted earnings per share . . . . . . $ 3.95 $ 3.49 $ 3.17 $ 0.46 13.2% $ 0.32 10.1%
Net Sales. The net sales increase in 2015 reflects a same-store sales increase of 2.8% compared to2014. For 2015, there were 11,706 same-stores which accounted for sales of $19.25 billion. Same-storesinclude stores that have been open for at least 13 months and remain open at the end of the reportingperiod. Changes in same-store sales are calculated based on the comparable calendar weeks in the
27

10-K
prior year, and include stores that have been remodeled, expanded or relocated. The remainder of theincrease in sales in 2015 was attributable to new stores, partially offset by sales from closed stores. Theincrease in sales reflects increased customer traffic and average transaction amounts. Increases in salesof consumables slightly outpaced our non-consumables, with sales of candy and snacks, perishables,tobacco products, and food contributing the majority of the increase in sales of consumables.
The net sales increase in 2014 reflects a same-store sales increase of 2.8% compared to 2013. For2014, there were 11,052 same-stores which accounted for sales of $17.82 billion. The remainder of theincrease in sales in 2014 was attributable to new stores, partially offset by sales from closed stores. Theincrease in sales reflects increased customer traffic and average transaction amounts resulting from therefinement of the Company’s merchandise offerings, including a full year’s sales of tobacco products,the expansion of perishables, and enhanced utilization of store square footage. Increases in sales ofconsumables outpaced our non-consumables, with sales of tobacco products, perishables, and candy andsnacks contributing the majority of the increase in sales of consumables.
Of our four major merchandise categories, the consumables category, which generally has a lowergross profit rate than the other three categories, has grown most significantly over the past severalyears. Because of the impact of sales mix on gross profit, we continually review our merchandise mixand strive to adjust it when appropriate.
Gross Profit. The gross profit rate as a percentage of sales was 31.0% in 2015 compared to 30.7%in 2014. Gross profit increased by 8.7% in 2015, and as a percentage of sales, increased by 27 basispoints. The gross profit rate increase in 2015 as compared to 2014 primarily reflects lowertransportation costs and an improved rate of inventory shrinkage, partially offset by increasedmarkdowns. We recorded a LIFO benefit of $2.3 million in 2015 compared to a LIFO provision of$4.2 million in 2014.
The gross profit rate as a percentage of sales was 30.7% in 2014 compared to 31.1% in 2013.Gross profit increased by 6.7% in 2014, and as a percentage of sales, decreased by 36 basis points. Themost significant factor affecting the gross profit rate was an increase in markdowns, primarily due toincreased promotions driven by competitive pressures. In addition, we experienced a continued trend ofconsumables comprising a larger portion of our net sales, primarily as the result of increased sales oflower margin consumables including tobacco products and expanded perishables offerings. Thesefactors were partially offset by higher initial inventory markups. We recorded a LIFO provision of$4.2 million in 2014 compared to a LIFO benefit of $11.0 million in 2013.
SG&A. SG&A was 21.4% as a percentage of sales in 2015 compared to 21.3% in 2014, anincrease of 10 basis points. The 2015 results reflect increases in incentive compensation expenses,repairs and maintenance expenses, occupancy costs, and fees associated with an increase in debit cardtransactions. Partially offsetting these items was a higher volume of cash back transactions resulting inincreased convenience fees collected from customers. The 2014 results reflect expenses of $14.3 million,or 8 basis points as a percentage of sales, related to an acquisition that was not completed.
SG&A expense was 21.3% as a percentage of sales in 2014 compared to 21.1% in 2013, an increaseof 19 basis points. The 2014 results reflect a significant increase in incentive compensation expense, asour 2013 financial performance did not satisfy certain performance requirements under our cash incentivecompensation program. The 2014 results also reflect increases in rent and utilities. Partially offsettingthese increased costs were retail labor expense, which increased at a rate lower than our increase in sales,the introduction of convenience fees charged to customers for cash back on debit card transactions, and areduction in workers’ compensation and general liability expenses. The 2014 period included expenses of$14.3 million relating to an acquisition that was not completed, while the 2013 results include expenses of$8.5 million for a legal settlement of a previously decertified collective action.
28

10-K
Interest Expense. Interest expense decreased $1.3 million to $86.9 million in 2015 compared to2014. See the detailed discussion under ‘‘Liquidity and Capital Resources’’ regarding the financing ofvarious long-term obligations.
Interest expense remained relatively constant in 2014 compared to 2013.
We had outstanding variable-rate debt of $686.6 million and $62.0 million as of January 29, 2016and January 30, 2015, respectively, after taking into consideration the impact of interest rate swaps ineffect at January 30, 2015. The remainder of our outstanding indebtedness at January 29, 2016 andJanuary 30, 2015 was fixed rate debt.
Other (Income) Expense. In 2015, we recorded pretax losses of $0.3 million related to therefinancing of long-term debt. In 2013, we recorded pretax losses of $18.9 million resulting from thetermination of our senior secured credit facilities.
Income Taxes. The effective income tax rates for 2015, 2014 and 2013 were expenses of 37.1%,36.6% and 37.0%, respectively.
The effective income tax rate for 2015 was 37.1% compared to a rate of 36.6% for 2014 whichrepresents a net increase of 0.5 percentage points. The effective income tax rate was lower in 2014 dueprincipally to federal and state reserve releases in 2014 that did not reoccur, to the same extent, in2015. As in prior years, we receive a significant income tax benefit related to wages paid to certainnewly hired employees that qualify for federal jobs credits (principally the Work Opportunity Tax Creditor ‘‘WOTC’’). In December 2015, Congress retroactively extended the federal law authorizing theWOTC for the period from January 1, 2015 through December 31, 2019. Accordingly, based on currentlaw, the WOTC should be available for our 2016 through 2019 fiscal years.
The effective income tax rate for 2014 was 36.6% compared to a rate of 37.0% for 2013 whichrepresents a net decrease of 0.4 percentage points. The effective income tax rate decreased from 2013due principally to the favorable resolution of state income tax examinations and other state income taxreserves, which increased by a lesser amount in 2014 compared to 2013.
Off Balance Sheet Arrangements
The entities involved in the ownership structure underlying the leases for three of our distributioncenters meet the accounting definition of a Variable Interest Entity (‘‘VIE’’). One of these distributioncenters has been recorded as a financing obligation whereby its property and equipment are reflectedin our consolidated balance sheets. The land and buildings of the other two distribution centers havebeen recorded as operating leases. We are not the primary beneficiary of these VIEs and, accordingly,have not included these entities in our consolidated financial statements. Other than the foregoing, weare not party to any material off balance sheet arrangements.
Effects of Inflation
We experienced little or no overall product cost inflation in 2015, 2014 and 2013.
Liquidity and Capital Resources
Current Financial Condition and Recent Developments
During the past three years, we have generated an aggregate of approximately $3.91 billion in cashflows from operating activities and incurred approximately $1.42 billion in capital expenditures. Duringthat period, we expanded the number of stores we operate by 1,977, representing growth ofapproximately 19%, and we remodeled or relocated 2,378 stores, or approximately 19% of the storeswe operated as of January 29, 2016. We intend to continue our current strategy of pursuing storegrowth, remodels and relocations in 2016.
29

10-K
We have a five-year $1.425 billion unsecured credit agreement (the ‘‘Facilities’’), and we haveoutstanding $2.3 billion aggregate principal amount of senior notes. At January 29, 2016, we had totaloutstanding debt (including the current portion of long-term obligations) of $2.97 billion, whichincludes balances under the Facilities, and senior notes, all of which are described in greater detailbelow. We had $722.0 million available for borrowing under the Facilities at January 29, 2016. Theinformation contained in Note 5 to the consolidated financial statements under the heading ‘‘BorrowingFacilities and 2015 Refinancing’’ contained in Part II, Item 8 of this report is incorporated herein byreference. Cash and cash equivalents decreased by $421.9 million in 2015, primarily due to thesuspension of share repurchases during the portion of 2014 that coincided with our attemptedacquisition, resulting in higher than normal cash and cash equivalents balances at the end of 2014.
We believe our cash flow from operations and existing cash balances, combined with availabilityunder the Facilities as discussed in greater detail below and access to the debt markets will providesufficient liquidity to fund our current obligations, projected working capital requirements, capitalspending and anticipated dividend payments for a period that includes the next twelve months as wellas the next several years. However, our ability to maintain sufficient liquidity may be affected bynumerous factors, many of which are outside of our control. Depending on our liquidity levels,conditions in the capital markets and other factors, we may from time to time consider the issuance ofdebt, equity or other securities, the proceeds of which could provide additional liquidity for ouroperations.
Facilities
On October 20, 2015, we consummated a refinancing pursuant to which we amended and restatedour senior unsecured credit facilities. The Facilities consist of a $425.0 million senior unsecured termloan facility (the ‘‘Term Facility’’) and a $1.0 billion senior unsecured revolving credit facility (the‘‘Revolving Facility’’) which provides for the issuance of letters of credit up to $175.0 million. TheFacilities are scheduled to mature on October 20, 2020.
Borrowings under the Facilities bear interest at a rate equal to an applicable interest rate marginplus, at our option, either (a) LIBOR or (b) a base rate (which is usually equal to the prime rate). Theapplicable interest rate margin for borrowings as of January 29, 2016 was 1.10% for LIBOR borrowingsand 0.10% for base-rate borrowings. We must also pay a facility fee, payable on any used and unusedcommitment amounts of the Facilities, and customary fees on letters of credit issued under theRevolving Facility. The applicable interest rate margins for borrowings, the facility fees and the letter ofcredit fees under the Facilities are subject to adjustment from time to time based on our long-termsenior unsecured debt ratings. The weighted average all-in interest rate for borrowings under theFacilities was 1.65% as of January 29, 2016.
The Facilities can be voluntarily prepaid in whole or in part at any time without penalty. There isno required amortization under the Facilities. The Facilities contain a number of customary affirmativeand negative covenants that, among other things, restrict, subject to certain exceptions, the Company’sand its subsidiaries ability to: incur additional liens; sell all or substantially all of our assets;consummate certain fundamental changes or change in the Company’s lines of business; and incuradditional subsidiary indebtedness. The Facilities also contain financial covenants that require themaintenance of a minimum fixed charge coverage ratio and a maximum leverage ratio. As ofJanuary 29, 2016, we were in compliance with all such covenants. The Facilities also contain customaryevents of default.
As of January 29, 2016, under the Revolving Facility, the Company had outstanding borrowings of$251.0 million, standby letters of credit of $27.0 million, and borrowing availability of $722.0 million. Inaddition, we had outstanding commercial letters of credit of $11.7 million.
30

10-K
For the remainder of fiscal 2016, we anticipate potential borrowings under the Revolving Facilityup to a maximum of approximately $500 million outstanding at any one time, including any anticipatedborrowings to fund repurchases of common stock.
Senior Notes
On October 20, 2015, we issued $500.0 million aggregate principal amount of 4.150% senior notesdue 2025 (the ‘‘2025 Senior Notes’’), net of discount of $0.8 million, which are scheduled to mature onNovember 1, 2025. In addition, we have $500.0 million aggregate principal amount of 4.125% seniornotes due 2017 (the ‘‘2017 Senior Notes’’) which are scheduled to mature on July 15, 2017,$400.0 million aggregate principal amount of 1.875% senior notes due 2018 (the ‘‘2018 Senior Notes’’),net of discount of $0.2 million, which are scheduled to mature on April 15, 2018; and $900.0 millionaggregate principal amount of 3.25% senior notes due 2023 (the ‘‘2023 Senior Notes’’), net of discountof $1.8 million, which are scheduled to mature on April 15, 2023. Collectively, the 2017 Senior Notes,the 2018 Senior Notes, the 2023 Senior Notes and the 2025 Senior Notes comprise the ‘‘Senior Notes’’,each of which were issued pursuant to an indenture as supplemented and amended by supplementalindentures relating to each series of Senior Notes (as so supplemented and amended, the ‘‘SeniorIndenture’’). Interest on the 2017 Senior Notes is payable in cash on January 15 and July 15 of eachyear. Interest on the 2018 Senior Notes and the 2023 Senior Notes is payable in cash on April 15 andOctober 15 of each year. Interest on the 2025 Senior Notes is payable in cash on May 1 andNovember 1 of each year, commencing on May 1, 2016. The net proceeds from the sale of the 2025Senior Notes were used, together with borrowings under the Facilities, to repay all outstandingborrowings under the then-existing credit agreement and for general corporate purposes.
We may redeem some or all of the Senior Notes at any time at redemption prices set forth in theSenior Indenture. Upon the occurrence of a change of control triggering event, which is defined in theSenior Indenture, each holder of our Senior Notes has the right to require us to repurchase some or allof such holder’s Senior Notes at a purchase price in cash equal to 101% of the principal amountthereof, plus accrued and unpaid interest, if any, to, but excluding, the repurchase date.
The Senior Indenture contains covenants limiting, among other things, our ability (subject tocertain exceptions) to consolidate, merge, or sell or otherwise dispose of all or substantially all of ourassets; and our ability and the ability of our subsidiaries to incur or guarantee indebtedness secured byliens on any shares of voting stock of significant subsidiaries.
The Senior Indenture also provides for events of default which, if any of them occurs, wouldpermit or require the principal of and accrued interest on our Senior Notes to become or to bedeclared due and payable, as applicable.
Sale Leaseback Transaction
In January 2014 we consummated a transaction pursuant to which we sold and subsequently leasedback the land, buildings and related improvements for 233 of our stores. This transaction resulted incash proceeds of approximately $281.6 million.
Rating Agencies
In October 2015, Standard & Poor’s raised our senior unsecured debt rating and our corporatedebt rating to BBB, both with a stable outlook, and Moody’s reaffirmed our senior unsecured debtrating of Baa3 and changed our outlook to positive. Our current credit ratings, as well as future ratingagency actions, could (i) impact our ability to finance our operations on satisfactory terms; (ii) affectour financing costs; and (iii) affect our insurance premiums and collateral requirements necessary forour self-insured programs. There can be no assurance that we will be able to maintain or improve ourcurrent credit ratings.
31

10-K
Interest Rate Swaps
From time to time, we use interest rate swaps to minimize the risk of adverse changes in interestrates. These swaps are intended to reduce risk by hedging an underlying economic exposure. Becauseof high correlation between the derivative financial instrument and the underlying exposure beinghedged, fluctuations in the value of the financial instruments are generally offset by reciprocal changesin the value of the underlying economic exposure. Our principal interest rate exposure relates tooutstanding amounts under our Facilities. On May 31, 2015, interest rate swaps with a total notionalamount of $875.0 million expired, and at January 29, 2016, we had no outstanding interest rate swaps.For more information see Item 7A, ‘‘Quantitative and Qualitative Disclosures about Market Risk’’below.
Contractual Obligations
The following table summarizes our significant contractual obligations and commercialcommitments as of January 29, 2016 (in thousands):
Payments Due by Period
Contractual obligations Total < 1 year 1 - 3 years 3 - 5 years 5+ years
Long-term debt obligations . . . . . . . . $ 2,986,590 $ 215 $ 900,770 $ 677,080 $1,408,525Capital lease obligations . . . . . . . . . . 4,806 1,164 1,412 920 1,310Interest(a) . . . . . . . . . . . . . . . . . . . . 513,562 89,626 141,340 119,576 163,020Self-insurance liabilities(b) . . . . . . . . 221,796 83,293 89,438 30,388 18,677Operating lease obligations(c) . . . . . . 7,229,243 866,444 1,614,931 1,353,567 3,394,301
Subtotal . . . . . . . . . . . . . . . . . . . . $10,955,997 $1,040,742 $2,747,891 $2,181,531 $4,985,833
Commitments Expiring by Period
Commercial commitments(d) Total < 1 year 1 - 3 years 3 - 5 years 5+ years
Letters of credit . . . . . . . . . . . . . . . . $ 11,680 $ 11,680 $ — $ — $ —Purchase obligations(e) . . . . . . . . . . 722,630 722,630 — — —
Subtotal . . . . . . . . . . . . . . . . . . . . $ 734,310 $ 734,310 $ — $ — $ —
Total contractual obligations andcommercial commitments(f) . . . . . $11,690,307 $1,775,052 $2,747,891 $2,181,531 $4,985,833
(a) Represents obligations for interest payments on long-term debt and capital lease obligations, andincludes projected interest on variable rate long-term debt, using 2015 year end rates and balances.Variable rate long-term debt includes the balance of the senior revolving credit facility (which hada balance of $251 million as of January 29, 2016), the balance of our tax increment financing of$10.6 million, and the balance of the senior term loan facility of $425 million.
(b) We retain a significant portion of the risk for our workers’ compensation, employee healthinsurance, general liability, property loss and automobile insurance. As these obligations do nothave scheduled maturities, these amounts represent undiscounted estimates based upon actuarialassumptions. Reserves for workers’ compensation and general liability which existed as of the dateof a merger transaction in 2007 were discounted in order to arrive at estimated fair value. Allother amounts are reflected on an undiscounted basis in our consolidated balance sheets.
(c) Operating lease obligations are inclusive of amounts included in deferred rent in our consolidatedbalance sheets.
32

10-K
(d) Commercial commitments include information technology license and support agreements,supplies, fixtures, letters of credit for import merchandise, and other inventory purchaseobligations.
(e) Purchase obligations include legally binding agreements for software licenses and support, supplies,fixtures, and merchandise purchases (excluding such purchases subject to letters of credit).
(f) We have potential payment obligations associated with uncertain tax positions that are notreflected in these totals. We are currently unable to make reasonably reliable estimates of theperiod of cash settlement with the taxing authorities for the $8.7 million of reserves for uncertaintax positions.
Share Repurchase Program
On December 2, 2015, the Company’s Board of Directors authorized a $1.0 billion increase to ourexisting common stock repurchase program. Our common stock repurchase program had a totalremaining authorization of approximately $924 million at January 29, 2016. Under the authorization,purchases may be made in the open market or in privately negotiated transactions from time to timesubject to market and other conditions, and the authorization has no expiration date. For more detailabout our share repurchase program, see Note 12 to the consolidated financial statements.
Other Considerations
On March 8, 2016, the Board of Directors approved a quarterly cash dividend to shareholders of$0.25 per share which will be paid on April 12, 2016 to shareholders of record on March 29, 2016, anincrease of $0.03 per share over quarterly dividends paid in 2015. Although the Board currently intendsto continue regular quarterly cash dividends, the payment of future cash dividends are subject to theBoard’s discretion and will depend upon, among other things, our results of operations, cashrequirements, financial condition, contractual restrictions and other factors that our Board may deemrelevant.
Our inventory balance represented approximately 54% of our total assets exclusive of goodwill andother intangible assets as of January 29, 2016. Our ability to effectively manage our inventory balancescan have a significant impact on our cash flows from operations during a given fiscal year. Inventorypurchases are often somewhat seasonal in nature, such as the purchase of warm-weather or Christmas-related merchandise. Efficient management of our inventory has been and continues to be an area offocus for us.
As described in Note 8 to the consolidated financial statements, we are involved in a number oflegal actions and claims, some of which could potentially result in material cash payments. Adversedevelopments in those actions could materially and adversely affect our liquidity. We also have certainincome tax-related contingencies as disclosed in Note 4 to the consolidated financial statements. Futurenegative developments could have a material adverse effect on our liquidity.
Cash Flows
Cash flows from operating activities. Cash flows from operating activities were $1.38 billion in2015, an increase of $63.2 million compared to 2014. Significant components of the increase in cashflows from operating activities in 2015 compared to 2014 include increased net income due primarily toincreased sales and operating profit in 2015 as described in more detail above under ‘‘Results ofOperations.’’ Changes in merchandise inventories resulted in a net use of working capital, increasing bya greater amount in 2015 compared to 2014 as described in greater detail below. Accounts payableincreased by $105.6 million in 2015 compared to a $97.2 million increase in 2014, due primarily to thetiming of merchandise receipts and related payments.
33
10-K
Cash flows from operating activities were $1.31 billion in 2014, an increase of $101.7 millioncompared to 2013. Significant components of the increase in cash flows from operating activities in2014 compared to 2013 include increased net income due primarily to increased sales and operatingprofit in 2014 as described in more detail above under ‘‘Results of Operations.’’ Merchandiseinventories increased by a greater amount in 2014 compared to 2013 as described in greater detailbelow, which was partially offset by accounts payable, which increased by $97.2 million in 2014compared to a $36.9 million increase in 2013. The increase in accounts payable during 2014 was dueprimarily to the volume and timing of domestic merchandise receipts.
On an ongoing basis, we closely monitor and manage our inventory balances, and they mayfluctuate from period to period based on new store openings, the timing of purchases, and otherfactors. Inventory balances at January 29, 2016 were impacted by a new DC in Texas, the timing of theEaster holiday in 2016, and our in-stock improvement initiative. Merchandise inventories increased by10% in 2015, by 9% in 2014, and by 7% in 2013. Inventory levels in the consumables categoryincreased by $218.4 million, or 13% in 2015, by $178.4 million, or 12%, in 2014, and by $168.0 million,or 12%, in 2013. The seasonal category increased by $63.2 million, or 13%, in 2015, by $13.8 million, or3%, in 2014, and decreased by $4.7 million, or 1%, in 2013. The home products category increased by$12.8 million, or 5%, in 2015, was essentially unchanged in 2014, and increased by $22.0 million, or 9%,in 2013. The apparel category decreased by $2.7 million, or 1%, in 2015, increased by $37.1 million, or13%, in 2014, and decreased by $29.5 million, or 9%, in 2013.
Cash flows from investing activities. Significant components of property and equipment purchasesin 2015 included the following approximate amounts: $168 million for improvements, upgrades,remodels and relocations of existing stores; $144 million for distribution and transportation-relatedprojects; $99 million for new leased stores; $53 million for stores built by us; and $34 million forinformation systems upgrades and technology-related projects. The timing of new, remodeled andrelocated store openings along with other factors may affect the relationship between such openingsand the related property and equipment purchases in any given period. During 2015, we opened730 new stores and remodeled or relocated 881 stores.
Significant components of property and equipment purchases in 2014 included the followingapproximate amounts: $127 million for improvements, upgrades, remodels and relocations of existingstores; $102 million for new leased stores; $64 million for distribution and transportation-relatedprojects; $38 million for stores built by us; and $35 million for information systems upgrades andtechnology-related projects. During 2014, we opened 700 new stores and remodeled or relocated915 stores. Cash flows from investing activities decreased from 2013 to 2014, due primarily to asale-leaseback transaction in 2013 (more fully described below).
Significant components of property and equipment purchases in 2013 included the followingapproximate amounts: $187 million for improvements, upgrades, remodels and relocations of existingstores; $124 million for new leased stores; $112 million for distribution centers, which included asignificant portion of the construction cost of a distribution center in Pennsylvania; $76 million forstores purchased or built by us; and $28 million for information systems upgrades andtechnology-related projects. During 2013, we opened 650 new stores and remodeled or relocated 582stores. Our sale-leaseback transaction which we consummated in January 2014 for 233 of our storesresulted in proceeds from the sale of these properties of approximately $281.6 million.
Capital expenditures during 2016 are projected to be in the range of $550-$600 million. Weanticipate funding 2016 capital requirements with existing cash balances, cash flows from operations,and we also expect to have significant availability under our Revolving Facility if necessary. We plan tocontinue to invest in store growth and development of approximately 900 new stores and approximately875 stores to be remodeled or relocated. Capital expenditures in 2016 are anticipated to support ourstore growth as well as our remodel and relocation initiatives, including capital outlays for leasehold
34

10-K
improvements, fixtures and equipment; the construction of new stores; costs to support and enhanceour supply chain initiatives including new and existing distribution center facilities; technologyinitiatives; as well as routine and ongoing capital requirements.
Cash flows from financing activities. In 2015, we repurchased 17.6 million outstanding shares ofour common stock at a total cost of $1.3 billion. We made repayments of $500.0 million on the balanceof the Term Facility, and had proceeds of $499.2 million from the issuance of senior notes. Netborrowings under the Revolving Facility during 2015 were $251.0 million.
In 2014, we repurchased 14.1 million outstanding shares of our common stock at a total cost of$800.1 million. We made repayments of $75.0 million on the balance of the Term Facility. Borrowingsand repayments under the Revolving Facility during the 2014 period were the same amount, resultingin no net increase to amounts outstanding under the Revolving Facility during 2014.
The 2013 cash flows from financing activities reflect a refinancing in April 2013, including theissuance of long-term obligations which includes the $1.0 billion unsecured Term Facility and theissuance of Senior Notes totaling approximately $1.3 billion. Proceeds from these transactions wereused to repay our previous secured term loan and revolving credit facilities which had balances of$1.96 billion and $155.6 million when refinanced. Net repayments under the Revolving Facility were$130.9 million during 2013. We paid debt issuance costs and hedging fees totaling $29.2 million in 2013related to the refinancing. Also in 2013, we repurchased 11.0 million outstanding shares of our commonstock at a total cost of $620.1 million.
Accounting Standards
In February 2016, the FASB issued new guidance related to lease accounting. This guidancerequires a dual approach for lessee accounting under which a lessee will account for leases as financeleases or operating leases. Both finance leases and operating leases will result in the lessee recognizinga right-of-use asset and a corresponding lease liability on its balance sheet, with differing methodologyfor income statement recognition. This guidance is effective for public business entities for fiscal years,and interim periods within those years, beginning after December 15, 2018, and early adoption ispermitted. A modified retrospective approach is required for all leases existing or entered into after thebeginning of the earliest comparative period in the consolidated financial statements. We are currentlyassessing the impact that adoption of this guidance will have on our consolidated financial statements,and we are anticipating a material impact because of our significant volume of lease contracts.
Critical Accounting Policies and Estimates
The preparation of financial statements in accordance with generally accepted accountingprinciples in the United States (‘‘U.S. GAAP’’) requires management to make estimates andassumptions that affect reported amounts and related disclosures. In addition to the estimatespresented below, there are other items within our financial statements that require estimation, but arenot deemed critical as defined below. We believe these estimates are reasonable and appropriate.However, if actual experience differs from the assumptions and other considerations used, the resultingchanges could have a material effect on the financial statements taken as a whole.
Management believes the following policies and estimates are critical because they involvesignificant judgments, assumptions, and estimates. Management has discussed the development andselection of the critical accounting estimates with the Audit Committee of our Board of Directors, andthe Audit Committee has reviewed the disclosures presented below relating to those policies andestimates. See Note 1 to the consolidated financial statements for a detailed discussion of our principalaccounting policies.
35

10-K
Merchandise Inventories. Merchandise inventories are stated at the lower of cost or market(‘‘LCM’’) with cost determined using the retail last in, first out (‘‘LIFO’’) method. We use the retailinventory method (‘‘RIM’’) to calculate gross profit and the resulting valuation of inventories at cost,which are computed utilizing a calculated cost-to-retail inventory ratio at an inventory department level.We apply the RIM to these departments, which are groups of products that are fairly uniform in termsof cost, selling price relationship and turnover. The RIM will result in valuing inventories at LCM ifpermanent markdowns are currently taken as a reduction of the retail value of inventories. Inherent inthe retail inventory method calculation are certain management judgments and estimates that mayimpact the ending inventory valuation at cost, as well as the gross profit recognized. These judgmentsinclude ensuring departments consist of uniform products, recording estimated shrinkage betweenphysical inventories, and timely recording of markdowns needed to sell inventory.
We perform an annual LIFO analysis whereby all merchandise units are considered for inclusion inthe index formulation. An actual valuation of inventory under the LIFO method is made at the end ofeach year based on the inventory levels and costs at that time. In contrast, interim LIFO calculationsare based on management’s annual estimates of sales and the rate of inflation or deflation, as well asyear-end inventory levels. We also perform analyses for determining obsolete inventory, adjustinginventory on a quarterly basis to an LCM value based on various management assumptions includingestimated below cost markdowns not yet recorded, but required to liquidate such inventory in futureperiods.
Factors considered in the determination of markdowns include current and anticipated demandbased on changes in competitors’ practices, consumer preferences, consumer spending andunseasonable weather patterns. Certain of these factors are outside of our control and may result ingreater than estimated markdowns to entice consumer purchases of excess inventory. The amount andtiming of markdowns may vary significantly from year to year.
We perform physical inventories in virtually all of our stores on an annual basis. We calculate ourshrink provision based on actual physical inventory results during the fiscal period and an accrual forestimated shrink occurring subsequent to a physical inventory through the end of the fiscal reportingperiod. This accrual is calculated as a percentage of sales at each retail store, at a department level,based on the store’s most recent historical shrink rate. To the extent that subsequent physicalinventories yield different results than the estimated accrual, our effective shrink rate for a givenreporting period will include the impact of adjusting to the actual results.
We believe our estimates and assumptions related to the application of the RIM results in amerchandise inventory valuation that reasonably approximates cost on a consistent basis.
Goodwill and Other Intangible Assets. The qualitative and quantitative assessments related to thevaluation and any potential impairment of goodwill and other intangible assets are each subject tojudgments and/or assumptions. The analysis of qualitative factors may include determining theappropriate factors to consider and the relative importance of those factors along with otherassumptions. If required, judgments in the quantitative testing process may include projecting futurecash flows, determining appropriate discount rates, correctly applying valuation techniques, correctlycomputing the implied fair value of goodwill if necessary, and other assumptions. Future cash flowprojections are based on management’s projections and represent best estimates taking into accountrecent financial performance, market trends, strategic plans and other available information, which inrecent years have been materially accurate. Changes in these estimates and assumptions couldmaterially affect the determination of fair value or impairment, however, such a conclusion is notindicated by recent analyses. Future indicators of impairment could result in an asset impairmentcharge. If these judgments or assumptions are incorrect or flawed, the analysis could be negativelyimpacted.
36

10-K
Our most recent testing of our goodwill and indefinite lived trade name intangible assets wascompleted during the third quarter of 2015. No indicators of impairment were evident and noassessment of or adjustment to these assets was required. We are not currently projecting a decline incash flows that could be expected to have an adverse effect such as a violation of debt covenants orfuture impairment charges.
Property and Equipment. Property and equipment are recorded at cost. We group our assets intorelatively homogeneous classes and generally provide for depreciation on a straight-line basis over theestimated average useful life of each asset class, except for leasehold improvements, which areamortized over the lesser of the applicable lease term or the estimated useful life of the asset. Certainstore and warehouse fixtures, when fully depreciated, are removed from the cost and relatedaccumulated depreciation and amortization accounts. The valuation and classification of these assetsand the assignment of depreciable lives involves judgments and the use of estimates, which we believehave been materially accurate in recent years.
Impairment of Long-lived Assets. Impairment of long-lived assets results when the carrying valueof the assets exceeds the estimated undiscounted future cash flows generated by the assets. Ourestimate of undiscounted future store cash flows is based upon historical operations of the stores andestimates of future profitability which encompasses many factors that are subject to variability and aredifficult to predict. If our estimates of future cash flows are not materially accurate, our impairmentanalysis could be impacted accordingly. If a long-lived asset is found to be impaired, the amountrecognized for impairment is equal to the difference between the carrying value and the asset’sestimated fair value. The fair value is estimated based primarily upon projected future cash flows(discounted at our credit adjusted risk-free rate) or other reasonable estimates of fair market value.Although not currently anticipated, changes in these estimates, assumptions or projections couldmaterially affect the determination of fair value or impairment.
Insurance Liabilities. We retain a significant portion of the risk for our workers’ compensation,employee health, property loss, automobile and general liability. These represent significant costsprimarily due to our large employee base and number of stores. Provisions are made for these liabilitieson an undiscounted basis. Certain of these liabilities are based on actual claim data and estimates ofincurred but not reported claims developed using actuarial methodologies based on historical claimtrends, which have been and are anticipated to continue to be materially accurate. If future claimtrends deviate from recent historical patterns, or other unanticipated events affect the number andsignificance of future claims, we may be required to record additional expenses or expense reductions,which could be material to our future financial results.
Contingent Liabilities—Income Taxes. Income tax reserves are determined using the methodologyestablished by accounting standards relating to uncertainty in income taxes. These standards requirecompanies to assess each income tax position taken using a two-step process. A determination is firstmade as to whether it is more likely than not that the position will be sustained, based upon thetechnical merits, upon examination by the taxing authorities. If the tax position is expected to meet themore likely than not criteria, the benefit recorded for the tax position equals the largest amount that isgreater than 50% likely to be realized upon ultimate settlement of the respective tax position.Uncertain tax positions require determinations and liabilities to be estimated based on provisions of thetax law which may be subject to change or varying interpretation. If our determinations and estimatesprove to be inaccurate, the resulting adjustments could be material to our future financial results.
Contingent Liabilities—Legal Matters. We are subject to legal, regulatory and other proceedingsand claims. We establish liabilities as appropriate for these claims and proceedings based upon theprobability and estimability of losses and to fairly present, in conjunction with the disclosures of thesematters in our financial statements and SEC filings, management’s view of our exposure. We reviewoutstanding claims and proceedings with external counsel to assess probability and estimates of loss,
37

10-K
which includes an analysis of whether such loss estimates are probable, reasonably possible, or remote.We re-evaluate these assessments on a quarterly basis or as new and significant information becomesavailable to determine whether a liability should be established or if any existing liability should beadjusted. The actual cost of resolving a claim or proceeding ultimately may be substantially differentthan the amount of the recorded liability. In addition, because it is not permissible under U.S. GAAPto establish a litigation liability until the loss is both probable and estimable, in some cases there maybe insufficient time to establish a liability prior to the actual incurrence of the loss (upon verdict andjudgment at trial, for example, or in the case of a quickly negotiated settlement).
Lease Accounting and Excess Facilities. Many of our stores are subject to build-to-suitarrangements with landlords, which typically carry a primary lease term of up to 15 years with multiplerenewal options. We also have stores subject to shorter-term leases and many of these leases haverenewal options. Certain of our stores have provisions for contingent rentals based upon a percentageof defined sales volume. We recognize contingent rental expense when the achievement of specifiedsales targets is considered probable. We record minimum rental expense on a straight-line basis overthe base, non-cancelable lease term commencing on the date that we take physical possession of theproperty from the landlord, which normally includes a period prior to store opening to make necessaryleasehold improvements and install store fixtures. When a lease contains a predetermined fixedescalation of the minimum rent, we recognize the related rent expense on a straight-line basis andrecord the difference between the recognized rental expense and the amounts payable under the leaseas deferred rent. Tenant allowances, to the extent received, are recorded as deferred incentive rent andamortized as a reduction to rent expense over the term of the lease. We reflect as a liability anydifference between the calculated expense and the amounts actually paid. Improvements of leasedproperties are amortized over the shorter of the life of the applicable lease term or the estimateduseful life of the asset.
Share-Based Payments. Our stock option awards are valued on an individual grant basis using theBlack-Scholes-Merton closed form option pricing model. We believe that this model fairly estimates thevalue of our stock option awards. The application of this valuation model involves assumptions that arejudgmental in the valuation of stock options, which affects compensation expense related to theseoptions. These assumptions include the term that the options are expected to be outstanding, thehistorical volatility of our stock price, applicable interest rates and the dividend yield of our stock.Other factors involving judgments that affect the expensing of share-based payments include estimatedforfeiture rates of share-based awards. Historically, these estimates have been materially accurate;however, if our estimates differ materially from actual experience, we may be required to recordadditional expense or reductions of expense, which could be material to our future financial results.
Fair Value Measurements. Accounting standards for the measurement of fair value of assets andliabilities establish a fair value hierarchy that distinguishes between market participant assumptionsbased on market data obtained from sources independent of the reporting entity (observable inputsthat are classified within Levels 1 and 2 of the hierarchy) and the reporting entity’s own assumptionsabout market participant assumptions (unobservable inputs classified within Level 3 of the hierarchy).Therefore, Level 3 inputs are typically based on an entity’s own assumptions, as there is little, if any,related market activity, and thus require the use of significant judgment and estimates. Currently, wehave no assets or liabilities that are valued based solely on Level 3 inputs.
Our fair value measurements are primarily associated with our outstanding debt instruments. Weuse various valuation models in determining the values of these liabilities. We believe that in recentyears these methodologies have produced materially accurate valuations.
38

10-K
ITEM 7A. QUANTITATIVE AND QUALITATIVE DISCLOSURES ABOUT MARKET RISK
Financial Risk Management
We are exposed to market risk primarily from adverse changes in interest rates, and to a lesserdegree commodity prices. To minimize this risk, we may periodically use financial instruments, includingderivatives. All derivative financial instrument transactions must be authorized and executed pursuantto approval by the Board of Directors. As a matter of policy, we do not buy or sell financialinstruments for speculative or trading purposes, and any such derivative financial instruments areintended to be used to reduce risk by hedging an underlying economic exposure. Our objective is tocorrelate derivative financial instruments and the underlying exposure being hedged, so thatfluctuations in the value of the financial instruments are generally offset by reciprocal changes in thevalue of the underlying economic exposure.
Interest Rate Risk
We manage our interest rate risk through the strategic use of fixed and variable interest rate debtand, from time to time, derivative financial instruments. Our principal interest rate exposure relates tooutstanding amounts under our unsecured debt Facilities. As of January 29, 2016, we had variable rateborrowings of $425 million under our Term Facility and borrowings of $251 million outstanding underour Revolving Facility. In order to mitigate a portion of the variable rate interest exposure under theFacilities, in prior years we have entered into various interest rate swaps. As of January 29, 2016, nosuch interest rate swaps were outstanding and, as a result, we are exposed to fluctuations in variableinterest rates under the Facilities. For a detailed discussion of our Facilities, see Note 5 to theconsolidated financial statements.
A change in interest rates on variable rate debt impacts our pre-tax earnings and cash flows;whereas a change in interest rates on fixed rate debt impacts the economic fair value of debt but notour pre-tax earnings and cash flows. Based on our variable rate borrowing levels and interest rate swapsoutstanding as of January 29, 2016 and January 30, 2015, the annualized effect of a one percentagepoint increase in variable interest rates would have resulted in a pretax reduction of our earnings andcash flows of approximately $6.9 million in 2015 and $0.6 million in 2014.
39

10-K
ITEM 8. FINANCIAL STATEMENTS AND SUPPLEMENTARY DATA
Report of Independent Registered Public Accounting Firm
The Board of Directors and Shareholders ofDollar General Corporation
We have audited the accompanying consolidated balance sheets of Dollar General Corporation andsubsidiaries as of January 29, 2016 and January 30, 2015, and the related consolidated statements ofincome, comprehensive income, shareholders’ equity and cash flows for each of the three years in theperiod ended January 29, 2016. These financial statements are the responsibility of the Company’smanagement. Our responsibility is to express an opinion on these financial statements based on ouraudits.
We conducted our audits in accordance with the standards of the Public Company AccountingOversight Board (United States). Those standards require that we plan and perform the audit to obtainreasonable assurance about whether the financial statements are free of material misstatement. Anaudit includes examining, on a test basis, evidence supporting the amounts and disclosures in thefinancial statements. An audit also includes assessing the accounting principles used and significantestimates made by management, as well as evaluating the overall financial statement presentation. Webelieve that our audits provide a reasonable basis for our opinion.
In our opinion, the financial statements referred to above present fairly, in all material respects,the consolidated financial position of Dollar General Corporation and subsidiaries at January 29, 2016and January 30, 2015, and the consolidated results of their operations and their cash flows for each ofthe three years in the period ended January 29, 2016, in conformity with U.S. generally acceptedaccounting principles.
We also have audited, in accordance with the standards of the Public Company AccountingOversight Board (United States), Dollar General Corporation and subsidiaries’ internal control overfinancial reporting as of January 29, 2016, based on criteria established in Internal Control—IntegratedFramework issued by the Committee of Sponsoring Organizations of the Treadway Commission (2013framework) and our report dated March 22, 2016 expressed an unqualified opinion thereon.
/s/ Ernst & Young LLP
Nashville, TennesseeMarch 22, 2016
40

10-K
DOLLAR GENERAL CORPORATION AND SUBSIDIARIES
CONSOLIDATED BALANCE SHEETS
(In thousands, except per share amounts)
January 29, January 30,2016 2015
(see Note 1)
ASSETSCurrent assets:
Cash and cash equivalents . . . . . . . . . . . . . . . . . . . . . . . . . . . . . . . . . . $ 157,947 $ 579,823Merchandise inventories . . . . . . . . . . . . . . . . . . . . . . . . . . . . . . . . . . . . 3,074,153 2,782,521Income tax receivable . . . . . . . . . . . . . . . . . . . . . . . . . . . . . . . . . . . . . 6,843 —Prepaid expenses and other current assets . . . . . . . . . . . . . . . . . . . . . . . 193,467 170,265
Total current assets . . . . . . . . . . . . . . . . . . . . . . . . . . . . . . . . . . . . . . . 3,432,410 3,532,609
Net property and equipment . . . . . . . . . . . . . . . . . . . . . . . . . . . . . . . . . . 2,264,062 2,116,075
Goodwill . . . . . . . . . . . . . . . . . . . . . . . . . . . . . . . . . . . . . . . . . . . . . . . . 4,338,589 4,338,589
Other intangible assets, net . . . . . . . . . . . . . . . . . . . . . . . . . . . . . . . . . . . 1,200,994 1,201,870
Other assets, net . . . . . . . . . . . . . . . . . . . . . . . . . . . . . . . . . . . . . . . . . . . 21,830 19,499
Total assets . . . . . . . . . . . . . . . . . . . . . . . . . . . . . . . . . . . . . . . . . . . . . . . $11,257,885 $11,208,642
LIABILITIES AND SHAREHOLDERS’ EQUITYCurrent liabilities:
Current portion of long-term obligations . . . . . . . . . . . . . . . . . . . . . . . . $ 1,379 $ 101,158Accounts payable . . . . . . . . . . . . . . . . . . . . . . . . . . . . . . . . . . . . . . . . . 1,494,225 1,388,154Accrued expenses and other . . . . . . . . . . . . . . . . . . . . . . . . . . . . . . . . . 467,122 413,760Income taxes payable . . . . . . . . . . . . . . . . . . . . . . . . . . . . . . . . . . . . . . 32,870 59,400
Total current liabilities . . . . . . . . . . . . . . . . . . . . . . . . . . . . . . . . . . . . . 1,995,596 1,962,472
Long-term obligations . . . . . . . . . . . . . . . . . . . . . . . . . . . . . . . . . . . . . . . 2,969,175 2,623,965
Deferred income taxes . . . . . . . . . . . . . . . . . . . . . . . . . . . . . . . . . . . . . . . 639,955 626,858
Other liabilities . . . . . . . . . . . . . . . . . . . . . . . . . . . . . . . . . . . . . . . . . . . . 275,283 285,309
Commitments and contingencies
Shareholders’ equity:Preferred stock, 1,000 shares authorized . . . . . . . . . . . . . . . . . . . . . . . . — —Common stock; $0.875 par value, 1,000,000 shares authorized, 286,694
and 303,447 shares issued and outstanding at January 29, 2016 andJanuary 30, 2015, respectively . . . . . . . . . . . . . . . . . . . . . . . . . . . . . . 250,855 265,514
Additional paid-in capital . . . . . . . . . . . . . . . . . . . . . . . . . . . . . . . . . . . 3,107,283 3,048,806Retained earnings . . . . . . . . . . . . . . . . . . . . . . . . . . . . . . . . . . . . . . . . 2,025,545 2,403,045Accumulated other comprehensive loss . . . . . . . . . . . . . . . . . . . . . . . . . (5,807) (7,327)
Total shareholders’ equity . . . . . . . . . . . . . . . . . . . . . . . . . . . . . . . . . . . 5,377,876 5,710,038
Total liabilities and shareholders’ equity . . . . . . . . . . . . . . . . . . . . . . . . . . $11,257,885 $11,208,642
The accompanying notes are an integral part of the consolidated financial statements.
41

10-K
DOLLAR GENERAL CORPORATION AND SUBSIDIARIES
CONSOLIDATED STATEMENTS OF INCOME
(In thousands, except per share amounts)
For the Year Ended
January 29, January 30, January 31,2016 2015 2014
Net sales . . . . . . . . . . . . . . . . . . . . . . . . . . . . . . . . . . . . . . $20,368,562 $18,909,588 $17,504,167Cost of goods sold . . . . . . . . . . . . . . . . . . . . . . . . . . . . . . . 14,062,471 13,107,081 12,068,425
Gross profit . . . . . . . . . . . . . . . . . . . . . . . . . . . . . . . . . . . . 6,306,091 5,802,507 5,435,742Selling, general and administrative expenses . . . . . . . . . . . . . 4,365,797 4,033,414 3,699,557
Operating profit . . . . . . . . . . . . . . . . . . . . . . . . . . . . . . . . . 1,940,294 1,769,093 1,736,185Interest expense . . . . . . . . . . . . . . . . . . . . . . . . . . . . . . . . . 86,944 88,232 88,984Other (income) expense . . . . . . . . . . . . . . . . . . . . . . . . . . . 326 — 18,871
Income before income taxes . . . . . . . . . . . . . . . . . . . . . . . . 1,853,024 1,680,861 1,628,330Income tax expense . . . . . . . . . . . . . . . . . . . . . . . . . . . . . . 687,944 615,516 603,214
Net income . . . . . . . . . . . . . . . . . . . . . . . . . . . . . . . . . . . . $ 1,165,080 $ 1,065,345 $ 1,025,116
Earnings per share:Basic . . . . . . . . . . . . . . . . . . . . . . . . . . . . . . . . . . . . . . . $ 3.96 $ 3.50 $ 3.17Diluted . . . . . . . . . . . . . . . . . . . . . . . . . . . . . . . . . . . . . . $ 3.95 $ 3.49 $ 3.17
Weighted average shares outstanding:Basic . . . . . . . . . . . . . . . . . . . . . . . . . . . . . . . . . . . . . . . 294,330 304,633 322,886Diluted . . . . . . . . . . . . . . . . . . . . . . . . . . . . . . . . . . . . . . 295,211 305,681 323,854
Dividends per share . . . . . . . . . . . . . . . . . . . . . . . . . . . . . . $ 0.88 $ — $ —
The accompanying notes are an integral part of the consolidated financial statements.
42

10-K
DOLLAR GENERAL CORPORATION AND SUBSIDIARIES
CONSOLIDATED STATEMENTS OF COMPREHENSIVE INCOME
(In thousands)
For the Year Ended
January 29, January 30, January 31,2016 2015 2014
Net income . . . . . . . . . . . . . . . . . . . . . . . . . . . . . . . . . . . . . . . $1,165,080 $1,065,345 $1,025,116Unrealized net gain (loss) on hedged transactions, net of related
income tax expense (benefit) of $971, $1,671 and $(4,461),respectively . . . . . . . . . . . . . . . . . . . . . . . . . . . . . . . . . . . . . 1,520 2,583 (6,972)
Comprehensive income . . . . . . . . . . . . . . . . . . . . . . . . . . . . . . $1,166,600 $1,067,928 $1,018,144
The accompanying notes are an integral part of the consolidated financial statements.
43
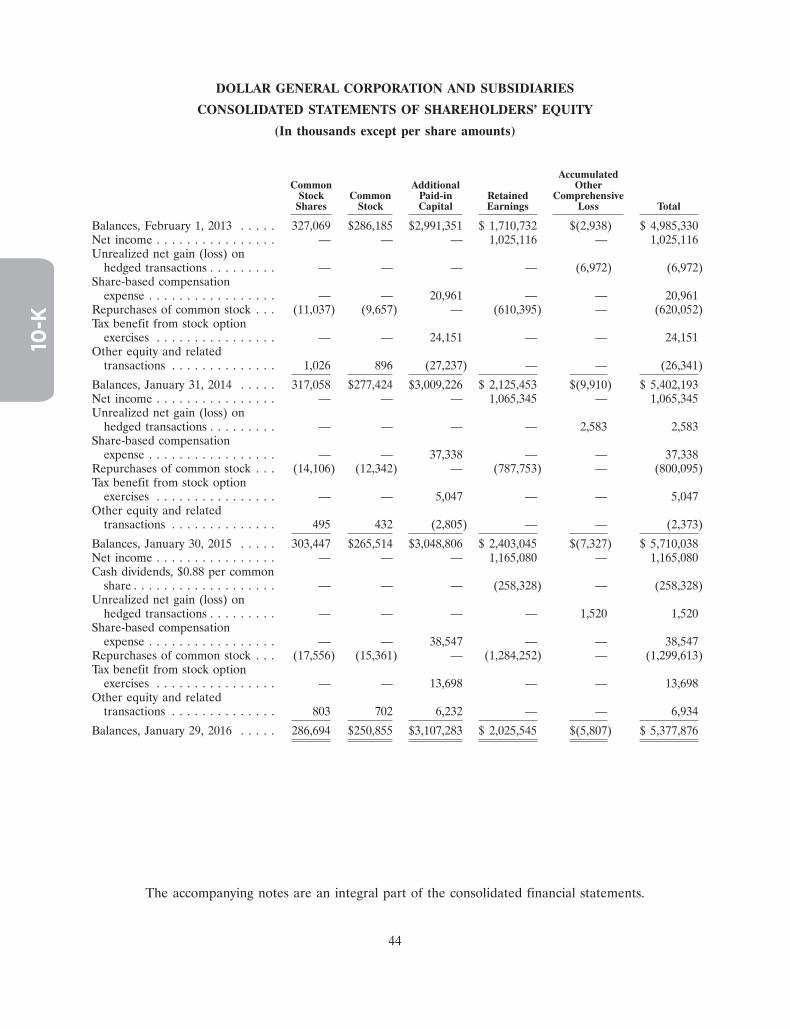
10-K
DOLLAR GENERAL CORPORATION AND SUBSIDIARIES
CONSOLIDATED STATEMENTS OF SHAREHOLDERS’ EQUITY
(In thousands except per share amounts)
AccumulatedCommon Additional Other
Stock Common Paid-in Retained ComprehensiveShares Stock Capital Earnings Loss Total
Balances, February 1, 2013 . . . . . 327,069 $286,185 $2,991,351 $ 1,710,732 $(2,938) $ 4,985,330Net income . . . . . . . . . . . . . . . . — — — 1,025,116 — 1,025,116Unrealized net gain (loss) on
hedged transactions . . . . . . . . . — — — — (6,972) (6,972)Share-based compensation
expense . . . . . . . . . . . . . . . . . — — 20,961 — — 20,961Repurchases of common stock . . . (11,037) (9,657) — (610,395) — (620,052)Tax benefit from stock option
exercises . . . . . . . . . . . . . . . . — — 24,151 — — 24,151Other equity and related
transactions . . . . . . . . . . . . . . 1,026 896 (27,237) — — (26,341)
Balances, January 31, 2014 . . . . . 317,058 $277,424 $3,009,226 $ 2,125,453 $(9,910) $ 5,402,193Net income . . . . . . . . . . . . . . . . — — — 1,065,345 — 1,065,345Unrealized net gain (loss) on
hedged transactions . . . . . . . . . — — — — 2,583 2,583Share-based compensation
expense . . . . . . . . . . . . . . . . . — — 37,338 — — 37,338Repurchases of common stock . . . (14,106) (12,342) — (787,753) — (800,095)Tax benefit from stock option
exercises . . . . . . . . . . . . . . . . — — 5,047 — — 5,047Other equity and related
transactions . . . . . . . . . . . . . . 495 432 (2,805) — — (2,373)
Balances, January 30, 2015 . . . . . 303,447 $265,514 $3,048,806 $ 2,403,045 $(7,327) $ 5,710,038Net income . . . . . . . . . . . . . . . . — — — 1,165,080 — 1,165,080Cash dividends, $0.88 per common
share . . . . . . . . . . . . . . . . . . . — — — (258,328) — (258,328)Unrealized net gain (loss) on
hedged transactions . . . . . . . . . — — — — 1,520 1,520Share-based compensation
expense . . . . . . . . . . . . . . . . . — — 38,547 — — 38,547Repurchases of common stock . . . (17,556) (15,361) — (1,284,252) — (1,299,613)Tax benefit from stock option
exercises . . . . . . . . . . . . . . . . — — 13,698 — — 13,698Other equity and related
transactions . . . . . . . . . . . . . . 803 702 6,232 — — 6,934
Balances, January 29, 2016 . . . . . 286,694 $250,855 $3,107,283 $ 2,025,545 $(5,807) $ 5,377,876
The accompanying notes are an integral part of the consolidated financial statements.
44

10-K
DOLLAR GENERAL CORPORATION AND SUBSIDIARIES
CONSOLIDATED STATEMENTS OF CASH FLOWS
(In thousands)
For the Year Ended
January 29, January 30, January 31,2016 2015 2014
Cash flows from operating activities:Net income . . . . . . . . . . . . . . . . . . . . . . . . . . . . . . . . . . . . . . . . . . $ 1,165,080 $ 1,065,345 $ 1,025,116Adjustments to reconcile net income to net cash from operating
activities:Depreciation and amortization . . . . . . . . . . . . . . . . . . . . . . . . . . . 352,431 342,353 332,837Deferred income taxes . . . . . . . . . . . . . . . . . . . . . . . . . . . . . . . . . 12,126 (17,734) (36,851)Tax benefit of share-based awards . . . . . . . . . . . . . . . . . . . . . . . . . (13,698) (12,147) (30,990)Loss on debt retirement, net . . . . . . . . . . . . . . . . . . . . . . . . . . . . . 326 — 18,871Noncash share-based compensation . . . . . . . . . . . . . . . . . . . . . . . . 38,547 37,338 20,961Other noncash (gains) and losses . . . . . . . . . . . . . . . . . . . . . . . . . . 7,797 8,551 (12,747)Change in operating assets and liabilities:
Merchandise inventories . . . . . . . . . . . . . . . . . . . . . . . . . . . . . . (290,001) (233,559) (144,943)Prepaid expenses and other current assets . . . . . . . . . . . . . . . . . . (24,626) (25,048) (4,947)Accounts payable . . . . . . . . . . . . . . . . . . . . . . . . . . . . . . . . . . . 105,637 97,166 36,942Accrued expenses and other liabilities . . . . . . . . . . . . . . . . . . . . . 44,949 41,635 16,265Income taxes . . . . . . . . . . . . . . . . . . . . . . . . . . . . . . . . . . . . . . (19,675) 12,399 (5,249)Other . . . . . . . . . . . . . . . . . . . . . . . . . . . . . . . . . . . . . . . . . . . (905) (1,555) (2,200)
Net cash provided by (used in) operating activities . . . . . . . . . . . . . . . 1,377,988 1,314,744 1,213,065
Cash flows from investing activities:Purchases of property and equipment . . . . . . . . . . . . . . . . . . . . . . . . (504,806) (373,967) (538,444)Proceeds from sales of property and equipment . . . . . . . . . . . . . . . . . 1,423 2,268 288,466
Net cash provided by (used in) investing activities . . . . . . . . . . . . . . . . (503,383) (371,699) (249,978)
Cash flows from financing activities:Issuance of long-term obligations . . . . . . . . . . . . . . . . . . . . . . . . . . . 499,220 — 2,297,177Repayments of long-term obligations . . . . . . . . . . . . . . . . . . . . . . . . . (502,401) (78,467) (2,119,991)Borrowings under revolving credit facilities . . . . . . . . . . . . . . . . . . . . . 2,034,100 1,023,000 1,172,900Repayments of borrowings under revolving credit facilities . . . . . . . . . . (1,783,100) (1,023,000) (1,303,800)Debt issuance costs . . . . . . . . . . . . . . . . . . . . . . . . . . . . . . . . . . . . . (6,991) — (15,996)Payments for cash flow hedge related to debt issuance . . . . . . . . . . . . . — — (13,217)Repurchases of common stock . . . . . . . . . . . . . . . . . . . . . . . . . . . . . (1,299,613) (800,095) (620,052)Payments of cash dividends . . . . . . . . . . . . . . . . . . . . . . . . . . . . . . . (258,328) — —Other equity and related transactions . . . . . . . . . . . . . . . . . . . . . . . . 6,934 (2,373) (26,341)Tax benefit of share-based awards . . . . . . . . . . . . . . . . . . . . . . . . . . . 13,698 12,147 30,990
Net cash provided by (used in) financing activities . . . . . . . . . . . . . . . . (1,296,481) (868,788) (598,330)
Net increase (decrease) in cash and cash equivalents . . . . . . . . . . . . . . (421,876) 74,257 364,757Cash and cash equivalents, beginning of year . . . . . . . . . . . . . . . . . . . 579,823 505,566 140,809
Cash and cash equivalents, end of year . . . . . . . . . . . . . . . . . . . . . . . $ 157,947 $ 579,823 $ 505,566
Supplemental cash flow information:Cash paid for:
Interest . . . . . . . . . . . . . . . . . . . . . . . . . . . . . . . . . . . . . . . . . . $ 76,354 $ 82,447 $ 73,464Income taxes . . . . . . . . . . . . . . . . . . . . . . . . . . . . . . . . . . . . . . $ 697,357 $ 631,483 $ 646,811
Supplemental schedule of noncash investing and financing activities:Purchases of property and equipment awaiting processing for payment,
included in Accounts payable . . . . . . . . . . . . . . . . . . . . . . . . . . . . $ 32,020 $ 31,586 $ 27,082
The accompanying notes are an integral part of the consolidated financial statements.
45

10-K
DOLLAR GENERAL CORPORATION AND SUBSIDIARIES
NOTES TO CONSOLIDATED FINANCIAL STATEMENTS
1. Basis of presentation and accounting policies
Basis of presentation
These notes contain references to the years 2015, 2014, and 2013, which represent fiscal yearsended January 29, 2016, January 30, 2015, and January 31, 2014, respectively, each of which were52-week accounting periods. The Company’s fiscal year ends on the Friday closest to January 31. Theconsolidated financial statements include all subsidiaries of the Company, except for its not-for-profitsubsidiary which the Company does not control. Intercompany transactions have been eliminated.
The Company sells general merchandise on a retail basis through 12,483 stores (as of January 29,2016) in 43 states covering most of the southern, southwestern, midwestern and eastern United States.The Company has owned distribution centers (‘‘DCs’’) in Scottsville, Kentucky; South Boston, Virginia;Alachua, Florida; Zanesville, Ohio; Jonesville, South Carolina; Marion, Indiana; Bessemer, Alabama;Bethel, Pennsylvania; and San Antonio, Texas, and leased DCs in Ardmore, Oklahoma; Fulton,Missouri; Indianola, Mississippi; and Lebec, California.
Cash and cash equivalents
Cash and cash equivalents include highly liquid investments with insignificant interest rate risk andoriginal maturities of three months or less when purchased. Such investments primarily consist ofmoney market funds, bank deposits, certificates of deposit, and commercial paper. The carryingamounts of these items are a reasonable estimate of their fair value due to the short maturity of theseinvestments.
Payments due from processors for electronic tender transactions classified as cash and cashequivalents totaled approximately $59.5 million and $58.5 million at January 29, 2016 and January 30,2015, respectively.
At January 29, 2016, the Company maintained cash balances to meet a $20 million minimumthreshold set by insurance regulators, as further described below under ‘‘Insurance liabilities.’’
Investments in debt and equity securities
The Company accounts for investments in debt and marketable equity securities asheld-to-maturity, available-for-sale, or trading, depending on their classification. Debt securitiescategorized as held-to-maturity are stated at amortized cost. Debt and equity securities categorized asavailable-for-sale are stated at fair value, with any unrealized gains and losses, net of deferred incometaxes, reported as a component of Accumulated other comprehensive loss. Trading securities are statedat fair value, with changes in fair value recorded as a component of Selling, general and administrative(‘‘SG&A’’) expense. The cost of securities sold is based upon the specific identification method.
Merchandise inventories
Inventories are stated at the lower of cost or market with cost determined using the retail last-in,first-out (‘‘LIFO’’) method as this method results in a better matching of costs and revenues. Under theCompany’s retail inventory method (‘‘RIM’’), the calculation of gross profit and the resulting valuationof inventories at cost are computed by applying a calculated cost-to-retail inventory ratio to the retailvalue of sales at a department level. The use of the RIM will result in valuing inventories at the lowerof cost or market (‘‘LCM’’) if markdowns are currently taken as a reduction of the retail value ofinventories. Costs directly associated with warehousing and distribution are capitalized into inventory.
46

10-K
DOLLAR GENERAL CORPORATION AND SUBSIDIARIES
NOTES TO CONSOLIDATED FINANCIAL STATEMENTS (Continued)
1. Basis of presentation and accounting policies (Continued)
The excess of current cost over LIFO cost was approximately $92.9 million and $95.1 million atJanuary 29, 2016 and January 30, 2015, respectively. Current cost is determined using the RIM on afirst-in, first-out basis. Under the LIFO inventory method, the impacts of rising or falling market pricechanges increase or decrease cost of sales (the LIFO provision or benefit). The Company recorded aLIFO provision (benefit) of $(2.3) million in 2015, $4.2 million in 2014, and $(11.0) million in 2013,which is included in cost of goods sold in the consolidated statements of income.
The Company purchases its merchandise from a wide variety of suppliers. The Company’s largestand second largest suppliers each accounted for approximately 7% of the Company’s purchases in 2015.
Vendor rebates
The Company accounts for all cash consideration received from vendors in accordance withapplicable accounting standards pertaining to such arrangements. Cash consideration received from avendor is generally presumed to be a rebate or an allowance and is accounted for as a reduction ofmerchandise purchase costs as earned. However, certain specific, incremental and otherwise qualifyingSG&A expenses related to the promotion or sale of vendor products may be offset by cashconsideration received from vendors, in accordance with arrangements such as cooperative advertising,when earned for dollar amounts up to but not exceeding actual incremental costs.
Prepaid expenses and other current assets
Prepaid expenses and other current assets include prepaid amounts for rent, maintenance, businesslicenses, advertising, and insurance, and amounts receivable for certain vendor rebates (primarily thoseexpected to be collected in cash) and coupons.
Property and equipment
In 2007, the Company’s property and equipment was recorded at estimated fair values as the resultof a merger transaction. Property and equipment acquired subsequent to the merger has been recordedat cost. The Company records depreciation and amortization on a straight-line basis over the assets’
47
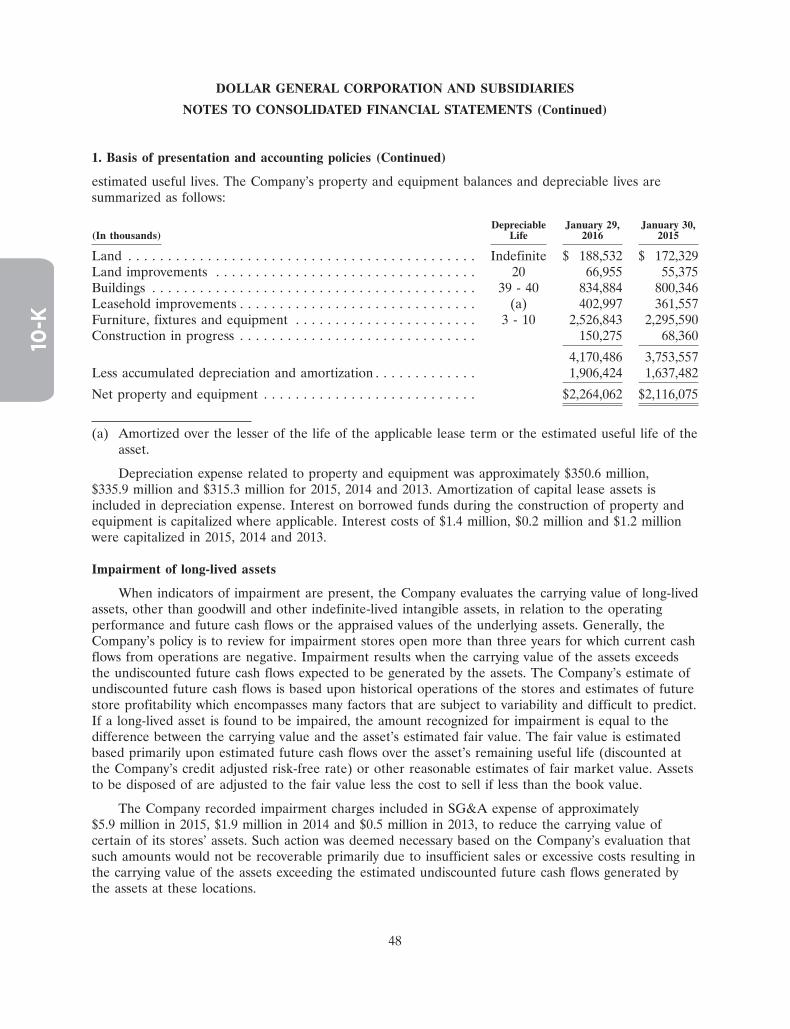
10-K
DOLLAR GENERAL CORPORATION AND SUBSIDIARIES
NOTES TO CONSOLIDATED FINANCIAL STATEMENTS (Continued)
1. Basis of presentation and accounting policies (Continued)
estimated useful lives. The Company’s property and equipment balances and depreciable lives aresummarized as follows:
Depreciable January 29, January 30,(In thousands) Life 2016 2015
Land . . . . . . . . . . . . . . . . . . . . . . . . . . . . . . . . . . . . . . . . . . . . Indefinite $ 188,532 $ 172,329Land improvements . . . . . . . . . . . . . . . . . . . . . . . . . . . . . . . . . 20 66,955 55,375Buildings . . . . . . . . . . . . . . . . . . . . . . . . . . . . . . . . . . . . . . . . . 39 - 40 834,884 800,346Leasehold improvements . . . . . . . . . . . . . . . . . . . . . . . . . . . . . . (a) 402,997 361,557Furniture, fixtures and equipment . . . . . . . . . . . . . . . . . . . . . . . 3 - 10 2,526,843 2,295,590Construction in progress . . . . . . . . . . . . . . . . . . . . . . . . . . . . . . 150,275 68,360
4,170,486 3,753,557Less accumulated depreciation and amortization . . . . . . . . . . . . . 1,906,424 1,637,482
Net property and equipment . . . . . . . . . . . . . . . . . . . . . . . . . . . $2,264,062 $2,116,075
(a) Amortized over the lesser of the life of the applicable lease term or the estimated useful life of theasset.
Depreciation expense related to property and equipment was approximately $350.6 million,$335.9 million and $315.3 million for 2015, 2014 and 2013. Amortization of capital lease assets isincluded in depreciation expense. Interest on borrowed funds during the construction of property andequipment is capitalized where applicable. Interest costs of $1.4 million, $0.2 million and $1.2 millionwere capitalized in 2015, 2014 and 2013.
Impairment of long-lived assets
When indicators of impairment are present, the Company evaluates the carrying value of long-livedassets, other than goodwill and other indefinite-lived intangible assets, in relation to the operatingperformance and future cash flows or the appraised values of the underlying assets. Generally, theCompany’s policy is to review for impairment stores open more than three years for which current cashflows from operations are negative. Impairment results when the carrying value of the assets exceedsthe undiscounted future cash flows expected to be generated by the assets. The Company’s estimate ofundiscounted future cash flows is based upon historical operations of the stores and estimates of futurestore profitability which encompasses many factors that are subject to variability and difficult to predict.If a long-lived asset is found to be impaired, the amount recognized for impairment is equal to thedifference between the carrying value and the asset’s estimated fair value. The fair value is estimatedbased primarily upon estimated future cash flows over the asset’s remaining useful life (discounted atthe Company’s credit adjusted risk-free rate) or other reasonable estimates of fair market value. Assetsto be disposed of are adjusted to the fair value less the cost to sell if less than the book value.
The Company recorded impairment charges included in SG&A expense of approximately$5.9 million in 2015, $1.9 million in 2014 and $0.5 million in 2013, to reduce the carrying value ofcertain of its stores’ assets. Such action was deemed necessary based on the Company’s evaluation thatsuch amounts would not be recoverable primarily due to insufficient sales or excessive costs resulting inthe carrying value of the assets exceeding the estimated undiscounted future cash flows generated bythe assets at these locations.
48

10-K
DOLLAR GENERAL CORPORATION AND SUBSIDIARIES
NOTES TO CONSOLIDATED FINANCIAL STATEMENTS (Continued)
1. Basis of presentation and accounting policies (Continued)
Goodwill and other intangible assets
The Company amortizes intangible assets over their estimated useful lives unless such lives aredeemed indefinite. Goodwill and intangible assets with indefinite lives are tested for impairment annuallyor more frequently if indicators of impairment are present. Other intangible assets are tested forimpairment if indicators of impairment are present. Impaired assets are written down to fair value asrequired. No impairment of intangible assets has been identified during any of the periods presented.
In accordance with accounting standards for goodwill and indefinite-lived intangible assets, anentity has the option first to assess qualitative factors to determine whether events and circumstancesindicate that it is more likely than not that goodwill or an indefinite-lived intangible asset is impaired.If after such assessment an entity concludes that the asset is not impaired, then the entity is notrequired to take further action. However, if an entity concludes otherwise, then it is required todetermine the fair value of the asset using a quantitative impairment test, and if impaired, theassociated assets must be written down to fair value as described in further detail below.
The quantitative goodwill impairment test is a two-step process that would require management tomake judgments in determining what assumptions to use in the calculation. The first step of theprocess consists of estimating the fair value of an entity’s reporting units based on valuation techniques(including a discounted cash flow model using revenue and profit forecasts) and comparing thatestimated fair value with the recorded carrying value, which includes goodwill. If the estimated fairvalue is less than the carrying value, a second step is performed to compute the amount of theimpairment by determining an ‘‘implied fair value’’ of goodwill. The determination of the implied fairvalue of goodwill would require the entity to allocate the estimated fair value of its reporting unit to itsassets and liabilities. Any unallocated fair value would represent the implied fair value of goodwill,which would be compared to its corresponding carrying value.
The quantitative impairment test for intangible assets compares the fair value of the intangibleasset with its carrying amount. If the carrying amount of an intangible asset exceeds its fair value, animpairment loss is recognized in an amount equal to that excess.
Other assets
Noncurrent Other assets consist primarily of qualifying prepaid expenses for maintenance, beerand wine licenses, and utility, security and other deposits.
Accrued expenses and other liabilities
Accrued expenses and other consist of the following:
January 29, January 30,(In thousands) 2016 2015
Compensation and benefits . . . . . . . . . . . . . . . . . . . . . . . . . $111,191 $ 78,645Insurance . . . . . . . . . . . . . . . . . . . . . . . . . . . . . . . . . . . . . . 82,182 81,944Taxes (other than taxes on income) . . . . . . . . . . . . . . . . . . . 136,762 124,893Other . . . . . . . . . . . . . . . . . . . . . . . . . . . . . . . . . . . . . . . . . 136,987 128,278
$467,122 $413,760
Included in other accrued expenses are liabilities such as interest expense, freight expense, andutilities.
49
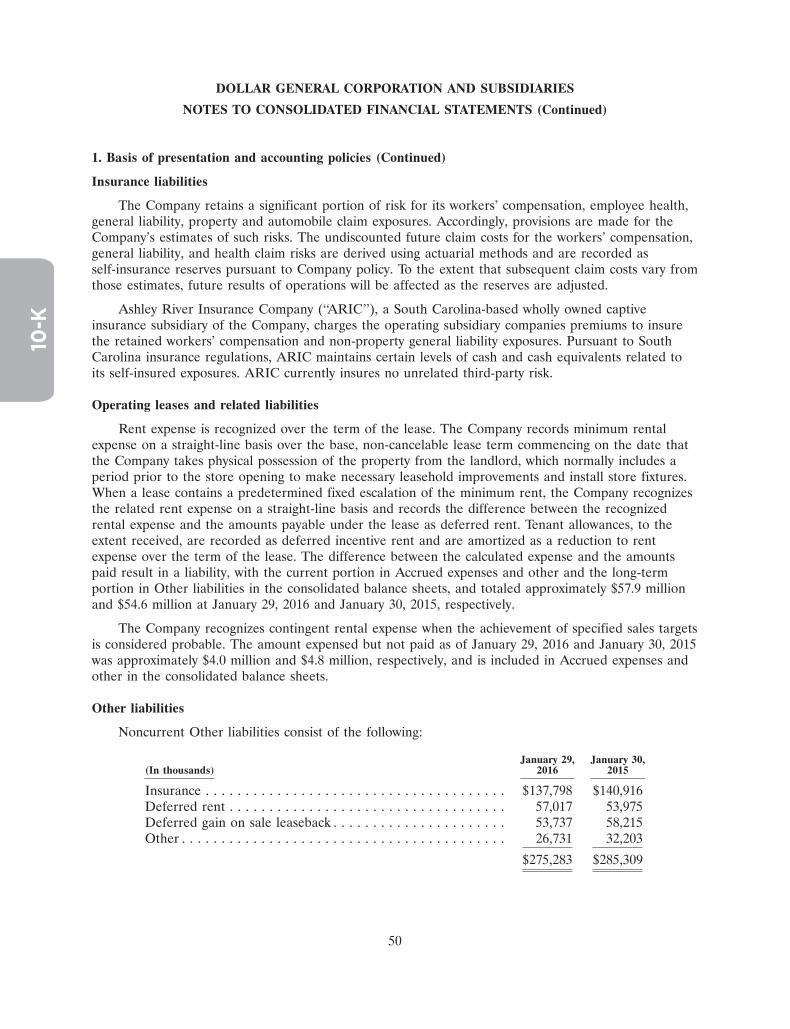
10-K
DOLLAR GENERAL CORPORATION AND SUBSIDIARIES
NOTES TO CONSOLIDATED FINANCIAL STATEMENTS (Continued)
1. Basis of presentation and accounting policies (Continued)
Insurance liabilities
The Company retains a significant portion of risk for its workers’ compensation, employee health,general liability, property and automobile claim exposures. Accordingly, provisions are made for theCompany’s estimates of such risks. The undiscounted future claim costs for the workers’ compensation,general liability, and health claim risks are derived using actuarial methods and are recorded asself-insurance reserves pursuant to Company policy. To the extent that subsequent claim costs vary fromthose estimates, future results of operations will be affected as the reserves are adjusted.
Ashley River Insurance Company (‘‘ARIC’’), a South Carolina-based wholly owned captiveinsurance subsidiary of the Company, charges the operating subsidiary companies premiums to insurethe retained workers’ compensation and non-property general liability exposures. Pursuant to SouthCarolina insurance regulations, ARIC maintains certain levels of cash and cash equivalents related toits self-insured exposures. ARIC currently insures no unrelated third-party risk.
Operating leases and related liabilities
Rent expense is recognized over the term of the lease. The Company records minimum rentalexpense on a straight-line basis over the base, non-cancelable lease term commencing on the date thatthe Company takes physical possession of the property from the landlord, which normally includes aperiod prior to the store opening to make necessary leasehold improvements and install store fixtures.When a lease contains a predetermined fixed escalation of the minimum rent, the Company recognizesthe related rent expense on a straight-line basis and records the difference between the recognizedrental expense and the amounts payable under the lease as deferred rent. Tenant allowances, to theextent received, are recorded as deferred incentive rent and are amortized as a reduction to rentexpense over the term of the lease. The difference between the calculated expense and the amountspaid result in a liability, with the current portion in Accrued expenses and other and the long-termportion in Other liabilities in the consolidated balance sheets, and totaled approximately $57.9 millionand $54.6 million at January 29, 2016 and January 30, 2015, respectively.
The Company recognizes contingent rental expense when the achievement of specified sales targetsis considered probable. The amount expensed but not paid as of January 29, 2016 and January 30, 2015was approximately $4.0 million and $4.8 million, respectively, and is included in Accrued expenses andother in the consolidated balance sheets.
Other liabilities
Noncurrent Other liabilities consist of the following:
January 29, January 30,(In thousands) 2016 2015
Insurance . . . . . . . . . . . . . . . . . . . . . . . . . . . . . . . . . . . . . . $137,798 $140,916Deferred rent . . . . . . . . . . . . . . . . . . . . . . . . . . . . . . . . . . . 57,017 53,975Deferred gain on sale leaseback . . . . . . . . . . . . . . . . . . . . . . 53,737 58,215Other . . . . . . . . . . . . . . . . . . . . . . . . . . . . . . . . . . . . . . . . . 26,731 32,203
$275,283 $285,309
50

10-K
DOLLAR GENERAL CORPORATION AND SUBSIDIARIES
NOTES TO CONSOLIDATED FINANCIAL STATEMENTS (Continued)
1. Basis of presentation and accounting policies (Continued)
Fair value accounting
The Company utilizes accounting standards for fair value, which include the definition of fairvalue, the framework for measuring fair value, and disclosures about fair value measurements. Fairvalue is a market-based measurement, not an entity-specific measurement. Therefore, a fair valuemeasurement should be determined based on the assumptions that market participants would use inpricing the asset or liability. As a basis for considering market participant assumptions in fair valuemeasurements, fair value accounting standards establish a fair value hierarchy that distinguishesbetween market participant assumptions based on market data obtained from sources independent ofthe reporting entity (observable inputs that are classified within Levels 1 and 2 of the hierarchy) andthe reporting entity’s own assumptions about market participant assumptions (unobservable inputsclassified within Level 3 of the hierarchy).
Level 1 inputs utilize quoted prices (unadjusted) in active markets for identical assets or liabilitiesthat the Company has the ability to access. Level 2 inputs are inputs other than quoted prices includedin Level 1 that are directly or indirectly observable for the asset or liability. Level 2 inputs may includequoted prices for similar assets and liabilities in active markets, as well as inputs that are observable forthe asset or liability (other than quoted prices), such as interest rates, foreign exchange rates, and yieldcurves that are observable at commonly quoted intervals. Level 3 inputs are unobservable inputs for theasset or liability, which are based on an entity’s own assumptions, as there is little, if any, observablemarket activity. In instances where the fair value measurement is based on inputs from different levelsof the fair value hierarchy, the level in the fair value hierarchy within which the entire fair valuemeasurement falls is based on the lowest level input that is significant to the fair value measurement inits entirety. The Company’s assessment of the significance of a particular input to the fair valuemeasurement in its entirety requires judgment and considers factors specific to the asset or liability.
The valuation of derivative financial instruments is determined using widely accepted valuationtechniques, including discounted cash flow analysis on the expected cash flows of each derivative. Thisanalysis takes into account the contractual terms of the derivatives, including the period to maturity,and uses observable market-based inputs, including interest rate curves. The fair values of interest rateswaps are determined using the market standard methodology of netting the discounted future fixedcash payments (or receipts) and the discounted expected variable cash receipts (or payments). Thevariable cash receipts (or payments) are based on an expectation of future interest rates (forwardcurves) derived from observable market interest rate curves.
The Company incorporates credit valuation adjustments to appropriately reflect both its ownnonperformance risk and the respective counterparty’s nonperformance risk in the fair valuemeasurements. The Company considers the impact of netting and any applicable credit enhancements,such as collateral postings, thresholds, mutual puts, and guarantees, to adjust the fair value ofoutstanding derivative contracts for the effect of nonperformance risk. In connection with accountingstandards for fair value measurement, the Company has made an accounting policy election to measurethe credit risk of outstanding derivative financial instruments that are subject to master nettingagreements on a net basis by counterparty portfolio.
Derivative financial instruments
The Company accounts for derivative financial instruments in accordance with applicableaccounting standards for such instruments and hedging activities, which require that all derivatives are
51

10-K
DOLLAR GENERAL CORPORATION AND SUBSIDIARIES
NOTES TO CONSOLIDATED FINANCIAL STATEMENTS (Continued)
1. Basis of presentation and accounting policies (Continued)
recorded on the balance sheet at fair value. The accounting for changes in the fair value of derivativesdepends on the intended use of the derivative, whether the Company has elected to designate aderivative in a hedging relationship and apply hedge accounting and whether the hedging relationshiphas satisfied the criteria necessary to apply hedge accounting.
Derivatives designated and qualifying as a hedge of the exposure to changes in the fair value of anasset, liability, or firm commitment attributable to a particular risk, such as interest rate risk, areconsidered fair value hedges. Derivatives designated and qualifying as a hedge of the exposure tovariability in expected future cash flows, or other types of forecasted transactions, are considered cashflow hedges. Derivatives may also be designated as hedges of the foreign currency exposure of a netinvestment in a foreign operation. Hedge accounting generally provides for the matching of the timingof gain or loss recognition on the hedging instrument with the recognition of the changes in the fairvalue of the hedged asset or liability that are attributable to the hedged risk in a fair value hedge orthe earnings effect of the hedged forecasted transactions in a cash flow hedge. The Company may enterinto derivative contracts that are intended to economically hedge a certain portion of its risk, eventhough hedge accounting does not apply or the Company elects not to apply the hedge accountingstandards.
Revenue and gain recognition
The Company recognizes retail sales in its stores at the time the customer takes possession ofmerchandise. All sales are net of discounts and estimated returns and are presented net of taxesassessed by governmental authorities that are imposed concurrent with those sales. The liability forretail merchandise returns is based on the Company’s prior experience. The Company records gaincontingencies when realized.
The Company recognizes gift card sales revenue at the time of redemption. The liability for thegift cards is established for the cash value at the time of purchase. The liability for outstanding giftcards was approximately $2.8 million and $2.5 million at January 29, 2016 and January 30, 2015,respectively, and is recorded in Accrued expenses and other liabilities. Estimated breakage revenue, apercentage of gift cards that will never be redeemed based on historical redemption rates, is recognizedover time in proportion to actual gift card redemptions. The Company recorded breakage revenue of$0.6 million and $2.4 million in 2015 and 2014, respectively.
Advertising costs
Advertising costs are expensed upon performance, ‘‘first showing’’ or distribution, and are reflectedin SG&A expenses net of earned cooperative advertising amounts provided by vendors which arespecific, incremental and otherwise qualifying expenses related to the promotion or sale of vendorproducts for dollar amounts up to but not exceeding actual incremental costs. Advertising costs were$89.3 million, $77.3 million and $70.5 million in 2015, 2014 and 2013, respectively. These costs primarilyinclude promotional circulars, targeted circulars supporting new stores, television and radio advertising,in-store signage, and costs associated with the sponsorships of certain automobile racing activities.Vendor funding for cooperative advertising offset reported expenses by $36.7 million, $35.0 million and$31.9 million in 2015, 2014 and 2013, respectively.
52

10-K
DOLLAR GENERAL CORPORATION AND SUBSIDIARIES
NOTES TO CONSOLIDATED FINANCIAL STATEMENTS (Continued)
1. Basis of presentation and accounting policies (Continued)
Share-based payments
The Company recognizes compensation expense for share-based compensation based on the fairvalue of the awards on the grant date. Forfeitures are estimated at the time of valuation and reduceexpense ratably over the vesting period. This estimate may be adjusted periodically based on the extentto which actual forfeitures differ, or are expected to differ, from the prior estimate. The forfeiture rateis the estimated percentage of share-based awards granted that are expected to be forfeited or canceledbefore becoming fully vested. The Company bases this estimate on historical experience or estimates offuture trends, as applicable. An increase in the forfeiture rate will decrease compensation expense.
The fair value of each option grant is separately estimated and amortized into compensationexpense on a straight-line basis between the applicable grant date and each vesting date. The Companyhas estimated the fair value of all stock option awards as of the grant date by applying the Black-Scholes-Merton option pricing valuation model. The application of this valuation model involvesassumptions that are judgmental and highly sensitive in the determination of compensation expense.
The Company calculates compensation expense for restricted stock, share units and similar awardsas the difference between the market price of the underlying stock or similar award on the grant dateand the purchase price, if any. Such expense is recognized on a straight-line basis for graded awards oran accelerated basis for performance awards over the period in which the recipient earns the awards.
Store pre-opening costs
Pre-opening costs related to new store openings and the related construction periods are expensedas incurred.
Income taxes
Under the accounting standards for income taxes, the asset and liability method is used forcomputing the future income tax consequences of events that have been recognized in the Company’sconsolidated financial statements or income tax returns. Deferred income tax expense or benefit is thenet change during the year in the Company’s deferred income tax assets and liabilities.
The Company includes income tax related interest and penalties as a component of the provisionfor income tax expense.
Income tax reserves are determined using a methodology which requires companies to assess eachincome tax position taken using a two-step process. A determination is first made as to whether it ismore likely than not that the position will be sustained, based upon the technical merits, uponexamination by the taxing authorities. If the tax position is expected to meet the more likely than notcriteria, the benefit recorded for the tax position equals the largest amount that is greater than 50%likely to be realized upon ultimate settlement of the respective tax position. Uncertain tax positionsrequire determinations and estimated liabilities to be made based on provisions of the tax law whichmay be subject to change or varying interpretation. If the Company’s determinations and estimatesprove to be inaccurate, the resulting adjustments could be material to the Company’s future financialresults.
53

10-K
DOLLAR GENERAL CORPORATION AND SUBSIDIARIES
NOTES TO CONSOLIDATED FINANCIAL STATEMENTS (Continued)
1. Basis of presentation and accounting policies (Continued)
Management estimates
The preparation of financial statements and related disclosures in conformity with accountingprinciples generally accepted in the United States requires management to make estimates andassumptions that affect the reported amounts of assets and liabilities and disclosure of contingent assetsand liabilities at the date of the consolidated financial statements and the reported amounts ofrevenues and expenses during the reporting periods. Actual results could differ from those estimates.
Accounting standards
In May 2014, the Financial Accounting Standards Board (‘‘FASB’’) issued comprehensive newaccounting standards related to the recognition of revenue, which specified an effective date for annualreporting periods beginning after December 15, 2016, with early adoption not permitted. In August2015, the FASB deferred the effective date to annual reporting periods beginning after December 15,2017, with earlier adoption permitted only for annual reporting periods beginning after December 15,2016. The new guidance allows for companies to use either a full retrospective or a modifiedretrospective approach in the adoption of this guidance. The Company is currently evaluating thesetransition approaches, as well as the potential timing of adoption and the effect of adoption on itsconsolidated financial statements.
In April 2015, the FASB issued new accounting guidance related to the presentation of debtissuance costs and requires such costs to be presented as a deduction from the corresponding debtliability, consistent with the presentation of debt discounts and/or premiums. This guidance is effectivefor fiscal years beginning after December 15, 2015, and interim periods within those fiscal years, withearly adoption permitted. The guidance must be applied retrospectively to all periods presented withinthe financial statements. The Company adopted this guidance in the third quarter of 2015. As a result,the presentation of $15.5 million of debt issuance costs (net of accumulated amortization) previouslyclassified as Other assets, net are reflected in Long-term obligations on the consolidated balance sheetas of January 30, 2015.
In November 2015, the FASB issued new accounting guidance which will require companies toclassify all deferred tax assets and liabilities as noncurrent on the balance sheet instead of separatingthem into current and noncurrent amounts. This guidance is effective for fiscal years beginning afterDecember 15, 2016, and interim periods within those fiscal years, with early adoption permitted. Thisguidance may be adopted on a prospective or retrospective basis. The Company adopted this guidanceretrospectively in the fourth quarter of 2015. As a result, the presentation of $25.3 million of deferredincome taxes previously classified as a current liability are reflected in noncurrent deferred incometaxes on the consolidated balance sheet as of January 30, 2015.
In February 2016, the FASB issued new guidance related to lease accounting. This guidancerequires a dual approach for lessee accounting under which a lessee will account for leases as financeleases or operating leases. Both finance leases and operating leases will result in the lessee recognizinga right-of-use asset and a corresponding lease liability on its balance sheet, with differing methodologyfor income statement recognition. This guidance is effective for public business entities for fiscal years,and interim periods within those years, beginning after December 15, 2018, and early adoption ispermitted. A modified retrospective approach is required for all leases existing or entered into after thebeginning of the earliest comparative period in the consolidated financial statements. The Company iscurrently assessing the impact that adoption of this guidance will have on its consolidated financial
54

10-K
DOLLAR GENERAL CORPORATION AND SUBSIDIARIES
NOTES TO CONSOLIDATED FINANCIAL STATEMENTS (Continued)
1. Basis of presentation and accounting policies (Continued)
statements and is anticipating a material impact because the Company is party to a significant numberof lease contracts.
Reclassifications
Certain financial disclosures relating to prior periods have been reclassified to conform to thecurrent year presentation where applicable.
2. Goodwill and other intangible assets
As of January 29, 2016 and January 30, 2015, the balances of the Company’s intangible assets wereas follows:
As of January 29, 2016
Remaining Accumulated(In thousands) Life Amount Amortization Net
Goodwill . . . . . . . . . . . . . . . . . . . . . . . . . . . . . . Indefinite $4,338,589 $ — $4,338,589
Other intangible assets:Leasehold interests . . . . . . . . . . . . . . . . . . . . . 1 to 7 years $ 4,379 $3,085 $ 1,294Trade names and trademarks . . . . . . . . . . . . . . Indefinite 1,199,700 — 1,199,700
$1,204,079 $3,085 $1,200,994
As of January 30, 2015
Remaining Accumulated(In thousands) Life Amount Amortization Net
Goodwill . . . . . . . . . . . . . . . . . . . . . . . . . . . . . . Indefinite $4,338,589 $ — $4,338,589
Other intangible assets:Leasehold interests . . . . . . . . . . . . . . . . . . . . . 1 to 8 years $ 18,218 $16,048 $ 2,170Trade names and trademarks . . . . . . . . . . . . . . Indefinite 1,199,700 — 1,199,700
$1,217,918 $16,048 $1,201,870
The Company recorded amortization expense related to amortizable intangible assets for 2015,2014 and 2013 of $0.9 million, $5.8 million and $11.9 million, respectively, all of which is included inrent expense. Expected future cash flows associated with the Company’s intangible assets are notexpected to be materially affected by the Company’s intent or ability to renew or extend thearrangements. The Company’s goodwill balance is not expected to be deductible for tax purposes.
For intangible assets subject to amortization, the estimated aggregate amortization expense foreach of the five succeeding fiscal years is as follows: 2016—$0.3 million, 2017—$0.2 million, 2018—$0.2 million and 2019—$0.2 million and 2020—$0.1 million.
55

10-K
DOLLAR GENERAL CORPORATION AND SUBSIDIARIES
NOTES TO CONSOLIDATED FINANCIAL STATEMENTS (Continued)
3. Earnings per share
Earnings per share is computed as follows (in thousands except per share data):
2015
WeightedNet Average Per Share
Income Shares Amount
Basic earnings per share . . . . . . . . . . . . . . . . . . . . $1,165,080 294,330 $3.96Effect of dilutive share-based awards . . . . . . . . . . . 881
Diluted earnings per share . . . . . . . . . . . . . . . . . . $1,165,080 295,211 $3.95
2014
WeightedNet Average Per Share
Income Shares Amount
Basic earnings per share . . . . . . . . . . . . . . . . . . . . $1,065,345 304,633 $3.50Effect of dilutive share-based awards . . . . . . . . . . . 1,048
Diluted earnings per share . . . . . . . . . . . . . . . . . . $1,065,345 305,681 $3.49
2013
WeightedNet Average Per Share
Income Shares Amount
Basic earnings per share . . . . . . . . . . . . . . . . . . . . $1,025,116 322,886 $3.17Effect of dilutive share-based awards . . . . . . . . . . . 968
Diluted earnings per share . . . . . . . . . . . . . . . . . . $1,025,116 323,854 $3.17
Basic earnings per share was computed by dividing net income by the weighted average number ofshares of common stock outstanding during the year. Diluted earnings per share was determined basedon the dilutive effect of share-based awards using the treasury stock method.
Options to purchase shares of common stock that were outstanding at the end of the respectiveperiods, but were not included in the computation of diluted earnings per share because the effect ofexercising such options would be antidilutive, were 1.3 million, 1.2 million, and 1.2 million in 2015, 2014and 2013, respectively.
56

10-K
DOLLAR GENERAL CORPORATION AND SUBSIDIARIES
NOTES TO CONSOLIDATED FINANCIAL STATEMENTS (Continued)
4. Income taxes
The provision (benefit) for income taxes consists of the following:
(In thousands) 2015 2014 2013
Current:Federal . . . . . . . . . . . . . . . . . . . . . . . . . . . . . . . $590,120 $543,089 $530,728Foreign . . . . . . . . . . . . . . . . . . . . . . . . . . . . . . . 1,678 1,245 1,324State . . . . . . . . . . . . . . . . . . . . . . . . . . . . . . . . 84,021 81,816 101,174
675,819 626,150 633,226
Deferred:Federal . . . . . . . . . . . . . . . . . . . . . . . . . . . . . . . 6,410 (7,697) (16,132)State . . . . . . . . . . . . . . . . . . . . . . . . . . . . . . . . 5,715 (2,937) (13,880)
12,125 (10,634) (30,012)
$687,944 $615,516 $603,214
A reconciliation between actual income taxes and amounts computed by applying the federalstatutory rate to income before income taxes is summarized as follows:
(Dollars in thousands) 2015 2014 2013
U.S. federal statutory rate on earnings beforeincome taxes . . . . . . . . . . . . . . . . . . . . . . . . . $648,558 35.0% $588,303 35.0% $569,916 35.0%
State income taxes, net of federal income taxbenefit . . . . . . . . . . . . . . . . . . . . . . . . . . . . . . 59,700 3.2 49,819 3.0 56,822 3.5
Jobs credits, net of federal income taxes . . . . . . . (21,366) (1.2) (18,961) (1.1) (19,348) (1.2)Increase (decrease) in valuation allowances . . . . . (1,371) (0.1) 1,453 0.1 (437) —Decrease in income tax reserves . . . . . . . . . . . . . (2,037) (0.1) (6,449) (0.4) (6,391) (0.4)Other, net . . . . . . . . . . . . . . . . . . . . . . . . . . . . . 4,460 0.3 1,351 — 2,652 0.1
$687,944 37.1% $615,516 36.6% $603,214 37.0%
The 2015 effective tax rate was an expense of 37.1%. This expense was greater than the federalstatutory tax rate of 35% due primarily to the inclusion of state income taxes in the total effective taxrate. The 2015 effective income tax rate increased from 2014 due principally to federal and statereserve releases in 2014 that did not reoccur, to the same extent, in 2015.
The 2014 effective tax rate was an expense of 36.6%. This expense was greater than the federalstatutory tax rate of 35% due primarily to the inclusion of state income taxes in the total effective taxrate. The 2014 effective income tax rate decreased from 2013 due principally to the favorable resolutionof state income tax examinations and a reduction in other state income tax reserve increases.
The 2013 effective tax rate was an expense of 37.0%. This expense was greater than the federalstatutory tax rate of 35% due primarily to the inclusion of state income taxes in the total effective taxrate.
57

10-K
DOLLAR GENERAL CORPORATION AND SUBSIDIARIES
NOTES TO CONSOLIDATED FINANCIAL STATEMENTS (Continued)
4. Income taxes (Continued)
Deferred taxes reflect the effects of temporary differences between carrying amounts of assets andliabilities for financial reporting purposes and the amounts used for income tax purposes. Significantcomponents of the Company’s deferred tax assets and liabilities are as follows:
January 29, January 30,(In thousands) 2016 2015
Deferred tax assets:Deferred compensation expense . . . . . . . . . . . . . . . . . . . . . . . . . . . . . . . . . $ 8,200 $ 8,842Accrued expenses . . . . . . . . . . . . . . . . . . . . . . . . . . . . . . . . . . . . . . . . . . . 8,139 5,146Accrued rent . . . . . . . . . . . . . . . . . . . . . . . . . . . . . . . . . . . . . . . . . . . . . . . 20,793 19,360Accrued insurance . . . . . . . . . . . . . . . . . . . . . . . . . . . . . . . . . . . . . . . . . . . 72,676 76,197Accrued incentive compensation . . . . . . . . . . . . . . . . . . . . . . . . . . . . . . . . . 19,902 14,866Share based compensation . . . . . . . . . . . . . . . . . . . . . . . . . . . . . . . . . . . . . 17,988 17,623Interest rate hedges . . . . . . . . . . . . . . . . . . . . . . . . . . . . . . . . . . . . . . . . . . 3,702 4,318Tax benefit of income tax and interest reserves related to uncertain tax
positions . . . . . . . . . . . . . . . . . . . . . . . . . . . . . . . . . . . . . . . . . . . . . . . . 1,371 1,502Deferred gain on sale-leaseback . . . . . . . . . . . . . . . . . . . . . . . . . . . . . . . . . 22,637 24,385Other . . . . . . . . . . . . . . . . . . . . . . . . . . . . . . . . . . . . . . . . . . . . . . . . . . . . 9,440 3,550State tax credit carry forwards, net of federal tax . . . . . . . . . . . . . . . . . . . . . 10,711 11,039
195,559 186,828Less valuation allowances . . . . . . . . . . . . . . . . . . . . . . . . . . . . . . . . . . . . . . . (1,474) (2,845)
Total deferred tax assets . . . . . . . . . . . . . . . . . . . . . . . . . . . . . . . . . . . . . . . . 194,085 183,983
Deferred tax liabilities:Property and equipment . . . . . . . . . . . . . . . . . . . . . . . . . . . . . . . . . . . . . . . (320,619) (302,531)Inventories . . . . . . . . . . . . . . . . . . . . . . . . . . . . . . . . . . . . . . . . . . . . . . . . (72,456) (73,188)Trademarks . . . . . . . . . . . . . . . . . . . . . . . . . . . . . . . . . . . . . . . . . . . . . . . . (433,548) (433,328)Other . . . . . . . . . . . . . . . . . . . . . . . . . . . . . . . . . . . . . . . . . . . . . . . . . . . . (7,417) (1,794)
Total deferred tax liabilities . . . . . . . . . . . . . . . . . . . . . . . . . . . . . . . . . . . . . . (834,040) (810,841)
Net deferred tax liabilities . . . . . . . . . . . . . . . . . . . . . . . . . . . . . . . . . . . . . . . $(639,955) $(626,858)
Deferred tax assets (liabilities) at January 30, 2015 include the reclassification of current deferredtax assets and liabilities to noncurrent. See Note 1 for additional information.
The Company has state tax credit carry forwards of approximately $16.5 million that will expirebeginning in 2021 through 2024.
A valuation allowance has been provided for state tax credit carry forwards. The 2015 decrease of$1.4 million was recorded as a reduction in income tax expense. The 2014 increase of $1.5 million and2013 decrease of $0.4 million were recorded as an increase and a reduction in income tax expense,respectively. Based upon expected future income, management believes that it is more likely than notthat the results of operations will generate sufficient taxable income to realize the deferred tax assetsafter giving consideration to the valuation allowance.
The Company’s 2010 and earlier tax years are not open for further examination by the InternalRevenue Service (‘‘IRS’’). Due to the filing of an amended federal income tax return for the 2011 tax
58

10-K
DOLLAR GENERAL CORPORATION AND SUBSIDIARIES
NOTES TO CONSOLIDATED FINANCIAL STATEMENTS (Continued)
4. Income taxes (Continued)
year, the IRS may, to a limited extent, examine the Company’s 2011 income tax filings. The IRS, at itsdiscretion, may also choose to examine the Company’s 2012 through 2014 fiscal year income tax filings.The Company has various state income tax examinations that are currently in progress. Generally, theCompany’s 2011 and later tax years remain open for examination by the various state taxing authorities.
As of January 29, 2016, accruals for uncertain tax benefits, interest expense related to income taxesand potential income tax penalties were $7.0 million, $0.9 million and $0.8 million, respectively, for atotal of $8.7 million. This total amount is reflected in noncurrent Other liabilities in the consolidatedbalance sheet.
As of January 30, 2015, accruals for uncertain tax benefits, interest expense related to income taxesand potential income tax penalties were $9.3 million, $1.0 million and $0.4 million, respectively, for atotal of $10.7 million. This total amount is reflected in noncurrent Other liabilities in the consolidatedbalance sheet.
The Company believes that it is reasonably possible that the reserve for uncertain tax positionsmay be reduced by approximately $2.6 million in the coming twelve months principally as a result ofthe effective settlement of outstanding issues. Also, as of January 29, 2016, approximately $7.0 millionof the uncertain tax positions would impact the Company’s effective income tax rate if the Companywere to recognize the tax benefit for these positions.
The amounts associated with uncertain tax positions included in income tax expense consists of thefollowing:
(In thousands) 2015 2014 2013
Income tax expense (benefit) . . . . . . . . . . . . . . . . . . . . $(2,379) $(9,497) $(3,915)Income tax related interest expense (benefit) . . . . . . . . (23) (1,445) 590Income tax related penalty expense (benefit) . . . . . . . . 373 51 30
A reconciliation of the uncertain income tax positions from February 1, 2013 through January 29,2016 is as follows:
(In thousands) 2015 2014 2013
Beginning balance . . . . . . . . . . . . . . . . . . . . . . . . . . . $ 9,343 $19,583 $22,237Increases—tax positions taken in the current year . . . . 214 198 3,484Increases—tax positions taken in prior years . . . . . . . . 17 62 3,000Decreases—tax positions taken in prior years . . . . . . . . (106) (8,636) (608)Statute expirations . . . . . . . . . . . . . . . . . . . . . . . . . . . (2,504) (1,121) (7,622)Settlements . . . . . . . . . . . . . . . . . . . . . . . . . . . . . . . . — (743) (908)
Ending balance . . . . . . . . . . . . . . . . . . . . . . . . . . . . . $ 6,964 $ 9,343 $19,583
59

10-K
DOLLAR GENERAL CORPORATION AND SUBSIDIARIES
NOTES TO CONSOLIDATED FINANCIAL STATEMENTS (Continued)
5. Current and long-term obligations
Current and long-term obligations consist of the following:
January 29, January 30,(In thousands) 2016 2015
Senior unsecured credit facilitiesTerm Facility . . . . . . . . . . . . . . . . . . . . . . . . . . . . . . . . $ 425,000 $ 925,000Revolving Facility . . . . . . . . . . . . . . . . . . . . . . . . . . . . . 251,000 —
4.125% Senior Notes due July 15, 2017 . . . . . . . . . . . . . . . 500,000 500,0001.875% Senior Notes due April 15, 2018 (net of discount of
$203 and $294) . . . . . . . . . . . . . . . . . . . . . . . . . . . . . . . 399,797 399,7063.250% Senior Notes due April 15, 2023 (net of discount of
$1,775 and $1,991) . . . . . . . . . . . . . . . . . . . . . . . . . . . . 898,225 898,0094.150% Senior Notes due November 1, 2025 (net of
discount of $764) . . . . . . . . . . . . . . . . . . . . . . . . . . . . . 499,236 —Capital lease obligations . . . . . . . . . . . . . . . . . . . . . . . . . . 4,806 5,875Tax increment financing due February 1, 2035 . . . . . . . . . . 10,590 11,995Debt issuance costs, net . . . . . . . . . . . . . . . . . . . . . . . . . . (18,100) (15,462)
2,970,554 2,725,123Less: current portion . . . . . . . . . . . . . . . . . . . . . . . . . . . . (1,379) (101,158)
Long-term portion . . . . . . . . . . . . . . . . . . . . . . . . . . . . . . $2,969,175 $2,623,965
Borrowing Facilities and 2015 Refinancing
On October 20, 2015, the Company consummated a refinancing, pursuant to which the Companyamended and restated its senior unsecured credit facilities (and refinanced all borrowings thereunder)and issued senior notes in an aggregate principal amount of $500.0 million, net of discount totaling$0.8 million. The amended and restated senior unsecured credit facilities (the ‘‘Facilities’’) consist of a$425.0 million senior unsecured term loan facility (the ‘‘Term Facility’’) and a $1.0 billion seniorunsecured revolving credit facility (the ‘‘Revolving Facility’’) which provides for the issuance of lettersof credit up to $175.0 million. The Facilities are scheduled to mature on October 20, 2020. TheCompany incurred $2.6 million of new debt issuance costs associated with the refinancing of theFacilities.
Borrowings under the Facilities bear interest at a rate equal to an applicable interest rate marginplus, at the Company’s option, either (a) LIBOR or (b) a base rate (which is usually equal to the primerate). The applicable interest rate margin for borrowings as of January 29, 2016 was 1.10% for LIBORborrowings and 0.10% for base-rate borrowings. The Company must also pay a facility fee, payable onany used and unused commitment amounts of the Facilities, and customary fees on letters of creditissued under the Revolving Facility. As of January 29, 2016, the commitment fee rate was 0.15%. Theapplicable interest rate margins for borrowings, the facility fees and the letter of credit fees under theFacilities are subject to adjustment from time to time based on the Company’s long-term seniorunsecured debt ratings. The weighted average all-in interest rate for borrowings under the Facilities was1.65% as of January 29, 2016.
The Facilities can be voluntarily prepaid in whole or in part at any time without penalty. There isno required principal amortization under the Facilities. The Facilities contain a number of customary
60

10-K
DOLLAR GENERAL CORPORATION AND SUBSIDIARIES
NOTES TO CONSOLIDATED FINANCIAL STATEMENTS (Continued)
5. Current and long-term obligations (Continued)
affirmative and negative covenants that, among other things, restrict, subject to certain exceptions, theCompany’s and its subsidiaries’ ability to: incur additional liens; sell all or substantially all of theCompany’s assets; consummate certain fundamental changes or change in the Company’s lines ofbusiness; and incur additional subsidiary indebtedness. The Facilities also contain financial covenantswhich require the maintenance of a minimum fixed charge coverage ratio and a maximum leverageratio. As of January 29, 2016, the Company was in compliance with all such covenants. The Facilitiesalso contain customary events of default.
As of January 29, 2016, under the Revolving Facility, the Company had borrowing availability of$722.0 million. In addition, the Company had outstanding letters of credit totaling $38.7 million,$27.0 million of which were issued under the Revolving Facility.
The Company incurred a pretax loss of $0.3 million for the write off of debt issuance costsassociated with the refinancing of its credit facilities, which is reflected in Other (income) expense inthe consolidated statement of income for the year ended January 29, 2016.
On October 20, 2015, the Company issued $500.0 million aggregate principal amount of 4.150%senior notes due 2025 (the ‘‘2025 Senior Notes’’), net of discount of $0.8 million, which are scheduledto mature on November 1, 2025. Interest on the 2025 Senior Notes is payable in cash on May 1 andNovember 1 of each year, commencing on May 1, 2016. The Company incurred $4.4 million of debtissuance costs associated with the issuance of the 2025 Senior Notes. The net proceeds from the sale ofthe 2025 Senior Notes were used, together with borrowings under the Facilities, to repay all of theoutstanding borrowings under the then-existing credit agreement and for general corporate purposes.Collectively, the 2025 Senior Notes and the Company’s other Senior Notes due 2017, 2018 and 2023 asreflected in the table above comprise the ‘‘Senior Notes’’, each of which were issued pursuant to anindenture as supplemented and amended by supplemental indentures relating to each series of SeniorNotes (as so supplemented and amended, the ‘‘Senior Indenture’’).
The Company may redeem some or all of its Senior Notes at any time at redemption prices setforth in the Senior Indenture. Upon the occurrence of a change of control triggering event, which isdefined in the Senior Indenture, each holder of the Senior Notes has the right to require the Companyto repurchase some or all of such holder’s Senior Notes at a purchase price in cash equal to 101% ofthe principal amount thereof, plus accrued and unpaid interest, if any, to, but excluding, the repurchasedate.
The Senior Indenture contains covenants limiting, among other things, the ability of the Companyand its subsidiaries to (subject to certain exceptions): consolidate, merge, sell or otherwise dispose of allor substantially all of the Company’s assets; and to incur or guarantee indebtedness secured by liens onany shares of voting stock of significant subsidiaries.
The Senior Indenture also provides for events of default which, if any of them occurs, wouldpermit or require the principal of and accrued interest on the Senior Notes to become or to bedeclared due and payable, as applicable.
Scheduled debt maturities, including capital lease obligations, for the Company’s fiscal years listedbelow are as follows (in thousands): 2016—$1,379; 2017—$501,290; 2018—$400,892; 2019—$1,020;2020—$676,980; thereafter—$1,409,835.
61

10-K
DOLLAR GENERAL CORPORATION AND SUBSIDIARIES
NOTES TO CONSOLIDATED FINANCIAL STATEMENTS (Continued)
6. Assets and liabilities measured at fair value
The following table presents the Company’s assets and liabilities measured at fair value on arecurring basis as of January 29, 2016, aggregated by the level in the fair value hierarchy within whichthose measurements are classified.
Quoted Pricesin ActiveMarkets Significant
for Identical Other SignificantAssets and Observable Unobservable Balance atLiabilities Inputs Inputs January 29,
(In thousands) (Level 1) (Level 2) (Level 3) 2016
Liabilities:Long-term obligations(a) . . . . . . . . . . . . . . . . . . $2,305,470 $675,459 $— $2,980,929Deferred compensation(b) . . . . . . . . . . . . . . . . . 21,064 — — 21,064
(a) Reflected at book value in the consolidated balance sheet as Current portion of long-termobligations of $1,379 and Long-term obligations of $2,969,175.
(b) Reflected at fair value in the consolidated balance sheet as a component of Accrued expenses andother current liabilities of $8,307 and a component of noncurrent Other liabilities of $12,757.
The carrying amounts reflected in the consolidated balance sheets for cash, cash equivalents,short-term investments, receivables and payables approximate their respective fair values. The Companydoes not have any recurring fair value measurements using significant unobservable inputs (Level 3) asof January 29, 2016.
7. Derivatives and hedging activities
From time to time, the Company enters into certain financial instrument positions, all of which areintended to reduce risk by hedging an underlying economic exposure.
Risk management objective of using derivatives
The Company is exposed to certain risks arising from both its business operations and economicconditions. The Company principally manages its exposures to a wide variety of business andoperational risks through management of its core business activities. The Company manages economicrisks, including interest rate, liquidity, and credit risk, primarily by managing the amount, sources, andduration of its debt funding and, from time to time, through the use of derivative financial instruments.Specifically, the Company may enter into derivative financial instruments to manage exposures thatarise from business activities that result in the receipt or payment of future known and uncertain cashamounts, the value of which are determined primarily by interest rates.
In addition, the Company is exposed to certain risks arising from uncertainties of future marketvalues caused by the fluctuation in the prices of commodities. From time to time the Company mayenter into derivative financial instruments to protect against future price changes related to thesecommodity prices.
62

10-K
DOLLAR GENERAL CORPORATION AND SUBSIDIARIES
NOTES TO CONSOLIDATED FINANCIAL STATEMENTS (Continued)
7. Derivatives and hedging activities (Continued)
Cash flow hedges of interest rate risk
The Company’s objectives when using interest rate derivatives are to add stability to interestexpense and to manage its exposure to interest rate changes. To accomplish these objectives, theCompany has from time to time used interest rate swaps as part of its interest rate risk managementstrategy. Interest rate swaps designated as cash flow hedges involve the receipt of variable-rate amountsfrom a counterparty in exchange for the Company making fixed-rate payments over the life of theagreements without exchange of the underlying notional amount. The Company also previously enteredinto treasury locks that were designated as cash flow hedges of interest rate risk prior to the issuanceof long-term debt in April 2013.
The effective portion of changes in the fair value of derivatives designated and that qualify as cashflow hedges is recorded in Accumulated other comprehensive income (loss) (also referred to as ‘‘OCI’’)and is subsequently reclassified into earnings in the period that the hedged forecasted transactionaffects earnings. The ineffective portion of the change in fair value of the interest rate swaps, if any, isrecognized directly in earnings.
The Company had interest rate swaps with a combined notional value of $875.0 million designatedas cash flow hedges of interest rate risk that expired on May 31, 2015. Such interest rate swaps wereused to hedge the variable cash flows associated with existing variable-rate debt prior to their maturity.Amounts reported in Accumulated other comprehensive income (loss) related to derivatives werereclassified to interest expense as interest payments were made on the Company’s variable-rate debt.
In April 2013, the Company recorded a loss on the settlement of treasury locks associated with theissuance of long-term debt which was deferred to OCI and is being amortized as an increase to interestexpense over the period of the debt’s maturity in 2023. During the 52-week period followingJanuary 29, 2016, the Company estimates that approximately $1.3 million will be reclassified as anincrease to interest expense related to the amortization of the loss associated with the treasury locks.All of the amounts reflected in Accumulated other comprehensive income (loss) in the consolidatedbalance sheets for the periods presented are related to cash flow hedges.
Non-designated hedges of commodity risk
Derivatives not designated as hedges are not speculative and are used to manage the Company’sexposure to commodity price risk but do not meet strict hedge accounting requirements. Changes inthe fair value of derivatives not designated in hedging relationships are recorded directly in earnings.As of January 29, 2016, the Company had no such non-designated hedges.
The table below presents the fair value of the Company’s derivative financial instruments as well astheir classification on the consolidated balance sheets as of January 29, 2016 and January 30, 2015:
January 29, January 30,(in thousands) 2016 2015
Derivatives Designated as Hedging InstrumentsInterest rate swaps classified as Accrued expenses and
other current liabilities . . . . . . . . . . . . . . . . . . . . . . . . . $— $1,173
63

10-K
DOLLAR GENERAL CORPORATION AND SUBSIDIARIES
NOTES TO CONSOLIDATED FINANCIAL STATEMENTS (Continued)
7. Derivatives and hedging activities (Continued)
The table below presents the pre-tax effect of the Company’s derivative financial instruments asreflected in the consolidated statements of comprehensive income and shareholders’ equity, asapplicable:
(in thousands) 2015 2014 2013
Derivatives in Cash Flow Hedging RelationshipsLoss related to effective portion of derivative
recognized in OCI . . . . . . . . . . . . . . . . . . . . . . . . . $ 3 $ 876 $16,036Loss related to effective portion of derivative
reclassified from Accumulated OCI to Interestexpense . . . . . . . . . . . . . . . . . . . . . . . . . . . . . . . . . $2,494 $5,130 $ 4,604
8. Commitments and contingencies
Leases
As of January 29, 2016, the Company was committed under operating lease agreements for mostof its retail stores. Many of the Company’s stores are subject to build-to-suit arrangements withlandlords which typically carry a primary lease term of up to 15 years with multiple renewal options.The Company also has stores subject to shorter-term leases and many of these leases have renewaloptions. Certain of the Company’s leased stores have provisions for contingent rentals based upon aspecified percentage of defined sales volume.
The land and buildings of the Company’s DCs in Fulton, Missouri and Indianola, Mississippi aresubject to operating lease agreements and the leased Ardmore, Oklahoma DC is subject to a financingarrangement. The entities involved in the ownership structure underlying these leases meet theaccounting definition of a Variable Interest Entity (‘‘VIE’’). The Company is not the primarybeneficiary of these VIEs and, accordingly, has not included these entities in its consolidated financialstatements. Certain leases contain restrictive covenants, and as of January 29, 2016, the Company is notaware of any material violations of such covenants.
In January 2014, the Company sold 233 store locations for cash and concurrent with the saletransaction, the Company leased the properties back for a period of 15 years. The transaction resultedin cash proceeds of approximately $281.6 million and a deferred gain of $67.2 million which is beingrecognized as a reduction of rent expense over the 15-year initial lease term of the properties.
In January 1999, the Company sold its DC located in Ardmore, Oklahoma for cash and concurrentwith the sale transaction, the Company leased the property back for a period of 23 years. Thetransaction is being accounted for as a financing obligation rather than a sale as a result of, amongother things, the lessor’s ability to put the property back to the Company under certain circumstances.The property and equipment, along with the related lease obligation associated with this transaction arerecorded in the consolidated balance sheets. In August 2007, the Company purchased a securedpromissory note (the ‘‘Ardmore Note’’) from an unrelated third party with a face value of $34.3 millionat the date of purchase which approximated the remaining financing obligation. The Ardmore Noterepresents debt issued by the third party entity from which the Company leases the Ardmore DC andtherefore the Company holds the debt instrument pertaining to its lease financing obligation. Because a
64

10-K
DOLLAR GENERAL CORPORATION AND SUBSIDIARIES
NOTES TO CONSOLIDATED FINANCIAL STATEMENTS (Continued)
8. Commitments and contingencies (Continued)
legal right of offset exists, the Company is accounting for the Ardmore Note as a reduction of itsoutstanding financing obligation in its consolidated balance sheets.
Future minimum payments as of January 29, 2016 for operating leases are as follows:
(In thousands)
2016 . . . . . . . . . . . . . . . . . . . . . . . . . . . . . . . . . . . . . . . . . . . . . . . . . . $ 866,4442017 . . . . . . . . . . . . . . . . . . . . . . . . . . . . . . . . . . . . . . . . . . . . . . . . . . 831,3672018 . . . . . . . . . . . . . . . . . . . . . . . . . . . . . . . . . . . . . . . . . . . . . . . . . . 783,5642019 . . . . . . . . . . . . . . . . . . . . . . . . . . . . . . . . . . . . . . . . . . . . . . . . . . 720,5692020 . . . . . . . . . . . . . . . . . . . . . . . . . . . . . . . . . . . . . . . . . . . . . . . . . . 632,998Thereafter . . . . . . . . . . . . . . . . . . . . . . . . . . . . . . . . . . . . . . . . . . . . . 3,394,301
Total minimum payments . . . . . . . . . . . . . . . . . . . . . . . . . . . . . . . . . . . $7,229,243
Total minimum payments for capital leases were $5.9 million, with a present value of $4.8 million,as of January 29, 2016. The gross amount of property and equipment recorded under capital leases andfinancing obligations at both January 29, 2016 and January 31, 2015, was $29.8 million. Accumulateddepreciation on property and equipment under capital leases and financing obligations at January 29,2016 and January 30, 2015, was $12.4 million and $10.6 million, respectively.
Rent expense under all operating leases is as follows:
(In thousands) 2015 2014 2013
Minimum rentals(a) . . . . . . . . . . . . . . . . . . . . . . . $849,115 $776,103 $674,849Contingent rentals . . . . . . . . . . . . . . . . . . . . . . . . 7,793 9,099 12,058
$856,908 $785,202 $686,907
(a) Excludes amortization of leasehold interests of $0.9 million, $5.8 million and $11.9 millionincluded in rent expense for the years ended January 29, 2016, January 30, 2015, andJanuary 31, 2014, respectively.
Legal proceedings
In September 2011, the Chicago Regional Office of the United States Equal EmploymentOpportunity Commission (‘‘EEOC’’ or ‘‘Commission’’) notified the Company of a cause finding relatedto the Company’s criminal background check policy. The cause finding alleges that the Company’scriminal background check policy, which excludes from employment individuals with certain criminalconvictions for specified periods, has a disparate impact on African-American candidates andemployees in violation of Title VII of the Civil Rights Act of 1964, as amended (‘‘Title VII’’).
The Company and the EEOC engaged in the statutorily required conciliation process, and despitethe Company’s good faith efforts to resolve the matter, the Commission notified the Company onJuly 26, 2012 of its view that conciliation had failed.
On June 11, 2013, the EEOC filed a lawsuit in the United States District Court for the NorthernDistrict of Illinois entitled Equal Opportunity Commission v. Dolgencorp, LLC d/b/a Dollar General in
65
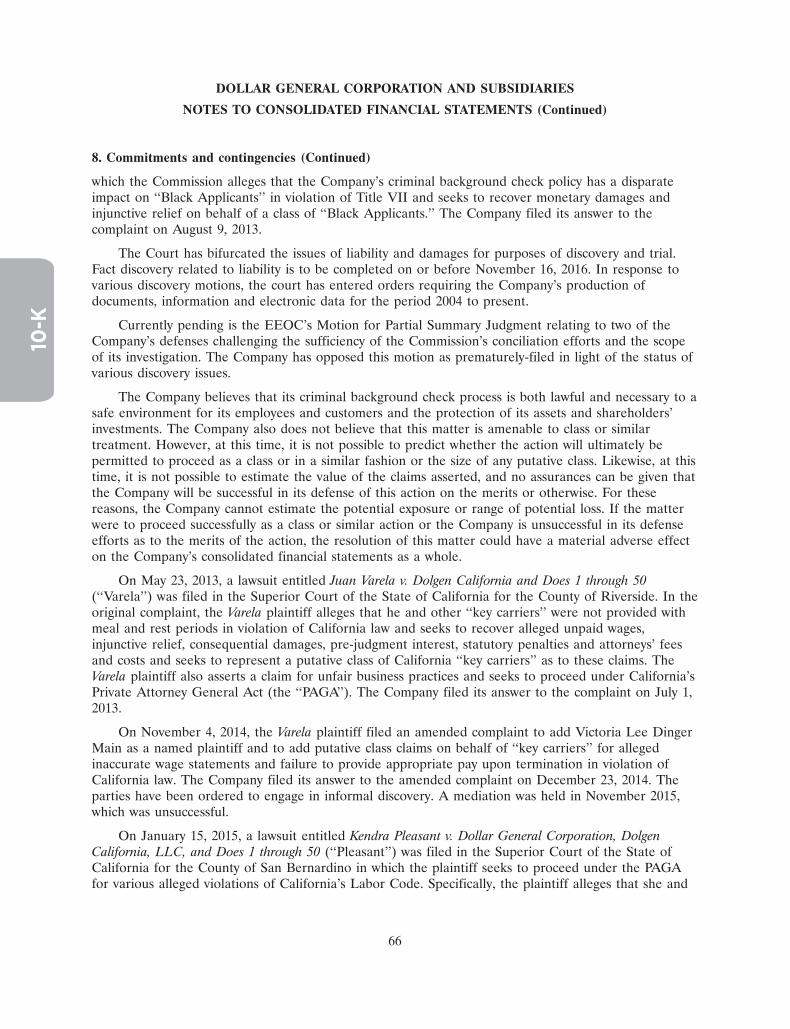
10-K
DOLLAR GENERAL CORPORATION AND SUBSIDIARIES
NOTES TO CONSOLIDATED FINANCIAL STATEMENTS (Continued)
8. Commitments and contingencies (Continued)
which the Commission alleges that the Company’s criminal background check policy has a disparateimpact on ‘‘Black Applicants’’ in violation of Title VII and seeks to recover monetary damages andinjunctive relief on behalf of a class of ‘‘Black Applicants.’’ The Company filed its answer to thecomplaint on August 9, 2013.
The Court has bifurcated the issues of liability and damages for purposes of discovery and trial.Fact discovery related to liability is to be completed on or before November 16, 2016. In response tovarious discovery motions, the court has entered orders requiring the Company’s production ofdocuments, information and electronic data for the period 2004 to present.
Currently pending is the EEOC’s Motion for Partial Summary Judgment relating to two of theCompany’s defenses challenging the sufficiency of the Commission’s conciliation efforts and the scopeof its investigation. The Company has opposed this motion as prematurely-filed in light of the status ofvarious discovery issues.
The Company believes that its criminal background check process is both lawful and necessary to asafe environment for its employees and customers and the protection of its assets and shareholders’investments. The Company also does not believe that this matter is amenable to class or similartreatment. However, at this time, it is not possible to predict whether the action will ultimately bepermitted to proceed as a class or in a similar fashion or the size of any putative class. Likewise, at thistime, it is not possible to estimate the value of the claims asserted, and no assurances can be given thatthe Company will be successful in its defense of this action on the merits or otherwise. For thesereasons, the Company cannot estimate the potential exposure or range of potential loss. If the matterwere to proceed successfully as a class or similar action or the Company is unsuccessful in its defenseefforts as to the merits of the action, the resolution of this matter could have a material adverse effecton the Company’s consolidated financial statements as a whole.
On May 23, 2013, a lawsuit entitled Juan Varela v. Dolgen California and Does 1 through 50(‘‘Varela’’) was filed in the Superior Court of the State of California for the County of Riverside. In theoriginal complaint, the Varela plaintiff alleges that he and other ‘‘key carriers’’ were not provided withmeal and rest periods in violation of California law and seeks to recover alleged unpaid wages,injunctive relief, consequential damages, pre-judgment interest, statutory penalties and attorneys’ feesand costs and seeks to represent a putative class of California ‘‘key carriers’’ as to these claims. TheVarela plaintiff also asserts a claim for unfair business practices and seeks to proceed under California’sPrivate Attorney General Act (the ‘‘PAGA’’). The Company filed its answer to the complaint on July 1,2013.
On November 4, 2014, the Varela plaintiff filed an amended complaint to add Victoria Lee DingerMain as a named plaintiff and to add putative class claims on behalf of ‘‘key carriers’’ for allegedinaccurate wage statements and failure to provide appropriate pay upon termination in violation ofCalifornia law. The Company filed its answer to the amended complaint on December 23, 2014. Theparties have been ordered to engage in informal discovery. A mediation was held in November 2015,which was unsuccessful.
On January 15, 2015, a lawsuit entitled Kendra Pleasant v. Dollar General Corporation, DolgenCalifornia, LLC, and Does 1 through 50 (‘‘Pleasant’’) was filed in the Superior Court of the State ofCalifornia for the County of San Bernardino in which the plaintiff seeks to proceed under the PAGAfor various alleged violations of California’s Labor Code. Specifically, the plaintiff alleges that she and
66

10-K
DOLLAR GENERAL CORPORATION AND SUBSIDIARIES
NOTES TO CONSOLIDATED FINANCIAL STATEMENTS (Continued)
8. Commitments and contingencies (Continued)
other similarly situated non-exempt California store-level employees were not paid for all time worked,provided meal and rest breaks, reimbursed for necessary work related expenses, and provided withaccurate wage statements and seeks to recover unpaid wages, civil and statutory penalties, interest,attorneys’ fees and costs. On March 12, 2015, the Company filed a demurrer asking the court to stay allproceedings in the Pleasant matter pending an issuance of a final judgment in the Varela matter. Thecourt granted the Company’s demurrer and stayed proceedings until resolution of the Varela matter.Subsequently, the Pleasant plaintiff moved to transfer this matter to the Superior Court of the State ofCalifornia for the County of Riverside where the Varela matter is pending, which the Companyopposed. The court denied the Pleasant plaintiff’s motion to transfer.
On February 20, 2015, a lawsuit entitled Julie Sullivan v. Dolgen California and Does 1 through 100(‘‘Sullivan’’) was filed in the Superior Court of the State of California for the County of Alameda inwhich the plaintiff alleges that she and other similarly situated Dollar General Market store managersin the State of California were improperly classified as exempt employees and were not provided withmeal and rest breaks and accurate wage statements in violation of California law. The Sullivan plaintiffalso alleges that she and other California store employees were not provided with printed wagestatements, purportedly in violation of California law. The plaintiff seeks to recover unpaid wages,including overtime pay, civil and statutory penalties, interest, injunctive relief, restitution, and attorneys’fees and costs.
On April 8, 2015, the Company removed this matter to the United States District Court for theNorthern District of California and filed its answer on the same date. On April 29, 2015, the Sullivanplaintiff amended her complaint to add a claim under the PAGA. The Company’s response to theamended complaint was filed on May 14, 2015. The plaintiff’s motion for class certification was filed onMarch 12, 2016. The matter has been set for trial on October 31, 2016. A mediation conducted in earlyMarch 2016 was unsuccessful.
The Company believes that its policies and practices comply with California law and that theVarela, Pleasant, and Sullivan actions are not appropriate for class or similar treatment. The Companyintends to vigorously defend these actions; however, at this time, it is not possible to predict whetherthe Varela, Pleasant, or Sullivan action ultimately will be permitted to proceed as a class, and noassurances can be given that the Company will be successful in its defense of these actions on themerits or otherwise. Similarly, at this time the Company cannot estimate either the size of any potentialclass or the value of the claims asserted in the Varela, Pleasant, or Sullivan action. For these reasons,the Company is unable to estimate any potential loss or range of loss in these matters; however, if theCompany is not successful in its defense efforts, the resolution of any of these actions could have amaterial adverse effect on the Company’s consolidated financial statements as a whole.
In December 2015, the Company was notified of seven lawsuits in which the plaintiffs allegeviolation of state consumer protection laws relating to the labeling, marketing and sale of DollarGeneral private-label motor oil. Six of these lawsuits were filed in various federal district courts of theUnited States: Bradford Barfoot and Leonard Karpeichik v. Dolgencorp, LLC (filed in the SouthernDistrict of Florida on December 18, 2015) (‘‘Barfoot’’); Milton M. Cooke, Jr. v. Dollar GeneralCorporation (filed in the Southern District of Texas on December 21, 2015) (‘‘Cooke’’); William Flinn v.Dolgencorp, LLC (filed in the District Court for New Jersey on December 17, 2015) (‘‘Flinn’’); John J.McCormick, III v. Dolgencorp, LLC (filed in the District Court of Maryland on December 23, 2015)(‘‘McCormick’’); David Sanchez v. Dolgencorp, LLC (filed in the Central District of California on
67

10-K
DOLLAR GENERAL CORPORATION AND SUBSIDIARIES
NOTES TO CONSOLIDATED FINANCIAL STATEMENTS (Continued)
8. Commitments and contingencies (Continued)
December 17, 2015) (‘‘Sanchez’’); and Will Sisemore v. Dolgencorp, LLC (filed in the Northern Districtof Oklahoma on December 21, 2015) (‘‘Sisemore’’).
The seventh matter, Chuck Hill v. Dolgencorp, LLC (‘‘Hill’’), was filed in Orleans County SuperiorCourt in Vermont on December 22, 2015, and subsequently removed to the United States DistrictCourt for the District of Vermont on February 8, 2016.
In February and March 2016, the Company was notified of thirteen additional lawsuits allegingsimilar claims concerning Dollar General private-label motor oil. All of these lawsuits were filed invarious federal district courts of the United States: Allen Brown v. Dollar General Corporation and DGRetail, LLC (filed in the District of Colorado on February 10, 2016) (‘‘Brown’’); Miriam Fruhling v.Dollar General Corporation and Dolgencorp, LLC (filed in the Southern District of Ohio onFebruary 10, 2016) (‘‘Fruhling’’); John Foppe v. Dollar General Corporation and Dolgencorp, LLC (filedin the Eastern District of Kentucky on February 10, 2016) (‘‘Foppe’’); Kevin Gadson v. Dolgencorp, LLC(filed in the Southern District of New York on February 8, 2016) (‘‘Gadson’’); Bruce Gooel v.Dolgencorp, LLC (filed in the Eastern District of Michigan on February 8, 2016) (‘‘Gooel’’); JanineHarvey v. Dollar General Corporation and Dolgencorp, LLC (filed in the District Court for Nebraska onFebruary 10, 2016) (‘‘Harvey’’); Nicholas Meyer v. Dollar General Corporation and DG Retail, LLC (filedin the District of Kansas on February 9, 2016) (‘‘Meyer’’); Robert Oren v. Dollar General Corporationand Dolgencorp, LLC (filed in the Western District of Missouri on February 8, 2016) (‘‘Oren’’); ScottSheehy v. Dollar General Corporation and DG Retail, LLC (filed in the District Court for Minnesota onFebruary 9, 2016) (‘‘Sheehy’’); Gerardo Solis v. Dollar General Corporation and DG Retail, LLC (filed inthe Northern District of Illinois on February 12, 2016) (‘‘Solis’’); Roberto Vega v. Dolgencorp, LLC (filedin the Central District of California on February 8, 2016) (‘‘Vega’’); Matthew Wait v. Dollar GeneralCorporation and Dolgencorp, LLC (filed in the Western District of Arkansas on February 16, 2016)(‘‘Wait’’); and James Taschner v. Dollar General Corporation and Dolgencorp, LLC (filed in the EasternDistrict of Missouri on March 15, 2016) (‘‘Taschner’’).
The plaintiffs in the Taschner, Vega and Sanchez matters seek to proceed on a nationwide andstatewide class basis, while the plaintiffs in the other matters seek to proceed only on a statewide classbasis. Each plaintiff seeks, for himself or herself and the putative class he or she seeks to represent,some or all of the following relief: compensatory damages, injunctive relief prohibiting the sale of theproducts at issue and requiring the dissemination of corrective advertising, certain statutory damages(including treble damages), punitive damages and attorneys’ fees.
On February 1, 2016, the Sanchez plaintiff voluntarily dismissed his complaint without prejudice.
The Company filed a motion to dismiss the plaintiffs’ claims and a motion to strike the classallegations in the Barfoot matter on February 4, 2016; in the Hill matter on February 8, 2016; in theCooke matter on February 24, 2016; in the Sisemore matter on March 4, 2016; and in the Flinn matteron March 10, 2016.
On March 7, 2016, the Company filed a motion with the United States Judicial Panel onMultidistrict Litigation requesting that all cases be transferred to the United States District Court forthe Eastern District of Michigan, or, in the alternative to the Western District of Missouri or theSouthern District of Florida, for consolidated pretrial proceedings (‘‘Motion to Transfer’’). Afterreceiving notice of the Company’s Motion to Transfer, the court stayed and administratively closed theBarfoot matter pending a transfer decision by the Judicial Panel on Multidistrict Litigation.
68

10-K
DOLLAR GENERAL CORPORATION AND SUBSIDIARIES
NOTES TO CONSOLIDATED FINANCIAL STATEMENTS (Continued)
8. Commitments and contingencies (Continued)
The Company’s responsive pleadings are due in the McCormick matter on March 21, 2016; in theFruhling matter on April 4, 2016; in the Meyer matter on April 6, 2016; in the Sheehy matter on April 7,2016; in the Solis matter on April 8, 2016; in the Foppe matter and Gooel matter on April 15, 2016; andin the Harvey, Oren and Vega matters on April 22, 2016.
The Company believes that the labeling, marketing and sale of its private-label motor oil complieswith applicable federal and state requirements and is not misleading. The Company further believesthat these matters are not appropriate for class or similar treatment. The Company intends tovigorously defend these actions; however, at this time, it is not possible to predict whether any of thesecases will be permitted to proceed as a class or the size of any putative class. Likewise, at this time, itis not possible to estimate the value of the claims asserted, and no assurances can be given that theCompany will be successful in its defense of these actions on the merits or otherwise. For thesereasons, the Company is unable to estimate the potential loss or range of loss in these matters;however if the Company is not successful in its defense efforts, the resolution of any of these actionscould have a material adverse effect on the Company’s consolidated financial statements as a whole.
From time to time, the Company is a party to various other legal actions involving claimsincidental to the conduct of its business, including actions by employees, consumers, suppliers,government agencies, or others through private actions, class actions, administrative proceedings,regulatory actions or other litigation, including without limitation under federal and state employmentlaws and wage and hour laws. The Company believes, based upon information currently available, thatsuch other litigation and claims, both individually and in the aggregate, will be resolved without amaterial adverse effect on the Company’s consolidated financial statements as a whole. However,litigation involves an element of uncertainty. Future developments could cause these actions or claimsto have a material adverse effect on the Company’s results of operations, cash flows, or financialposition. In addition, certain of these lawsuits, if decided adversely to the Company or settled by theCompany, may result in liability material to the Company’s financial position or may negatively affectoperating results if changes to the Company’s business operation are required.
9. Benefit plans
The Dollar General Corporation 401(k) Savings and Retirement Plan, which became effective onJanuary 1, 1998, is a safe harbor defined contribution plan and is subject to the Employee Retirementand Income Security Act (‘‘ERISA’’).
A participant’s right to claim a distribution of his or her account balance is dependent on the plan,ERISA guidelines and Internal Revenue Service regulations. All active participants are fully vested inall contributions to the 401(k) plan. During 2015, 2014 and 2013, the Company expensed approximately$15.0 million, $13.7 million and $13.0 million, respectively, for matching contributions.
The Company also has a nonqualified supplemental retirement plan (‘‘SERP’’) and compensationdeferral plan (‘‘CDP’’), known as the Dollar General Corporation CDP/SERP Plan, for a select groupof management and other key employees. The Company incurred compensation expense for these plansof approximately $1.1 million, $0.8 million and $1.2 million in 2015, 2014 and 2013, respectively.
The CDP/SERP Plan assets are invested in accounts selected by the Company’s CompensationCommittee or its delegate, and the associated deferred compensation liability is reflected in theconsolidated balance sheets as further discussed in Note 6.
69

10-K
DOLLAR GENERAL CORPORATION AND SUBSIDIARIES
NOTES TO CONSOLIDATED FINANCIAL STATEMENTS (Continued)
10. Share-based payments
The Company accounts for share-based payments in accordance with applicable accountingstandards, under which the fair value of each award is separately estimated and amortized intocompensation expense over the service period. The fair value of the Company’s stock option grants areestimated on the grant date using the Black-Scholes-Merton valuation model. Forfeitures are estimatedat the time of valuation and reduce expense ratably over the vesting period. The application of thisvaluation model involves assumptions that are judgmental and highly sensitive in the determination ofcompensation expense.
On July 6, 2007, the Company’s Board of Directors adopted the 2007 Stock Incentive Plan for KeyEmployees, which plan was subsequently amended (as so amended, the ‘‘Plan’’). The Plan allows thegranting of stock options, stock appreciation rights, and other stock-based awards or dividendequivalent rights to key employees, directors, consultants or other persons having a service relationshipwith the Company, its subsidiaries and certain of its affiliates. The number of shares of Companycommon stock authorized for grant under the Plan is 31,142,858. As of January 29, 2016, 18,556,241 ofsuch shares are available for future grants.
Since May 2011, most of the share-based awards issued by the Company have been in the form ofstock options, restricted stock, restricted stock units and performance share units. With limitedexceptions, stock options and restricted stock units granted to employees generally vest ratably on anannual basis over four-year and three-year periods, respectively. Awards granted to board membersgenerally vest ratably over a one or three-year period. Performance share units generally vest ratablyover a three-year period, provided that certain minimum performance criteria are met in the year ofgrant. With limited exceptions, the performance share unit and restricted stock unit awards are payablein shares of common stock on the vesting date.
From July 2007 through May 2011, a significant majority of the Company’s share-based awardswere a combination of stock options that vest solely upon the continued employment of the recipient(‘‘MSA Time Options’’) and options that vest upon the achievement of predetermined annual orcumulative financial-based targets (‘‘MSA Performance Options’’) (collectively, the ‘‘MSA Options’’).MSA Options generally vest ratably on an annual basis over a period of approximately five years, withlimited exceptions. The MSA Options are subject to various provisions set forth in a managementstockholder’s agreement (‘‘MSA’’) entered into with each option holder. The MSA Options have acontractual term of 10 years and an exercise price equal to the fair value of the underlying commonstock on the date of grant.
The weighted average for key assumptions used in determining the fair value of all stock optionsgranted in the years ended January 29, 2016, January 30, 2015, and January 31, 2014, and a summary ofthe methodology applied to develop each assumption, are as follows:
January 29, January 30, January 31,2016 2015 2014
Expected dividend yield . . . . . . . . . . . . . . . . . . . 1.2% 0% 0%Expected stock price volatility . . . . . . . . . . . . . . 25.3% 25.6% 26.2%Weighted average risk-free interest rate . . . . . . . 1.8% 1.9% 1.2%Expected term of options (years) . . . . . . . . . . . . 6.4 6.3 6.3
70

10-K
DOLLAR GENERAL CORPORATION AND SUBSIDIARIES
NOTES TO CONSOLIDATED FINANCIAL STATEMENTS (Continued)
10. Share-based payments (Continued)
Expected dividend yield—This is an estimate of the expected dividend yield on the Company’sstock. An increase in the dividend yield will decrease compensation expense.
Expected stock price volatility—This is a measure of the amount by which the price of theCompany’s common stock has fluctuated or is expected to fluctuate. Since November 2011, theexpected volatilities for awards have been based on the historical volatility of the Company’s publiclytraded common stock. An increase in the expected volatility will increase compensation expense.
Weighted average risk-free interest rate—This is the U.S. Treasury rate for the week of the granthaving a term approximating the expected life of the option. An increase in the risk-free interest ratewill increase compensation expense.
Expected term of options—This is the period of time over which the options granted are expectedto remain outstanding. The Company has estimated the expected term as the mid-point between thevesting date and the contractual term of the option. An increase in the expected term will increasecompensation expense.
A summary of the Company’s stock option activity, exclusive of options subject to an MSA, duringthe year ended January 29, 2016 is as follows:
Average RemainingOptions Exercise Contractual Intrinsic
(Intrinsic value amounts reflected in thousands) Issued Price Term in Years Value
Balance, January 30, 2015 . . . . . . . . . . . 2,399,124 $49.69Granted . . . . . . . . . . . . . . . . . . . . . . . 1,247,557 74.73Exercised . . . . . . . . . . . . . . . . . . . . . . (703,956) 45.66Canceled . . . . . . . . . . . . . . . . . . . . . . . (512,760) 61.67
Balance, January 29, 2016 . . . . . . . . . . . 2,429,965 $61.19 8.1 $33,701
Exercisable at January 29, 2016 . . . . . . . 517,375 $47.31 6.7 $14,355
The weighted average grant date fair value per share of non-MSA options granted was $18.48,$17.26 and $13.86 during 2015, 2014 and 2013, respectively. The intrinsic value of non-MSA optionsexercised during 2015, 2014, and 2013 was $20.8 million, $2.5 million and $0.8 million, respectively.
The number of performance share unit awards earned is based upon the Company’s annualfinancial performance in the year of grant as specified in the award agreement. A summary ofperformance share unit award activity during the year ended January 29, 2016 is as follows:
Units Intrinsic(Intrinsic value amounts reflected in thousands) Issued Value
Balance, January 30, 2015 . . . . . . . . . . . . . . . . . . . . . . . . . . . . 212,583Granted . . . . . . . . . . . . . . . . . . . . . . . . . . . . . . . . . . . . . . . . . 103,666Converted to common stock . . . . . . . . . . . . . . . . . . . . . . . . . . (120,417)Canceled . . . . . . . . . . . . . . . . . . . . . . . . . . . . . . . . . . . . . . . . (51,735)
Balance, January 29, 2016 . . . . . . . . . . . . . . . . . . . . . . . . . . . . 144,097 $10,816
71

10-K
DOLLAR GENERAL CORPORATION AND SUBSIDIARIES
NOTES TO CONSOLIDATED FINANCIAL STATEMENTS (Continued)
10. Share-based payments (Continued)
The weighted average grant date fair value per share of performance share units granted was$74.72, $57.91 and $48.11 during 2015, 2014, and 2013, respectively.
A summary of restricted stock unit award activity during the year ended January 29, 2016 is asfollows:
Units Intrinsic(Intrinsic value amounts reflected in thousands) Issued Value
Balance, January 30, 2015 . . . . . . . . . . . . . . . . . . . . . . . . . . . . 714,858Granted . . . . . . . . . . . . . . . . . . . . . . . . . . . . . . . . . . . . . . . . . 383,134Converted to common stock . . . . . . . . . . . . . . . . . . . . . . . . . . (326,383)Canceled . . . . . . . . . . . . . . . . . . . . . . . . . . . . . . . . . . . . . . . . (130,699)
Balance, January 29, 2016 . . . . . . . . . . . . . . . . . . . . . . . . . . . . 640,910 $48,107
The weighted average grant date fair value per share of restricted stock units granted was $74.67,$57.87 and $48.20 during 2015, 2014 and 2013, respectively.
At January 29, 2016, 173,091 MSA Time Options were outstanding, all of which were exercisable,with an average exercise price of $20.36, an average remaining contractual term of 3.8 years, and anaggregate intrinsic value of $9.5 million. The intrinsic value of MSA Time Options exercised during2015, 2014 and 2013 was $6.6 million, $6.8 million and $39.4 million, respectively.
At January 29, 2016, 151,097 MSA Performance Options were outstanding, all of which wereexercisable, with an average exercise price of $21.23, an average remaining contractual term of3.9 years, and an aggregate intrinsic value of $8.1 million. The intrinsic value of MSA PerformanceOptions exercised during 2015, 2014 and 2013 was $4.9 million, $4.9 million and $39.1 million,respectively.
In March 2012, the Company issued a performance-based award of 326,037 shares of restrictedstock to its former Chairman and Chief Executive Officer. The restricted stock award had a fair valueon the grant date of $45.25 per share, with the award scheduled to vest in one-half incrementscontingent upon, among other things, meeting certain specified earnings per share targets for 2014 and2015. The target for 2014 was met and the applicable shares vested. Certain conditions relating to the2015 tranche of the award were not satisfied and therefore the applicable shares did not vest.
At January 29, 2016, the total unrecognized compensation cost related to nonvested stock-basedawards was $48.2 million with an expected weighted average expense recognition period of 1.7 years.
72

10-K
DOLLAR GENERAL CORPORATION AND SUBSIDIARIES
NOTES TO CONSOLIDATED FINANCIAL STATEMENTS (Continued)
10. Share-based payments (Continued)
The fair value method of accounting for share-based awards resulted in share-based compensationexpense (a component of SG&A expenses) and a corresponding reduction in net income before incometaxes as follows:
Stock Performance Restricted Restricted(In thousands) Options Share Units Stock Units Stock Total
Year ended January 29, 2016Pre-tax . . . . . . . . . . . . . . . $11,113 $4,856 $22,578 $ — $38,547Net of tax . . . . . . . . . . . . . $ 6,779 $2,962 $13,772 $ — $23,513
Year ended January 30, 2015Pre-tax . . . . . . . . . . . . . . . $ 8,533 $5,461 $15,968 $7,376 $37,338Net of tax . . . . . . . . . . . . . $ 5,206 $3,332 $ 9,742 $4,500 $22,780
Year ended January 31, 2014Pre-tax . . . . . . . . . . . . . . . $ 7,634 $3,448 $ 9,879 $ — $20,961Net of tax . . . . . . . . . . . . . $ 4,649 $2,100 $ 6,016 $ — $12,765
11. Segment reporting
The Company manages its business on the basis of one reportable operating segment. See Note 1for a brief description of the Company’s business. As of January 29, 2016, all of the Company’soperations were located within the United States with the exception of certain subsidiaries in HongKong and China and a liaison office in India, which collectively are not material with regard to assets,results of operations or otherwise, to the consolidated financial statements. The following net sales datais presented in accordance with accounting standards related to disclosures about segments of anenterprise.
(In thousands) 2015 2014 2013
Classes of similar products:Consumables . . . . . . . . . . . . . . . . . . . . $15,457,611 $14,321,080 $13,161,825Seasonal . . . . . . . . . . . . . . . . . . . . . . . . 2,522,701 2,344,993 2,259,516Home products . . . . . . . . . . . . . . . . . . . 1,289,423 1,205,373 1,115,648Apparel . . . . . . . . . . . . . . . . . . . . . . . . 1,098,827 1,038,142 967,178
Net sales . . . . . . . . . . . . . . . . . . . . . . $20,368,562 $18,909,588 $17,504,167
12. Common stock transactions
On August 29, 2012, the Company’s Board of Directors authorized a common stock repurchaseprogram, which the Board has increased on several occasions. Most recently, on December 2, 2015, theCompany’s Board of Directors authorized a $1.0 billion increase to the existing common stockrepurchase program. As of January 29, 2016, a cumulative total of $4.0 billion had been authorizedunder the program since its inception and $923.8 million remained available for repurchase. Therepurchase authorization has no expiration date and allows repurchases from time to time in the openmarket or in privately negotiated transactions. The timing and number of shares purchased depends ona variety of factors, such as price, market conditions, compliance with the covenants and restrictions
73

10-K
DOLLAR GENERAL CORPORATION AND SUBSIDIARIES
NOTES TO CONSOLIDATED FINANCIAL STATEMENTS (Continued)
12. Common stock transactions (Continued)
under the Company’s debt agreements and other factors. Repurchases under the program may befunded from available cash or borrowings under the Facilities discussed in further detail in Note 5.
During the years ended January 29, 2016, January 30, 2015, and January 31, 2014, the Companyrepurchased approximately 17.6 million shares of its common stock at a total cost of $1.3 billion,approximately 14.1 million shares at a total cost of $0.8 billion and approximately 11.0 million shares ofits common stock at a total cost of $0.6 billion, respectively, pursuant to its common stock repurchaseprograms.
The Company paid quarterly cash dividends of $0.22 per share during each of the four quarters of2015. On March 8, 2016, the Company’s Board of Directors approved a quarterly cash dividend of$0.25 per share, which is payable on April 12, 2016 to shareholders of record as of March 29, 2016.The declaration of future cash dividends is subject to the discretion of the Company’s Board ofDirectors and will depend upon, among other things, the Company’s results of operations, cashrequirements, financial condition, contractual restrictions and other factors that the Board may deemrelevant in its sole discretion.
13. Corporate restructuring
On October 13, 2015, the Company implemented a restructuring of its corporate support functions,including the elimination of approximately 255 positions, substantially all of which were at theCompany’s corporate headquarters and effective immediately. The restructuring is part of a broaderinitiative aimed at improving efficiencies and reducing expenses.
The Company incurred pretax expense of $6.1 million associated with this restructuring forseverance-related benefits. This expense is reflected in Selling, general, and administrative expenses onthe Company’s consolidated statements of income for the year ended January 29, 2016. As ofJanuary 29, 2016, the remaining liability related to these charges is $3.5 million.
14. Quarterly financial data (unaudited)
The following is selected unaudited quarterly financial data for the fiscal years ended January 29,2016 and January 30, 2015. Each quarterly period listed below was a 13-week accounting period. Thesum of the four quarters for any given year may not equal annual totals due to rounding.
First Second Third Fourth(In thousands) Quarter Quarter Quarter Quarter
2015:Net sales . . . . . . . . . . . . . . . . . . $4,918,672 $5,095,904 $5,067,048 $5,286,938Gross profit . . . . . . . . . . . . . . . . 1,498,705 1,588,155 1,536,962 1,682,269Operating profit . . . . . . . . . . . . . 428,194 475,812 423,859 612,429Net income . . . . . . . . . . . . . . . . 253,235 282,349 253,321 376,175Basic earnings per share . . . . . . . 0.84 0.95 0.87 1.30Diluted earnings per share . . . . . 0.84 0.95 0.86 1.30
74

10-K
DOLLAR GENERAL CORPORATION AND SUBSIDIARIES
NOTES TO CONSOLIDATED FINANCIAL STATEMENTS (Continued)
14. Quarterly financial data (unaudited) (Continued)
First Second Third Fourth(In thousands) Quarter Quarter Quarter Quarter
2014:Net sales . . . . . . . . . . . . . . . . . . $4,522,081 $4,724,039 $4,724,409 $4,939,059Gross profit . . . . . . . . . . . . . . . . 1,357,746 1,455,574 1,423,748 1,565,439Operating profit . . . . . . . . . . . . . 379,708 428,526 394,143 566,716Net income . . . . . . . . . . . . . . . . 222,398 251,260 236,316 355,371Basic earnings per share . . . . . . . 0.72 0.83 0.78 1.17Diluted earnings per share . . . . . 0.72 0.83 0.78 1.17
As discussed in Note 13, in the third quarter of 2015, the Company implemented a restructuring ofits corporate support functions. As a result, the Company incurred expenses, primarily related toseverance-related benefits, of $6.1 million ($3.7 million net of tax, or $0.01 per diluted share), whichwas recognized as Selling, general, and administrative expense.
In the third and fourth quarters of 2014, the Company incurred expenses related to an attemptedacquisition of $8.2 million ($7.4 million net of tax, or $0.02 per diluted share) and $6.1 million($1.3 million net of tax, or $0.00 per diluted share), respectively, which were recognized as Selling,general and administrative expenses.
75

10-K
ITEM 9. CHANGES IN AND DISAGREEMENTS WITH ACCOUNTANTS ON ACCOUNTING ANDFINANCIAL DISCLOSURE
Not applicable.
ITEM 9A. CONTROLS AND PROCEDURES
(a) Disclosure Controls and Procedures. Under the supervision and with the participation of ourmanagement, including our principal executive officer and principal financial officer, we conducted anevaluation of our disclosure controls and procedures, as such term is defined under Rule 13a-15(e) or15d-15(e) promulgated under the Securities Exchange Act of 1934, as amended (the ‘‘Exchange Act’’).Based on this evaluation, our principal executive officer and our principal financial officer concludedthat our disclosure controls and procedures were effective as of the end of the period covered by thisreport.
(b) Management’s Annual Report on Internal Control Over Financial Reporting. Our managementprepared and is responsible for the consolidated financial statements and all related financialinformation contained in this report. This responsibility includes establishing and maintaining adequateinternal control over financial reporting as defined in Rule 13a-15(f) or 15d-15(f) under the ExchangeAct. Our internal control over financial reporting is designed to provide reasonable assurance regardingthe reliability of financial reporting and the preparation of financial statements for external purposes inaccordance with United States generally accepted accounting principles.
To comply with the requirements of Section 404 of the Sarbanes-Oxley Act of 2002, managementdesigned and implemented a structured and comprehensive assessment process to evaluate theeffectiveness of its internal control over financial reporting. Such assessment was based on criteriaestablished in Internal Control—Integrated Framework (2013 Framework) issued by the Committee ofSponsoring Organizations of the Treadway Commission. Because of its inherent limitations, a system ofinternal control over financial reporting can provide only reasonable assurance and may not prevent ordetect misstatements. Management regularly monitors our internal control over financial reporting, andactions are taken to correct any deficiencies as they are identified. Based on its assessment,management has concluded that our internal control over financial reporting is effective as ofJanuary 29, 2016.
Ernst & Young LLP, the independent registered public accounting firm that audited ourconsolidated financial statements, has issued an attestation report on management’s assessment of ourinternal control over financial reporting. Such attestation report is contained below.
76

10-K
(c) Attestation Report of Independent Registered Public Accounting Firm.
Report of Independent Registered Public Accounting Firm
The Board of Directors and Shareholders ofDollar General Corporation
We have audited Dollar General Corporation and subsidiaries’ internal control over financialreporting as of January 29, 2016, based on criteria established in Internal Control—IntegratedFramework issued by the Committee of Sponsoring Organizations of the Treadway Commission (2013framework) (the COSO criteria). Dollar General Corporation and subsidiaries’ management isresponsible for maintaining effective internal control over financial reporting, and for its assessment ofthe effectiveness of internal control over financial reporting included in the accompanyingManagement’s Annual Report on Internal Control Over Financial Reporting. Our responsibility is toexpress an opinion on the company’s internal control over financial reporting based on our audit.
We conducted our audit in accordance with the standards of the Public Company AccountingOversight Board (United States). Those standards require that we plan and perform the audit to obtainreasonable assurance about whether effective internal control over financial reporting was maintainedin all material respects. Our audit included obtaining an understanding of internal control overfinancial reporting, assessing the risk that a material weakness exists, testing and evaluating the designand operating effectiveness of internal control based on the assessed risk, and performing such otherprocedures as we considered necessary in the circumstances. We believe that our audit provides areasonable basis for our opinion.
A company’s internal control over financial reporting is a process designed to provide reasonableassurance regarding the reliability of financial reporting and the preparation of financial statements forexternal purposes in accordance with generally accepted accounting principles. A company’s internalcontrol over financial reporting includes those policies and procedures that (1) pertain to themaintenance of records that, in reasonable detail, accurately and fairly reflect the transactions anddispositions of the assets of the company; (2) provide reasonable assurance that transactions arerecorded as necessary to permit preparation of financial statements in accordance with generallyaccepted accounting principles, and that receipts and expenditures of the company are being made onlyin accordance with authorizations of management and directors of the company; and (3) providereasonable assurance regarding prevention or timely detection of unauthorized acquisition, use, ordisposition of the company’s assets that could have a material effect on the financial statements.
Because of its inherent limitations, internal control over financial reporting may not prevent ordetect misstatements. Also, projections of any evaluation of effectiveness to future periods are subjectto the risk that controls may become inadequate because of changes in conditions, or that the degreeof compliance with the policies or procedures may deteriorate.
In our opinion, Dollar General Corporation and subsidiaries maintained, in all material respects,effective internal control over financial reporting as of January 29, 2016, based on the COSO criteria.
We also have audited, in accordance with the standards of the Public Company AccountingOversight Board (United States), the consolidated balance sheets of Dollar General Corporation andsubsidiaries as of January 29, 2016 and January 30, 2015, and the related consolidated statements ofincome, comprehensive income, shareholders’ equity, and cash flows for each of the three years in theperiod ended January 29, 2016 of Dollar General Corporation and subsidiaries and our report datedMarch 22, 2016 expressed an unqualified opinion thereon.
/s/ Ernst & Young LLP
Nashville, TennesseeMarch 22, 2016
77

10-K
(d) Changes in Internal Control Over Financial Reporting. There have been no changes during thequarter ended January 29, 2016 in our internal control over financial reporting (as defined in ExchangeAct Rule 13a-15(f)) that have materially affected, or are reasonably likely to materially affect, ourinternal control over financial reporting.
ITEM 9B. OTHER INFORMATION
On March 7, 2016, Mr. John W. Flanigan, Executive Vice President, Global Supply Chain, advisedthe Company of his intent to retire effective April 29, 2016.
On March 16, 2016, the Company’s Compensation Committee (the ‘‘Committee’’) awarded 119,599non-qualified stock options (‘‘Options’’) and 27,367 performance share units (‘‘PSUs’’) to Mr. Vasosand 32,890 Options and 7,526 PSUs to each of Messrs. Garratt, Flanigan and Ravener and Ms. Tayloron the terms and subject to the conditions set forth in the form of Option award agreement and formof PSU award agreement attached hereto as Exhibit 10.5 and Exhibit 10.10, respectively (collectively,the ‘‘Form Award Agreements’’), and subject to the terms and conditions of the previously filedAmended and Restated 2007 Stock Incentive Plan for Key Employees of Dollar General Corporation(the ‘‘Plan’’).
The Options have a term of ten years and, subject to earlier forfeiture or accelerated vesting undercertain circumstances described in the form of Option award agreement, generally will vest in fourequal annual installments beginning on April 1, 2017.
The PSUs represent a target number of units that can be earned if certain performance measuresare achieved during the performance period (which is the Company’s fiscal year 2016) (the‘‘Performance Period’’) and if certain additional vesting requirements are met. The performancemeasures are goals related to adjusted EBITDA (weighted 50%) and ROIC (weighted 50%) asestablished by the Committee on the grant date. The number of PSUs earned will vary between 0%and 300% of the target amount based on actual performance compared to target performance on agraduated scale, with performance at the target level resulting in 100% of the target number of PSUsbeing earned. At the conclusion of the Performance Period, the Committee will determine the level ofachievement of each performance goal measure and the corresponding number of PSUs earned by eachgrantee. Subject to certain pro-rata vesting conditions, one-third of the PSUs earned by each granteewill vest on the last day of the Performance Period and be paid on April 1, 2017. The remainingtwo-thirds of the PSUs earned by each grantee will vest in equal installments on April 1, 2018 andApril 1, 2019, in each case subject to the grantee’s continued employment with the Company andcertain accelerated vesting provisions described in the form of PSU award agreement.
The Form Award Agreements also provide that in the event of a Change in Control (as defined inthe Form Award Agreements) of the Company, a grantee will only receive an accelerated payout of hisor her equity award if a Qualifying Termination (as defined in the Form Award Agreements) occurswithin two years following the Change in Control.
Also, on March 16, 2016, in addition to the award of Options and PSUs as outlined above, theCommittee awarded Mr. Vasos 85,759 Options according to the terms of the form of Option awardagreement attached hereto as Exhibit 10.38 and subject to the terms and conditions of the Plan.Subject to certain forfeiture and limited vesting acceleration events (including the same Change inControl provisions as described above), such Option award is scheduled to vest ratably in installmentsof 33 1/3% on each of the third, fourth and fifth anniversaries of the grant date, subject to holdingrequirements through the fifth anniversary of the grant date, and will terminate no later than ten yearsfrom the grant date.
The foregoing descriptions of all Options and PSU awards and the forms of award agreements aresummaries only, do not purport to be complete, and are qualified in their entirety by reference to thefiled forms of award agreement attached hereto as Exhibits 10.5, 10.10 and 10.38.
78

10-K
PART III
ITEM 10. DIRECTORS, EXECUTIVE OFFICERS AND CORPORATE GOVERNANCE
(a) Information Regarding Directors and Executive Officers. The information required by thisItem 10 regarding our directors and director nominees is contained under the captions ‘‘Who are thenominees this year,’’ ‘‘What are the backgrounds of this year’s nominees,’’ ‘‘Are there any familialrelationships between any of the nominees,’’ ‘‘How are directors identified and nominated,’’ and ‘‘Whatparticular experience, qualifications, attributes or skills led the Board of Directors to conclude thateach nominee should serve as a director of Dollar General,’’ all under the heading ‘‘Proposal 1:Election of Directors’’ in our definitive Proxy Statement to be filed for our Annual Meeting ofShareholders to be held on May 25, 2016 (the ‘‘2016 Proxy Statement’’), which information under suchcaptions is incorporated herein by reference. Information required by this Item 10 regarding ourexecutive officers is contained in Part I of this Form 10-K under the caption ‘‘Executive Officers of theRegistrant,’’ which information under such caption is incorporated herein by reference.
(b) Compliance with Section 16(a) of the Exchange Act. Information required by this Item 10regarding compliance with Section 16(a) of the Exchange Act is contained under the caption‘‘Section 16(a) Beneficial Ownership Reporting Compliance’’ in the 2016 Proxy Statement, whichinformation under such caption is incorporated herein by reference.
(c) Code of Business Conduct and Ethics. We have adopted a Code of Business Conduct andEthics that applies to all of our employees, officers and Board members. This Code is posted on theInvestor Information section of our Internet website at www.dollargeneral.com. If we choose to nolonger post such Code, we will provide a free copy to any person upon written request to DollarGeneral Corporation, c/o Investor Relations Department, 100 Mission Ridge, Goodlettsville, TN 37072.We intend to provide any required disclosure of an amendment to or waiver from such Code thatapplies to our principal executive officer, principal financial officer, principal accounting officer orcontroller, or persons performing similar functions, on our Internet website located atwww.dollargeneral.com promptly following the amendment or waiver. We may elect to disclose anysuch amendment or waiver in a report on Form 8-K filed with the SEC either in addition to or in lieuof the website disclosure. The information contained on or connected to our Internet website is notincorporated by reference into this Form 10-K and should not be considered part of this or any otherreport that we file with or furnish to the SEC.
(d) Procedures for Shareholders to Nominate Directors. There have been no material changes tothe procedures by which security holders may recommend nominees to the registrant’s Board ofDirectors.
(e) Audit Committee Information. Information required by this Item 10 regarding our auditcommittee and our audit committee financial experts is contained under the captions ‘‘CorporateGovernance—Does the Board of Directors have standing Audit, Compensation and NominatingCommittees’’ and ‘‘—Does Dollar General have an audit committee financial expert serving on itsAudit Committee’’ in the 2016 Proxy Statement, which information under such captions is incorporatedherein by reference.
ITEM 11. EXECUTIVE COMPENSATION
The information required by this Item 11 regarding director and executive officer compensation,the Compensation Committee Report, the risks arising from our compensation policies and practicesfor employees, and compensation committee interlocks and insider participation is contained under thecaptions ‘‘Director Compensation’’ and ‘‘Executive Compensation’’ in the 2016 Proxy Statement, whichinformation under such captions is incorporated herein by reference.
79

10-K
ITEM 12. SECURITY OWNERSHIP OF CERTAIN BENEFICIAL OWNERS AND MANAGEMENTAND RELATED STOCKHOLDER MATTERS
(a) Equity Compensation Plan Information. The following table sets forth information aboutsecurities authorized for issuance under our compensation plans (including individual compensationarrangements) as of January 29, 2016:
Number ofsecurities remainingavailable for future
Number of securities issuance underto be issued upon Weighted-average equity compensation
exercise of exercise price of plans (excludingoutstanding options, outstanding options, securities reflectedwarrants and rights warrants and rights in column (a))
Plan category (a) (b) (c)
Equity compensation plans approved bysecurity holders(1) . . . . . . . . . . . . . . . . . . . 3,539,160 $56.43 18,556,241
Equity compensation plans not approved bysecurity holders . . . . . . . . . . . . . . . . . . . . . — — —
Total(1) . . . . . . . . . . . . . . . . . . . . . . . . . . 3,539,160 $56.43 18,556,241
(1) Column (a) consists of shares of common stock issuable upon exercise of outstanding options andupon vesting and payment of share units and deferred shares, including dividend equivalentsaccrued thereon, under the Amended and Restated 2007 Stock Incentive Plan. Share units,deferred shares and dividend equivalents are settled for shares of common stock on a one-for-onebasis and have no exercise price. Accordingly, they have been excluded for purposes of computingthe weighted-average exercise price in column (b). Column (c) consists of shares reserved forissuance pursuant to the Amended and Restated 2007 Stock Incentive Plan, whether in the form ofstock, restricted stock, share units, or other share-based awards or upon the exercise of an optionor right.
(b) Other Information. The information required by this Item 12 regarding security ownership ofcertain beneficial owners and our management is contained under the caption ‘‘Security Ownership’’ inthe 2016 Proxy Statement, which information under such caption is incorporated herein by reference.
ITEM 13. CERTAIN RELATIONSHIPS AND RELATED TRANSACTIONS, AND DIRECTORINDEPENDENCE
The information required by this Item 13 regarding certain relationships and related transactions iscontained under the caption ‘‘Transactions with Management and Others’’ in the 2016 Proxy Statement,which information under such caption is incorporated herein by reference.
The information required by this Item 13 regarding director independence is contained under thecaption ‘‘Director Independence’’ in the 2016 Proxy Statement, which information under such caption isincorporated herein by reference.
ITEM 14. PRINCIPAL ACCOUNTING FEES AND SERVICES
The information required by this Item 14 regarding fees we paid to our principal accountant andthe pre-approval policies and procedures established by the Audit Committee of our Board of Directorsis contained under the caption ‘‘Fees Paid to Auditors’’ in the 2016 Proxy Statement, which informationunder such caption is incorporated herein by reference.
80

10-K
PART IV
ITEM 15. EXHIBITS AND FINANCIAL STATEMENT SCHEDULES
(a) Report of Independent Registered Public Accounting FirmConsolidated Balance SheetsConsolidated Statements of IncomeConsolidated Statements of Comprehensive IncomeConsolidated Statements of Shareholders’ EquityConsolidated Statements of Cash FlowsNotes to Consolidated Financial Statements
(b) All schedules for which provision is made in the applicable accounting regulations of the SEC arenot required under the related instructions, are inapplicable or the information is included in theConsolidated Financial Statements and, therefore, have been omitted.
(c) Exhibits: See Exhibit Index immediately following the signature pages hereto, which ExhibitIndex is incorporated by reference as if fully set forth herein.
81

10-K
SIGNATURES
Pursuant to the requirements of Section 13 or 15(d) of the Securities Exchange Act of 1934, theregistrant has duly caused this report to be signed on its behalf by the undersigned, thereunto dulyauthorized.
DOLLAR GENERAL CORPORATION
Date: March 22, 2016 By: /s/ TODD J. VASOS
Todd J. Vasos,Chief Executive Officer
We, the undersigned directors and officers of the registrant, hereby severally constitute Todd J.Vasos, John W. Garratt II and Anita C. Elliott, and each of them singly, our true and lawful attorneyswith full power to them and each of them to sign for us, and in our names in the capacities indicatedbelow, any and all amendments to this Annual Report on Form 10-K filed with the Securities andExchange Commission.
Pursuant to the requirements of the Securities Exchange Act of 1934, this report has been signedbelow by the following persons on behalf of the registrant and in the capacities and on the datesindicated.
Name Title Date
/s/ TODD J. VASOS Chief Executive Officer & Director March 22, 2016(Principal Executive Officer)TODD J. VASOS
Executive Vice President & Chief/s/ JOHN W. GARRATTFinancial Officer (Principal Financial March 22, 2016
JOHN W. GARRATT Officer)
Senior Vice President & Chief/s/ ANITA C. ELLIOTTAccounting Officer (Principal Accounting March 22, 2016
ANITA C. ELLIOTT Officer)
/s/ WARREN F. BRYANTDirector March 22, 2016
WARREN F. BRYANT
/s/ MICHAEL M. CALBERTDirector March 22, 2016
MICHAEL M. CALBERT
/s/ SANDRA B. COCHRANDirector March 22, 2016
SANDRA B. COCHRAN
82

10-K
Name Title Date
/s/ PATRICIA D. FILI-KRUSHELDirector March 22, 2016
PATRICIA D. FILI-KRUSHEL
/s/ PAULA A. PRICEDirector March 22, 2016
PAULA A. PRICE
/s/ WILLIAM C. RHODES, IIIDirector March 22, 2016
WILLIAM C. RHODES, III
/s/ DAVID B. RICKARDDirector March 22, 2016
DAVID B. RICKARD
83

10-K
EXHIBIT INDEX
3.1 Amended and Restated Charter of Dollar General Corporation (complete copy as amendedfor SEC filing purposes only) (incorporated by reference to Exhibit 3.1 to Dollar GeneralCorporation’s Quarterly Report on Form 10-Q for the quarter ended May 3, 2013, filedwith the SEC on June 4, 2013 (file no. 001-11421))
3.2 Amended and Restated Bylaws of Dollar General Corporation (incorporated by referenceto Exhibit 3.2 to Dollar General Corporation’s Current Report on Form 8-K datedNovember 18, 2009, filed with the SEC on November 18, 2009 (file no. 001-11421))
4.1 Form of Stock Certificate for Common Stock (incorporated by reference to Exhibit 4.1 toDollar General Corporation’s Registration Statement on Form S-1 (file no. 333-161464))
4.2 Form of 4.125% Senior Notes due 2017 (included in Exhibit 4.7)
4.3 Form of 1.875% Senior Notes due 2018 (included in Exhibit 4.8)
4.4 Form of 3.250% Senior Notes due 2023 (included in Exhibit 4.9)
4.5 Form of 4.150% Senior Notes due 2025 (included in Exhibit 4.10)
4.6 Indenture, dated as of July 12, 2012, between Dollar General Corporation, as issuer, andU.S. Bank National Association, as trustee (incorporated by reference to Exhibit 4.1 toDollar General Corporation’s Current Report on Form 8-K dated July 12, 2012, filed withthe SEC on July 17, 2012 (file no. 001-11421))
4.7 First Supplemental Indenture, dated as of July 12, 2012, among Dollar GeneralCorporation, as issuer, the subsidiary guarantors named therein, and U.S. Bank NationalAssociation, as trustee (incorporated by reference to Exhibit 4.2 to Dollar GeneralCorporation’s Current Report on Form 8-K dated July 12, 2012, filed with the SEC onJuly 17, 2012 (file no. 001-11421))
4.8 Third Supplemental Indenture, dated as of April 11, 2013, between Dollar GeneralCorporation, as issuer, and U.S. Bank National Association, as trustee (incorporated byreference to Exhibit 4.1 to Dollar General Corporation’s Current Report on Form 8-Kdated April 8, 2013 and filed with the SEC on April 11, 2013 (file no. 001-11421))
4.9 Fourth Supplemental Indenture, dated as of April 11, 2013, between Dollar GeneralCorporation, as issuer, and U.S. Bank National Association, as trustee (incorporated byreference to Exhibit 4.2 to Dollar General Corporation’s Current Report on Form 8-Kdated April 8, 2013 and filed with the SEC on April 11, 2013 (file no. 001-11421))
4.10 Fifth Supplemental Indenture, dated as of October 20, 2015, between Dollar GeneralCorporation, as issuer, and U.S. Bank National Association, as trustee (incorporated byreference to Exhibit 4.1 to Dollar General Corporation’s Current Report on Form 8-Kdated October 15, 2015, filed with the SEC on October 20, 2015 (file no. 001-11421))
4.11 Amended and Restated Credit Agreement, dated as of October 20, 2015, among DollarGeneral Corporation, as borrower, Citibank, N.A., as administrative agent, and the othercredit parties and lenders party thereto (incorporated by reference to Exhibit 4.3 to DollarGeneral Corporation’s Current Report on Form 8-K dated October 15, 2015 and filed withthe SEC on October 20, 2015 (file no. 001-11421))
84

10-K
10.1 Amended and Restated 2007 Stock Incentive Plan for Key Employees of Dollar GeneralCorporation and its Affiliates (effective June 1, 2012) (incorporated by reference toAppendix A to Dollar General Corporation’s Definitive Proxy Statement filed with the SECon April 5, 2012 (file no. 001-11421))*
10.2 Form of Stock Option Award Agreement (approved May 24, 2011) for awards made priorto December 2014 to certain newly hired and promoted employees of Dollar GeneralCorporation pursuant to the Amended and Restated 2007 Stock Incentive Plan(incorporated by reference to Exhibit 10.2 to Dollar General Corporation’s QuarterlyReport on Form 10-Q for the fiscal quarter ended April 29, 2011, filed with the SEC onJune 1, 2011 (file no. 001-11421))*
10.3 Form of Stock Option Award Agreement (approved March 20, 2012) for annual awardsbeginning March 20, 2012 and prior to March 2015 to certain employees of Dollar GeneralCorporation pursuant to the Amended and Restated 2007 Stock Incentive Plan(incorporated by reference to Exhibit 10.1 to Dollar General Corporation’s Current Reporton Form 8-K dated March 20, 2012, filed with the SEC on March 26, 2012 (fileno. 001-11421))*
10.4 Form of Stock Option Award Agreement (approved August 26, 2014) for annual awardsbeginning March 2015 and prior to March 2016 to certain employees of Dollar GeneralCorporation pursuant to the Amended and Restated 2007 Stock Incentive Plan(incorporated by reference to Exhibit 10.2 to Dollar General Corporation’s QuarterlyReport on Form 10-Q for the fiscal quarter ended October 31, 2014, filed with the SEC onDecember 4, 2014 (file no. 001-11421))*
10.5 Form of Stock Option Award Agreement (approved March 16, 2016) for awards beginningMarch 2016 to certain employees of Dollar General Corporation pursuant to the Amendedand Restated 2007 Stock Incentive Plan*
10.6 Form of Stock Option Award Agreement (approved August 26, 2014) for awards beginningDecember 2014 and prior to May 2016 to certain newly hired and promoted employees ofDollar General Corporation pursuant to the Amended and Restated 2007 Stock IncentivePlan (incorporated by reference to Exhibit 10.3 to Dollar General Corporation’s QuarterlyReport on Form 10-Q for the fiscal quarter ended October 31, 2014, filed with the SEC onDecember 4, 2014 (file no. 001-11421))*
10.7 Form of Performance Share Unit Award Agreement (approved March 20, 2012) for annualawards prior to March 2014 to certain employees of Dollar General Corporation pursuantto the Amended and Restated 2007 Stock Incentive Plan (incorporated by reference toExhibit 10.2 to Dollar General Corporation’s Current Report on Form 8-K dated March 20,2012, filed with the SEC on March 26, 2012 (file no. 001-11421))*
10.8 Form of Performance Share Unit Award Agreement (approved March 18, 2014) for annualawards beginning March 2014 and prior to March 2015 to certain employees of DollarGeneral Corporation pursuant to the Amended and Restated 2007 Stock Incentive Plan(incorporated by reference to Exhibit 10.3 to Dollar General Corporation’s QuarterlyReport on Form 10-Q for the fiscal quarter ended May 2, 2014, filed with the SEC onJune 3, 2014 (file no. 001-11421))*
85

10-K
10.9 Form of Performance Share Unit Award Agreement (approved August 26, 2014) for annualawards beginning March 2015 and prior to March 2016 to certain employees of DollarGeneral Corporation pursuant to the Amended and Restated 2007 Stock Incentive Plan(incorporated by reference to Exhibit 10.4 to Dollar General Corporation’s QuarterlyReport on Form 10-Q for the fiscal quarter ended October 31, 2014, filed with the SEC onDecember 4, 2014 (file no. 001-11421))*
10.10 Form of Performance Share Unit Award Agreement (approved March 16, 2016) for awardsbeginning March 2016 to certain employees of Dollar General Corporation pursuant to theAmended and Restated 2007 Stock Incentive Plan*
10.11 Form of Restricted Stock Unit Award Agreement (approved March 20, 2012) for annualawards made prior to March 2015 to certain employees of Dollar General Corporationpursuant to the Amended and Restated 2007 Stock Incentive Plan (incorporated byreference to Exhibit 10.3 to Dollar General Corporation’s Current Report on Form 8-Kdated March 20, 2012, filed with the SEC on March 26, 2012 (file no. 001-11421))*
10.12 Form of Restricted Stock Unit Award Agreement (approved March 17, 2015) for awardsbeginning March 2015 and prior to March 2016 to certain employees of Dollar GeneralCorporation pursuant to the Amended and Restated 2007 Stock Incentive Plan(incorporated by reference to Exhibit 10.2 to Dollar General Corporation’s QuarterlyReport on Form 10-Q for the fiscal quarter ended May 1, 2015, filed with the SEC onJune 2, 2015 (file no. 001-11421))*
10.13 Form of Restricted Stock Unit Award Agreement (approved March 16, 2016) for awardsbeginning March 2016 to certain employees of Dollar General Corporation pursuant to theAmended and Restated 2007 Stock Incentive Plan*
10.14 Waiver of Certain Limitations Set Forth in Option Agreements Pertaining to OptionsPreviously Granted under the Amended and Restated 2007 Stock Incentive Plan, effectiveAugust 26, 2010 (incorporated by reference to Exhibit 10.3 to Dollar General Corporation’sQuarterly Report on Form 10-Q for the fiscal quarter ended July 30, 2010, filed with theSEC on August 31, 2010 (file no. 001-11421))*
10.15 Waiver of Transfer Restrictions dated February 1, 2013 (incorporated by reference toExhibit 99 to Dollar General Corporation’s Current Report on Form 8-K dated February 1,2013, filed with the SEC on February 5, 2013 (file no. 001-11421))*
10.16 Form of Restricted Stock Unit Award Agreement for awards prior to May 24, 2011 tonon-employee directors of Dollar General Corporation pursuant to the Amended andRestated 2007 Stock Incentive Plan (incorporated by reference to Exhibit 10.15 to DollarGeneral Corporation’s Registration Statement on Form S-1 (file no. 333-161464))
10.17 Form of Restricted Stock Unit Award Agreement (approved May 24, 2011) for awards priorto May 29, 2014 to non-employee directors of Dollar General Corporation pursuant to theAmended and Restated 2007 Stock Incentive Plan (incorporated by reference toExhibit 10.3 to Dollar General Corporation’s Quarterly Report on Form 10-Q for the fiscalquarter ended April 29, 2011, filed with the SEC on June 1, 2011 (file no. 001-11421))
10.18 Form of Restricted Stock Unit Award Agreement (approved May 28, 2014) for awardsbeginning May 29, 2014 and prior to February 2015 to non-employee directors of DollarGeneral Corporation pursuant to the Amended and Restated 2007 Stock Incentive Plan(incorporated by reference to Exhibit 10.4 to Dollar General Corporation’s QuarterlyReport on Form 10-Q for the fiscal quarter ended May 2, 2014, filed with the SEC onJune 3, 2014 (file no. 001-11421))
86

10-K
10.19 Form of Restricted Stock Unit Award Agreement (approved December 3, 2014) for awardsbeginning February 2015 to non-employee directors of Dollar General Corporation pursuantto the Amended and Restated 2007 Stock Incentive Plan (incorporated by reference toExhibit 10.7 to Dollar General Corporation’s Quarterly Report on Form 10-Q for the fiscalquarter ended October 31, 2014, filed with the SEC on December 4, 2014 (fileno. 001-11421))
10.20 Form of Restricted Stock Unit Award Agreement (approved January 26, 2016) for awardsbeginning February 1, 2016 to non-executive Chairmen of the Board of Directors of DollarGeneral Corporation pursuant to the Amended and Restated 2007 Stock Incentive Plan
10.21 Form of Stock Option Award Agreement for awards to non-employee directors of DollarGeneral Corporation pursuant to the Amended and Restated 2007 Stock Incentive Plan(incorporated by reference to Exhibit 10.16 to Dollar General Corporation’s RegistrationStatement on Form S-1 (file no. 333-161464))
10.22 Dollar General Corporation CDP/SERP Plan (as amended and restated effectiveDecember 31, 2007) (incorporated by reference to Exhibit 10.10 to Dollar GeneralCorporation’s Registration Statement on Form S-4 (file no. 333-148320))*
10.23 First Amendment to the Dollar General Corporation CDP/SERP Plan (as amended andrestated effective December 31, 2007) (incorporated by reference to Exhibit 10.11 to DollarGeneral Corporation’s Registration Statement on Form S-4 (file no. 333-148320))*
10.24 Second Amendment to the Dollar General Corporation CDP/SERP Plan (as amended andrestated effective December 31, 2007), dated as of June 3, 2008 (incorporated by referenceto Exhibit 10.6 to Dollar General Corporation’s Quarterly Report on Form 10-Q for thequarter ended August 1, 2008, filed with the SEC on September 3, 2008 (fileno. 001-11421))*
10.25 Dollar General Corporation Non-Employee Director Deferred Compensation Plan(approved December 3, 2014) (incorporated by reference to Exhibit 10.6 to Dollar GeneralCorporation’s Quarterly Report on Form 10-Q for the fiscal quarter ended October 31,2014, filed with the SEC on December 4, 2014 (file no. 001-11421))
10.26 Amended and Restated Dollar General Corporation Annual Incentive Plan (effectiveJune 1, 2012) (incorporated by reference to Appendix B to the Dollar GeneralCorporation’s Definitive Proxy Statement filed with the SEC on April 5, 2012 (fileno. 001-11421))*
10.27 Dollar General Corporation 2015 Teamshare Bonus Program for Named Executive Officers(incorporated by reference to Exhibit 10.1 to Dollar General Corporation’s QuarterlyReport on Form 10-Q for the fiscal quarter ended May 1, 2015, filed with the SEC onJune 2, 2015 (file no. 001-11421))*
10.28 Summary of Dollar General Corporation Life Insurance Program as Applicable toExecutive Officers (incorporated by reference to Exhibit 10.19 to Dollar GeneralCorporation’s Annual Report on Form 10-K for the fiscal year ended February 2, 2007,filed with the SEC on March 29, 2007) (file no. 001-11421))*
10.29 Dollar General Corporation Executive Relocation Policy, as amended (effective July 16,2014) (incorporated by reference to Exhibit 10.1 to Dollar General Corporation’s QuarterlyReport on Form 10-Q for the fiscal quarter ended August 1, 2014, filed with the SEC onAugust 28, 2014 (file no. 001-11421))*
87

10-K
10.30 Dollar General Corporation Executive Relocation Policy, as amended (effectiveSeptember 22, 2015) (incorporated by reference to Exhibit 10.2 to Dollar GeneralCorporation’s Quarterly Report on Form 10-Q for the fiscal quarter ended October 30,2015, filed with the SEC on December 3, 2015 (file no. 001-11421))*
10.31 Summary of Non-Employee Director Compensation effective January 30, 2016
10.32 Employment Transition Agreement, effective March 10, 2015, between Dollar GeneralCorporation and Richard W. Dreiling (incorporated by reference to Exhibit 99 to DollarGeneral Corporation’s Current Report on Form 8-K dated March 10, 2015, filed with theSEC on March 13, 2015 (file no. 001-11421))*
10.33 Restricted Stock Unit Award Agreement, dated March 17, 2015, between Dollar GeneralCorporation and Richard W. Dreiling (incorporated by reference to Exhibit 99 to DollarGeneral Corporation’s Current Report on Form 8-K dated March 17, 2015, filed with theSEC on March 19, 2015 (file no. 001-11421))*
10.34 Employment Agreement, effective April 1, 2012, between Dollar General Corporation andDavid M. Tehle (incorporated by reference to Exhibit 99.1 to Dollar General Corporation’sCurrent Report on Form 8-K dated April 16, 2012, filed with the SEC on April 19, 2012(file no. 001-11421))*
10.35 Amendment to Employment Agreement, effective March 18, 2014, between Dollar GeneralCorporation and David M. Tehle (incorporated by reference to Exhibit 10.32 to DollarGeneral Corporation’s Annual Report on Form 10-K for the fiscal year ended January 31,2014, filed with the SEC on March 20, 2014 (file no. 001-11421))*
10.36 Employment Agreement, effective June 3, 2015, between Dollar General Corporation andTodd J. Vasos (incorporated by reference to Exhibit 99.3 to Dollar General Corporation’sCurrent Report on Form 8-K dated May 27, 2015, filed with the SEC on May 28, 2015 (fileno. 001-11421))*
10.37 Form of Stock Option Award Agreement between Dollar General Corporation and Todd J.Vasos for June 3, 2015 award (incorporated by reference to Exhibit 99.2 to Dollar GeneralCorporation’s Current Report on Form 8-K dated May 27, 2015, filed with the SEC onMay 28, 2015 (file no. 001-11421))*
10.38 Form of Stock Option Award Agreement between Dollar General Corporation and Todd J.Vasos (approved March 16, 2016)*
10.39 Employment Agreement, effective April 1, 2015, between Dollar General Corporation andJohn W. Garratt (incorporated by reference to Exhibit 10.3 to Dollar General Corporation’sQuarterly Report on Form 10-Q for the fiscal quarter ended May 1, 2015, filed with theSEC on June 2, 2015 (file no. 001-11421))*
10.40 Employment Agreement, effective December 2, 2015, between Dollar General Corporationand John W. Garratt (incorporated by reference to Exhibit 99.2 to Dollar GeneralCorporation’s Current Report on Form 8-K dated December 2, 2015, filed with the SEC onDecember 3, 2015 (file no. 001-11421))*
10.41 Employment Agreement, effective November 1, 2013, between Dollar General Corporationand David W. D’Arezzo (incorporated by reference to Exhibit 10.37 to Dollar GeneralCorporation’s Annual Report on Form 10-K for the fiscal year ended January 31, 2014,filed with the SEC on March 20, 2014 (file no. 001-11421))*
88

10-K
10.42 Employment Agreement, effective August 10, 2015, between Dollar General Corporationand John W. Flanigan (incorporated by reference to Exhibit 10.6 to Dollar GeneralCorporation’s Quarterly Report on Form 10-Q for the fiscal quarter ended July 31, 2015,filed with the SEC on August 27, 2015 (file no. 001-11421))*
10.43 Employment Agreement, effective August 10, 2015, between Dollar General Corporationand Robert D. Ravener (incorporated by reference to Exhibit 10.5 to Dollar GeneralCorporation’s Quarterly Report on Form 10-Q for the fiscal quarter ended July 31, 2015,filed with the SEC on August 27, 2015 (file no. 001-11421))*
10.44 Stock Option Agreement, dated as of August 28, 2008, between Dollar General Corporationand Robert D. Ravener (incorporated by reference to Exhibit 10.40 to Dollar GeneralCorporation’s Annual Report on Form 10-K for the fiscal year ended January 28, 2011,filed with the SEC on March 22, 2011 (file no. 001-11421))*
10.45 Stock Option Agreement, dated as of December 19, 2008, between Dollar GeneralCorporation and Robert D. Ravener (incorporated by reference to Exhibit 10.41 to DollarGeneral Corporation’s Annual Report on Form 10-K for the fiscal year ended January 28,2011, filed with the SEC on March 22, 2011 (file no. 001-11421))*
10.46 Stock Option Agreement, dated as of March 24, 2010, between Dollar General Corporationand Robert D. Ravener (incorporated by reference to Exhibit 10.42 to Dollar GeneralCorporation’s Annual Report on Form 10-K for the fiscal year ended January 28, 2011,filed with the SEC on March 22, 2011 (file no. 001-11421))*
10.47 Employment Agreement, effective August 10, 2015, between Dollar General Corporationand Rhonda M. Taylor (incorporated by reference to Exhibit 10.4 to Dollar GeneralCorporation’s Quarterly Report on Form 10-Q for the fiscal quarter ended July 31, 2015,filed with the SEC on August 27, 2015 (file no. 001-11421))*
10.48 Stock Option Agreement, dated March 24, 2010, between Dollar General Corporation andRhonda M. Taylor*
10.49 Employment Agreement, effective June 15, 2015, between Dollar General Corporation andJeffery C. Owen (incorporated by reference to Exhibit 10.7 to Dollar General Corporation’sQuarterly Report on Form 10-Q for the fiscal quarter ended October 30, 2015, filed withthe SEC on December 3, 2015 (file no. 001-11421))*
10.50 Employment Agreement, effective August 7, 2015, between Dollar General Corporation andJames W. Thorpe (incorporated by reference to Exhibit 10.6 to Dollar GeneralCorporation’s Quarterly Report on Form 10-Q for the fiscal quarter ended October 30,2015, filed with the SEC on December 3, 2015 (file no. 001-11421))*
10.51 Employment Agreement, effective December 2, 2015, between Dollar General Corporationand Anita C. Elliott (incorporated by reference to Exhibit 99.3 to Dollar GeneralCorporation’s Current Report on Form 8-K dated December 2, 2015, filed with the SEC onDecember 3, 2015 (file no. 001-11421))*
10.52 Omnibus Limited Waiver by Dollar General Corporation to the Employment Agreementand Employment Transition Agreement with certain employees of Dollar GeneralCorporation, effective January 28, 2016*
10.53 Employment Agreement, effective March 19, 2012, between Dollar General Corporationand Gregory A. Sparks (incorporated by reference to Exhibit 10.4 to Dollar GeneralCorporation’s Quarterly Report on Form 10-Q for the fiscal quarter ended May 4, 2012,filed with the SEC on June 4, 2012 (file no. 001-11421))*
89

12 Calculation of Fixed Charge Ratio
21 List of Subsidiaries of Dollar General Corporation
23 Consent of Independent Registered Public Accounting Firm
24 Powers of Attorney (included as part of the signature pages hereto)
31 Certifications of CEO and CFO under Exchange Act Rule 13a-14(a)
32 Certifications of CEO and CFO under 18 U.S.C. 1350
101.INS XBRL Instance Document
101.SCH XBRL Taxonomy Extension Schema Document
101.CAL XBRL Taxonomy Extension Calculation Linkbase Document
101.LAB XBRL Taxonomy Extension Labels Linkbase Document
101.PRE XBRL Taxonomy Extension Presentation Linkbase Document
101.DEF XBRL Taxonomy Extension Definition Linkbase Document
* Management Contract or Compensatory Plan
90
10-K

(This page has been left blank intentionally.)

Michael M. Calbert (1)†Retired MemberKohlberg Kravis Roberts & Co.
Warren F. Bryant (2)(3)*†Retired Chairman, President &Chief Executive OfficerLongs Drug Stores Corporation
Sandra B. Cochran (2)(4)†President & Chief Executive OfficerCracker Barrel Old Country Store, Inc.
Patricia D. Fili-Krushel (3)(4)†Former Executive Vice President NBCUniversal
Paula A. Price (2)†Senior LecturerHarvard Business School
William C. Rhodes, III (3)(4)*†Chairman, President & Chief Executive OfficerAutoZone, Inc.
David B. Rickard (2)*†Retired Executive Vice President, Chief Financial Officer & Chief Administrative OfficerCVS Health Corporation
Todd J. Vasos†Chief Executive OfficerDollar General Corporation
DIRECTORS
Executive Vice Presidents
John W. Flanigan†Global Supply Chain
John W. Garratt†Chief Financial Officer
Jeffery C. Owen†Store Operations
Robert D. Ravener†Chief People Officer
Rhonda M. Taylor†General Counsel
James W. Thorpe†Chief Merchandising Officer
Senior Vice Presidents
Ryan G. BooneChief Information Officer
Steven R. DeckardCorporate Store Operations
Anita C. Elliott†Chief Accounting Officer
Lawrence J. GattaGeneral Merchandise ManagerConsumables
Stephen P. JacobsonGlobal Sourcing Operations
Michael J. KindyGlobal Supply Chain
James E. KoppGlobal Strategic Sourcing
Cynthia A. LongGeneral Merchandise ManagerNon-Consumables (Home & Apparel)
Daniel J. NieserReal Estate & Store Development
Steven G. SunderlandStore Operations
Emily C. TaylorGeneral Merchandise ManagerNon-Consumables (Seasonal, Stationery & HBC)
Transfer AgentWells Fargo Bank, N.A., Shareowner ServicesPO Box 64854, St. Paul, MN 55164-0854www.wellsfargo.com/shareownerservices
Inquiries regarding stock transfers, lost certificates or address changes should be directed to the transfer agent at the address or website noted above or by calling (800) 468-9716.
Direct Stock Purchase PlanWells Fargo Shareowner Services sponsors and administers a direct purchase plan for the shares of Dollar General Corporation. Information on the plan, a copy of the prospectus and enrollment forms are located at www.shareowneronline.com, or you may contact our transfer agent by calling (866) 927-3314 or at our transfer agent’s mailing address above.
Independent Registered Public Accounting FirmErnst & Young LLP, Nashville, Tennessee
Form 10-K; SEC CertificationsA copy of the Form 10-K filed by the Company with the Securities and Exchange Commission (the “SEC”) for the fiscal year ended January 29, 2016, which includes as exhibits the Chief Executive Officer and Chief Financial Officer Certifications required to be filed with the SEC pursuant to Section 302 of the Sarbanes-Oxley Act, is available on our website at www.dollargeneral.com in the Investor Information section or on the SEC’s website.
A printed copy of the Form 10-K, and a list of all its exhibits, will be supplied without charge to any shareholder upon written request. Exhibits to the Form 10-K are available for a reasonable fee. For a printed copy of the Form 10-K, please contact:
Dollar General CorporationInvestor Relations
100 Mission Ridge, Goodlettsville, Tennessee 37072(615) 855-4000
CORPORATE INFORMATION
OFFICERSTodd J. Vasos†Chief Executive Officer
† Indicates person subject to the provisions of Section 16 of the Securities and Exchange Act of 1934.
(1) Chairman of the Board (2) Audit Committee (3) Compensation Committee (4) Nominating & Governance Committee (*) Committee Chairman

ANNUAL MEETINGDollar General Corporation’s annual meeting of share-
holders is scheduled for 9:00 a.m. Central Time on
Wednesday May 25, 2016, at:
Goodlettsville City Hall Auditorium
105 South Main Street, Goodlettsville, TN 37072
Shareholders of record as of March 17, 2016 are entitled
to vote at the meeting.
NYSE: DGThe common stock of Dollar General Corporation is
traded on the New York Stock Exchange under the trading
symbol “DG.” The number of shareholders of record as of
March 17, 2016 was 1,879.
STOCK PERFORMANCE GRAPHThe graph below shows a comparison of Dollar General’s
cumulative total shareholder return on common stock
with the cumulative total returns of the S&P 500 index
and the S&P Retailing index. The graph tracks the per-
formance of a $100 investment in Dollar General com-
mon stock and in each index (with the reinvestment of
all dividends) from January 28, 2011 to January 29, 2016.
COMPARISON OF CUMULATIVE TOTAL RETURN
The stock price performance included in this graph is not necessarily indicative of future stock price performance.
S&P Retailing IndexS&P 500 Index
$150
$200
$100
$250
$300
1/28/11 2/3/12 2/1/13 1/31/14 1/30/15 1/29/16
Dollar General Corporation
$147.68
$115.66
$104.22 $121.71
$149.35
$162.96 $198.31
$147.89
$189.57
$236.13
$168.93
$227.53
$266.71
$167.81
$266.59
Dollar General
S&P 500 Index
S&P Retailing Index
$100
$100
$100
1/28/11 2/3/12 2/1/13 1/31/14 1/30/15 1/29/16
Cautionary Language Regarding Forward-Looking Statements: All forward-looking information in this report should be read with, and is qualifi ed in its entirety by, the Cautionary Disclosure Regarding Forward-Looking Statements and the Risk Factors disclosures set forth in the Introduction and in Item 1A, respectively, of the Form 10-K included elsewhere in this report.
The information contained on or connected to our Internet websites is not incorporated by reference into this report and should not be considered part of this or any other report that we fi le with or furnish to the SEC.
$20.4
2015
$14.8
2011
$16.0
2012
$17.5
2013
$18.9
2014
11,789
2014
12,483
2015
9,937
2011
10,506
2012
11,132
2013
$4,709
2014
$6,087
2015
$1,050
2011
$2,181
2012
$3,394
2013
2.8%
2014
2.8%
2015
6.0%
2011
4.7%
2012
3.3%
2013
NET SALES (IN BILLIONS)
ENDING STORE COUNT
SAME-STORE SALES GROWTH
Fiscal 2011 includes 53 weeks, while all other years presented contain 52 weeks. Sales in the 2011 53rd
week were $289 million.
Dollar General Corporation has been delivering value to shoppers for over 75 years. Dollar General helps shoppers Save time. Save money. Every day!® by o� ering products that are frequently used and replenished, such as food, snacks, health and beauty aids, cleaning supplies, clothing for the family, housewares and seasonal items at low everyday prices in convenient neighborhood locations. With 12,483 stores in 43 states as of January 29, 2016, Dollar General is among the largest discount retailers
in the United States. In addition to high quality private brands, Dollar General sells products from America’s most-trusted manufacturers such as Procter & Gamble, Kimberly-Clark, Unilever, Kellogg’s, General Mills, Nabisco, Hanes, PepsiCo and Coca-Cola.
Learn more about Dollar Generaland shop online at:
www.dollargeneral.com
ABOUT DOLLAR GENERAL
336
654
89362
164 31
28
41
733
708
188
451 428
210456
493
22
41113
14
353
66
436
411
666644
1,296
389
658
334198
457
24
7
5
97
24
80
555
30016
28
223
28
4187
126
STORES
DISTRIBUTION CENTER
12,483TOTAL STORES | TOTAL STATES: 43
as of January 29, 2016
CUMULATIVE CASH FROM OPERATIONS (IN MILLIONS)
12,483TOTAL STORES | TOTAL STATES: 43
as of January 29, 2016

Dollar G
eneral Corporation • 20
15 Annual R
eport and 2016 Proxy Statem
ent
2015ANNUALREPORT
100 Mission RidgeGoodlettsville, Tennessee 37072
(615) 855-4000www.dollargeneral.com
AND 2016 PROXY STATEMENT