Embed Size (px)
Citation preview

2012
Annual Report
Lam
Res
earc
h Co
rpor
atio
n 2
012
Annu
al R
epor
t
Lam Research Corporation4650 Cushing ParkwayFremont, California 94538
Phone: 1.510.572.0200www.lamresearch.com

2300® Kiyo® Conductor Etch Family
2300® Flex™ Dielectric Etch Family
2300® Versys® Metal Metal Etch Family
2300® Syndion® TSV Etch Family
TCP® 9400DSiE™
MEMS/Deep SiliconEtch Family
VECTOR® PECVD Family
SPEED® HDP-CVD Family
ALTUS® W-CVD Family
SABRE® ECD Family
INOVA® PVD Family
SOLA® UVTP Family
etch
depo
sitio
nprod
ucts EXECUTIVE OFFICERS
Martin B. Anstice President and Chief Executive Officer
Timothy M. Archer Chief Operating Officer
Ernest E. Maddock Senior Vice President and Chief Financial Officer
Richard A. Gottscho, Ph.D. Senior Vice President, Global Products
Sarah A. O’Dowd, Esq. Group Vice President, Chief Legal Officer
Stephen G. Newberry Vice Chairman
BOARD OF DIRECTORS
James W. Bagley Chairman
Stephen G. Newberry Vice Chairman
Martin B. Anstice President and Chief Executive Officer
Robert M. Berdahl, Ph.D. President Emeritus, Association of American Universities
Eric K. Brandt Executive Vice President and Chief Financial Officer, Broadcom Corporation
Michael R. Cannon General Partner, MRC & LBC Partners, LLC
Youssef A. El-Mansy, Ph.D. Vice President, Director of Logic Technology Development, Intel Corporation (retired)
Christine A. Heckart Chief Marketing Officer, ServiceSource
Grant M. Inman General Partner, Inman Investment Management
Catherine P. Lego Member, Lego Ventures, LLC
Kim E. Perdikou Executive Vice President, Office of the Chief Executive Officer, Juniper Networks
Krishna C. Saraswat, Ph.D. Rickey/Nielsen Professor, School of Engineering, Stanford University
William R. Spivey, Ph.D. President and Chief Executive Officer, Luminent, Inc. (retired)
Abhijit Y. Talwalkar President and Chief Executive Officer, LSI Corporation
Delbert A. Whitaker Senior Vice President, Worldwide Analog and Standard Logic, Texas Instruments, Inc. (retired)
© 2012 Lam Research Corporation.
All rights reserved.
201209-05608/7K

GxT®
G400®
G3D™ Standalone Strip
Strip45™
Microwave Stripper Integrated Strip
DV-Prime®
Da Vinci®
SP Series Spin Wet Clean
2300® Coronus® Plasma Bevel Clean
Service
Spares
Upgrades
Refurbishment
Legacy Products
Technical Training
cust
omer
sup
port
strip
& c
lean
TSV = through-silicon via; MEMS = micro-electromechanical systems; PECVD = plasma-enhanced chemical vapor deposition; HDP-CVD = high-density plasma chemical vapor deposition; W-CVD = tungsten chemical vapor deposition; ECD = electrochemical deposition; PVD = physical vapor deposition; UVTP = ultraviolet thermal processing
dire
ctor
y INDEPENDENT REGISTERED PUBLIC
ACCOUNTING FIRM Ernst & Young LLP
San Jose, California
LEGAL COUNSEL Jones Day San Francisco, California
TRANSFER AGENT AND REGISTRAR For a response to questions regarding misplaced stock certificates, changes of address, or the consolidation of accounts, please contact the company’s transfer agent.
Computershare Shareowner Services P.O. Box 43006 Providence, RI 02940-3006 1.877.265.2630
TDD for Hearing Impaired: 1.800.231.5469
Foreign Shareowners: 1.201.680.6578
TDD Foreign Shareowners: 1.201.680.6610
Website Address: www.computershare.com/investor
STOCK LISTING The company’s common stock is traded on the NASDAQ Global Select MarketSM under the symbol LRCX. Lam Research is an S&P 500® and NASDAQ-100® company.
INVESTOR RELATIONS Lam Research Corporation welcomes inquiries from its stockholders and other interested investors. For additional copies of this report or other financial information, please contact:
Investor Relations Lam Research Corporation 4650 Cushing Parkway Fremont, California 94538 1.510.572.1615 [email protected]
ANNUAL MEETING The Annual Meeting of Stockholders will be held at 11:00 a.m. Pacific Time on Thursday, November 1, 2012, at the company’s corporate headquarters.
CAUTIONS REGARDING FORwARD-LOOKING
STATEMENTS With the exception of historical facts, the statements contained in this Letter to Our Stockholders (“Letter”) are forward-looking statements. Forward-looking statements are subject to the safe harbor provisions created by the Private Securities Litigation Reform Act of 1995. We have identified certain, but not necessarily all, of the forward-looking statements in the Letter by use of future-oriented words and phrases such as “next several years”, “potential”, “will”, “expect”, and “should”. However, our identification of certain statements as forward-looking does not mean that other statements not specifically identified are not forward-looking. Forward-looking statements include, but are not limited to, statements that relate to: our general prospects for the future; projections of future market opportunities for our etch, single-wafer clean, and deposition products and our prospects for market share expansion and growth opportunities for our existing and prospective customers; projections for cost savings; expectations for future share repurchases; prospects for accretion in conjunction with our acquisition of Novellus Systems; prospects for successful leadership transitions; the health of semiconductor demand; the company’s ability to sustain a competitive advantage; and the strengthening of our end markets. These statements are based on current expectations and are subject to risks, uncertainties, and changes in condition, significance, value and effect, including without limitation those discussed under the heading “Risk Factors” within Item 1A of our fiscal 2011 Form 10-K; under the heading “Cautionary Statement Regarding Forward-Looking Statements” at the beginning of Part I of the Form 10-K; and other documents we file from time to time with the Securities and Exchange Commission (SEC), such as our quarterly reports on Form 10-Q and current reports on Form 8-K. These risks, uncertainties and changes in condition, significance, value and effect could cause our actual results to differ materially from those expressed in this Letter and in ways that are not readily foreseeable. Readers are cautioned not to place undue reliance on these forward-looking statements, which speak only as of the date of this Letter and are based on information currently and reasonably known to us. We do not undertake any obligation to update any forward-looking statements, or to release the results of any revisions to these forward-looking statements, to reflect the impact of anticipated or unanticipated events or circumstances that occur after the date of this Letter.
TRADEMARK INFORMATION The Lam Research logo, Lam Research, and all Lam Research product and service names used in this report are either registered trademarks or trademarks of Lam Research Corporation in the United States and/or other countries. All other marks mentioned herein are the property of their respective owners.

lette
r
The semiconductor capital equipment industry has been, and continues to be, a key enabler for the creation
of the electronic products that are transforming our everyday lives. This paradigm has been particularly evident
at Lam Research in the last 12 months. Just before the end of our fiscal year, we closed our acquisition of
Novellus Systems. This accomplishment brought together two great companies and two solid management
teams in what we believe will be a landmark transaction for our industry, our customers, and our investors.
In addition, for the second time in the company’s history, we promoted a new CEO from within our executive
ranks. This passing of the baton—a more appropriate analogy than the oft-heard “changing of the guard”—
underscores the importance of Lam’s culture of cultivating, growing, and retaining a strong talent pool within
the organization. Leveraging the strengths of the combined executive leadership team, we are working together
to help our customers solve the ever more complex technical challenges that they face.
We are building on our successful strategy of expanding into adjacent markets with Novellus’ leadership in
the thin film deposition and wafer surface preparation markets complementing Lam’s leadership in etch and
single-wafer clean technologies. This combination nearly doubles the size of Lam’s served markets to
approximately 30 percent of wafer fabrication equipment spending. Moreover, Lam is now broadly positioned
in each of the top 10 semiconductor manufacturers, and our comprehensive product portfolio and process
knowledge make available exciting opportunities for market share expansion and accelerated growth.
Historically, semiconductor device manufacturers have been able to deliver more functionality and performance
at lower power and lower cost with each successive technology node. The Novellus transaction comes at a
time when our customers are faced with unprecedented technology challenges and cost pressures posed by
next-generation chip designs. By combining forces in this environment, Lam and Novellus are establishing the
scope and scale to further enhance our relevance to our customers while efficiently supporting investments
necessary to position the company for future growth.
The potential value creation resulting from this transaction is significant, and we are focused on realizing
those opportunities. We have already made meaningful progress toward integrating organizations and business
processes and have identified and are executing to our objectives relating to cost synergies. More importantly,
we believe we have the opportunity to achieve revenue synergies that exceed our cost savings as we harness
the innovation, capability, and complementary nature of our combined businesses.
In fiscal 2012, macroeconomic conditions negatively impacted electronics demand. As a result, we saw a
pause in semiconductor equipment spending as customers slowed the pace of their capacity investments.
In this environment, Lam generated $2.7 billion in revenue for the fiscal year and $1.35 in diluted per share
earnings. We achieved strong cash flow generation, which enabled us to begin executing on the $1.6 billion
share repurchase plan that accelerates the accretion of the acquisition. Overall, we returned approximately
$0.9 billion dollars to our shareholders through stock repurchases and increased our cash and short-term
investments from the prior year end to $2.9 billion.
Looking ahead, our combined organization is energized and focused on “Innovative Technology, Trusted
Productivity, Fast Solutions”. This theme conveys our commitment to deliver best-of-breed technology and
productivity solutions, to accelerate that delivery by leveraging our adjacent technologies, and to enhance
our complementary customer relationships through a strengthened global organization. We believe these
capabilities exemplify the focus of our company and define the strategic priority for strengthening competitive
differentiation.
As we reflect on what has certainly been a transformative year for the company, we also pause to recognize
the end of an extraordinary era in Lam’s history. In late August, Jim announced his decision to retire from
the industry and will step down as chairman of the board on November 1, 2012. During his 16-year tenure,
Jim’s passion and leadership propelled Lam to the forefront of the semiconductor equipment industry. We are
pleased that Steve Newberry has been named Jim’s successor as chairman of the board, further assuring the
leadership continuity that has defined our organization for many years.
In closing, we want to extend an enthusiastic welcome to the Novellus employees who have joined
Lam Research. We would also like to express our sincere gratitude to the entire Lam organization for their
tremendous efforts and dedication, our customers for their collaboration and support, and our stockholders
for your interest and investment in us.
Sincerely,
Martin B. Anstice
President and Chief Executive Officer
SEPTEMBER 5, 2012
James W. Bagley
Chairman of the Board
To Our Stockholders

GxT®
G400®
G3D™ Standalone Strip
Strip45™
Microwave Stripper Integrated Strip
DV-Prime®
Da Vinci®
SP Series Spin Wet Clean
2300® Coronus® Plasma Bevel Clean
Service
Spares
Upgrades
Refurbishment
Legacy Products
Technical Training
cust
omer
sup
port
strip
& c
lean
TSV = through-silicon via; MEMS = micro-electromechanical systems; PECVD = plasma-enhanced chemical vapor deposition; HDP-CVD = high-density plasma chemical vapor deposition; W-CVD = tungsten chemical vapor deposition; ECD = electrochemical deposition; PVD = physical vapor deposition; UVTP = ultraviolet thermal processing
dire
ctor
y INDEPENDENT REGISTERED PUBLIC
ACCOUNTING FIRM Ernst & Young LLP
San Jose, California
LEGAL COUNSEL Jones Day San Francisco, California
TRANSFER AGENT AND REGISTRAR For a response to questions regarding misplaced stock certificates, changes of address, or the consolidation of accounts, please contact the company’s transfer agent.
Computershare Shareowner Services P.O. Box 43006 Providence, RI 02940-3006 1.877.265.2630
TDD for Hearing Impaired: 1.800.231.5469
Foreign Shareowners: 1.201.680.6578
TDD Foreign Shareowners: 1.201.680.6610
Website Address: www.computershare.com/investor
STOCK LISTING The company’s common stock is traded on the NASDAQ Global Select MarketSM under the symbol LRCX. Lam Research is an S&P 500® and NASDAQ-100® company.
INVESTOR RELATIONS Lam Research Corporation welcomes inquiries from its stockholders and other interested investors. For additional copies of this report or other financial information, please contact:
Investor Relations Lam Research Corporation 4650 Cushing Parkway Fremont, California 94538 1.510.572.1615 [email protected]
ANNUAL MEETING The Annual Meeting of Stockholders will be held at 11:00 a.m. Pacific Time on Thursday, November 1, 2012, at the company’s corporate headquarters.
CAUTIONS REGARDING FORwARD-LOOKING
STATEMENTS With the exception of historical facts, the statements contained in this Letter to Our Stockholders (“Letter”) are forward-looking statements. Forward-looking statements are subject to the safe harbor provisions created by the Private Securities Litigation Reform Act of 1995. We have identified certain, but not necessarily all, of the forward-looking statements in the Letter by use of future-oriented words and phrases such as “next several years”, “potential”, “will”, “expect”, and “should”. However, our identification of certain statements as forward-looking does not mean that other statements not specifically identified are not forward-looking. Forward-looking statements include, but are not limited to, statements that relate to: our general prospects for the future; projections of future market opportunities for our etch, single-wafer clean, and deposition products and our prospects for market share expansion and growth opportunities for our existing and prospective customers; projections for cost savings; expectations for future share repurchases; prospects for accretion in conjunction with our acquisition of Novellus Systems; prospects for successful leadership transitions; the health of semiconductor demand; the company’s ability to sustain a competitive advantage; and the strengthening of our end markets. These statements are based on current expectations and are subject to risks, uncertainties, and changes in condition, significance, value and effect, including without limitation those discussed under the heading “Risk Factors” within Item 1A of our fiscal 2011 Form 10-K; under the heading “Cautionary Statement Regarding Forward-Looking Statements” at the beginning of Part I of the Form 10-K; and other documents we file from time to time with the Securities and Exchange Commission (SEC), such as our quarterly reports on Form 10-Q and current reports on Form 8-K. These risks, uncertainties and changes in condition, significance, value and effect could cause our actual results to differ materially from those expressed in this Letter and in ways that are not readily foreseeable. Readers are cautioned not to place undue reliance on these forward-looking statements, which speak only as of the date of this Letter and are based on information currently and reasonably known to us. We do not undertake any obligation to update any forward-looking statements, or to release the results of any revisions to these forward-looking statements, to reflect the impact of anticipated or unanticipated events or circumstances that occur after the date of this Letter.
TRADEMARK INFORMATION The Lam Research logo, Lam Research, and all Lam Research product and service names used in this report are either registered trademarks or trademarks of Lam Research Corporation in the United States and/or other countries. All other marks mentioned herein are the property of their respective owners.

4650 Cushing ParkwayFremont, California 94538Telephone: 510-572-0200
NOTICE OF 2012 ANNUAL MEETING OF STOCKHOLDERS
DATE AND TIME Thursday, November 1, 2012 at 11:00 a.m. local time
PLACE Principal executive offices of Lam Research Corporation, 4650 Cushing Parkway,Fremont, California 94538
INTERNET Listen to the annual meeting online by clicking on the Calendar/Webcasts link athttp://investor.lamresearch.com. The proxy materials are also available at thatwebsite and at proxyvote.com.
AGENDA Vote on Proposal No. 1: Election of directors to serve for the ensuing year, anduntil their respective successors are elected and qualified
Vote on Proposal No. 2: Advisory vote on fiscal year 2012 executivecompensation (“Say on Pay”)
Vote on Proposal No. 3: Ratification of the appointment of independent registeredpublic accounting firm for fiscal year 2013
Transact other business that may properly come before the annual meeting(including any adjournment or postponement)
RECORD DATE September 7, 2012. Only stockholders of record at the close of business on theRecord Date are entitled to notice of and to vote at the annual meeting.
VOTING Please vote as soon as possible, even if you plan to attend the annual meeting inperson. You have three options for submitting your vote before the annual meeting:by the internet, phone or mail. The proxy statement and the accompanying proxycard provide detailed voting instructions.
By Order of the Board of Directors
Sarah A. O’DowdSecretary
This proxy statement is first being made available and/or mailed to our stockholders on or aboutSeptember 21, 2012.

LAM RESEARCH CORPORATION
PROXY STATEMENTFOR
2012 ANNUAL MEETING OF STOCKHOLDERSTo Be Held November 1, 2012
TABLE OF CONTENTS
Page
Information Concerning Solicitation and Voting . . . . . . . . . . . . . . . . . . . . . . . . . . . . . . . . . . . . . . . . . . . . . . . 1Other Meeting Information . . . . . . . . . . . . . . . . . . . . . . . . . . . . . . . . . . . . . . . . . . . . . . . . . . . . . . . . . . . . . . . . 3Proposal No. 1: Election of Directors . . . . . . . . . . . . . . . . . . . . . . . . . . . . . . . . . . . . . . . . . . . . . . . . . . . . . . 6
Nominees for Director . . . . . . . . . . . . . . . . . . . . . . . . . . . . . . . . . . . . . . . . . . . . . . . . . . . . . . . . . . . . . . . 6Security Ownership of Certain Beneficial Owners and Management . . . . . . . . . . . . . . . . . . . . . . . . . . . 12Corporate Governance . . . . . . . . . . . . . . . . . . . . . . . . . . . . . . . . . . . . . . . . . . . . . . . . . . . . . . . . . . . . . . . 14Director Compensation . . . . . . . . . . . . . . . . . . . . . . . . . . . . . . . . . . . . . . . . . . . . . . . . . . . . . . . . . . . . . . . 21Section 16(a) Beneficial Ownership Reporting Compliance . . . . . . . . . . . . . . . . . . . . . . . . . . . . . . . . . . 24Executive Compensation and Other Information . . . . . . . . . . . . . . . . . . . . . . . . . . . . . . . . . . . . . . . . . . . 25
Compensation Discussion and Analysis . . . . . . . . . . . . . . . . . . . . . . . . . . . . . . . . . . . . . . . . . . . . . . 25Compensation Committee Report . . . . . . . . . . . . . . . . . . . . . . . . . . . . . . . . . . . . . . . . . . . . . . . . . . 48Compensation Committee Interlocks and Insider Participation . . . . . . . . . . . . . . . . . . . . . . . . . . . . 49Executive Compensation Tables . . . . . . . . . . . . . . . . . . . . . . . . . . . . . . . . . . . . . . . . . . . . . . . . . . . 49
Securities Authorized for Issuance under Equity Compensation Plans . . . . . . . . . . . . . . . . . . . . . . . . . . 62Proposal No. 2: Advisory Vote on Fiscal Year 2012 Executive Compensation (“Say on Pay”) . . . . . . . 63Proposal No. 3: Ratification of the Appointment of Independent Registered Public Accounting
Firm . . . . . . . . . . . . . . . . . . . . . . . . . . . . . . . . . . . . . . . . . . . . . . . . . . . . . . . . . . . . . . . . . . . . . . . . . . . . . . . 64Audit Committee Report . . . . . . . . . . . . . . . . . . . . . . . . . . . . . . . . . . . . . . . . . . . . . . . . . . . . . . . . . . . . . 65Relationship with Independent Registered Public Accounting Firm . . . . . . . . . . . . . . . . . . . . . . . . . . . . 66Certain Relationships and Related Transactions . . . . . . . . . . . . . . . . . . . . . . . . . . . . . . . . . . . . . . . . . . . 67Other Matters . . . . . . . . . . . . . . . . . . . . . . . . . . . . . . . . . . . . . . . . . . . . . . . . . . . . . . . . . . . . . . . . . . . . . . 67

LAM RESEARCH CORPORATION
PROXY STATEMENT FOR2012 ANNUAL MEETING OF STOCKHOLDERS
Our board of directors solicits your proxy for the 2012 Annual Meeting of Stockholders and anyadjournment or postponement of the meeting, for the purposes described in the “Notice of 2012 Annual Meetingof Stockholders.” The table below shows important details about the annual meeting and voting. We use theterms “Lam Research,” the “Company,” “we,” “our,” “Lam’s,” and “us” in this proxy statement to refer to LamResearch Corporation, a Delaware corporation.
Record Date September 7, 2012. Only stockholders of record at the close of business on theRecord Date are entitled to receive notice of and to vote at the annual meeting.
Shares Outstanding 177,325,100 shares of common stock were outstanding as of the Record Date.
Quorum A majority of shares outstanding on the Record Date constitutes a quorum. A quorumis required to transact business at the annual meeting.
Inspector ofElections
The Company will appoint an inspector of elections to determine whether a quorumis present. The inspector will also tabulate the votes cast by proxy or at the annualmeeting.
Effect ofAbstentions andBroker Non-Votes
Shares voted “abstain” and broker non-votes (shares held by brokers that do notreceive voting instructions from the beneficial owner of the shares, and do not havediscretionary authority to vote on a matter) will be counted as present for purposes ofdetermining whether we have a quorum. For purposes of voting results, abstentionswill not be counted with respect to the election of directors but will have the effect of“no” votes with respect to other proposals, and broker non-votes will not be countedwith respect to any proposal.
Voting by Proxy Stockholders may vote by internet, phone, or mail, per the instructions on theaccompanying proxy card.
Voting at theMeeting
Stockholders can vote in person during the meeting. Stockholders of record will beon a list held by the inspector of elections. Each beneficial owner (an owner who isnot the record holder of their shares) must obtain a proxy from the beneficial owner’sbrokerage firm, bank, or the stockholder of record holding such shares for thebeneficial owner, and present it to the inspector of elections with a ballot. Voting inperson by a stockholder as described here will replace any previous votes of thatstockholder submitted by proxy.
Changing YourVote
Stockholders of record may change their votes by revoking their proxies. This maybe done at any time before the polls close by (a) submitting a later-dated proxy by theinternet, telephone or mail, or (b) submitting a vote in person at the annual meeting.Before the meeting, stockholders of record may also deliver voting instructions to ourcorporate secretary, Sarah A. O’Dowd, Office of the Secretary, Lam ResearchCorporation, 4650 Cushing Parkway, Fremont, California 94538. If a beneficialowner holds shares through a bank or brokerage firm, or another stockholder ofrecord, the beneficial owner must contact the stockholder of record in order to revokeany prior voting instructions.
1

Voting Instructions If a stockholder completes and submits proxy voting instructions, the people namedon the proxy card as proxy holders (the “Proxy Holders”) will follow thestockholder’s instructions. If a stockholder submits proxy voting instructions butdoes not include voting instructions for each item, the Proxy Holders will vote as theboard recommends on each item for which the stockholder did not include aninstruction. The Proxy Holders will vote on any other matters properly presented atthe annual meeting in accordance with their best judgment.
Voting Results We will announce preliminary results at the annual meeting. We will report finalvoting results at http://investor.lamresearch.com and in a Form 8-K to be filedshortly after the annual meeting.
Availability ofProxy Materials
We mailed this proxy statement and the accompanying proxy card and 2012 AnnualReport to stockholders entitled to vote at the annual meeting who have designated apreference for a printed copy beginning on September 21, 2012. Stockholders whopreviously chose to receive proxy materials electronically were sent an email withinstructions on how to access this year’s proxy materials and the proxy voting site.
We have also provided our stockholders access to our proxy materials over theinternet in accordance with rules and regulations adopted by the United StatesSecurities and Exchange Commission (“SEC”). These materials are available on ourwebsite at http://investor.lamresearch.com and at proxyvote.com. We will furnish,without charge, a printed copy of these materials and our 2012 Annual Report(including exhibits) on request by phone (510-572-1615), by mail (to InvestorRelations, 4650 Cushing Parkway, Fremont, California 94538), or by email ([email protected]).
A Notice of Internet Availability of Proxy Materials will be mailed beginning onSeptember 21, 2012 to all stockholders entitled to vote at the meeting. The notice willhave instructions for stockholders on how to access our proxy materials through theinternet and how to request that a printed copy of the proxy materials be mailed tothem. The notice will also have instructions on how to elect to receive all futureproxy materials electronically or in printed form. If you choose to receive futureproxy materials electronically, you will receive an email each year with instructionson how to access the proxy materials and proxy voting site.
Proxy SolicitationCosts
The Company will bear the cost of all proxy solicitation activities. Our directors,officers and other employees may solicit proxies personally or by telephone, email orother communication means, without any cost to Lam Research. In addition, we haveretained Phoenix Advisory Partners to assist in obtaining proxies by mail, facsimileor email from brokers, bank nominees and other institutions for the annual meeting.The estimated cost of such services is $8,500 plus out-of-pocket expenses. PhoenixAdvisory Partners may be contacted at 110 Wall Street, 27th Floor, New York, NewYork 10005. We are required to request that brokers and nominees who hold stock intheir names furnish our proxy materials to the beneficial owners of the stock, and wemust reimburse these brokers and nominees for the expenses of doing so inaccordance with statutory fee schedules.
2

OTHER MEETING INFORMATION
Voting on Proposals
Pursuant to Proposal No. 1, board members will be elected at the annual meeting to fill eleven seats on theboard under a “majority vote” standard. The majority voting standard means that, even though there are elevennominees for the eleven board seats, a nominee will be elected only if he or she receives an affirmative “for” votefrom stockholders owning, as of the Record Date, at least a majority of the shares present and voted at themeeting in such nominee’s election by proxy or in person. If an incumbent fails to receive the required majority,his or her previously submitted resignation will be promptly considered by the board. Each stockholder may castone vote (“for” or “withhold”), per share held, for each of the eleven nominees. Stockholders may not cumulatevotes in the election of directors.
Each share is entitled to one vote on Proposals No. 2 and 3. Votes may be cast “for,” “against” or “abstain”on those Proposals.
If a stockholder votes by means of the proxy solicited by this proxy statement and does not instruct theProxy Holders how to vote, the Proxy Holders will vote: “for” all individuals nominated by the board; “for”approval, on an advisory basis, of the fiscal year 2012 compensation of the Company’s named executive officers;and “for” the ratification of Ernst & Young LLP as the Company’s independent registered public accounting firmfor fiscal year 2013.
If you choose to vote in person, you will have an opportunity to do so at the annual meeting. You may eitherbring your proxy card to the annual meeting, or if you do not bring your proxy card, the Company will pass outwritten ballots to anyone who was a stockholder as of the Record Date. As noted above, if you are a beneficialowner (an owner who is not the record holder of their shares), you will need to obtain a proxy from yourbrokerage firm, bank, or the stockholder of record holding shares on your behalf.
Voting by 401(k) Plan Participants
Employee participants in Lam’s Savings Plus Plan, Lam Research 401(k) and the Novellus 401(k) Plan (the“401(k) Plans”) who held the Company’s common stock in their personal 401(k) Plan accounts as of the RecordDate will receive this proxy statement, so that each participant may vote, by proxy, his or her interest in theCompany’s common stock as held by the 401(k) Plans. The 401(k) Plan trustees, or the Company’s Savings PlusPlan, Lam Research 401(k) Committee as the administrator of the 401(k) Plans, will aggregate and vote proxiesin accordance with the instructions in the proxies of employee participants that they receive.
Stockholder Accounts Sharing the Same Last Name and Address
To reduce the expense of delivering duplicate proxy materials to stockholders who may have more than oneaccount holding Lam Research stock but who share the same address, we have adopted a procedure approved bythe SEC called “householding.” Under this procedure, stockholders of record who have the same address and lastname will receive only one copy of our proxy statement and annual report unless one of the stockholders notifiesour investor relations department that he or she wants to receive separate copies. This procedure reducesduplicate mailings and therefore saves printing and mailing costs, as well as natural resources. Stockholders whoparticipate in householding will continue to have access to all proxy materials at http://investor.lamresearch.com,as well as the ability to submit separate proxy voting instructions for each account through the internet or byphone.
Stockholders may request separate copies of the proxy materials for multiple accounts holding LamResearch stock by contacting the Company by phone (510-572-1615), by mail (to Investor Relations, 4650Cushing Parkway, Fremont, California 94538) or by email (to [email protected]).Stockholders may also request consolidation of proxy materials mailed to multiple accounts at the same address.
3

Stockholder-Initiated Proposals and Nominations for 2013 Annual Meeting
Proposals submitted under SEC rules for inclusion in the Company’s proxy statement. Stockholder-initiatedproposals (other than director nominations) may be eligible for inclusion in our proxy statement for next year’s2013 annual meeting (in accordance with SEC Rule 14a-8) and for consideration at the annual meeting. TheCompany must receive a stockholder proposal no later than May 23, 2013 for the proposal to be eligible forinclusion. Any stockholder interested in submitting a proposal or nomination is advised to contact legal counselfamiliar with the detailed securities law requirements for submitting proposals or nominations for inclusion in acompany’s proxy statement.
Proposals and nominations under Company bylaws. Stockholders may also submit proposals forconsideration, and nominations of director candidates for election, at the annual meeting by following certainrequirements set forth in our bylaws. The current applicable provisions of our bylaws are described below.Proposals will not be eligible for inclusion in the Company’s proxy statement unless they are submitted incompliance with then applicable SEC rules; however, they will be presented for discussion at the annual meetingif the requirements established by our bylaws for stockholder proposals and nominations have been satisfied.Under current SEC rules, stockholder nominations for directors are not eligible for inclusion in the Company’sproxy materials.
Our bylaws establish requirements for stockholder proposals and nominations to be discussed at the annualmeeting even though they are not included in our proxy statement. Assuming that the 2013 annual meeting takesplace at roughly the same date next year as the 2012 annual meeting (and subject to any change in our bylaws—which would be publicly disclosed by the Company—and to any provisions of then-applicable SEC rules), theprincipal requirements for the 2013 annual meeting would be as follows:
For proposals and for nominations:
• A stockholder of record (“the Stockholder”) must submit the proposal or nomination in writing; it mustbe received by the secretary of the Company no earlier than July 5, 2013, and no later than August 6,2013;
• The Stockholder’s notice to the secretary of a proposal or nomination must state for each of theStockholder and the beneficial owner of Company common stock, if any, on behalf of whom theproposal or nomination is being made (a “Beneficial Owner”):
• the name and record address of the Stockholder and the Beneficial Owner;
• the class, series and number of shares of capital stock of the Company that are owned beneficiallyor of record by the Stockholder and the Beneficial Owner;
• a description of any options, warrants, convertible securities, or similar rights held by theStockholder or the Beneficial Owner with respect to the Company’s stock, and any otheropportunities by the Stockholder or the Beneficial Owner to profit or share in any profit derivedfrom any increase or decrease in the value of shares of the Company, including through a generalor limited partnership or ownership interest in a general partner;
• a description of any proxies, contracts, or other voting arrangements to which the Stockholder orthe Beneficial Owner is a party concerning the Company’s stock;
• a description of any short interest held by the Stockholder or the Beneficial Owner in theCompany’s stock;
• a description of any rights to dividends separated or separable from the underlying shares of theCompany to which the Stockholder or the Beneficial Owner are entitled;
• any other information relating to the Stockholder or the Beneficial Owner that would be requiredto be disclosed in a proxy statement or other filings required to be made in connection with
4

solicitations of proxies for, as applicable, the proposal and/or for the election of directors in acontested election pursuant to Section 14 of the Securities Exchange Act of 1934 (the “ExchangeAct”) and the rules and regulations pursuant thereto; and
• a statement whether or not the Stockholder or the Beneficial Owner will deliver a proxy statementand form of proxy to holders of, in the case of a proposal, at least the percentage of voting powerof all of the shares of capital stock of the Company required under applicable law to carry theproposal or, in the case of nominations, at least the percentage of voting power of all of the sharesof capital stock of the Company reasonably believed by the Stockholder or the Beneficial Owner,as the case may be, to be sufficient to elect the nominee or nominees proposed to be nominated bythe Stockholder or Beneficial Owner under a majority voting standard.
Additionally, for nominations, the notice must:
• Set forth, as to each person whom the Stockholder proposes to nominate for election or reelection as adirector, all information relating to such person as would be required to be disclosed in solicitations ofproxies for the election of such nominees as directors pursuant to Regulation 14A under the ExchangeAct;
• Be accompanied by a written consent of each proposed nominee to be named as a nominee and to serveas a director if elected; and
• Be accompanied by a statement whether such person, if elected, intends to tender, promptly followingsuch person’s election or reelection, an irrevocable resignation effective upon such person’s failure toreceive the required vote for reelection at the next meeting at which such person would face reelectionand upon acceptance of such resignation by the board, in accordance with our corporate governanceguidelines.
Additionally, for proposals, the notice must set forth a brief description of such business, the reasons forconducting such business at the meeting and any material interest in such business of such Stockholder and theBeneficial Owner, if any, on whose behalf the proposal is made.
For a full description of the requirements for submitting a proposal or nomination, see the Company’sbylaws. Submissions or questions should be sent to: Sarah A. O’Dowd, Office of the Secretary, Lam ResearchCorporation, 4650 Cushing Parkway, Fremont, California 94538.
5

PROPOSAL NO. 1ELECTION OF DIRECTORS
NOMINEES FOR DIRECTOR
A board of eleven directors is to be elected at the 2012 annual meeting. In general, the eleven nominees whoreceive the highest number of “for” votes will be elected. However, any nominee who fails to receive affirmativeapproval from holders of a majority of the votes cast in such nominee’s election at the annual meeting, either byproxy or in person, will not be elected to the board, even if he or she is among the top eleven nominees in total“for” votes. This requirement reflects the majority vote provisions implemented by the Company in November2009. The term of office of each person elected as a director will be for the ensuing year, and until his or hersuccessor is elected and qualified.
Unless otherwise instructed, the Proxy Holders will vote the proxies received by them for the elevennominees named below, each of whom is currently a director of the Company. The proxies cannot be voted formore than eleven nominees, whether or not there are additional nominees. If any nominee of the Company shoulddecline or be unable to serve as a director as of the time of the annual meeting, and unless otherwise instructed,the proxies will be voted for any substitute nominee designated by the present board of directors to fill thevacancy. The Company is not aware of any nominee who will be unable, or will decline, to serve as a director.
The individuals in the table below who are shown as nominees for reelection have been nominated forelection to the board of directors in accordance with the criteria and procedures discussed below in “CorporateGovernance.” The eleven directors to be elected is fewer than the fifteen members as of the filing date, and theboard has reduced the size of the board to eleven, effective as of the end of the current directors’ term.
THE BOARD OF DIRECTORS OF THE COMPANY RECOMMENDS A VOTE “FOR”EACH OF THE NOMINEES FOR DIRECTOR SET FORTH BELOW.
The following table sets forth certain information concerning the nominees to the board, including theirqualifications to serve and their ages as of September 1, 2012.
Board Member Name andCurrent Board Role(s)
Principal Occupation and Business ExperienceDuring Past Five Years
Martin B. Anstice, age 45
Nominee for reelection
President and Chief ExecutiveOfficer
Mr. Anstice has been a director of the Company since February 2012 andhas served as the Company’s President and Chief Executive Officer sinceJanuary 2012. Mr. Anstice joined the Company in April 2001 as SeniorDirector, Operations Controller, was promoted to the position of ManagingDirector and Corporate Controller in May 2002, and was promoted toGroup Vice President, Chief Financial Officer, and Chief AccountingOfficer in June 2004. He was appointed Executive Vice President andChief Operating Officer in September 2008 and President in December2010. Prior to joining the Company, Mr. Anstice held various financepositions from 1988 to 1999 at Raychem Corporation, a global materialsscience company. Subsequent to the acquisition of Raychem by TycoInternational, a global provider of engineered electronic components,network solutions and wireless systems, he assumed responsibilitiessupporting mergers and acquisition activities of Tyco Electronics.
Mr. Anstice is an Associate member of the Institute of CharteredManagement Accountants in the United Kingdom.
The board has concluded that Mr. Anstice is qualified to serve as a directorof the Company because of his experience in the semiconductor equipmentindustry, including as current President and Chief Executive Officer of theCompany, past President and Chief Operating Officer, and past ChiefFinancial Officer of the Company, and as a director of the Company, aswell as his strong leadership and prior experience as a corporate executive.
6

Board Member Name andCurrent Board Role(s)
Principal Occupation and Business ExperienceDuring Past Five Years
Eric K. Brandt, age 50
Nominee for reelection
Audit Committee member
Mr. Brandt has been a director of the Company since September 2010.Mr. Brandt serves as Executive Vice President and Chief FinancialOfficer of Broadcom Corporation, a global supplier of semiconductordevices, a role in which he has served since joining Broadcom in March2007. From September 2005 to March 2007, Mr. Brandt served asPresident and Chief Executive Officer of Avanir Pharmaceuticals, Inc., apharmaceutical company. Prior to Avanir Pharmaceuticals, Mr. Brandtwas Executive Vice President-Finance and Technical Operations andChief Financial Officer of Allergan Inc., a global specialtypharmaceutical company, where he also held a number of other seniorpositions following his arrival there in May 1999.
Mr. Brandt serves as a member of the board of directors and a member ofthe compensation committee of Dentsply International, Inc., amanufacturer and distributor of dental product solutions. He previouslyserved as a member of the boards of directors of Avanir Pharmaceuticalsand of Vertex Pharmaceuticals, Inc., a pharmaceutical company, wherehe was chair of the audit committee.
Mr. Brandt received a B.S. in Chemical Engineering from theMassachusetts Institute of Technology and an M.B.A. from the HarvardGraduate School of Business.
The board has concluded that Mr. Brandt is qualified to serve as adirector of the Company because of his financial expertise including asan active chief financial officer of a publicly traded company that is acustomer of our customers, his experience in the semiconductor industry,and his service on other boards of directors.
Michael R. Cannon, age 59
Nominee for reelection
Compensation Committeemember
Nominating and GovernanceCommittee member
Mr. Cannon has been a director of the Company since February 2011. Heis the General Partner of MRC & LBC Partners, LLC. From February2007 until his retirement in January 2009, Mr. Cannon served asPresident of Global Operations of Dell Inc., a computer systemsmanufacturer and services provider. Prior to joining Dell, he wasPresident and Chief Executive Officer of Solectron Corporation, anelectronic manufacturing services company, from January 2003 toFebruary 2007. From July 1996 to January 2003, Mr. Cannon served asPresident and Chief Executive Officer of Maxtor Corporation, a diskdrive and storage systems manufacturer.
Mr. Cannon serves on the boards of directors of Adobe Systems Inc., adiversified software company, and Seagate Technology Public Limited, adisk drive and storage solutions company. Mr. Cannon previously servedon the boards of directors of Solectron and the Elster Group SE, ametering and smart grid technology company.
He studied mechanical engineering at Michigan State University andcompleted the Advanced Management Program at the Harvard GraduateSchool of Business.
The board has concluded that Mr. Cannon is qualified to serve as adirector of the Company because of his experience as a director on otherpublic company boards, his experience in leadership roles at a publiccorporation that is a customer of our customers, and his industry andtechnology knowledge.
7

Board Member Name andCurrent Board Role(s)
Principal Occupation and Business ExperienceDuring Past Five Years
Youssef A. El-Mansy, age 67
Nominee for reelection
Compensation Committeemember
Dr. El-Mansy has been a director of the Company since June 2012. He isthe retired Vice President, Director of Logic Technology Development,at Intel Corporation, a leading producer of microchips, computing andcommunications products, where he was responsible for managingtechnology development, the processor design center for Intel’sTechnology and Manufacturing Group and two wafer manufacturingfacilities. Dr. El-Mansy joined Intel in 1979 and led microprocessortechnology development at Intel for 20 years.
Dr. El-Mansy served on the board of directors of Novellus Systems, Inc.,a semiconductor wafer fabrication equipment company, from April 2004until its merger with Lam Research in June 2012 and on the board ofdirectors of Zygo Corporation, a designer and manufacturer of opticalsystems, from July 2004 to June 2009.
Dr. El-Mansy holds Bachelor of Science and Masters degrees inElectronics and Communications from Alexandria University in Egyptand a Ph.D. in Electronics from Carleton University in Ottawa, Canada.
The board has concluded that Dr. El-Mansy is qualified to serve as adirector of the Company because of his more than 30 years of experienceas an executive focused on the manufacturing of technological devicesand components for a company that is a customer of the Company; hisknowledge of the business and operations of Novellus, resulting from hisservice as a director of Novellus since 2004; and his public companyexperience as a director and member of a compensation committee ofanother publicly traded company.
Christine A. Heckart, age 46
Nominee for reelection
Compensation Committeemember
Ms. Heckart has been a director of the Company since April 2011. She isthe Chief Marketing Officer of ServiceSource, a service revenuemanagement company. From 2010 to 2012, she was the Chief MarketingOfficer at NetApp, Inc., a leading provider of data storage andmanagement solutions. Ms. Heckart served as General Manager for theTV, video and music business of Microsoft Corporation, a developer ofsoftware, services, and hardware, from 2005 to 2010; and she led globalmarketing at Juniper Networks, Inc., a provider of network infrastructuresolutions, from 2002 to 2005. She was President at TeleChoice, Inc, aconsulting firm specializing in business and marketing strategies, from1995 to 2002.
Ms. Heckart holds a degree in economics from the University ofColorado at Boulder.
The board has concluded that Ms. Heckart is qualified to serve as adirector of the Company because of her experience in leadership roles atpublic corporations, her knowledge of the electronics industry and herstrong marketing background.
8
Board Member Name andCurrent Board Role(s)
Principal Occupation and Business ExperienceDuring Past Five Years
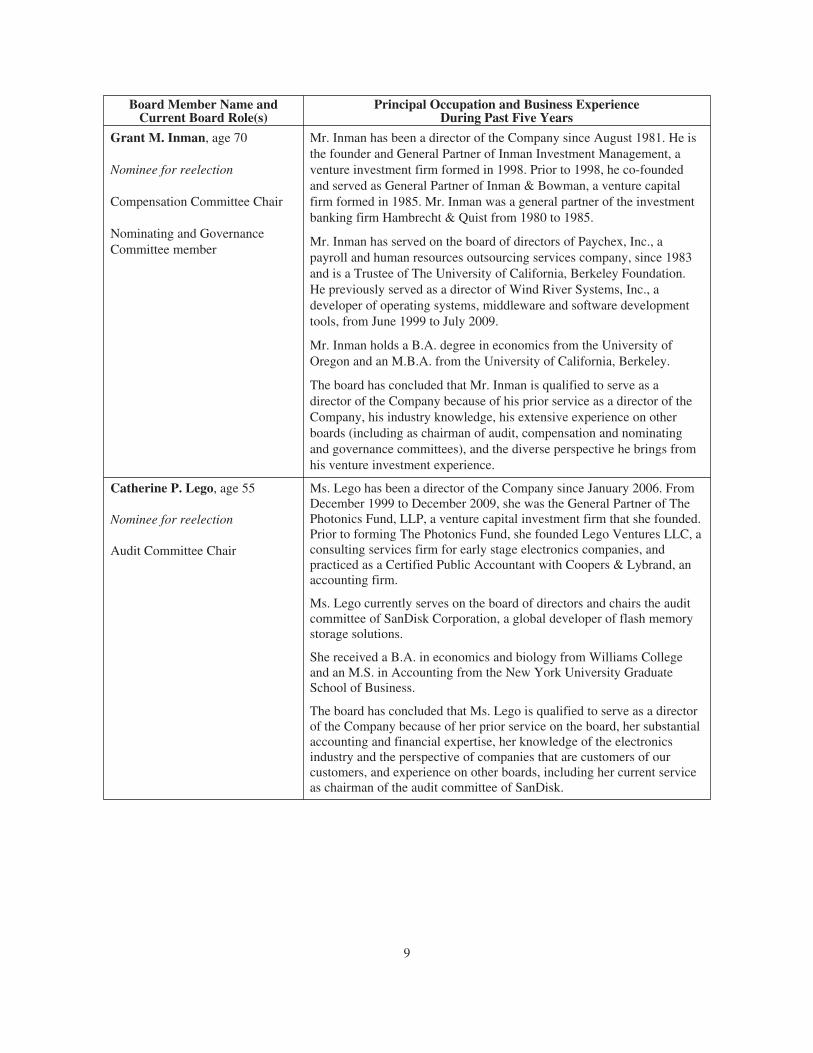
Grant M. Inman, age 70
Nominee for reelection
Compensation Committee Chair
Nominating and GovernanceCommittee member
Mr. Inman has been a director of the Company since August 1981. He isthe founder and General Partner of Inman Investment Management, aventure investment firm formed in 1998. Prior to 1998, he co-foundedand served as General Partner of Inman & Bowman, a venture capitalfirm formed in 1985. Mr. Inman was a general partner of the investmentbanking firm Hambrecht & Quist from 1980 to 1985.
Mr. Inman has served on the board of directors of Paychex, Inc., apayroll and human resources outsourcing services company, since 1983and is a Trustee of The University of California, Berkeley Foundation.He previously served as a director of Wind River Systems, Inc., adeveloper of operating systems, middleware and software developmenttools, from June 1999 to July 2009.
Mr. Inman holds a B.A. degree in economics from the University ofOregon and an M.B.A. from the University of California, Berkeley.
The board has concluded that Mr. Inman is qualified to serve as adirector of the Company because of his prior service as a director of theCompany, his industry knowledge, his extensive experience on otherboards (including as chairman of audit, compensation and nominatingand governance committees), and the diverse perspective he brings fromhis venture investment experience.
Catherine P. Lego, age 55
Nominee for reelection
Audit Committee Chair
Ms. Lego has been a director of the Company since January 2006. FromDecember 1999 to December 2009, she was the General Partner of ThePhotonics Fund, LLP, a venture capital investment firm that she founded.Prior to forming The Photonics Fund, she founded Lego Ventures LLC, aconsulting services firm for early stage electronics companies, andpracticed as a Certified Public Accountant with Coopers & Lybrand, anaccounting firm.
Ms. Lego currently serves on the board of directors and chairs the auditcommittee of SanDisk Corporation, a global developer of flash memorystorage solutions.
She received a B.A. in economics and biology from Williams Collegeand an M.S. in Accounting from the New York University GraduateSchool of Business.
The board has concluded that Ms. Lego is qualified to serve as a directorof the Company because of her prior service on the board, her substantialaccounting and financial expertise, her knowledge of the electronicsindustry and the perspective of companies that are customers of ourcustomers, and experience on other boards, including her current serviceas chairman of the audit committee of SanDisk.
9

Board Member Name andCurrent Board Role(s)
Principal Occupation and Business ExperienceDuring Past Five Years
Stephen G. Newberry, age 58
Nominee for reelection
Vice Chairman
Mr. Newberry has been a director of the Company since June 2005 andhas served as the Vice Chairman of the Company’s board sinceDecember 2010. He served as the Company’s Chief Executive Officerfrom June 2005 to January 2012, the Company’s President from July1998 to December 2010, and the Company’s Chief Operating Officerfrom 1997 to 2005. Mr. Newberry joined the Company in August 1997 asExecutive Vice President and Chief Operating Officer. Prior to joiningthe Company, Mr. Newberry held various executive positions at AppliedMaterials, Inc. during his 17-year tenure there.
Mr. Newberry serves on the boards of directors of NanometricsIncorporated, a provider of process control metrology and inspectionsystems, and Semiconductor Equipment and Materials International(“SEMI”), a global semiconductor industry trade association.Mr. Newberry previously served as a director of Amkor Technology,Inc., a provider of outsourced semiconductor packaging assembly andtest services, and Nextest Systems Corporation, a developer of automatedtest equipment systems for the semiconductor industry
Mr. Newberry is a graduate of the U.S. Naval Academy and the HarvardGraduate School of Business.
The board has concluded that Mr. Newberry is qualified to serve as adirector of the Company because of his 30 years’ experience in thesemiconductor equipment industry, his comprehensive understanding ofthe Company and its products, markets, and strategies gained through hisrole as an executive of our Company, including as our Chief ExecutiveOfficer, his active role in the semiconductor industry’s trade association,and his strong leadership and operations expertise.
Krishna C. Saraswat, age 65
Nominee for reelection
Nominating and GovernanceCommittee member
Dr. Saraswat has been a director of the Company since June 2012. He hasserved as the Rickey/Nielsen Professor in the School of Engineering ofStanford University since 2004. He has also served as a Professor ofElectrical Engineering and a Professor of Material Scienceand Engineering at Stanford University since 1983.
Dr. Saraswat served on the board of Novellus from February 2011 untilits merger with Lam Research in June 2012.
Dr. Saraswat received his B.E. degree in Electronics in 1968 from theBirla Institute of Technology and Science, Pilani, India, and his M.S. andPh.D. degrees in Electrical Engineering in 1969 and 1974, respectively,from Stanford University. At Stanford University he has been engaged inresearch on new and innovative materials, structures, and processtechnology of silicon, germanium and III-V devices and interconnects forVLSI and nanoelectronics.
The board has concluded that Dr. Saraswat is qualified to serve as adirector of the Company because of his diverse and extensive experiencein research and development of materials, structures and processtechnology directly related to our industry; his experience as a professorstudying and teaching electrical engineering in those areas; his strongacademic credentials, including his recognition as a recipient ofnumerous awards and his publication of more than 650 technical papers;and his experience as a director of Novellus since 2011.
10

Board Member Name andCurrent Board Role(s)
Principal Occupation and Business ExperienceDuring Past Five Years
William R. Spivey, age 65
Nominee for reelection
Nominating and GovernanceCommittee member
Dr. Spivey has been a director of the Company since June 2012. FromJuly 2000 to September 2001, he was President and Chief ExecutiveOfficer of Luminent, Inc., a producer of fiber optic components. FromOctober 1997 to July 2000, he was Group President, Network ProductsGroup of Lucent Technologies, a producer of world-widecommunications products. Previously he held senior executive positionsat AT&T Microelectronics, a communications company; Tektronix, Inc.,a provider of communications network management and diagnosticsolutions; Honeywell; and General Electric.
Dr. Spivey serves on the boards of directors of Cascade Microtech, Inc., adeveloper of precision electrical measurement and test of advancedsemiconductor devices, and Raytheon Company, a prime contractor on abroad portfolio of defense and related programs for governmentcustomers. He also served on the boards of Novellus from May 1998until its merger with Lam Research in June 2012; Laird PLC, a globalprovider of products and technology solutions, from 2002 to 2012; ADCTelecommunications, a supplier of networking products and systems,from 2004 to 2010; Lyondell Chemical Company, from 2000 to 2007;and Luminent, from 2000 to 2001.
Dr. Spivey holds a Bachelor of Science degree in Physics from DuquesneUniversity, a Masters degree in Physics from Indiana University ofPennsylvania and a Ph.D. in Management from Walden University.
The board has concluded that Dr. Spivey is qualified to serve as adirector of the Company because of his managerial experience at severaltechnology companies; his service as a director of multiple publiccompanies; his experience as lead independent director andcompensation and nominating and governance committee member; andhis service as a director of Novellus since 1998.
Abhijit Y. Talwalkar, age 48
Nominee for reelection
Compensation Committeemember
Nominating and GovernanceCommittee member
Mr. Talwalkar has been a director of the Company since February 2011.Since 2005, he has been the President and Chief Executive Officer of LSICorporation, a leading provider of silicon, systems and softwaretechnologies for the storage and networking markets. Prior to becomingthe LSI President and Chief Executive Officer, Mr. Talwalkar acted inseveral executive leadership roles at Intel from 1993 to 2005.
Mr. Talwalkar also serves on the boards of LSI and the U.S.Semiconductor Industry Association, a semiconductor industry tradeassociation.
He has a degree in electrical engineering from Oregon State University.
The board has concluded that Mr. Talwalkar is qualified to serve as adirector of the Company because of his experience in the semiconductorindustry, including as the chief executive officer of a semiconductorcompany, his leadership roles at other semiconductor companies, and hisactive role in the semiconductor industry’s trade association.
In addition to the biographical information above regarding each director’s specific experience, attributes,positions and qualifications, we believe that each of our nominees, while serving as a director and/or officer ofthe Company, has performed his or her duties with critical attributes such as honesty, integrity, wisdom, and anadherence to high ethical standards. Each nominee has demonstrated strong business acumen, an ability to makeindependent analytical inquiries, an ability to understand the Company’s business environment, and an ability toexercise sound judgment, as well as a commitment to the Company and its core values. We believe the nomineeshave an appropriate diversity of viewpoints and experiences that will encourage a robust decision-makingprocess for the board.
11

SECURITY OWNERSHIPOF CERTAIN BENEFICIAL OWNERS AND MANAGEMENT
The table below sets forth the beneficial ownership of shares of Lam’s Common Stock by: (i) each person orentity who the Company believes beneficially owned more than 5% of Lam’s common stock on the date set forthbelow; (ii) each current director of the Company; (iii) each named executive officer identified below in the“Compensation Discussion and Analysis” section; and (iv) all current directors and current executive officers as agroup. With the exception of 5% owners, and unless otherwise noted, the information below reflects holdings asof September 7, 2012, which is the Record Date for the 2012 annual meeting and the most recent practicable datefor determining ownership. For 5% owners, holdings are as of September 7, 2012, which is the most practicabledate for determining their holdings based on their most recent ownership reports filed with the SEC. Thepercentage of the class owned is calculated using 177,325,100 as the number of shares of Lam’s Common Stockoutstanding on September 7, 2012.
Name of Person or Identity of Group
SharesBeneficiallyOwned (1)
Percentage ofClass
5% Stockholders
JP Morgan Asset Management245 Park AvenueNew York, NY 10167-0002
12,142,006 6.8%
The Vanguard Group, Inc.100 Vanguard BoulevardMalvern, PA 19355
11,453,312 6.5%
AllianceBernstein L.P.1345 Avenue of the AmericasNew York, NY 10105
9,709,527 5.5%
Directors
Martin B. Anstice (also a Named Executive Officer) 65,170 *
James W. Bagley 142,000 *
Robert M. Berdahl 11,570 *
Eric K. Brandt 9,415 *
Michael R. Cannon 4,792 *
Youssef A. El-Mansy 28,818 *
Christine A. Heckart 4,942 *
Grant M. Inman 90,818 *
Catherine P. Lego 33,818 *
Stephen G. Newberry (also a Named Executive Officer) 203,638 *
Kim E. Perdikou 4,942 *
Krishna C. Saraswat 14,476 *
William R. Spivey 50,196 *
Abhijit Y. Talwalkar 4,942 *
Delbert A. Whitaker 24,320 *
Named Executive Officers (“NEOs”)
Richard A. Gottscho 31,523 *
Ernest E. Maddock 55,088 *
Sarah A. O’Dowd 62,045 *
Mukund Srinivasan 28,382 *
All current directors and executive officers as a group (20 people) (2) 1,232,788 *
12

* Less than 1%.
(1) Includes shares subject to outstanding stock options that are now exercisable or will become exercisablewithin 60 days after September 7, 2012, as well as restricted stock units (“RSUs”) that will vest within thattime period, as follows:
Martin B. Anstice 29,120
Robert M. Berdahl 3,620
Eric K. Brandt 4,918
Michael R. Cannon 3,620
Youssef A. El-Mansy 1,820
Christine A. Heckart 3,620
Grant M. Inman 3,620
Catherine P. Lego 3,620
Stephen G. Newberry 123,700
Kim E. Perdikou 3,620
Krishna C. Saraswat 1,820
William R. Spivey 1,820
Abhijit Y. Talwalkar 3,620
Delbert A. Whitaker 1,820
Ernest E. Maddock 24,480
Sarah A. O’Dowd 38,658
All current directors and executiveofficers as a group (20 people) (2) 540,371
As discussed in “Director Compensation” below, non-employee directors receive an annual equity grant aspart of their compensation. These grants generally vest on November 1, subject to continued service on theboard as of that date, but the shares are delivered in the following January. For 2012, Dr. Berdahl; Messrs.Cannon, Inman and Talwalkar; and Mses. Heckart, Lego and Perdikou each received grants of 3,620 RSUs.Drs. El-Mansy, Saraswat and Spivey and Mr. Whitaker each received pro-rated grants of 1,820 RSUs. TheseRSUs are included in the tables above, although the directors will not actually receive them until January2013.
(2) In addition to the directors and NEOs, this group includes our chief operating officer, who joined theCompany in June 2012.
13

CORPORATE GOVERNANCE
Our board of directors and members of management are committed to responsible corporate governance thatwill ensure that the Company is managed for the long-term benefit of its stockholders. To that end, the board andmanagement periodically review and update, as appropriate, the Company’s corporate governance policies andpractices. As part of that process, the board and management review the requirements of federal and state law,including rules and regulations of the SEC; the listing standards for the NASDAQ Global Select Market(“NASDAQ”); published guidelines and recommendations of institutional stockholder organizations; andpublished guidelines of other selected public companies.
Corporate Governance Policies
We have instituted a variety of policies and procedures to foster and maintain responsible corporategovernance, including the following:
Board committee charters. Each of the board’s standing committees—audit, compensation and nominatingand governance committees — has a written charter adopted by the board that establishes practices andprocedures for the committee in accordance with applicable corporate governance rules and regulations. Eachcommittee reviews its charter annually and recommends changes to the board, as appropriate. Each committeecharter is available on the investors’ page of Lam’s web site at http://investor.lamresearch.com. Please also referto “Board Committees,” below, for a description of responsibilities of these standing committees.
Corporate governance guidelines. We adhere to written corporate governance guidelines, adopted by theboard and reviewed annually by the nominating and governance committee and the board. Selected provisions ofthe guidelines are discussed below, including in the “Board Nomination Policies and Procedures,” “DirectorIndependence Policies” and “Other Governance Practices” sections below.
Corporate code of ethics. We maintain a code of ethics that applies to all employees, officers, and membersof the board. The code of ethics establishes standards reasonably necessary to promote honest and ethicalconduct, including the ethical handling of actual or apparent conflicts of interest between personal andprofessional relationships, and full, fair, accurate, timely, and understandable disclosure in the periodic reportswe file with the SEC and in other public communications. We will promptly disclose to the public anyamendments to, or waivers from, any provision of the code of ethics, to the extent required by applicable laws.We intend to make this public disclosure by posting the relevant material on our website, to the extent permittedby applicable laws. A copy of the code of ethics is available on the investors’ page of Lam’s web site at http://investor.lamresearch.com.
Global standards of business conduct policy. We maintain written standards of appropriate business conductin a variety of business situations that apply to employees worldwide. Among other things, these global standardsof business conduct prohibit employees from engaging in “short sales” of Lam Research securities or frompurchasing “put” or “call” options for Lam Research securities (other than through our equity incentive plans oremployee stock purchase plans). These measures help to ensure that our employees will not benefit from adecline in Lam’s stock price, and will remain focused on our business success.
Insider trading policy. Our insider trading policy restricts the trading of Company stock by our directors,officers, and employees, and includes provisions addressing insider blackout periods, margin accounts andhedging transactions.
Board Nomination Policies and Procedures
Board membership criteria. Under our corporate governance guidelines, the nominating and governancecommittee is responsible for assessing the appropriate balance of experience, skills and characteristics requiredfor the board and for recommending director nominees to the independent directors.
14

The guidelines direct the committee to consider all factors it considers appropriate. The committee need notconsider all of the same factors for every candidate. Factors considered may include, among other things:diversity with respect to any attribute(s) the board considers desirable; experience; business acumen; wisdom;integrity; judgment; the ability to make independent analytical inquiries; the ability to understand the Company’sbusiness environment; the candidate’s willingness and ability to devote adequate time to board duties; specificskills, background or experience considered necessary or desirable for board or committee service; specificexperiences with other businesses or organizations that may be relevant to the Company or its industry; and theinterplay of a candidate’s experiences and skills with the experiences and skills of other board members.
Prior to recommending that an incumbent non-employee director be nominated for reelection to the board,the committee reviews the experiences, skills and qualifications of the director to assess the continuing relevanceof the director’s experiences, skills and qualifications to those considered necessary or desirable for the board atthat time.
Board members may not serve on more than four boards of public companies (including the Company’sboard). In addition, board nominees must be under the age of 75 years when nominated. For this reason,Dr. Robert M. Berdahl has not been nominated for reelection at this annual meeting.
Nomination procedure. The nominating and governance committee identifies, evaluates and recommendsqualified candidates for appointment or election to the board. The committee considers recommendations from avariety of sources, including search firms, board members, executive officers and stockholders. Formalnominations are made by the independent members of the board.
Certain provisions of our bylaws apply to the nomination or recommendation of candidates by astockholder. Information regarding the nomination procedure is provided in the section above captioned“Stockholder-Initiated Proposals and Nominations for 2013 Annual Meeting.”
Director Independence Policies
Board independence requirements. Our corporate governance guidelines require that at least a majority ofthe board members be independent in accordance with NASDAQ rules. No director will qualify as “independent”unless the board affirmatively determines that the director has no relationship that would interfere with theexercise of independent judgment as a director. In addition, no non-employee director may serve as a consultantor service provider to the Company without the approval of a majority of the independent directors (and any suchdirector’s independence must be reassessed by the full board following such approval).
Board member independence. The board has determined that all current directors, other thanMessrs. Anstice, Bagley and Newberry, are independent in accordance with NASDAQ criteria for directorindependence.
Board committee independence. All members of the board’s three standing committees—the audit,compensation, and nominating and governance committees—must be independent in accordance with applicableNASDAQ criteria as well as, in the case of the compensation committee, applicable rules under section 162(m)of the Internal Revenue Code. See “Board Committees” below for a description of the responsibilities of theboard’s standing committees.
Lead independent director. Our corporate governance guidelines authorize the board to designate a leadindependent director from among the independent board members. The lead independent director is responsiblefor coordinating the activities of the independent members of the board, consulting with the chairman regardingmatters such as schedules of and agendas for board meetings and the retention of consultants reporting to theboard, and developing the agenda for and moderating executive sessions of the board’s independent directors.Dr. Berdahl has served as the lead independent director since 2004. The board has designated Grant Inman toserve as lead independent director beginning immediately upon his reelection at this annual meeting.
15
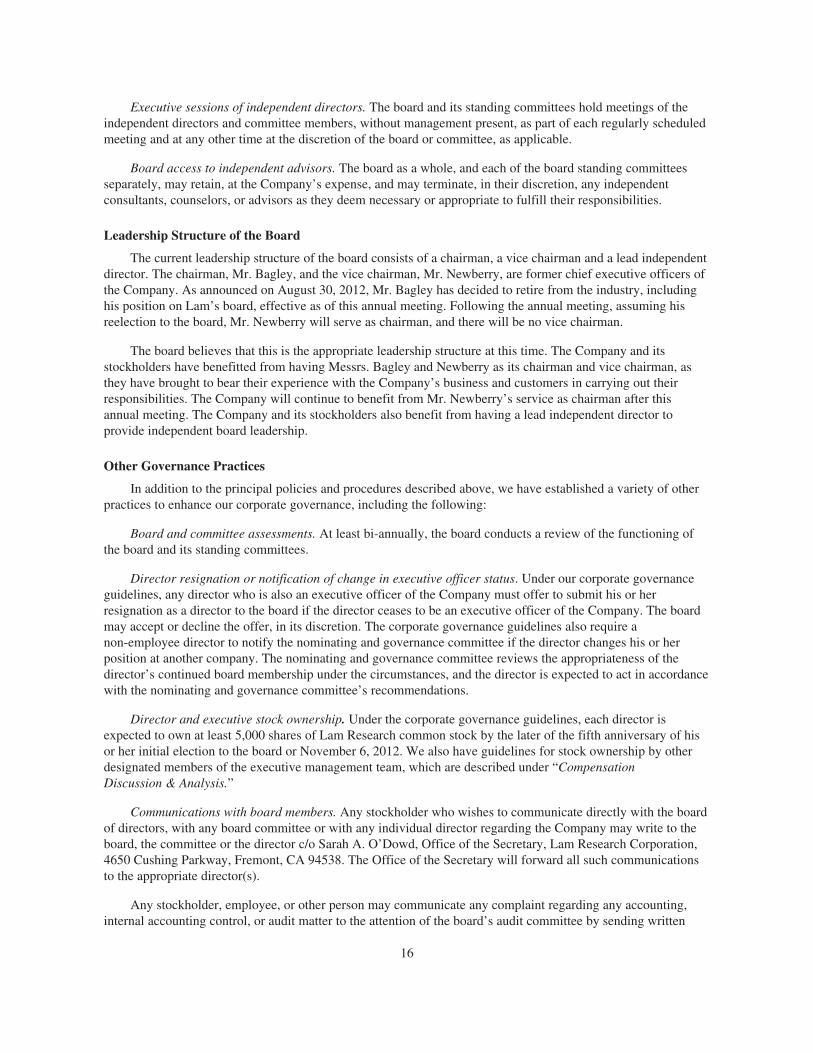
Executive sessions of independent directors. The board and its standing committees hold meetings of theindependent directors and committee members, without management present, as part of each regularly scheduledmeeting and at any other time at the discretion of the board or committee, as applicable.
Board access to independent advisors. The board as a whole, and each of the board standing committeesseparately, may retain, at the Company’s expense, and may terminate, in their discretion, any independentconsultants, counselors, or advisors as they deem necessary or appropriate to fulfill their responsibilities.
Leadership Structure of the Board
The current leadership structure of the board consists of a chairman, a vice chairman and a lead independentdirector. The chairman, Mr. Bagley, and the vice chairman, Mr. Newberry, are former chief executive officers ofthe Company. As announced on August 30, 2012, Mr. Bagley has decided to retire from the industry, includinghis position on Lam’s board, effective as of this annual meeting. Following the annual meeting, assuming hisreelection to the board, Mr. Newberry will serve as chairman, and there will be no vice chairman.
The board believes that this is the appropriate leadership structure at this time. The Company and itsstockholders have benefitted from having Messrs. Bagley and Newberry as its chairman and vice chairman, asthey have brought to bear their experience with the Company’s business and customers in carrying out theirresponsibilities. The Company will continue to benefit from Mr. Newberry’s service as chairman after thisannual meeting. The Company and its stockholders also benefit from having a lead independent director toprovide independent board leadership.
Other Governance Practices
In addition to the principal policies and procedures described above, we have established a variety of otherpractices to enhance our corporate governance, including the following:
Board and committee assessments. At least bi-annually, the board conducts a review of the functioning ofthe board and its standing committees.
Director resignation or notification of change in executive officer status. Under our corporate governanceguidelines, any director who is also an executive officer of the Company must offer to submit his or herresignation as a director to the board if the director ceases to be an executive officer of the Company. The boardmay accept or decline the offer, in its discretion. The corporate governance guidelines also require anon-employee director to notify the nominating and governance committee if the director changes his or herposition at another company. The nominating and governance committee reviews the appropriateness of thedirector’s continued board membership under the circumstances, and the director is expected to act in accordancewith the nominating and governance committee’s recommendations.
Director and executive stock ownership. Under the corporate governance guidelines, each director isexpected to own at least 5,000 shares of Lam Research common stock by the later of the fifth anniversary of hisor her initial election to the board or November 6, 2012. We also have guidelines for stock ownership by otherdesignated members of the executive management team, which are described under “CompensationDiscussion & Analysis.”
Communications with board members. Any stockholder who wishes to communicate directly with the boardof directors, with any board committee or with any individual director regarding the Company may write to theboard, the committee or the director c/o Sarah A. O’Dowd, Office of the Secretary, Lam Research Corporation,4650 Cushing Parkway, Fremont, CA 94538. The Office of the Secretary will forward all such communicationsto the appropriate director(s).
Any stockholder, employee, or other person may communicate any complaint regarding any accounting,internal accounting control, or audit matter to the attention of the board’s audit committee by sending written
16

correspondence to: Lam Research Corporation, Attention: Board Audit Committee, P.O. Box 5010, Fremont, CA94537-5010. The audit committee has established procedures to ensure that employee complaints or concernsregarding audit or accounting matters will be received and treated anonymously (if the complaint or concern issubmitted anonymously) and confidentially.
We expect our directors to attend the annual meeting of stockholders each year and to respond toappropriate questions. All individuals who were directors as of the 2011 annual meeting attended the 2011 annualmeeting.
Meeting Attendance
All of the directors attended at least 75% of the aggregate number of board meetings and meetings of boardcommittees on which they served during their board tenure in fiscal year 2012. Our board of directors held a totalof nine meetings during fiscal year 2012.
Board Committees
The board of directors has three standing committees, all of whose members are independent directors: anaudit committee, a compensation committee, and a nominating and governance committee. The purpose,membership and charter of each are described below.
Committee Memberships as of June 2012
Name Audit Compensation
Nominatingand
Governance
Robert M. Berdahl Chair
Eric K. Brandt x
Michael R. Cannon x x
Youssef A. El-Mansy x
Christine A. Heckart x
Grant M. Inman Chair x
Catherine P. Lego Chair
Kim E. Perdikou x
Krishna C. Saraswat x
William R. Spivey x
Abhijit Y. Talwalkar x x
Delbert A. Whitaker x
Audit committee. The purpose of the audit committee is to oversee the Company’s accounting and financialreporting processes and the audits of our financial statements. The audit committee is not, however, responsiblefor planning or conducting our audits, or determining whether our financial statements are complete and accurateor prepared in accordance with generally accepted accounting principles.
At the end of fiscal year 2012, the audit committee consisted of Messrs. Brandt and Whitaker, and Mses.Lego and Perdikou. Mr. Brandt and Mses. Lego and Perdikou served for the entire fiscal year. Mr. Whitaker
17

joined the committee in June 2012. The board concluded that all audit committee members are non-employeedirectors who are independent in accordance with the NASDAQ criteria for audit committee memberindependence. The board also determined that Ms. Lego, the chair of the committee during fiscal year 2012, is a“financial expert” as defined in SEC rules. The audit committee held nine meetings during fiscal year 2012.
The audit committee’s responsibilities include (but are not limited to) the following:
• Appoint and provide for the compensation for the Company’s independent registered public accountingfirm (the “Accounting Firm”), and approve, in accordance with and in a manner consistent with thelaws, rules and regulations applicable to the Company, all professional services to be provided to LamResearch by the Accounting Firm
• Oversee the work, and evaluate the performance, of the Accounting Firm
• Meet with management and the Accounting Firm to discuss the annual financial statements and theAccounting Firm’s report on them prior to the filing of the Company’s Form 10-K with the SEC, and todiscuss the adequacy of internal control over financial reporting
• Meet quarterly with management and the Accounting Firm to discuss the quarterly financial statementsprior to the filing of the Company’s Form 10-Q with the SEC
• At least annually, review and reassess the internal audit charter and, if appropriate, recommendproposed changes
• Review the scope, results and analysis of internal audits (if any)
• Review and approve all related-party transactions
• Establish a procedure for receipt, retention and treatment of any complaints received by the Companyabout its accounting, internal accounting controls or auditing matters, and for the confidential andanonymous submission by employees of concerns regarding questionable accounting or auditingmatters
• Review and monitor the Company’s investment policy and performance and associated risks, includingbut not limited to annual review and recommendation to the full board of management’s treasurystrategy committee charter
Compensation committee. The purpose of the compensation committee is to discharge certainresponsibilities of the board relating to executive compensation, to oversee incentive, equity-based and othercompensatory plans in which the Company’s executive officers and directors participate and to produce anannual report on executive compensation for inclusion as required in the Company’s proxy statement.
At the end of fiscal year 2012, the compensation committee consisted of Dr. El-Mansy, Messrs. Cannon,Inman and Talwalkar and Ms. Heckart. Dr. El-Mansy joined the committee in June 2012, and the other membersserved for the entire fiscal year. Dr. Berdahl served on the committee until February 2012. The board concludedthat all members of the compensation committee are non-employee directors who are independent in accordancewith the NASDAQ criteria for director independence and who are outside directors for purposes of section162(m) of the Internal Revenue Code as amended. The compensation committee held six meetings during fiscalyear 2012.
The compensation committee’s responsibilities include (but are not limited to) the following:
• Establish and review corporate goals and objectives as relevant to the chief executive officer, thechairman and the vice chairman, evaluate their performance in light of these goals and objectives andbased on this evaluation recommend the chief executive officer’s, the chairman’s and the vicechairman’s compensation packages and payouts for approval by the independent members of the board
• Determine compensation packages, targets, and payouts for other executive officers
• Establish and administer stock ownership guidelines applicable to executive officers
18

• Review and recommend to the board for final approval all cash, equity-based or other compensationarrangements applicable to the independent members of the board
• Review and approve, subject to stockholder or board approval as required, the creation or amendmentof any equity-based compensatory plans and other compensatory plans as the board designates, andadminister such plans
• Oversee management’s determination as to whether the Company’s compensation policies andpractices create risks that are reasonably likely to have a material adverse effect on the Company
• Recommend to the board the frequency of “say-on-pay” votes, review the results of “say-on-pay”votes, and consider whether any adjustments to the Company’s executive compensation program areappropriate as a result of such votes
Nominating and governance committee. The purpose of the nominating and governance committee is toidentify individuals qualified to serve as members of the board of the Company, to recommend nominees forelection as directors of the Company, to conduct evaluations of the board’s performance, to develop andrecommend corporate governance guidelines to the board, and to provide oversight with respect to corporategovernance and ethical conduct.
At the end of fiscal year 2012, the nominating and governance committee consisted of Drs. Berdahl,Saraswat and Spivey and Messrs. Inman and Talwalkar. The board concluded that all nominating and governancecommittee members are non-employee directors who are independent in accordance with the NASDAQ criteriafor director independence. The nominating and governance committee held four meetings during fiscal year2012.
The nominating and governance committee’s responsibilities include (but are not limited to) the following:
• Identify, screen, evaluate, and recommend to the independent members of the board nominees forelection as directors of the Company at the next annual or special meeting of stockholders at whichdirectors are to be elected; and identify, screen, evaluate and recommend to the board individuals to fillany vacancies or newly created directorships that may occur between meetings
• Make recommendations to the board annually after consultation with the chairman of the board and thelead independent director, if any, with respect to assignment of board members to committees and ascommittee chairs
• Cause to be prepared and recommend to the board the adoption of corporate governance guidelines,and from time to time review and assess the guidelines and recommend changes for approval by theboard
• Conduct from time to time an assessment of the board and the board committees in accordance with theCompany’s corporate governance guidelines and the committee charters, and report the evaluation tothe board
The nominating and governance committee recommended the slate of nominees for director set forth inProposal No. 1. The independent members of the board approved the recommendations and nominated theproposed slate of nominees.
The nominating and governance committee will consider for nomination persons properly nominated bystockholders in accordance with the Company’s bylaws and other procedures described above in the sectioncaptioned “Stockholder - Initiated Proposals and Nominations for 2013 Annual Meeting.” Subject to then-applicable law, stockholder nominations for director will be evaluated by the Company’s nominating andgovernance committee in accordance with the same criteria as are applied to candidates identified by thenominating and governance committee or other sources.
19

Board’s Role in Risk Oversight
The board of directors has oversight responsibility with respect to the Company’s risk managementactivities. Examples of risks facing the Company include, but are not limited to, integration of Novellus andindustry business cycles. For further discussion of the risks we face, see our Annual Report on Form 10-K.
The board provides risk oversight by: (1) understanding and assessing the Company’s risk managementprocesses; (2) understanding the Company’s strategic goals and objectives and assessing how they may beaffected by material risk exposures; and (3) receiving regular reports from management on various types of risksand management’s processes for managing such risks.
The board has delegated oversight responsibility for certain areas of risk exposure to its standingcommittees.
• The audit committee oversees risk management activities relating to the Company’s accounting andfinancial reporting, internal controls, and the auditing of the Company’s annual financial statements.The audit committee also oversees the Company’s independent registered public accounting firm andthe Company’s internal audit function. The audit committee meets privately with the Company’sindependent registered public accounting firm at least quarterly.
• The compensation committee oversees risk management activities relating to the design of equity,executive and board level compensation policies and plans. The compensation committee works withan independent compensation consultant and meets privately with that consultant as appropriate.
Assessment of Compensation Risk
Management conducted a compensation risk assessment in 2012 and concluded that the Company’s currentcompensation programs are not reasonably likely to have a material adverse effect on the Company’s business.
20

DIRECTOR COMPENSATION
Board members who are also employees do not receive any additional compensation for service on theboard. The compensation of our non-employee directors is reviewed and determined annually by the board, uponrecommendation from the compensation committee. Committee chairs, the lead independent director andcommittee members receive cash retainers. The board endeavors to maintain forms and amounts of directorcompensation that will attract and retain directors of the caliber desired by the Company and that align directorinterests with those of stockholders.
Our director compensation plans run on a calendar-year basis. However, SEC rules require us to reportcompensation in this proxy statement on a fiscal-year basis. The second half of calendar year 2011 and the firsthalf of calendar year 2012 comprised fiscal year 2012. The types and rates of cash compensation are included inthe table below. For directors who served for all of the fiscal year, the fiscal year 2012 compensation rate is thesum of the applicable portions of the two calendar year amounts. For directors who joined the board or acommittee during the fiscal year, the fiscal year 2012 compensation is pro-rated.
CalendarYear 2011
CalendarYear 2012
FiscalYear 2012
Annual Retainer . . . . . . . . . . . . . . . . . . . . . . . . . . . . . . . . . . . . . . . . . . . . . . $50,000 $60,000 $55,000Lead Independent Director . . . . . . . . . . . . . . . . . . . . . . . . . . . . . . . . . . . . . . $12,500 $15,000 $13,750Audit Committee – Chair . . . . . . . . . . . . . . . . . . . . . . . . . . . . . . . . . . . . . . . $20,000 $25,000 $22,500Audit Committee – Member . . . . . . . . . . . . . . . . . . . . . . . . . . . . . . . . . . . . . * $12,500 $ 6,250Compensation Committee – Chair . . . . . . . . . . . . . . . . . . . . . . . . . . . . . . . . $15,000 $20,000 $17,500Compensation Committee – Member . . . . . . . . . . . . . . . . . . . . . . . . . . . . . . * $10,000 $ 5,000Nominating and Governance Committee – Chair . . . . . . . . . . . . . . . . . . . . . * $10,000 $ 5,000Nominating and Governance Committee – Member . . . . . . . . . . . . . . . . . . * $ 5,000 $ 2,500
* In calendar year 2011, the lead independent director received a single fee for his service both as leadindependent director and as chair of the nominating and governance committee. Separate fees forcommittee service were not paid in calendar year 2011.
New non-employee directors are generally eligible to receive an initial equity grant in the form of RSUs,upon the date of the first regularly scheduled board meeting attended by that director after first being appointedor elected to the board, with a targeted grant date value equal to $250,000 (the number of RSUs subject to theaward is determined by dividing $250,000 by the fair market value of a share of Company common stock as ofthe date of grant, rounded down to the nearest ten shares). The initial RSUs vest in four equal annual installmentsfrom the date of grant subject to the director’s continued service on the board. These equity grants are subject tothe terms and conditions of the Company’s 2007 Stock Incentive Plan and the applicable grant awardagreements.
Each non-employee director is eligible to receive an annual equity grant on a designated date in January ofeach year (or, if the designated date falls within a blackout window under applicable Company policies, on thefirst business day such grant is permissible under those policies) with a targeted grant date value equal to$160,000 (the number of RSUs subject to the award is determined by dividing $160,000 by the fair market valueof a share of Company common stock as of the date of grant, rounded down to the nearest ten shares). Thosegrants generally vest on November 1 in the year of grant.
21

Each non-employee director who was on the board on February 3, 2012 received a grant of 3,620 RSUs forservices during calendar year 2012. Each RSU grant issued in February 2012 vests in full on November 1, 2012,generally subject to the director’s continued service on the board. Receipt of the shares is deferred untilJanuary 25, 2013.
Drs. El-Mansy, Saraswat and Spivey and Mr. Whitaker were not deemed “new directors” in light of theirtransition to the Company’s board from the Novellus board following the Company’s acquisition of Novellus,which was completed in June 2012. Accordingly, they were given pro-rated annual board and committee fees andpro-rated annual equity grants of 1,820 RSUs. As with the other annual grants, these grants vest in full onNovember 1, 2012, subject to their service on the board on that date. The following table shows cash and equitycompensation for fiscal year 2012 for directors other than Messrs. Anstice and Newberry, whose compensation isdescribed below under “Compensation Discussion and Analysis”:
Director Compensation for Fiscal Year 2012
Name
Fees Earnedor Paid inCash ($)
StockAwards
($) (1)
All OtherCompensation
($) (2) Total
James W. Bagley . . . . . . . . . . . . . . . . . . . . . . . . . . . $415,000(5) $ 0 $16,577 $431,577David G. Arscott . . . . . . . . . . . . . . . . . . . . . . . . . . . . $ 25,000(6) $ 0 $ 0 $ 25,000Robert M. Berdahl . . . . . . . . . . . . . . . . . . . . . . . . . . $ 73,750(7) $159,968(3) $14,712 $248,430Eric K. Brandt . . . . . . . . . . . . . . . . . . . . . . . . . . . . . . $ 61,250(8) $159,968(3) $ 0 $221,218Michael R. Cannon . . . . . . . . . . . . . . . . . . . . . . . . . . $ 62,500(9) $159,968(3) $ 0 $222,468Youssef A. El-Mansy . . . . . . . . . . . . . . . . . . . . . . . . $ 3,644(10) $ 65,502(4) $ 1,278 $ 70,424Christine A. Heckart . . . . . . . . . . . . . . . . . . . . . . . . . $ 47,500(11) $159,968(3) $ 0 $207,468Grant M. Inman . . . . . . . . . . . . . . . . . . . . . . . . . . . . $ 75,000(12) $159,968(3) $14,712 $249,680Catherine P. Lego . . . . . . . . . . . . . . . . . . . . . . . . . . . $ 77,500(13) $159,968(3) $ 6,486 $243,954Kim E. Perdikou . . . . . . . . . . . . . . . . . . . . . . . . . . . . $ 48,750(14) $159,968(3) $ 7,670 $216,388Krishna C. Saraswat . . . . . . . . . . . . . . . . . . . . . . . . . $ 3,384(15) $ 65,502(4) $ 0 $ 68,886William R. Spivey . . . . . . . . . . . . . . . . . . . . . . . . . . $ 3,384(16) $ 65,502(4) $ 1,278 $ 70,164Abhijit Y. Talwalkar . . . . . . . . . . . . . . . . . . . . . . . . . $ 48,750(17) $159,968(3) $ 0 $208,718Delbert A. Whitaker . . . . . . . . . . . . . . . . . . . . . . . . . $ 3,774(18) $ 65,502(4) $ 0 $ 69,276
(1) The amounts shown in this column represent the grant date fair value of unvested restricted stock unitawards granted during fiscal year 2012 in accordance with Accounting Standards Codification 718,Compensation — Stock Compensation (“ASC 718”). However, pursuant to SEC rules, these values are notreduced by an estimate for the probability of forfeiture. The assumptions used to calculate the fair value ofthe restricted stock units in fiscal year 2012 are set forth in Note 11 in the Notes to Consolidated FinancialStatements of the Company’s Annual Report on Form 10-K for the fiscal year ended June 24, 2012.
(2) Represents the portion of medical, dental and vision premiums paid by the Company. For Mr. Bagley, alsoincludes $7,602 in company matching contributions to the 401(k) plan.
(3) On February 3, 2012, each non-employee director who was on the board received an annual grant of 3,620restricted stock units based on the $44.19 closing price of the Company’s common stock and the targetvalue of $160,000, rounded down to the nearest ten shares.
(4) On June 4, 2012, Drs. El-Mansy, Saraswat and Spivey and Mr. Whitaker each received a pro-rated annualgrant of 1,820 restricted stock units based on the $35.99 closing price of the Company’s common stock andthe target value of $65,753, rounded down to the nearest ten shares. The proration was based on the numberof days from June 4, 2012 through October 31, 2012.
(5) Mr. Bagley received $415,000, representing his annual fee. As explained below, his compensation is basedon his positions as an employee of the Company and chairman of the board.
(6) Mr. Arscott served on the board through November 3, 2011. He received $25,000, representing the fiscalyear 2012 portion of his calendar year 2011 annual retainer.
22

(7) Dr. Berdahl received $55,000, representing his annual retainer; $13,750 as lead independent director; and$5,000 as chair of the nominating and governance committee.
(8) Mr. Brandt received $55,000, representing his annual retainer; and $6,250 as a member of the auditcommittee.
(9) Mr. Cannon received $55,000, representing his annual retainer; $5,000 as a member of the compensationcommittee; and $2,500 as a member of the nominating and governance committee.
(10) Dr. El-Mansy received $3,124, representing his annual retainer; and $520 as a member of the compensationcommittee.
(11) Ms. Heckart received $42,500, representing her annual retainer; and $5,000 as a member of thecompensation committee.
(12) Mr. Inman received $55,000, representing his annual retainer; $17,500 as chair of the compensationcommittee; and $2,500 as a member of the nominating and governance committee.
(13) Ms. Lego received $55,000, representing her annual retainer; and $22,500 as chair of the audit committee.(14) Ms. Perdikou received $42,500, representing her annual retainer; and $6,250 as a member of the audit
committee.(15) Dr. Saraswat received $3,124, representing his annual retainer; and $260 as a member of the nominating and
governance committee.(16) Dr. Spivey received $3,124, representing his annual retainer; and $260 as a member of the nominating and
governance committee.(17) Mr. Talwalkar received $42,500, representing his annual retainer; $5,000 as a member of the compensation
committee; and $1,250 as a member of the nominating and governance committee.(18) Mr. Whitaker received $3,124, representing his annual retainer; and $650 as a member of the audit
committee.
Mr. Bagley has had a different compensation arrangement than the other directors due to his position as anemployee of the Company. Mr. Bagley’s compensation was approved by the independent members of the boardupon recommendation from the compensation committee. Mr. Bagley had an employment contract that expiredMarch 31, 2012, and he continued as an employee of the Company. He received $415,000 during the fiscal year.Mr. Bagley does not receive additional compensation for his role as a member of the board; he is not eligible forany performance bonus program offered by the Company; and he is not entitled to any equity awards other thanthose equity awards granted to him in the discretion of the independent members of the board. Mr. Bagley iseligible to participate in the Company’s Elective Deferred Compensation Program and medical, dental andinsurance benefit programs maintained by the Company that are generally applicable to executives of theCompany, subject to the general terms and conditions of the programs.
23

In addition, members of the board who have retired from the board can participate in the Company’sExecutive Retirement Medical and Dental Plan if they meet certain eligibility requirements. The most recentvaluation of the Company’s accumulated post-retirement benefit obligation under Accounting StandardsCodification 715, Compensation-Retirement Benefits (“ASC 715”), as of June 2012, for eligible former directorsand the current and former directors who may become eligible is shown below. Factors affecting the amount ofpost-retirement benefit obligation include age at enrollment, age at retirement, coverage tier (e.g., single, plusspouse, plus family), interest rate, and length of service.
Name
AccumulatedPost-Retirement
Benefit Obligation,as of June 2012
James W. Bagley . . . . . . . . . . . . . . . . . . . . . . . . . . . . . $260,000David G. Arscott . . . . . . . . . . . . . . . . . . . . . . . . . . . . . $311,000Robert M. Berdahl . . . . . . . . . . . . . . . . . . . . . . . . . . . . $236,000Eric K. Brandt . . . . . . . . . . . . . . . . . . . . . . . . . . . . . . . $122,000Michael R. Cannon . . . . . . . . . . . . . . . . . . . . . . . . . . . $ 93,000Youssef A. El-Mansy . . . . . . . . . . . . . . . . . . . . . . . . . $ 0Christine A. Heckart . . . . . . . . . . . . . . . . . . . . . . . . . . $ 43,000Grant M. Inman . . . . . . . . . . . . . . . . . . . . . . . . . . . . . . $285,000Catherine P. Lego . . . . . . . . . . . . . . . . . . . . . . . . . . . . $407,000Kim E. Perdikou . . . . . . . . . . . . . . . . . . . . . . . . . . . . . $ 94,000Krishna C. Saraswat . . . . . . . . . . . . . . . . . . . . . . . . . . $ 0William R. Spivey . . . . . . . . . . . . . . . . . . . . . . . . . . . . $ 0Abhijit Y. Talwalkar . . . . . . . . . . . . . . . . . . . . . . . . . . $ 70,000Delbert A. Whitaker . . . . . . . . . . . . . . . . . . . . . . . . . . $ 0
SECTION 16(a) BENEFICIAL OWNERSHIP REPORTING COMPLIANCE
Section 16(a) of the Exchange Act requires our executive officers, directors, and people who own more than10% of a registered class of our equity securities to file an initial report of ownership (on a Form 3) and reportson subsequent changes in ownership (on Forms 4 or 5) with the SEC by specified due dates. Our executiveofficers, directors, and greater-than-10% stockholders are also required by SEC rules to furnish us with copies ofall Section 16(a) forms they file. We are required to disclose in this proxy statement any failure to file any ofthese reports on a timely basis. Based solely on our review of the copies of the forms that we received from thefilers, and on written representations from certain reporting persons, we believe that all of these requirementswere satisfied during fiscal year 2012, with the exception of a filing by Timothy M. Archer on June 7, 2012 toreport the acquisition of 150,195 shares of Lam Research common stock and stock options to acquire 415,688shares of Lam Research common stock received by Mr. Archer in exchange for 133,507 shares of Novellus andstock options to acquire 369,500 shares of Novellus in connection with the merger of BLMS Inc., a whollyowned subsidiary of Lam Research, with and into, pursuant to the terms of the Agreement and Plan of Merger byand among BLMS Inc., Lam Research and Novellus, dated December 14, 2011.
24

EXECUTIVE COMPENSATION AND OTHER INFORMATION
COMPENSATION DISCUSSION AND ANALYSIS
This Compensation Discussion and Analysis (“CD&A”) describes the Company’s executive compensationprogram. It is organized as follows: In section I we provide an executive summary of our compensation program.In section II we discuss our philosophy and objectives regarding the program and its various components. Insection III we describe executive compensation governance and procedures. In section IV we analyze how andwhy the compensation committee of our board of directors arrived at specific compensation decisions for ourexecutive officers in fiscal year 2012 relating to payouts for completed performance periods and targets and goalsfor future periods, and we describe the financial, strategic and operational performance factors that guided thosecompensation decisions.1 Finally, section V addresses tax and accounting considerations related to compensationmatters.
Our CD&A discusses compensation earned by our “Named Executive Officers,” or NEOs, who are ourchief executive officer, our chief financial officer, three other highly compensated executives, as described underSEC rules, and our vice chairman who served as Chief Executive Officer (“CEO”) for a portion of the fiscal year.Our NEOs for fiscal year 2012 are as follows:
Name Position(s) Held During Fiscal Year 2012
Martin B. Anstice President and Chief Executive Officer beginning January 2012President and Chief Operating Officer through December 2011
Ernest E. Maddock Senior Vice President and Chief Financial Officer
Richard A. Gottscho Senior Vice President, Global Products
Sarah A. O’Dowd Group Vice President, Chief Legal Officer
Mukund Srinivasan2 Vice President and General Manager, Clean Business
Stephen G. Newberry Vice Chairman beginning January 2012Vice Chairman and Chief Executive Officer through December 2011
Figure 1. Fiscal Year 2012 NEO Positions.
I. EXECUTIVE SUMMARY
Our compensation philosophy is to pay for performance that creates stockholder value over the long termwhile delivering exceptional performance throughout fluctuating business cycles. Accordingly, compensation forthe Company’s NEOs is weighted toward incentive compensation that is tied to the achievement of businessobjectives. Compensation is reduced when objectives are not realized, and compensation is increased whenobjectives are exceeded.
1 For purposes of this CD&A, a reference to a compensation action or decision by the committee with respect tothe NEOs means an action or decision by the compensation committee and, in the case of our vice chairmanand chief executive officer, an action or decision by the independent members of our board of directors.
2 Dr. Srinivasan is the vice president and general manager of our clean business group. At the start of fiscal year2011, this position was considered an “executive officer” position as defined by SEC Rule 3b-7. Due tocorporate reorganization, at the end of fiscal year 2012, the position of product group general manager was nolonger considered to meet this definition. Accordingly, information regarding Dr. Srinivasan’s fiscal year 2012compensation is disclosed pursuant to SEC Regulation S-K Item 402(a)(3); forward looking informationregarding his fiscal year 2012 compensation is not disclosed in this CD&A.
25

To understand our executive compensation program fully, we feel it is important to understand thefollowing:
• Our business and our fiscal year 2012 financial performance;
• The extreme volatility over the past several years of the semiconductor equipment industry;
• The calendar year orientation of our executive compensation program and management system whilethe Company maintains a fiscal year ending in June; and
• Our compensation philosophy and program design, which reward executives for performance and forcreating shareholder value throughout fluctuating business cycles, and foster retention.
Our Business and Our Fiscal Year 2012 Financial Performance
Lam Research has been a leading supplier of wafer fabrication equipment and services for more than thirtyyears by contributing to the advancement of semiconductor manufacturing processes. These processes have inturn led to the proliferation of a variety of electronic products that impact our everyday lives, including cellphones, computers, memory, and networking equipment. Lam acquired Novellus Systems, Inc. (“Novellus”) onJune 4, 2012. As a result of the Novellus acquisition, we believe Lam is now better positioned to serve ourcustomer base by leveraging our technical expertise across a broader portfolio of products to address theincreasingly complex business of manufacturing integrated circuits.
Revenues declined in fiscal year 2012 as semiconductor device manufacturers slowed the pace of theircapacity expansions in response to weaker macroeconomic conditions impacting demand for certainsemiconductor devices. Throughout the fiscal year, we continued to make strategic investments focused onleading-edge plasma etch, single-wafer clean and other semiconductor manufacturing requirements to supportfuture growth opportunities. The resulting decrease in operating income is reflected in our fiscal year 2012financials. For further discussion of our fiscal year 2012 results and the effect on those results of consolidatingreporting with Novellus, see our Annual Report on Form 10-K.
26

Volatility of the Semiconductor Equipment Industry
The semiconductor capital equipment industry is highly competitive and subject to business cycles thathistorically have been characterized by rapid changes in demand that necessitate adjusting spending andmanaging capital allocation prudently across business cycles. The graph below (Figure 2) shows year-over-yearchanges in revenue growth for the electronics industry, the semiconductor industry, and the wafer fabricationequipment segment of the semiconductor equipment industry from 1998 to the present. The semiconductorindustry is considered to be a highly cyclical industry, with fluctuations responding to changes in the demand forsemiconductor devices. The graph illustrates the more extreme volatility of the semiconductor equipmentindustry, and in particular the wafer fabrication equipment segment of that industry in which we participate,during these demand cycles. We have responded to this extreme volatility with a flexible business model thatenables our operations team to adjust quickly to these rapid changes in demand while effectively managing costs.Our compensation program is designed to incorporate this same flexibility. See section IV for more explanationof this plan design.
-40%
-20%
CY
’199
8
CY
’199
9
CY
’200
0
CY
’200
1
CY
’200
2
CY
’200
3
CY
’200
4
CY
’200
5
CY
’200
6
CY
’200
7
CY
’200
8
CY
’200
9
CY
’201
1
CY
’201
0
0%
20%
40%
60%
80%
100%
120%
140%
Revenue Growth by Industry
Electronics Revenue Growth
Semiconductor Revenue Growth
Wafer Fabrication Equipment (WFE) Revenue Growth
Figure 2. Revenue Growth by Industry, 1998-2011.Sources: SEMI; World Semiconductor Trade Statistics, Inc. (WSTS); Gartner, Inc.; Lam ResearchCorporation
27

Although We Are a June Fiscal Year End Company, Our Executive Compensation Program is CalendarYear-Oriented
Our executive compensation program is designed and evaluated on a calendar year basis, rather than on afiscal year basis, to correspond with our annual calendar year-based business planning and compensation cycles.Therefore, this CD&A reflects a calendar-year orientation, as shown in Figure 3 below. The ExecutiveCompensation Tables at the end of this CD&A are based on the 2012 fiscal year, as required by SEC regulations.The numbers in this CD&A reflect decisions made by the committee relating to goals and payouts for a calendaryear and do not correspond directly to the fiscal year 2012 numbers in the Executive Compensation Tables.
6/27/2011
Calendar Year 2012Calendar Year 2011
Relevant for compensation program design andperformance evaluation
6/24/2012
Fiscal Year 2012
1/1/2011 1/1/2012 1/1/2013
Relevant for executivecompensation tables
Figure 3. Executive Compensation Calendar Year Orientation.
Our Executive Compensation Philosophy and Program Design are Performance Based, RewardingExecutives for Exceptional Performance Throughout Fluctuating Business Cycles and for CreatingStockholder Value, and Fostering Retention
As illustrated in Figure 4 below, the primary components of our executive compensation program areheavily weighted towards driving superior performance elements and stockholder value throughout fluctuatingbusiness cycles. The pay component mix changed in 2012 due to the timing of the Novellus merger, as furtherexplained under “Say on Pay Voting Results; Program Changes” below.
Goal-BasedEquity21.6%
Annual CashIncentive
15.5%
Long-Term CashIncentive32.0%
BaseSalary14.9%
Service-BasedEquity16.0%
Calendar Year 2010 NEO Target Pay Mix69% Performance Based(1)
Goal-BasedEquity18.9%
Annual CashIncentive
16.8%
Long-Term CashIncentive
32.5%
BaseSalary15.5%
Service-BasedEquity16.3%
Calendar Year 2011 NEO Target Pay Mix68% Performance Based
Annual CashIncentive
16.1%
Long-Term CashIncentive33.6% Base
Salary16.7%
Service-BasedEquity33.6%
Calendar Year 2012 NEO Target Pay Mix50% Performance Based
Performance-Based Compensation(2) Non-Performance-Based Compensation
(1) Data in Figure 4 for the 2010 and 2011 charts is for the then-applicable NEOs (i.e., fiscal year 2010 NEOsare represented in the calendar year 2010 chart, etc.). Mr. Newberry and Dr. Srinivasan are not included inthe calendar year 2012 chart.
(2) For purposes of this illustration, we include goal-based RSUs as performance based, but do not classifyservice-based RSUs as performance based.
Figure 4. Executive Compensation Target Pay Mix.
28

Our program design specifically drives exceptional performance throughout fluctuating business cycles,motivates stockholder value creation, and fosters retention by:
• Incorporating multiple performance-based metrics that represent superior business performance for thebenefit of our stockholders;
• Tying compensation directly to stockholder returns by including a stock price factor in the cash-basedportion of our long-term compensation program, which represents 50% of that program, and bydelivering the remaining 50% in equity;
• Setting objectives on an annual or semiannual basis, adjusting them upward or downward in growingor declining business environments in order to maintain stretch objectives under all businessconditions;
• Deferring payments under our long-term compensation program until completion of a two-year period.That is, there is no annual vesting, and employment until completion of the two-year period is requiredto receive any payouts under the long-term program;
• Operating the cash program so that we can record compensation expense in the period in which themetric (usually non-GAAP operating income) is realized rather than on an estimated basis over the lifeof the program, so that compensation expense is greater in periods when non-GAAP operating incomeis higher, and lower in periods when non-GAAP operating income is lower;
• Setting executive stock ownership guidelines, described in section II below, to foster creation ofstockholder value over the long term.
Our programs also include features that protect our stockholders against unreasonable compensationexpense and/or dilution. For example, both our annual and our long-term cash incentive programs incorporatecaps on individual and aggregate awards. In addition, 50% of our long-term compensation is delivered in cash,limiting the dilution associated with all-equity programs, and our long-term equity program awards are dollarbased rather than share based, preventing the issuance of excessive value in times of relatively high stock prices.Our philosophy and design are more fully described in sections II and IV.
As illustrated in Figure 5 below, we believe that our compensation programs and decisions have served tolink pay to operational and stock price performance over the past several years. As shown, total compensationawards have tracked changes in our revenue, operating income, and stock price performance over that period.Thus, in fiscal years 2010 and 2011, when revenue, operating income and stock price all rose, executive payincreased, and when those factors declined in 2008, 2009 and 2012, so did executive pay. Over the past severalyears, average amounts earned by our NEOs under our annual cash incentive program have averaged from 39%of target for calendar year 2008 to 166% of target for calendar year 2010, and under our long-term cash incentiveprogram they have averaged from 59% of target in 2008/2009 to 250% in 2006/2007, with the lower payoutsresponding to the difficult semiconductor equipment environment during the global recession and higher payoutsresponding to semiconductor industry demand growth.
29

8,368
7,070
4,275
6,210
9,393
12,589
8,878
7,323
12,080
13,700
(500,000)
-
500,000
1,000,000
1,500,000
2,000,000
2,500,000
3,000,000
3,500,000
-
2,000
4,000
6,000
8,000
10,000
12,000
14,000
FY2007 FY2008 FY2009 FY2010 FY2012FY2011
$ R
even
ue, N
et I
ncom
e (i
n th
ousa
nds)
$ T
otal
Com
pens
atio
n (i
n th
ousa
nds)
CEO and NEO Pay for Performance (Fiscal 2007-2012)
CEO Total Compensation (1) NEOs Total Compensation (excluding CEO) (2)
Revenue Net income(loss)
$45.80
$25.70
$35.39
$47.91Average Share Price
$46.55 $40.53
11,072
3,841
(1) “CEO Total Compensation” and “NEOs Total Compensation (excluding CEO)” consist of base salary,annual incentive payments, accrued values of the cash payments under the long-term incentive plan andgrant date fair values of equity based awards under the long-term incentive plan, and all othercompensation as reported in the Summary Compensation Table below. “Average Share Price,” shown asdollar figures superimposed on the bar chart, is equal to the average closing price for all trading daysduring the fiscal year.
(2) All years had five NEOs except fiscal years 2010 and 2012, which had six. Mr. Anstice’s total compensationfor the year (which represents six months as COO and six months as CEO) is shown in the CEO bar;Mr. Newberry’s compensation (which represents six months as CEO and six months as vice chair) waslower, as shown in the Summary Compensation Table at the end of this CD&A, and is included with theother NEOs.
Figure 5. CEO and NEO Pay for Performance (Fiscal Years 2007-2012).
2011 Say on Pay Voting Results; Program Changes
In 2011, our stockholders voted to approve our 2011 advisory vote on executive compensation, with 80.46%of the votes cast in favor of the advisory proposal. No significant design changes were made to the executivecompensation program following the 2011 stockholder “say on pay” vote or otherwise during fiscal year 2012.However, we have continued our efforts to improve our disclosure, and in particular to simplify the descriptionof our executive compensation.
30

We also deviated from our typical long-term program design in 2012 as a result of the merger with NovellusSystems, Inc. The merger had been announced, but had not been concluded, when compensation decisions weremade in February 2012 and, as a result, management did not set long-term goals for the combined organization atthat time, making it difficult for the committee to set appropriate performance goals under the long-termcompensation plan. For this reason, and to aid retention during the integration period, the long-term equity planfor the 2012/2013 performance period was modified to include only service-based equity.
II. PHILOSOPHY, OBJECTIVES AND PROGRAM COMPONENTS
Philosophy
The executive compensation philosophy articulated by the committee in February 2012 is as follows: Payfor performance while creating stockholder value over the long term and delivering exceptional performancethroughout fluctuating business cycles. We explain how our executive compensation program is designed todeliver on these elements below.
• Pay for performance. Our executive compensation program is designed and implemented to link pay toperformance by rewarding executives for achieving financial, strategic and operational objectives. Asillustrated in Figure 4 (see section I), historically under our program design, approximately 68% of ourtarget executive compensation has been performance based, and as illustrated in Figure 5 (see section I)our compensation payouts have tracked our revenue and net income. We focus our executives on theattainment of business performance objectives because we believe this approach best serves the long-terminterests of our stockholders. We include a variety of performance metrics in our annual and long-termprograms. For example, for calendar year 2012, business metrics included non-GAAP operating income,cash from operations, clean and etch product market share, and organizational performance, as more fullydiscussed in section IV below. We use non-GAAP metrics for operating income and cash from operationsbecause we believe non-GAAP measures better reflect the operating performance of the Company, andtheir use avoids rewarding or penalizing our executive team for nonrecurring and non-operating results.3
• Create stockholder value over the long term. Our executive compensation program is designed andimplemented to create stockholder value over the long term. We believe that the best way to createsuch value is to focus our executives on achieving outstanding business results. We believe that overtime, outstanding business results create stockholder value. We also believe that our executives’compensation should be directly tied to the welfare of our stockholders. We have therefore designedthe long-term program to include both cash and equity components that foster stockholder valuecreation. The cash portion, which is 50% of the total long-term award, builds stockholder value inseveral ways. First, paying in cash rather than equity reduces dilution for our stockholders. Second,while paid in cash, there also is a specific stock price-related factor in the program that serves to alignthe interests of participants with those of stockholders. Third, the program has been designed so that wecan record compensation expense in the period in which the metric (usually non-GAAP operatingincome) is realized, rather than on an estimated basis over the life of the program. That means thatcompensation expense is greater in periods when non-GAAP operating income is higher, and lower in
3 Non-GAAP results are designed to provide information about performance without the impact of certainnon-recurring and other non-operating line items. Non-GAAP operating income and non-GAAP cash fromoperations are derived from GAAP results, with charges and credits in the following line items excluded fromnon-GAAP results during applicable quarters during fiscal years 2012 and 2011: restructuring and impairmentcharges and benefits; acquisition-related and integration-related costs; certain costs associated with a customerbankruptcy filing; costs associated with rationalization of certain product configurations; amortization relatedto intangible assets acquired in the Novellus transaction; impairment of investment; acquisition-relatedinventory fair value impact; amortization of convertible note discount; net tax benefit of research anddevelopment credits; tax expense associated with legal entity restructuring; and the tax effects related to theseline items. Non-GAAP cash from operations is derived from GAAP cash from operations, with adjustments tonon-GAAP net income, receivables, and inventory.
31

periods when non-GAAP operating income is lower. We believe that this ability to matchcompensation expense recognition to the period in which non-GAAP operating income is earnedenhances stockholder value creation throughout fluctuating business cycles. The other half of our long-term program is delivered in equity which directly aligns management and stockholder interests forstock appreciation. The cash and equity portions of our long-term incentive program are described insection IV. The Company’s executive stock ownership guidelines, described below, also foster creationof stockholder value over the long term.
• Motivate exceptional performance throughout fluctuating business cycles. Our executive compensationprogram is designed and implemented to deliver exceptional strategic, financial and operational resultsthroughout the extreme fluctuations in our business cycles (See Figure 2 in section I for an illustrationof the volatility in our industry.) Because business cycles in our industry can change rapidly, ourprograms authorize the compensation committee to evaluate key corporate performance metrics everysix months to reflect changes in the business environment. Under this principle of flexibility, changesmay be made in either direction, depending upon the business environment, so that metrics are mademore difficult as the business improves and more realistic as the business declines. In all cases, metricsare set as stretch goals. In difficult business environments or in situations where management haselected to make extraordinary investments in the future, metrics are set so that achievement of targetawards requires performance exceeding actual corporate plans. Consistent with this principle offlexibility, our executive compensation plans also allow us to use equity in a flexible manner, withdifferent types and timing of awards (service-based RSUs, stock options and performance-based RSUs)available to attract, motivate and retain executives in different business environments.
Compensation Objectives
Within the framework of our compensation philosophy, we have designed and operated our executivecompensation programs to achieve the following objectives:
• Attract and retain exceptionally talented executives. In order to attract and retain executives who candeliver the exceptional levels of performance required for our business to succeed, we offer targetcompensation that is competitive with that of similarly positioned, high-performing executives atcompanies with which we compete for talent. We also promote retention by including compensationelements that are contingent on long-term service to the Company, including the two-year cliff vestingcycle of our long-term incentive program.
• Motivate executives. Our compensation arrangements are designed to motivate executives by enablingthem to earn rewards above target levels for above target corporate and individual performance.
• Match performance-based compensation expenses to the periods in which the performance occurs.Since our industry is subject to rapid changes in demand that require us to have a flexible businessstructure, we reset goals on an annual and six-month basis to respond to those changes. The cashprogram that is part of our long-term incentive program allows us to match performance-basedcompensation expenses to the periods in which the performance occurs, to assist management inadjusting to these rapid changes while effectively managing costs.
• Maintain cost-effectiveness. To the extent practical, we structure our compensation programs to becost-effective to the Company and its stockholders. We consider the tax deductibility of compensationexpenses for the Company, and we carefully monitor the dilutive impact of equity compensationawards. As noted above, we also set ceilings on performance-based awards to ensure that actualcompensation is not unreasonably high in relation to target compensation during periods ofexceptionally strong performance.
• Protect stockholder interests from unreasonable compensation expense and/or dilution. Our programsalso include features that protect our stockholders against unreasonable compensation expense and/ordilution. For example, both our annual and our long-term cash incentive programs incorporate caps onindividual and aggregate awards. In addition, 50% of our long-term compensation is delivered in cash,
32

limiting the dilution associated with all-equity programs, and our long-term equity program awards aredollar based rather than share based, preventing the issuance of excessive value in times of relativelyhigh stock prices.
Stock Ownership Guidelines
We have stock ownership guidelines for our executive officers, as shown in Figure 6 below, that serve tofurther align executives’ interests with those of our stockholders. The requirements are specified in thealternative of shares or dollars to allow for stock price volatility. Ownership levels as shown below must beachieved within five years of appointment as an executive officer; and increased requirements due to promotionsmust be achieved within three years of promotion. Our ownership guidelines are set to be in line with marketpractices of companies that typically deliver long-term compensation entirely in equity, although 50% of ourlong-term incentive program is awarded in cash.
Position Guidelines (lesser of)
CEO 3x base salary or 65,000 shares
COO/CFO 2x base salary or 25,000 shares
Other NEOs 2x base salary or 20,000 shares
Figure 6. Executive Stock Ownership Guidelines.
III. EXECUTIVE COMPENSATION GOVERNANCE AND PROCEDURES
Role of the Compensation Committee
The board of directors has delegated certain responsibilities to the compensation committee (“committee”)through the committee charter, and the committee oversees the incentive, equity-based and other compensationplans in which our executive officers (including the NEOs) participate. A copy of the committee’s charter can beviewed at http://investor.lamresearch.com.
Key committee responsibilities include, but are not limited to: evaluating the performance of the chiefexecutive officer, the chairman and the vice chairman of the board, and recommending their compensation to theindependent members of the board of directors; determining the compensation packages, targets, and payouts forexecutive officers other than the CEO; and reviewing, and approving where appropriate, equity-basedcompensation plans. During fiscal year 2012, Mr. Anstice and Mr. Newberry each served as CEO for part of theyear, and Mr. Newberry continued to serve as vice chairman for the remainder of the year. Accordingly, theindependent members of our board of directors, upon recommendation from the committee, approvedMr. Anstice’s and Mr. Newberry’s compensation packages, targets and payouts. For additional information onthe committee’s responsibilities, see “Corporate Governance: Board Committees” above.
In order to carry out these responsibilities, the committee receives and reviews information, analysis andproposals prepared by our management and by the committee’s compensation consultant and other advisors (see“Role of Committee Advisors” below).
Role of Management
The chief executive officer, with support from our human resources and finance organizations, developsrecommendations for the compensation of our executive officers, including our NEOs. Typically, theserecommendations cover the base salaries, annual incentive plan target award opportunities, long-term incentiveplan target award opportunities and the criteria upon which these award opportunities may be earned, as well asactual payout amounts under annual and long-term incentive plans.
33

Working with its independent consultant, Compensia, Inc., a national compensation consulting firm(“Compensia”), the committee considers the CEO’s recommendations within the context of competitivecompensation data, the committee’s compensation philosophy and objectives, current business conditions, andany other factors it considers relevant. At the request of the committee, the chairman and/or vice chairman of theboard provides input to the committee on the chief executive officer’s recommendations.
Our chief executive officer generally attends committee meetings at the request of the committee. The chiefexecutive officer leaves the meeting for any discussion of his own compensation, when the committee meets inexecutive session, and at any other time requested by the committee.
Role of Committee Advisors
The committee is authorized to engage its own advisors to assist in carrying out its responsibilities. Thecommittee has engaged the services of Compensia. Compensia provides the committee with guidance regardingthe amount and types of compensation for our chairman, vice chairman and NEOs and how these compare toother companies’ compensation practices, as well as guidance on market trends, evolving regulatoryrequirements, compensation of our independent directors, and other matters as requested by the committee.
Representatives of Compensia regularly attend committee meetings (including executive sessions withoutmanagement present), communicate with the committee chair outside of meetings, and assist the committee withthe preparation of metrics and goals. Compensia reports to the committee, not to management. At thecommittee’s request, Compensia meets with members of management to gather and discuss information that isrelevant to advising the committee. The committee may replace Compensia or hire additional advisors at anytime. Compensia has not provided any other services to the committee or to our management and has received nocompensation other than with respect to the services described above.
Peer Group Practices and Survey Data
In establishing the total compensation levels of our executive officers as well as the mix and weighting ofindividual compensation elements, the committee monitors compensation data from a group of comparably sizedcompanies in the technology industry (the “Peer Group”), which may differ from peer groups used by proxyresearch and voting advisory firms. The committee selects the companies constituting our Peer Group based on theircomparability to our lines of business and industry, annual revenue, and market capitalization, and our belief that weare likely to compete with them for executive talent. Our Peer Group is focused on the semiconductor,semiconductor equipment and materials, and solar technology industries. Figure 7 below summarizes how the PeerGroup companies compare to the Company:
Metric
Lam ResearchCalendar Year
2011 ($M)Target for Peer
Group
Peer GroupMedian as of
December 31, 2011
Revenue . . . . . . . . . . . . . . . . . . . . $2,826 0.33 to 3 times Lam $2,613Market Capitalization . . . . . . . . . $4,425 0.33 to 3 times Lam $6,230
Figure 7. 2012 Peer Group Revenue and Market Capitalization.
34

Based on these criteria, the Peer Group may be modified from year to year. Our Peer Group in effect inFebruary 2012, when payout decisions for calendar year 2011 were made and compensation targets for 2012were set, consists of the companies listed below, which represents the same Peer Group we used in February2011 with the following exceptions: we added three new peers that met our peer group criteria (Advanced MicroDevices, Inc., Broadcom Corporation, and ON Semiconductor Corporation); removed two peers that no longermet the criteria (Cypress Semiconductor Corporation and MEMC Electronics Materials, Inc.); and removed twopeers that were acquired during the intervening year (National Semiconductor Corporation and VarianSemiconductor Equipment Associates, Inc.) as well as Novellus.
Advanced Micro Devices, Inc. LSI Corporation
Altera Corporation Marvell Technology Group Ltd
Analog Devices, Inc. Maxim Integrated Products, Inc.
Applied Materials, Inc. Molex Incorporated
Atmel Corporation NVIDIA Corporation
Avago Technologies ON Semiconductor Corporation
Broadcom Corporation SanDisk Corporation
Fairchild Semiconductor International, Inc. SunPower Corporation
First Solar, Inc. Teradyne, Inc.
KLA-Tencor Corporation Xilinx, Inc.
Figure 8. Calendar Year 2012 Peer Group Companies.
We derive revenue, market capitalization and NEO compensation data for the Peer Group companies fromtheir public filings with the SEC and other publicly available sources. In addition to analyzing Peer Groupinformation, our human resources department and Compensia analyze selected survey data on base salary, bonustargets, equity awards, and total compensation drawn from the Radford Executive Survey (“Radford Survey”).Radford is a leading provider of compensation data.
The committee reviews compensation practices at Peer Group companies and selected data from theRadford Survey primarily as a reference to ensure compensation packages are within market norms. Typicallybase pay levels are designed to approximate market median and variable pay is designed to deliver above marketmedian for exceptional performance. However, the committee does not “target” pay at any specific percentiles.Rather, individual pay positioning depends on a variety of factors, such as prior job performance, job scope andresponsibilities, skill set, prior experience, the executive officer’s time in his or her position with us, internalequity regarding pay levels for similar skill levels or positions, external pressures to attract and retain executivetalent, Company performance and general market conditions.
IV. PRIMARY COMPONENTS OF NEO COMPENSATION; CALENDAR YEAR 2011COMPENSATION PAYOUTS; CALENDAR YEAR 2012 COMPENSATION TARGETS ANDMETRICS
In fiscal year 2012, management received feedback from stockholders and stockholder advisory groups thatrevealed a need to improve our disclosures and provide more clarity to ensure understanding of our executivecompensation program. This section describes the components of our executive compensation program. It alsodescribes, for each component, the payouts to our NEOs for calendar year 2011 and the forward-looking actionstaken with respect to our NEOs in calendar year 2012.
35

Base Salary
Base salaries represent one of the primary components of our executive compensation program. We believethe purpose of base salary is to fairly and competitively compensate our executive officers, including our NEOs,with a fixed amount of compensation for the jobs they perform. Accordingly, we seek to ensure that our basesalary levels are competitive in reference to Peer Group practice and the data generally suggested by the RadfordSurvey. Adjustments to base salary are generally considered by the committee each year in February.
For calendar years 2011 and 2012, base salaries were determined by the committee in February and becameeffective in April based on the factors described above. The base salary for Mr. Anstice was increased January 1,2012 in connection with his promotion to CEO. The base salary for Mr. Newberry was reduced January 1, 2012in connection with his move to vice chairman. The base salaries of the NEOs for calendar years 2011 and 2012are as follows:
Named Executive Officer
BaseSalary as
ofApril 2011
BaseSalary as
ofApril 2012
Martin B. Anstice . . . . . . . . . . . . . . . . . . . . . . . . . . . . . . . . . . . . . . . $550,000 $665,000(1)
Ernest E. Maddock . . . . . . . . . . . . . . . . . . . . . . . . . . . . . . . . . . . . . . $471,000 $485,000Richard A. Gottscho . . . . . . . . . . . . . . . . . . . . . . . . . . . . . . . . . . . . . $425,000 $438,000Sarah A. O’Dowd . . . . . . . . . . . . . . . . . . . . . . . . . . . . . . . . . . . . . . . $375,000 $386,000Mukund Srinivasan . . . . . . . . . . . . . . . . . . . . . . . . . . . . . . . . . . . . . . $300,000 $325,000Stephen G. Newberry . . . . . . . . . . . . . . . . . . . . . . . . . . . . . . . . . . . . $885,000 $500,000(1)
(1) Effective January 1, 2012.
Figure 9. 2011-2012 NEO Base Salaries.
Annual Incentive Program
Our annual incentive program provides short-term incentive-based compensation to our executive teambased on performance against pre-set corporate and organizational metrics. The committee establishes individualtarget opportunities for each executive officer as a percentage of base salary. Specific target award opportunitiesare determined based on job scope and responsibilities, as well as an assessment of competitive compensationdata. Awards are capped at a multiple of the target opportunity. The cap for 2012 was set at 2.25 times target,consistent with prior years. For example, if an NEO’s target is 85% of base salary, then the cap is 191% of basesalary. The committee reserves the right to settle annual incentive payments in cash, Company shares, or anycombination of cash and Company shares, based on the Company’s cash position. Historically, these paymentshave been settled in cash.
To create a maximum payout amount from which annual incentive program payouts may be made, thecommittee establishes a performance-based funding factor metric and related goals (“Funding Factor”). Thecommittee may exercise negative (but not positive) discretion against the Funding Factor result, and the entirefunded amount generally is not paid out. The committee also tracks specific corporate-wide metrics and relatedgoals that apply to all executive officers (“Corporate Factor”), and organization-specific metrics and related goalsthat apply to each individual NEO (“Organization Factors”). The specific metrics and goals for the CorporateFactor and the Organization Factor, and their relative weightings, are based upon the recommendation of ourchief executive officer. These goals are set to be more difficult than the Funding Factor goal. The CorporateFactor and Organization Factor results are weighted equally in making payout decisions, and discretion may beapplied against these results in a positive or negative direction. Very strong performance is required to receivepayouts above the target award opportunity, and weaker performance results in lower payouts.
The metric and goals for the Funding Factor are generally set on an annual basis (for calendar year 2012,because of the Novellus acquisition, the metric and goals were set on a semi-annual basis); metrics and goals for
36

some of the other performance factors are set every six months to preserve the flexibility to make adjustments inresponse to changes in our historically highly cyclical business environment. New goals are set depending on thebusiness environment, to ensure that they remain stretch goals regardless of changes in the environment. Asbusiness conditions improve, goals are set to require better performance, and as business conditions deteriorate,goals are set to ensure stretch performance under more difficult conditions. Over the last three years, at thesix-month reset point, the goals have been set higher once, set lower once, and remained the same once. Webelieve this ability to reset goals motivates exceptional performance and delivers stockholder value throughoutfluctuating business cycles.
The committee uses the Corporate Factor and Organization Factors to obtain a view of corporate andorganizational performance, and may exercise discretion against either of these factors based on its assessment ofbusiness, leadership team or individual performance. The committee uses the results from these factors todetermine whether and in what amount to exercise negative discretion against the Funding Factor pool. TheCorporate Factor and Organization Factor results are weighted equally in determining the final result. We believethe metrics and goals set under this program, together with the exercise of discretion as described above, havebeen effective to achieve pay-for-performance results, as illustrated in Figure 5 in section I above and in Figure10 below. Over the five year period from 2008 to 2012, average payouts for our NEOs have varied from 39% oftarget for 2008, reflecting the weak semiconductor equipment industry conditions that affected companyperformance during that period, to 166% of target for 2010, reflecting the strong business environment andcorporate performance achieved that year. The payment for calendar year 2011 performance was 99%, reflectinggood performance despite a weakening business environment versus calendar year 2010.
CalendarYear
Average NEO’s AnnualIncentive Payout as %
of Target AwardOpportunity Business Environment
2011 99% Healthy semiconductor demand under weakening economic conditions;business conditions deteriorated in the second half of calendar year 2011
2010 166% Strong operating performance supported by semiconductor industrydemand growth
2009 81% Difficult business environment through the first half of calendar year 2009;improving conditions in the second half of calendar year 2009
Figure 10. Annual Incentive Program Payouts for Calendar Years 2009-2011.
37

Annual incentive program parameters and payout decisions for calendar year 2011
The committee had set the calendar year 2011 target opportunity for each NEO in February 2011, togetherwith the Funding Factor metric and goals, and metrics for Corporate and Organization Factors. To allowflexibility to respond to changing business conditions, goals relating to the Corporate Factor and some of theOrganization Factors were set on a six-month basis and revisited in July, others were set for the full year. InFebruary 2012, the committee considered the actual results under the various factors and made payout decisionsfor the calendar year 2011 program, all as described below.
2011 Annual Award Opportunities. The committee had approved the following target annual incentiveaward opportunities for calendar year 2011 for each NEO as follows:
Named Executive Officer
Target AwardOpportunity (% of
Base Salary)
Martin B. Anstice . . . . . . . . . . . . . . . . . . . . . . . . . . . . . . . . . . . . . . . . . . . . 100%Ernest E. Maddock . . . . . . . . . . . . . . . . . . . . . . . . . . . . . . . . . . . . . . . . . . . 85%Richard A. Gottscho . . . . . . . . . . . . . . . . . . . . . . . . . . . . . . . . . . . . . . . . . . 85%Sarah A. O’Dowd . . . . . . . . . . . . . . . . . . . . . . . . . . . . . . . . . . . . . . . . . . . . 75%Mukund Srinivasan . . . . . . . . . . . . . . . . . . . . . . . . . . . . . . . . . . . . . . . . . . . 70%Stephen G. Newberry . . . . . . . . . . . . . . . . . . . . . . . . . . . . . . . . . . . . . . . . . 150%
Figure 11. 2011 Annual Target Award Opportunities.
2011 Annual Incentive Program Funding Factor. In February 2011, the committee set the Funding Factorfor the full year based on non-GAAP operating income as a percentage of revenue. A minimum of 7.5%non-GAAP operating income percentage was required to fund any program payments, and performance greaterthan or equal to 20% would fully fund the pool for maximum payout potential of 225%. Actual performance wasinterpolated between those points. Based on calendar year 2011 non-GAAP operating income of 18.1% ofrevenue, the Funding Factor resulted in a potential payout pool of up to 207% of target award opportunity. Thecommittee exercised negative discretion against this Funding Factor result in making actual payment decisions,as described under “2011 Payout Decisions” below.
2011 Annual Incentive Program Corporate Factor. The committee set the metrics for the calendar year 2011Corporate Factor as non-GAAP operating income (weighted 65%) and non-GAAP cash flow from operations(weighted 35%), both as a percentage of revenue. It set goals of 21.0% and 28.0% of revenue, respectively, for thefirst half of the year in February; and in July, it set goals of 18.0% and 21.0% of revenue, respectively, for thesecond half of the year. Actual non-GAAP operating income percentage was 22.8% of revenue for the first half ofcalendar year 2011, and 12.2% of revenue for the second half, resulting in a factor of 0.925 for the year. Actual non-GAAP cash flow from operations percentage was 29.4% of revenue for the first half of calendar year 2011, and20.4% of revenue for the second half, resulting in a factor of 1.040 for the year. This performance resulted in a totalCorporate Factor for calendar year 2011 of 0.965.
2011 Annual Incentive Program Organization Factors. Calendar year 2011 Organization Factors were setfor each NEO. The Organization Factors for Messrs. Anstice and Newberry were based on market share goals(weighted 70%) and on the average Organization Factor of other organizations reporting to them (weighted30%). For other NEOs, specific Organization Factors were based on market share goals and/or strategic,operational and organizational performance goals specific to the organizations they manage. The committeeexercised discretion in evaluating the executives’ overall Organization Factor performance.
• Mr. Anstice’s Organization Factor was comprised of etch market share (40%), clean market share(30%), and the average Organization Factor of all organizations reporting to him (30%).
• Mr. Maddock’s Organization Factor was comprised of strategic, operational and organizationaldevelopment goals for finance (35%), for global information systems (35%), for Silfex (20%) and forinvestor relations (10%).
38

• Dr. Gottscho’s Organization Factor was comprised of market share, strategic, operational andorganizational development goals for etch (50%) and for clean (50%).
• Ms. O’Dowd’s Organization Factor was comprised of strategic, operational and organizationaldevelopment goals for global human resources (50%), and for legal (50%).
• Dr. Srinivasan’s Organization Factor was comprised of market share, strategic, operational andorganizational development goals for clean.
• Mr. Newberry’s Organization Factor was comprised of etch market share (40%), clean market share(30%), and the average Organization Factor of all organizations reporting to him (30%).
The Organization Factor results for our NEOs were: Mr. Anstice, 0.93; Mr. Maddock, 1.09; Dr. Gottscho,0.93; Ms. O’Dowd, 1.15; Dr. Srinivasan, 0.90, and Mr. Newberry, 0.93.
2011 Payout Decisions. In February 2012, the committee exercised negative discretion against the FundingFactor pool, and made payouts for calendar year 2011 for each NEO, as follows: Mr. Anstice, $521,125;Mr. Maddock, $416,823; Dr. Gottscho, $339,032; Ms. O’Dowd, $308,868; Dr. Srinivasan, $194,068; andMr. Newberry, $1,244,414.
Calendar year 2012 annual incentive program parameters
In February 2012, the committee set the target award opportunity for each NEO as a percentage of basesalary, and consistent with prior years set a cap on payments equal to 2.25 times target. The target awardopportunity for each NEO is: Mr. Anstice, 125%; Mr. Maddock and Dr. Gottscho, 85%; Ms. O’Dowd, 75%.4
The committee also approved a metric and first half goals for the Funding Factor and for the CorporateFactor based on non-GAAP operating income as a percentage of revenue. Consistent with plan design, theCorporate Factor goal is more difficult to achieve than the Funding Factor goal. Organization Factor metrics andgoals were also set for each NEO. These include market share and strategic and operational performance goalsspecific to individual business organizations. As a result, each NEO has multiple performance metrics and goalsunder this program. Some of the goals set in February were six-month goals, and in those cases goals were set forthe second half in July.
Long-Term Incentive Program
Our long-term incentive program provides longer-term incentive-based and service-based compensation toour executive team. It operates on a two-calendar year cycle, with target award opportunities set at the start ofeach two-year performance period. Target award opportunities are expressed half in cash and half in equity.Consistent with our philosophy of paying for performance, the long-term incentive program has been designed tobe 75% performance based and 25% service based. A deviation from the long-term program design was made in2012 as a result of the merger with Novellus. The merger had been announced, but had not been concluded, whencompensation decisions were made in February 2012 and, as a result, management had not set long-term goalsfor the combined organization by that time, making it difficult for the committee to set appropriate long-termgoals under the long-term compensation plan. As a result, and to aid retention during the integration period, forthe 2012/2013 performance period, the long-term incentive plan pay components are 50% performance-basedcash and 50% service-based restricted stock units. Since this is a deviation from the historical plan design ineffect for all periods discussed other than calendar year 2012, we reference the 75% performance-based mix indescribing the program design.
4 As explained in footnote 2 above, forward-looking information regarding Dr. Srinivasan’s compensation is notincluded here. Similarly, information regarding Mr. Newberry’s fiscal year 2013 compensation is not includedhere. Following his transition from CEO in January 2012, he is no longer eligible for this program. Hisemployment agreement is described in “Potential Payments Upon Termination or Change in Control” below.
39

We are the only company in our peer group that uses cash in our long-term incentive program. Half of thelong-term target award is made in cash, and the cash portion of the program is 100% performance based. Webelieve that the cash portion of our program has been successful in driving superior long-term performancethroughout the high volatility we have experienced in our industry and our business over the past several years.(See Figure 5 in section I for an illustration of our overall “pay for performance” results and Figure 13 below foran illustration of alignment of our cash program payouts to our performance.) The other half of the long-termaward is made in equity, and historically half of the equity award (25% of the total award) has been performancebased, delivered in either performance-vested RSUs or stock options. The remaining half of the equity award(25% of the total award) has been delivered through service-vested RSUs. Therefore, historically 75% of the totalaward – the cash award and half of the equity award — is performance based. The performance-based equitycomponent of the long-term program is reviewed annually to determine whether performance-based RSUs orstock options are the most appropriate form for the award based on criteria such as the current businessenvironment, the perceived potential value to motivate and retain the executives, and the accounting impactrelative to the potential value delivered.
Target Award Opportunity
Under the long-term incentive program, the committee sets a target award opportunity for each participant, acap on potential payouts (2.5 times the target award opportunity), and metrics and goals for the program. Multiplemetrics and goals are used in the program, with separate metrics and goals set for the cash and performance-basedequity components of the program. The service-based equity component of the program aligns our executives withour stockholders by tracking changes in stock price over the vesting period. This alignment is further enhanced byour stock ownership guidelines. (See “Stock Ownership Guidelines” in section II above.)
Target award opportunities are set at the beginning of each two-year performance period based on theexecutive’s position and responsibilities and an assessment of competitive compensation data. Long-term cashawards are capped at 2.5 times these target amounts. Because each performance period covers performance intwo calendar years, three performance cycles affect compensation during each fiscal year. The target amounts(which included both the cash and equity long-term incentive awards) for each NEO under the three programcycles affecting fiscal year 2012 are as follows:
Named Executive Officer
Long-TermIncentive
PlanPerformance
Period
TargetAward
Opportunity
Martin B. Anstice . . . . . . . . . . . . . . . . . . . . . . . . . . . . 2012/2013 $3,500,0002011/2012 $2,400,0002010/2011 $2,000,000
Ernest E. Maddock . . . . . . . . . . . . . . . . . . . . . . . . . . . 2012/2013 $1,600,0002011/2012 $1,600,0002010/2011 $1,600,000
Richard A. Gottscho . . . . . . . . . . . . . . . . . . . . . . . . . . 2012/2013 $1,600,0002011/2012 $1,600,0002010/2011 $1,350,000
Sarah A. O’Dowd . . . . . . . . . . . . . . . . . . . . . . . . . . . . 2012/2013 $1,250,0002011/2012 $1,250,0002010/2011 $1,250,000
Mukund Srinivasan . . . . . . . . . . . . . . . . . . . . . . . . . . . 2011/2012 $ 800,000
Stephen G. Newberry . . . . . . . . . . . . . . . . . . . . . . . . . 2011/2012 $4,500,0002010/2011 $4,500,000
Figure 12. Long-Term Incentive Program Target Award Opportunities, 2010/2011 to 2012/2013.
40

Long-Term Cash Incentive Program
As noted above, one half of the total long-term target award for each two-year performance period isawarded under the cash portion of the program, and this portion is 100% performance-based. The committee setsperformance metrics under each two-year performance period on an annual basis. Because historically theCompany’s business environment has been very volatile, goals against the metrics are set every six months. Thisflexibility allows the committee to react to changes in the external business environment. When businessconditions improve, goals are set to require stronger performance, and when business conditions deteriorate,goals are set to ensure stretch performance under more difficult conditions. As with the annual incentiveprogram, we believe this flexibility motivates exceptional performance and delivers stockholder value throughoutfluctuating business cycles.
In addition to motivating exceptional performance, the cash portion of our long-term program buildsstockholder value creation in several ways. First, paying in cash rather than equity reduces dilution for ourstockholders. Second, there is a specific stock price-related factor in the program that serves to align the interestsof management and the stockholders. Third, the program has been designed so that we can record compensationexpense in the period in which the metric (usually non-GAAP operating income) is realized rather than on anestimated basis over the life of the program. That is, compensation expense is greater in periods when non-GAAPoperating income is higher, and lower in periods when non-GAAP operating income is lower. We believe thatthis ability to match compensation expense recognition to the period in which non-GAAP operating income isearned enhances stockholder value creation throughout fluctuating business cycles.
Results determined based on performance against the pre-set goals are adjusted to reflect stock priceappreciation occurring during the performance period. The adjustment is made quarterly referencing a ratio of(x) the market price of our common stock over a 50-trading-day period to (y) the market price of our commonstock over a 200-trading-day period, if the ratio is greater than one. Thus the final payout amount is determinedby achievement against the performance goals adjusted by stock price appreciation, and subject to the cap thecommittee sets and any negative discretion the committee might exercise.
For each two-year performance period cliff vesting occurs and payouts are made following the end of thesecond year to those participants who remain employed on the Award Determination Date. For example, theperformance period for the 2010/2011 program covered calendar years 2010 and 2011, and payments for thatcycle were made on February 17, 2012, to those participants who remained employed on that date.
41

We believe this program has been effective to achieve pay-for-performance results, as illustrated in Figure13 below.
Long-TermCash Cycle
Average Long-TermCash Award as %
of Target Business Environment
2010/2011 165% 2011: Healthy semiconductor demand under weakening economicconditions; business conditions deteriorated in the second half of calendaryear 2011
2010: Strong operating performance supported by semiconductor industrydemand growth
2009/2010 119% 2010: Strong operating performance supported by semiconductor industrydemand growth
2009: Difficult business environment of global downturn continued throughthe first half of calendar year 2009; improved conditions in the second halfof calendar year 2009
2008/2009 59% 2009: Difficult business environment of global downturn continued throughthe first half of calendar year 2009; improved conditions in the second halfof calendar year 2009
2008: Difficult business environment of global downturn in economy; weaksemiconductor demand environment
Figure 13. Long-Term Cash Payouts, 2008/2009 to 2010/2011.
Payout decisions under the 2010/2011 long-term cash program. In February 2012, the committeedetermined payouts for the 2010/2011 performance cycle. The performance metric for both years of the programwas non-GAAP operating income, and the starting equity price for determination of stock price appreciationmetric was set as $30.32 Specific non-GAAP operating income goals were set in six month increments, andduring the entire performance period, these goals ranged from $121 million to $201 million, reflecting stretchgoals under prevailing business conditions. Actual quarterly performance of non-GAAP operating income rangedfrom 44% to 125% of goal. Without regard to stock price appreciation, the resulting payout would have been102% of target for the entire period. However, the stock price appreciation metric served to increase the payoutsto 165% of target. The committee did not exercise negative discretion against these results.
Payouts for the eligible NEOs were awarded at 165% of target, as follows:
Named Executive Officer(1)
TargetTwo-Year
Cash Award Cash Payout
Martin B. Anstice . . . . . . . . . . . . . . . . . . . . . . . . . . . . $1,000,000 $1,648,516Ernest E. Maddock . . . . . . . . . . . . . . . . . . . . . . . . . . . $ 800,000 $1,318,813Richard A. Gottscho . . . . . . . . . . . . . . . . . . . . . . . . . . $ 675,000 $1,112,748Sarah A. O’Dowd . . . . . . . . . . . . . . . . . . . . . . . . . . . . $ 625,000 $1,030,323Stephen G. Newberry . . . . . . . . . . . . . . . . . . . . . . . . . $2,250,000 $3,709,161
(1) Dr. Srinivasan did not participate in the 2010/2011 program.
Figure 14. 2010/2011 Long-Term Cash Awards.
Calendar year 2011 and 2012 decisions under the 2011/2012 long-term cash program. The year-longparameters of the 2011/2012 performance period were set in February 2011. The target award amounts were setat that time, and are shown in the table below. At that time, the committee also set non-GAAP operating income
42

as the performance metric for the 2011 calendar year portion of the 2011/2012 program and set the starting pricefor measuring stock price appreciation for the 2011 calendar year at $41.21, the 200-day moving average as ofDecember 23, 2010. In February 2012, the committee retained non-GAAP operating income as the performancemetric and retained $41.21 as the starting price for measuring stock price appreciation for the 2012 calendar yearportion of the program. Specific goals against the non-GAAP operating income have been set in advance on asix-month basis throughout the two-year period. Payouts will be determined and made in February 2013 toeligible NEOs.
Named Executive OfficerTarget Two-Year Cash Award
(split evenly between CY 2011 and CY 2012)
Martin B. Anstice . . . . . . . . . . . . . . . . . . . . . . . . . . . $1,200,000Ernest E. Maddock . . . . . . . . . . . . . . . . . . . . . . . . . . $ 800,000Richard A. Gottscho . . . . . . . . . . . . . . . . . . . . . . . . . $ 800,000Sarah A. O’Dowd . . . . . . . . . . . . . . . . . . . . . . . . . . . $ 625,000Stephen G. Newberry . . . . . . . . . . . . . . . . . . . . . . . . $2,250,000
Figure 15. 2011/2012 Long-Term Cash Target Award Opportunities.
Calendar year 2012 decisions under the 2012/2013 long-term cash program. In February 2012, thecommittee set target award amounts for each NEO under the 2012/2013 program, established the performancemetric for calendar year 2012 as non-GAAP operating income, and set the starting price for measuring stockprice appreciation for the 2012 calendar year at $43.45, the 200-day moving average as of December 23, 2011.Goals against the non-GAAP operating income were also set in February for the first half of calendar year 2012,and in July 2012 for the second half. Payouts under this program will be determined and made in February 2014to eligible NEOs. The target cash award opportunity for each eligible NEO under the 2012/2013 long-term cashprogram is shown in the table below.5
Named Executive OfficerTarget Two-Year Cash Award
(split evenly between CY 2012 and CY 2013)
Martin B. Anstice . . . . . . . . . . . . . . . . . . . . . . . . . . . $1,750,000Ernest E. Maddock . . . . . . . . . . . . . . . . . . . . . . . . . . $ 800,000Richard A. Gottscho . . . . . . . . . . . . . . . . . . . . . . . . . $ 800,000Sarah A. O’Dowd . . . . . . . . . . . . . . . . . . . . . . . . . . . $ 625,000
Figure 16. 2012/2013 Long-Term Cash Target Award Opportunities.
Long-Term Equity Incentive Program
The equity portion of the long-term incentive program is designed to provide competitive levels ofcompensation and to reward our senior executives for Company performance and stock price appreciation, usingboth performance-based and service-based awards. One half of the total long-term target award opportunity foreach two-year performance period is awarded under the equity segment of the program. Awards vest on anAward Determination Date in the calendar year following the two-year performance period, depending oncontinued employment with us and, in the case of performance-based RSUs, on performance against specifiedmetrics and goals.
Vesting and performance results under the 2010/2011 long-term equity program. On February 5, 2010, thecommittee made a grant to each NEO under the 2010/2011 long-term equity program of performance-based andservice-based RSUs with a combined value equal to 50% of the NEO’s total target award amount, as shown in
5 Following Mr. Newberry’s transition from CEO in January 2012, he is no longer eligible for this program. See“Potential Payments Upon Termination or Change in Control” for a description of Mr. Newberry’semployment contract.
43

Figure 17. To determine the number of performance-based and service-based RSUs, the NEO’s long-term equitytarget award amount was divided by $33.29, the closing price of our common stock on the grant date. On thesame date, the performance criteria for the performance-based RSUs were set. The performance metric wasnon-GAAP operating income, and the goal was 15% or more non-GAAP operating income as a percentage ofrevenue. Maximum vesting under the performance-based award is 100%, and the minimum is 0%. The AwardDetermination Date for all of the performance-based and service-based RSUs under this program was onFebruary 5, 2012. On that date, the service-based awards vested due to the passage of time, and the performance-based awards vested in full (100%) under the previously set performance criteria.6
Named Executive OfficerEquity Target Award
Opportunity
Vested Service-basedRestricted Stock
Unit Award
VestedPerformance-based
Restricted StockUnit Award
Martin B. Anstice . . . . . . . . . . . . . . . . . $1,000,000 15,019 15,019Ernest E. Maddock . . . . . . . . . . . . . . . . $ 800,000 12,015 12,015Richard A. Gottscho . . . . . . . . . . . . . . . $ 675,000 10,138 10,138Sarah A. O’Dowd . . . . . . . . . . . . . . . . . $ 625,000 9,387 9,387Stephen G. Newberry . . . . . . . . . . . . . . $2,250,000 33,793 33,793
Figure 17. 2010/2011 Long-Term Equity Vesting.
Awards under the 2011/2012 long-term equity program. Under the 2011/2012 long-term equity program, onMarch 4, 2011 the committee made a grant to each NEO of performance-based and service-based RSUs with acombined value equal to 50% of the NEO’s total target award amount, as shown in the following table. Todetermine the number of performance-based and service-based RSUs, the NEO’s equity target dollar amount wasdivided by $58.27, the closing price of our common stock on the grant date. The performance criteria for theperformance-based RSUs were set by the committee on the same date. The performance metric is non-GAAPoperating income, and goals were set for the two-year performance period at that time. The maximum vesting is100%, and the minimum is 0%. The Award Determination Date will be March 4, 2013. On that date, the service-based RSUs will vest, and the performance-based RSUs will vest to the extent earned under the specified criteria.
Named Executive OfficerEquity Target Award
Opportunity
Service-basedRestricted Stock
Units Award
Performance-basedRestricted Stock
Units Award
Martin B. Anstice . . . . . . . . . . . . . . . . . . . . $1,200,000 10,296 10,296Ernest E. Maddock . . . . . . . . . . . . . . . . . . . $ 800,000 6,864 6,864Richard A. Gottscho . . . . . . . . . . . . . . . . . . $ 800,000 6,864 6,864Sarah A. O’Dowd . . . . . . . . . . . . . . . . . . . . $ 625,000 5,362 5,362Mukund Srinivasan . . . . . . . . . . . . . . . . . . . $ 400,000 3,432 3,432Stephen G. Newberry . . . . . . . . . . . . . . . . . $2,250,000 19,306 19,306
Figure 18. 2011/2012 Long-Term Equity Awards.
6 Dr. Srinivasan did not participate in the 2010/2011 long-term incentive plan.
44

Calendar year 2012 decisions for the 2012/2013 long-term equity program. On February 7, 2012, thecommittee made a grant under the 2012/2013 long-term equity program to each NEO of RSUs with a combinedvalue equal to 50% of the NEO’s total target award amount, as shown in Figure 19. As explained above, thecommittee granted only service-based equity awards because of the then pending merger with Novellus. Todetermine the number of RSUs, the NEO’s long-term equity target dollar amount was divided by $43.38, theclosing price of our common stock on the grant date. The Award Determination Date is February 7, 2014.
Named Executive Officer(1)
Long-Term EquityTarget AwardOpportunity
Service-basedRestricted Stock Units
Award
Martin B. Anstice . . . . . . . . . . . . . . . . . . . . . . . . . . . . . . . . . . $1,750,000 40,341Ernest E. Maddock . . . . . . . . . . . . . . . . . . . . . . . . . . . . . . . . . $ 800,000 18,441Richard A. Gottscho . . . . . . . . . . . . . . . . . . . . . . . . . . . . . . . . $ 800,000 18,441Sarah A. O’Dowd . . . . . . . . . . . . . . . . . . . . . . . . . . . . . . . . . . $ 625,000 14,407
(1) As noted above, Dr. Srinivasan is not participating in the 2012/2013 executive officer program.
Figure 19. 2012/2013 Long-Term Equity Awards.
Employment/Change in Control Arrangements
The Company has entered into employment agreements with Messrs. Anstice, Maddock and Newberry, andchange in control agreements with our other executive officers, including Dr. Gottscho and Ms. O’Dowd. TheCompany enters into these agreements to help attract and retain our NEOs and believes that these agreementshelp facilitate a smooth transaction and transition in connection with a change-in-control event. The Companyalso entered into an employment agreement with Timothy Archer, our chief operating officer, in connection withthe Novellus merger.
The employment agreements generally provide for designated payments in the event of an “involuntarytermination” of employment, “death,” or “disability,” as each is defined in the applicable agreements. Theemployment agreements, and also the change in control agreements, generally provide for designated paymentsin the case of a “change in control” when coupled with an “involuntary termination” (i.e., a double trigger isrequired before payment is made due to a change in control), as each is defined in the applicable agreements.
After the end of the fiscal year, the Company entered into new employment agreements with Mr. Maddockand Dr. Gottscho. The Company also entered into a new change in control agreement with Ms. O’Dowd.
For additional information about these arrangements and detail about post-termination payments under thesearrangements, see the “Potential Payments Upon Termination or Change in Control” tables.
Other Benefits Not Available to All Employees
Elective Deferred Compensation Plan. The Company maintains an elective deferred compensation plan thatallows eligible employees (including all of the NEOs) to voluntarily defer receipt of all or a portion of basesalary and certain incentive compensation payments until a date or dates elected by the participating employee.This allows the employee to defer taxes on compensation amounts that are deferred. In addition, we provide alimited Company contribution to the plan for all eligible employees.
Supplemental Health and Welfare Benefits. We provide certain health and welfare benefits not generallyavailable to other employees, including the payment of premiums for supplemental long-term disabilityinsurance, executive dental insurance coverage, and an executive medical reimbursement program thatreimburses an executive officer’s payment of medical co-insurance and co-payments, and vision care expenses.
45

We also provide post-retirement medical and dental insurance coverage for eligible former executiveofficers under our Executive Retirement Medical and Dental Plan, subject to certain eligibility requirements. Wehave an independent actuarial valuation of this post-retirement benefit conducted annually in accordance withgenerally accepted accounting principles. The most recent valuation was conducted in June 2012 and reflectedthe following retirement benefit obligation for the NEOs:
Named Executive Officer Fiscal Year 2012
Martin B. Anstice . . . . . . . . . . . . . . . . . . . . . . . . . . . . . . . . . . . . . . . . . . . . . . $192,000Ernest E. Maddock . . . . . . . . . . . . . . . . . . . . . . . . . . . . . . . . . . . . . . . . . . . . . $465,000Richard A. Gottscho . . . . . . . . . . . . . . . . . . . . . . . . . . . . . . . . . . . . . . . . . . . . $426,000Sarah A. O’Dowd . . . . . . . . . . . . . . . . . . . . . . . . . . . . . . . . . . . . . . . . . . . . . . $235,000Mukund Srinivasan . . . . . . . . . . . . . . . . . . . . . . . . . . . . . . . . . . . . . . . . . . . . . $189,000Stephen G. Newberry . . . . . . . . . . . . . . . . . . . . . . . . . . . . . . . . . . . . . . . . . . . $436,000
Figure 20. Post-Retirement Benefit Obligations as of June 2012.
V. TAX AND ACCOUNTING CONSIDERATIONS
Deductibility of Executive Compensation
Section 162(m) of the Internal Revenue Code of 1986, as amended (the “Code”), imposes limitations on thedeductibility for federal income tax purposes of compensation in excess of $1 million paid to our chief executiveofficer, and any of our three other most highly compensated executive officers (other than our chief financialofficer) in a single tax year. Generally, compensation in excess of $1 million may only be deducted if it is“performance-based compensation” within the meaning of the Code.
When we design our executive compensation program, we take into account whether a particular form ofcompensation will be considered “performance-based” compensation for purposes of section 162(m).
To facilitate the deductibility of compensation payments under section 162(m), in fiscal year 2004, weadopted the Executive Incentive Plan (“EIP”) and obtained stockholder approval for the EIP at that time andagain in calendar year 2010. Both the Annual Incentive Program and the Long-term Incentive Program areadministered under the EIP. The annual program awards and the long-term cash awards to our NEOs generallyqualify for deductibility under section 162(m) to the extent practicable.
Consistent with the EIP and the regulations under section 162(m), compensation income realized upon theexercise of stock options granted under our long-term incentive program generally will be deductible because theawards are granted by a committee whose members are outside directors and the other conditions of the EIP aresatisfied. However, compensation associated with RSUs granted under the long-term incentive program or underthe Global Products Group Key Incentive Plan is deductible only to the extent that vesting is based on specificperformance goals and the other conditions of the EIP are satisfied. Therefore, compensation income realizedupon the vesting of service-based RSUs or upon the vesting of equity awards not meeting the conditions requiredby the EIP is not deductible to the Company to the extent that the threshold is exceeded.
The committee monitors the application of section 162(m) and the associated Treasury regulations on anongoing basis and the advisability of qualifying our executive compensation for deductibility of suchcompensation. The committee’s policy is to qualify our executive compensation for deductibility underapplicable tax laws to the extent practicable and if the committee believes it is in the best interests of theCompany and its stockholders.
46

Taxation of “Parachute” Payments
Sections 280G and 4999 of the Code provide that “disqualified individuals” within the meaning of the Code(which generally includes certain officers, directors and employees of the Company) may be subject to additionaltaxes if they receive payments or benefits in connection with a change in control of the corporation that exceedscertain prescribed limits. The corporation or its successor may also forfeit a deduction on the amounts subject tothis additional tax.
We did not provide any of our executive officers, including any NEO, any director, or any other serviceprovider with a “gross-up” or other reimbursement payment for any tax liability that the individual might owe asa result of the application of Sections 280G or 4999 during fiscal year 2012, and we have not agreed and are nototherwise obligated to provide any individual with such a “gross-up” or other reimbursement.
Internal Revenue Code Section 409A
Section 409A of the Code imposes significant additional taxes on an executive officer, director, or serviceprovider that receives non-compliant “deferred compensation” that is within the scope of section 409A. Amongother things, section 409A potentially applies to the cash awards under the long-term incentive program, theElective Deferred Compensation Plan, certain equity awards, and severance arrangements.
To assist our employees in avoiding additional taxes under section 409A, we have structured the long-termincentive program, the Elective Deferred Compensation Plan, and our equity awards in a manner intended toqualify them for exclusion from or compliance with section 409A.
Accounting for Stock-Based Compensation
We follow Financial Accounting Standards Board Accounting Standards Codification Topic 718 (“ASC718”) for accounting for our stock options and other stock-based awards. ASC 718 requires companies tocalculate the grant date “fair value” of their stock option grants and other equity awards using a variety ofassumptions. This calculation is performed for accounting purposes. ASC 718 also requires companies torecognize the compensation cost of stock option grants and other stock-based awards in their income statementsover the period that an employee is required to render service in exchange for the option or other equity award.
47

COMPENSATION COMMITTEE REPORT
The compensation committee has reviewed and discussed with management the Compensation Discussionand Analysis required by Item 402(b) of Regulation S-K. Based on this review and discussion, the compensationcommittee has recommended to the board of directors that the Compensation Discussion and Analysis beincluded in this proxy statement and the Company’s Annual Report on Form 10-K.
This Compensation Committee Report shall not be deemed “filed” with the SEC for purposes of federalsecurities law, and it shall not, under any circumstances, be incorporated by reference into any of the Company’spast or future SEC filings. The report shall not be deemed soliciting material.
COMPENSATION COMMITTEEGrant M. Inman (Chair)
Michael R. CannonYoussef A. El-MansyChristine A. HeckartAbhijit Y. Talwalkar
48

COMPENSATION COMMITTEE INTERLOCKSAND INSIDER PARTICIPATION
None of the committee members has ever been an officer or employee of Lam Research. No interlockingrelationship exists or existed during fiscal year 2012 between any member of our compensation committee andany member of any other company’s board of directors or compensation committee.
EXECUTIVE COMPENSATION TABLES
Summary Compensation Table
Name andPrincipal Position
FiscalYear Salary ($)
Bonus($)
StockAwards
($) (1)
Non-EquityIncentive PlanCompensation
($)
All OtherCompensation
($) (2)Total
($)
Martin B. Anstice . . . . . . . . . 2012 $605,288 $ 0 $1,749,993 $1,463,810(6) $22,337 $3,841,428President and 2011 $512,738 $ 0 $1,199,896 $2,518,831(7) $16,459 $4,247,924Chief Executive Officer 2010 $425,141 $ 0 $ 999,965 $1,385,442(8) $16,857 $2,827,405
Ernest E. Maddock . . . . . . . . 2012 $474,261 $ 0 $ 799,971 $1,012,865(9) $18,413 $2,305,510Senior Vice President and 2011 $457,194 $ 0 $ 799,931 $2,096,358(10) $18,069 $3,371,552Chief Financial Officer 2010 $415,693 $ 0 $ 799,959 $1,224,780(11) $17,987 $2,458,419
Richard A. Gottscho . . . . . . 2012 $427,942 $ 5,609(3) $ 799,971 $ 905,832(12) $19,959 $2,159,312Senior Vice President, 2011 $396,781 $ 0 $1,248,731 $1,799,597(13) $18,913 $3,464,022Global Products 2010 $345,363 $28,918(4) $1,607,108 $ 995,312(14) $41,719 $3,018,420
Sarah A. O’Dowd . . . . . . . . 2012 $377,596 $ 0 $ 624,976 $ 774,526(15) $15,355 $1,792,453Group Vice President and 2011 $363,753 $ 0 $ 624,887 $1,611,267(16) $16,783 $2,616,690Chief Legal Officer
Mukund Srinivasan . . . . . . . 2012 $305,769 $ 3,200(5) $ 828,280 $ 415,862(17) $20,390 $1,573,501Vice President and GeneralManager, Clean Business
Stephen G. Newberry . . . . . . 2012 $699,231 $ 0 $ 0 $2,530,467(18) $11,331 $3,241,029Vice Chairman 2011 $857,852 $ 0 $2,249,921 $6,274,853(19) $10,619 $9,393,245
2010 $737,473 $ 0 $2,249,938 $3,211,287(20) $11,184 $6,209,882
(1) The amounts shown in this column represent the value of restricted stock unit awards granted in accordancewith ASC 718. However, pursuant to SEC rules, these values are not reduced by an estimate for theprobability of forfeiture. The assumptions used to calculate the fair value of the restricted stock units infiscal year 2012 are set forth in Note 11 in the Notes to Consolidated Financial Statements of theCompany’s Annual Report on Form 10-K for the fiscal year ended June 24, 2012.
(2) Please refer to the “All Other Compensation” table, which immediately follows this table, for additionalinformation.
(3) Represents a patent award and a bonus equal to the additional income tax due to section 409A for certainstock option awards.
(4) Represents a bonus equal to the additional income tax due to section 409A for certain stock option awards.(5) Represents a bonus paid for a patent award.(6) Represents $521,125 earned by Mr. Anstice under the 2011 Annual Incentive Program (“AIP”), $233,936
accrued on Mr. Anstice’s behalf for the performance during fiscal year 2012 under the 2010/2011 CashLong-Term Incentive Program (“LTIP”), $405,171 accrued on Mr. Anstice’s behalf for the performanceduring fiscal year 2012 under the 2011/2012 Cash LTIP, and $303,578 accrued on Mr. Anstice’s behalf for
49

the performance during fiscal year 2012 under the 2012/2013 Cash LTIP. Mr. Anstice has received theamounts accrued under the 2010/2011 Cash LTIP, and will be eligible to receive the amounts accrued underthe 2011/2012 and 2012/2013 Cash LTIPs if he remains employed by the Company through the respectiveaward determination dates in February 2013 and February 2014.
(7) Represents $629,285 earned by Mr. Anstice under the 2010 AIP, $433,868 accrued on Mr. Anstice’s behalffor performance during fiscal year 2011 under the 2009/2010 Cash LTIP, $1,033,893 accrued onMr. Anstice’s behalf for performance during fiscal year 2011 under the 2010/2011 Cash LTIP, and$421,785 accrued on Mr. Anstice’s behalf for performance during fiscal year 2011 under the 2011/2012Cash LTIP. Mr. Anstice has received the amounts accrued under the 2009/2010 and 2010/2011 Cash LTIPs,and will be eligible to receive the amounts accrued under the 2011/2012 Cash LTIPs if he remains employedby the Company through the award determination date in February 2013.
(8) Represents $287,482 earned by Mr. Anstice under the 2009 AIP, $238,722 accrued on Mr. Anstice’s behalffor performance during fiscal year 2010 under the 2008/2009 Cash LTIP, $464,637 accrued onMr. Anstice’s behalf for performance during fiscal year 2010 under the 2009/2010 Cash LTIP, and$394,601 accrued on Mr. Anstice’s behalf for performance during fiscal year 2010 under the 2010/2011Cash LTIP. Mr. Anstice has received the amounts accrued under the 2008/2009, 2009/2010, and 2010/2011Cash LTIPs.
(9) Represents $416,823 earned by Mr. Maddock under the 2011 AIP, $187,149 accrued on Mr. Maddock’sbehalf for performance during fiscal year 2012 under the 2010/2011 Cash LTIP, $270,114 accrued onMr. Maddock’s behalf for performance during fiscal year 2012 under the 2011/2012 Cash LTIP, and$138,779 accrued on Mr. Maddock’s behalf for performance during fiscal year 2012 under the 2012/2013Cash LTIP. Mr. Maddock has received the amounts accrued under the 2010/2011 Cash LTIP, will beeligible to receive the amounts accrued under the 2011/2012 and 2012/2013 Cash LTIPs if he remainsemployed by the Company through the respective award determination dates in February 2013 andFebruary 2014.
(10) Represents $591,375 earned by Mr. Maddock under the 2010 AIP, $396,679 accrued on Mr. Maddock’sbehalf for performance during fiscal year 2011 under the 2009/2010 Cash LTIP, $827,114 accrued onMr. Maddock’s behalf for performance during fiscal year 2011 under the 2010/2011 Cash LTIP, and$281,190 accrued on Mr. Maddock’s behalf for performance during fiscal year 2011 under the 2011/2012Cash LTIP. Mr. Maddock has received the amounts accrued under the 2009/2010 and 2010/2011 CashLTIPs, and will be eligible to receive the amounts accrued under the 2011/2012 Cash LTIPs if he remainsemployed by the Company through the award determination date in February 2013.
(11) Represents $266,028 earned by Mr. Maddock pursuant to the 2009 AIP, $218,260 accrued onMr. Maddock’s behalf for performance during fiscal year 2010 under the 2008/2009 Cash LTIP, $424,811accrued on Mr. Maddock’s behalf for performance during fiscal year 2010 under the 2009/2010 Cash LTIP,and $315,681 accrued on Mr. Maddock’s behalf for performance during fiscal year 2010 under the2010/2011 Cash LTIP. Mr. Maddock has received the amounts accrued under the 2008/2009, 2009/2010,and 2010/2011 Cash LTIPs.
(12) Represents $339,032 earned by Dr. Gottscho under the 2011 AIP, $157,907 accrued on Dr. Gottscho’sbehalf for performance during fiscal year 2012 under the 2010/2011 Cash LTIP, $270,114 accrued onDr. Gottscho’s behalf for performance during fiscal year 2012 under the 2011/2012 Cash LTIP, and$138,779 accrued on Dr. Gottscho’s behalf for performance during fiscal year 2012 under the 2012/2013Cash LTIP. Dr. Gottscho has received the amounts accrued under the 2010/2011 Cash LTIP, will be eligibleto receive the amounts accrued under the 2011/2012 and 2012/2013 Cash LTIPs if he remains employed bythe Company through the respective award determination dates in February 2013 and February 2014.
(13) Represents $508,144 earned by Dr. Gottscho under the 2010 AIP, $312,385 accrued on Dr. Gottscho’sbehalf for performance during fiscal year 2011 under the 2009/2010 Cash LTIP, $697,878 accrued onDr. Gottscho’s behalf for performance during fiscal year 2011 under the 2010/2011 Cash LTIP, and$281,190 accrued on Dr. Gottscho’s behalf for performance during fiscal year 2011 under the 2011/2012Cash LTIP. Dr. Gottscho has received the amounts accrued under the 2009/2010 and 2010/2011 CashLTIPs, and will be eligible to receive the amounts accrued under the 2011/2012 Cash LTIP if he remainsemployed by the Company through the award determination date in February 2013.
50

(14) Represents $222,539 earned by Dr. Gottscho under the 2009 AIP, $171,880 accrued on Dr. Gottscho’sbehalf for performance during fiscal year 2010 under the 2008/2009 Cash LTIP, $334,538 accrued onDr. Gottscho’s behalf for performance during fiscal year 2010 under the 2009/2010 Cash LTIP, and$266,355 accrued on Dr. Gottscho’s behalf for performance during fiscal year 2010 under the 2010/2011Cash LTIP. Dr. Gottscho has received the amounts accrued under the 2008/2009, 2009/2010, and 2010/2011Cash LTIPs.
(15) Represents $308,868 earned Ms. O’Dowd under the 2011 AIP, $146,210 accrued on Ms. O’Dowd’s behalffor performance during fiscal year 2012 under the 2010/2011 Cash LTIP, and $211,027 accrued onMs. O’Dowd’s behalf for performance during fiscal year 2012 under the 2011/2012 Cash LTIP and$108,421 accrued on Ms. O’Dowd’s behalf for performance during fiscal year 2012 under the 2012/2013Cash LTIP. Ms. O’Dowd has received the amounts accrued under the 2010/2011 Cash LTIP, will be eligibleto receive the amounts accrued under the 2011/2012 and 2012/2013 Cash LTIPs if she remains employed bythe Company through the respective award determination dates in February 2013 and February 2014.
(16) Represents $435,498 earned by Ms. O’Dowd under the 2010 AIP, $309,906 accrued on Ms. O’Dowd’sbehalf for performance during fiscal year 2011 under the 2009/2010 Cash LTIP, $646,183 accrued onMs. O’Dowd’s behalf for performance during fiscal year 2011 under the 2010/2011 Cash LTIP, and$219,680 accrued on Ms. O’Dowd’s behalf for performance during fiscal year 2011 under the 2011/2012Cash LTIP. Ms. O’Dowd has received the amounts accrued under the 2009/2010 and 2010/2011 CashLTIPs, and will be eligible to receive the amounts accrued under the 2011/2012 Cash LTIP if she remainsemployed by the Company through the award determination date in February 2013.
(17) Represents $194,068 earned by Dr. Srinivasan under the 2012 AIP, $$135,057 accrued on Dr. Srinivasan’sbehalf for performance during fiscal year 2012 under the 2011/2012 Cash LTIP and $86,737 accrued onDr. Srinivasan’s behalf during fiscal year 2012 under the 2012/2013 Cash LTIP. Dr. Srinivasan has receivedthe amounts accrued under the 2011/2012 Cash LTIP and will be eligible to receive the amounts accruedunder the 2011/2012 Cash LTIP if he remains employed by the Company through the award determinationdate in February 2013.
(18) Represents $1,244,414 earned by Mr. Newberry under the 2011 AIP, $526,357 accrued on Mr. Newberry’sbehalf for performance during fiscal year 2012 under the 2010/2011 Cash LTIP and $759,696 accrued onMr. Newberry’s behalf for performance during fiscal year 2012 under the 2011/2012 Cash LTIP.Mr. Newberry has received the amounts accrued under the 2010/2011 Cash LTIP, and will be eligible toreceive the amounts accrued under the 2011/2012 if he remains employed by the Company through theaward determination date in February 2013.
(19) Represents $2,166,049 earned by Mr. Newberry under the 2010 AIP, $991,698 accrued on Mr. Newberry’sbehalf for performance during fiscal year 2011 under the 2009/2010 Cash LTIP, $2,326,259 accrued onMr. Newberry’s behalf for performance during fiscal year 2011 under the 2010/2011 Cash LTIP, and$790,847 accrued on Mr. Newberry’s behalf for performance during fiscal year 2011 under the 2011/2012Cash LTIP. Mr. Newberry has received the amounts accrued under the 2009/2010 and 2010/2011 CashLTIPs, and will be eligible to receive the amounts accrued under the 2011/2012 Cash LTIP if he remainsemployed by the Company through the award determination date in February 2013.
(20) Represents $715,760 earned by Mr. Newberry under the 2009 AIP, $545,650 accrued on Mr. Newberry’sbehalf for performance during fiscal year 2010 under the 2008/2009 Cash LTIP, $1,062,026 accrued onMr. Newberry’s behalf for performance during fiscal year 2010 under the 2009/2010 Cash LTIP, and$887,851 accrued on Mr. Newberry’s behalf for performance during fiscal year 2010 under the 2010/2011Cash LTIP. Mr. Newberry has received the amounts accrued under the 2008/2009, 2009/2010, and2010/2011 Cash LTIPs.
51

All Other Compensation for Fiscal Year 2012
NameFiscalYear
CompanyMatching
Contributionto the
Company’sSection
401(k) Plan
Company PaidLong-TermDisabilityInsurance
Premiums (1)
CompanyPaid LifeInsurance
Premiums (2)
CompanyPaid
HealthcareInsurance
Premiums (3)
CompanyContributionto the Elective
DeferredCompensation
Plan Gross Up (4) Total
Martin B. Anstice . . . . . . . . . . . . 2012 $8,876 $ 0 $1,236 $9,725 $2,500 $ 0 $22,337Ernest E. Maddock . . . . . . . . . . . 2012 $6,574 $ 929 $1,236 $8,975 $ 699 $ 0 $18,413Richard A. Gottscho . . . . . . . . . . 2012 $7,545 $1,174 $1,236 $9,129 $ 0 $ 875 $19,959Sarah A. O’Dowd . . . . . . . . . . . . 2012 $2,644 $ 0 $1,236 $8,975 $2,500 $ 0 $15,355Mukund Srinivasan . . . . . . . . . . . 2012 $7,575 $ 0 $1,236 $9,725 $ 0 $1,854 $20,390Stephen G. Newberry . . . . . . . . . 2012 $ 0 $ 370 $1,236 $9,725 $ 0 $ 0 $11,331
(1) Represents the portion of supplemental long term disability insurance premiums paid by the Company.(2) Represents the portion of life insurance premiums paid by the Company.(3) Represents the portion of executive dental and executive medical reimbursement insurance premiums paid by the
Company.(4) Represents the portion of gross up tax amount applied to Bonus paid for applicable Federal, State, and local laws.
Grants of Plan-Based Awards for Fiscal Year 2012
Estimated FuturePayouts Under
Non-Equity IncentivePlan Awards
EstimatedFuturePayoutsUnderEquity
IncentivePlan
Awards
AllOtherStock
Awards:Numberof Sharesof Stockor Units
(#) (3)
AllOtherOption
Awards:Number ofSecurities
UnderlyingOptions
(#)
GrantDate Fair
Valueof Stock and
OptionAwards
($) (4)Name Award TypeGrantDate
ApprovalDate
Target($) (1)
Maximum($)
Target(#) (2)
Martin B. Anstice . . . . . . .Annual Incentive Program N/A 2/7/2012 $ 831,000 $1,870,000 0 0 0 $ 0Equity LTIP 2/7/2012 2/7/2012 $ 0 $ 0 0 40,341 0 $1,749,993Cash LTIP N/A 2/7/2012 $1,750,000 $4,375,000 0 0 0 $ 0
Ernest E. Maddock . . . . . .Annual Incentive Program N/A 2/6/2012 $ 412,000 $ 927,000 0 0 0 $ 0Equity LTIP 2/7/2012 2/6/2012 $ 0 $ 0 0 18,441 0 $ 799,971Cash LTIP N/A 2/6/2012 $ 800,000 $2,000,000 0 0 0 $ 0
Richard A. Gottscho . . . .Annual Incentive Program N/A 2/6/2012 $ 372,000 $ 837,000 0 0 0 $ 0Equity LTIP 2/7/2012 2/6/2012 $ 0 $ 0 0 18,441 0 $ 799,971Cash LTIP N/A 2/6/2012 $ 800,000 $2,000,000 0 0 0 $ 0
Sarah A. O’Dowd . . . . . .Annual Incentive Program NA 2/6/2012 $ 290,000 $ 653,000 0 0 0 $ 0Equity LTIP 2/7/2012 2/6/2012 $ 0 $ 0 0 14,407 0 $ 624,976Cash LTIP NA 2/6/2012 $ 625,000 $1,562,500 0 0 0 $ 0
Mukund Srinivasan . . . . .Annual Incentive Program NA 4/2/2012 $ 228,000 $ 513,000 0 0 0Equity LTIP 4/27/2012 4/24/2012 $ 0 $ 0 0 11,884 0 $ 499,960Cash LTIP NA 4/24/2012 $ 500,000 $1,250,000 0 0 0 $ 0Time-based RSU 3/2/2012 2/27/2012 $ 0 $ 0 0 8,000 0 $ 328,320
Stephen G. Newberry . . . .Annual Incentive Program N/A N/A $ 0 $ 0 0 0 0 $ 0Equity LTIP N/A N/A $ 0 $ 0 0 0 0 $ 0Cash LTIP N/A N/A $ 0 $ 0 0 0 0 $ 0
(1) Base salary used to calculate the Annual Incentive Program (“AIP”) goal was base salary approved in February2012. Actual base earnings under the AIP could be different.
(2) Represents RSUs with performance-based vesting.
52

(3) Represents RSUs with service-based vesting.(4) The amounts shown in this column represent the value of restricted stock unit awards granted during fiscal
year 2012 in accordance with ASC 718. However, pursuant to SEC rules, these values are not reduced by anestimate for the probability of forfeiture. The assumptions used to calculate the fair value of the restrictedstock units in fiscal year 2012 are set forth in Note 11 in the Notes to Consolidated Financial Statements ofthe Company’s Annual Report on Form 10-K for the fiscal year ended June 24, 2012.
Outstanding Equity Awards at 2012 Fiscal Year-End
Option Awards Stock Awards
Name
Number ofSecurities
UnderlyingUnexercisedOptions (#)Exercisable
Number ofSecurities
UnderlyingUnexercisedOptions (#)
Unexercisable
OptionExercisePrice ($)
OptionExpiration
Date
Number ofShares orUnits ofStock
That HaveNot Vested
(#)
MarketValue of
Shares orUnits ofStockThat
Have NotVested($) (1)
EquityIncentive
PlanAwards:
Number ofUnearned
Shares,Units orOther
Rights ThatHave NotVested (#)
EquityIncentive
PlanAwards:Market
or PayoutValue of
UnearnedShares,Units orOtherRightsThat
Have NotVested($) (1)
Martin B. Anstice . . . . . . . . . . . 0 0 $ 0 N/A 40,341(2) $1,530,941 0 $ 00 0 $ 0 N/A 10,296(3) $ 390,733 10,296(4) $390,73329,120(5) 0 $20.21 2/26/2014 0 $ 0 0 $ 0
Ernest E. Maddock . . . . . . . . . . 0 0 $ 0 N/A 18,441(2) $ 699,836 0 $ 00 0 $ 0 N/A 6,864(3) $ 260,489 6,864(4) $260,48924,480(5) 0 $20.21 2/26/2014 0 $ 0 0 $ 0
Richard A. Gottscho . . . . . . . . . 0 0 $ 0 N/A 18,441(2) $ 699,836 0 $ 00 0 $ 0 N/A 6,864(3) $ 260,489 6,864(4) $260,489
Sarah A. O’Dowd . . . . . . . . . . . 0 0 $ 0 N/A 14,407(2) $ 546,746 0 $ 00 0 $ 0 N/A 5,362(3) $ 203,488 5,362(4) $203,48838,658(5) 0 $20.21 2/26/2014 0 $ 0 0 $ 0
Mukund Srinivasan . . . . . . . . . 0 0 $ 0 N/A 4,000(6) $ 151,800 0 $ 00 0 $ 0 N/A 11,884(7) $ 450,998 0 $ 00 0 $ 0 N/A 3,432(3) $ 130,244 3,432(4) $130,2440 0 $ 0 N/A 2,866(8) $ 108,765 0 $ 0
Stephen G. Newberry . . . . . . . . 0 0 $ 0 N/A 19,306(3) $ 732,663 19,306(4) $732,663123,700(5) 0 $20.21 2/26/2014 0 $ 0 0 $ 0
(1) Calculated by multiplying the number of unvested shares by $37.95, the closing price per share of our common stock on June 22, 2012.(2) RSUs were granted on February 7, 2012. On February 7, 2014, 100% of the RSUs will vest provided that the person remains an
employee on such date.(3) RSUs were granted on March 4, 2011. On March 3, 2013, 100% of the RSUs will vest provided that the person remains an employee on
such date.(4) RSUs were granted on March 4, 2011 and are subject to performance criteria and continued service. On March 4, 2013, 100% of the
RSUs will vest provided that the performance criteria have been met and the person remains an employee on such date.(5) Options were granted on February 26, 2009. On February 26, 2011, 100% of the options vested.(6) RSUs were granted on March 2, 2012. As of the 2012 fiscal year-end, 50% of the RSUs granted on March 2, 2012 had vested. On
September 2, 2012, half of the remaining unvested RSUs vested, and on December 2, 2012, the remaining unvested RSUs will vestprovided that the person remains an employee on such date.
(7) RSUs were granted on April 27, 2012. On each of November 13, 2013 and May 13, 2014, 33% of the RSUs will vest, and on August 12,2014, 34% will vest provided that the person remains an employee on such date.
(8) RSU were grant on February 17, 2010. On July 15, 2012, 100% of the RSUs will vest provided that the person remains an employee onsuch date.
53

Option Exercises and Stock Vested for Fiscal Year 2012
Option Awards Stock Awards
Name
Numberof SharesAcquired
onExercise
(#)
ValueRealized onExercise ($)
Numberof SharesAcquired
onVesting
(#)
ValueRealized onVesting ($)
Martin B. Anstice . . . . . . . . . . . . . . . . . . . . . . . . . . . . . . . . . . . . . . 0 $0 30,038 $1,312,961Ernest E. Maddock . . . . . . . . . . . . . . . . . . . . . . . . . . . . . . . . . . . . . 0 $0 24,030 $1,050,351Richard A. Gottscho . . . . . . . . . . . . . . . . . . . . . . . . . . . . . . . . . . . . 0 $0 32,276 $1,330,504Sarah A. O’Dowd . . . . . . . . . . . . . . . . . . . . . . . . . . . . . . . . . . . . . . 0 $0 18,774 $ 820,612Mukund Srinivasan . . . . . . . . . . . . . . . . . . . . . . . . . . . . . . . . . . . . . 0 $0 18,619 $ 753,048Stephen G. Newberry . . . . . . . . . . . . . . . . . . . . . . . . . . . . . . . . . . . 0 $0 67,586 $2,959,253
(1) The table shows all stock options exercised and the value realized upon exercise, and all stock awardsvested and the value realized upon vesting, by the NEOs during fiscal year 2012, which ended on June 24,2012.
Non-Qualified Deferred Compensation for Fiscal Year 2012
Name
ExecutiveContributions
in FY12
RegistrantContributions
in FY12 (1)
AggregateEarnings in
FY12 (2)
AggregateWithdrawals/Distributions
in FY12
AggregateBalance at
FYE12
Martin B. Anstice . . . . . . . . . . . . . . . . . . . $ 775,969(3) $2,500 ($ 66,824) $0 $ 3,032,350Ernest E. Maddock . . . . . . . . . . . . . . . . . . $1,074,139(4) $ 699 $ 284,802 $0 $10,654,434Richard A. Gottscho . . . . . . . . . . . . . . . . . $ 0 $ 0 $ 76,304 $0 $ 1,601,376Sarah A. O’Dowd . . . . . . . . . . . . . . . . . . . $1,050,923(5) $2,500 ($ 29,452) $0 $ 1,407,264Mukund Srinivasan . . . . . . . . . . . . . . . . . $ 0 $ 0 $ 0 $0 $ 0Stephen G. Newberry . . . . . . . . . . . . . . . . $ 0 $ 0 $ 58,266 $0 $ 1,284,083
(1) Represents the amount that the Company credited to the Elective Deferred Compensation Plan (“EDCP”),which is 3% of Executive Contribution during calendar year 2011, to a maximum benefit of $2,500. Theseamounts are included in the Summary Compensation and All Other Compensation tables.
(2) The NEOs did not receive above-market or preferential earnings in fiscal year 2012.(3) Executive contributions in fiscal year 2012 include $457,257 reported in our fiscal year 2012 Summary
Compensation Table, $215,680 reported in our fiscal year 2011 Summary Compensation Table and$103,032 reported in our fiscal year 2010 Summary Compensation Table.
(4) Executive contributions in fiscal year 2012 include $578,678 reported in our fiscal year 2012 SummaryCompensation Table, $330,609 reported in our fiscal year 2011 Summary Compensation Table and$164,852 reported in our fiscal year 2010 Summary Compensation Table.
(5) Executive contributions in fiscal year 2012 include $653,014 reported in our fiscal year 2012 SummaryCompensation Table, $269,119 reported in our fiscal year 2011 Summary Compensation Table and$128,790 reported in our fiscal year 2010 Summary Compensation Table.
54
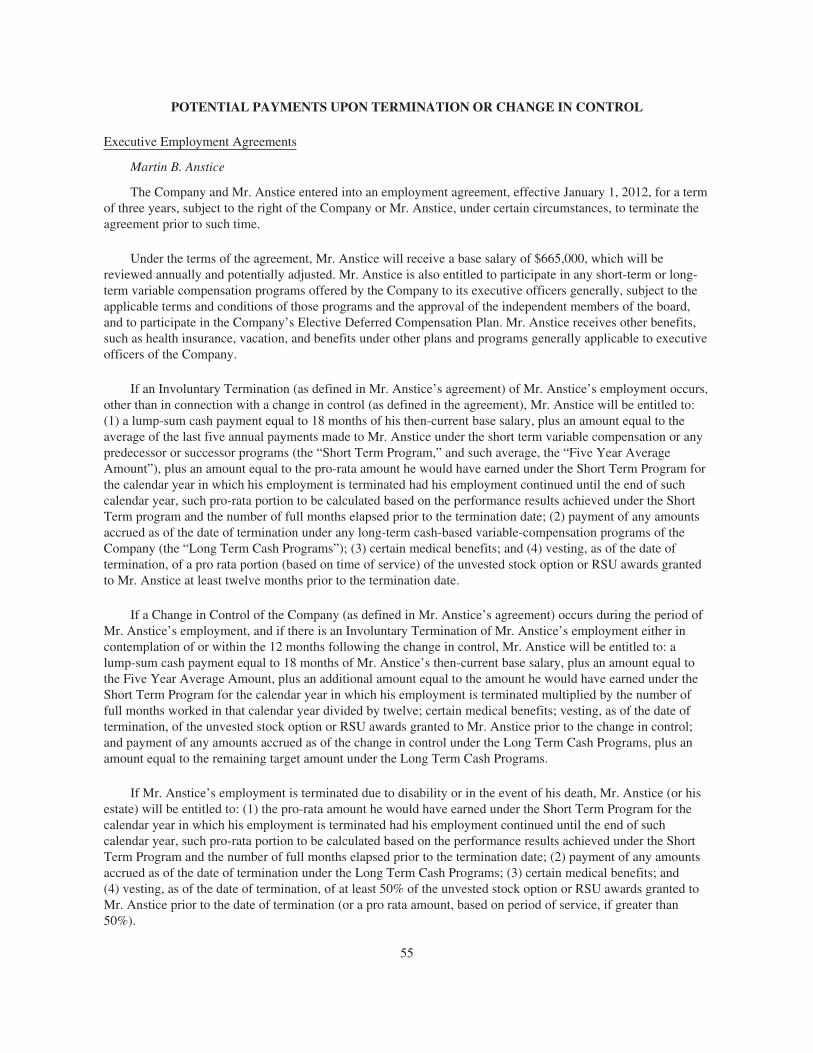
POTENTIAL PAYMENTS UPON TERMINATION OR CHANGE IN CONTROL
Executive Employment Agreements
Martin B. Anstice
The Company and Mr. Anstice entered into an employment agreement, effective January 1, 2012, for a termof three years, subject to the right of the Company or Mr. Anstice, under certain circumstances, to terminate theagreement prior to such time.
Under the terms of the agreement, Mr. Anstice will receive a base salary of $665,000, which will bereviewed annually and potentially adjusted. Mr. Anstice is also entitled to participate in any short-term or long-term variable compensation programs offered by the Company to its executive officers generally, subject to theapplicable terms and conditions of those programs and the approval of the independent members of the board,and to participate in the Company’s Elective Deferred Compensation Plan. Mr. Anstice receives other benefits,such as health insurance, vacation, and benefits under other plans and programs generally applicable to executiveofficers of the Company.
If an Involuntary Termination (as defined in Mr. Anstice’s agreement) of Mr. Anstice’s employment occurs,other than in connection with a change in control (as defined in the agreement), Mr. Anstice will be entitled to:(1) a lump-sum cash payment equal to 18 months of his then-current base salary, plus an amount equal to theaverage of the last five annual payments made to Mr. Anstice under the short term variable compensation or anypredecessor or successor programs (the “Short Term Program,” and such average, the “Five Year AverageAmount”), plus an amount equal to the pro-rata amount he would have earned under the Short Term Program forthe calendar year in which his employment is terminated had his employment continued until the end of suchcalendar year, such pro-rata portion to be calculated based on the performance results achieved under the ShortTerm program and the number of full months elapsed prior to the termination date; (2) payment of any amountsaccrued as of the date of termination under any long-term cash-based variable-compensation programs of theCompany (the “Long Term Cash Programs”); (3) certain medical benefits; and (4) vesting, as of the date oftermination, of a pro rata portion (based on time of service) of the unvested stock option or RSU awards grantedto Mr. Anstice at least twelve months prior to the termination date.
If a Change in Control of the Company (as defined in Mr. Anstice’s agreement) occurs during the period ofMr. Anstice’s employment, and if there is an Involuntary Termination of Mr. Anstice’s employment either incontemplation of or within the 12 months following the change in control, Mr. Anstice will be entitled to: alump-sum cash payment equal to 18 months of Mr. Anstice’s then-current base salary, plus an amount equal tothe Five Year Average Amount, plus an additional amount equal to the amount he would have earned under theShort Term Program for the calendar year in which his employment is terminated multiplied by the number offull months worked in that calendar year divided by twelve; certain medical benefits; vesting, as of the date oftermination, of the unvested stock option or RSU awards granted to Mr. Anstice prior to the change in control;and payment of any amounts accrued as of the change in control under the Long Term Cash Programs, plus anamount equal to the remaining target amount under the Long Term Cash Programs.
If Mr. Anstice’s employment is terminated due to disability or in the event of his death, Mr. Anstice (or hisestate) will be entitled to: (1) the pro-rata amount he would have earned under the Short Term Program for thecalendar year in which his employment is terminated had his employment continued until the end of suchcalendar year, such pro-rata portion to be calculated based on the performance results achieved under the ShortTerm Program and the number of full months elapsed prior to the termination date; (2) payment of any amountsaccrued as of the date of termination under the Long Term Cash Programs; (3) certain medical benefits; and(4) vesting, as of the date of termination, of at least 50% of the unvested stock option or RSU awards granted toMr. Anstice prior to the date of termination (or a pro rata amount, based on period of service, if greater than50%).
55

If Mr. Anstice voluntarily resigns, he will be entitled to no additional benefits (except as he may be eligiblefor under the Executive Retiree Medical Plan), stock options and RSUs will cease to vest on the termination date,and stock options will be cancelled unless they are exercised within ninety days after the termination date. RSUswill be cancelled on the termination date.
Mr. Anstice’s agreement also subjects Mr. Anstice to customary confidentiality and non-competitionobligations during the term of the agreement, and non-solicitation obligations for a period of six monthsfollowing the termination of his employment. The agreement also requires Mr. Anstice to execute a release infavor of the Company to receive the payments described above.
Ernest E. Maddock
The Company and Mr. Maddock entered into an employment agreement, effective July 1, 2009, for a termof three years, subject to the right of the Company or Mr. Maddock, under certain circumstances, to terminate theagreement prior to such time. The terms of Mr. Maddock’s agreement are substantively similar to those ofMr. Anstice’s agreement, with the following material differences: Mr. Maddock will receive a base salary and,effective April 2012, this base salary was adjusted to $485,000.
The severance terms of Mr. Maddock’s agreement are generally similar to those of Mr. Anstice’sagreement, provided that (1) Mr. Maddock will receive 12 months base salary instead of 18 months in the eventof his Involuntary Termination; and (2) instead of a payment of the Five Year Average Amount, he will receive apayment of 50% of the Five Year Average Amount. The change in control terms of Mr. Maddock’s agreementare generally similar to those of Mr. Anstice’s agreement, provided that Mr. Maddock will receive 12 monthsbase salary instead of 18 months in the event of his Involuntary Termination. After the end of the fiscal year, theCompany and Mr. Maddock entered into an employment agreement effective July 18, 2012 for a term of threeyears with the same terms as the expiring agreement.
After the end of the fiscal year, the Company and Mr. Maddock entered into a new employment agreement,effective July 18, 2012, for a term of three years, subject to the right of the Company or Mr. Maddock undercertain circumstances, to terminate the agreement prior to such time. Mr. Maddock’s new employment agreementhas the same terms as his prior agreement.
Timothy M. Archer
The Company and Mr. Archer entered into an employment agreement, effective June 4, 2012, for a term ofthree years, subject to the right of the Company or Mr. Archer, under certain circumstances, to terminate theagreement prior to such time. The terms of Mr. Archer’s agreement are substantively similar to those ofMr. Anstice’s agreement, with the following material differences: Mr. Archer will receive a base salary, and thisbase salary is $550,000. Mr. Archer is not an NEO for fiscal year 2012; and his agreement includes a retentionbonus. His contract is described here because he is our COO and for completeness.
The severance terms of Mr. Archer’s agreement are generally similar to those of Mr. Anstice’s agreement,provided that (1) Mr. Archer will receive 12 months base salary instead of 18 months in the event of hisInvoluntary Termination; and (2) instead of a payment of the Five Year Average Amount, he will receive apayment of 50% of the Five Year Average Amount. The change in control terms of Mr. Archer’s agreement aregenerally similar to those of Mr. Anstice’s agreement, provided that Mr. Archer will receive 12 months basesalary instead of 18 months in the event of his Involuntary Termination.
Other Executive Agreements
The Company entered into change in control agreements with Dr. Gottscho and Ms. O’Dowd, effectiveJuly 1, 2009, for a term of three years, subject to the right of the Company or the executive, under certaincircumstances, to terminate the agreement prior to such time. The agreements provide that if a change in control(as defined as in Mr. Anstice’s agreement) of the Company occurs during the period of their employment underthe change in control agreement, and there is an Involuntary Termination (as defined as in Mr. Anstice’sagreement) of the executive’s employment, the executive will be entitled to payments and benefits substantivelysimilar to those contained in the change in control provisions of Mr. Maddock’s agreement.
56

The change in control agreements contain confidentiality, non-competition, and non-solicitation terms thatare substantively similar to those of Mr. Anstice’s and Mr. Maddock’s agreements, and require Dr. Gottscho andMs. O’Dowd to execute releases in favor of the Company to receive the payments described in the previousparagraph.
After the end of the fiscal year, the Company and Dr. Gottscho entered into an employment agreement,effective July 18, 2012, for a term of three years, subject to the right of the Company or Dr. Gottscho, undercertain circumstances, to terminate the agreement prior to such time. The terms of Dr. Gottscho’s agreement aresubstantively similar to those of Mr. Maddock’s July 18, 2012 employment agreement.
Also after the end of the fiscal year, the Company and Ms. O’Dowd entered into a change in controlagreement, effective July 18, 2012, for a term of three years, with the same terms as her prior agreement.
Vice Chairman of the Board Employment Agreement
The terms of Stephen G. Newberry’s agreement provide that Mr. Newberry shall serve as the Company’sVice Chairman, for a term commencing on January 1, 2012 and ending on December 31, 2014, subject to theright of the Company or Mr. Newberry, under certain circumstances, to terminate the agreement prior toDecember 31, 2014, and provided that Mr. Newberry’s employment under the agreement will terminate upon hisdeath or disability, as defined in the Newberry Agreement.
Under Mr. Newberry’s agreement, Mr. Newberry will receive a base salary of $500,000 per year, subject toannual adjustment at the discretion of the Board. That amount will be paid solely in cash during 2012, and during2013 and 2014 will be paid partially in cash, and partially in restricted stock units, as described in the agreement.Mr. Newberry will continue to vest in his current 2011/2012 Long-Term Incentive Plan, but he will not beeligible for future awards under the Company’s short-term or long term variable compensation plans.Mr. Newberry will receive other benefits, such as health insurance, vacation, and other benefit plans andcompensation programs generally applicable to executive officers of the Company.
The change in control terms and payment triggers of Mr. Newberry’s agreement are generally similar tothose of Mr. Anstice’s agreement and provide that Mr. Newberry will be entitled to (1) a lump-sum cash paymentequal to 12 months of Mr. Newberry’s Base Compensation; (2) if as of the termination date, payment has not yetbeen made under the Short Term Plan that was in effect during the 2011 calendar year, payment of any amountsunder the Short Term Plan that was in effect during the 2011 calendar year which Mr. Newberry would haveearned (based on the performance results achieved under the plan) if his employment had not been terminated;(3) certain medical benefits; (4) vesting, as of the date of termination, of the unvested portions of any stockoption or restricted stock unit awards granted to Mr. Newberry prior to the change in control, and (5) payment ofany amounts accrued as of the last full completed quarter as of the change in control under any long-term cash-based variable compensation plans (which will only include the 2011/2012 Long-Term Incentive Plan forMr. Newberry) of the Company (the “Long Term Plans”), plus an amount equal to the remaining target amountunder the Long Term Plans.
If Mr. Newberry is involuntarily terminated other than in connection with a change in control, he will beentitled to (1) a lump-sum cash payment equal to 12 months of Mr. Newberry’s base salary; (2) if as of thetermination date, payment has not yet been made under the Short Term Plan that was in effect during the 2011calendar year, payment of any amounts under the Short Term Plan that was in effect during the 2011 calendaryear which Mr. Newberry would have earned (based on the performance results achieved under the plan) if hisemployment had not been terminated; (3) certain medical benefits; and (4) vesting of any unvested stock optionsor RSUs that were granted 12 months or more before the termination date, in an amount such that the total vestedshares under any such awards equals the total number of calendar months worked, divided by the total number ofmonths over which such award vests, multiplied by the number of shares subject to such award; and any LongTerm Plans (which will only include the 2011/2012 Long-Term Incentive Plan for Mr. Newberry) which areaccrued as of the last full completed quarter prior to the termination date.
57

In the event of Mr. Newberry’s death or disability, he (or his estate) will be entitled to (1) a lump-sum cashpayment equal to 12 months of Mr. Newberry’s base compensation less, in the case of Mr. Newberry’s death,certain insurance payments, and, if as of the termination date, payment has not yet been made under the ShortTerm Plan that was in effect during the 2011 calendar year, payment of any amounts under the Short Term Planthat was in effect during the 2011 calendar year which Mr. Newberry would have earned (based on theperformance results achieved under the plan) if his employment had not been terminated plus; (2) payment ofcertain accrued but unpaid amounts under any Long Term Plan (which will only include the 2011/2012 Long-Term Incentive Plan for Mr. Newberry); (3) certain medical benefits; and (4) vesting of any unvested stockoptions or RSUs, in an amount equal to the greater of 50% of such awards or an amount such that the total vestedshares under any such awards equals the total number of calendar months worked, divided by the total number ofmonths over which such award vests, multiplied by the number of shares subject to such award.
If Mr. Newberry voluntarily resigns, he will be entitled to no additional benefits (except as he may beeligible for under the Executive Retiree Medical Plan), any unvested stock options will be cancelled 90 days afterthe date of termination unless earlier exercised. RSUs will be cancelled on the date of termination.
The Newberry Agreement contains confidentiality and non-competition obligations during the term of theagreement, and non-solicitation obligations for a period of six months following the termination of hisemployment.
Equity Plans
In addition to the above, certain of our stock plans provide for accelerated benefits after certain events.While the applicable triggers under each plan vary, these events generally include: (i) a merger or consolidationin which the Company is not the surviving entity, (ii) a sale of substantially all of the Company’s assets,including a liquidation or dissolution of the Company, or (iii) a change in the ownership of more than 50% of ouroutstanding securities by tender offer or similar transaction. After a designated event, the vesting of some or allof awards granted under these plans may be immediately accelerated in full, or certain awards may be assumed,substituted, replaced or settled in cash by a surviving corporation or its parent. The specific treatment of awardsin a particular transaction will be determined by the board and/or the terms of the applicable transactiondocuments.
58

Potential Payments to Named Executive Officers Upon Termination or Change in Control
The tables below summarize the potential payments to our NEOs, assuming a change in control of theCompany as of the end of fiscal year 2012. These amounts are calculated assuming that the employmenttermination or change in control occurs on the last day of fiscal year 2012, June 24, 2012. The closing price pershare of our common stock on June 22, 2012, which was the last trading day of fiscal year 2012, was $37.95.
Potential Payments to Mr. Anstice Upon Termination or Change of Controlas of June 24, 2012
Involuntary Termination
Executive Benefits and Payments Upon TerminationVoluntary
TerminationDisability or
DeathFor
CauseNot forCause
Change inControl
CompensationSeverance . . . . . . . . . . . . . . . . . . . . . . . . . . . . . . . . . . $— $ — $— $ 997,500 $ 997,500Short-term Incentive (5-year average) . . . . . . . . . . . . $— $ — $— $ 415,196 $ 415,196Short-term Incentive (pro rata 2012) . . . . . . . . . . . . . $— $ 415,600 $— $ 415,600 $ 415,600Long-term Incentives:
2011-2012 Cash LTIP . . . . . . . . . . . . . . . . . . . . $— $ 825,879 $— $ 825,879 $1,125,8792012-2013 Cash LTIP . . . . . . . . . . . . . . . . . . . . $— $ 303,578 $— $ 303,578 $1,616,078
Stock Options (Unvested and Accelerated) . . . . . . . . $— $ — $— $ — $ —Restricted Stock Units (Unvested and
Accelerated) . . . . . . . . . . . . . . . . . . . . . . . . . . . . . . $— $1,253,906 $— $ 488,417 $2,312,407Benefits and PerquisitesHealth Benefit Continuation/COBRA Benefit . . . . . . $— $ 22,545 $— $ 22,545 $ 22,543Total . . . . . . . . . . . . . . . . . . . . . . . . . . . . . . . . . . . . . . $— $2,821,508 $— $3,468,715 $6,905,203
Potential Payments to Mr. Maddock Upon Termination or Change of Controlas of June 24, 2012
Involuntary Termination
Executive Benefits and Payments Upon TerminationVoluntary
TerminationDisability or
DeathFor
CauseNot forCause
Change inControl
CompensationSeverance . . . . . . . . . . . . . . . . . . . . . . . . . . . . . . . . . . $— $ — $— $ 485,000 $ 485,000Short-term Incentive (5-year average) . . . . . . . . . . . . $— $ — $— $ 190,662 $ 381,323Short-term Incentive (pro rata 2012) . . . . . . . . . . . . . $— $ 206,181 $— $ 206,181 $ 206,181Long-term Incentives:
2011-2012 Cash LTIP . . . . . . . . . . . . . . . . . . . . $— $ 550,585 $— $ 550,585 $ 750,5852012-2013 Cash LTIP . . . . . . . . . . . . . . . . . . . . $— $ 138,778 $— $ 138,778 $ 738,778
Stock Options (Unvested and Accelerated) . . . . . . . . $— $ — $— $ — $ —Restricted Stock Units (Unvested and
Accelerated) . . . . . . . . . . . . . . . . . . . . . . . . . . . . . . $— $ 675,529 $— $ 325,611 $1,220,814Benefits and PerquisitesHealth Benefit Continuation/COBRA Benefit . . . . . . $— $ 16,796 $— $ 16,796 $ 16,796Total . . . . . . . . . . . . . . . . . . . . . . . . . . . . . . . . . . . . . . $— $1,587,869 $— $1,913,613 $3,199,477
59

Potential Payments to Dr. Gottscho Upon Termination or Change of Controlas of June 24, 2012
Involuntary Termination
Executive Benefits and Payments Upon TerminationVoluntary
TerminationDisabilityor Death
ForCause
Not forCause
Change inControl
CompensationSeverance . . . . . . . . . . . . . . . . . . . . . . . . . . . . . . . . . . $ — $ — $ — $ $ 437,750Short-term Incentive (5-year average) . . . . . . . . . . . $ — $ — $ — $ $ 317,517Short-term Incentive (pro rata 2012) . . . . . . . . . . . . . $ — $ $ — $ $ 186,044Long-term Incentives:
2011-2012 Cash LTIP . . . . . . . . . . . . . . . . . . . . $ — $ $ — $ $ 750,5852012-2013 Cash LTIP . . . . . . . . . . . . . . . . . . . . $ — $ $ — $ $ 738,778
Stock Options (Unvested and Accelerated) . . . . . . . . $ — $ — $ — $ — $ —Restricted Stock Units (Unvested and
Accelerated) . . . . . . . . . . . . . . . . . . . . . . . . . . . . . . $ — $ $ — $ $1,220,814Benefits and PerquisitesHealth Benefit Continuation/COBRA Benefit . . . . . $359,000 $359,000 $359,000 $359,000 $ 359,000Total . . . . . . . . . . . . . . . . . . . . . . . . . . . . . . . . . . . . . $359,000 $359,000 $359,000 $359,000 $4,010,488
Potential Payments to Ms. O’Dowd Upon Termination or Change of Controlas of June 24, 2012
Involuntary Termination
Executive Benefits and Payments Upon TerminationVoluntary
TerminationDisabilityor Death
ForCause
Not forCause
Change inControl
CompensationSeverance . . . . . . . . . . . . . . . . . . . . . . . . . . . . . . . . . . . . . . . . $— $— $— $— $ 386,250Short-term Incentive (5-year average) . . . . . . . . . . . . . . . . . . $— $— $— $— $ 301,524Short-term Incentive (pro rata 2012) . . . . . . . . . . . . . . . . . . . $— $— $— $— $ 144,844Long-term Incentives:
2011-2012 Cash LTIP . . . . . . . . . . . . . . . . . . . . . . . . . . . $— $— $— $— $ 586,3952012-2013 Cash LTIP . . . . . . . . . . . . . . . . . . . . . . . . . . . $— $— $— $— $ 577,171
Stock Options (Unvested and Accelerated) . . . . . . . . . . . . . . $— $— $— $— $ —Restricted Stock Units (Unvested and Accelerated) . . . . . . . . $— $— $— $— $ 953,721Benefits and PerquisitesHealth Benefit Continuation/COBRA Benefit . . . . . . . . . . . . $— $— $— $— $ 16,796Total . . . . . . . . . . . . . . . . . . . . . . . . . . . . . . . . . . . . . . . . . . . . $— $— $— $— $2,966,701
60

Potential Payments to Mr. Newberry Upon Termination or Change of Controlas of June 24, 2012
Involuntary Termination
Executive Benefits and Payments Upon TerminationVoluntary
TerminationDisability or
DeathFor
CauseNot forCause
Change inControl
CompensationSeverance . . . . . . . . . . . . . . . . . . . . . . . . . . . . . . . . $ — $ 500,000* $ — $ 500,000 $ 500,000Short-term Incentive (5-year average) . . . . . . . . . . $ — $ 0 $ — $ 0 $ 0Short-term Incentive (pro rata 2012) . . . . . . . . . . . $ — $ 0 $ — $ 0 $ 0Long-term Incentives:
2011-2012 Cash LTIP . . . . . . . . . . . . . . . . . . . $ — $1,548,522 $ — $1,548,522 $2,111,0222012-2013 Cash LTIP . . . . . . . . . . . . . . . . . . . $ — $ 0 $ — $ 0 $ 0
Stock Options (Unvested and Accelerated) . . . . . . $ — $ 0 $ — $ 0 $ 0Restricted Stock Units (Unvested and
Accelerated) . . . . . . . . . . . . . . . . . . . . . . . . . . . . $ — $ 915,828 $ — $ 915,828 $1,465,325Benefits and PerquisitesHealth Benefit Continuation/COBRA Benefit . . . . $367,000 $ 367,000 $367,000 $ 367,000 $ 367,000Total . . . . . . . . . . . . . . . . . . . . . . . . . . . . . . . . . . . . $367,000 3,331,350 $367,000 3,331,350 $4,076,347
* In the case of death, the $500,000 payment to Mr. Newberry is reduced by amounts payable pursuant to lifeinsurance in Mr. Newberry’s name. For fiscal year 2012, the life insurance amount is $1,000,000, whichwill reduce this payment to $0.
Dr. Srinivasan does not have an agreement which would result in any payments upon termination or changein control.
61
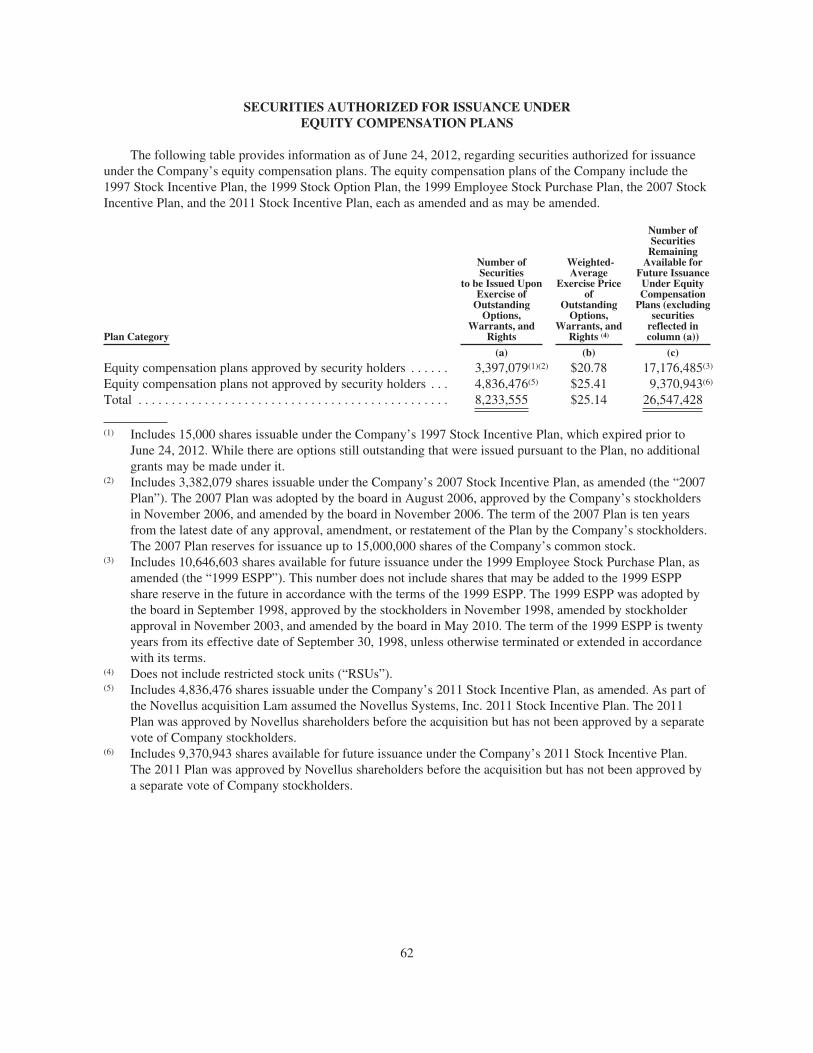
SECURITIES AUTHORIZED FOR ISSUANCE UNDEREQUITY COMPENSATION PLANS
The following table provides information as of June 24, 2012, regarding securities authorized for issuanceunder the Company’s equity compensation plans. The equity compensation plans of the Company include the1997 Stock Incentive Plan, the 1999 Stock Option Plan, the 1999 Employee Stock Purchase Plan, the 2007 StockIncentive Plan, and the 2011 Stock Incentive Plan, each as amended and as may be amended.
Plan Category
Number ofSecurities
to be Issued UponExercise of
OutstandingOptions,
Warrants, andRights
Weighted-Average
Exercise Priceof
OutstandingOptions,
Warrants, andRights (4)
Number ofSecurities
RemainingAvailable for
Future IssuanceUnder EquityCompensation
Plans (excludingsecurities
reflected incolumn (a))
(a) (b) (c)
Equity compensation plans approved by security holders . . . . . . 3,397,079(1)(2) $20.78 17,176,485(3)
Equity compensation plans not approved by security holders . . . 4,836,476(5) $25.41 9,370,943(6)
Total . . . . . . . . . . . . . . . . . . . . . . . . . . . . . . . . . . . . . . . . . . . . . . . 8,233,555 $25.14 26,547,428
(1) Includes 15,000 shares issuable under the Company’s 1997 Stock Incentive Plan, which expired prior toJune 24, 2012. While there are options still outstanding that were issued pursuant to the Plan, no additionalgrants may be made under it.
(2) Includes 3,382,079 shares issuable under the Company’s 2007 Stock Incentive Plan, as amended (the “2007Plan”). The 2007 Plan was adopted by the board in August 2006, approved by the Company’s stockholdersin November 2006, and amended by the board in November 2006. The term of the 2007 Plan is ten yearsfrom the latest date of any approval, amendment, or restatement of the Plan by the Company’s stockholders.The 2007 Plan reserves for issuance up to 15,000,000 shares of the Company’s common stock.
(3) Includes 10,646,603 shares available for future issuance under the 1999 Employee Stock Purchase Plan, asamended (the “1999 ESPP”). This number does not include shares that may be added to the 1999 ESPPshare reserve in the future in accordance with the terms of the 1999 ESPP. The 1999 ESPP was adopted bythe board in September 1998, approved by the stockholders in November 1998, amended by stockholderapproval in November 2003, and amended by the board in May 2010. The term of the 1999 ESPP is twentyyears from its effective date of September 30, 1998, unless otherwise terminated or extended in accordancewith its terms.
(4) Does not include restricted stock units (“RSUs”).(5) Includes 4,836,476 shares issuable under the Company’s 2011 Stock Incentive Plan, as amended. As part of
the Novellus acquisition Lam assumed the Novellus Systems, Inc. 2011 Stock Incentive Plan. The 2011Plan was approved by Novellus shareholders before the acquisition but has not been approved by a separatevote of Company stockholders.
(6) Includes 9,370,943 shares available for future issuance under the Company’s 2011 Stock Incentive Plan.The 2011 Plan was approved by Novellus shareholders before the acquisition but has not been approved bya separate vote of Company stockholders.
62

PROPOSAL NO. 2
ADVISORY VOTE ON FISCAL YEAR 2012EXECUTIVE COMPENSATION (“SAY ON PAY”)
The Dodd-Frank Wall Street Reform and Consumer Protection Act of 2010 (the “Dodd-Frank Act”) enablesthe Company’s stockholders to vote to approve, on an advisory or non-binding basis, the compensation of ournamed executive officers, as disclosed in this proxy statement in accordance with SEC rules. Although the vote isadvisory and is not binding on us or on our board of directors, our compensation committee and, as appropriate,our board, will take into account the outcome of the vote when considering future executive compensationdecisions and will evaluate whether any actions are necessary to address stockholder concerns.
We believe that our compensation philosophy has allowed us to attract, retain, and motivate qualifiedexecutive officers who have contributed to our success. For more information regarding the compensation of ournamed executive officers and our compensation philosophy, we encourage you to read the section of this proxystatement entitled “Executive Compensation and Other Information — Compensation Discussion and Analysis,”the compensation tables, and the narrative following the compensation tables for a more detailed discussion ofour compensation policies and practices.
We are asking for stockholder approval, on an advisory or non-binding basis, of the compensation of ournamed executive officers in accordance with SEC rules, including section 14A of the Exchange Act. This vote isnot intended to address any specific item of compensation, but rather the overall compensation of our namedexecutive officers and the policies and practices described in this proxy statement.
Stockholder approval of Proposal No. 2 requires the affirmative vote of a majority of the shares present andcast on the matter, in person or by proxy, at the annual meeting.
THE BOARD OF DIRECTORS RECOMMENDS A VOTE “FOR” THE APPROVAL, ON ANADVISORY OR NON-BINDING BASIS, OF PROPOSAL NO. 2.
63

PROPOSAL NO. 3
RATIFICATION OF THE APPOINTMENT OFINDEPENDENT REGISTERED PUBLIC ACCOUNTING FIRM
Stockholders are being asked to ratify the appointment of Ernst & Young LLP as the Company’sindependent registered public accounting firm for fiscal year 2013. Ernst & Young LLP has been the Company’sindependent registered public accounting firm (independent auditor) since fiscal year 1981.
Approval of Proposal No. 3 will require the affirmative vote of a majority of the outstanding shares ofcommon stock present or represented and voting on the proposal at the annual meeting. Each proxy received bythe Proxy Holders will be voted “FOR” the ratification of the appointment of Ernst & Young LLP, unless thestockholder provides other instructions.
Our audit committee meets periodically with Ernst & Young LLP to review both audit and non-auditservices performed by Ernst & Young LLP, as well as the fees charged for those services. Among other things,the committee examines the effect that the performance of non-audit services, if any, may have upon theindependence of the independent registered public accounting firm. All professional services provided byErnst & Young LLP, including non-audit services, if any, are subject to approval by the audit committee inaccordance with applicable securities laws, rules, and regulations. For more information, see the “AuditCommittee Report” and the “Relationship with Independent Registered Public Accounting Firm” sectionselsewhere in this proxy statement.
A representative of Ernst & Young LLP is expected to be present at the annual meeting and will have anopportunity to make a statement if he or she so desires. The representative will also be available to respond toappropriate questions from the stockholders.
Stockholder approval of Proposal No. 3 requires the affirmative vote of a majority of the shares present andcast on the matter, in person or by proxy, at the annual meeting.
THE BOARD OF DIRECTORS RECOMMENDS A VOTE “FOR” PROPOSAL NO. 3.
64

AUDIT COMMITTEE REPORT
The Company’s management, audit committee and independent registered public accounting firm (Ernst &Young LLP) have specific but different responsibilities relating to Lam’s financial reporting. Lam’s managementis responsible for the financial statements and for the system of internal control and the financial reportingprocess. Ernst & Young LLP has the responsibility to express an opinion on the financial statements and thesystem of internal control over financial reporting, based on the audit they conducted in accordance with thestandards of the Public Company Accounting Oversight Board (U.S.). The audit committee is responsible formonitoring and overseeing these processes.
In this context and in connection with the audited financial statements contained in the Company’s AnnualReport on Form 10-K for the fiscal year ended June 24, 2012, the audit committee took the following actions:
• Reviewed and discussed the audited financial statements with Company management
• Discussed with Ernst & Young LLP the matters required to be discussed by Rule AU380 of the PublicCompany Accounting Oversight Board (“PCAOB”), “Communication with Audit Committees”
• Reviewed the written disclosures and the letter from Ernst & Young LLP, required by Rule 3526 of thePCAOB, “Communication with Audit Committees Concerning Independence,” and discussed withErnst & Young LLP its independence
• Based on the foregoing reviews and discussions, recommended to the board of directors that theaudited financial statements be included in the Company’s 2012 Annual Report on Form 10-K for thefiscal year ended June 24, 2012 for filing with the SEC
This Audit Committee Report shall not be deemed “filed” with the SEC for purposes of federal securitieslaw, and it shall not, under any circumstances, be incorporated by reference into any of the Company’s past orfuture SEC filings. The report shall not be deemed soliciting material.
AUDIT COMMITTEEEric K. Brandt
Catherine P. Lego (Chair)Kim E. Perdikou
Delbert A. Whitaker
65

RELATIONSHIP WITHINDEPENDENT REGISTERED PUBLIC ACCOUNTING FIRM
Ernst & Young LLP has audited the Company’s consolidated financial statements since the Company’sinception.
Fees Billed by Ernst & Young LLP
The table below shows the fees billed by Ernst & Young LLP for audit and other services provided to theCompany in fiscal years 2012 and 2011.
Services / Type of FeeFiscal Year
2012Fiscal Year
2011
Audit Fees (1) . . . . . . . . . . . . . . . . . . . . . . . . . . . . . . . . . . . . . . . . . . . . . . . $ 4,528,332 $2,854,146Audit-Related Fees (2) . . . . . . . . . . . . . . . . . . . . . . . . . . . . . . . . . . . . . . . . 684,815 145,880Tax Fees . . . . . . . . . . . . . . . . . . . . . . . . . . . . . . . . . . . . . . . . . . . . . . . . . . — —All Other Fees (3) . . . . . . . . . . . . . . . . . . . . . . . . . . . . . . . . . . . . . . . . . . . . 1,995 1,995
TOTAL . . . . . . . . . . . . . . . . . . . . . . . . . . . . . . . . . . . . . . . . . . . . . . . . . . . $5,215,1422 $3,002,021
(1) Audit fees represent fees for professional services provided in connection with the audits of annual financialstatements, and for fiscal year 2012 include review of the Company’s acquisition of Novellus. Audit feesalso include reviews of quarterly financial statements, audit services related to other statutory or regulatoryfilings or engagements, and fees related to Ernst & Young LLP’s audit of the effectiveness of theCompany’s internal control over financial reporting pursuant to Section 404 of the Sarbanes-Oxley Act.
(2) Audit-related fees consist of assurance and related services that are reasonably related to the audit or reviewof the Company’s financial statements and are not reported above under “Audit Fees” and include feesrelated to accounting due diligence review associated with the Company’s acquisition of Novellus duringfiscal year 2012.
(3) Other fees represent subscription fees to Ernst & Young LLP’s accounting research service.
The audit committee reviewed summaries of the services provided by Ernst & Young LLP and the relatedfees during fiscal year 2012 and has determined that the provision of non-audit services was compatible withmaintaining the independence of Ernst & Young LLP as the Company’s independent registered publicaccounting firm. The audit committee approved 100% of the services and related fee amounts for servicesprovided by Ernst & Young LLP during fiscal year 2012.
Policy on Audit Committee Pre-Approval of Audit and Non-Audit Services
It is the responsibility of the audit committee to approve, in accordance with Sections 10A(h) and (i) of theExchange Act and the rules and regulations of the SEC, all professional services, to be provided to the Companyby its Independent Registered Public Accounting Firm, provided that the audit committee shall not approve anynon-audit services proscribed by Section 10A(g) of the Exchange Act in the absence of an applicable exemption.
It is the policy of the Company that the audit committee pre-approves all audit and permissible non-auditservices provided by the Company’s independent registered public accounting firm, consistent with the criteriaset forth in the Audit Committee Charter and applicable laws and regulations. The committee has delegated to thechair of the committee the authority to pre-approve such services, provided that the chair shall report anydecisions to pre-approve such services to the full audit committee at its next regular meeting. These services mayinclude audit services, audit-related services, tax services, and other services. The Company’s independentregistered public accounting firm and Company management are required to periodically report to the auditcommittee regarding the extent of services provided by the Company’s independent registered public accountingfirm pursuant to any such pre-approval.
66

CERTAIN RELATIONSHIPS AND RELATED PARTY TRANSACTIONS
No family relationships exist or existed during fiscal year 2012 among any of the Company’s directors andexecutive officers. No related-party transactions occurred during fiscal year 2012.
OTHER MATTERS
We are not aware of any other matters to be submitted to the annual meeting. If any other matters properlycome before the annual meeting, the Proxy Holders intend to vote the shares they represent as the board ofdirectors may recommend or, if the board does not make a recommendation, as the Proxy Holders decide in theirreasonable judgment.
It is important that your stock holdings be represented at the meeting, regardless of the number of sharesyou hold. We urge you to complete and return the accompanying proxy card in the enclosed envelope, or voteyour shares by telephone or internet, as described in the materials accompanying this proxy statement.
By Order of the Board of Directors,
Sarah A. O’DowdSecretary
Fremont, CaliforniaDated: September 21, 2012
67

[THIS PAGE INTENTIONALLY LEFT BLANK]


UNITED STATESSECURITIES AND EXCHANGE COMMISSION
WASHINGTON, D.C. 20549
FORM 10-K(Mark One)
È ANNUAL REPORT PURSUANT TO SECTION 13 OR 15(d) OF THE SECURITIESEXCHANGE ACT OF 1934
For the fiscal year ended June 24, 2012OR
‘ TRANSITION REPORT PURSUANT TO SECTION 13 OR 15(d) OF THE SECURITIESEXCHANGE ACT OF 1934
For the transition period from to .Commission file number: 0-12933
LAM RESEARCH CORPORATION(Exact name of registrant as specified in its charter)
Delaware 94-2634797(State or other jurisdiction of
incorporation or organization)(I.R.S. Employer
Identification No.)
4650 Cushing ParkwayFremont, California 94538
(Address of principal executive offices) (Zip code)Registrant’s telephone number, including area code: (510) 572-0200
Securities registered pursuant to Section 12(b) of the Act:Title of class Name of exchange on which registered
Common Stock, Par Value $0.001 Per Share NASDAQ Global Select MarketSecurities registered pursuant to Section 12(g) of the Act:
None(Title of class)
Indicate by check mark if the registrant is a well-known seasoned issuer, as defined in Rule 405 of the SecuritiesAct. Yes È No ‘
Indicate by check mark if the registrant is not required to file reports pursuant to Section 13 or Section 15(d) of theAct. Yes ‘ No È
Indicate by check mark whether the registrant (1) has filed all reports required to be filed by Section 13 or 15(d) of the SecuritiesExchange Act of 1934 during the preceding 12 months (or for such shorter period that the registrant was required to file such reports),and (2) has been subject to such filing requirements for the past 90 days. Yes È No ‘
Indicate by check mark whether the registrant has submitted electronically and posted on its corporate Web site, if any, everyInteractive Data File required to be submitted and posted pursuant to Rule 405 of Regulation S-T during the preceding 12 months (orfor such shorter period that the registrant was required to submit and post such files). Yes È No ‘
Indicate by check mark if disclosure of delinquent filers pursuant to Item 405 of Regulation S-K is not contained herein, and willnot be contained, to the best of registrant’s knowledge, in definitive proxy or information statements incorporated by reference inPart III of this Form 10-K or any amendment to this Form 10-K. ‘
Indicate by check mark whether the registrant is a large accelerated filer, an accelerated filer, a non-accelerated filer, or a smallerreporting company. See the definitions of “large accelerated filer,” “accelerated filer” and “smaller reporting company” in Rule 12b-2of the Exchange Act. (Check one):Large accelerated filer È Accelerated filer ‘
Non-accelerated filer ‘ (Do not check if a smaller reporting company) Smaller reporting company ‘
Indicate by check mark whether the registrant is a shell company (as defined in Rule 12b-2 of the ExchangeAct). Yes ‘ No È
The aggregate market value of the Registrant’s Common Stock, $0.001 par value, held by non-affiliates of the Registrant, as ofDecember 25, 2011, the last business day of the most recently completed second fiscal quarter with respect to the fiscal year coveredby this Form 10-K, was $3,659,876,227. Common Stock held by each officer and director and by each person who owns 5% or moreof the outstanding Common Stock has been excluded from this computation in that such persons may be deemed to be affiliates. Thisdetermination of affiliate status is not necessarily a conclusive determination of such status for other purposes.
As of August 14, 2012, the Registrant had 182,306,362 outstanding shares of Common Stock.
Documents Incorporated by ReferenceParts of the Registrant’s Proxy Statement for the Annual Meeting of Stockholders expected to be held on or about November 1,
2012 are incorporated by reference into Part III of this Form 10-K. (However, the Reports of the Audit Committee and CompensationCommittee are expressly not incorporated by reference herein.)

LAM RESEARCH CORPORATION
2012 ANNUAL REPORT ON FORM 10-K
TABLE OF CONTENTS
Page
Part I.
Item 1. Business . . . . . . . . . . . . . . . . . . . . . . . . . . . . . . . . . . . . . . . . . . . . . . . . . . . . . . . . . . . . . . . 3
Item 1A. Risk Factors . . . . . . . . . . . . . . . . . . . . . . . . . . . . . . . . . . . . . . . . . . . . . . . . . . . . . . . . . . . . 16
Item 1B. Unresolved Staff Comments . . . . . . . . . . . . . . . . . . . . . . . . . . . . . . . . . . . . . . . . . . . . . . . 27
Item 2. Properties . . . . . . . . . . . . . . . . . . . . . . . . . . . . . . . . . . . . . . . . . . . . . . . . . . . . . . . . . . . . . . 27
Item 3. Legal Proceedings . . . . . . . . . . . . . . . . . . . . . . . . . . . . . . . . . . . . . . . . . . . . . . . . . . . . . . . 27
Item 4. Mine Safety Disclosures . . . . . . . . . . . . . . . . . . . . . . . . . . . . . . . . . . . . . . . . . . . . . . . . . . . 27
Part II.
Item 5. Market for the Registrant’s Common Equity, Related Stockholder Matters and IssuerPurchases of Equity Securities . . . . . . . . . . . . . . . . . . . . . . . . . . . . . . . . . . . . . . . . . . . . . . 28
Item 6. Selected Financial Data . . . . . . . . . . . . . . . . . . . . . . . . . . . . . . . . . . . . . . . . . . . . . . . . . . . 32
Item 7. Management’s Discussion and Analysis of Financial Condition and Results ofOperations . . . . . . . . . . . . . . . . . . . . . . . . . . . . . . . . . . . . . . . . . . . . . . . . . . . . . . . . . . . . . . 47
Item 7A. Quantitative and Qualitative Disclosures about Market Risk . . . . . . . . . . . . . . . . . . . . . . 50
Item 8. Financial Statements and Supplementary Data . . . . . . . . . . . . . . . . . . . . . . . . . . . . . . . . . 50
Item 9. Changes in and Disagreements with Accountants on Accounting and FinancialDisclosure . . . . . . . . . . . . . . . . . . . . . . . . . . . . . . . . . . . . . . . . . . . . . . . . . . . . . . . . . . . . . . 50
Item 9A. Controls and Procedures . . . . . . . . . . . . . . . . . . . . . . . . . . . . . . . . . . . . . . . . . . . . . . . . . . . 50
Item 9B. Other Information . . . . . . . . . . . . . . . . . . . . . . . . . . . . . . . . . . . . . . . . . . . . . . . . . . . . . . . . 51
Part III.
Item 10. Directors, Executive Officers, and Corporate Governance . . . . . . . . . . . . . . . . . . . . . . . . 52
Item 11. Executive Compensation . . . . . . . . . . . . . . . . . . . . . . . . . . . . . . . . . . . . . . . . . . . . . . . . . . 52
Item 12. Security Ownership of Certain Beneficial Owners and Management and RelatedStockholder Matters . . . . . . . . . . . . . . . . . . . . . . . . . . . . . . . . . . . . . . . . . . . . . . . . . . . . . . 52
Item 13. Certain Relationships and Related Transactions, and Director Independence . . . . . . . . . . 52
Item 14. Principal Accounting Fees and Services . . . . . . . . . . . . . . . . . . . . . . . . . . . . . . . . . . . . . . 52
Part IV.
Item 15. Exhibits and Financial Statement Schedules . . . . . . . . . . . . . . . . . . . . . . . . . . . . . . . . . . . 53
Signatures . . . . . . . . . . . . . . . . . . . . . . . . . . . . . . . . . . . . . . . . . . . . . . . . . . . . . . . . . . . . . . . . . . . . . . . . 103
Exhibit Index . . . . . . . . . . . . . . . . . . . . . . . . . . . . . . . . . . . . . . . . . . . . . . . . . . . . . . . . . . . . . . . . . . . . . . 107
2

PART I
CAUTIONARY STATEMENT REGARDING FORWARD-LOOKING STATEMENTS
With the exception of historical facts, the statements contained in this discussion are forward-lookingstatements, which are subject to the safe harbor provisions created by the Private Securities Litigation ReformAct of 1995. Certain, but not all, of the forward-looking statements in this report are specifically identified asforward-looking, by use of phrases and words such as “we believe,” “we anticipate,” “we expect,” “may,”“should,” “could,” and other future-oriented terms. The identification of certain statements as “forward-looking” is not intended to mean that other statements not specifically identified are not forward-looking.Forward-looking statements include, but are not limited to, statements that relate to our future revenue,shipments, costs, earnings, income, and margins, product development, demand, acceptance and marketshare, competitiveness, market opportunities, levels of research and development (R&D), the success of ourmarketing, sales and service efforts, outsourced activities and operating expenses, anticipated manufacturing,customer and technical requirements, the ongoing viability of the solutions that we offer and our customers’success, tax expenses, our management’s plans and objectives for our current and future operations andbusiness focus, the levels of customer spending, general economic conditions, the sufficiency of financialresources to support future operations, and capital expenditures. Such statements are based on currentexpectations and are subject to risks, uncertainties, and changes in condition, significance, value and effect,including without limitation those discussed below under the heading “Risk Factors” within Item 1A andelsewhere in this report and other documents we file from time to time with the Securities and ExchangeCommission (the “SEC”), such as our quarterly reports on Form 10-Q and our current reports on Form 8-K.Such risks, uncertainties and changes in condition, significance, value and effect could cause our actualresults to differ materially from those expressed in this report and in ways we cannot readily foresee. Readersare cautioned not to place undue reliance on these forward-looking statements, which speak only as of thedate hereof and are based on information currently and reasonably known to us. We do not undertake anyobligation to release the results of any revisions to these forward-looking statements, which may be made toreflect events or circumstances that occur after the date of this report or to reflect the occurrence or effect ofanticipated or unanticipated events.
Item 1. Business
Incorporated in 1980, Lam Research Corporation (“Lam Research,” “Lam,” “we,” or the “Company”) is aDelaware corporation, headquartered in Fremont, California, and maintains a network of facilities throughoutAsia, Europe, and North America in order to meet the needs of its global customer base.
Additional information about Lam Research is available on our website at www.lamresearch.com.
Our Annual Report on Form 10-K, Quarterly Reports on Forms 10-Q, Current Reports on Forms 8-K, andany amendments to those reports are available on our website as soon as reasonably practical after we file themwith or furnish them to the SEC and are also available online at the SEC’s website at http://www.sec.gov.
The Lam Research logo, Lam Research, and all product and service names used in this report are eitherregistered trademarks or trademarks of Lam Research Corporation or its subsidiaries in the United States and/orother countries. All other marks mentioned herein are the property of their respective holders.
All references to fiscal years apply to our fiscal years, which ended June 24, 2012, June 26,2011, and June 27, 2010.
Lam acquired Novellus Systems, Inc. (“Novellus”) on June 4, 2012. As a result of the Novellus acquisition,Lam has enhanced its role as a leading supplier of wafer fabrication equipment and services to the worldwidesemiconductor industry. In addition, Lam is better positioned to serve our customer base by leveraging our
3

technical expertise across a broader portfolio of product to address the increasingly complex business ofmanufacturing integrated circuits. Lam Research has been a leading supplier of wafer fabrication equipment andservices for more than thirty years by contributing to the advancement of semiconductor manufacturing processesthat have led to the proliferation of a variety of electronic products that impact our everyday lives, including cellphones, computers, memory, and networking equipment. The Company’s customer base includes leadingsemiconductor memory, foundry, and integrated device manufacturers (“IDMs”) that make integrated circuits forthese products such as DRAM, NAND, and logic devices.
We design, manufacture, market, refurbish, and service semiconductor processing equipment used in thefabrication of integrated circuits. Semiconductor wafers are subjected to a complex series of process andpreparation steps that result in the simultaneous creation of many individual integrated circuits. Our products areused by every major semiconductor device manufacturer for their leading edge devices. Today, foundrycustomers are manufacturing leading edge devices at the 28nm technology node.
We leverage our expertise in semiconductor device processing to develop technology and productivitysolutions that typically benefit our customers through lower defect rates, enhanced yields, faster processing time,and/or reduced cost. Many of the technical advances that we introduce in our newest products are also availableas upgrades to our installed base of equipment; this is a benefit that can provide customers with a cost-effectivestrategy for extending the performance and capabilities of their existing wafer fabrication lines.
We are the market leader in plasma etch, a highly critical process step which shapes the microscopicconductive and dielectric/insulating layers into circuits that define a chip’s final use and function. In addition, weoffer a broad portfolio of single-wafer clean technologies, which allows our customers to implement customizedyield-enhancing solutions. With the acquisition of Novellus, we have expanded into the areas of thin-filmdeposition and surface preparation which, like single-wafer clean, are process steps often adjacent to etch. Duringdeposition, alternating thin-film conductive and dielectric layers are applied to create metal wiring and insulatingstructures. These technologies, together with other process steps, enable customers to build some of the world’shighest-performing integrated circuits. With each successive technology node, additional requirements andchallenges drive the need for advanced manufacturing solutions. We strive to consistently deliver these advancedcapabilities with cost-effective production performance. Lam Research understands the close relationshipbetween customer trust and the timely delivery of new solutions that leads to shared success with our customers.
Our Customer Support Business Group (“CSBG”) provides products and services to maximize installedequipment performance and operational efficiency. We offer a broad range of services to deliver valuethroughout the lifecycle of our equipment, including customer service, spares, upgrades, refurbishment of ouretch, deposition, photoresist strip, and clean products. While most semiconductor device manufacturers havetransitioned to 300 mm wafer technology, there are still many who utilize 200 mm technology, requiring prior-generation equipment. To address this market and to meet customers’ needs for high-performance, low-riskequipment, our Reliant™ Systems Business offers a suite of new and refurbished Lam legacy equipment.
With the acquisition of Novellus, we entered into the business of developing, manufacturing, selling andsupporting equipment used in grinding, lapping and polishing precision parts used in a broad spectrum ofindustrial applications. Our primary subsidiary in this area, Peter Wolters, is a leader in the design andmanufacturing of high precision grinding, lapping, polishing, and deburring systems used to achieve a highlyprecise or smooth surface on a finished material. Peter Wolters’ products are used in the semiconductor and LEDmanufacturing industries, as well as in the automotive, aerospace, medical, and green energy industries.
Lam’s subsidiary, Silfex, is a leading provider of high purity custom silicon components and assemblies thatserve high technology markets including the solar, optics, and semiconductor equipment markets. In addition toits silicon growing and fabrication services, Silfex also provides full vertical integration through the developmentof bonding, precision cleaning and clean room manufacturing necessary in the fabrication of critical componentsused by its customers.
4

Etch Process
Etch processes, which are repeated numerous times during the wafer fabrication cycle, are required tomanufacture every type of semiconductor device produced today. Our etch products selectively remove portionsof various films from the wafer in the creation of semiconductor devices. These products use various plasma-based technologies to create the desired critical device features at current and future technology nodes. Plasmaconsists of charged and neutral particles that react with exposed portions of the wafer surface to removedielectric or conductive materials and produce the finely defined features and patterns of an integrated circuit.Etch products are required to remove only the desired films and do so in a uniform fashion across the entiresurface of the wafer. This process is becoming increasingly challenging as device feature sizes shrink, thecomplexity of the films being removed increases, and the tolerance for variability between devices and wafersbecomes smaller.
Dielectric Etch
Dielectric etch often requires etching multi-layer film stacks. Smaller technology node sizes increase thecomplexity of the structures being etched, and repeatable on-wafer performance remains critical. In addition tothe challenges introduced by new materials and scaling, device manufacturers’ focus on reducing overall cost perwafer has placed an increased emphasis on the ability to etch multiple films in the same chamber (in situ).
Production-proven in high-volume manufacturing for the more than 15 years, our patented Dual FrequencyConfined™ (“DFC”) technology has been extended to incorporate multi-frequency power with physicallyconfined plasma. The application of power at different frequencies provides enhanced process flexibility andallows different materials to be etched in the same chamber. Physical confinement of the plasma to an areadirectly above the wafer minimizes chemical interaction with the chamber walls, eliminating potential polymerbuild-up that could lead to defects on the wafer. Confinement also enables our proprietary in situ WaferlessAutoclean™ (“WAC”) technology to clean chamber components after each wafer has been etched. Usedtogether, multi-frequency and WAC technologies provide a consistent process environment for every wafer,preventing process drift and ensuring repeatable process results wafer-to-wafer and chamber-to-chamber.
2300 Flex Product Family:2300® Exelan® Flex™, 2300® Exelan® Flex45™, 2300® Flex™ D Series, 2300® Flex™ E Series
Our 2300 Flex dielectric etch product family represents a continuous evolution of the productivity andperformance benefits of DFC technology. The 2300 Flex family allows a single chamber design to meet therequirements of a wide range of applications at multiple nodes. Advances in system design, such as multiplefrequencies, higher power capabilities and tunable wafer temperature, meet the more demanding uniformity andprofile requirements for applications at advanced technology nodes.
Conductor Etch
As the semiconductor industry continues to shrink critical feature sizes and improve device performance,a variety of new etch challenges have emerged. For conductor etch, these challenges include processing smallerfeatures, new materials, and 3-dimensional transistor structures on the wafer. Due to decreasing feature sizes, theetch process can now require atomic-level control across a 300 mm wafer. The incorporation of new metal gatesand high-k dielectric materials in the device stack requires advanced multi-film etching capability. Furthermore,the adoption of double patterning techniques to address lithography challenges, which began at sub-40nmtechnology nodes, expands etch processing by defining the feature on the wafer and also transferring the patterninto the film. All of these challenges require today’s conductor etch systems to provide advanced capabilities,while still providing high productivity.
Introduced in 1992, our Transformer Coupled Plasma™ (“TCP”) technology continues to provide leading-edge capability for advanced conductor etch applications at leading edge technology nodes. By efficiently
5

coupling radio frequency (“RF”) power into plasma at low pressures, the TCP technology provides capability toetch nanoscale features into silicon and metal films. The advanced TCP source design ensures a uniform, high-density plasma across the wafer, without requiring magnetic enhancements that could cause device damage. Witha wide process window over a range of power, chemistry, and pressure combinations, TCP technology providesthe flexibility required to perform multiple etch steps in the same chamber.
2300 Kiyo Product Family:2300® Versys® Kiyo®, 2300® Versys® Kiyo45™, 2300® Kiyo® C Series, 2300® Kiyo® E Series
2300 Versys Metal Product Family:2300® Versys® Metal, 2300® Versys® Metal45™, 2300® Versys® Metal L, 2300® Versys® Metal M
Now in its fourth generation, the 2300 Kiyo product family combines iterative advances in technology toprovide critical dimension (“CD”) uniformity and productivity for a wide range of conductor etch applications.The 2300 Versys Metal product family leverages Lam’s proprietary TCP technology to provide a flexibleplatform for back-end-of-line metal etch processes. Our etch products perform production-proven in situ etchesof complex features. In addition, proprietary pre-coat and post-etch chamber clean techniques provide the sameenvironment for superior repeatability, as well as high uptime and yield wafer after wafer.
Through-Silicon Via Etch
The semiconductor industry is developing advanced, three-dimensional integrated circuits (“3D ICs”) usingthrough-silicon vias (“TSVs”) to provide interconnect capability for die-to-die and wafer-to-wafer stacking. Inaddition to a reduced form factor, 3D ICs can enhance device performance through increased speed anddecreased power consumption. Manufacturers are currently considering a wide variety of 3D integration schemesthat present an equally broad range of TSV etch requirements. Plasma etch technology, which has been usedextensively for deep silicon etching in memory devices and micro-electromechanical systems (“MEMS”)production, is well suited for TSV creation.
2300 Syndion Product Family:2300® Syndion®, 2300® Syndion® C
The 2300 Syndion etch system is based on our patented TCP technology and the production-proven 2300Versys Kiyo conductor etch system. The Syndion system can etch multiple film stacks in the same chamber;including silicon, dielectric, and conducting materials, thereby addressing multiple TSV etch requirements.
MEMS and Deep Silicon Etch
Deep silicon etch is an enabling process for several emerging technologies, including MEMS devices,CMOS image sensors, and power devices. Many of these technologies are increasingly being used in consumerapplications, such as ink jet printer heads, accelerometers, and inertial sensors. This is driving a number of deepsilicon etch applications to transition into high-volume manufacturing, which requires the high levels of cost-effective production typically seen in commodity semiconductor memory devices. To achieve high yield in massproduction, the deep silicon etch process requires wafer-to-wafer repeatability.
TCP 9400DSiE Product Family:TCP® 9400DSiE™, TCP® 9400DSiE™ II
The TCP 9400DSiE system is based on our production-proven TCP 9400 silicon etch series. The system’spatented high-density TCP plasma source provides a configuration to meet the challenges of silicon deep reactiveion etch. This offers broad process capability and flexibility for a wide range of MEMS, advanced packaging,power semiconductor applications, and TSV applications on 150 mm and 200 mm wafers. In addition,incorporation of our proprietary in situ chamber cleaning technology provides etch rate stability.
6

Deposition Process
Our advanced deposition systems use chemical vapor deposition (“CVD”), physical vapor deposition(“PVD”), and electrochemical deposition (“ECD”) processes to form transistor, capacitor, and interconnectlayers in an integrated circuit. Our high-density plasma CVD (“HDP-CVD”) and plasma-enhanced CVD(“PECVD”) systems employ a chemical plasma to deposit dielectric material within the gaps formed by theetching of aluminum or in a copper chip as a blanket film which can be etched with patterns for depositingconductive materials into the etched dielectric. Our CVD tungsten systems are used to deposit conductivecontacts between transistors and interconnects or between layers of metal interconnect wiring. Our PVD systemsdeposit conductive aluminum and copper metal layers by sputtering metal atoms from the surface of a targetsource. Our ECD systems deposit copper to form the conductive wiring on integrated circuits using copperinterconnects.
CVD Technologies
In the CVD process, manufacturers place wafers in a reaction chamber, introduce a variety of pure andprecisely metered gases into the chamber, and then add a form of energy to activate a chemical reaction thatdeposits a film on the wafers. The CVD process is the traditional method used to deposit dielectric films onwafers. Manufacturers also use CVD to deposit conductive metal layers, particularly tungsten, as it is difficult todeposit such layers on devices with very small features when using conventional PVD or other depositiontechnologies.
ALTUS Product Family:ALTUS®, ALTUS® Max, ALTUS® Max ExtremeFill™, ALTUS® DirectFill™
The ALTUS tungsten CVD deposition systems deliver leading productivity and technology for contactand local interconnect applications. The system delivers advanced contact and via fill technology using a PulsedNucleation Layer (PNL™) Lam’s advanced Atomic Layer Deposition (ALD) nucleation technology withchemical vapor deposition processes, and the ALTUS multi-station sequential deposition (“MSSD”) architectureallows the nucleation layer and CVD fill to be performed within the same ALTUS Max chamber. The latestadvancement of the product, ALTUS Max ExtremeFill, has recently been introduced for challengingconventional applications and 3D fill applications requiring greater than 100% step coverage, and can beupgraded onto existing ALTUS or ALTUS Max systems. The ALTUS DirectFill barrier deposition systemdelivers a highly conformal tungsten nitride barrier film using PNL™ technology. The system is adapted fromthe ALTUS Max platform with the sequential deposition architecture providing maximum productivity and highreliability, resulting in low cost of ownership. ALTUS DirectFill technology extends contact metallization tofuture technology nodes, enabling superior electrical performance and low power consumption.
SPEED Product Family:SPEED®, SPEED® NExT, SPEED® Max
For gapfill HDP-CVD applications, the SPEED Max 300 mm system offers significant flexibility andproductivity benefits while extending HDP- CVD into leading edge technology nodes and beyond. SPEEDMax’s ability to run multiple processes for various devices in one platform, without any hardware changes,improves customer development times and tool utilizations across product lines. The SPEED Max isothermalchamber design, combined with an enlarged remote plasma source, allows more wafers to be processed betweenplasma cleans and delivers superior throughput per system. In addition, the multi-port injection, together withisolated source technology, customizes the deposition and in situ etching profile for optimal thickness and gapfill uniformity across the wafer.
7

VECTOR Product Family:VECTOR®, VECTOR® Express, VECTOR® Express AHM, VECTOR® Extreme, VECTOR® Extreme AHM,VECTOR® Extreme TEOS xT, VECTOR® Excel
The VECTOR PECVD products are used for depositing dielectric films on 300 mm wafers. With over1,000 systems installed in logic fabs, memory fabs, and foundries around the world, VECTOR has the highestinstalled base of 300mm PECVD systems in the industry. The VECTOR multi-station sequential depositionarchitecture not only provides excellent wafer-to-wafer repeatability, but also allows independent temperatureand RF control of each processing station, critical in meeting the integration needs for advanced technologynodes. VECTOR is available in a number of different models for different end applications. The VECTORExpress delivers capital productivity with high reliability. VECTOR Extreme is designed for memory megafabs,and the VECTOR Extreme TEOS xT version runs at industry leading throughputs. Both VECTOR Express andVECTOR Extreme can also be configured to deposit ashable hard mask (“AHM”) films. Finally, the VECTORExcel is a modular system designed to address the needs of advanced technology nodes that require pre- or post-deposition treatment of the dielectric film.
SOLA Product Family:SOLA®, SOLA® xT
SOLA is an innovative ultraviolet thermal processing (“UVTP”) system used for the post-depositiontreatment of dielectric films. SOLA is based on multi-station sequential treatment architecture to improve filmproperties and resulting device yields. The SOLA architecture is both highly productive and flexible and allowsthe use of different lamps, light intensities, and temperatures at each processing station, resulting in superiorpost-treatment film performance and improved wafer to wafer uniformity. A variety of applications benefit fromSOLA technology, including high-stress silicon nitrides and ultra-low-k dielectrics used to deliver increaseddevice speeds and lower power consumption for advanced technology nodes.
PVD Technologies
PVD, also known as “sputtering,” is a process in which ions of an inert gas, such as argon, areelectrically accelerated in a high vacuum toward a target of pure metal, such as tantalum or copper. Upon impact,the argon ions sputter off the target material, which is then deposited as a thin film on a silicon wafer. PVDprocesses are used to create the barrier and seed layers in copper damascene interconnect applications, as well asin front-end-of-line applications such as high-k/metal gate schemes for logic devices.
INOVA Product Family:INOVA®, INOVA® xT, INOVA® NExT
The latest generation INOVA NExT is a 300 mm PVD system designed for both copper damascene andsubtractive aluminum manufacturing processes. For copper applications, the INOVA NExT features the patentedHollow Cathode Magnetron (HCM™) source technology to provide ion-induced copper seed flow (IonFlow™)enabling the sidewall coverage, film quality, and scalable seed layers required for advanced technology nodes.Coupled with the HCM IONX™ tantalum or titanium barrier technology, the INOVA NExT system enablesPVD copper barrier seed ensures extendibility. For aluminum applications, the INOVA NExT production-provenQ300 Planar Magnetron Source provides industry-leading system productivity with lowest cost of consumablesand defects, our highest manufacturing throughput, and excellent process control for robust integration.
ECD Technologies
Lam’s Electrofill® products are used to build the copper primary conductive wires in advancedintegrated circuits. Electrofill uses a copper electrolytic solution to create lines and vias in a dielectric layerwhich has been etched with the pattern of the circuitry, in a process called copper damascene.
8

SABRE Product Family:SABRE®, SABRE® xT, SABRE® NExT, SABRE® Extreme, SABRE® Excel
The latest-generation SABRE Excel system features a deposition module that incorporates our patentedIRISCell™ technology that enables the deposition of very thin seeds for advanced technology nodes. SABREExcel’s Multiwave entry and low-corrosion electrolyte also dramatically improve on-wafer performance, reducecost of consumables, and significantly reduce production halting defects.
Surface Preparation Process
Chip manufacturers use surface preparation products to remove photoresist from a wafer’s surface after thephotolithographic circuitry patterning process to remove any film residues and particles before proceeding withthe next deposition step in the manufacturing process. Both wet chemistry and dry chemistry strip processes maybe used in semiconductor manufacturing. In dry strip, a combination of plasma energy and gaseous chemistriesare combined to achieve the desired result.
Standalone Photoresist Strip Products:GxT®, G400®
Our family of photoresist strip products are tailored to the specific needs of memory and logic customers.The GxT photoresist strip system is intended for critical logic device cleaning steps that demand low materialloss, full temperature and chemistry flexibility, and ultra-low defect rates. The GxT’s MSSP architecturefacilitates complex, multi-step ashing processes, while the ultra-low silicon loss (“ULSi”) H2-based processprovides non-oxidizing chemistries for near-zero material loss. Our G400 system, the industry’s most productivephotoresist system, is targeted for memory manufacturers and provides bulk strip and high-dose implant stripcapabilities. Enhanced source technology combined with faster wafer heating provides the G400 with industryleading throughputs for bulk strip applications and implant strip.
Clean Process
The manufacture of semiconductor devices involves a series of processes such as etch, deposition, andimplantation, which leave particles and residues on the surface of the wafer. The wafer must generally be cleanedafter these steps to remove particles and residues that could adversely impact the processes that immediatelyfollow them and degrade device performance. Common wafer cleaning steps include post-etch and post-stripcleans and pre-diffusion and pre-deposition cleans, among others.
As customers transition to smaller geometries, it becomes increasingly more challenging to efficientlyremove particles and residues while at the same time minimizing substrate material loss, protecting structureswith fragile new materials and smaller feature sizes, and efficient drying. Similarly, as manufacturers transitionto smaller technology nodes, managing particle build-up on the back-side of the wafer surface is becoming morecritical. Single-wafer wet processing provides an advantage over batch cleaning by preventing particles frommigrating from the back-side of a wafer to the front-side during the cleaning steps. In addition, management ofpotential defect sources at the wafer edge becomes increasingly challenging as new materials are introduced inthe process flow.
Single-Wafer Wet Clean
As device geometries shrink and new materials are introduced, device flows become more complex, and thenumber of wafer cleaning steps increases. The need to have better control of the cleaning process, to increaseoverall clean efficiency, and to clean fragile structures without causing damage are reasons why chipmakers areturning to single-wafer wet clean processing technology for next-generation devices.
Single-wafer wet processing is particularly advantageous for those applications where improved defectperformance (removing particles without damaging the wafer pattern) or enhanced selectivity and CD control can
9

improve yield. Over the past decade, the transition from batch to single-wafer processing has occurred forback-end-of-line wet clean applications. More recently device manufacturers have transitioned to single-waferprocessing for front-end-of-line wet clean applications as the need for higher particle removal efficiency withoutdevice structure damage has increased.
Spin Wet Clean Products:SP Series, Da Vinci®, DV-Prime®
Introduced over 20 years ago, our spin technology for cleaning and removing films has assisted the industrytransition from batch to single-wafer wet processing. This proven technology provides the productivity andflexibility needed for both high-volume manufacturing and leading-edge development across multiple technologynodes and for all device types. By offering advanced dilute chemistry and solvent solutions in our systems, ourspin wet clean systems address certain defectivity and material integrity requirements. In addition, our uniquewafer chuck design provides the ability to effectively clean the back-side of the wafer without damaging thedevices on the front-side of the wafer surface.
Plasma-Based Bevel Clean
Semiconductor manufacturers clean the wafer edge or bevel to properly remove yield limiting defects. Newmaterials like porous low-k and organic films often do not adhere as well as traditional silicon or polymer-basedfilms and have the potential to be significant defect sources. By including cleaning steps that target the bevelregion, the number of good die at the wafer’s edge can be increased to maximize yield.
2300® Coronus® Plasma Bevel Clean System
The 2300 Coronus plasma bevel clean system incorporates plasma technology to remove yield limitingdefect sources. The system combines the ability of plasma to selectively remove a wide variety of materials witha proprietary confinement technology that protects the die area. Incorporating our Dynamic Alignmenttechnology on the production-proven 2300 platform, the Coronus system provides highly accurate waferplacement for repeatable process results and superior encroachment control and is designed to remove a widerange of material types, in multiple applications, throughout the manufacturing process flow.
Advanced Wafer-Level Packaging or “Back End” Systems
3D wafer level packaging (“WLP”) is emerging as an alternative to traditional two dimensional packagingas the 3D approach offers a smaller form factor in the final chip package, increased interconnect speed andbandwidth, and lower power consumption, among other benefits. To address this emerging trend, we currentlyoffer WLP versions of our ECD, PVD, PECVD and photoresist strip systems.
ECD: SABRE® 3D — Designed for advanced wafer-level packaging applications including through-silicon vias,redistribution layers, pillars, under-bump metallization, and bumping. The system’s innovative modular designmaximizes footprint density, enables integrated multi-layer processing, and supports field extendibility, makingcapacity additions easy and cost effective. The SABRE 3D incorporates many of the same technologies found onthe standard SABRE platform, including sealed dry contacts, innovative clamshell and cell design, andSmartDose™ plating bath control.
PVD: INOVA® 3D — Designed for depositing copper barrier/seed films for TSVs, the INOVA 3D uses our next-generation patented HCM sputtering source coupled with our IonFlow technology to provide superior coppersidewall coverage and ultra-low defects in high aspect ratio TSVs. The ion-induced copper flow process enablesvoid-free fill to be achieved while using a much thinner seed layer compared to competitive PVD approaches,reducing the manufacturing cost of consumables for the TSV PVD process step by greater than 50%.
10

PECVD: VECTOR® 3D — Used to deposit high quality dielectric liners for TSV structures, as well as other lowtemperature films such as silicon nitride and silicon oxide that are compatible with bonded substrates. Thesystem incorporates technology to tune the hermiticity and electrical performance of these low temperature filmsto match the film quality typically obtained with a higher temperature dielectric deposition. VECTOR 3D alsouses the same patented MSSD technology that is incorporated into the more than 1,000 VECTOR PECVDsystems that have been shipped worldwide.
Photoresist Strip: G3D™ — Introduced in 2010, the G3D is a version of the GxT platform designed foradvanced WLP applications, including contact clean and TSV photoresist strip. The G3D photoresist strip systemhas been designed to quickly remove thick (20-100 micron) photoresists used in the manufacture of redistributionlayers and pillars and to achieve residue-free strip and clean of high aspect ratio TSVs. G3D’s competitive edgecomes from a unique combination of high productivity, low temperature processing, and a deep cleaningcapability that is enabled by the system’s high ash rate inductively-coupled plasma source. With flexible RFpower and gas distribution controls, and a low-temperature processing capability, the G3D affords a wide processwindow for residue-free removal at industry leading throughputs.
LED Manufacturing Systems
For the LED sub-segment of the general lighting marketplace, we offer a suite of highly productivedeposition, strip, and polishing/grinding process equipment solutions for LED manufacturing. Our products forLED manufacturing include the L3510® line of photoresist strip systems for de-scum and dry strip cleaningprocesses, the INOVA and SABRE systems for LED metallization steps, the SEQUEL® and VECTOR systemsfor PECVD deposition, and the AC-1500-P3 double-side polishing system from Peter Wolters for polishing andbackside grinding. Our LED manufacturing products are designed for substrates of sapphire, silicon carbide,silicon, gallium arsenide and gallium nitride, and can be used with wafers ranging from 2 inches (50 mm) to 12inches (300 mm) in diameter. All systems are supported by our worldwide field service organization.
Fiscal Periods Presented
All references to fiscal years apply to our fiscal years, which ended June 24, 2012, June 26,2011, and June 27, 2010. In all sections of this document, the fiscal 2012 information presented reflects 20 daysof Novellus related activity.
Research and Development
The market for semiconductor capital equipment is characterized by rapid technological change and productinnovation. Our ability to achieve and maintain our competitive advantage depends in part on our continued andtimely development of new products and enhancements to existing products. Accordingly, we devote asignificant portion of our personnel and financial resources to R&D programs and seek to maintain close andresponsive relationships with our customers and suppliers.
Our R&D expenses during fiscal years 2012, 2011, and 2010 were $444.6 million, $373.3 million, and$320.9 million, respectively. The majority of R&D spending over the past three years has been targeted at etchand other plasma-based technologies, single-wafer clean, and other semiconductor manufacturing products. Webelieve current challenges for customers at various points in the semiconductor manufacturing process presentopportunities for us.
We expect to continue to make substantial investments in R&D to meet our customers’ product needs,support our growth strategy, and enhance our competitive position.
11

Marketing, Sales, and Service
Our marketing, sales, and service efforts are focused on building long-term relationships with our customersand targeting product and service solutions designed to meet their needs. These efforts are supported by a team ofproduct marketing and sales professionals as well as equipment and process engineers who work closely withindividual customers to develop solutions for their wafer processing needs. We maintain ongoing servicerelationships with our customers and have an extensive network of service engineers in place throughout theUnited States, Europe, Taiwan, Korea, Japan, and Asia Pacific. We believe that comprehensive support programsand close working relationships with customers are essential to maintaining high customer satisfaction and ourcompetitiveness in the marketplace.
We provide standard warranties for our systems. The warranty provides that systems shall be free fromdefects in material and workmanship and conform to agreed-upon specifications. The warranty is limited torepair of the defect or replacement with new or like-new equivalent goods and is valid when the buyer providesprompt notification within the warranty period of the claimed defect or non-conformity and also makes the itemsavailable for inspection and repair. We also offer extended warranty packages to our customers to purchase asdesired.
International Sales
A significant portion of our sales and operations occur outside the United States and, therefore, may besubject to certain risks, including but not limited to tariffs and other barriers, difficulties in staffing and managingnon-U.S. operations, adverse tax consequences, foreign currency exchange rate fluctuations, changes in currencycontrols, compliance with U.S. and international laws and regulations, including U.S. export restrictions, andeconomic and political conditions. Any of these factors may have a material adverse effect on our business,financial position, and results of operations and cash flows. Revenue by region was as follows:
Year Ended
June 24, June 26, June 27,2012 2011 2010
(in thousands)
Revenue:Korea . . . . . . . . . . . . . . . . . . . . . . . . . . . . . . $ 893,549 $ 756,660 $ 539,312Taiwan . . . . . . . . . . . . . . . . . . . . . . . . . . . . . 467,922 766,910 703,854North America . . . . . . . . . . . . . . . . . . . . . . . 458,531 393,004 186,036Japan . . . . . . . . . . . . . . . . . . . . . . . . . . . . . . 308,189 405,371 318,641Asia Pacific . . . . . . . . . . . . . . . . . . . . . . . . . 292,963 492,600 252,248Europe . . . . . . . . . . . . . . . . . . . . . . . . . . . . . 244,038 423,148 133,685
Total revenue . . . . . . . . . . . . . . . . . . . . $2,665,192 $3,237,693 $2,133,776
Customers
Our customers include many of the world’s leading semiconductor manufacturers. Customers continue toestablish joint ventures, alliances and licensing arrangements which have the potential to positively or negativelyimpact our competitive position and market opportunities. In fiscal year 2012, three customers, SamsungElectronics Company, Ltd., SK Hynix Inc., and Taiwan Semiconductor Manufacturing Company, Ltd., combinedrepresented approximately 50% of total revenues and each customer individually represented greater than 10% oftotal revenues. In fiscal year 2011, Samsung Electronics Company, Ltd. represented approximately 24% of totalrevenues. In fiscal year 2010, three customers, Samsung Electronics Company, Ltd., Taiwan SemiconductorManufacturing Company, Ltd., and Toshiba Corporation, combined represented approximately 50% of totalrevenues and each customer individually represented greater than 10% of total revenues.
A material reduction in orders from our customers could adversely affect our results of operations andprojected financial condition. Our business depends upon the expenditures of semiconductor manufacturers.
12

Semiconductor manufacturers’ businesses, in turn, depend on many factors, including their economic capability,the current and anticipated market demand for integrated circuits and the availability of equipment capacity tosupport that demand.
Backlog
In general, we schedule production of our systems based upon our customers’ delivery requirements. Inorder for a system to be included in our backlog, the following conditions must be met: 1) we have received awritten customer request that has been accepted, 2) we have an agreement on prices and product specifications,and 3) there is a scheduled shipment within the next 12 months. In order for spares and services to be included inour backlog, the following conditions must be met: 1) we have received a written customer request that has beenaccepted and (2) delivery of products or provision of services is anticipated within the next 12 months. Wherespecific spare parts and customer service purchase contracts do not contain discrete delivery dates, we usevolume estimates at the contract price and over the contract period, not to exceed 12 months, in calculatingbacklog amounts. Our policy is to revise our backlog for order cancellations and to make adjustments to reflect,among other things, changes in spares volume estimates and customer delivery date changes. At June 24, 2012and June 26, 2011, our backlog was approximately $870 million and $641 million, respectively. Generally,orders for our products and services are subject to cancellation by our customers with limited penalties. Becausesome orders are received and shipped in the same quarter and because customers may change delivery dates andcancel orders, our backlog at any particular date is not necessarily indicative of business volumes or actualrevenue levels for succeeding periods.
Manufacturing
Our manufacturing operations consist mainly of assembling and testing components, sub-assemblies, andmodules that are then integrated into finished systems prior to shipment to or at the location of our customers.Most of the assembly and testing of our products is conducted in cleanroom environments.
We have agreements with third parties to outsource certain aspects of our manufacturing, productionwarehousing, and logistics functions. We believe that these outsourcing contracts provide us more flexibility toscale our operations up or down in a timely and cost effective manner, enabling us to respond to the cyclicalnature of our business. We believe that we have selected reputable providers and have secured their performanceon terms documented in written contracts. However, it is possible that one or more of these providers could failto perform as we expect, and such failure could have an adverse impact on our business and have a negativeeffect on our operating results and financial condition. Overall, we believe we have effective mechanisms tomanage risks associated with our outsourcing relationships. Refer to Note 14 of our Consolidated FinancialStatements, included in Item 15 of this report, for further information concerning our outsourcing commitments.
Certain components and sub-assemblies that we include in our products may only be obtained from a singlesupplier. We believe that, in many cases, we could obtain and qualify alternative sources to supply theseproducts. Nevertheless, any prolonged inability to obtain these components could have an adverse effect on ouroperating results and could unfavorably impact our customer relationships.
Environmental Matters
We are subject to a variety of governmental regulations related to the management of hazardous materialsthat we use in our business operations. We are currently not aware of any pending notices of violation, fines,lawsuits, or investigations arising from environmental matters that would have a material effect on our business.We believe that we are generally in compliance with these regulations and that we have obtained (or will obtainor are otherwise addressing) all necessary environmental permits to conduct our business. Nevertheless, thefailure to comply with present or future regulations could result in fines being imposed on us, require us tosuspend production or cease operations or cause our customers to not accept our products. These regulations
13

could require us to alter our current operations, to acquire significant additional equipment, or to incur substantialother expenses to comply with environmental regulations. Our failure to control the use, sale, transport ordisposal of hazardous substances could subject us to future liabilities.
Employees
As of August 14, 2012, we had approximately 6,600 regular employees. Although we have employment-related agreements with a number of key employees, these agreements do not guarantee continued service. Eachof our employees is required to comply with our policies relating to maintaining the confidentiality of ournon-public information.
In the semiconductor and semiconductor equipment industries, competition for highly skilled employees isintense. Our future success depends, to a significant extent, upon our continued ability to attract and retainqualified employees particularly in the R&D and customer support functions.
Competition
The semiconductor capital equipment industry is characterized by rapid change and is highly competitivethroughout the world. To compete effectively, we invest significant financial resources to continue to strengthenand enhance our product and services portfolio and to maintain customer service and support locations globally.Semiconductor manufacturers evaluate capital equipment suppliers in many areas, including, but not limited to,process performance, productivity, customer support, defect control, and overall cost of ownership, which can beaffected by many factors such as equipment design, reliability, software advancements, and similar factors. Ourability to succeed in the marketplace depends upon our ability to maintain existing products and introduceproduct enhancements and new products that meet customer requirements on a timely basis. In addition,semiconductor manufacturers must make a substantial investment to qualify and integrate new capital equipmentinto semiconductor production lines. As a result, once a semiconductor manufacturer has selected a particularsupplier’s equipment and qualified it for production, the manufacturer generally maintains that selection for thatspecific production application and technology node as long as the supplier’s products demonstrate performanceto specification in the installed base. Accordingly, we may experience difficulty in selling to a given customer ifthat customer has qualified a competitor’s equipment. We must also continue to meet the expectations of ourinstalled base of customers through the delivery of high-quality and cost-efficient spare parts in the presence ofthird-party spare parts provider competition.
We face significant competition with all of our products and services. Our primary competitors in the etchmarket are Tokyo Electron, Ltd. and Applied Materials, Inc. Our primary competitors in the single-wafer wetclean market are Dainippon Screen Manufacturing Co. Ltd. and Tokyo Electron, Ltd. In the tungsten CVD,PECVD, HDP-CVD, ECD and PVD markets, our primary competitor is Applied Materials, Inc. In the PECVDmarket, we also compete against ASM International. Our primary competitors in the surface preparation productarena are Mattson Technologies, Inc. and PSK, Inc.
Certain of our existing and potential competitors have substantially greater financial resources and largerengineering, manufacturing, marketing, and customer service and support organizations than we do. In addition,we face competition from a number of emerging companies in the industry. We expect our competitors tocontinue to improve the design and performance of their current products and processes and to introduce newproducts and processes with enhanced price/performance characteristics. If our competitors make acquisitions orenter into strategic relationships with leading semiconductor manufacturers, or other entities, covering productssimilar to those we sell, our ability to sell our products to those customers could be adversely affected. There canbe no assurance that we will continue to compete successfully in the future.
14

Patents and Licenses
Our policy is to seek patents on inventions relating to new or enhanced products and processes developed aspart of our ongoing research, engineering, manufacturing, and support activities. We currently hold a number ofUnited States and foreign patents covering various aspects of our products and processes. We believe that theduration of our patents generally exceeds the useful life of the technologies and processes disclosed and claimedin them. Our patents, which cover material aspects of our past and present core products, have current durationsranging from approximately one to twenty years. We believe that, although the patents we own and may obtain inthe future will be of value, they alone will not determine our success. Our success depends principally upon ourengineering, marketing, support, and delivery skills. However, in the absence of patent protection, we may bevulnerable to competitors who attempt to imitate our products, manufacturing techniques, and processes. Inaddition, other companies and inventors may receive patents that contain claims applicable or similar to ourproducts and processes. The sale of products covered by patents of others could require licenses that may not beavailable on terms acceptable to us, or at all. For further discussion of legal matters, see Item 3, “LegalProceedings,” of this report.
EXECUTIVE OFFICERS OF THE COMPANY
As of August 22, 2012, the executive officers of Lam Research were as follows:
Name Age Title
Martin B. Anstice . . . . . . . . . . . . . 45 President and Chief Executive OfficerTimothy M. Archer . . . . . . . . . . . . 45 Chief Operating OfficerErnest E. Maddock . . . . . . . . . . . .
54Senior Vice President, Chief Financial Officer and ChiefAccounting Officer
Richard A. Gottscho . . . . . . . . . . . 60 Senior Vice President, Global ProductsSarah A. O’Dowd . . . . . . . . . . . . . 62 Group Vice President, Chief Legal Officer
Martin B. Anstice is President and Chief Executive Officer of Lam Research. He joined Lam Research inApril 2001 as Senior Director, Operations Controller, was promoted to the position of Managing Director andCorporate Controller in May 2002, was promoted to Group Vice President, Chief Financial Officer and ChiefAccounting Officer in June 2004, was named Senior Vice President, Chief Financial Officer and ChiefAccounting Officer in March 2007, was promoted to Executive Vice President, Chief Operating Officer, inSeptember 2008, and promoted to President, Chief Operating Officer, in December 2010. In January 2012,Mr. Anstice was appointed President, Chief Executive Officer, and in February 2012, was appointed to the LamResearch Corporation Board of Directors. Mr. Anstice began his career at Raychem Corporation where, duringhis 13-year tenure, he held numerous finance roles of increasing responsibility in Europe and North America.Subsequent to Tyco International’s acquisition of Raychem in 1999, he assumed responsibilities supportingmergers and acquisition activities of Tyco Electronics. Mr. Anstice is an associate member of the CharteredInstitute of Management Accountants in the United Kingdom.
Timothy M. Archer joined Lam Research in June 2012 as the Company’s Chief Operating Officer. Prior toLam Research, Mr. Archer spent 18 years at Novellus Systems in various technology development and businessleadership roles, including most recently as Chief Operating Officer from January 2011 to June 2012, ExecutiveVice President Worldwide Sales, Marketing, and Customer Satisfaction from September 2009 to January 2011,and Executive Vice President of the PECVD and Electrofill Business Units from November 2008 to September2009. Mr. Archer’s tenure at Novellus Systems also included assignments as Senior Director of Technology forNovellus Systems Japan from 1999 to 2001 and Senior Director of Technology for the Electrofill Business Unitfrom April 2001 to April 2002. Mr. Archer started his career in 1989 at Tektronix where he was responsible forprocess development for high-speed bipolar integrated circuits. Mr. Archer completed the Program forManagement Development at Harvard Graduate School of Business and holds a Bachelor of Science degree inApplied Physics from the California Institute of Technology.
15

Ernest E. Maddock was appointed Senior Vice President and Chief Financial Officer of Lam Research inSeptember 2008. Additionally, Mr. Maddock oversees Information Technology and heads Silfex Incorporated(formerly Bullen Semiconductor Corporation), a division of Lam Research. From October 2003 throughSeptember 2008, Mr. Maddock held the position of Senior Vice President of Global Operations at Lam Research,overseeing Information Technology, Global Supply Chain, Production Operations, Corporate Quality, GlobalSecurity, and Global Real Estate & Facilities. Mr. Maddock also held the position of Vice President of theCustomer Support Business Group (CSBG) with the Company. Mr. Maddock joined the Company in November1997. Prior to his employment with Lam Research, Mr. Maddock was Managing Director, Global Logistics andRepair Services Operations, and Chief Financial Officer, Software Products Division, of NCR Corporation. Hehas also held a variety of executive roles in finance and operations in several industries ranging from commercialreal estate to telecommunications.
Richard A. Gottscho is the Company’s Senior Vice President, Global Products Group, a position he has heldsince August 2010. Prior to that time, he had been Group Vice President and General Manager, Etch Businessessince March 2007. Dr. Gottscho joined the Company in January 1996 and has served at various Director andVice President levels in support of etch products, CVD products, and corporate research. Prior to joining LamResearch, Dr. Gottscho was a member of Bell Laboratories for 15 years where he started his career working inplasma processing. During his tenure at Bell, he headed research departments in electronics materials, electronicspackaging, and flat panel displays. Dr. Gottscho is the author of numerous papers, patents, and lectures in plasmaprocessing and process control. He is a recipient of the American Vacuum Society’s Peter Mark MemorialAward and Plasma Science and Technology Division Prize, the Gaseous Electronics Conference FoundationLecturer, the Dry Process Symposium Nishizawa Award, and the Tegal Thinker Award. He is a fellow of theAmerican Physical and American Vacuum Societies and has served on numerous editorial boards of refereedtechnical publications, program committees for major conferences in plasma science and engineering, and wasvice-chair of a National Research Council study on plasma science in the 1980s. Dr. Gottscho earned Ph.D. andB.S. degrees in physical chemistry from the Massachusetts Institute of Technology and the Pennsylvania StateUniversity, respectively.
Sarah A. O’Dowd joined Lam Research in September 2008 as Group Vice President and Chief LegalOfficer, responsible for general legal matters, intellectual property and ethics & compliance. In addition to herLegal function, in April 2009 she was appointed Vice President of Human Resources and served in this dualcapacity from April 2009 through May 2012. Prior to joining Lam Research, Ms. O’Dowd was Vice Presidentand General Counsel for FibroGen, Inc. from February 2007 until September 2008. Until February 2007,Ms. O’Dowd was a shareholder in the law firm of Heller Ehrman LLP for more than twenty years, practicing inthe areas of corporate securities, governance and mergers and acquisitions for a variety of clients, principallypublicly traded high technology companies. She served in a variety of leadership and management roles at HellerEhrman, including Managing Partner of the Silicon Valley and San Diego offices, member of the firm’s PolicyCommittee and, as head of the firm’s business practice groups, a member of the firm’s Executive Committee.
Item 1A. Risk Factors
In addition to the other information in this 2012 Form 10-K, the following risk factors should be carefullyconsidered in evaluating the Company and its business because such factors may significantly impact ourbusiness, operating results, and financial condition. As a result of these risk factors, as well as other risksdiscussed in our other SEC filings, our actual results could differ materially from those projected in any forward-looking statements. No priority or significance is intended, nor should be attached, to the order in which the riskfactors appear.
16

The Semiconductor Equipment Industry is Subject to Major Fluctuations and, as a Result, We Face RisksRelated to Our Strategic Resource Allocation Decisions
The business cycle in the semiconductor equipment industry has historically been characterized by frequentperiods of rapid change in demand that challenge our management to adjust spending and other resourcesallocated to operating activities. During periods of rapid growth or decline in demand for our products andservices, we face significant challenges in maintaining adequate financial and business controls, managementprocesses, information systems, procedures for training and managing our work force, and in appropriately sizingour supply chain infrastructure, work force, and other components of our business on a timely basis. If we do notadequately meet these challenges during periods of demand decline, our gross margins and earnings may benegatively impacted.
We continuously reassess our strategic resource allocation choices in response to the changing businessenvironment. If we do not adequately adapt to the changing business environment, we may lack the infrastructureand resources to scale up our business to meet customer expectations and compete successfully during a periodof growth, or we may expand our capacity too rapidly and/or beyond what is appropriate for the actual demandenvironment.
Especially during transitional periods, resource allocation decisions can have a significant impact on ourfuture performance, particularly if we have not accurately anticipated industry changes. Our success will depend,to a significant extent, on the ability of our executive officers and other members of our senior management toidentify and respond to these challenges effectively.
Future Declines in the Semiconductor Industry, and the Overall World Economic Conditions on Which it isSignificantly Dependent, Could Have a Material Adverse Impact on Our Results of Operations and FinancialCondition
Our business depends on the capital equipment expenditures of semiconductor manufacturers, which in turndepend on the current and anticipated market demand for integrated circuits. The semiconductor industry iscyclical in nature and experiences periodic downturns. Global economic and business conditions, which are oftenunpredictable, have historically impacted customer demand for our products and normal commercialrelationships with our customers, suppliers, and creditors. Additionally, in times of economic uncertainty ourcustomers’ budgets for our products, or their ability to access credit to purchase them, could be adverselyaffected. This would limit their ability to purchase our products and services. As a result, economic downturnscan cause material adverse changes to our results of operations and financial condition including, but not limitedto:
• a decline in demand for our products;
• an increase in reserves on accounts receivable due to our customers’ inability to pay us;
• an increase in reserves on inventory balances due to excess or obsolete inventory as a result of ourinability to sell such inventory;
• valuation allowances on deferred tax assets;
• restructuring charges;
• asset impairments including the potential impairment of goodwill and other intangible assets;
• a decline in the value of our investments;
• exposure to claims from our suppliers for payment on inventory that is ordered in anticipation ofcustomer purchases that do not come to fruition;
• a decline in the value of certain facilities we lease to less than our residual value guarantee with thelessor; and
• challenges maintaining reliable and uninterrupted sources of supply.
17

Fluctuating levels of investment by semiconductor manufacturers may materially affect our aggregateshipments, revenues and operating results. Where appropriate, we will attempt to respond to these fluctuationswith cost management programs aimed at aligning our expenditures with anticipated revenue streams, whichsometimes result in restructuring charges. Even during periods of reduced revenues, we must continue to investin research and development (“R&D”) and maintain extensive ongoing worldwide customer service and supportcapabilities to remain competitive, which may temporarily harm our profitability and other financial results.
Our Long-term Success, Results of Operations and the Value of Our Common Stock Depend on OurAbility to Successfully Combine the Novellus Business With Our Pre-existing Business, Which May Be MoreDifficult, Costly or Time-consuming Than Expected
On June 4, 2012, we acquired Novellus, and we are currently combining Novellus’ business with ourpre-existing business. Our future success, results of operations and the value of our common stock depend, inpart, on our ability to realize the anticipated benefits of the acquisition. To realize these anticipated benefits, wemust successfully combine our businesses in an efficient and effective manner and communicate the impact thata business combination will have on our financial statements. If we are not able to achieve and clearlycommunicate these objectives within the anticipated time frame, or at all, the anticipated benefits and costsavings of the acquisition may not be realized fully, or at all, or may take longer than expected to realize, and ourresults of operations and the value of our common stock may be adversely affected.
Specific issues that must be addressed in integrating the operations of Novellus into our pre-existingoperations in order to realize the anticipated benefits of the acquisition include, among other things:
• integrating and optimizing the utilization of the properties, equipment, suppliers, distributionchannels, manufacturing, service, marketing, promotion and sales activities and informationtechnologies of the combined company;
• consolidating corporate and administrative infrastructures of the combined company;
• coordinating geographically dispersed organizations of the combined company;
• retaining and growing business at existing customers and attracting new customers to thecombined company;
• managing our contractual and business relationships with common suppliers and customers toreduce inconsistent or inefficient effects;
• retaining key employees and utilizing their technical knowledge and business expertise;
• communicating the inherently complex factors that a business combination will have on ourfinancial position and results of operations; and
• conforming standards, controls, procedures, policies, business cultures and compensationstructures throughout the combined company.
In addition, integration efforts will also divert management attention and resources, the actual integrationmay result in additional and unforeseen expenses, and the anticipated benefits of the integration plan may not berealized. Actual synergies, if achieved at all, may be lower than what we expect and may take longer to achievethan anticipated. If we are not able to adequately address these challenges, we may be unable to successfullyintegrate the combined company’s operations or to realize the anticipated benefits of the acquisition.
Our Quarterly Revenues and Operating Results Are Unpredictable
Our revenues and operating results may fluctuate significantly from quarter to quarter due to a number offactors, not all of which are in our control. We manage our expense levels based in part on our expectations offuture revenues. Because our operating expenses are based in part on anticipated future revenues, and a certain
18

amount of those expenses are relatively fixed, a change in the timing of recognition of revenue and/or the level ofgross profit from a small number of transactions can unfavorably affect operating results in a particular quarter.Factors that may cause our financial results to fluctuate unpredictably include, but are not limited to:
• economic conditions in the electronics and semiconductor industries in general and specifically thesemiconductor equipment industry;
• the size and timing of orders from customers;
• procurement shortages;
• the failure of our suppliers or outsource providers to perform their obligations in a manner consistentwith our expectations;
• manufacturing difficulties;
• customer cancellations or delays in shipments, installations, and/or customer acceptances;
• the extent that customers continue to purchase and use our products and services in their business;
• changes in average selling prices, customer mix, and product mix;
• our ability in a timely manner to develop, introduce and market new, enhanced, and competitiveproducts;
• our competitors’ introduction of new products;
• legal or technical challenges to our products and technology;
• transportation, communication, demand, information technology or supply disruptions based on factorsoutside our control such as strikes, acts of God, wars, terrorist activities, and natural disasters;
• legal, tax, accounting, or regulatory changes (including but not limited to change in import/exportregulations) or changes in the interpretation or enforcement of existing requirements;
• changes in our estimated effective tax rate;
• foreign currency exchange rate fluctuations; and
• the dilutive impact of our convertible notes and related warrants on our earnings per share.
Our Leverage and Debt Service Obligations and Potential Note Conversion or Related Hedging Activities MayAdversely Affect Our Financial Condition, Results of Operations and Earnings Per Share
As a result of the sale of our 2016 and 2018 convertible notes and the assumption of the 2041 convertiblenotes in connection with the Novellus acquisition (collectively the “Notes”), we have a greater amount of debtthan we have maintained in the past. Our maintenance of higher levels of indebtedness could have adverseconsequences including:
• impacting our ability to satisfy our obligations;
• increasing the portion of our cash flows that may have to be dedicated to interest and principalpayments and may not be available for operations, working capital, capital expenditures, expansion,acquisitions or general corporate or other purposes; and
• impairing our ability to obtain additional financing in the future.
Our ability to meet our expenses and debt obligations will depend on our future performance, which will beaffected by financial, business, economic, regulatory and other factors. Furthermore, our operations may notgenerate sufficient cash flows to enable us to meet our expenses and service our debt. As a result, we may need toenter into new financing arrangements to obtain the necessary funds. If we determine it is necessary to seekadditional funding for any reason, we may not be able to obtain such funding or, if funding is available, obtain it
19

on acceptable terms. If we fail to make a payment on our debt, we could be in default on such debt, and thisdefault could cause us to be in default on our other outstanding indebtedness.
Conversion of our Notes may cause dilution to our shareholders and to our earnings per share. Uponconversion of any Notes, we will deliver cash in the amount of the principal amount of the Notes and, withrespect to any excess conversion value greater than the principal amount of the Notes, shares of our commonstock, which would result in dilution to our shareholders. This dilution may be mitigated to some extent by thehedging transactions we entered into in connection with the sale of the 2016 and 2018 Notes. Prior to thematurity of the Notes, if the price of our common stock exceeds the conversion price, U.S. GAAP requires thatwe report an increase in diluted share count, which would result in lower reported earnings per share. The priceof our common stock could also be affected by sales of our common stock by investors who view the Notes as amore attractive means of equity participation in our company and by hedging activity that may develop involvingour common stock by holders of the Notes.
We Derive Our Revenues Primarily from a Relatively Small Number of High-Priced Systems
System sales constitute a significant portion of our total revenue. Our systems are priced up toapproximately $6 million per unit, and our revenues in any given quarter are dependent upon the acceptance of alimited number of systems. As a result, the inability to recognize revenue on even a few systems can cause asignificantly adverse impact on our revenues for a given quarter.
We Have a Limited Number of Key Customers
Sales to a limited number of large customers constitute a significant portion of our overall revenue,shipments and profitability. As a result, the actions of even one customer may subject us to variability in thoseareas that are difficult to predict. In addition, large customers may be able to negotiate requirements that result inincreased costs and/or lower margins for us. Similarly, significant portions of our credit risk may, at any giventime, be concentrated among a limited number of customers, so that the failure of even one of these keycustomers to pay its obligations to us could significantly impact our financial results. As of June 24, 2012, threecustomers accounted for approximately 24%, 17%, and 11 % of accounts receivable. As of June 26, 2011, threecustomers accounted for approximately 17%, 14%, and 10% of accounts receivable.
Variations in the Amount of Time it Takes for Our Customers to Accept Our Systems May Cause Fluctuationin Our Operating Results
We generally recognize revenue for new system sales on the date of customer acceptance or the date thecontractual customer acceptance provisions lapse. As a result, the fiscal period in which we are able to recognizenew systems revenues is typically subject to the length of time that our customers require to evaluate theperformance of our equipment after shipment and installation, which may vary from customer to customer andtool to tool. Such variations could cause our quarterly operating results to fluctuate.
We Depend on New Products and Processes for Our Success. Consequently, We are Subject to RisksAssociated with Rapid Technological Change
Rapid technological changes in semiconductor manufacturing processes subject us to increased pressure todevelop technological advances that enable those processes. We believe that our future success depends in partupon our ability to develop and offer new products with improved capabilities and to continue to enhance ourexisting products. If new products have reliability, quality, or design problems, our performance may beimpacted by reduced orders, higher manufacturing costs, delays in acceptance of and payment for new products,and additional service and warranty expenses. We may be unable to develop and manufacture new productssuccessfully, or new products that we introduce may fail in the marketplace. The expected industry transition to a450mm platform represents an emerging challenge for our business. Our failure to commercialize new productsin a timely manner could result in loss of market share, unanticipated costs, and inventory obsolescence, whichwould adversely affect our financial results.
20

In order to develop new products and processes, we expect to continue to make significant investments inR&D and to pursue joint development relationships with customers, suppliers or other members of the industry.We must manage product transitions and joint development relationships successfully, as the introduction of newproducts could adversely affect our sales of existing products. Future technologies, processes or productdevelopments may render our current product offerings obsolete, leaving us with non-competitive products, orobsolete inventory, or both. Moreover, customers may adopt new technologies or processes to address thecomplex challenges associated with next generation devices. This shift may result in a reduction in the size ofLam’s addressable markets. For example, the adoption of extreme ultraviolet lithography may adversely impactLam’s served available market.
We are Subject to Risks Relating to Product Concentration and Lack of Product Revenue Diversification
We derive a substantial percentage of our revenues from a limited number of products, which we expect willcontinue to account for a large percentage of our revenues in the near term. Continued market acceptance of theseproducts is, therefore, critical to our future success. Our business, operating results, financial condition, and cashflows could therefore be adversely affected by:
• a decline in demand for even a limited number of our products;
• a failure to achieve continued market acceptance of our key products;
• export restrictions or other regulatory or legislative actions that could limit our ability to sell thoseproducts to key customer or market segments;
• an improved version of products being offered by a competitor in the market in which we participate;
• increased pressure from competitors that offer broader product lines;
• technological changes that we are unable to address with our products; or
• a failure to release new or enhanced versions of our products on a timely basis.
In addition, the fact that we offer limited product lines creates the risk that our customers may view us asless important to their business than our competitors that offer additional products as well. This may impact ourability to maintain or expand our business with certain customers. Such product concentration may also subjectus to additional risks associated with technology changes. Our business is affected by our customers’ use of ourproducts in certain steps in their wafer fabrication processes. Should technologies change so that the manufactureof semiconductor chips requires fewer steps using our products, this could have a larger impact on our businessthan it would on the business of our less concentrated competitors.
Strategic Alliances and Potential Customer Consolidation May Have Negative Effects on Our Business
Increasingly, semiconductor manufacturing companies are entering into strategic alliances or consolidatingwith one another to expedite the development of processes and other manufacturing technologies and/or achieveeconomies of scale. The outcomes of such an alliance can be the definition of a particular tool set for a certainfunction and/or the standardization of a series of process steps that use a specific set of manufacturingequipment; while the outcomes of consolidation can lead to an overall reduction in the market for semiconductormanufacturing equipment as customers’ operations achieve economies of scale and/or increased purchasingpower based on their higher volumes. While in certain instances this could work to our advantage, if ourequipment becomes the basis for the function or process as the tool of choice for the larger consolidated customeror alliance, it could also work to our disadvantage if a competitor’s tools or equipment become the standardequipment for such functions or processes.
Similarly, our customers may team with, or follow the lead of, educational or research institutions thatestablish processes for accomplishing various tasks or manufacturing steps. If those institutions utilize a
21

competitor’s equipment when they establish those processes, it is likely that customers will tend to use the sameequipment in setting up their own manufacturing lines. These actions could adversely impact our market shareand financial results.
We Depend On a Limited Number of Key Suppliers
We obtain certain components and sub-assemblies included in our products from a single supplier or alimited group of suppliers. We have established long-term contracts with many of these suppliers. These long-term contracts can take a variety of forms. We may renew these contracts periodically. In some cases, thesesuppliers have sold us products for a substantial period of time, and we expect that we and they will continue torenew these contracts in the future or that we will otherwise replace them with competent alternative suppliers.However, certain of our suppliers are relatively new providers to us so that our experience with them and theirperformance is limited. Where practical, we intend to establish alternative sources to mitigate the risk that thefailure of any single supplier will adversely affect our business. Nevertheless, a prolonged inability to obtaincertain components could impair our ability to ship products and generate revenues, which could adversely affectour operating results and damage our customer relationships.
Our Outsource Providers May Fail to Perform as We Expect
Outsource providers have played and will continue to play a key role in our manufacturing operations and inmany of our transactional and administrative functions, such as information technology, facilities management,and certain elements of our finance organization. Although we attempt to select reputable providers and securetheir performance on terms documented in written contracts, it is possible that one or more of these providerscould fail to perform as we expect and such failure could have an adverse impact on our business.
In addition, the expansive role of our outsource providers has required and may continue to require us toimplement changes to our existing operations and to adopt new procedures to deal with and manage theperformance of these outsource providers. Any delay or failure in the implementation of our operational changesand new procedures could adversely affect our customer and/or employee relationships, which could have anegative effect on our operating results.
Once a Semiconductor Manufacturer Commits to Purchase a Competitor’s Semiconductor ManufacturingEquipment, the Manufacturer Typically Continues to Purchase that Competitor’s Equipment, Making it MoreDifficult for Us to Sell Our Equipment to that Customer
Semiconductor manufacturers must make a substantial investment to qualify and integrate wafer processingequipment into a semiconductor production line. We believe that once a semiconductor manufacturer selects aparticular supplier’s processing equipment, the manufacturer generally relies upon that equipment for thatspecific production line application for an extended period of time. Accordingly, we expect it to be more difficultto sell our products to a given customer if that customer initially selects a competitor’s equipment for the sameproduct line application.
We Face a Challenging and Complex Competitive Environment
We face significant competition from multiple competitors. Other companies continue to develop systemsand products that are competitive to ours and may introduce new products, which may affect our ability to sellour existing products. We face a greater risk if our competitors enter into strategic relationships with leadingsemiconductor manufacturers covering products similar to those we sell or may develop, as this could adverselyaffect our ability to sell products to those manufacturers.
We believe that to remain competitive we must devote significant financial resources to offer a broad rangeof products, to maintain customer service and support centers worldwide, and to invest in product and process
22

R&D. Certain of our competitors, especially those that are created and financially backed by foreigngovernments, have substantially greater financial resources and more extensive engineering, manufacturing,marketing, and customer service and support resources than we do and therefore have the potential toincreasingly dominate the semiconductor equipment industry. These competitors may deeply discount or giveaway products similar to those that we sell, challenging or even exceeding our ability to make similaraccommodations and threatening our ability to sell those products. We also face competition from our owncustomers, who in some instances have established affiliated entities that manufacture equipment similar to ours.For these reasons, we may fail to continue to compete successfully worldwide.
In addition, our competitors may be able to develop products comparable or superior to those we offer ormay adapt more quickly to new technologies or evolving customer requirements. In particular, while we continueto develop product enhancements that we believe will address future customer requirements, we may fail in atimely manner to complete the development or introduction of these additional product enhancementssuccessfully, or these product enhancements may not achieve market acceptance or be competitive. Accordingly,competition may intensify, and we may be unable to continue to compete successfully in our markets, whichcould have a material adverse effect on our revenues, operating results, financial condition, and/or cash flows.
Our Future Success Depends Heavily on International Sales and the Management of Global Operations
Non-U.S. sales accounted for approximately 83% of total revenue in fiscal year 2012, 88% of total revenuein fiscal year 2011, and 91% of total revenue in fiscal year 2010. We expect that international sales will continueto account for a substantial portion of our total revenue in future years.
We are subject to various challenges related to international sales and the management of global operationsincluding, but not limited to:
• trade balance issues;
• global economic and political conditions, including the ongoing macroeconomic challenges associatedwith sovereign debt levels in certain Euro-zone countries and the financial contagion to global markets;
• changes in currency controls;
• differences in the enforcement of intellectual property and contract rights in varying jurisdictions;
• our ability to respond to customer and foreign government demands for locally sourced systems, spareparts and services and develop the necessary relationships with local suppliers;
• compliance with U.S. and international laws and regulations affecting foreign operations, includingU.S. export restrictions;
• fluctuations in interest and foreign currency exchange rates;
• the need for technical support resources in different locations; and
• our ability to secure and retain qualified people in all necessary locations for the successful operationof our business.
Certain international sales depend on our ability to obtain export licenses from the U.S. government. Ourfailure or inability to obtain such licenses would substantially limit our markets and severely restrict ourrevenues. Many of the challenges noted above are applicable in China, which is a fast developing market for thesemiconductor equipment industry and therefore an area of potential significant growth for our business. As thebusiness volume between China and the rest of the world grows, there is inherent risk, based on the complexrelationships among China, Taiwan, Japan, South Korea, and the United States, that political and diplomaticinfluences might lead to trade disruptions. This would adversely affect our business with China, Taiwan, Japan,and/or South Korea and perhaps the entire Asia Pacific region. A significant trade disruption in these areas couldhave a materially adverse impact on our future revenue and profits.
23

We are potentially exposed to adverse as well as beneficial movements in foreign currency exchange rates.The majority of our sales and expenses are denominated in U.S. dollars. However, we are exposed to foreigncurrency exchange rate fluctuations related to certain of our revenues denominated in Japanese yen and Euros, aswell as certain of our spares and service contracts, Euro denominated expenses, and expenses related to ournon-U.S. sales and support offices that are denominated in the related countries’ local currency.
We currently enter into foreign currency forward contracts to minimize the short-term impact of the foreigncurrency exchange rate fluctuations on Japanese yen-denominated (“JPY”) revenue and monetary assets andliabilities, Euro-denominated (“EUR”) expenses and monetary assets and liabilities, as well as monetary assetsand liabilities denominated in Swiss francs (“CHF”),Taiwanese dollars (“TWD”), and Great British pounds(“GBP”). We believe these are our primary exposures to currency rate fluctuation. We expect to continue to enterinto hedging transactions, for the purposes outlined, for the foreseeable future. However, these hedgingtransactions may not achieve their desired effect because differences between the actual timing of the underlyingexposures and our forecasts of those exposures may leave us either over-or under-hedged on any giventransaction. Moreover, by hedging these foreign currency denominated revenues, expenses, monetary assets andliabilities with foreign currency forward contracts, we may miss favorable currency trends that would have beenadvantageous to us but for the hedges. Additionally, we are exposed to short-term foreign currency exchange ratefluctuations on non-U.S. dollar-denominated (“USD”) assets and liabilities (other than those currency exposurespreviously discussed) and currently we do not enter into foreign currency hedge contracts against theseexposures. Therefore, we are subject to both favorable and unfavorable foreign currency exchange ratefluctuations to the extent that we transact business (including intercompany transactions) for these currencies.
Our Ability To Attract, Retain and Motivate Key Employees Is Critical To Our Success
Our ability to compete successfully depends in large part on our ability to attract, retain and motivate keyemployees. This is an ongoing challenge due to intense competition for top talent, as well as fluctuations inindustry economic conditions that may require cycles of hiring activity and workforce reductions. Our success inhiring depends on a variety of factors, including the attractiveness of our compensation and benefit programs andour ability to offer a challenging and rewarding work environment. We periodically evaluate our overallcompensation programs and make adjustments, as appropriate, to maintain or enhance their competitiveness. Ifwe are not able to successfully attract, retain and motivate key employees, we may be unable to capitalize onmarket opportunities and our operating results may be materially and adversely affected.
We Rely Upon Certain Critical Information Systems for the Operation of Our Business
We maintain and rely upon certain critical information systems for the effective operation of our business.These information systems include telecommunications, the internet, our corporate intranet, various computerhardware and software applications, network communications, and e-mail. These information systems may beowned and maintained by us, our outsource providers or third parties such as vendors and contractors. Theseinformation systems are subject to attacks, failures, and access denials from a number of potential sourcesincluding viruses, destructive or inadequate code, power failures, and physical damage to computers, hard drives,communication lines, and networking equipment. Confidential information stored on these information systemscould be compromised. To the extent that these information systems are under our control, we have implementedsecurity procedures, such as virus protection software and emergency recovery processes, to mitigate the outlinedrisks. However, security procedures for information systems cannot be guaranteed to be failsafe and our inabilityto use or access these information systems at critical points in time, or unauthorized releases of confidentialinformation, could unfavorably impact the timely and efficient operation of our business.
24

Our Financial Results May be Adversely Impacted by Higher than Expected Tax Rates or Exposure toAdditional Tax Liabilities
As a global company, our effective tax rate is highly dependent upon the geographic composition ofworldwide earnings and tax regulations governing each region. We are subject to income taxes in the UnitedStates and various foreign jurisdictions, and significant judgment is required to determine worldwide taxliabilities. Our effective tax rate could be adversely affected by changes in the split of earnings between countrieswith differing statutory tax rates, in the valuation of deferred tax assets, in tax laws, by material auditassessments, or changes in or expirations of agreements with tax authorities. These factors could affect ourprofitability. In particular, the carrying value of deferred tax assets, which are predominantly in the United States,is dependent on our ability to generate future taxable income in the United States. In addition, the amount ofincome taxes we pay is subject to ongoing audits in various jurisdictions, and a material assessment by agoverning tax authority could affect our profitability.
A Failure to Comply with Environmental Regulations May Adversely Affect Our Operating Results
We are subject to a variety of governmental regulations related to the handling, discharge, and disposal oftoxic, volatile or otherwise hazardous chemicals. We believe that we are generally in compliance with theseregulations and that we have obtained (or will obtain or are otherwise addressing the need for) all environmentalpermits necessary to conduct our business. These permits generally relate to the handling and disposal ofhazardous wastes. Nevertheless, the failure to comply with present or future regulations could result in finesbeing imposed on us, require us to suspend production, or cease operations or cause our customers to not acceptour products. These regulations could require us to alter our current operations, to acquire significant additionalequipment or to incur substantial other expenses to comply with environmental regulations. Any failure tocomply with regulations governing the use, handling, sale, transport or disposal of hazardous substances couldsubject us to future liabilities.
If We Choose to Acquire or Dispose of Product Lines and Technologies, We May Encounter Unforeseen Costsand Difficulties That Could Impair Our Financial Performance
An important element of our management strategy is to review acquisition prospects that would complementour existing products, augment our market coverage and distribution ability, or enhance our technologicalcapabilities. As a result, we may make acquisitions of complementary companies, products or technologies, orwe may reduce or dispose of certain product lines or technologies that no longer fit our long-term strategies.Managing an acquired business, disposing of product technologies or reducing personnel entail numerousoperational and financial risks, including difficulties in assimilating acquired operations and new personnel orseparating existing business or product groups, diversion of management’s attention away from other businessconcerns, amortization of acquired intangible assets and potential loss of key employees or customers of acquiredor disposed operations. There can be no assurance that we will be able to achieve and manage successfully anysuch integration of potential acquisitions, disposition of product lines or technologies, or reduction in personnelor that our management, personnel, or systems will be adequate to support continued operations. Any suchinabilities or inadequacies could have a material adverse effect on our business, operating results, financialcondition, and cash flows.
In addition, any acquisition could result in changes such as potentially dilutive issuances of equitysecurities, the incurrence of debt and contingent liabilities, the amortization of related intangible assets, andgoodwill impairment charges, any of which could materially adversely affect our business, financial condition,and results of operations and/or the price of our Common Stock.
25

The Market for Our Common Stock is Volatile, Which May Affect Our Ability to Raise Capital, MakeAcquisitions, or Subject Our Business to Additional Costs
The market price for our Common Stock is volatile and has fluctuated significantly over the past years. Thetrading price of our Common Stock could continue to be highly volatile and fluctuate widely in response to avariety of factors, many of which are not within our control or influence. These factors include but are notlimited to the following:
• general market, semiconductor, or semiconductor equipment industry conditions;
• economic or political events and trends occurring globally or in any of our key sales regions;
• variations in our quarterly operating results and financial condition, including our liquidity;
• variations in our revenues, earnings or other business and financial metrics from forecasts by us orsecurities analysts, or from those experienced by other companies in our industry;
• announcements of restructurings, reductions in force, departure of key employees, and/orconsolidations of operations;
• government regulations;
• developments in, or claims relating to, patent or other proprietary rights;
• technological innovations and the introduction of new products by us or our competitors;
• commercial success or failure of our new and existing products;
• disruptions of relationships with key customers or suppliers; or
• dilutive impacts of our Notes and related warrants.
In addition, the stock market experiences significant price and volume fluctuations. Historically, we havewitnessed significant volatility in the price of our Common Stock due in part to the actual or anticipatedmovement in interest rates and the price of and markets for semiconductors. These broad market and industryfactors have and may again adversely affect the price of our Common Stock, regardless of our actual operatingperformance. In the past, following volatile periods in the price of their stock, many companies became theobject of securities class action litigation. If we are sued in a securities class action, we could incur substantialcosts, and it could divert management’s attention and resources and have an unfavorable impact on our financialperformance and the price for our Common Stock.
Intellectual Property, Indemnity and Other Claims Against Us Can be Costly and We Could Lose SignificantRights That are Necessary to Our Continued Business and Profitability
Third parties may assert infringement, unfair competition, product liability, breach of contract, or otherclaims against us. From time to time, other parties send us notices alleging that our products infringe their patentor other intellectual property rights. In addition, law enforcement authorities may seek criminal charges relatingto intellectual property or other issues. We also face risks of claims arising from commercial and otherrelationships. In addition, our Bylaws and indemnity obligations provide that we will indemnify officers anddirectors against losses that they may incur in legal proceedings resulting from their service to Lam Research.From time to time, in the normal course of business, we indemnify third parties with whom we enter intocontractual relationships, including customers and suppliers, with respect to certain matters. We have agreed,under certain conditions, to hold these third parties harmless against specified losses, such as those arising from abreach of representations or covenants, other third party claims that our products when used for their intendedpurposes infringe the intellectual property rights of such other third parties, or other claims made against certainparties. In such cases, it is our policy either to defend the claims or to negotiate licenses or other settlements oncommercially reasonable terms. However, we may be unable in the future to negotiate necessary licenses orreach agreement on other settlements on commercially reasonable terms, or at all, and any litigation resulting
26

from these claims by other parties may materially adversely affect our business and financial results, and we maybe subject to substantial damage awards and penalties. Moreover, although we have insurance to protect us fromcertain claims and cover certain losses to our property, such insurance may not cover us for the full amount ofany losses, or at all, and may be subject to substantial exclusions and deductibles.
We May Fail to Protect Our Critical Proprietary Technology Rights, Which Could Affect Our Business
Our success depends in part on our proprietary technology and our ability to protect key components of thattechnology through patents, copyrights and trade secret protection. Protecting our key proprietary technologyhelps us to achieve our goals of developing technological expertise and new products and systems that give us acompetitive advantage; increasing market penetration and growth of our installed base; and providingcomprehensive support and service to our customers. As part of our strategy to protect our technology wecurrently hold a number of United States and foreign patents and pending patent applications. However, otherparties may challenge or attempt to invalidate or circumvent any patents the United States or foreigngovernments issue to us or these governments may fail to issue patents for pending applications. Additionally,even when patents are issued, the legal systems in certain of the countries in which we do business do not enforcepatents and other intellectual property rights as rigorously as the United States. The rights granted or anticipatedunder any of our patents or pending patent applications may be narrower than we expect or, in fact, provide nocompetitive advantages. Any of these circumstances could have a material adverse impact on our business.
Item 1B. Unresolved Staff Comments
None.
Item 2. Properties
Our executive offices and principal operating and R&D facilities are located in Fremont, California,Livermore, California, San Jose, California, Tualatin, Oregon, and Villach, Austria. The Fremont and Livermorefacilities are held under operating leases expiring in 2015 and the San Jose and Tualatin facilities are owned bythe Company. Our Fremont and Livermore operating leases generally include options to renew or purchase thefacilities. In addition, we lease or own properties for our service, technical support and sales personnelthroughout the United States, Europe, Taiwan, Korea, Japan, and Asia Pacific and lease or own manufacturingfacilities located in Eaton, Ohio, Rendsburg, Germany, Chandler, Arizona, and Des Plaines, Illinois. Ourfacilities lease obligations are subject to periodic increases. We believe that our existing facilities are well-maintained and in good operating condition.
Item 3. Legal Proceedings
The Company is either a defendant or plaintiff in various actions that have arisen from time to time in thenormal course of business, including intellectual property claims. The Company accrues for a liability when it isboth probable that a liability has been incurred and the amount of the loss can be reasonably estimated.Significant judgment is required in both the determination of probability and the determination as to whether aloss is reasonably estimable. These accruals are reviewed at least quarterly and adjusted to reflect the effects ofnegotiations, settlements, rulings, advice of legal counsel, and other information and events pertaining to aparticular matter. To the extent there is a reasonable possibility that the losses could exceed the amounts alreadyaccrued, the Company believes that the amount of any such additional loss would be immaterial to theCompany’s business, financial condition, and results of operations.
Item 4. Mine Safety Disclosures
Not applicable
27

PART II
Item 5. Market for the Registrant’s Common Equity, Related Stockholder Matters and Issuer Purchasesof Equity Securities
Stock Information
Our Common Stock is traded on the Nasdaq Global Select Market under the symbol LRCX. As ofAugust 14, 2012 we had 458 stockholders of record. In fiscal years 2012 and 2011 we did not declare or pay cashdividends to our stockholders. We currently have no plans to declare or pay cash dividends. The table below setsforth the high and low prices of our common stock as reported by The NASDAQ Stock Market, Inc. for theperiod indicated:
2012
High Low
First Quarter . . . . . . . . . . . . . . . . . . . . . . . . . . . . . . . . . . . . . . . $46.27 $34.92Second Quarter . . . . . . . . . . . . . . . . . . . . . . . . . . . . . . . . . . . . . $45.48 $34.81Third Quarter . . . . . . . . . . . . . . . . . . . . . . . . . . . . . . . . . . . . . . . $45.04 $36.15Fourth Quarter . . . . . . . . . . . . . . . . . . . . . . . . . . . . . . . . . . . . . . $45.29 $35.84
2011
High Low
First Quarter . . . . . . . . . . . . . . . . . . . . . . . . . . . . . . . . . . . . . . . $43.76 $35.39Second Quarter . . . . . . . . . . . . . . . . . . . . . . . . . . . . . . . . . . . . . $52.91 $36.77Third Quarter . . . . . . . . . . . . . . . . . . . . . . . . . . . . . . . . . . . . . . . $59.10 $46.27Fourth Quarter . . . . . . . . . . . . . . . . . . . . . . . . . . . . . . . . . . . . . . $57.41 $41.77
Repurchase of Company Shares
On September 10, 2010, the Board of Directors authorized the repurchase of up to $250 million of ourcommon stock and on September 1, 2011 the Board of Directors authorized the repurchase of up to an additional$500 million of our common stock. On December 14, 2011, the Board of Directors authorized the repurchase ofup to $1.6 billion of our common stock in conjunction with the acquisition of Novellus, which replaces theprevious repurchase authorizations. These repurchases can be conducted on the open market or as privatepurchases and may include the use of derivative contracts with large financial institutions, in all cases subject tocompliance with applicable law. Repurchases will be funded using our available cash. This repurchase programhas no termination date and may be suspended or discontinued at any time.
As part of our share repurchase program, we may from time-to-time enter into structured share repurchasearrangements with financial institutions using general corporate funds. During fiscal year 2012 sucharrangements included the following.
Cash Enhanced Share Repurchases
Under cash enhanced share repurchases, we are required to make an up-front cash payment in exchange forthe right to receive shares of our common stock or cash at the expiration of the agreement, dependent upon theclosing price of our common stock at the settlement date. During the year ended June 24, 2012, one sucharrangement resulted in the receipt of 2.6 million shares upon settlement at an aggregate price of $100.0 millionand two such arrangements were settled in cash for an aggregate of $130.2 million. All cash enhanced sharerepurchase agreements during fiscal year 2012 were executed prior to the December 2011 $1.6 billion buybackauthorization. As of June 24, 2012 there are no outstanding prepayments under such arrangements. Under thesearrangements, any prepayments or cash payments at settlement are recorded as a component of Additional paidin capital in our Consolidated Balance Sheet.
28

Collared Accelerated Share Repurchases
During the year ended June 24, 2012, we entered into two share repurchase transactions under one masterrepurchase arrangement. Under these collared accelerated share repurchase transactions (“ASRs”), we madeup-front cash payments of $375 million and $200 million, respectively, three days after the respective trade datein exchange for an initial delivery of 6.6 million and 3.9 million shares of our common stock, respectively. Thenumber of shares to ultimately be repurchased by us is based generally on the volume-weighted average price(“VWAP”) of our common stock during the term of the ASR minus a pre-determined, fixed discount set atinception of the ASR, subject to collar provisions that provide a minimum and maximum number of shares thatwe could repurchase under the agreements.
The minimum and maximum thresholds for each transaction are established based on the average of theVWAP prices for our common stock during an initial hedge period. We received incremental shares on top of theinitial shares delivered such that the total number of shares received under the ASRs after the initial hedge periodequaled 8.8 million and 4.8 million shares, representing the minimum number of shares to be delivered under theterms of the ASRs, respectively. The ASRs were scheduled to end on or before September 18, 2012 andOctober 9, 2012, respectively. However, each ASR is subject to acceleration at the option of the counterparty atany time after June 27, 2012 and July 19, 2012, respectively. At the conclusion of the ASRs, we may receiveadditional shares based on the VWAP of our common stock during the term of the agreement minus thepre-determined fixed discount, such that the total number of shares received under the ASRs does not exceed themaximum of 10.8 and 6.6 million shares, respectively.
We accounted for each ASR as two separate transactions: (a) as shares of common stock acquired in atreasury stock transaction recorded on the acquisition date and (b) as a forward contract indexed to our owncommon stock and classified in stockholders’ equity. As such, we accounted for the shares that we receivedunder the ASRs as a repurchase of our common stock for the purpose of calculating earnings per common share.We have determined that the forward contracts indexed to our common stock met all of the applicable criteria forequity classification in accordance with the Derivatives and Hedging topic of the FASB ASC, and, therefore, theASRs were not accounted for as derivative instruments. As of June 24, 2012, the aggregate repurchase price of$575.0 million is reflected as Treasury stock, at cost, in our condensed consolidated balance sheet.
The counterparty designated July 6, 2012 as the accelerated termination date, at which time we settled the$375 million ASR and received an additional 1.3 million shares of common stock in addition to the minimumshares already received, which represented a weighted average share price of approximately $36.80 for thetransaction period. The counterparty designated July 25, 2012 as the accelerated termination date, at which timewe settled the $200 million ASR and received an additional 0.7 million shares of common stock in addition to theminimum shares already received, which represented a weighted average share price of approximately $36.12 forthe transaction period.
29

Share repurchases, including those under the repurchase program, were as follows:
Period
Total Number ofShares
Repurchased (1)Average Price
Paid Per Share*
Total Number of SharesPurchased as Part ofPublicly AnnouncedPlans or Programs
Amount AvailableUnder
RepurchaseProgram
(in thousands, except per share data)
Available balance as of June 26, 2011 . . . . . — $ — — $ 249,244Authorization of additional $500 million -
September 2011 . . . . . . . . . . . . . . . . . . . . — $ — — $ 749,244Quarter ended September 25, 2011 . . . . . . . 2,063 $37.83 1,977 $ 674,957Quarter ended December 25, 2011 . . . . . . . . 2,955 $38.79 2,860 $ 564,320Authorization of replacement $1.6 billion
plan - December 2011 . . . . . . . . . . . . . . . — $ — — $1,600,000Quarter ended March 25, 2012 . . . . . . . . . . . 452 $41.86 300 $1,587,487March 26, 2012 - April 25, 2012 . . . . . . . . . 82 $44.49 — $1,587,487April 26, 2012 - May 25, 2012 . . . . . . . . . . . 6,754 $38.37 6,745 $1,301,967May 26, 2012 - June 24, 2012 . . . . . . . . . . . 9,640 $37.51 9,578 $ 911,933
Total . . . . . . . . . . . . . . . . . . . . . . . . . . . 21,946 21,460
* Average price excludes accelerated share repurchases that had not settled as of June 24, 2012 as the final priceper share for these repurchases was not known until each transactions’ settlement date in fiscal 2013.
(1) In addition to shares repurchased under Board authorized repurchase programs, included in this column are486,000 shares acquired at a total cost of $20.5 million which the Company withheld through net sharesettlements to cover tax withholding obligations upon the vesting of restricted stock unit awards grantedunder the Company’s equity compensation plans. The shares retained by the Company through these netshare settlements are not a part of the Board-authorized repurchase program but instead are authorized underthe Company’s equity compensation plans.
30

Cumulative 5-year Return
The graph below compares Lam Research Corporation’s cumulative 5-year total shareholder return oncommon stock with the cumulative total returns of the NASDAQ Composite index and the Research Data Group,Incorporated (“RDG”) Semiconductor Composite index. The graph tracks the performance of a $100 investmentin our common stock and in each of the indices (with the reinvestment of all dividends) from June 30, 2007 toJune 30, 2012.
COMPARISON OF 5 YEAR CUMULATIVE TOTAL RETURN*Among Lam Research Corporation, the S&P 500 Index, the NASDAQ Composite Index,
and the RDG Semiconductor Composite Index
$0
$20
$40
$60
$80
$100
$120
$140
6/07 6/08 6/09 6/10 6/11 6/12
*$100 invested on 6/30/07 in stock or index, including reinvestment of dividends.Fiscal year ending June 30.
Copyright© 2012 S&P, a division of The McGraw-Hill Companies Inc. All rights reserved.
Lam Research Corporation (LRCX)
NASDAQ Composite
S&P 500
RDG Semiconductor Composite
6/07 6/08 6/09 6/10 6/11 6/12
Lam Research Corporation (LRCX) . . . . . . . . . . . . . . . . . . 100.00 70.33 50.58 74.05 86.15 73.42S&P 500 . . . . . . . . . . . . . . . . . . . . . . . . . . . . . . . . . . . . . . . . . 100.00 86.88 64.10 73.35 95.87 101.09NASDAQ Composite . . . . . . . . . . . . . . . . . . . . . . . . . . . . . . . 100.00 84.54 73.03 82.88 110.33 115.30RDG Semiconductor Composite . . . . . . . . . . . . . . . . . . . . . 100.00 82.09 61.89 76.16 94.82 92.46
31

Item 6. Selected Financial Data (derived from audited financial statements)
Year Ended
June 24,2012 (1)(2)
June 26,2011 (1)
June 27,2010 (1)
June 28,2009 (1)
June 29,2008 (1)
(in thousands, except per share data)
OPERATIONS:Revenue . . . . . . . . . . . . . . . . . . . . . . . . . . . . . $2,665,192 $3,237,693 $2,133,776 $1,115,946 $2,474,911Gross margin . . . . . . . . . . . . . . . . . . . . . . . . . 1,084,069 1,497,232 969,935 388,734 1,173,406Goodwill impairment (3) . . . . . . . . . . . . . . . . — — — 96,255 —Restructuring charges and asset
impairments, net (4) . . . . . . . . . . . . . . . . . 1,725 11,579 21,314 44,513 6,366409A expense (5) . . . . . . . . . . . . . . . . . . . . . — — (38,590) 3,232 44,494Legal judgment . . . . . . . . . . . . . . . . . . . . . . . — — — 4,647 —In-process research and development . . . . . . — — — — 2,074Operating income (loss) . . . . . . . . . . . . . . . . 237,733 804,285 425,410 (281,243) 509,431Net income (loss) . . . . . . . . . . . . . . . . . . . . . 168,723 723,748 346,669 (302,148) 439,349Net income (loss) per share:
Basic . . . . . . . . . . . . . . . . . . . . . . . . . . . $ 1.36 $ 5.86 $ 2.73 $ (2.41) $ 3.52Diluted . . . . . . . . . . . . . . . . . . . . . . . . . . $ 1.35 $ 5.79 $ 2.71 $ (2.41) $ 3.47
BALANCE SHEET:Working capital . . . . . . . . . . . . . . . . . . . . . . . $2,988,181 $2,592,506 $1,198,004 $ 855,064 $1,280,028Total assets . . . . . . . . . . . . . . . . . . . . . . . . . . 8,004,652 4,053,867 2,487,392 1,993,184 2,806,755Long-term obligations, less current
portion . . . . . . . . . . . . . . . . . . . . . . . . . . . . 1,255,600 903,263 160,600 158,019 385,132
(1) Fiscal year 2012, 2011, 2010, 2009 and 2008 amounts include the operating results of SEZ from theacquisition date of March 11, 2008. The acquisition was accounted for as a business combination inaccordance with the applicable accounting guidance.
(2) Fiscal year 2012 amounts include the operating results of Novellus from the acquisition date of June 4,2012. The acquisition was accounted for as a business combination in accordance with the applicableaccounting guidance.
(3) During fiscal year 2009, a combination of factors, including the economic environment, a sustained declinein our market valuation and a decline in our operating results indicated possible impairment of our goodwill.We conducted an analysis and concluded that the fair value of our Clean Product Group had been reducedbelow its carrying value. As a result, we recorded a non-cash goodwill impairment charge of approximately$96.3 million during fiscal year 2009.
(4) Restructuring charges and asset impairments, net exclude restructuring charges (releases) included in cost ofgoods sold and reflected in gross margin of ($1.0) million, $3.4 million, $21.0 million, and $12.6 million forfiscal years 2012, 2010, 2009, and 2008, respectively. Restructuring and asset impairment amounts includedin cost of goods sold and reflected in gross margin during fiscal year 2012 related to a recorded obligationnot realized for a previously restructured product line. Restructuring and asset impairment amounts includedin cost of goods sold and reflected in gross margin during fiscal year 2010 primarily related to assetimpairments for production efficiencies and shifts in product demands partially offset by the recovery ofexpenses related to previously impaired inventory. Restructuring amounts included in cost of goods sold andreflected in gross margin during fiscal year 2009 primarily relate to the Company’s alignment of its coststructure with the outlook for the current economic environment and future business opportunities.Restructuring amounts included in cost of goods sold and reflected in gross margin during fiscal year 2008primarily related to the integration of SEZ.
(5) 409A expense excludes a credit included in cost of goods sold and reflected in gross margin of $5.8 millionin fiscal year 2010 related to a reversal of accrued liabilities due to final settlement of matters associatedwith our Internal Revenue Code Section 409A (“409A”) expenses from the 2007 voluntary independentstock option review. 409A expense excludes an expense included in cost of goods sold and reflected in
32

gross margin of $6.4 million during fiscal year 2008. Following a voluntary independent review of itshistorical stock option granting process, the Company considered whether Section 409A of the InternalRevenue Code of 1986, as amended (“IRC”), and similar provisions of state law, applied to certain stockoption grants as to which, under the applicable accounting guidance, intrinsic value was deemed to exist atthe time of the options’ measurement dates. If, under applicable tax principles, an employee stock option isnot considered as granted with an exercise price equal to the fair market value of the underlying stock on thegrant date, then the optionee may be subject to federal and state penalty taxes under Section 409A(collectively, “Section 409A liabilities”). On March 30, 2008, the Board of Directors authorized theCompany (i) to assume potential Section 409A Liabilities, inclusive of applicable penalties and interest, ofcurrent and past employees arising from the exercise in 2006 or 2007 of Company stock options that vestedafter 2004, and (ii) if necessary, to compensate such employees for additional tax liability associated withthat assumption.
Three Months Ended (1)
June 24,2012
March 25,2012
December 25,2011
September 25,2011
(in thousands, except per share data)
QUARTERLY FISCAL YEAR 2012:Revenue . . . . . . . . . . . . . . . . . . . . . . . . . . . . . . . . . . . . . . . . . . $741,814 $658,961 $583,981 $680,436Gross margin . . . . . . . . . . . . . . . . . . . . . . . . . . . . . . . . . . . . . . 298,213 267,147 234,826 283,883Restructuring and asset impairments - operating expenses . . — — — 1,725Operating income . . . . . . . . . . . . . . . . . . . . . . . . . . . . . . . . . . 32,670 58,118 47,546 99,399Net income . . . . . . . . . . . . . . . . . . . . . . . . . . . . . . . . . . . . . . . 18,069 45,604 33,212 71,838Net income per share
Basic . . . . . . . . . . . . . . . . . . . . . . . . . . . . . . . . . . . . . . . . $ 0.13 $ 0.38 $ 0.28 $ 0.58Diluted . . . . . . . . . . . . . . . . . . . . . . . . . . . . . . . . . . . . . . . $ 0.13 $ 0.38 $ 0.27 $ 0.58
Number of shares used in per share calculations:Basic . . . . . . . . . . . . . . . . . . . . . . . . . . . . . . . . . . . . . . . . 133,997 119,841 119,739 123,130Diluted . . . . . . . . . . . . . . . . . . . . . . . . . . . . . . . . . . . . . . . 135,842 120,956 120,873 124,049
Three Months Ended (1)
June 26,2011
March 27,2011
December 26,2010
September 26,2010
(in thousands, except per share data)
QUARTERLY FISCAL YEAR 2011:Revenue . . . . . . . . . . . . . . . . . . . . . . . . . . . . . . . . . . . . . . . . . . $752,018 $809,087 $870,714 $805,874Gross margin . . . . . . . . . . . . . . . . . . . . . . . . . . . . . . . . . . . . . . 338,454 374,019 407,433 377,326Restructuring and asset impairments - operating expenses . . 16,742 — — (5,163)Operating income . . . . . . . . . . . . . . . . . . . . . . . . . . . . . . . . . . 142,191 196,996 241,104 223,994Net income . . . . . . . . . . . . . . . . . . . . . . . . . . . . . . . . . . . . . . . 125,928 182,240 221,856 193,724Net income per share
Basic . . . . . . . . . . . . . . . . . . . . . . . . . . . . . . . . . . . . . . . . $ 1.02 $ 1.47 $ 1.80 $ 1.57Diluted . . . . . . . . . . . . . . . . . . . . . . . . . . . . . . . . . . . . . . . $ 1.01 $ 1.45 $ 1.78 $ 1.55
Number of shares used in per share calculations:Basic . . . . . . . . . . . . . . . . . . . . . . . . . . . . . . . . . . . . . . . . 123,863 123,674 123,101 123,665Diluted . . . . . . . . . . . . . . . . . . . . . . . . . . . . . . . . . . . . . . . 125,086 125,293 124,786 125,202
(1) Our reporting period is a 52/53-week fiscal year. The fiscal years ended June 24, 2012 and June 26, 2011both included 52 weeks. All quarters presented above included 13 weeks.
33

Item 7. Management’s Discussion and Analysis of Financial Condition and Results of Operations
The following discussion of our financial condition and results of operations contains forward-lookingstatements, which are subject to risks, uncertainties and changes in condition, significance, value and effect.Our actual results could differ materially from those anticipated in the forward-looking statements as a resultof certain factors, including but not limited to those discussed in “Risk Factors” and elsewhere in this 2012Form 10-K and other documents we file from time to time with the Securities and Exchange Commission. (See“Cautionary Statement Regarding Forward-Looking Statements” in Part I of this 2012 Form 10-K).
Management’s Discussion and Analysis of Financial Condition and Results of Operations (“MD&A”)provides a description of our results of operations and should be read in conjunction with our ConsolidatedFinancial Statements and accompanying Notes to Consolidated Financial Statements included in this 2012 Form10-K. MD&A consists of the following sections:
Executive Summary provides a summary of the key highlights of our results of operations and ourmanagement’s assessment of material trends and uncertainties relevant to our business.
Results of Operations provides an analysis of operating results.
Critical Accounting Policies and Estimates discusses accounting policies that reflect the more significantjudgments and estimates used in the preparation of our consolidated financial statements.
Liquidity and Capital Resources provides an analysis of cash flows, contractual obligations and financialposition.
Executive Summary
We design, manufacture, market, refurbish, and service semiconductor processing equipment used in thefabrication of integrated circuits and are recognized as a major provider of such equipment to the worldwidesemiconductor industry. Our customers include semiconductor manufacturers that make DRAM, flash memory,microprocessors, and other logic integrated circuits for a wide range of consumer and industrial electronics.Semiconductor wafers are subjected to a complex series of process and preparation steps that result in thesimultaneous creation of many individual integrated circuits. We leverage our expertise in semiconductorprocessing to develop technology and productivity solutions that typically benefit our customers through lowerdefect rates, enhanced yields, faster processing time, and reduced cost as well as by facilitating their ability tomeet more stringent performance and design standards.
The semiconductor capital equipment industry is cyclical in nature and has historically experienced periodicand pronounced changes in customer demand resulting in industry downturns and upturns. Today’s leadingindicators of change in customer investment patterns, such as electronics demand, memory pricing, and foundryutilization rates, may not be any more reliable than in prior years. Demand for our equipment can varysignificantly from period to period as a result of various factors, including, but not limited to, economicconditions (both general and in the semiconductor and electronics industries), supply, demand, prices forsemiconductors, customer capacity requirements, and our ability to develop, acquire, and market competitiveproducts. For these and other reasons, our results of operations during any particular fiscal period are notnecessarily indicative of future operating results.
Demand for our products declined in fiscal year 2012 as semiconductor device manufacturers slowed thepace of their capacity expansions in response to weaker macroeconomic conditions impacting demand for certainsemiconductor devices. In spite of the slowing pace of capacity expansion, particularly in the memory segment,our customers continued to invest in leading edge technologies over this period. We believe that, over the longterm, demand for our products will increase as customers’ capital expenditures rise to meet growing demand forsemiconductor devices, particularly in mobile markets, and address the increasing complexity of semiconductormanufacturing.
34

The following summarizes certain key annual financial information for the periods indicated below:
Year Ended
June 24,2012
June 26,2011
June 27,2010 FY12 vs. FY11 FY11 vs. FY10
(in thousands, except per share data and percentages)
Revenue . . . . . . . . . . . . . . . . . $2,665,192 $3,237,693 $2,133,776 $(572,501) -17.7% $1,103,917 51.7%Gross margin . . . . . . . . . . . . . 1,084,069 1,497,232 969,935 $(413,163) -27.6% $ 527,297 54.4%Gross margin as a percent of
total revenue . . . . . . . . . . . 40.7% 46.2% 45.5% -5.5% 0.7%Total operating expenses . . . . 846,336 692,947 544,525 $ 153,389 22.1% $ 148,422 27.3%Net income . . . . . . . . . . . . . . . 168,723 723,748 346,669 $(555,025) -76.7% $ 377,079 108.8%Diluted net income per
share . . . . . . . . . . . . . . . . . . $ 1.35 $ 5.79 $ 2.71 $ (4.44) -76.7% $ 3.08 113.7%
On June 4, 2012 we completed our acquisition of Novellus Systems, Inc (“Novellus”). Results for fiscalyear 2012 include Novellus operations from the acquisition date through June 24, 2012. Lam’s primary reasonsfor this acquisition were to complement existing product offerings and to provide opportunities for revenue andcost synergies.
Fiscal year 2012 revenues decreased 18% compared to fiscal year 2011, primarily reflecting the decrease incustomer capacity investments as noted above. The decrease in gross margin as a percentage of revenue for thefiscal year 2012 compared to fiscal year 2011 was due primarily to decreased factory and field utilization as aresult of lower volume, and less favorable customer and product mix. Operating expenses in fiscal year 2012increased as compared to fiscal year 2011 primarily related to continued investments in next-generation researchand development and the customer facing activities that surround and support it and costs associated with theNovellus acquisition and integration.
Our cash and cash equivalents, short-term investments, and restricted cash and investments balances totaledapproximately $3.0 billion as of June 24, 2012 compared to $2.3 billion as of June 26, 2011. This increaseincluded the impact of $1.1 billion acquired in connection with the Novellus acquisition, offset by $773 millionof share repurchases. We generated approximately $499 million in net cash provided by operating activitiesduring fiscal year 2012, compared to net cash provided by operating activities of $881 million in fiscal year2011. The decreased operating cash flows in fiscal year 2012 versus fiscal year 2011 were primarily a result oflower revenue, increased investments in research and development, and costs related to the Novellus acquisition.
Results of Operations
Shipments and Backlog
Year Ended
June 24,2012
June 26,2011
June 27,2010
Shipments (in millions) $2,672 $3,306 $2,304
Korea . . . . . . . . . . . . . . . . . . . . . . . . . . . . . . . . . . . . . . . . . . . . 36% 21% 27%Taiwan . . . . . . . . . . . . . . . . . . . . . . . . . . . . . . . . . . . . . . . . . . . 18% 23% 32%North America . . . . . . . . . . . . . . . . . . . . . . . . . . . . . . . . . . . . . 17% 13% 8%Asia Pacific . . . . . . . . . . . . . . . . . . . . . . . . . . . . . . . . . . . . . . . 11% 17% 11%Japan . . . . . . . . . . . . . . . . . . . . . . . . . . . . . . . . . . . . . . . . . . . . 10% 13% 15%Europe . . . . . . . . . . . . . . . . . . . . . . . . . . . . . . . . . . . . . . . . . . . 8% 13% 7%
Shipments for fiscal year 2012 were approximately $2.7 billion and decreased by 19% compared to fiscalyear 2011. Shipments for fiscal year 2011 were approximately $3.3 billion and increased by 43% compared to
35

fiscal year 2010. The decrease in shipments during fiscal year 2012 as compared to fiscal year 2011 related tochange in demand for semiconductor equipment, especially in the first half of fiscal year 2012. The increase inshipments from fiscal year 2010 to 2011 reflects improvements in the industry and economic environments.
During fiscal year 2012, applications at or below the 45 nanometer technology node were 93% of totalsystems shipments. During fiscal year 2011, applications at or below the 65 nanometer technology node were90% of total systems shipments. During fiscal year 2012 the memory market segment, foundry segment, andlogic/integrated device manufacturing segment were approximately 45%, 46% and 9% of system shipments,respectively. During fiscal year 2011 the memory market segment, foundry segment, and logic/integrated devicemanufacturing segment were approximately 49%, 32% and 19% of system shipments, respectively. Starting withthe December 2011 quarter we have modified the foundry category to include manufacturers that have a majorityof their logic capacity available for the foundry business. These shipments were previously reported in the logic/integrated device manufacturing category.
Unshipped orders in backlog as of June 24, 2012 were approximately $870 million and increased fromapproximately $641 million as of June 26, 2011. Our unshipped orders backlog includes orders for systems,spares, and services. Please refer to “Backlog” in Part I Item 1, “Business” of this report for a description of ourpolicies for adding to and adjusting backlog.
Revenue
Year Ended
June 24,2012
June 26,2011
June 27,2010
Revenue (in millions) . . . . . . . . . . . . . . . . . . . . . . . . . . . . . . . $2,665 $3,238 $2,134
Korea . . . . . . . . . . . . . . . . . . . . . . . . . . . . . . . . . . . . . . . . . . . . 33% 23% 25%Taiwan . . . . . . . . . . . . . . . . . . . . . . . . . . . . . . . . . . . . . . . . . . . 18% 24% 33%North America . . . . . . . . . . . . . . . . . . . . . . . . . . . . . . . . . . . . . 17% 12% 9%Japan . . . . . . . . . . . . . . . . . . . . . . . . . . . . . . . . . . . . . . . . . . . . 12% 13% 15%Asia Pacific . . . . . . . . . . . . . . . . . . . . . . . . . . . . . . . . . . . . . . . 11% 15% 12%Europe . . . . . . . . . . . . . . . . . . . . . . . . . . . . . . . . . . . . . . . . . . . 9% 13% 6%
The revenue decrease in fiscal year 2012 as compared to fiscal year 2011 was due to the decrease incustomer capacity investments. The revenue increase during fiscal year 2011 compared to 2010 reflectedimprovements in the industry and economic environments. Our revenue levels are generally correlated to theamount of shipments and our installation and acceptance timelines. The overall Asia region continues to accountfor a majority of our revenues as a substantial amount of the worldwide capacity additions for semiconductormanufacturing continues to occur in this region. Our deferred revenue balance increased to $335.4 million as ofJune 24, 2012 compared to $257.6 million as of June 26, 2011, due to the addition of Novellus-related activityand increased customer shipment levels in the second half of fiscal year 2012. Our deferred revenue balance doesnot include shipments to Japanese customers, to whom title does not transfer until customer acceptance.Shipments to Japanese customers are classified as inventory at cost until the time of customer acceptance. Theanticipated future revenue value from shipments to Japanese customers was approximately $23 million as ofJune 24, 2012 compared to $70 million as of June 26, 2011.
Gross Margin
Year Ended
June 24,2012
June 26,2011
June 27,2010 FY12 vs. FY11 FY11 vs. FY10
(in thousands, except percentages)
Gross margin . . . . . . . . . . . . . . . . . $1,084,069 $1,497,232 $969,935 $(413,163) -27.6% $527,297 54.4%Percent of total revenue . . . . . . . . . 40.7% 46.2% 45.5% -5.5% 0.7%
36

The decrease in gross margin as a percentage of revenue for fiscal year 2012 compared to fiscal year 2011was due primarily to decreased factory and field utilization as a result of lower volume, and less favorablecustomer and product mix.
The increase in gross margin as a percentage of revenue for fiscal year 2011 compared to fiscal year 2010was due primarily to increased factory and field utilization as a result of higher volume.
Research and Development
Year Ended
June 24,2012
June 26,2011
June 27,2010 FY12 vs. FY11 FY11 vs. FY10
(in thousands, except percentages)
Research & development (“R&D”) . . . . . . $444,559 $373,293 $320,859 $71,266 19.1% $52,434 16.3%Percent of total revenue . . . . . . . . . . . . . . . 16.7% 11.5% 15.0% 5.2% -3.5%
We continued to make significant R&D investments focused on leading-edge plasma etch, single-waferclean and other semiconductor manufacturing requirements. The increase in R&D spending during fiscal year2012 compared to fiscal year 2011 was due primarily to an $18 million increase in salary and benefits as a resultof higher headcount, a $21 million increase in supplies, and an $11 million increase in depreciation related tonew product development. Also included in our results are $11 million of Novellus-related R&D expenses thatwere incurred in the June 2012 quarter from acquisition date through June 24, 2012.
The increase in R&D spending during fiscal year 2011 compared to fiscal year 2010 was due primarily to a$27 million increase in employee compensation and benefits, mainly as a result of higher headcount and strongercompany profitability, and a $19 million increase in outside services and supplies related to new productdevelopment.
Approximately 30% of both fiscal years 2012 and 2011 systems revenues were derived from productsintroduced over the previous two years, which is reflective of our continued investment in new products andtechnologies.
Selling, General and Administrative
Year Ended
June 24,2012
June 26,2011
June 27,2010 FY12 vs. FY11 FY11 vs. FY10
(in thousands, except percentages)
Selling, general & administrative(“SG&A”) . . . . . . . . . . . . . . . . . . . . . . . . $400,052 $308,075 $240,942 $91,977 29.9% $67,133 27.9%
Percent of total revenue . . . . . . . . . . . . . . . 15.0% 9.5% 11.3% 5.5% -1.8%
The increase in SG&A expense during fiscal year 2012 compared to fiscal year 2011 was due primarily to$63 million in expenses related to the Novellus acquisition and integration and $13 million of Novellus relatedSG&A expenses, including $4 million of intangible asset amortization, incurred in the June 2012 quarter fromacquisition date through June 24, 2012.
The growth in SG&A expense during fiscal year 2011 compared to fiscal year 2010 was due primarily to a$44 million increase in employee compensation and benefits, mainly as a result of higher headcount and strongercompany profitability, and an $18 million increase in outside services and supplies for customer penetrationactivities. Rent and depreciation-related expenses increased in fiscal year 2011 from fiscal year 2010 byapproximately $13 million. The increases in SG&A expenses during fiscal year 2011 were offset by the releaseof approximately $4 million of previously reserved allowance for doubtful accounts as the result of cashcollections from customers.
37

Restructuring and Asset Impairments
During fiscal year 2012 we incurred restructuring and asset impairment charges of $0.9 million, consistingof a $1.7 million expense related to a decline in the market value of certain facilities partially offset by therelease of $0.8 million related to a recorded obligation not realized for a previously restructured product line.During fiscal year 2011 we incurred restructuring and asset impairment charges of $11.6 million consistingprimarily of certain facilities charges related to the reassessment of future obligations for previously restructuredleases. During fiscal year 2010 we incurred restructuring and asset impairment charges of $24.8 million,consisting primarily of $19.8 million of facilities charges related to the reassessment of future obligations forcertain previously restructured leases and $6.0 million of asset impairment charges related to productionefficiencies and shifts in product demands, partially offset by a recovery of $2.2 million related to inventorypreviously restructured in connection with our initial product line integration road maps.
For further details related to restructuring and asset impairment, see Note 19 of the Notes to ConsolidatedFinancial Statements.
409A Expense
In fiscal year 2008, following the voluntary independent review of our historical option grant process, weconsidered whether Section 409A of the Internal Revenue Code and similar provisions of state law would applyto stock options that were found to have intrinsic value at the time of their respective measurement dates. If astock option is not considered as issued with an exercise price of at least the fair market value of the underlyingstock, it may be subject to penalty taxes under Section 409A and similar provisions of state law. In such a case,taxes may be assessed not only on the intrinsic value increase, but on the entire stock option gain as measured atvarious times. On March 30, 2008, our Board of Directors authorized us to assume potential tax liabilities ofcertain employees, relating to options that might be subject to Section 409A and similar provisions of state law.Those liabilities totaled $50.9 million for fiscal year 2008 and an incremental $3.2 million of expense duringfiscal year 2009. During fiscal year 2010, we reached final settlement of matters associated with our 409Aexpenses with the Internal Revenue Service (“IRS”) and California Franchise Tax Board (“FTB”) resulting in acredit of $44.4 million due to the reversal of 409A liabilities. There were no expenses or reversals related toSection 409A during fiscal year 2011 or 2012.
Other Income (Expense), Net
Other income (expense), net, consisted of the following:
Year Ended
June 24,2012
June 26,2011
June 27,2010
(in thousands)
Interest income . . . . . . . . . . . . . . . . . . . . . . . . . . . . . . . . . $ 12,141 $ 9,890 $ 8,682Interest expense . . . . . . . . . . . . . . . . . . . . . . . . . . . . . . . . (38,962) (5,380) (994)Gains (losses) on deferred compensation plan related
assets . . . . . . . . . . . . . . . . . . . . . . . . . . . . . . . . . . . . . . . (914) 5,682 (84)Foreign exchange gain (loss) . . . . . . . . . . . . . . . . . . . . . . (397) (11,085) (103)Other, net . . . . . . . . . . . . . . . . . . . . . . . . . . . . . . . . . . . . . (5,183) (2,516) (2,770)
$(33,315) $ (3,409) $ 4,731
The increase in interest income during fiscal year 2012 as compared with fiscal year 2011 and during fiscalyear 2011 compared with fiscal year 2010 was primarily due to increases in our average cash and investmentbalances from cash provided by operations and proceeds from convertible note financing, which was partiallyoffset by treasury stock transactions and the decrease in interest rate yields.
38
The increase in interest expense during fiscal year 2012 as compared with fiscal year 2011 and during fiscalyear 2011 as compared with fiscal year 2010 was primarily due to the issuance of the $900 million convertiblenotes during May 2011.
Foreign exchange losses in fiscal year 2012 were related to un-hedged portions of the balance sheetexposures. Foreign exchange losses in fiscal year 2011 were related to un-hedged portions of the balance sheetexposures, primarily in the Euro, Korean Won, and Singapore dollar.
Other expenses during fiscal year 2012 increased as compared to fiscal year 2011 primarily due to increasedcharitable contributions.
Income Tax Expense
Our annual income tax expense was $35.7 million, $77.1 million, and $83.5 million in fiscal years 2012,2011, and 2010, respectively. Our effective tax rate for fiscal years 2012, 2011, and 2010 was 17.5%, 9.6%, and19.4%, respectively. The increase in the effective tax rate in fiscal year 2012 as compared to fiscal year 2011 wasprimarily due to the level of income, the change in geographical mix of income between higher and lower taxjurisdictions, decrease in federal R&D tax credit due to the expiration of the credit on December 31, 2011,increase in non-deductible stock based compensation, and non-deductible acquisition costs. The decrease in theeffective tax rate in fiscal year 2011 as compared to fiscal year 2010 was primarily due to the change ingeographical mix of income between higher and lower tax jurisdictions, tax benefits related to the recognition ofpreviously unrecognized tax benefits due to the settlement of audits, and tax benefit due to the extension of thesecond half of fiscal year 2010 federal R&D tax credit.
Deferred Income Taxes
Deferred income taxes reflect the net tax effect of temporary differences between the carrying amounts ofassets and liabilities for financial reporting purposes and the amounts used for income tax purposes, as well asthe tax effect of carryforwards. Our gross deferred tax assets, composed primarily of reserves and accruals thatare not currently deductible and tax credit carryforwards, were $253.7 million and $160.6 million at the end offiscal years 2012 and 2011, respectively. These gross deferred tax assets were offset by deferred tax liabilities of$285.6 million and $45.1 million at the end of fiscal years 2012 and 2011, respectively, and a valuationallowance of $55.2 million and $46.2 million at the end of fiscal years 2012 and 2011, respectively. The changein the gross deferred tax assets and deferred tax liabilities between fiscal year 2012 and 2011 is primarily as aresult of our acquisition of Novellus.
We record a valuation allowance to reduce our deferred tax assets to the amount that is more-likely-than-notto be realized. Realization of our net deferred tax assets is dependent on future taxable income. We believe it ismore likely than not that such assets will be realized; however, ultimate realization could be negatively impactedby market conditions and other variables not known or anticipated at this time. In the event that we determinethat we would not be able to realize all or part of our net deferred tax assets, an adjustment would be charged toearnings in the period such determination is made. Likewise, if we later determine that it is more-likely-than-notthat the deferred tax assets would be realized, then the previously provided valuation allowance would bereversed. Our fiscal years 2012 and 2011 valuation allowance of $55.2 million and $46.2 million relate toCalifornia and certain foreign deferred tax assets.
At our fiscal year end of June 24, 2012 we continued to record a valuation allowance to offset the entireCalifornia deferred tax asset balance due to the impact of the cost of performance sales factor sourcing rule andthe single sales factor apportionment election. Additionally, we recorded valuation allowance related to tax assetsestablished in purchase price accounting. We released valuation allowance on certain foreign entities’ deferredtax assets due to an increase in the forecasted income and indefinite net operating loss carryforward period inthose jurisdictions.
39

We evaluate the realizability of the deferred tax assets quarterly and will continue to assess the need forchanges in valuation allowances, if any.
Uncertain Tax Positions
We reevaluate uncertain tax positions on a quarterly basis. This evaluation is based on factors including, butnot limited to, changes in facts or circumstances, changes in tax law, effectively settled issues under audit, andnew audit activity. Such a change in recognition or measurement would result in the recognition of a tax benefitor an additional charge to the tax provision.
Critical Accounting Policies and Estimates
The preparation of financial statements in conformity with U.S. Generally Accepted Accounting Principles(“GAAP”) requires management to make certain judgments, estimates and assumptions that could affect thereported amounts of assets and liabilities at the date of the financial statements and the reported amounts ofrevenue and expenses during the reporting period. We based our estimates and assumptions on historicalexperience and on various other assumptions we believed to be applicable and evaluate them on an ongoing basisto ensure they remain reasonable under current conditions. Actual results could differ significantly from thoseestimates.
The significant accounting policies used in the preparation of our financial statements are described inNote 2 of our Consolidated Financial Statements. Some of these significant accounting policies are considered tobe critical accounting policies. A critical accounting policy is defined as one that has both a material impact onour financial condition and results of operations and requires us to make difficult, complex and/or subjectivejudgments, often regarding estimates about matters that are inherently uncertain.
We believe that the following critical accounting policies reflect the more significant judgments andestimates used in the preparation of our consolidated financial statements.
Revenue Recognition: We recognize all revenue when persuasive evidence of an arrangement exists,delivery has occurred and title has passed or services have been rendered, the selling price is fixed ordeterminable, collection of the receivable is reasonably assured, and we have received customer acceptance,completed our system installation obligations, or are otherwise released from our installation or customeracceptance obligations. If terms of the sale provide for a lapsing customer acceptance period, we recognizerevenue upon the expiration of the lapsing acceptance period or customer acceptance, whichever occurs first. Ifthe practices of a customer do not provide for a written acceptance or the terms of sale do not include a lapsingacceptance provision, we recognize revenue when it can be reliably demonstrated that the delivered system meetsall of the agreed-to customer specifications. In situations with multiple deliverables, we recognize revenue uponthe delivery of the separate elements to the customer and when we receive customer acceptance or are otherwisereleased from our customer acceptance obligations. We allocate revenue from multiple-element arrangementsamong the separate elements based on their relative selling prices, provided the elements have value on a stand-alone basis. Our sales arrangements do not include a general right of return. The maximum revenue we recognizeon a delivered element is limited to the amount that is not contingent upon the delivery of additional items. Wegenerally recognize revenue related to sales of spare parts and system upgrade kits upon shipment. We generallyrecognize revenue related to services upon completion of the services requested by a customer order. Werecognize revenue for extended maintenance service contracts with a fixed payment amount on a straight-linebasis over the term of the contract. When goods or services have been delivered to the customer but allconditions for revenue recognition have not been met, we record deferred revenue and/or deferred costs of salesin deferred profit on our Consolidated Balance Sheet.
Inventory Valuation: Inventories are stated at the lower of cost or market using standard costs that generallyapproximate actual costs on a first-in, first-out basis. We maintain a perpetual inventory system and continuouslyrecord the quantity on-hand and standard cost for each product, including purchased components, subassemblies,
40

and finished goods. We maintain the integrity of perpetual inventory records through periodic physical counts ofquantities on hand. Finished goods are reported as inventories until the point of title transfer to the customer.Generally, title transfer is documented in the terms of sale. Unless specified in the terms of sale, title generallytransfers when we complete physical transfer of the products to the freight carrier. Transfer of title for shipmentsto Japanese customers generally occurs at the time of customer acceptance.
We reassess standard costs as needed but annually at a minimum, and reflect achievable acquisition costs.Acquisition costs are generally based on the most recent vendor contract prices for purchased parts, normalizedassembly and test labor utilization levels, methods of manufacturing, and normalized overhead. Manufacturinglabor and overhead costs are attributed to individual product standard costs at a level planned to absorb spendingat average utilization volumes. We eliminate all intercompany profits related to the sales and purchases ofinventory between our legal entities from our Consolidated Financial Statements.
Management evaluates the need to record adjustments for impairment of inventory at least quarterly. Ourpolicy is to assess the valuation of all inventories including manufacturing raw materials, work-in-process,finished goods, and spare parts in each reporting period. Obsolete inventory or inventory in excess ofmanagement’s estimated usage requirements over the next 12 to 36 months is written down to its estimatedmarket value if less than cost. Estimates of market value include, but are not limited to, management’s forecastsrelated to our future manufacturing schedules, customer demand, technological and/or market obsolescence,general semiconductor market conditions, and possible alternative uses. If future customer demand or marketconditions are less favorable than our projections, additional inventory write-downs may be required and wouldbe reflected in cost of goods sold in the period in which we make the revision.
Warranty: Typically, the sale of semiconductor capital equipment includes providing parts and servicewarranty to customers as part of the overall price of the system. We provide standard warranties for our systems.When appropriate, we record a provision for estimated warranty expenses to cost of sales for each system whenwe recognize revenue. We do not maintain general or unspecified reserves; all warranty reserves are related tospecific systems. The amount recorded is based on an analysis of historical activity that uses factors such as typeof system, customer, geographic region, and any known factors such as tool reliability trends. All actual orestimated parts and labor costs incurred in subsequent periods are charged to those established reserves on asystem-by-system basis.
Actual warranty expenses are accounted for on a system-by-system basis and may differ from our originalestimates. While we periodically monitor the performance and cost of warranty activities, if actual costs incurredare different than our estimates, we may recognize adjustments to provisions in the period in which thosedifferences arise or are identified. In addition to the provision of standard warranties, we offer customer-paidextended warranty services. Revenues for extended maintenance and warranty services with a fixed paymentamount are recognized on a straight-line basis over the term of the contract. Related costs are recorded asincurred.
Equity-based Compensation — Employee Stock Purchase Plan (“ESPP”) and Employee Stock Plans:GAAP requires us to recognize the fair value of equity-based compensation in net income. We determine the fairvalue of our restricted stock units (“RSUs”) based upon the fair market value of Company stock at the date ofgrant. We estimate the fair value of our stock options and ESPP awards using the Black-Scholes option valuationmodel. This model requires us to input highly subjective assumptions, including expected stock price volatilityand the estimated life of each award. We amortize the fair value of equity-based awards over the vesting periodsof the awards, and we have elected to use the straight-line method of amortization.
We make quarterly assessments of the adequacy of our tax credit pool related to equity-based compensationto determine if there are any deficiencies that we are required to recognize in our Consolidated Statements ofOperations. We will only recognize a benefit from stock-based compensation in paid-in-capital if we realize anincremental tax benefit after all other tax attributes currently available to us have been utilized. In addition, wehave elected to account for the indirect benefits of stock-based compensation on the research tax credit through
41

the income statement (continuing operations) rather than through paid-in-capital. We have also elected to netdeferred tax assets and the associated valuation allowance related to net operating loss and tax creditcarryforwards for the accumulated stock award tax benefits for income tax footnote disclosure purposes. We willtrack these stock award attributes separately and will only recognize these attributes through paid-in-capital.
Income Taxes: Deferred income taxes reflect the net tax effect of temporary differences between thecarrying amount of assets and liabilities for financial reporting purposes and the amounts used for income taxpurposes, as well as the tax effect of carryforwards. We record a valuation allowance to reduce our deferred taxassets to the amount that is more likely than not to be realized. Realization of our net deferred tax assets isdependent on future taxable income. We believe it is more-likely-than-not that such assets will be realized;however, ultimate realization could be negatively impacted by market conditions and other variables not knownor anticipated at the time. In the event that we determine that we would not be able to realize all or part of our netdeferred tax assets, an adjustment would be charged to earnings in the period such determination is made.Likewise, if we later determine that it is more-likely-than-not that the deferred tax assets would be realized, thenthe previously provided valuation allowance would be reversed.
We calculate our current and deferred tax provision based on estimates and assumptions that can differ fromthe actual results reflected in income tax returns filed during the subsequent year. Adjustments based on filedreturns are recorded when identified.
We recognize the benefit from a tax position only if it is more-likely-than-not that the position would besustained upon audit based solely on the technical merits of the tax position. Our policy is to include interest andpenalties related to unrecognized tax benefits as a component of income tax expense. Please refer to Note 15 ofthe Notes to the Consolidated Financial Statements for additional information.
In addition, the calculation of our tax liabilities involves dealing with uncertainties in the application ofcomplex tax regulations. We recognize liabilities for uncertain tax positions based on the two-step processprescribed within the interpretation. The first step is to evaluate the tax position for recognition by determining ifthe weight of available evidence indicates that it is more-likely-than-not that the position will be sustained onaudit, including resolution of related appeals or litigation processes, if any. The second step requires us toestimate and measure the tax benefit as the largest amount that is more than 50% likely to be realized uponultimate settlement. It is inherently difficult and subjective to estimate such amounts, as this requires us todetermine the probability of possible outcomes. We reevaluate these uncertain tax positions on a quarterly basis.This evaluation is based on factors including, but not limited to, changes in facts or circumstances, changes in taxlaw, effectively settled issues under audit, and new audit activity. Such a change in recognition or measurementwould result in the recognition of a tax benefit or an additional charge to the tax provision in the period suchdetermination is made.
Goodwill and Intangible Assets: Goodwill represents the amount by which the purchase price in eachbusiness combination exceeds the fair value of the net tangible and identifiable intangible assets acquired. Weallocate the carrying value of goodwill to our reporting units. We test goodwill and identifiable intangible assetswith indefinite useful lives for impairment at least annually. We amortize intangible assets with estimable usefullives over their respective estimated useful lives, and we review for impairment whenever events or changes incircumstances indicate that the carrying amount of the intangible asset may not be recoverable and the carryingamount exceeds its fair value.
We review goodwill at least annually for impairment. If certain events or indicators of impairment occurbetween annual impairment tests, we would perform an impairment test of goodwill at that date. In testing for apotential impairment of goodwill, we: (1) allocate goodwill to our reporting units to which the acquired goodwillrelates; (2) estimate the fair value of our reporting units; and (3) determine the carrying value (book value) ofthose reporting units, as some of the assets and liabilities related to those reporting units are not held by thosereporting units but by a corporate function. Prior to this allocation of the assets to the reporting units, we are
42

required to assess long-lived assets for impairment. Furthermore, if the estimated fair value of a reporting unit isless than the carrying value, we must estimate the fair value of all identifiable assets and liabilities of thatreporting unit, in a manner similar to a purchase price allocation for an acquired business. This can requireindependent valuations of certain internally generated and unrecognized intangible assets such as in-processR&D and developed technology. Only after this process is completed can the amount of goodwill impairment, ifany, be determined. Beginning with our fiscal year 2012 goodwill impairment analysis, we adopted newaccounting guidance that allowed us to first assess qualitative factors to determine whether it was necessary toperform a quantitative analysis. Under the revised guidance, an entity is no longer required to calculate the fairvalue of a reporting unit unless the entity determines, based on a qualitative assessment, that it is more-likely-than-not that its fair value is less than its carrying amount.
The process of evaluating the potential impairment of goodwill is subjective and requires significantjudgment at many points during the analysis. We determine the fair value of our reporting units by using aweighted combination of both a market and an income approach, as this combination is deemed to be the mostindicative of fair value in an orderly transaction between market participants.
Under the market approach, we use information regarding the reporting unit as well as publicly availableindustry information to determine various financial multiples to value our reporting units. Under the incomeapproach, we determine fair value based on estimated future cash flows of each reporting unit, discounted by anestimated weighted-average cost of capital, which reflects the overall level of inherent risk of a reporting unit andthe rate of return an outside investor would expect to earn.
In estimating the fair value of a reporting unit for the purposes of our annual or periodic analyses, we makeestimates and judgments about the future cash flows of our reporting units, including estimated growth rates andassumptions about the economic environment. Although our cash flow forecasts are based on assumptions thatare consistent with the plans and estimates we are using to manage the underlying businesses, there is significantjudgment involved in determining the cash flows attributable to a reporting unit. In addition, we make certainjudgments about allocating shared assets to the estimated balance sheets of our reporting units. We also considerour market capitalization and that of our competitors on the date we perform the analysis. Changes in judgmenton these assumptions and estimates could result in a goodwill impairment charge.
As a result, several factors could result in impairment of a material amount of our goodwill balance in futureperiods, including, but not limited to: (1) weakening of the global economy, weakness in the semiconductorequipment industry, or our failure to reach our internal forecasts, which could impact our ability to achieve ourforecasted levels of cash flows and reduce the estimated discounted cash flow value of our reporting units; and(2) a decline in our stock price and resulting market capitalization, if we determine that the decline is sustainedand indicates a reduction in the fair value of our reporting units below their carrying value. In addition, the valuewe assign to intangible assets, other than goodwill, is based on our estimates and judgments regardingexpectations such as the success and life cycle of products and technology acquired. If actual product acceptancediffers significantly from our estimates, we may be required to record an impairment charge to write down theasset to its realizable value.
Recent Accounting Pronouncements
In June 2011, the Financial Accounting Standards Board (“FASB”) issued new authoritative guidance thatincreases the prominence of items reported in other comprehensive income (“OCI”) by eliminating the option topresent components of OCI as part of the statement of changes in stockholders’ equity. The amendments in thisstandard require that all non-owner changes in stockholders’ equity be presented either in a single continuousstatement of comprehensive income or in two separate but consecutive statements. This guidance does not affectthe underlying accounting for components of OCI, but will change the presentation of our financial statements.We will adopt this authoritative guidance retrospectively in the first quarter of our fiscal year 2013.
43

In September 2011, the FASB issued revised guidance intended to simplify how an entity tests goodwill forimpairment. The amendment will allow an entity to first assess qualitative factors to determine whether it isnecessary to perform the two-step quantitative goodwill impairment test. An entity no longer will be required tocalculate the fair value of a reporting unit unless the entity determines, based on a qualitative assessment, that itis more-likely-than-not that its fair value is less than its carrying amount. We adopted this guidance during fiscalyear 2012 and it did not have a significant impact on the results of our annual goodwill impairment assessment.
Liquidity and Capital Resources
Total gross cash, cash equivalents, short-term investments, and restricted cash and investments balanceswere $3.0 billion at the end of fiscal year 2012 compared to $2.3 billion at the end of fiscal year 2011. Thisincrease was primarily due to cash provided by operations and cash acquired in connection with the acquisitionof Novellus, which was offset by $773 million of share repurchases.
Cash Flows from Operating Activities
Net cash provided by operating activities of $499 million during fiscal year 2012 consisted of (in millions):
Net income . . . . . . . . . . . . . . . . . . . . . . . . . . . . . . . . . . . . . . . . . $168.7Non-cash charges:
Depreciation and amortization . . . . . . . . . . . . . . . . . . . . . . 100.8Equity-based compensation . . . . . . . . . . . . . . . . . . . . . . . . 81.6Restructuring charges, net . . . . . . . . . . . . . . . . . . . . . . . . . 0.9
Net tax benefit on equity-based compensation plans . . . . . . . . . (1.2)Deferred income taxes . . . . . . . . . . . . . . . . . . . . . . . . . . . . . . . . 42.4Amortization of convertible note discount . . . . . . . . . . . . . . . . . 27.0Impairment of investment . . . . . . . . . . . . . . . . . . . . . . . . . . . . . 1.7Changes in operating asset and liability accounts . . . . . . . . . . . 66.2Other . . . . . . . . . . . . . . . . . . . . . . . . . . . . . . . . . . . . . . . . . . . . . . 10.9
$499.0
Significant changes in operating asset and liability accounts, net of foreign exchange impact, included thefollowing sources of cash: decreases in inventories of $74.0 million, accounts receivable of $66.1 million, andprepaid and other assets of $43.2 million and an increase in accounts payable of $12.1 million, partially offset bythe following uses of cash: decreases in accrued liabilities of $120.0 million and deferred profit of $9.2 million.
Cash Flows from Investing Activities
Net cash provided by investing activities during fiscal year 2012 was $269.7 million which was primarilydue to $418.7 million cash acquired in connection with the acquisition of Novellus, partially offset by capitalexpenditures of $107.3 million and net purchases of available-for-sale securities and other investment of $52.7million.
Cash Flows from Financing Activities
Net cash used for financing activities during fiscal year 2012 was $692.7 million which was primarily due to$772.7 million in treasury stock repurchases, partially offset by $55.2 million net cash settlements understructured stock repurchase arrangement (see Note 20 of Notes to Condensed Consolidated Financial Statements)and net proceeds from issuance of common stock related to employee equity-based plans of $27.3 million.
44

Liquidity
Given the cyclical nature of the semiconductor equipment industry, we believe that maintaining sufficientliquidity reserves is important to support sustaining levels of investment in R&D and capital infrastructure. Basedupon our current business outlook, we expect that our levels of cash, cash equivalents, and short-terminvestments at June 24, 2012 will be sufficient to support our presently anticipated levels of operations,investments, debt service requirements, and capital expenditures, through at least the next 12 months.
In the longer term, liquidity will depend to a great extent on our future revenues and our ability toappropriately manage our costs based on demand for our products and services. While we have substantial cashbalances in the United States and offshore, we may require additional funding and need to raise the requiredfunds through borrowings or public or private sales of debt or equity securities. We believe that, if necessary, wewill be able to access the capital markets on terms and in amounts adequate to meet our objectives. However,given the possibility of changes in market conditions or other occurrences, there can be no certainty that suchfunding will be available in needed quantities or on terms favorable to us.
Off-Balance Sheet Arrangements and Contractual Obligations
We have certain obligations to make future payments under various contracts, some of which are recordedon our balance sheet and some of which are not. Obligations are recorded on our balance sheet in accordancewith GAAP and include our long-term debt which is outlined in the following table and noted below. Ouroff-balance sheet arrangements include contractual relationships and are presented as operating leases andpurchase obligations in the table below. Our contractual cash obligations and commitments as of June 24, 2012,relating to these agreements and our guarantees are included in the following table. The amounts in the tablebelow exclude $274.2 million of liabilities related to uncertain tax benefits as we are unable to reasonablyestimate the ultimate amount or time of settlement. See Note 15 of Notes to the Consolidated FinancialStatements for further discussion.
TotalLess than
1 year1-3
years3-5
yearsMore than
5 yearsSubleaseIncome
(in thousands)
Operating Leases . . . . . . . . . . . . . . . . . . $ 37,381 $ 15,620 $22,497 $ 10,663 $ 1,423 $(12,822)Capital Leases . . . . . . . . . . . . . . . . . . . . 15,136 1,877 3,181 10,078 — —Purchase Obligations . . . . . . . . . . . . . . . 142,138 125,403 13,037 3,698 — —Long-term Debt and Interest
Expense . . . . . . . . . . . . . . . . . . . . . . . 2,174,198 26,248 52,497 500,528 1,594,925 —
Total . . . . . . . . . . . . . . . . . . . . . . . . . . . . $2,368,853 $169,148 $91,212 $524,967 $1,596,348 $(12,822)
Operating Leases
We lease most of our administrative, R&D and manufacturing facilities, regional sales/service offices andcertain equipment under non-cancelable operating leases. Certain of our facility leases for buildings located atour Fremont, California headquarters, Livermore facilities, and certain other facility leases provide us with anoption to extend the leases for additional periods or to purchase the facilities. Certain of our facility leasesprovide for periodic rent increases based on the general rate of inflation. In addition to amounts included in thetable above, we have guaranteed residual values for certain of our Fremont and Livermore facility leases of up to$164.9 million. See Note 14 of Notes to the Consolidated Financial Statements for further discussion.
Capital Leases
Capital leases reflect building and office equipment lease obligations. The amounts in the table aboveinclude the interest portion of payment obligations.
45

Purchase Obligations
Purchase obligations consist of significant contractual obligations either on an annual basis or over multi-year periods related to our outsourcing activities or other material commitments, including vendor-consignedinventories. We continue to enter into new agreements and maintain existing agreements to outsource certainactivities, including elements of our manufacturing, warehousing, logistics, facilities maintenance, certaininformation technology functions, and certain transactional general and administrative functions. The contractualcash obligations and commitments table presented above contains our minimum obligations at June 24, 2012under these arrangements and others. For obligations with cancellation provisions, the amounts included in thepreceding table were limited to the non-cancelable portion of the agreement terms or the minimum cancellationfee. Actual expenditures will vary based on the volume of transactions and length of contractual serviceprovided. In addition to these obligations, certain of these agreements include early termination provisions and/orcancellation penalties which could increase or decrease amounts actually paid.
Long-Term Debt
On May 11, 2011, we issued and sold $450.0 million in aggregate principal amount of 0.5% convertiblenotes due 2016 (the “2016 Notes”) and $450.0 million in aggregate principal amount of 1.25% convertible notesdue 2018 (the “2018 Notes,” and collectively with the “2016 Notes”, the “Notes”). The 2016 Notes were issuedat par and pay interest at a rate of 0.5% per annum and the 2018 Notes were issued at par and pay interest at rateof 1.25% per annum. The Notes may be converted into our common stock, under certain circumstances, based onan initial conversion rate of 15.8687 shares of our common stock per $1,000 principal amount of Notes, which isequal to a conversion price of approximately $63.02 per share of our common stock. The conversion price will besubject to adjustment in some events but will not be adjusted for accrued interest. Concurrently with the issuanceof the Notes, we purchased convertible note hedges for $181.1 million and sold warrants for $133.8 million. Theseparate convertible note hedges and warrant transactions are structured to reduce the potential future economicdilution associated with the conversion of the Notes.
In June 2012, with the acquisition of Novellus, we assumed $700 million in aggregate principal amount of2.625% Convertible Senior Notes due May 2041 (the “2041 Notes”). The 2041 Notes were issued at par and payinterest at a rate of 2.625% per annum. The 2041 Notes may be converted, under certain circumstances, into ourcommon stock based on an initial conversion rate of 28.4781 shares of common stock per $1,000 principalamount of notes, which represents an initial conversion price of approximately $35.11 per share of commonstock.
During fiscal year 2012, 2011, and 2010 we made $5.3 million, $4.5 million, and $21.0 million,respectively, in principal payments on long-term debt and capital leases, respectively.
Other Guarantees
We have issued certain indemnifications to our lessors for taxes and general liability under some of ouragreements. We have entered into certain insurance contracts that may limit our exposure to suchindemnifications. As of June 24, 2012, we had not recorded any liability on our Consolidated FinancialStatements in connection with these indemnifications, as we do not believe, based on information available, thatit is probable that we will pay any amounts under these guarantees.
Generally, we indemnify, under pre-determined conditions and limitations, our customers for infringementof third-party intellectual property rights by our products or services. We seek to limit our liability for suchindemnity to an amount not to exceed the sales price of the products or services subject to its indemnificationobligations. We do not believe, based on information available, that it is probable that we will pay any materialamounts under these guarantees.
46
We provide guarantees and standby letters of credit to certain parties as required for certain transactionsinitiated during the ordinary course of business. As of June 24, 2012, the maximum potential amount of futurepayments that we could be required to make under these arrangements and letters of credit was $19.9 million. Wedo not believe, based on historical experience and information currently available, that it is probable that anyamounts will be required to be paid.
Warranties
We offer standard warranties on our systems. The liability amount is based on actual historical warrantyspending activity by type of system, customer, and geographic region, modified for any known differences suchas the impact of system reliability improvements.
Item 7A. Quantitative and Qualitative Disclosures About Market Risk
Investments
We maintain an investment portfolio of various holdings, types, and maturities. As of June 24, 2012, ourmutual funds are classified as trading securities. Investments classified as trading securities are recorded at fairvalue based upon quoted market prices. Any material differences between the cost and fair value of tradingsecurities is recognized as “Other income (expense)” in our Consolidated Statement of Operations. All of ourother short-term investments are classified as available-for-sale and consequently are recorded in theConsolidated Balance Sheets at fair value with unrealized gains or losses reported as a separate component ofaccumulated other comprehensive income, net of tax.
47

Interest Rate Risk
Fixed Income Securities
Our investments in various interest earning securities carry a degree of market risk for changes in interestrates. At any time, a sharp rise in interest rates could have a material adverse impact on the fair value of our fixedincome investment portfolio. Conversely, declines in interest rates could have a material adverse impact oninterest income for our investment portfolio. We target to maintain a conservative investment policy, whichfocuses on the safety and preservation of our invested funds by limiting default risk, market risk, reinvestmentrisk, and the amount of credit exposure to any one issuer. The following table presents the hypothetical fairvalues of fixed income securities that would result from selected potential decreases and increases in interestrates. Market changes reflect immediate hypothetical parallel shifts in the yield curve of plus or minus 50 basispoints (“BPS”), 100 BPS, and 150 BPS. The hypothetical fair values as of June 24, 2012 were as follows:
Valuation of SecuritiesGiven an Interest Rate
Decrease of X Basis PointsFair Value as ofJune 24, 2012
Valuation of SecuritiesGiven an Interest Rate
Increase of X Basis Points
(150 BPS) (100 BPS) (50 BPS) 0.00% 50 BPS 100 BPS 150 BPS
(in thousands)
Municipal Notes andBonds . . . . . . . . . . . . $ 327,596 $ 325,920 $ 324,244 $ 322,567 $ 320,891 $ 319,215 $ 317,539
US Treasury &Agencies . . . . . . . . . 140,968 139,794 138,620 137,446 136,272 135,098 133,924
Government-SponsoredEnterprises . . . . . . . . 126,329 125,309 124,289 123,268 122,248 121,228 120,208
Foreign GovernmentBond . . . . . . . . . . . . 6,582 6,507 6,433 6,358 6,283 6,209 6,134
Corporate Notes andBonds . . . . . . . . . . . . 781,039 776,993 772,947 768,901 764,856 760,811 756,765
Mortgage BackedSecurities -Residential . . . . . . . . 26,797 26,522 26,247 25,972 25,697 25,422 25,147
Mortgage BackedSecurities -Commercial . . . . . . . 86,387 85,875 85,364 84,853 84,341 83,830 83,319
Total . . . . . . . . . . . . . . . $1,495,698 $1,486,920 $1,478,144 $1,469,365 $1,460,588 $1,451,813 $1,443,036
We mitigate default risk by investing in high credit quality securities and by positioning our portfolio torespond appropriately to a significant reduction in a credit rating of any investment issuer or guarantor. Theportfolio includes only marketable securities with active secondary or resale markets to achieve portfolioliquidity and maintain a prudent amount of diversification.
Long-Term Debt
As of June 24, 2012, we had $1.6 billion in principal amount of fixed-rate long-term debt outstanding, witha fair value of $1.7 billion. The fair value of our Notes is subject to interest rate risk, market risk and otherfactors due to the convertible feature. Generally, the fair value of Notes will increase as interest rates fall and/orour common stock price increases, and decrease as interest rates rise and/or our common stock price decreases.The interest and market value changes affect the fair value of our Notes but do not impact our financial position,cash flows, or results of operations due to the fixed nature of the debt obligations. We do not carry the Notes atfair value, but present the fair value of the principal amount of our Notes for disclosure purposes.
48

Equity Price Risk
Publicly Traded Securities
The values of our investments in publicly traded securities, including mutual funds related to our obligationsunder our deferred compensation plans, are subject to market price risk. The following table presents thehypothetical fair values of our publicly traded securities that would result from selected potential decreases andincreases in the price of each security in the portfolio. Potential fluctuations in the price of each security in theportfolio of plus or minus 10%, 15%, or 25% were selected based on potential near-term changes in thosesecurity prices. The hypothetical fair values as of June 24, 2012 were as follows:
Valuation of SecuritiesGiven an X% Decrease
in Stock PriceFair Value as ofJune 24, 2012
Valuation of SecuritiesGiven an X% Increase
in Stock Price
(25%) (15%) (10%) 0.00% 10% 15% 25%
(in thousands)
Mutual Funds . . . . . . . . . . . . . . . . $13,316 $15,091 $15,979 $17,754 $19,529 $20,417 $22,193Publicly traded equity
securities . . . . . . . . . . . . . . . . . $ 4,435 $ 5,026 $ 5,322 $ 5,913 $ 6,504 $ 6,800 $ 7,391
Total . . . . . . . . . . . . . . . . . . . . . . . $17,751 $20,117 $21,301 $23,667 $26,033 $27,217 $29,584
Foreign Currency Exchange (“FX”) Risk
We conduct business on a global basis in several major international currencies. As such, we are potentiallyexposed to adverse as well as beneficial movements in foreign currency exchange rates. The majority of ourrevenues and expenses are denominated in U.S. dollars except for certain revenues denominated in Japanese yen,certain revenues and expenses denominated in the Euro, certain spares and service contracts denominated invarious currencies, and expenses related to our non-U.S. sales and support offices denominated in the relatedcountries’ local currency. We currently enter into foreign currency forward contracts to minimize the short-termimpact of foreign currency exchange rate fluctuations on Japanese yen-denominated revenue and monetary assetand liability exposure, Euro-denominated expenses and monetary assets and liabilities, as well as monetary assetsand liabilities denominated in Swiss francs, Taiwanese dollars, and Great British pounds. We currently believethese are our primary exposures to currency rate fluctuation.
To protect against the reduction in value of forecasted Japanese yen-denominated revenue and Euro-denominated expenses, we enter into foreign currency forward contracts that generally expire within 12 months,and no later than 24 months. These foreign currency forward contracts are designated as cash flow hedges andare carried on our balance sheet at fair value, with the effective portion of the contracts’ gains or losses includedin accumulated other comprehensive income (loss) and subsequently recognized in earnings in the same periodthe hedged revenue and/or expense is recognized. We also enter into foreign currency forward contracts to hedgethe gains and losses generated by the remeasurement of Japanese yen, Euros, Swiss franc, Taiwanese dollar, andGreat British pound -denominated monetary assets and liabilities against the U.S. dollar. The change in fair valueof these balance sheet hedge contracts is recorded into earnings as a component of other income (expense), netand offsets the change in fair value of the foreign currency denominated monetary assets and liabilities alsorecorded in other income (expense), net, assuming the hedge contract fully covers the intercompany and tradereceivable balances.
49

The notional amount and unrealized gain of our outstanding forward contracts that are designated as cashflow hedges, as of June 24, 2012 are shown in the table below. This table also shows the change in fair value ofthese cash flow hedges assuming a hypothetical foreign currency exchange rate movement of plus-or-minus10 percent and plus-or-minus 15 percent.
NotionalAmount
Unrealized FXGain / (Loss)June 24, 2012
Valuation of Fx Contracts Given an X%Increase (+)/Decrease(-) in Each Fx
Rate
+ / - (10%) + / - (15%)
(in $ Millions)
Cash Flow HedgeSell . . . . . . . . . . . . . . . . . . . . . JPY $ 98.8 $ 3.3 $ 9.9 $14.8Buy . . . . . . . . . . . . . . . . . . . . . EUR $ 64.4 $(3.5) $ 6.4 $ 9.7
$163.2 $(0.2) $16.3 $24.5
The notional amount and unrealized loss of our outstanding foreign currency forward contracts that aredesignated as balance sheet hedges, as of June 24, 2012 are shown in the table below. This table also shows thechange in fair value of these balance sheet hedges, assuming a hypothetical foreign currency exchange ratemovement of plus-or-minus 10 percent and plus-or-minus 15 percent. These changes in fair values would beoffset in other income (expense), net, by corresponding change in fair values of the foreign currencydenominated monetary assets and liabilities, assuming the hedge contract fully covers the intercompany and tradereceivable balances.
NotionalAmount
Unrealized FXGain / (Loss)June 24, 2012
Valuation of Fx Contracts Given an X%Increase (+)/Decrease(-) in Each Fx
Rate
+ /- (10%) + /- (15%)
(in $ Millions)
Balance Sheet HedgeSell . . . . . . . . . . . . . . . . . . . JPY $ 42.6 $0.0 $ 4.3 $ 6.4Buy . . . . . . . . . . . . . . . . . . . CHF $232.9 $0.0 $23.3 $34.9Buy . . . . . . . . . . . . . . . . . . . TWD $ 86.9 $0.0 $ 8.7 $13.0Buy . . . . . . . . . . . . . . . . . . . EUR $ 11.8 $0.0 $ 1.2 $ 1.8Buy . . . . . . . . . . . . . . . . . . . GBP $ 4.5 $0.0 $ 0.4 $ 0.7
$378.7 $0.0 $37.9 $56.8
Item 8. Financial Statements and Supplementary Data
The Consolidated Financial Statements required by this Item are set forth on the pages indicated inItem 15(a). The unaudited quarterly results of our operations for our two most recent fiscal years are incorporatedin this Item by reference under Item 6, “Selected Financial Data” above.
Item 9. Changes in and Disagreements With Accountants on Accounting and Financial Disclosure
None.
Item 9A. Controls and Procedures
Disclosure Controls and Procedures
As required by Rule 13a-15(b) under the Securities Exchange Act of 1934, as amended (the “ExchangeAct”), as of June 24, 2012, we carried out an evaluation, under the supervision and with the participation of ourmanagement, including our Chief Executive Officer and our Chief Financial Officer, of the effectiveness of thedesign and operation of our disclosure controls and procedures as defined in Rule 13a-15(e). Based upon thatevaluation, our Chief Executive Officer and our Chief Financial Officer each concluded that our disclosurecontrols and procedures are effective at the reasonable assurance level.
50

We intend to review and evaluate the design and effectiveness of our disclosure controls and procedures onan ongoing basis and to correct any material deficiencies that we may discover. Our goal is to ensure that oursenior management has timely access to material information that could affect our business.
Changes in Internal Control Over Financial Reporting
There has been no change in our internal control over financial reporting during our most recent fiscalquarter that has materially affected, or is reasonably likely to materially affect, our internal control over financialreporting.
Management’s Report on Internal Control Over Financial Reporting
Management is responsible for establishing and maintaining adequate “internal control over financialreporting”, as that term is defined in Exchange Act Rules 13a-15(f) and 15d-15(f). Management has used theframework set forth in the report entitled “Internal Control — Integrated Framework” published by theCommittee of Sponsoring Organizations of the Treadway Commission to evaluate the effectiveness of theCompany’s internal control over financial reporting. Based on that evaluation, management has concluded thatthe Company’s internal control over financial reporting was effective as of June 24, 2012 at providing reasonableassurance regarding the reliability of financial reporting and the preparation of financial statements for externalpurposes in accordance with GAAP.
In accordance with guidance issued by the SEC, companies are permitted to exclude acquisitions from theirfinal assessment of internal control over financial reporting for the fiscal year in which the acquisition occurred.Management’s evaluation of internal control over financial reporting excluded the internal control activities ofNovellus. The acquired business represented approximately 1 percent of consolidated revenues for the year endedJune 24, 2012 and approximately 25 percent of consolidated total assets and approximately 23 percent ofconsolidated net assets, excluding acquisition method fair value adjustments as of June 24, 2012.
Ernst & Young LLP, an independent registered public accounting firm, has audited the Company’s internalcontrol over financial reporting, as stated in their report, which is included in Part IV, Item 15 of this 2012Form 10-K.
Effectiveness of Controls
While we believe the present design of our disclosure controls and procedures and internal control overfinancial reporting is effective at the reasonable assurance level, future events affecting our business may causeus to modify our disclosure controls and procedures or internal controls over financial reporting. Theeffectiveness of controls cannot be absolute because the cost to design and implement a control to identify errorsor mitigate the risk of errors occurring should not outweigh the potential loss caused by the errors that wouldlikely be detected by the control. Moreover, we believe that a control system cannot be guaranteed to be 100%effective all of the time. Accordingly, a control system, no matter how well designed and operated, can provideonly reasonable, not absolute, assurance that the control system’s objectives will be met.
Item 9B. Other Information
None.
51

PART III
We have omitted from this 2012 Form 10-K certain information required by Part III because we, as theRegistrant, will file a definitive proxy statement with the Securities and Exchange Commission (SEC) within120 days after the end of our fiscal year, pursuant to Regulation 14A, as promulgated by the SEC, for our AnnualMeeting of Stockholders expected to be held on or about November 1, 2012 (the “Proxy Statement”), and certaininformation included in the Proxy Statement is incorporated into this report by reference. (However, the Reportsof the Audit Committee and Compensation Committee in the Proxy Statement are expressly not incorporated byreference into this report.)
Item 10. Directors, Executive Officers, and Corporate Governance
For information regarding our executive officers, see Part I, Item 1 of this 2012 Form 10-K under thecaption “Executive Officers of the Company,” which information is incorporated into Part III by reference.
The information concerning our directors required by this Item is incorporated by reference to our ProxyStatement under the heading “Proposal No. 1 — Election of Directors.”
The information concerning our audit committee and audit committee financial experts required by this Itemis incorporated by reference to our Proxy Statement under the heading “Corporate Governance.”
The information concerning compliance by our officers, directors and 10% shareholders with Section 16 ofthe Exchange Act required by this Item is incorporated by reference to our Proxy Statement under the heading“Section 16(a) Beneficial Ownership Reporting Compliance.”
The Company has adopted a Corporate Code of Ethics that applies to all employees, officers, and directorsof the Company. Our Code of Ethics is publicly available on the investor relations page of our website at http://investor.lamresearch.com. To the extent required by law, any amendments to, or waivers from, any provision ofthe Code of Ethics will promptly be disclosed to the public. To the extent permitted by applicable legalrequirements, we intend to make any required public disclosure by posting the relevant material on our website inaccordance with SEC rules.
Item 11. Executive Compensation
The information required by this Item is incorporated by reference to our Proxy Statement under the heading“Executive Compensation and Other Information.”
Item 12. Security Ownership of Certain Beneficial Owners and Management and Related StockholderMatters
The information required by this Item is incorporated by reference to our Proxy Statement under theheadings “Proposal No. 1 — Election of Directors,” “Compensation Committee Interlocks and InsiderParticipation,” “Compensation Committee Report,” “Security Ownership of Certain Beneficial Owners andManagement” and “Securities Authorized for Issuance Under Equity Compensation Plans.”
Item 13. Certain Relationships and Related Transactions, and Director Independence
The information required by this Item is incorporated by reference to our Proxy Statement under theheadings “Certain Relationships and Related Transactions” and “Corporate Governance”.
Item 14. Principal Accounting Fees and Services
The information required by this Item is incorporated by reference to our Proxy Statement under the heading“Relationship with Independent Registered Public Accounting Firm.”
52

PART IV
Item 15. Exhibits, Financial Statement Schedules
(a) The following documents are filed as part of this Annual Report on Form 10-K
1. Index to Financial Statements
Page
Consolidated Balance Sheets — June 24, 2012 and June 26, 2011 . . . . . . . . . . . . . . . . . . . . . . . . . . . 54Consolidated Statements of Operations — Years Ended June 24, 2012, June 26, 2011, and June 27,
2010 . . . . . . . . . . . . . . . . . . . . . . . . . . . . . . . . . . . . . . . . . . . . . . . . . . . . . . . . . . . . . . . . . . . . . . . . . . 55Consolidated Statements of Cash Flows — Years Ended June 24, 2012, June 26, 2011, and
June 27, 2010 . . . . . . . . . . . . . . . . . . . . . . . . . . . . . . . . . . . . . . . . . . . . . . . . . . . . . . . . . . . . . . . . . . 56Consolidated Statements of Stockholders’ Equity — Years Ended June 24, 2012, June 26, 2011,
and June 27, 2010 . . . . . . . . . . . . . . . . . . . . . . . . . . . . . . . . . . . . . . . . . . . . . . . . . . . . . . . . . . . . . . . 57Notes to Consolidated Financial Statements . . . . . . . . . . . . . . . . . . . . . . . . . . . . . . . . . . . . . . . . . . . . . 58Reports of Independent Registered Public Accounting Firm . . . . . . . . . . . . . . . . . . . . . . . . . . . . . . . . 101
2. Index to Financial Statement Schedules
Schedule II — Valuation and Qualifying Accounts . . . . . . . . . . . . . . . . . . . . . . . . . . . . . . . . . . . . . . . 106
Schedules, other than those listed above, have been omitted since they are not applicable/notrequired, or the information is included elsewhere herein.
3. See (c) of this Item 15, which is incorporated herein by reference.
(c) The list of Exhibits follows page 92 of this 2012 Form 10-K and is incorporated herein by thisreference.
53

LAM RESEARCH CORPORATIONCONSOLIDATED BALANCE SHEETS
(in thousands, except per share data)
June 24, June 26,2012 2011
ASSETSCash and cash equivalents . . . . . . . . . . . . . . . . . . . . . . . . . . . . . . . . . . . . . . . . . . . . . . $ 1,564,752 $ 1,492,132Short-term investments . . . . . . . . . . . . . . . . . . . . . . . . . . . . . . . . . . . . . . . . . . . . . . . . . 1,297,931 630,115Accounts receivable, less allowance for doubtful accounts of $5,248 as of June 24,
2012 and $4,720 as of June 26, 2011 . . . . . . . . . . . . . . . . . . . . . . . . . . . . . . . . . . . . 765,818 590,568Inventories . . . . . . . . . . . . . . . . . . . . . . . . . . . . . . . . . . . . . . . . . . . . . . . . . . . . . . . . . . 632,853 396,607Deferred income taxes . . . . . . . . . . . . . . . . . . . . . . . . . . . . . . . . . . . . . . . . . . . . . . . . . 47,782 78,435Prepaid expenses and other current assets . . . . . . . . . . . . . . . . . . . . . . . . . . . . . . . . . . 105,973 85,408
Total current assets . . . . . . . . . . . . . . . . . . . . . . . . . . . . . . . . . . . . . . . . . . . . . . . . 4,415,109 3,273,265Property and equipment, net . . . . . . . . . . . . . . . . . . . . . . . . . . . . . . . . . . . . . . . . . . . . . 584,596 270,458Restricted cash and investments . . . . . . . . . . . . . . . . . . . . . . . . . . . . . . . . . . . . . . . . . . 166,335 165,256Deferred income taxes . . . . . . . . . . . . . . . . . . . . . . . . . . . . . . . . . . . . . . . . . . . . . . . . . — 3,892Goodwill . . . . . . . . . . . . . . . . . . . . . . . . . . . . . . . . . . . . . . . . . . . . . . . . . . . . . . . . . . . . 1,446,303 169,182Intangible assets, net . . . . . . . . . . . . . . . . . . . . . . . . . . . . . . . . . . . . . . . . . . . . . . . . . . . 1,240,427 47,434Other assets . . . . . . . . . . . . . . . . . . . . . . . . . . . . . . . . . . . . . . . . . . . . . . . . . . . . . . . . . . 151,882 124,380
Total assets . . . . . . . . . . . . . . . . . . . . . . . . . . . . . . . . . . . . . . . . . . . . . . . . . . . . . . $ 8,004,652 $ 4,053,867
LIABILITIES AND STOCKHOLDERS’ EQUITYTrade accounts payable . . . . . . . . . . . . . . . . . . . . . . . . . . . . . . . . . . . . . . . . . . . . . . . . $ 258,778 $ 163,541Accrued expenses and other current liabilities . . . . . . . . . . . . . . . . . . . . . . . . . . . . . . . 492,178 358,756Deferred profit . . . . . . . . . . . . . . . . . . . . . . . . . . . . . . . . . . . . . . . . . . . . . . . . . . . . . . . 164,833 153,680Current portion of long-term debt, convertible notes, and capital leases . . . . . . . . . . . 511,139 4,782
Total current liabilities . . . . . . . . . . . . . . . . . . . . . . . . . . . . . . . . . . . . . . . . . . . . . 1,426,928 680,759Long-term debt, convertible notes, and capital leases . . . . . . . . . . . . . . . . . . . . . . . . . 761,783 738,488Income taxes payable . . . . . . . . . . . . . . . . . . . . . . . . . . . . . . . . . . . . . . . . . . . . . . . . . . 274,240 113,582Other long-term liabilities . . . . . . . . . . . . . . . . . . . . . . . . . . . . . . . . . . . . . . . . . . . . . . 219,577 51,193
Total liabilities . . . . . . . . . . . . . . . . . . . . . . . . . . . . . . . . . . . . . . . . . . . . . . . . . . . 2,682,528 1,584,022Commitments and contingenciesSenior convertible notes (Note 13) . . . . . . . . . . . . . . . . . . . . . . . . . . . . . . . . . . . . . . . . 190,343 —Stockholders’ equity:Preferred stock, at par value of $0.001 per share; authorized - 5,000 shares, none
outstanding . . . . . . . . . . . . . . . . . . . . . . . . . . . . . . . . . . . . . . . . . . . . . . . . . . . . . . . . — —Common stock, at par value of $0.001 per share; authorized - 400,000 shares; issued
and outstanding - 186,656 shares at June 24, 2012 and 123,579 shares atJune 26, 2011 . . . . . . . . . . . . . . . . . . . . . . . . . . . . . . . . . . . . . . . . . . . . . . . . . . . . . . 187 124
Additional paid-in capital . . . . . . . . . . . . . . . . . . . . . . . . . . . . . . . . . . . . . . . . . . . . . . . 4,943,539 1,531,465Treasury stock, at cost, 62,068 shares at June 24, 2012 and 40,995 shares at June 26,
2011 . . . . . . . . . . . . . . . . . . . . . . . . . . . . . . . . . . . . . . . . . . . . . . . . . . . . . . . . . . . . . (2,636,936) (1,761,591)Accumulated other comprehensive income (loss) . . . . . . . . . . . . . . . . . . . . . . . . . . . . (33,818) 9,761Retained earnings . . . . . . . . . . . . . . . . . . . . . . . . . . . . . . . . . . . . . . . . . . . . . . . . . . . . . 2,858,809 2,690,086
Total stockholders’ equity . . . . . . . . . . . . . . . . . . . . . . . . . . . . . . . . . . . . . . 5,131,781 2,469,845
Total liabilities and stockholders’ equity . . . . . . . . . . . . . . . . . . . . . . . . . . . $ 8,004,652 $ 4,053,867
See Notes to Consolidated Financial Statements
54

LAM RESEARCH CORPORATIONCONSOLIDATED STATEMENTS OF OPERATIONS
(in thousands, except per share data)
Year Ended
June 24, June 26, June 27,2012 2011 2010
Revenue . . . . . . . . . . . . . . . . . . . . . . . . . . . . . . . . . . . . . . . . . . . . . . . . . . . $2,665,192 $3,237,693 $2,133,776Cost of goods sold . . . . . . . . . . . . . . . . . . . . . . . . . . . . . . . . . . . . . . . 1,581,982 1,740,461 1,166,219Cost of goods sold - restructuring and impairments . . . . . . . . . . . . . (859) — 3,438Cost of goods sold - 409A expense . . . . . . . . . . . . . . . . . . . . . . . . . . — — (5,816)
Total costs of goods sold . . . . . . . . . . . . . . . . . . . . . . . . . . . . . . 1,581,123 1,740,461 1,163,841
Gross margin . . . . . . . . . . . . . . . . . . . . . . . . . . . . . . . . . . . . . . . 1,084,069 1,497,232 969,935Research and development . . . . . . . . . . . . . . . . . . . . . . . . . . . . . . . . . . . . 444,559 373,293 320,859Selling, general and administrative . . . . . . . . . . . . . . . . . . . . . . . . . . . . . . 400,052 308,075 240,942Restructuring and impairments . . . . . . . . . . . . . . . . . . . . . . . . . . . . . . . . . 1,725 11,579 21,314409A expense . . . . . . . . . . . . . . . . . . . . . . . . . . . . . . . . . . . . . . . . . . . . . . — — (38,590)
Total operating expenses . . . . . . . . . . . . . . . . . . . . . . . . . . . . . . 846,336 692,947 544,525
Operating income . . . . . . . . . . . . . . . . . . . . . . . . . . . . . . . . . . . 237,733 804,285 425,410Other income (expense), net:
Interest income . . . . . . . . . . . . . . . . . . . . . . . . . . . . . . . . . . . . . 12,141 9,890 8,682Interest expense . . . . . . . . . . . . . . . . . . . . . . . . . . . . . . . . . . . . . (38,962) (5,380) (994)Gains (losses) on deferred compensation plan related assets . . (914) 5,682 (84)Foreign exchange gains (losses) . . . . . . . . . . . . . . . . . . . . . . . . (397) (11,085) (103)Other, net . . . . . . . . . . . . . . . . . . . . . . . . . . . . . . . . . . . . . . . . . . (5,183) (2,516) (2,770)
Income before income taxes . . . . . . . . . . . . . . . . . . . . . . . . . . . 204,418 800,876 430,141Income tax expense . . . . . . . . . . . . . . . . . . . . . . . . . . . . . . . . . . . . . . . . . . 35,695 77,128 83,472
Net income . . . . . . . . . . . . . . . . . . . . . . . . . . . . . . . . . . . . . . . . $ 168,723 $ 723,748 $ 346,669
Net income per share:Basic net income per share . . . . . . . . . . . . . . . . . . . . . . . . . . . . . . . . $ 1.36 $ 5.86 $ 2.73
Diluted net income per share . . . . . . . . . . . . . . . . . . . . . . . . . . . . . . . $ 1.35 $ 5.79 $ 2.71
Number of shares used in per share calculations:Basic . . . . . . . . . . . . . . . . . . . . . . . . . . . . . . . . . . . . . . . . . . . . . . . . . 124,176 123,529 126,933
Diluted . . . . . . . . . . . . . . . . . . . . . . . . . . . . . . . . . . . . . . . . . . . . . . . . 125,233 125,019 128,126
See Notes to Condensed Consolidated Financial Statements
55

LAM RESEARCH CORPORATIONCONSOLIDATED STATEMENTS OF CASH FLOWS
(in thousands)
Year Ended
June 24, June 26, June 27,2012 2011 2010
CASH FLOWS FROM OPERATING ACTIVITIES:Net income . . . . . . . . . . . . . . . . . . . . . . . . . . . . . . . . . . . . . . . . . . . . . . . . . . . . . . . . . . . . . . . . . . . . . . . $ 168,723 $ 723,748 $ 346,669Adjustments to reconcile net income to net cash provided by operating activities:
Depreciation and amortization . . . . . . . . . . . . . . . . . . . . . . . . . . . . . . . . . . . . . . . . . . . . . . . . . . . . 100,825 74,759 71,401Deferred income taxes . . . . . . . . . . . . . . . . . . . . . . . . . . . . . . . . . . . . . . . . . . . . . . . . . . . . . . . . . . 42,446 (10,721) 13,718Restructuring charges, net . . . . . . . . . . . . . . . . . . . . . . . . . . . . . . . . . . . . . . . . . . . . . . . . . . . . . . . 866 11,579 24,752Impairment of investment . . . . . . . . . . . . . . . . . . . . . . . . . . . . . . . . . . . . . . . . . . . . . . . . . . . . . . . 1,724 — —Equity-based compensation expense . . . . . . . . . . . . . . . . . . . . . . . . . . . . . . . . . . . . . . . . . . . . . . . 81,559 53,012 50,463Income tax benefit on equity-based compensation plans . . . . . . . . . . . . . . . . . . . . . . . . . . . . . . . 1,510 28,775 10,635Excess tax benefit on equity-based compensation plans . . . . . . . . . . . . . . . . . . . . . . . . . . . . . . . . (2,686) (23,290) (10,234)Amortization of convertible note discount . . . . . . . . . . . . . . . . . . . . . . . . . . . . . . . . . . . . . . . . . . 27,028 3,554 —Other, net . . . . . . . . . . . . . . . . . . . . . . . . . . . . . . . . . . . . . . . . . . . . . . . . . . . . . . . . . . . . . . . . . . . . 10,877 (2,341) 3,190Changes in operating asset and liability accounts:
Accounts receivable, net of allowance . . . . . . . . . . . . . . . . . . . . . . . . . . . . . . . . . . . . . . . . . 66,064 (89,716) (246,653)Inventories . . . . . . . . . . . . . . . . . . . . . . . . . . . . . . . . . . . . . . . . . . . . . . . . . . . . . . . . . . . . . . . 73,987 (77,461) (79,701)Prepaid expenses and other assets . . . . . . . . . . . . . . . . . . . . . . . . . . . . . . . . . . . . . . . . . . . . . 43,171 (25,282) (23,647)Trade accounts payable . . . . . . . . . . . . . . . . . . . . . . . . . . . . . . . . . . . . . . . . . . . . . . . . . . . . . 12,145 42,320 71,600Deferred profit . . . . . . . . . . . . . . . . . . . . . . . . . . . . . . . . . . . . . . . . . . . . . . . . . . . . . . . . . . . . (9,236) 34,012 77,407Accrued expenses and other liabilities . . . . . . . . . . . . . . . . . . . . . . . . . . . . . . . . . . . . . . . . . (119,975) 138,080 41,113
Net cash provided by operating activities . . . . . . . . . . . . . . . . . . . . . . . . . . . . . . . . . . . 499,028 881,028 350,713
CASH FLOWS FROM INVESTING ACTIVITIES:Capital expenditures and intangible assets . . . . . . . . . . . . . . . . . . . . . . . . . . . . . . . . . . . . . . . . . . . . . . (107,272) (127,495) (35,590)Cash acquired in business acquisition . . . . . . . . . . . . . . . . . . . . . . . . . . . . . . . . . . . . . . . . . . . . . . . . . . 418,681 — —Purchases of available-for-sale securities . . . . . . . . . . . . . . . . . . . . . . . . . . . . . . . . . . . . . . . . . . . . . . . (883,429) (564,485) (192,755)Sales and maturities of available-for-sale securities . . . . . . . . . . . . . . . . . . . . . . . . . . . . . . . . . . . . . . . 841,440 210,962 114,768Purchase of equity method investment . . . . . . . . . . . . . . . . . . . . . . . . . . . . . . . . . . . . . . . . . . . . . . . . . (10,740) — —Purchase of other investments . . . . . . . . . . . . . . . . . . . . . . . . . . . . . . . . . . . . . . . . . . . . . . . . . . . . . . . . — (417) (2,184)Receipt of loan payments (loans made) . . . . . . . . . . . . . . . . . . . . . . . . . . . . . . . . . . . . . . . . . . . . . . . . . 8,375 — (800)Proceeds from sale of assets . . . . . . . . . . . . . . . . . . . . . . . . . . . . . . . . . . . . . . . . . . . . . . . . . . . . . . . . . 2,677 1,544 —Transfer of restricted cash and investments . . . . . . . . . . . . . . . . . . . . . . . . . . . . . . . . . . . . . . . . . . . . . . (6) (22) 13,205
Net cash provided by (used for) investing activities . . . . . . . . . . . . . . . . . . . . . . . . . . . 269,726 (479,913) (103,356)
CASH FLOWS FROM FINANCING ACTIVITIES:Principal payments on long-term debt and capital lease obligations . . . . . . . . . . . . . . . . . . . . . . . . . . . (5,265) (4,530) (21,040)Net proceeds from issuance of long-term debt & convertible notes . . . . . . . . . . . . . . . . . . . . . . . . . . . — 882,831 336Proceeds from sale of warrants . . . . . . . . . . . . . . . . . . . . . . . . . . . . . . . . . . . . . . . . . . . . . . . . . . . . . . . — 133,830 —Purchase of convertible note hedge . . . . . . . . . . . . . . . . . . . . . . . . . . . . . . . . . . . . . . . . . . . . . . . . . . . . — (181,125) —Excess tax benefit on equity-based compensation plans . . . . . . . . . . . . . . . . . . . . . . . . . . . . . . . . . . . . 2,686 23,290 10,234Treasury stock purchases . . . . . . . . . . . . . . . . . . . . . . . . . . . . . . . . . . . . . . . . . . . . . . . . . . . . . . . . . . . . (772,663) (211,316) (93,032)Net cash received in settlement of (paid in advance for) stock repurchase contracts . . . . . . . . . . . . . . 55,194 (149,589) —Reissuances of treasury stock . . . . . . . . . . . . . . . . . . . . . . . . . . . . . . . . . . . . . . . . . . . . . . . . . . . . . . . . 25,525 21,194 17,452Proceeds from issuance of common stock . . . . . . . . . . . . . . . . . . . . . . . . . . . . . . . . . . . . . . . . . . . . . . . 1,776 12,401 13,386
Net cash provided by (used for) financing activities . . . . . . . . . . . . . . . . . . . . . . . . . . . (692,747) 526,986 (72,664)
Effect of exchange rate changes on cash . . . . . . . . . . . . . . . . . . . . . . . . . . . . . . . . . . . . . . . . . . . . . . . . (3,387) 18,264 (3,093)Net increase in cash and cash equivalents . . . . . . . . . . . . . . . . . . . . . . . . . . . . . . . . . . . . . . . . . . . . . . . 72,620 946,365 171,600Cash and cash equivalents at beginning of year . . . . . . . . . . . . . . . . . . . . . . . . . . . . . . . . . . . . . . . . . . 1,492,132 545,767 374,167
Cash and cash equivalents at end of year . . . . . . . . . . . . . . . . . . . . . . . . . . . . . . . . . . . . . . . . . . . . . . . $1,564,752 $1,492,132 $ 545,767
Schedule of noncash transactionsAcquisition of leased equipment . . . . . . . . . . . . . . . . . . . . . . . . . . . . . . . . . . . . . . . . . . . . . . . . . . $ — $ — $ —
Accrued payables for stock repurchases . . . . . . . . . . . . . . . . . . . . . . . . . . . . . . . . . . . . . . . . . . . . $ 20,853 $ — $ 13,500
Supplemental disclosures:Cash payments for interest . . . . . . . . . . . . . . . . . . . . . . . . . . . . . . . . . . . . . . . . . . . . . . . . . . . . . . . $ 8,246 $ 232 $ 878
Cash payments for income taxes, net . . . . . . . . . . . . . . . . . . . . . . . . . . . . . . . . . . . . . . . . . . . . . . $ 29,113 $ 70,774 $ 16,261
See Notes to Consolidated Financial Statements
56

LAM RESEARCH CORPORATIONCONSOLIDATED STATEMENTS OF STOCKHOLDERS’ EQUITY
(in thousands)
CommonStockShares
CommonStock
AdditionalPaid-inCapital
TreasuryStock
AccumulatedOther
ComprehensiveIncome(Loss)
RetainedEarnings Total
Balance at June 28, 2009 . . . . . . . . . . . . . . . . . . . . . . . . . . . . 126,532 127 1,377,231 (1,495,693) (52,822) 1,624,246 1,453,089
Sale of common stock . . . . . . . . . . . . . . . . . . . . . . . . . . . . . . . 1,619 1 13,386 — — — 13,387Purchase of treasury stock . . . . . . . . . . . . . . . . . . . . . . . . . . . (2,982) (3) — (106,531) — — (106,534)Income tax benefit on equity-based compensation plans . . . . — — 10,635 — — — 10,635Reissuance of treasury stock . . . . . . . . . . . . . . . . . . . . . . . . . . 777 1 1,224 20,807 — (4,579) 17,453Equity-based compensation expense . . . . . . . . . . . . . . . . . . . — — 50,463 — — — 50,463Components of comprehensive income:
Net income . . . . . . . . . . . . . . . . . . . . . . . . . . . . . . . . . . . — — — — — 346,669 346,669Foreign currency translation adjustment . . . . . . . . . . . . . — — — — (13,868) — (13,868)Unrealized loss on fair value of derivative financial
instruments, net . . . . . . . . . . . . . . . . . . . . . . . . . . . . . . — — — — (414) — (414)Unrealized gain on financial instruments, net . . . . . . . . — — — — 2,062 — 2,062Less: Reclassification adjustment for gains included in
earnings . . . . . . . . . . . . . . . . . . . . . . . . . . . . . . . . . . . . — — — — (645) — (645)Change in retiree medical benefit . . . . . . . . . . . . . . — — — — (4,162) — (4,162)
Total comprehensive income . . . . . . . . . . . . . . . . . — — — — — — 329,642
Balance at June 27, 2010 . . . . . . . . . . . . . . . . . . . . . . . . . . . . 125,946 $126 $1,452,939 $(1,581,417) $(69,849) $1,966,336 $1,768,135
Sale of common stock . . . . . . . . . . . . . . . . . . . . . . . . . . . . . . . 1,744 2 12,404 — — — 12,406Purchase of treasury stock . . . . . . . . . . . . . . . . . . . . . . . . . . . (4,790) (5) (149,589) (197,840) — — (347,434)Income tax benefit on equity-based compensation plans . . . . — — 28,775 — — — 28,775Reissuance of treasury stock . . . . . . . . . . . . . . . . . . . . . . . . . . 679 1 3,549 17,666 — 2 21,218Equity-based compensation expense . . . . . . . . . . . . . . . . . . . — — 53,012 — — — 53,012Issuance of convertible notes . . . . . . . . . . . . . . . . . . . . . . . . . — 110,655 110,655Sale of warrants . . . . . . . . . . . . . . . . . . . . . . . . . . . . . . . . . . . 133,830 133,830Purchase of convertible note hedge . . . . . . . . . . . . . . . . . . . . (114,110) (114,110)Components of comprehensive income:
Net income . . . . . . . . . . . . . . . . . . . . . . . . . . . . . . . . . . . — — — — — 723,748 723,748Foreign currency translation adjustment . . . . . . . . . . . . . — — — — 80,695 — 80,695Unrealized gain on fair value of derivative financial
instruments, net . . . . . . . . . . . . . . . . . . . . . . . . . . . . . . — — — — 6,994 — 6,994Unrealized gain on financial instruments, net . . . . . . . . — — — — 621 — 621Less: Reclassification adjustment for gains included in
earnings . . . . . . . . . . . . . . . . . . . . . . . . . . . . . . . . . . . . — — — — (7,514) — (7,514)Change in retiree medical benefit . . . . . . . . . . . . . . — — — — (1,186) — (1,186)
Total comprehensive income . . . . . . . . . . . . . . . . . 803,358
Balance at June 26, 2011 . . . . . . . . . . . . . . . . . . . . . . . . . . . . 123,579 $124 $1,531,465 $(1,761,591) $ 9,761 $2,690,086 $2,469,845
Balance at June 26, 2011 . . . . . . . . . . . . . . . . . . . . . . . . . . . . 123,579 $124 $1,531,465 $(1,761,591) $ 9,761 $2,690,086 $2,469,845Sale of common stock . . . . . . . . . . . . . . . . . . . . . . . . . . . . . . . 1,513 1 1,767 — — — 1,768Purchase of treasury stock . . . . . . . . . . . . . . . . . . . . . . . . . . . (21,946) (22) 158,673 (896,971) — — (738,320)Income tax benefit on equity-based compensation plans . . . . — — 1,510 — — — 1,510Reissuance of treasury stock . . . . . . . . . . . . . . . . . . . . . . . . . . 821 1 3,899 21,626 — — 25,526Equity-based compensation expense . . . . . . . . . . . . . . . . . . . — — 81,559 — — — 81,559Shares issued as acquisition consideration . . . . . . . . . . . . . . . 82,689 83 3,026,905 — — — 3,026,988Acquisition of convertible debt . . . . . . . . . . . . . . . . . . . . . . . . — — 137,783 — — — 137,783Exercise of convertible note . . . . . . . . . . . . . . . . . . . . . . . . . . — — (22) — — — (22)
Components of comprehensive income: . . . . . . . . . . . . .Net income . . . . . . . . . . . . . . . . . . . . . . . . . . . . . . . . . . . — — — — — 168,723 168,723Foreign currency translation adjustment . . . . . . . . . . . . . — — — — (37,332) — (37,332)Unrealized gain on fair value of derivative financial
instruments, net . . . . . . . . . . . . . . . . . . . . . . . . . . . . . . — — — — 6,959 — 6,959Unrealized gain on financial instruments, net . . . . . . . . — — — — 270 — 270Less: Reclassification adjustment for gains included in
earnings . . . . . . . . . . . . . . . . . . . . . . . . . . . . . . . . . . . . — — — — (9,075) — (9,075)Change in retiree medical benefit . . . . . . . . . . . . . . — — — — (4,401) — (4,401)
Total comprehensive income . . . . . . . . . . . . . . . . . — — — — — — 125,144
Balance at June 24, 2012 . . . . . . . . . . . . . . . . . . . . . . . . . . . . 186,656 187 4,943,539 (2,636,936) (33,818) 2,858,809 $5,131,781
See Notes to Consolidated Financial Statements
57

NOTES TO CONSOLIDATED FINANCIAL STATEMENTSJUNE 24, 2012
Note 1: Company and Industry Information
The Company designs, manufactures, markets, refurbishes and services semiconductor processingequipment used in the fabrication of integrated circuits. Semiconductor wafers are subjected to a complex seriesof process and preparation steps that result in the simultaneous creation of many individual integrated circuits.The Company leverages its expertise in the areas of etch and single-wafer clean to develop processing solutionsthat typically benefit its customers through lower defect rates, enhanced yields, faster processing time, andreduced cost. With the acquisition of Novellus Systems, Inc. (“Novellus”), in June, 2012, the Company expandedinto the areas of thin-film deposition and surface preparation, which, like single-wafer clean, are process stepsoften adjacent to etch.
The Company sells its products and services primarily to companies involved in the production ofsemiconductors in North America, Europe, Taiwan, Korea, Japan, and Asia Pacific.
The semiconductor industry is cyclical in nature and has historically experienced periodic downturns andupturns. Today’s leading indicators of changes in customer investment patterns, such as electronics demand,memory pricing, and foundry utilization rates, may not be any more reliable than in prior years. Demand for theCompany’s equipment can vary significantly from period to period as a result of various factors, including, butnot limited to, economic conditions, supply, demand, and prices for semiconductors, customer capacityrequirements, and the Company’s ability to develop and market competitive products. For these and otherreasons, the Company’s results of operations for fiscal years 2012, 2011, and 2010 may not necessarily beindicative of future operating results.
Note 2: Summary of Significant Accounting Policies
The preparation of financial statements, in conformity with U.S. Generally Accepted Accounting Principles(“GAAP”), requires management to make judgments, estimates, and assumptions that could affect the reportedamounts of assets and liabilities at the date of the financial statements and the reported amounts of revenue andexpenses during the reporting period. The Company bases its estimates and assumptions on historical experienceand on various other assumptions we believed to be applicable, and evaluated them on an on-going basis toensure they remain reasonable under current conditions. Actual results could differ significantly from thoseestimates.
Revenue Recognition: The Company recognizes revenue when persuasive evidence of an arrangementexists, delivery has occurred and title has passed or services have been rendered, the selling price is fixed ordeterminable, collection of the receivable is reasonably assured, and the Company has received customeracceptance, completed its system installation obligations, or is otherwise released from its installation orcustomer acceptance obligations. If terms of the sale provide for a lapsing customer acceptance period, theCompany recognizes revenue upon the expiration of the lapsing acceptance period or customer acceptance,whichever occurs first. If the practices of a customer do not provide for a written acceptance or the terms of saledo not include a lapsing acceptance provision, the Company recognizes revenue when it can be reliablydemonstrated that the delivered system meets all of the agreed-to customer specifications. In situations withmultiple deliverables, revenue is recognized upon the delivery of the separate elements to the customer and whenthe Company receives customer acceptance or is otherwise released from its customer acceptance obligations.Revenue from multiple-element arrangements is allocated among the separate elements based on their relativeselling prices, provided the elements have value on a stand-alone basis. Our sales arrangements do not include ageneral right of return. The maximum revenue recognized on a delivered element is limited to the amount that isnot contingent upon the delivery of additional items. Revenue related to sales of spare parts and system upgradekits is generally recognized upon shipment. Revenue related to services is generally recognized upon completionof the services requested by a customer order. Revenue for extended maintenance service contracts with a fixed
58

payment amount is recognized on a straight-line basis over the term of the contract. When goods or services havebeen delivered to the customer but all conditions for revenue recognition have not been met, the Company defersrevenue recognition until customer acceptance and records the deferred revenue and/or deferred costs of sales indeferred profit on the Consolidated Balance Sheet.
Inventory Valuation: Inventories are stated at the lower of cost or market using standard costs whichgenerally approximate actual costs on a first-in, first-out basis. The Company maintains a perpetual inventorysystem and continuously records the quantity on-hand and standard cost for each product, including purchasedcomponents, subassemblies, and finished goods. The Company maintains the integrity of perpetual inventoryrecords through periodic physical counts of quantities on hand. Finished goods are reported as inventories untilthe point of title transfer to the customer. Generally, title transfer is documented in the terms of sale. Transfer oftitle for shipments to Japanese customers generally occurs at time of customer acceptance.
Standard costs are reassessed as needed but annually at a minimum, and reflect acquisition costs.Acquisition costs are generally based on the most recent vendor contract prices for purchased parts, normalizedassembly and test labor utilization levels, methods of manufacturing, and normalized overhead. Manufacturinglabor and overhead costs are attributed to individual product standard costs at a level planned to absorb spendingat average utilization volumes. All intercompany profits related to the sales and purchases of inventory betweenthe Company’s legal entities are eliminated from its consolidated financial statements.
Management evaluates the need to record adjustments for impairment of inventory at least quarterly. TheCompany’s policy is to assess the valuation of all inventories including manufacturing raw materials,work-in-process, finished goods, and spare parts in each reporting period. Obsolete inventory or inventory inexcess of management’s estimated usage requirements over the next 12 to 36 months is written down to itsestimated market value if less than cost. Estimates of market value include, but are not limited to, management’sforecasts related to the Company’s future manufacturing schedules, customer demand, technological and/ormarket obsolescence, general semiconductor market conditions, possible alternative uses, and ultimate realizationof excess inventory. If future customer demand or market conditions are less favorable than the Company’sprojections, additional inventory write-downs may be required and would be reflected in cost of sales in theperiod the revision is made.
Warranty: Typically, the sale of semiconductor capital equipment includes providing parts and servicewarranty to customers as part of the overall price of the system. The Company provides standard warranties forits systems. The Company records a provision for estimated warranty expenses to cost of sales for each systemupon revenue recognition. The amount recorded is based on an analysis of historical activity which uses factorssuch as type of system, customer, geographic region, and any known factors such as tool reliability trends. Allactual or estimated parts and labor costs incurred in subsequent periods are charged to those established reserveson a system-by-system basis.
Actual warranty expenses are accounted for on a system-by-system basis and may differ from theCompany’s original estimates. While the Company periodically monitors the performance and cost of warrantyactivities, if actual costs incurred are different than its estimates, the Company may recognize adjustments toprovisions in the period in which those differences arise or are identified. In addition to the provision of standardwarranties, the Company offers customer-paid extended warranty services. Revenues for extended maintenanceand warranty services with a fixed payment amount are recognized on a straight-line basis over the term of thecontract. Related costs are recorded as incurred.
Equity-based Compensation — Employee Stock Purchase Plan (“ESPP”) and Employee Stock Plans: TheCompany recognizes the fair value of equity-based awards as employee compensation expense. The fair value ofthe Company’s restricted stock units was calculated based upon the fair market value of Company stock at thedate of grant. The fair value of the Company’s stock options and ESPP awards was estimated using a Black-Scholes option valuation model. This model requires the input of highly subjective assumptions, including
59

expected stock price volatility and the estimated life of each award. The fair value of equity-based awards isamortized over the vesting period of the award and the Company has elected to use the straight-line method ofamortization.
Income Taxes: Deferred income taxes reflect the net effect of temporary differences between the carryingamount of assets and liabilities for financial reporting purposes and the amounts used for income tax purposes, aswell as the tax effect of carryforwards. The Company records a valuation allowance to reduce its deferred taxassets to the amount that is more-likely-than-not to be realized. Realization of the Company’s net deferred taxassets is dependent on future taxable income. The Company believes it is more-likely-than-not that such assetswill be realized; however, ultimate realization could be negatively impacted by market conditions and othervariables not known or anticipated at the time. In the event that the Company determines that it would not be ableto realize all or part of its net deferred tax assets, an adjustment would be charged to earnings in the period suchdetermination is made. Likewise, if the Company later determined that it is more-likely-than-not that the deferredtax assets would be realized, then the previously provided valuation allowance would be reversed.
The Company calculates its current and deferred tax provision based on estimates and assumptions that candiffer from the actual results reflected in income tax returns filed during the subsequent year. Adjustments basedon filed returns are recorded when identified.
We recognize the benefit from a tax position only if it is more-likely-than-not that the position would besustained upon audit based solely on the technical merits of the tax position. Our policy is to include interest andpenalties related to unrecognized tax benefits as a component of income tax expense. We must make certainestimates and judgments in determining income tax expense for financial statement purposes. These estimatesand judgments occur in the calculation of tax credits, benefits, and deductions, and in the calculation of certaintax assets and liabilities, which arise from differences in the timing of recognition of revenue and expense for taxand financial statement purposes, as well as the interest and penalties relating to these uncertain tax positions.Significant changes to these estimates may result in an increase or decrease to our tax provision in a subsequentperiod.
In addition, the calculation of the Company’s tax liabilities involves uncertainties in the application ofcomplex tax regulations. The Company recognizes liabilities for uncertain tax positions based on the two-stepprocess prescribed within the interpretation. The first step is to evaluate the tax position for recognition bydetermining if the weight of available evidence indicates that it is more-likely-than-not that the position will besustained on tax audit, including resolution of related appeals or litigation processes, if any. The second steprequires the Company to estimate and measure the tax benefit as the largest amount that is more-likely-than-notto be realized upon ultimate settlement. It is inherently difficult and subjective to estimate such amounts, as thisrequires us to determine the probability of various possible outcomes. The Company reevaluates these uncertaintax positions on a quarterly basis. This evaluation is based on factors including, but not limited to, changes infacts or circumstances, changes in tax law, effectively settled issues under audit, and new audit activity. Such achange in recognition or measurement would result in the recognition of a tax benefit or an additional charge tothe tax provision in the period such determination is made.
Goodwill and Intangible Assets: Goodwill represents the amount by which the purchase price of a businesscombination exceeds the fair value of the net tangible and identifiable intangible assets acquired. The carryingvalue of goodwill is allocated to our reporting units. Goodwill and identifiable intangible assets with indefiniteuseful lives are tested for impairment at least annually. Intangible assets with estimable useful lives are amortizedover their respective estimated useful lives and reviewed for impairment whenever events or changes incircumstances indicate that the carrying amount of the intangible asset may not be recoverable and the carryingamount exceeds its fair value.
The Company reviews goodwill at least annually for impairment. Should certain events or indicators ofimpairment occur between annual impairment tests, the Company would perform an impairment test of goodwillat that date. In testing for a potential impairment of goodwill, the Company: (1) allocates goodwill to our
60

reporting units to which the acquired goodwill relates; (2) estimates the fair value of its reporting units; and(3) determines the carrying value (book value) of those reporting units. Prior to this allocation of the assets to thereporting units, the Company is required to assess long-lived assets for impairment. Furthermore, if the estimatedfair value of a reporting unit is less than the carrying value, the Company must estimate the fair value of allidentifiable assets and liabilities of that reporting unit, in a manner similar to a purchase price allocation for anacquired business. This can require independent valuations of certain internally generated and unrecognizedintangible assets such as in-process research and development and developed technology. Only after this process iscompleted can the amount of goodwill impairment, if any, be determined. Beginning with its fiscal year 2012goodwill impairment analysis, the Company adopted new accounting guidance that allowed it to first assessqualitative factors to determine whether it was necessary to perform a quantitative analysis. Under the revisedguidance, an entity no longer required to calculate the fair value of a reporting unit unless the entity determines,based on a qualitative assessment, that it is more-likely-than-not that its fair value is less than its carrying amount.
The process of evaluating the potential impairment of goodwill is subjective and requires significantjudgment at many points during the analysis. The Company determines the fair value of its reporting units byusing a weighted combination of both a market and an income approach, as this combination is deemed to be themost indicative of our fair value in an orderly transaction between market participants.
Under the market approach, the Company utilizes information regarding the reporting unit as well aspublicly available industry information to determine various financial multiples to value our reporting units.Under the income approach, the Company determines fair value based on estimated future cash flows of eachreporting unit, discounted by an estimated weighted-average cost of capital, which reflects the overall level ofinherent risk of a reporting unit and the rate of return an outside investor would expect to earn.
In estimating the fair value of a reporting unit for the purposes of the Company’s annual or periodicanalyses, the Company makes estimates and judgments about the future cash flows of its reporting units,including estimated growth rates and assumptions about the economic environment. Although the Company’scash flow forecasts are based on assumptions that are consistent with the plans and estimates it is using tomanage the underlying businesses, there is significant judgment involved in determining the cash flowsattributable to a reporting unit. In addition, the Company makes certain judgments about allocating shared assetsto the estimated balance sheets of our reporting units. The Company also considers its market capitalization andthat of its competitors on the date it performs the analysis. Changes in judgment on these assumptions andestimates could result in a goodwill impairment charge.
As a result, several factors could result in impairment of a material amount of the Company’s goodwillbalance in future periods, including, but not limited to: (1) weakening of the global economy, weakness in thesemiconductor equipment industry, or failure of the Company to reach its internal forecasts, which could impactthe Company’s ability to achieve its forecasted levels of cash flows and reduce the estimated discounted cashflow value of its reporting units; and (2) a decline in the Company’s stock price and resulting marketcapitalization, if the Company determines that the decline is sustained and indicates a reduction in the fair valueof the Company’s reporting units below their carrying value. Further, the value assigned to intangible assets,other than goodwill, is based on estimates and judgments regarding expectations such as the success and lifecycle of products and technology acquired. If actual product acceptance differs significantly from the estimates,the Company may be required to record an impairment charge to write down the asset to its realizable value.
Fiscal Year: The Company follows a 52/53-week fiscal reporting calendar, and its fiscal year ends on thelast Sunday of June each year. The Company’s most recent fiscal year ended on June 24, 2012 and included 52weeks. The fiscal years ended June 26, 2011 and June 27, 2010 also included 52 weeks. The Company’s nextfiscal year, ending on June 30, 2013 will include 53 weeks.
Principles of Consolidation: The consolidated financial statements include the accounts of the Company andits wholly-owned subsidiaries. All intercompany accounts and transactions have been eliminated inconsolidation.
61

Cash Equivalents and Short-Term Investments: Investments purchased with an original final maturity ofthree months or less are considered to be cash equivalents. The Company also invests in certain mutual funds,which include equity and fixed income securities, related to its obligations under its deferred compensation plan,and such investments are classified as trading securities on the consolidated balance sheets. All of the Company’sother short-term investments are classified as available-for-sale at the respective balance sheet dates. TheCompany accounts for its investment portfolio at fair value. Investments classified as trading securities arerecorded at fair value based upon quoted market prices. Differences between the cost and fair value of tradingsecurities are recognized as “Other income (expense)” in the Consolidated Statement of Operations. Theinvestments classified as available-for-sale are recorded at fair value based upon quoted market prices, andtemporary difference between the cost and fair value of available-for-sale securities is presented as a separatecomponent of accumulated other comprehensive income (loss). Unrealized losses on available-for-sale securitiesare charged against “Other income (expense)” when a decline in fair value is determined to be other-than-temporary. The Company considers several factors to determine whether a loss is other-than-temporary. Thesefactors include but are not limited to: (i) the extent to which the fair value is less than cost basis, (ii) the financialcondition and near term prospects of the issuer, (iii) the length of time a security is in an unrealized loss positionand (iv) the Company’s ability to hold the security for a period of time sufficient to allow for any anticipatedrecovery in fair value. The Company’s ongoing consideration of these factors could result in additionalimpairment charges in the future, which could adversely affect its results of operation. An other-than-temporaryimpairment is triggered when there is an intent to sell the security, it is more-likely-than-not that the security willbe required to be sold before recovery, or the security is not expected to recover the entire amortized cost basis ofthe security. Other-than-temporary impairments attributed to credit losses are recognized in the incomestatement. The specific identification method is used to determine the realized gains and losses on investments.
Allowance for Doubtful Accounts: The Company evaluates its allowance for doubtful accounts based on acombination of factors. In circumstances where specific invoices are deemed to be uncollectible, the Companyprovides a specific allowance for bad debt against the amount due to reduce the net recognized receivable to theamount it reasonably believes will be collected. The Company also provides allowances based on its write-offhistory.
Property and Equipment: Property and equipment is stated at cost. Equipment is depreciated by the straight-line method over the estimated useful lives of the assets, generally three to eight years. Furniture and fixtures aredepreciated by the straight-line method over the estimated useful lives of the assets, generally five years.Software is amortized by the straight-line method over the estimated useful lives of the assets, generally three tofive years. Buildings are depreciated by the straight-line method over the estimated useful lives of the assets,generally twenty-five to thirty-three years. Leasehold improvements are generally amortized by the straight-linemethod over the shorter of the life of the related asset or the term of the underlying lease. Amortization of capitalleases is included with depreciation expense.
Impairment of Long-Lived Assets (Excluding Goodwill and Intangibles): The Company routinely considerswhether indicators of impairment of long-lived assets are present. If such indicators are present, the Companydetermines whether the sum of the estimated undiscounted cash flows attributable to the assets is less than theircarrying value. If the sum is less, the Company recognizes an impairment loss based on the excess of the carryingamount of the assets over their respective fair values. Fair value is determined by discounted future cash flows,appraisals or other methods. If the assets determined to be impaired are to be held and used, the Companyrecognizes an impairment charge to the extent the present value of anticipated net cash flows attributable to theasset are less than the asset’s carrying value. The fair value of the asset then becomes the asset’s new carryingvalue, which the Company depreciates over the remaining estimated useful life of the asset. Assets to be disposedof are reported at the lower of the carrying amount or fair value.
Derivative Financial Instruments: In the normal course of business, the Company’s financial position isroutinely subjected to market risk associated with foreign currency exchange rate fluctuations. The Company’spolicy is to mitigate the effect of these exchange rate fluctuations on certain foreign currency denominated
62

business exposures. The Company has a policy that allows the use of derivative financial instruments to hedgeforeign currency exchange rate fluctuations on forecasted revenue and expenses transactions denominated inJapanese yen and Euros, and net monetary assets or liabilities denominated in various foreign currencies. TheCompany carries derivative financial instruments (derivatives) on the balance sheet at their fair values. TheCompany does not use derivatives for trading or speculative purposes. The Company does not believe that it isexposed to more than a nominal amount of credit risk in its interest rate and foreign currency hedges, ascounterparties are large, global and well-capitalized financial institutions. The Company’s exposures are in liquidcurrencies (Japanese yen, Swiss francs, Euros, Taiwanese dollars, and Great British pounds), so there is minimalrisk that appropriate derivatives to maintain the Company’s hedging program would not be available in thefuture.
To hedge foreign currency risks, the Company uses foreign currency exchange forward contracts, wherepossible and prudent. These forward contracts are valued using standard valuation formulas with assumptionsabout future foreign currency exchange rates derived from existing exchange rates and interest rates observed inthe market.
The Company considers its most current outlook in determining the level of foreign currency denominatedrevenue and expenses to hedge as cash flow hedges. The Company combines these forecasts with historicaltrends to establish the portion of its expected volume to be hedged. The revenue and expenses are hedged anddesignated as cash flow hedges to protect the Company from exposures to fluctuations in foreign currencyexchange rates. If the underlying forecasted transaction does not occur, or it becomes probable that it will notoccur, the related hedge gains and losses on the cash flow hedge are reclassified from accumulated othercomprehensive income (loss) to interest and other income (expense) on the consolidated statement of operationsat that time.
Guarantees: The Company has certain operating leases that contain provisions whereby the propertiessubject to the operating leases may be remarketed at lease expiration. The Company has guaranteed to the lessoran amount approximating the lessor’s investment in the property. The Company has recorded a liability forcertain guaranteed residual values related to these specific operating lease agreements. Also, the Company’sguarantees generally include certain indemnifications to its lessors under operating lease agreements forenvironmental matters, potential overdraft protection obligations to financial institutions related to one of theCompany’s subsidiaries, indemnifications to the Company’s customers for certain infringement of third-partyintellectual property rights by its products and services, and the Company’s warranty obligations under sales ofits products.
Foreign Currency Translation: The Company’s non-U.S. subsidiaries that operate in a local currencyenvironment, where that local currency is the functional currency, primarily generate and expend cash in theirlocal currency. Billings and receipts for their labor and services are primarily denominated in the local currency,and the workforce is paid in local currency. Accordingly, all balance sheet accounts of these local functionalcurrency subsidiaries are translated at the fiscal period-end exchange rate, and income and expense accounts aretranslated using average rates in effect for the period, except for costs related to those balance sheet items that aretranslated using historical exchange rates. The resulting translation adjustments are recorded as cumulativetranslation adjustments and are a component of accumulated other comprehensive income (loss). Translationadjustments are recorded in other income (expense), net, where the U.S. dollar is the functional currency.
Note 3: Recent Accounting Pronouncements
In June 2011, the Financial Accounting Standards Board (“FASB”) issued new authoritative guidance thatincreases the prominence of items reported in other comprehensive income (“OCI”) by eliminating the option topresent components of OCI as part of the statement of changes in stockholders’ equity. The amendments in thisstandard require that all non-owner changes in stockholders’ equity be presented either in a single continuousstatement of comprehensive income or in two separate but consecutive statements. This guidance does not affect
63

the underlying accounting for components of OCI, but will change the presentation of the Company’s financialstatements. The Company will adopt this authoritative guidance retrospectively in the first quarter of its fiscalyear 2013.
In September 2011, the FASB issued revised guidance intended to simplify how an entity tests goodwill forimpairment. The amendment will allow an entity to first assess qualitative factors to determine whether it isnecessary to perform the two-step quantitative goodwill impairment test. An entity no longer will be required tocalculate the fair value of a reporting unit unless the entity determines, based on a qualitative assessment, that itis more-likely-than-not that its fair value is less than its carrying amount. The Company adopted this guidanceduring fiscal year 2012 and it did not have a significant impact on the results of the Company’s annual goodwillimpairment assessment.
Note 4: Financial Instruments
Fair Value
The Company defines fair value as the price that would be received from selling an asset or paid to transfera liability in an orderly transaction between market participants at the measurement date. When determining thefair value measurements for assets and liabilities required or permitted to be recorded at fair value, the Companyconsiders the principal or most advantageous market in which it would transact, and it considers assumptions thatmarket participants would use when pricing the asset or liability.
A fair value hierarchy has been established that prioritizes the inputs to valuation techniques used tomeasure fair value. The level of an asset or liability in the hierarchy is based on the lowest level of input that issignificant to the fair value measurement. Assets and liabilities carried at fair value are classified and disclosed inone of the following three categories:
Level 1: Valuations based on quoted prices in active markets for identical assets or liabilities with sufficientvolume and frequency of transactions.
Level 2: Valuations based on observable inputs other than Level 1 prices such as quoted prices for similarassets or liabilities, quoted prices in markets that are not active, or model-derived valuations techniques for whichall significant inputs are observable in the market or can be corroborated by, observable market data forsubstantially the full term of the assets or liabilities.
Level 3: Valuations based on unobservable inputs to the valuation methodology that are significant to themeasurement of fair value of assets or liabilities and based on non-binding, broker-provided price quotes andmay not have been corroborated by observable market data.
64

The following table sets forth the Company’s financial assets and liabilities measured at fair value on arecurring basis:
Fair Value Measurement at June 24, 2012
Total
Quoted Prices inActive Markets for
Identical Assets(Level 1)
Significant OtherObservable Inputs
(Level 2)
SignificantUnobservable
Inputs(Level 3)
(In thousands)
AssetsShort-Term InvestmentsMoney Market Funds . . . . . . . . . . . . . . . . . . . . . $1,318,812 $1,318,812 $ — $—Municipal Notes and Bonds . . . . . . . . . . . . . . . . 322,567 — 322,567 —US Treasury and Agencies . . . . . . . . . . . . . . . . . 137,446 130,624 6,822 —Government-Sponsored Enterprises . . . . . . . . . . 123,268 — 123,268 —Foreign Government Bonds . . . . . . . . . . . . . . . . 6,358 — 6,358 —Corporate Notes and Bonds . . . . . . . . . . . . . . . . 768,901 164,885 604,016 —Mortgage Backed Securities - Residential . . . . . 25,972 — 25,972 —Mortgage Backed Securities - Commercial . . . . 84,853 — 84,853 —
Total Short-Term Investments $2,788,177 $1,614,321 $1,173,856 $—Equities . . . . . . . . . . . . . . . . . . . . . . . . . . . . . . . . 5,913 5,913 — —Mutual Funds . . . . . . . . . . . . . . . . . . . . . . . . . . . 17,754 17,754 — —Derivatives Assets . . . . . . . . . . . . . . . . . . . . . . . 5,020 — 5,020 —
Total . . . . . . . . . . . . . . . . . . . . . . . . . . . . . . . . . . $2,816,864 $1,637,988 $1,178,876 $—
LiabilitiesDerivative liabilities . . . . . . . . . . . . . . . . . . . . . . $ 4,529 $ — $ 4,328 $201
The amounts in the table above are reported in the consolidated balance sheet as of June 24, 2012 asfollows:
Reported As:
Total (Level 1) (Level 2) (Level 3)
(In thousands)
Cash Equivalents . . . . . . . . . . . . . . . . . . . . . . . $1,325,361 $1,318,812 $ 6,549 $—Short-Term Investments . . . . . . . . . . . . . . . . . 1,297,931 130,624 1,167,307 —Restricted Cash and Investments . . . . . . . . . . 164,885 164,885 — —Prepaid Expenses and Other Current
Assets . . . . . . . . . . . . . . . . . . . . . . . . . . . . . . 5,020 — 5,020 —Other Assets . . . . . . . . . . . . . . . . . . . . . . . . . . . 23,667 23,667 — —
Total . . . . . . . . . . . . . . . . . . . . . . . . . . . . . . . . . $2,816,864 $1,637,988 $1,178,876 $—
Accrued Expenses and Other CurrentLiabilities . . . . . . . . . . . . . . . . . . . . . . . . . . . $ 4,529 $ — $ 4,328 $201
65

The following table sets forth the Company’s financial assets and liabilities measured at fair value on arecurring basis:
Fair Value Measurement at June 26, 2011
Total
Quoted Pricesin Active Markets
for Identical Assets(Level 1)
Significant OtherObservable Inputs
(Level 2)
SignificantUnobservable
Inputs(Level 3)
(In thousands)
AssetsShort-Term InvestmentsMoney Market Funds . . . . . . . . . . . . . . . . . . . . . $1,300,098 $1,300,098 $ — $—Municipal Notes and Bonds . . . . . . . . . . . . . . . . 321,339 — 321,339 —US Treasury and Agencies . . . . . . . . . . . . . . . . . 8,496 8,496 — —Government-Sponsored Enterprises . . . . . . . . . . 19,868 — 19,868 —Foreign Government Bonds . . . . . . . . . . . . . . . . 1,005 — 1,005 —Corporate Notes and Bonds . . . . . . . . . . . . . . . . 382,432 164,885 217,547 —Mortgage Backed Securities - Residential . . . . . 2,633 — 2,633 —Mortgage Backed Securities - Commercial . . . . 60,729 — 60,729 —
Total Short-Term Investments $2,096,600 $1,473,479 $623,121 $—Equities . . . . . . . . . . . . . . . . . . . . . . . . . . . . . . . 7,443 7,443 — —Mutual Funds . . . . . . . . . . . . . . . . . . . . . . . . . . 19,467 19,467 — —Derivatives Assets . . . . . . . . . . . . . . . . . . . . . . . 1,994 — 1,994 —
Total . . . . . . . . . . . . . . . . . . . . . . . . . . . . . . . . . . $2,125,504 $1,500,389 $625,115 $—
LiabilitiesDerivative liabilities . . . . . . . . . . . . . . . . . . . . . . $ 1,924 $ — $ 1,924 $—
The amounts in the table above are reported in the consolidated balance sheet as of June 26, 2011 asfollows:
Reported As:
Total (Level 1) (Level 2) (Level 3)
(In thousands)
Cash Equivalents . . . . . . . . . . . . . . . . . . . . . . . . $1,301,600 $1,300,098 $ 1,502 $—Short-Term Investments . . . . . . . . . . . . . . . . . . 630,115 8,496 621,619 —Restricted Cash and Investments . . . . . . . . . . . 164,885 164,885 — —Prepaid Expenses and Other Current
Assets . . . . . . . . . . . . . . . . . . . . . . . . . . . . . . . . 1,994 — 1,994 —Other Assets . . . . . . . . . . . . . . . . . . . . . . . . . . . . 26,910 26,910 — —
Total . . . . . . . . . . . . . . . . . . . . . . . . . . . . . . . . . . . $2,125,504 $1,500,389 $625,115 $—
Accrued Expenses and Other CurrentLiabilities . . . . . . . . . . . . . . . . . . . . . . . . . . . . . $ 1,924 $ — $ 1,924 $—
The Company’s primary financial instruments include its cash, cash equivalents, short-term investments,restricted cash and investments, long-term investments, accounts receivable, accounts payable, long-term debtand capital leases, and foreign currency related derivatives. The estimated fair value of cash, accounts receivableand accounts payable approximates their carrying value due to the short period of time to their maturities. Theestimated fair values of capital lease obligations approximate their carrying value as the substantial majority ofthese obligations have interest rates that adjust to market rates on a periodic basis. Refer to Note 13 of the Notesto the Condensed Consolidated Financial Statements for additional information regarding the fair value of theCompany’s convertible notes.
66

Investments
The acquisition of Novellus during the quarter ended June 24, 2012 resulted in increases to cash and cashequivalents, short-term investments, and restricted cash and investments of $419 million, $641 million, and $1million, respectively. The following tables summarize the Company’s investments (in thousands):
June 24, 2012 June 26, 2011
CostUnrealized
GainUnrealized
(Loss) Fair Value CostUnrealized
GainUnrealized
(Loss) Fair Value
Cash . . . . . . . . . . . . . . . . . . . . . $ 240,841 $ — $ — $ 240,841 $ 190,903 $ — $ — $ 190,903Fixed Income Money Market
Funds . . . . . . . . . . . . . . . . . . 1,318,812 — — 1,318,812 1,300,098 — — 1,300,098Municipal Notes and Bonds . . 321,001 1,574 (8) 322,567 319,913 1,510 (84) 321,339US Treasury and Agencies . . . 137,516 43 (113) 137,446 8,462 34 — 8,496Government-Sponsored
Enterprises . . . . . . . . . . . . . . 123,269 67 (68) 123,268 19,864 6 (2) 19,868Foreign Government Bonds . . 6,315 43 — 6,358 1,004 1 — 1,005Corporate Notes and Bonds . . 767,847 1,443 (389) 768,901 380,992 1,498 (58) 382,432Mortgage Backed Securities -
Residential . . . . . . . . . . . . . . 25,857 121 (6) 25,972 2,521 144 (32) 2,633Mortgage Backed Securities -
Commercial . . . . . . . . . . . . . 84,682 555 (384) 84,853 60,639 277 (187) 60,729
Total Cash and Short-Term Investments . . $3,026,140 $3,846 $ (968) $3,029,018 $2,284,396 $3,470 $ (363) $2,287,503
Publicly Traded EquitySecurities . . . . . . . . . . . . . . . $ 9,320 $ — $(3,407) $ 5,913 $ 9,320 $ — $(1,877) $ 7,443
Private Equity Securities . . . . . 5,000 — — 5,000 $ — $ — $ — —Mutual Funds . . . . . . . . . . . . . 17,459 366 (71) 17,754 17,975 1,492 — 19,467
Total FinancialInstruments . . . . $3,057,919 $4,212 $(4,446) $3,057,685 $2,311,691 $4,962 $(2,240) $2,314,413
As ReportedCash and Cash Equivalents . . . $1,564,752 $ — $ — $1,564,752 $1,492,132 $ — $ — $1,492,132Short-Term Investments . . . . . 1,295,053 3,846 (968) 1,297,931 627,008 3,470 (363) 630,115Restricted Cash and
Investments . . . . . . . . . . . . . 166,335 — — 166,335 165,256 — — 165,256Other Assets . . . . . . . . . . . . . . 31,779 366 (3,478) 28,667 27,295 1,492 (1,877) 26,910
Total . . . . . . . . $3,057,919 $4,212 $(4,446) $3,057,685 $2,311,691 $4,962 $(2,240) $2,314,413
The Company accounts for its investment portfolio at fair value. Realized gains (losses) for investment salesand pay-downs are specifically identified. Management assesses the fair value of investments in debt securitiesthat are not actively traded through consideration of interest rates and their impact on the present value of thecash flows to be received from the investments. The Company also considers whether changes in the creditratings of the issuer could impact the assessment of fair value. Net realized gains (losses) on investmentsincluded other-than-temporary impairment charges of $1.7 million, $0 million and $0.9 million in fiscal years2012, 2011 and 2010, respectively. Additionally, gross realized gains/(losses) from sales of investments wereapproximately $1.4 million and $(1.0) million in fiscal year 2012, $0.7 million and $(0.3) million in fiscal year2011, $0.8 million and $(0.2) million in fiscal year 2010, respectively.
67

The following is an analysis of the Company’s fixed income securities in unrealized loss positions (inthousands):
June 24, 2012
UNREALIZED LOSSES UNREALIZED LOSSESLESS THAN 12 MONTHS 12 MONTHS OR GREATER TOTAL
Fair Value Unrealized Fair Value Unrealized Fair Value Unrealized
Fixed Income SecuritiesMunicipal Notes and Bonds . . . $ 28,970 $ (8) $ — $— $ 28,970 $ (8)US Treasury and Agencies . . . . $ 72,260 $(113) — — 72,260 (113)Government-Sponsored
Enterprises . . . . . . . . . . . . . . 83,962 (68) — — 83,962 (68)Corporate Notes and Bonds . . . 205,979 (377) 2,378 (12) 208,357 (389)Mortgage Backed Securities -
Residential . . . . . . . . . . . . . . 4,969 (2) 175 (4) 5,144 (6)Mortgage Backed Securities -
Commercial . . . . . . . . . . . . . 43,445 (345) 1,596 (39) 45,041 (384)
Total Fixed Income . . . . . . . . . . . . $439,585 $(913) $4,149 $ (55) $443,734 $(968)
The amortized cost and fair value of cash equivalents, short-term investments, and restricted cash andinvestments with contractual maturities are as follows:
June 24, 2012 June 26, 2011
Cost
EstimatedFair
Value Cost
EstimatedFair
Value
(in thousands)
Due in less than one year . . . . . . . . . . . . . . . $1,819,712 $1,820,089 $1,606,390 $1,606,925Due in more than one year . . . . . . . . . . . . . 965,587 968,088 487,103 489,675
$2,785,299 $2,788,177 $2,093,493 $2,096,600
Management has the ability, if necessary, to liquidate any of its cash equivalents and short-term investmentsin order to meet the Company’s liquidity needs in the next 12 months. Accordingly, those investments withcontractual maturities greater than one year from the date of purchase nonetheless are classified as short-term onthe accompanying Consolidated Balance Sheets.
Derivative Instruments and Hedging
The Company carries derivative financial instruments (“derivatives”) on its Consolidated Balance Sheets attheir fair values. The Company enters into foreign currency forward contracts with financial institutions with theprimary objective of reducing volatility of earnings and cash flows related to foreign currency exchange ratefluctuations. The counterparties to these foreign currency forward contracts are large global financial institutionsthat the Company believes are creditworthy, and therefore, we do not consider the risk of counterpartynonperformance to be material.
Cash Flow Hedges
In the normal course of business, the Company’s financial position is routinely subjected to market riskassociated with foreign currency exchange rate fluctuations on non-US dollar transactions or cash flows,primarily from Japanese yen-denominated revenues and Euro-denominated expenses. The Company’s policy isto mitigate the foreign exchange risk arising from the fluctuations in the value of these non-US dollardenominated transactions or cash flows through a foreign currency cash flow hedging program, using foreign
68

currency forward contracts that generally expire within 12 months and no later than 24 months. These foreigncurrency forward contracts are designated as cash flow hedges and are carried on the Company’s balance sheet atfair value with the effective portion of the contracts’ gains or losses included in accumulated other comprehensiveincome (loss) and subsequently recognized in revenue in the same period the hedged revenue is recognized.
At inception and at each quarter end, hedges are tested prospectively and retrospectively for effectivenessusing regression analysis. Changes in the fair value of foreign currency forward contracts due to changes in timevalue are excluded from the assessment of effectiveness and are recognized in revenue in the current period. Thechange in time value related to these contracts was not material for all reported periods. To qualify for hedgeaccounting, the hedge relationship must meet criteria relating both to the derivative instrument and the hedgeditem. These criteria include identification of the hedging instrument, the hedged item, the nature of the risk beinghedged and how the hedging instrument’s effectiveness in offsetting the exposure to changes in the hedgeditem’s fair value or cash flows will be measured. There were no gains or losses during the twelve months endedJune 24, 2012 or June 26, 2011 associated with ineffectiveness or forecasted transactions that failed to occur.
To receive hedge accounting treatment, all hedging relationships are formally documented at the inceptionof the hedge and the hedges must be tested to demonstrate an expectation of providing highly effective offsettingchanges to future cash flows on hedged transactions. When derivative instruments are designated and qualify aseffective cash flow hedges, the Company recognizes effective changes in the fair value of the hedging instrumentwithin accumulated other comprehensive income (loss) until the hedged exposure is realized. Consequently, withthe exception of excluded time value and hedge ineffectiveness recognized, the Company’s results of operationsare not subject to fluctuation as a result of changes in the fair value of the derivative instruments. If hedges arenot highly effective or if the Company does not believe that the underlying hedged forecasted transactions willoccur, the Company may not be able to account for its derivative instruments as cash flow hedges. If this were tooccur, future changes in the fair values of the Company’s derivative instruments would be recognized inearnings. Additionally, related amounts previously recorded in “Other comprehensive income” would bereclassified to income immediately. At June 24, 2012, the Company had losses of $0.2 million accumulated inOther Comprehensive Income, which it expects to reclassify from Other Comprehensive Income into earningsover the next 12 months.
Balance Sheet Hedges
The Company also enters into foreign currency forward contracts to hedge fluctuations associated with foreigncurrency denominated monetary assets and liabilities, primarily intercompany receivables and payables. Theseforeign currency forward contracts are not designated for hedge accounting treatment. Therefore, the change in fairvalue of these derivatives is recorded as a component of other income (expense) and offsets the change in fair valueof the foreign currency denominated assets and liabilities, recorded in other income (expense).
As of June 24, 2012, the Company had the following outstanding foreign currency forward contracts thatwere entered into under its cash flow and balance sheet hedge program:
Derivatives Designated asHedging Instruments:
Derivatives Not Designated asHedging Instruments:
(in thousands)
Foreign Currency Forward ContractsSell Japanese Yen . . . . . . . . . . . . . . $102,418 $ 73,641Buy Japanese Yen . . . . . . . . . . . . . . — 30,280Sell Swiss Francs . . . . . . . . . . . . . . . — 4,210Buy Swiss Francs . . . . . . . . . . . . . . — 237,259Buy Great British Pounds . . . . . . . . — 4,452Buy Taiwanese Dollars . . . . . . . . . . — 86,800Sell Euro . . . . . . . . . . . . . . . . . . . . . — 18,808Buy Euro . . . . . . . . . . . . . . . . . . . . . 67,876 30,615
$170,294 $486,065
69

The fair value of derivatives instruments in the Company’s consolidated balance sheet as of June 24, 2012was as follows:
Fair Value of Derivative Instruments
Asset Derivatives Liability Derivatives
Balance SheetLocation Fair Value
Balance SheetLocation Fair Value
(in thousands)
Derivatives designated as hedginginstruments:
Foreign exchange forwardcontracts . . . . . . . . . . . . . . . . . . .
Prepaid expenseand other assets $3,358 Accrued liabilities $(3,403)
Derivatives not designated as hedginginstruments:
Foreign exchange forwardcontracts . . . . . . . . . . . . . . . . . . .
Prepaid expenseand other assets 1,662 Accrued liabilities (925)
Total derivatives $5,020 $(4,328)
The fair value of derivatives instruments in the Company’s consolidated balance sheet as of June 26, 2011was as follows:
Fair Value of Derivative Instruments
Asset Derivatives Liability Derivatives
Balance SheetLocation Fair Value
Balance SheetLocation Fair Value
(in thousands)
Derivatives designated as hedginginstruments:
Foreign exchange forwardcontracts . . . . . . . . . . . . . . . . . . .
Prepaid expenseand other assets $1,881 Accrued liabilities $(1,142)
Derivatives not designated as hedginginstruments:
Foreign exchange forwardcontracts . . . . . . . . . . . . . . . . . . .
Prepaid expenseand other assets 113 Accrued liabilities (782)
Total derivatives $1,994 $(1,924)
70

The effect of derivative instruments designated as cash flow hedges on the Company’s consolidatedstatements of operations was as follows:
Twelve Months Ended June 24, 2012
DerivativesDesignated as
HedgingInstruments:
Gain (Loss) Recognized(Effective Portion) (1)
Gain (Loss)Recognized
(Effective Portion) (2)Gain (Loss) Recognized(Ineffective Portion) (3)
Gain (Loss) Recognized(Excluded from
Effectiveness Testing) (4)(in thousands)
Foreignexchangeforwardcontracts . . . . $(9,342) $(8,549) $— $796
Twelve Months Ended June 26, 2011
DerivativesDesignated as
HedgingInstruments:
Gain (Loss) Recognized(Effective Portion) (1)
Gain (Loss)Recognized
(Effective Portion) (2)Gain (Loss) Recognized(Ineffective Portion) (3)
Gain (Loss) Recognized(Excluded
from Effectiveness Testing) (4)(in thousands)
Foreignexchangeforwardcontracts . . . . $(5,134) $(5,716) $— $516
(1) Amount recognized in other comprehensive income (loss) (effective portion).(2) Amount of gain (loss) reclassified from accumulated other comprehensive income into income (loss)
(effective portion) located in revenue.(3) Amount of gain (loss) recognized in income on derivative (ineffective portion) located in other income
(expense), net.(4) Amount of gain (loss) recognized in income on derivative (amount excluded from effectiveness testing)
located in other income (expense), net.
The effect of derivative instruments not designated as cash flow hedges on the Company’s consolidatedstatement of operations was as follows:
Twelve Months Ended
June 24, 2012 June 26, 2011
Derivatives Not Designated as Hedging Instruments:
Gain (Loss)Recognized (5)
Gain (Loss)Recognized (5)
(in thousands)
Foreign exchange forward contracts . . . . . . . . . . . . $(39,629) $55,362
(5) Amount of gain (loss) recognized in income located in other income (expense), net.
Concentrations of Credit Risk
Financial instruments that potentially subject the Company to concentrations of credit risk consistprincipally of cash and cash equivalents, short term investments, restricted cash and investments, trade accountsreceivable, and derivative financial instruments used in hedging activities. Cash is placed on deposit in largeglobal financial institutions. Such deposits may be in excess of insured limits. Management believes that thefinancial institutions that hold the Company’s cash are creditworthy and, accordingly, minimal credit risk existswith respect to these balances.
The Company’s available-for-sale securities must have a minimum rating of A2 / A at the time of purchase,as rated by two of the following three rating agencies: Moody’s, Standard & Poor’s (S&P), or Fitch. To ensurediversification and minimize concentration, the Company’s policy limits the amount of credit exposure with anyone financial institution or commercial issuer.
71

The Company is exposed to credit losses in the event of nonperformance by counterparties on the foreigncurrency forward contracts that are used to mitigate the effect of exchange rate fluctuations and on contractsrelated to structured share repurchase agreements. These counterparties are large global financial institutions andto date, no such counterparty has failed to meet its financial obligations to the Company.
Credit risk evaluations, including trade references, bank references and Dun & Bradstreet ratings, areperformed on all new customers and the Company monitors its customers’ financial statements and paymentperformance. In general, the Company does not require collateral on sales.
As of June 24, 2012, three customers accounted for approximately 24%, 17%, and 11% of accountsreceivable. As of June 26, 2011, three customers accounted for approximately 17%, 14%, and 10% of accountsreceivable.
Note 5: Inventories
Inventories are stated at the lower of cost (first-in, first-out method) or market. Shipments to Japanesecustomers, to whom title does not transfer until customer acceptance, are classified as inventory and carried atcost until title transfers. The acquisition of Novellus during the quarter ended June 24, 2012 resulted in anincrease of $309 million in inventory on the date of acquisition. Inventories consist of the following:
2012 2011
(in thousands)
Raw materials . . . . . . . . . . . . . . . . . . . . . . . . . . . . . . . . . . $342,283 $212,979Work-in-process . . . . . . . . . . . . . . . . . . . . . . . . . . . . . . . . 118,566 69,013Finished goods . . . . . . . . . . . . . . . . . . . . . . . . . . . . . . . . . . 172,004 114,615
$632,853 $396,607
Note 6: Property and Equipment
The acquisition of Novellus during the quarter ended June 24, 2012 resulted in an increase of $289 millionin property and equipment on the date of acquisition. Property and equipment, net, consist of the following:
June 24, June 26,2012 2011
(in thousands)
Manufacturing, engineering and office equipment . . . . $ 468,739 $ 345,684Computer equipment and software . . . . . . . . . . . . . . . . . 104,919 95,770Land . . . . . . . . . . . . . . . . . . . . . . . . . . . . . . . . . . . . . . . . 65,228 14,758Buildings . . . . . . . . . . . . . . . . . . . . . . . . . . . . . . . . . . . . . 231,536 65,429Leasehold improvements . . . . . . . . . . . . . . . . . . . . . . . . 54,327 55,833Furniture and fixtures . . . . . . . . . . . . . . . . . . . . . . . . . . . 19,770 15,258
944,519 592,732Less: accumulated depreciation and amortization . . . . . (359,923) (322,274)
$ 584,596 $ 270,458
Depreciation expense, including amortization of capital leases, during fiscal years 2012, 2011, and 2010 was$74.0 million, $54.0 million, $47.8 million, respectively.
The Company’s long lived assets held for use, including property, plant, and equipment and intangibleassets, are measured at fair value when an impairment exists. Long lived assets held for use are assessed forimpairment when events occur that indicate a potential impairment. The Company did not record impairments oflong lived assets held for use for the years ended June 24, 2012 or June 26, 2011.
72

Note 7: Accrued Expenses and Other Current Liabilities
The acquisition of Novellus during the quarter ended June 24, 2012 resulted in an increase of $197 millionin accrued expenses and other current liabilities on the date of acquisition. Accrued expenses and other currentliabilities consist of the following:
June 24, June 26,2012 2011
(in thousands)
Accrued compensation . . . . . . . . . . . . . . . . . . . . . . . . . . . $274,165 $206,313Warranty reserves . . . . . . . . . . . . . . . . . . . . . . . . . . . . . . . 63,988 40,951Income and other taxes payable . . . . . . . . . . . . . . . . . . . . 24,745 51,183Other . . . . . . . . . . . . . . . . . . . . . . . . . . . . . . . . . . . . . . . . . 129,280 60,309
$492,178 $358,756
Note 8: Other Income (Expense), Net
The significant components of other income (expense), net, are as follows:
Year Ended
June 24, June 26, June 27,2012 2011 2010
(in thousands)
Interest income . . . . . . . . . . . . . . . . . . . . . . . . . . . . . . . . . $ 12,141 $ 9,890 $ 8,682Interest expense . . . . . . . . . . . . . . . . . . . . . . . . . . . . . . . . (38,962) (5,380) (994)Gains (losses) on deferred compensation plan related
assets . . . . . . . . . . . . . . . . . . . . . . . . . . . . . . . . . . . . . . . (914) 5,682 (84)Foreign exchange gains (losses) . . . . . . . . . . . . . . . . . . . . (397) (11,085) (103)Other, net . . . . . . . . . . . . . . . . . . . . . . . . . . . . . . . . . . . . . (5,183) (2,516) (2,770)
$(33,315) $ (3,409) $ 4,731
The increase in interest expense during fiscal year 2012 as compared with fiscal year 2011 and during fiscalyear 2011 as compared with fiscal year 2010 was due to the issuance of the 2016 and 2018 Notes (as described inNote 13) during May 2011.
73

Note 9: Net Income Per Share
Basic net income per share is computed by dividing net income by the weighted-average number ofcommon shares outstanding during the period. Diluted net income per share is computed using the treasury stockmethod, for dilutive stock options, RSUs, and convertible notes. The following table reconciles the numeratorsand denominators of the basic and diluted computations for net income per share.
Year Ended
June 24, June 26, June 27,2012 2011 2010
(in thousands, except per share data)
Numerator:Net income . . . . . . . . . . . . . . . . . . . . . . . . . . . . . . $168,723 $723,748 $346,669
Denominator:Basic average shares outstanding . . . . . . . . . . . . . 124,176 123,529 126,933Effect of potential dilutive securities:
Employee stock plans . . . . . . . . . . . . . . . . . . 910 1,490 1,193Convertible notes . . . . . . . . . . . . . . . . . . . . . 147
Diluted average shares outstanding . . . . . . . . . . . 125,233 125,019 128,126
Net income per share - basic . . . . . . . . . . . . . . . . . . . . $ 1.36 $ 5.86 $ 2.73
Net income per share - diluted . . . . . . . . . . . . . . . . . . . $ 1.35 $ 5.79 $ 2.71
For purposes of computing diluted net income (loss) per share, weighted-average common shares do notinclude potentially dilutive securities that are anti-dilutive under the treasury stock method. The followingpotentially dilutive securities were excluded:
Year Ended
June 24, June 26, June 27,2012 2011 2010
(in thousands)
Number of options and RSUs excluded . . . . . . . . . . . . . . . . . 382 241 577
Diluted shares outstanding include only the effect of the 2041 Notes. Diluted shares outstanding do notinclude any effect resulting from warrants, assumed conversion of the notes, or note hedges associated with theCompany’s 2016 or 2018 Notes (as described in Note 13) as their impact would have been anti-dilutive.
Note 10: Comprehensive Income (Loss)
The components of comprehensive income (loss), on an after-tax basis where applicable, are as follows:
Year Ended
June 24, June 26, June 27,2012 2011 2010
(in thousands)
Net income . . . . . . . . . . . . . . . . . . . . . . . . . . . . . . . . . . . . . . . . . . $168,723 $723,748 $346,669Foreign currency translation adjustment . . . . . . . . . . . . . . . . . . . (37,332) 80,695 (13,868)Unrealized gain (loss) on fair value of derivative financial
instruments, net . . . . . . . . . . . . . . . . . . . . . . . . . . . . . . . . . . . . 6,959 6,994 (414)Unrealized gain on financial instruments, net . . . . . . . . . . . . . . . 270 621 2,062Reclassification adjustment for loss (gain) included in
earnings . . . . . . . . . . . . . . . . . . . . . . . . . . . . . . . . . . . . . . . . . . (9,075) (7,514) (645)Postretirement benefit plan adjustment . . . . . . . . . . . . . . . . . . . . (4,401) (1,186) (4,162)
Comprehensive income . . . . . . . . . . . . . . . . . . . . . . . . . . . . . . . . $125,144 $803,358 $329,642
74

The balance of accumulated other comprehensive income (loss), on an after-tax basis where applicable, is asfollows:
June 24, June 26,2012 2011
(in thousands)
Accumulated foreign currency translation adjustment . . . . $(22,481) $14,852Accumulated unrealized gain (loss) on derivative financial
instruments . . . . . . . . . . . . . . . . . . . . . . . . . . . . . . . . . . . . (212) 581Accumulated unrealized gain on financial instruments . . . . (308) 744Postretirement benefit plan adjustment . . . . . . . . . . . . . . . . (10,817) (6,416)
Accumulated other comprehensive income (loss) . . . . . . . . $(33,818) $ 9,761
Note 11: Equity-Based Compensation Plans
The Company has adopted stock plans that provide for the grant to employees of equity-based awards,including stock options and restricted stock units (“RSUs”), of Lam Research Common Stock. In addition, theseplans permit the grant of nonstatutory equity-based awards to consultants and outside directors. An option is aright to purchase the Company’s stock at a set price. An RSU award is an agreement to issue shares of theCompany’s stock at the time of vesting. Pursuant to the plans, the equity-based award exercise price isdetermined by the Board of Directors or its designee, the plan administrator, but in no event will the exerciseprice for any option be less than the fair market value of the Company’s Common Stock on the date of grant.Equity-based awards granted under the plans vest over a period determined by the Board of Directors or the planadministrator, typically over a period of two years or less. The Company also has an ESPP that allows employeesto purchase shares of its Common Stock through payroll deduction at a discounted price. A summary of stockplan transactions is as follows:
Options Outstanding Restricted Stock Units Outstanding
Number ofShares
Weighted-AverageExercise
PriceNumber of
Shares
Weighted-Average
Fair Market Valueat Grant
June 28, 2009 . . . . . . . . . . . . . . . . . . . . . . . . . . . . . . . . . . . 1,590,316 $22.10 2,520,063 $30.32Granted . . . . . . . . . . . . . . . . . . . . . . . . . . . . . . . . . . . . . . . — $ — 1,383,941 $34.71Exercised . . . . . . . . . . . . . . . . . . . . . . . . . . . . . . . . . . . . . . (642,861) $20.91Canceled . . . . . . . . . . . . . . . . . . . . . . . . . . . . . . . . . . . . . . (62,030) $41.36 (197,549) $33.23Vested restricted stock . . . . . . . . . . . . . . . . . . . . . . . . . . . (965,693) $35.29
June 27, 2010 . . . . . . . . . . . . . . . . . . . . . . . . . . . . . . . . . . . 885,425 $21.61 2,740,762 $30.50Granted . . . . . . . . . . . . . . . . . . . . . . . . . . . . . . . . . . . . . . . — $ — 922,210 $50.11Exercised . . . . . . . . . . . . . . . . . . . . . . . . . . . . . . . . . . . . . . (572,182) $21.68Canceled . . . . . . . . . . . . . . . . . . . . . . . . . . . . . . . . . . . . . . (3,310) $20.35 (154,185) $32.20Vested restricted stock . . . . . . . . . . . . . . . . . . . . . . . . . . . (1,177,447) $27.03
June 26, 2011 . . . . . . . . . . . . . . . . . . . . . . . . . . . . . . . . . . . 309,933 $21.50 2,331,340 $39.90Awards assumed in Novellus acquisition . . . . . . . . . . . . . 3,932,143 $25.17 1,291,808 $35.99Granted . . . . . . . . . . . . . . . . . . . . . . . . . . . . . . . . . . . . . . . — $ — 2,336,283 $41.23Exercised . . . . . . . . . . . . . . . . . . . . . . . . . . . . . . . . . . . . . . (74,615) $23.70Canceled . . . . . . . . . . . . . . . . . . . . . . . . . . . . . . . . . . . . . . (265,384) $21.71 (120,070) $40.91Vested restricted stock . . . . . . . . . . . . . . . . . . . . . . . . . . . (1,507,883) $35.47
June 24, 2012 . . . . . . . . . . . . . . . . . . . . . . . . . . . . . . . . . . . 3,902,077 $25.14 4,331,478 $41.01
75

Outstanding and exercisable options presented by price range at June 24, 2012 are as follows:
Options Outstanding Options Exercisable
Range of Exercise Prices
Number ofOptions
Outstanding
Weighted-Average
RemainingLife
(Years)
Weighted-AverageExercise
Price
Number ofOptions
Exercisable
Weighted-AverageExercise
Price
$9.44-$14.92 . . . . . . . . . . . . . . . . . . . . . . . . . . . . . . . . 523,057 6.32 $11.43 172,195 $11.83$15.16-$19.68 . . . . . . . . . . . . . . . . . . . . . . . . . . . . . . . 69,513 6.45 $17.73 27,390 $17.16$20.21-$24.81 . . . . . . . . . . . . . . . . . . . . . . . . . . . . . . . 1,333,197 4.68 $22.04 972,358 $22.27$25.08-$29.68 . . . . . . . . . . . . . . . . . . . . . . . . . . . . . . . 1,301,307 5.26 $28.92 945,055 $28.81$30.24-$37.18 . . . . . . . . . . . . . . . . . . . . . . . . . . . . . . . 675,003 2.78 $35.36 570,605 $35.98
$9.44-$37.18 . . . . . . . . . . . . . . . . . . . . . . . . . . . . . . . . 3,902,077 4.79 $25.14 2,687,603 $26.76
The 2007 Stock Incentive Plan provides for the grant of non-qualified equity-based awards to eligibleemployees, consultants and advisors, and non-employee directors of the Company and its subsidiaries.Additional shares are reserved for issuance pursuant to awards previously granted under the Company’s 1997Stock Incentive Plan and its 1999 Stock Option Plan (collectively with the 2007 Stock Incentive Plan, the“Existing Stock Plans”). As of June 24, 2012 there were a total of 3,397,079 shares subject to options andrestricted stock units issued and outstanding under the Company’s Existing Stock Plans. As of June 24, 2012,there were a total of 6,529,882 shares available for future issuance under the 2007 Stock Incentive Plan.
As part of the Novellus acquisition Lam assumed the Novellus Systems, Inc. 2011 Stock Incentive Plan (the“Novellus Plan”). As of June 24, 2012 there were a total of 4,836,476 shares subject to options and restrictedstock units issued and outstanding under the Novellus Plan. As of June 24, 2012, there were a total of 9,370,943shares available for future issuance under the Novellus Plan.
The ESPP allows employees to designate a portion of their base compensation to be deducted and used topurchase the Company’s Common Stock at a purchase price per share of the lower of 85% of the fair marketvalue of the Company’s Common Stock on the first or last day of the applicable purchase period. Typically, eachoffering period lasts 12 months and comprises three interim purchase dates. Key provisions of the ESPP include(i) an annual increase in the number of shares available for issuance under the plan by a specific amount on aone-for-one basis with shares of Common Stock that the Company repurchases for such purpose and(ii) authorization of the Plan Administrator (the Compensation Committee of the Board) to set a limit on thenumber of shares a plan participant can purchase on any single plan exercise date. The automatic annual increaseprovides that the number of shares in the plan reserve available for issuance shall be increased on the firstbusiness day of each calendar year commencing with 2004, on a one-for-one basis with each share of CommonStock that the Company repurchases, and designates for this purpose, by a number of shares equal to the lesser of(i) 2,000,000, (ii) one and one-half percent (1.5%) of the number of shares of all classes of Common Stock of theCompany outstanding on the first business day of such calendar year, or (iii) a lesser number determined by thePlan Administrator. During fiscal year 2012 the number of shares of Lam Research Common Stock reserved forissuance under the 1999 ESPP increased by 1.8 million. During fiscal years 2011 and 2010, the number of sharesof Lam Research Common Stock reserved for issuance under the 1999 ESPP increased by 1.9 million each year.
During fiscal year 2012, a total of 819,011 shares of the Company’s Common Stock were sold to employeesunder the 1999 ESPP. At June 24, 2012 10,646,603 shares were available for purchase under the 1999 ESPP.
76

The estimated fair value of the Company’s stock-based awards, less expected forfeitures, is amortized overthe awards’ vesting period on a straight-line basis. The Company recognized or realized the following equity-based compensation expenses and benefits during the fiscal years noted:
Year Ended
June 24, June 26, June 27,2012 2011 2010
(in millions)
Equity-based compensation expense . . . . . . . . . . . . . . . . . . . . . . . . . . . . . . . . . . . . . . $81.6 $53.0 $50.5Income tax benefit recognized in the Consolidated Statement of Operations related
to equity-based compensation . . . . . . . . . . . . . . . . . . . . . . . . . . . . . . . . . . . . . . . . . . $12.2 $ 8.6 $ 8.3Tax benefit realized from the exercise and vesting of options and RSUs . . . . . . . . . . $11.8 $16.3 $11.1
Stock Options and Restricted Stock Units
Stock Options
In connection with the acquisition of Novellus, the Company assumed 3,932,143 stock options. The fairvalue of stock options assumed was estimated using the Black-Scholes option valuation model. This modelrequires the input of highly subjective assumptions, including expected stock price volatility and the estimatedlife of each award. The following assumptions were used to value these stock options:
Expected volatility . . . . . . . . . . . . . . . . . . . . . . . . . . . . . . . . . . . . 38.04%Risk-free interest rate . . . . . . . . . . . . . . . . . . . . . . . . . . . . . . . . . . 0.55%Expected term (years) . . . . . . . . . . . . . . . . . . . . . . . . . . . . . . . . . . 3.89Dividend yield . . . . . . . . . . . . . . . . . . . . . . . . . . . . . . . . . . . . . . . 0%
The year-end intrinsic value relating to stock options for fiscal years 2012, 2011, and 2010 is presentedbelow:
Year Ended
June 24, June 26, June 27,2012 2011 2010
(millions)
Intrinsic value - options outstanding . . . . . . . . . . . . . . . . . . . . $49.9 $ 6.7 $16.5Intrinsic value - options exercisable . . . . . . . . . . . . . . . . . . . . $30.1 $ 6.7 $ 7.0Intrinsic value - options exercised . . . . . . . . . . . . . . . . . . . . . $ 1.3 $16.7 $10.0
As of June 24, 2012, there was $13.1 million of total unrecognized compensation cost related to unvestedstock options granted and outstanding; that cost is expected to be recognized over a weighted average remainingvesting period of 1.7 years. Cash received from stock option exercises was $1.8 million, $12.4 million, and $13.4million during fiscal years 2012, 2011, and 2010, respectively.
Restricted Stock Units
In connection with the acquisition of Novellus, the Company assumed 1,291,808 restricted stock units. Thefair value of the Company’s restricted stock units, including those assumed upon acquisition of Novellus, wascalculated based upon the fair market value of the Company’s stock at the date of grant. As of June 24, 2012,there was $117.3 million of total unrecognized compensation cost related to unvested restricted stock unitsgranted; that cost is expected to be recognized over a weighted average remaining vesting period of 2.1 years.
77

ESPP
ESPP rights were valued using the Black-Scholes model. During fiscal years 2012, 2011, and 2010 ESPPwas valued assuming no expected dividends and the following weighted-average assumptions:
Year Ended
June 24, June 26, June 27,2012 2011 2010
Expected life (years) . . . . . . . . . . . . . . . . . . . . . . . . . . . . . . . . 0.72 0.68 0.78Expected stock price volatility . . . . . . . . . . . . . . . . . . . . . . . . 44.22% 42.25% 59.07%Risk-free interest rate . . . . . . . . . . . . . . . . . . . . . . . . . . . . . . . 0.11% 0.61% 0.61%
As of June 24, 2012, there was $1.7 million of total unrecognized compensation cost related to the ESPPthat is expected to be recognized over a remaining vesting period of 2 months.
Note 12: Retirement and Deferred Compensation Plans
Employee Savings and Retirement Plan
The Company maintains a 401(k) retirement savings plan for its full-time employees in North America.Each participant in the plan may elect to contribute from 1% to 75% of annual eligible earnings to the plan,subject to statutory limitations. The Company makes matching employee contributions in cash to the plan at therate of 50% of the first 6% of earnings contributed. Employees participating in the 401(k) retirement savings planare fully vested in the Company matching contributions, and investments are directed by participants. TheCompany made matching contributions of $5.8 million, $5.1 million, and $4.3 million in fiscal years 2012, 2011,and 2010, respectively.
Deferred Compensation Arrangements
The Company has an unfunded, non-qualified deferred compensation plan whereby certain executives maydefer a portion of their compensation. Participants earn a return on their deferred compensation based on theirallocation of their account balance among measurement funds. The Company controls the investment of thesefunds and the participants remain general creditors of the Company. Participants are able to elect the payment ofbenefits on a specified date at least three years after the opening of a deferral subaccount or upon retirement.Distributions are made in the form of lump sum or annual installments over a period of up to 20 years as electedby the participant. If no alternate election has been made, a lump sum payment will be made upon termination ofa participant’s employment with the Company. As of June 24, 2012 and June 26, 2011 the liability of theCompany to the plan participants was $79.0 million and $62.5 million, respectively, which was recorded inaccrued expenses and other current liabilities on the Consolidated Balance Sheets. As of June 24, 2012 andJune 26, 2011 the Company had investments in the aggregate amount of $83.2 million and $64.7 millionrespectively that correlate to the deferred compensation obligations, which were recorded in other assets on theconsolidated balance sheets.
Postretirement Healthcare Plan
The Company maintains a postretirement healthcare plan for certain executive and director retirees.Coverage continues through the duration of the lifetime of the retiree or the retiree’s spouse, whichever is longer.The benefit obligation was $19.8 million and $13.6 million as of June 24, 2012 and June 26, 2011, respectively.
78

Note 13: Long Term Debt
The following table reflects the carrying value of the Company’s convertible notes and other long-term debtas of June 24, 2012 and June 26, 2011:
June 24, June 26,2012 2011
(in millions)
0.50% Notes due 2016 . . . . . . . . . . . . . . . . . . . . . . . . . . . . . $ 450.0 $ 450.0Less: Unamortized interest discount . . . . . . . . . . . . . . . . . . . (60.3) (74.4)
Net carrying amount of 0.50% Notes 2016 . . . . . . . . . 389.7 375.6
1.25% Notes due 2018 . . . . . . . . . . . . . . . . . . . . . . . . . . . . . 450.0 450.0Less: Unamortized interest discount . . . . . . . . . . . . . . . . . . . (90.4) (103.2)
Net carrying amount of 1.25% Notes 2018 . . . . . . . . . 359.6 346.8
2.625% Notes due 2041 . . . . . . . . . . . . . . . . . . . . . . . . . . . . 699.9 —Less: Unamortized interest discount . . . . . . . . . . . . . . . . . . . (190.3) —
Net carrying amount of 2.625% Notes 2018 . . . . . . . . 509.6 —
Other long-term debt . . . . . . . . . . . . . . . . . . . . . . . . . . . . . . . — 3.9
Total long-term debt . . . . . . . . . . . . . . . . . . . . . . . . . . . . . . . $1,258.9 $ 726.3
Convertible Senior Notes
In May 2011, the Company issued and sold $450 million in aggregate principal amount of 0.5% ConvertibleSenior Notes due May 2016 (the “2016 Notes”) at par. At the same time, the Company issued and sold $450million in aggregate principal amount of 1.25% Convertible Senior Notes due May 2018 (the “2018 Notes”) atpar. The 2016 and 2018 Notes may be converted, under certain circumstances, based on an initial conversion rateof 15.8687 shares of common stock per $1,000 principal amount of notes (which represents an initial conversionprice of approximately $63.02 per share of common stock).The net proceeds to the Company from the sale of the2016 and 2018 Notes were $835.5 million. The Company pays cash interest at an annual rate of 0.5% and 1.25%,respectively, on the 2016 and 2018 Notes, payable semi-annually on May 15 and November 15 of each year,beginning November 15, 2011.
In June 2012, with the acquisition of Novellus Systems, Inc. (see Note 16), the Company assumed $700million in aggregate principal amount 2.625% Convertible Senior Notes due May 2041 (the “2041 Notes,” andcollectively with the 2016 and 2018 Notes, the “Notes”). The 2041 Notes may be converted, under certaincircumstances, based on an initial conversion rate of 28.4781 shares of common stock per $1,000 principalamount of notes (which represents an initial conversion price of approximately $35.11 per share of commonstock.). The Company pays cash interest at an annual rate of 2.625%, payable semi-annually on May 15 andNovember 15 of each year.
The Company separately accounts for the liability and equity components of the Notes. The initial debtcomponents of the 2016, 2018, and 2041 Notes were valued at $373.8 million, $345.1 million, and $509.5million, respectively, based on the present value of the future cash flows using discount rates of 4.29%, 5.27%,and 4.28%, respectively, the Company’s borrowing rate at the date of the issuance or assumption for similar debtinstruments without the conversion feature. The carrying values of the equity components of the 2016 and 2018Notes were $76.2 million and $104.9 million, respectively, as of June 24, 2012 and June 26, 2011. The carryingvalue of the equity components of the 2041 Notes was $328.1 million as of June 24, 2012. The effective interestrates on the liability components of the 2016 Notes and 2018 Notes for the years ended June 24, 2012 andJune 26, 2011 were 4.29% and 5.27%, respectively. The effective interest rate on the liability component of the2041 Notes for the year ended June 24, 2012 was 4.28%. The following table presents the amount of interest cost
79

recognized relating to both the contractual interest coupon and amortization of the discount on the liabilitycomponent of the Notes during the years ended June 24, 2012 and June 26, 2011.
June 24, June 26,2012 2011
(in millions) (in millions)
Contractual interest coupon . . . . . . . . . . . . . . . . . . . . . . $ 9.2 $1.1Amortization of interest discount . . . . . . . . . . . . . . . . . . 27.0 3.6Amortization of issuance costs . . . . . . . . . . . . . . . . . . . . 2.4 0.3
Total interest cost recognized . . . . . . . . . . . . . . . . . $38.6 $5.0
The remaining bond discount of the 2016 Notes of $60.3 million as of June 24, 2012 will be amortized overtheir remaining life, which is approximately 3.9 years. The remaining bond discount of the 2018 Notes of $90.4million as of June 24, 2012 will be amortized over their remaining life, which is approximately 5.9 years. Theremaining bond discount of the 2041 Notes of $190.3 million as of June 24, 2012 will be amortized over theirremaining life, which is approximately 28.9 years. As of June 24, 2012, the if-converted value of the 2016 and2018 Notes did not exceed the aggregate principal amount. As of June 24, 2012, the if-converted value of the2041 Notes exceeded the aggregate principal amount by $2.0 million.
2016 Notes
The 2016 Notes may be converted at any time prior to the close of business on the business day immediatelypreceding February 15, 2016, at the option of the holder, only under the following circumstances: 1) during thefive business-day period after any ten consecutive trading-day period (the “measurement period”) in which thetrading price per $1,000 principal amount of 2016 Notes for each day of such measurement period was less than98% of the product of the last reported sale price of the Company’s common stock and the applicable conversionrate on each such trading day; 2) during any fiscal quarter commencing after the fiscal quarter endingSeptember 25, 2011, if the last reported sale price of the Company’s common stock for 20 or more trading daysin a period of 30 consecutive trading days ending on the last trading day of the immediately preceding fiscalquarter is greater than or equal to 130% of the conversion price in effect on the last trading day of theimmediately preceding fiscal quarter; or 3) upon the occurrence of specified corporate events. On and afterFebruary 15, 2016 until the close of business on the second scheduled trading day immediately preceding thematurity date of May 15, 2016, holders may convert their notes at any time, regardless of the foregoingcircumstances.
Upon conversion, a holder will receive the conversion value of the 2016 Notes to be converted equal to theconversion rate multiplied by the volume weighted average price of the Company’s common stock during aspecified period following the conversion date. The conversion value of each 2016 Note will be paid in: 1) cashequal to the principal amount of the note and 2) to the extent the conversion value exceeds the principal amountof the note, common stock (plus cash in lieu of any fractional shares of common stock). The conversion pricewill be subject to adjustment in some events but will not be adjusted for accrued interest. Upon a “fundamentalchange” at any time, as defined, the Company will in some cases increase the conversion rate for a holder whoelects to convert its 2016 Notes in connection with such fundamental change. In addition, the holders may requirethe Company to repurchase for cash all or a portion of their notes upon a “designated event” at a price equal to100% of the principal amount of the notes being repurchased plus accrued and unpaid interest, if any.
80

Concurrently with the issuance of the 2016 Notes, the Company purchased a convertible note hedge andsold warrants. The separate convertible note hedge and warrant transactions are collectively structured to reducethe potential future economic dilution associated with the conversion of the 2016 Notes and to increase theeffective initial conversion price to $71.34 per share. Each of these components is discussed separately below:
Convertible Note Hedge. Counterparties agreed to sell to the Company up to approximately 7.1 millionshares of the Company’s common stock, which is the number of shares initially issuable upon conversion ofthe 2016 Notes in full, at a price of $63.02 per share. The convertible note hedge transaction will be settledin net shares and will terminate upon the earlier of the maturity date of the 2016 Notes or the first day noneof the 2016 Notes remains outstanding due to conversion or otherwise. Settlement of the convertible notehedge in net shares, based on the number of shares issued upon conversion of the 2016 Notes, on theexpiration date would result in the Company receiving net shares equivalent to the number of sharesissuable by the Company upon conversion of the 2016 Notes. Should there be an early unwind of theconvertible note hedge transaction, the number of net shares potentially received by the Company willdepend upon 1) the then existing overall market conditions, 2) the Company’s stock price, 3) the volatilityof the Company’s stock, and 4) the amount of time remaining before expiration of the convertible notehedge. The convertible note hedge transaction cost of $76.2 million has been accounted for as an equitytransaction. The Company initially recorded approximately $28.2 million in stockholders’ equity from thenet deferred tax asset related to the convertible note hedge at inception of the transaction.
Sold Warrants. The Company received $57.6 million from the same counterparties from the sale of warrantsto purchase up to approximately 7.1 million shares of the Company’s common stock at an exercise price of$71.34 per share. The warrants expire on a series of dates between August 15, 2016 and October 21, 2016.At expiration, the Company may, at its option, elect to settle the warrants on a net share basis. As ofJune 24, 2012, the warrants had not been exercised and remained outstanding. The value of the warrants wasinitially recorded in equity and continues to be classified as equity.
2018 Notes
The 2018 Notes may be converted at any time prior to the close of business on the business day immediatelypreceding February 15, 2018, at the option of the holder only under the following circumstances: 1) during thefive business-day period after any ten consecutive trading-day period (the “measurement period”) in which thetrading price per $1,000 principal amount of 2018 Notes for each day of such measurement period was less than98% of the product of the last reported sale price of the Company’s common stock and the applicable conversionrate on each such trading day; 2) during any fiscal quarter commencing after the fiscal quarter endingSeptember 25, 2011, if the last reported sale price of the Company’s common stock for 20 or more trading daysin a period of 30 consecutive trading days ending on the last trading day of the immediately preceding fiscalquarter is greater than or equal to 130% of the conversion price in effect on the last trading day of theimmediately preceding fiscal quarter; or 3) upon the occurrence of specified corporate events. On and afterFebruary 15, 2018 until the close of business on the second scheduled trading day immediately preceding thematurity date of May 15, 2018, holders may convert their notes at any time, regardless of the foregoingcircumstances.
Upon conversion, a holder will receive the conversion value of the 2018 Notes to be converted equal to theconversion rate multiplied by the volume weighted average price of the Company’s common stock during aspecified period following the conversion date. The conversion value of each 2018 Notes will be paid in: 1) cashequal to the principal amount of the note and 2) to the extent the conversion value exceeds the principal amountof the note, common stock (plus cash in lieu of any fractional shares of common stock). The conversion pricewill be subject to adjustment in some events but will not be adjusted for accrued interest. Upon a “fundamentalchange” at any time, as defined, the Company will in some cases increase the conversion rate for a holder whoelects to convert its 2018 Notes in connection with such fundamental change. In addition, the holders may requirethe Company to repurchase for cash all or a portion of their notes upon a “designated event” at a price equal to100% of the principal amount of the notes being repurchased plus accrued and unpaid interest, if any.
81

Concurrently with the issuance of the 2018 Notes, the Company purchased a convertible note hedge andsold warrants. The separate convertible note hedge and warrant transactions are collectively structured to reducethe potential future economic dilution associated with the conversion of the 2018 Notes and to increase theeffective initial conversion price to $76.10 per share. Each of these components is discussed separately below:
Convertible Note Hedge. Counterparties agreed to sell to the Company up to approximately 7.1 millionshares of the Company’s common stock, which is the number of shares initially issuable upon conversion ofthe 2018 Notes in full, at a price of $63.02 per share. The convertible note hedge transaction will be settledin net shares and will terminate upon the earlier of the maturity date of the 2018 Notes or the first day noneof the 2018 Notes remains outstanding due to conversion or otherwise. Settlement of the convertible notehedge in net shares, based on the number of shares issued upon conversion of the 2018 Notes, on theexpiration date would result in the Company receiving net shares equivalent to the number of sharesissuable by the Company upon conversion of the 2018 Notes. Should there be an early unwind of theconvertible note hedge transaction, the number of net shares potentially received by the Company willdepend upon 1) the then existing overall market conditions, 2) the Company’s stock price, 3) the volatilityof the Company’s stock, and 4) the amount of time remaining before expiration of the convertible notehedge. The convertible note hedge transaction cost of $104.9 million has been accounted for as an equitytransaction. The Company initially recorded approximately $38.8 million in stockholders’ equity from thenet deferred tax asset related to the convertible note hedge at inception of the transaction.
Sold Warrants . The Company received $76.3 million from the same counterparties from the sale ofwarrants to purchase up to approximately 7.1 million shares of the Company’s common stock at an exerciseprice of $76.10 per share. The warrants expire on a series of dates between August 15, 2018 and October 23,2018. At expiration, the Company may, at its option, elect to settle the warrants on a net share basis. As ofJune 24, 2012, the warrants had not been exercised and remained outstanding. The value of the warrants wasinitially recorded in equity and continues to be classified as equity.
2041 Notes
The 2041 Notes may be converted at any time prior to the close of business on the business day immediatelypreceding February 15, 2041, at the option of the holder only under the following circumstances: 1) during thefive business-day period after any ten consecutive trading-day period (the “measurement period”) in which thetrading price per $1,000 principal amount of 2041 notes for each day of such measurement period was less than98% of the product of the last reported sale price of the Company’s common stock and the applicable conversionrate on each such trading day; 2) during any fiscal quarter, if the last reported sale price of the Company’scommon stock for 20 or more trading days in a period of 30 consecutive trading days ending on the last tradingday of the immediately preceding fiscal quarter is greater than or equal to 130% of the conversion price in effecton the last trading day of the immediately preceding fiscal quarter; or 3) upon the occurrence of specifiedcorporate events. On and after February 15, 2041 until the close of business on the third scheduled trading dayimmediately preceding the maturity date of May 15, 2041, holders may convert their notes at any time, regardlessof the foregoing circumstances.
In connection with the acquisition of Novellus, the 2041 Notes may be converted into the Company’scommon stock at any time from and after the later of (1) the date that was 30 scheduled trading days immediatelyprior to the anticipated closing date of the merger and (2) the date on which we delivered to the note holdersnotice of the merger, until 35 business days after the actual closing date of the merger, or July 24, 2012.Accordingly, the carrying amount of the 2041 Notes has been classified in current liabilities in our balance sheet.The excess of the amount of cash payable, if converted, over the carrying amount of the 2041 Notes has beenreclassified from permanent to temporary equity. When the conversion period closed, July 24, 2012, all 2041Notes not converted were reclassified back to noncurrent liabilities and the temporary equity was reclassified topermanent equity. During the period ending June 24, 2012, 65 of the 2041 Notes, with a total par value of$65,000, were converted at the note holders’ option. In conjunction with the conversion, 137 shares of commonstock were issued.
82

Upon conversion, a holder will receive the conversion value of the 2041 Notes to be converted equal to theconversion rate multiplied by the volume weighted average price of the Company’s common stock during aspecified period following the conversion date. The conversion value of each 2041 Note will be paid in: 1) cashequal to the principal amount of the note and 2) to the extent the conversion value exceeds the principal amountof the note, common stock (plus cash in lieu of any fractional shares of common stock). The conversion pricewill be subject to adjustment in some events but will not be adjusted for accrued interest. Upon a “fundamentalchange” at any time, as defined, the Company will in some cases increase the conversion rate for a holder whoelects to convert its 2041 Notes in connection with such fundamental change. In addition, the holders may requirethe Company to repurchase for cash all or a portion of their notes upon a “designated event” at a price equal to100% of the principal amount of the notes being repurchased plus accrued and unpaid interest, if any.
On or after May 21, 2021, we may redeem all or part of the 2041 Notes for the principal plus any accruedand unpaid interest if the closing price of our common stock has been at least 150% of the conversion price thenin effect for at least 20 trading days during any period of 30 consecutive trading days prior to the date on whichwe provide notice of redemption.
The 2041 Notes also have a contingent interest payment provision that may require us to pay additionalinterest based on certain thresholds, beginning with the semi-annual interest payment commencing on May 15,2021, and upon the occurrence of certain events, as outlined in the indenture governing the 2041 Notes. Themaximum amount of the contingent interest will accrue at a rate of 2.1% per annum, excluding any potentialimpact from dividends deemed payable to holders of the 2041Notes. The contingent interest payment provisionhas been identified as an embedded derivative, to be accounted for separately, and is recorded at fair value at theend of each reporting period in Other non-current liabilities, with any gains and losses recorded in Interestexpense, within the Condensed Consolidated Statements of Income.
Fair Value of Notes
As of June 24, 2012, the face values of the 2016 Notes, 2018 Notes, and 2041 Notes were $450.0 million,$450.0 million, and $699.9 million, respectively. As of June 24, 2012, the fair values of the 2016 Notes, 2018Notes, and 2041 Notes, which includes the debt and equity components, were approximately $432.4 million,$445.6 million, and $863.9 million respectively, based on quoted market prices (level 1 inputs within the fairvalue hierarchy).
Contractual Obligations
The Company’s contractual cash obligations relating to its convertible notes and other long-term debt as ofJune 24, 2012 were as follows:
Long-termDebt
(in thousands)
Payments due by period:One year . . . . . . . . . . . . . . . . . . . . . . . . . . . . . . . . . . . . . . . $ —Two years . . . . . . . . . . . . . . . . . . . . . . . . . . . . . . . . . . . . . . —Three years . . . . . . . . . . . . . . . . . . . . . . . . . . . . . . . . . . . . . —Four years . . . . . . . . . . . . . . . . . . . . . . . . . . . . . . . . . . . . . . 450,000Five years . . . . . . . . . . . . . . . . . . . . . . . . . . . . . . . . . . . . . . —Over 5 years* . . . . . . . . . . . . . . . . . . . . . . . . . . . . . . . . . . . 1,149,935
Total . . . . . . . . . . . . . . . . . . . . . . . . . . . . . . . . . . . . . . . . . . 1,599,935Current portion of long-term debt . . . . . . . . . . . . . . . . . . . 699,935
Long-term debt . . . . . . . . . . . . . . . . . . . . . . . . . . . . . . . . . . $ 900,000
* As noted above, the conversion period for the 2041 Notes closed on July 24, 2012 and no further conversionsoccurred. As such, the payment of principal on the 2041 Notes has been included in the over 5 year category ofthis table.
83
Note 14: Commitments
The Company has certain obligations to make future payments under various contracts, some of these arerecorded on its balance sheet and some are not. Obligations that are recorded on the Company’s balance sheetinclude the Company’s capital lease obligations. Obligations that are not recorded on the Company’s balancesheet include contractual relationships for operating leases, purchase obligations, and certain guarantees. TheCompany’s commitments relating to capital leases and off-balance sheet agreements are included in the tablesbelow. These amounts exclude $274.2 million of liabilities related to uncertain tax benefits because the Companyis unable to reasonably estimate the ultimate amount or time of settlement. See Note 15, of Notes to ConsolidatedFinancial Statements for further discussion.
Capital Leases
Capital leases reflect building and office equipment leases. The Company’s contractual cash obligationsrelating to its existing capital leases, including interest, as of June 24, 2012 were as follows:
CapitalLeases
(in thousands)
Payments due by period:One year . . . . . . . . . . . . . . . . . . . . . . . . . . . . . . . . . . . . . . . $ 1,877Two years . . . . . . . . . . . . . . . . . . . . . . . . . . . . . . . . . . . . . . 1,596Three years . . . . . . . . . . . . . . . . . . . . . . . . . . . . . . . . . . . . . 1,585Four years . . . . . . . . . . . . . . . . . . . . . . . . . . . . . . . . . . . . . 2,138Five years . . . . . . . . . . . . . . . . . . . . . . . . . . . . . . . . . . . . . . 7,940Over 5 years . . . . . . . . . . . . . . . . . . . . . . . . . . . . . . . . . . . . —
Total . . . . . . . . . . . . . . . . . . . . . . . . . . . . . . . . . . . . . . . . . . 15,136Interest on capital leases . . . . . . . . . . . . . . . . . . . . . . . . . . 1,077
Current portion of capital leases . . . . . . . . . . . . . . . . . . . . 1,547
Long-term portion of capital leases . . . . . . . . . . . . . . . . . . $12,512
Operating Leases and Related Guarantees
The Company leases the majority of its administrative, R&D and manufacturing facilities, regional sales/service offices and certain equipment under non-cancelable operating leases. Certain of the Company’s facilityleases for buildings located at its Fremont, California headquarters and certain other facility leases provide theCompany with options to extend the leases for additional periods or to purchase the facilities. Certain of theCompany’s facility leases provide for periodic rent increases based on the general rate of inflation. TheCompany’s rental expense for facilities occupied during fiscal years 2012, 2011, and 2010 was approximately$11 million, $9 million, and $6 million, respectively.
On December 18, 2007, the Company entered into two operating leases regarding certain improvedproperties in Livermore, California. These leases were amended on April 3, 2008 and July 9, 2008 (as soamended, the “Livermore Leases”). On December 21, 2007, the Company entered into a series of four amendedand restated operating leases (the “New Fremont Leases,” and collectively with the Livermore Leases, the“Operating Leases”) with regard to certain improved properties at the Company’s headquarters in Fremont,California.
The Operating Leases have a term of approximately seven years ending on the first business day in January2015. The Company may, at its discretion and with 30 days’ notice, elect to purchase the property that is thesubject of the Operating Lease for an amount approximating the sum required to pay the amount of the lessor’sinvestment in the property and any accrued but unpaid rent.
84
The Company is required, pursuant to the terms of the Operating Leases, to maintain collateral in anaggregate of approximately $164.9 million in separate interest-bearing accounts as security for the Company’sobligations under the Operating Leases. This amount is recorded as restricted cash in the Company’sConsolidated Balance Sheet as of as of June 24, 2012.
When the terms of the Operating Leases expire, the property subject to that Operating Lease may beremarketed. The Company has guaranteed to the lessor that each property will have a certain minimum residualvalue. The aggregate guarantee made by the Company under the Operating Leases is generally no more thanapproximately $141.7 million; however, under certain default circumstances, the guarantee with regard to anOperating Lease may be 100% of the lessor’s aggregate investment in the applicable property, which in no casewill exceed $164.9 million, in the aggregate.
The Company recognized at lease inception $0.6 million in estimated liabilities related to the OperatingLeases, which represents the fair value guarantee premium that would be required had the guarantee been issuedin a standalone transaction. These liabilities are recorded in other long-term liabilities with the offsetting entryrecorded as prepaid rent in other assets. The balances in prepaid rent and the guarantee liability are amortized tothe statement of operations on a straight line basis over the life of the leases. If it becomes probable that theCompany will be required to make a payment under the residual guarantee, the Company will increase itsliability with a corresponding increase to prepaid rent and amortize the increased prepaid rent over the remaininglease term with no corresponding reduction in the liability. As of June 24, 2012, the unamortized portion of thefair value of the residual value guarantees remaining in other long-term liabilities and prepaid rent was $0.2million.
During fiscal years 2011 and 2010, the Company recognized restructuring charges of $13.7 million and$13.0 million, respectively, related to the reassessment of the residual value guarantee for such lease.Accordingly, an amount of $26.7 million has been recorded in other long-term liabilities as of June 24, 2012.
The Company’s contractual cash obligations with respect to operating leases, excluding the residual valueguarantees discussed above, as of June 24, 2012 were as follows:
OperatingLeases
(in thousands)
Payments due by period:One year . . . . . . . . . . . . . . . . . . . . . . . . . . . . . . . . . . . . . . . $ 15,620Two years . . . . . . . . . . . . . . . . . . . . . . . . . . . . . . . . . . . . . . 12,537Three years . . . . . . . . . . . . . . . . . . . . . . . . . . . . . . . . . . . . . 9,960Four years . . . . . . . . . . . . . . . . . . . . . . . . . . . . . . . . . . . . . 5,886Five years . . . . . . . . . . . . . . . . . . . . . . . . . . . . . . . . . . . . . . 4,777Over 5 years . . . . . . . . . . . . . . . . . . . . . . . . . . . . . . . . . . . . 1,423Less: Sublease Income . . . . . . . . . . . . . . . . . . . . . . . . . . . . (12,822)
Total . . . . . . . . . . . . . . . . . . . . . . . . . . . . . . . . . . . . . . . . . . $ 37,381
Other Guarantees
The Company has issued certain indemnifications to its lessors for taxes and general liability under some ofits agreements. The Company has entered into certain insurance contracts that may limit its exposure to suchindemnifications. As of June 24, 2012, the Company had not recorded any liability on its Consolidated FinancialStatements in connection with these indemnifications, as it does not believe, based on information available, thatit is probable that any amounts will be paid under these guarantees.
85

Generally, the Company indemnifies, under pre-determined conditions and limitations, its customers forinfringement of third-party intellectual property rights by the Company’s products or services. The Companyseeks to limit its liability for such indemnity to an amount not to exceed the sales price of the products or servicessubject to its indemnification obligations. The Company does not believe, based on information available, that itis probable that any material amounts will be paid under these guarantees.
The Company provides guarantees and standby letters of credit to certain parties as required for certaintransactions initiated during the ordinary course of business. As of June 24, 2012, the maximum potential amountof future payments that we could be required to make under these arrangements and letters of credit was$19.9 million. We do not believe, based on historical experience and information currently available, that it isprobable that any amounts will be required to be paid.
Purchase Obligations
Purchase obligations consist of significant contractual obligations either on an annual basis or over multi-year periods related to the Company’s outsourcing activities or other material commitments, including vendor-consigned inventories. The Company continues to enter into new agreements and maintain existing agreements tooutsource certain activities, including elements of its manufacturing, warehousing, logistics, facilitiesmaintenance, certain information technology functions, and certain transactional general and administrativefunctions. The contractual cash obligations and commitments table presented below contains the Company’sminimum obligations at June 24, 2012 under these arrangements and others. For obligations with cancellationprovisions, the amounts included in the following table were limited to the non-cancelable portion of theagreement terms or the minimum cancellation fee. Actual expenditures will vary based on the volume oftransactions and length of contractual service provided. In addition to these obligations, certain of theseagreements include early termination provisions and/or cancellation penalties that could increase or decreaseamounts actually paid.
The Company’s commitments related to these agreements as of June 24, 2012 are as follows:
PurchaseObligations
(in thousands)
Payments due by period:One year . . . . . . . . . . . . . . . . . . . . . . . . . . . . . . . . . . . . . . . $125,403Two years . . . . . . . . . . . . . . . . . . . . . . . . . . . . . . . . . . . . . . 7,567Three years . . . . . . . . . . . . . . . . . . . . . . . . . . . . . . . . . . . . . 5,470Four years . . . . . . . . . . . . . . . . . . . . . . . . . . . . . . . . . . . . . 2,974Five years . . . . . . . . . . . . . . . . . . . . . . . . . . . . . . . . . . . . . . 724Over 5 years . . . . . . . . . . . . . . . . . . . . . . . . . . . . . . . . . . . . —
Total . . . . . . . . . . . . . . . . . . . . . . . . . . . . . . . . . . . . . . . . . . $142,138
86

Warranties
The Company provides standard warranties on its systems. The liability amount is based on actual historicalwarranty spending activity by type of system, customer, and geographic region, modified for any knowndifferences such as the impact of system reliability improvements.
Changes in the Company’s product warranty reserves were as follows:
Year Ended
June 24,2012
June 26,2011
(in thousands)
Balance at beginning of period . . . . . . . . . . . . . . . . . . . . . . . . . . . . . . . . . . . . . . $ 40,951 $ 31,756Warranties issued during the period . . . . . . . . . . . . . . . . . . . . . . . . . . . . . . . . . . 45,095 51,721Warranties assumed in Novellus acquisition . . . . . . . . . . . . . . . . . . . . . . . . . . . 38,967 —Settlements made during the period . . . . . . . . . . . . . . . . . . . . . . . . . . . . . . . . . . (58,710) (39,915)Expirations and change in liability for pre-existing warranties during the
period . . . . . . . . . . . . . . . . . . . . . . . . . . . . . . . . . . . . . . . . . . . . . . . . . . . . . . . 3,793 (3,299)Changes in foreign currency exchange rates . . . . . . . . . . . . . . . . . . . . . . . . . . . 65 688
Balance at end of period . . . . . . . . . . . . . . . . . . . . . . . . . . . . . . . . . . . . . . . . . . . $ 70,161 $ 40,951Less: long-term portion . . . . . . . . . . . . . . . . . . . . . . . . . . . . . . . . . . . . . . . . . . . (6,173) —
Accrued warranty, current . . . . . . . . . . . . . . . . . . . . . . . . . . . . . . . . . . . . . . . . . $ 63,988 $ 40,951
Note 15: Income Taxes
The components of income (loss) before income taxes are as follows:
Year Ended
June 24,2012
June 26,2011
June 27,2010
(in thousands)
United States . . . . . . . . . . . . . . . . . . . . . . . . . . . . . . . . $ (6,950) $159,250 $140,309Foreign . . . . . . . . . . . . . . . . . . . . . . . . . . . . . . . . . . . . . 211,368 641,626 289,832
$204,418 $800,876 $430,141
87

Significant components of the provision (benefit) for income taxes attributable to income before incometaxes are as follows:
Year Ended
June 24,2012
June 26,2011
June 27,2010
(in thousands)
Federal:Current . . . . . . . . . . . . . . . . . . . . . . . . . . . . . . . . . . . $ 5,038 $ 55,119 $38,221Deferred . . . . . . . . . . . . . . . . . . . . . . . . . . . . . . . . . . (1,033) (25,143) 11,438
$ 4,005 $ 29,976 $49,659
State:Current . . . . . . . . . . . . . . . . . . . . . . . . . . . . . . . . . . . $ 1,297 $ 3,159 $ 6,126Deferred . . . . . . . . . . . . . . . . . . . . . . . . . . . . . . . . . . 336 26,589 5,009
$ 1,633 $ 29,748 $11,135
Foreign:Current . . . . . . . . . . . . . . . . . . . . . . . . . . . . . . . . . . . $33,871 $ 22,556 $22,813Deferred . . . . . . . . . . . . . . . . . . . . . . . . . . . . . . . . . . (3,814) (5,152) (135)
$30,057 $ 17,404 $22,678
Total Provision for Income Taxes . . . . . . . . . . . . . . $35,695 $ 77,128 $83,472
Deferred income taxes reflect the net tax effect of temporary differences between the carrying amounts ofassets and liabilities for financial reporting purposes, and the amounts used for income tax purposes, as well asthe tax effect of carryforwards. Significant components of the Company’s net deferred tax assets are as follows:
June 24,2012
June 26,2011
(in thousands)
Deferred tax assets:Tax carryforwards . . . . . . . . . . . . . . . . . . . . . . . . . . $ 114,974 $ 33,152Allowances and reserves . . . . . . . . . . . . . . . . . . . . . 102,041 85,751Equity-based compensation . . . . . . . . . . . . . . . . . . . 24,960 8,019Inventory valuation differences . . . . . . . . . . . . . . . . 8,233 8,861Other . . . . . . . . . . . . . . . . . . . . . . . . . . . . . . . . . . . . 3,118 1,720Capitalized R&D expenses . . . . . . . . . . . . . . . . . . . 388 2,722Intangible Assets . . . . . . . . . . . . . . . . . . . . . . . . . . . — 20,397
Gross deferred tax assets . . . . . . . . . . . . . . . . . . . . . . . . . 253,714 160,622Valuation allowance . . . . . . . . . . . . . . . . . . . . . . . . . (55,213) (46,201)
Net deferred tax assets . . . . . . . . . . . . . . . . . . . . . . . . . . . 198,501 114,421Deferred tax liabilities:
Intangible Assets . . . . . . . . . . . . . . . . . . . . . . . . . . . (117,312) —Convertible debt . . . . . . . . . . . . . . . . . . . . . . . . . . . . (81,608) —Temporary differences for capital assets . . . . . . . . . (71,439) (36,519)Amortization of goodwill . . . . . . . . . . . . . . . . . . . . . (8,180) (7,768)Other . . . . . . . . . . . . . . . . . . . . . . . . . . . . . . . . . . . . (7,060) (802)
Gross deferred tax liabilities . . . . . . . . . . . . . . . . . . . . . . (285,599) (45,089)
Net deferred tax assets . . . . . . . . . . . . . . . . . . . . . . . . . . . $ (87,098) $ 69,332
88

The change in the gross deferred tax assets, gross deferred tax liabilities and valuation allowance betweenfiscal year 2012 and 2011 is primarily attributable to the Company’s acquisition of Novellus. Realization of theCompany’s net deferred tax assets is based upon the weighting of available evidence, including such factors asthe recent earnings history and expected future taxable income. The Company believes it is more-likely-than-notthat such deferred tax assets will be realized with the exception of $55.2 million related to California and certainforeign deferred tax assets. $22.5 million of the valuation allowance relates to tax assets established in purchaseprice accounting and is allocated to goodwill.
The provisions related to the tax accounting for stock-based compensation prohibit the recognition of adeferred tax asset for an excess benefit that has not yet been realized. As a result, the Company will onlyrecognize an excess benefit from stock-based compensation in additional paid-in-capital if an incremental taxbenefit is realized after all other tax attributes currently available to us have been utilized. In addition, theCompany continued to elect to account for the indirect benefits of stock-based compensation such as the R&Dtax credit through the consolidated statement of operations.
At June 24, 2012, the Company had federal net operating loss carryforwards of approximately $186.2million. These losses will begin to expire in the year 2018, and are subject to limitations on their utilization.
As of June 24, 2012, the Company had state net operating loss carryforward of approximately $ 60.2million. If not utilized, the net operating loss carryforwards will begin to expire in the year 2013, and are subjectto limitations on their utilization.
At June 24, 2012, the Company had federal tax credit carryforwards of approximately $47.6 million, ofwhich $44.9 million will begin to expire in fiscal year 2027. The remaining balance of $2.8 million of creditsmay be carried forward indefinitely. The tax benefits relating to approximately $8.1 million of the federal taxcredit carryforwards will be credited to additional paid-in-capital when recognized.
At June 24, 2012, the Company had state tax credit carryforwards of approximately $159.0 million.Substantially all tax credits may be carried forward indefinitely. The tax benefits relating to approximately$36.7 million of the state tax credit carryforwards will be credited to additional paid-in-capital when recognized.
At June 24, 2012, the Company had foreign net operating loss carryforwards of approximately $66.4million, of which approximately $34.0 million may be carried forward indefinitely and $32.4 million will beginto expire in fiscal year 2014.
A reconciliation of income tax expense provided at the federal statutory rate (35% in fiscal years 2012, 2011and 2010) to actual income expense is as follows:
Year Ended
June 24,2012
June 26,2011
June 27,2010
(in thousands)
Income tax expense computed at federal statutoryrate . . . . . . . . . . . . . . . . . . . . . . . . . . . . . . . . . . . . . . $ 71,546 $ 280,306 $150,549
State income taxes, net of federal tax benefit . . . . . . . (4,895) 9,322 4,754Foreign income taxed at different rates . . . . . . . . . . . . (51,425) (217,982) (84,081)Tax credits . . . . . . . . . . . . . . . . . . . . . . . . . . . . . . . . . . (5,791) (16,503) (4,410)State valuation allowance, net of federal tax
benefit . . . . . . . . . . . . . . . . . . . . . . . . . . . . . . . . . . . 5,862 10,078 4,627Equity-based compensation . . . . . . . . . . . . . . . . . . . . . 14,123 12,244 11,847Acquisition costs . . . . . . . . . . . . . . . . . . . . . . . . . . . . . 5,683 — —Other, net . . . . . . . . . . . . . . . . . . . . . . . . . . . . . . . . . . . 592 (337) 186
$ 35,695 $ 77,128 $ 83,472
89

The Company’s effective tax rate on income before tax for the year was 17.5% which was lower than theUnited States federal statutory rate of 35% due to geographical mix of income between higher and lower foreigntax jurisdictions and recognition of the U.S. federal research tax credit.
Effective from fiscal year 2003 through June 2013, the Company has a tax holiday in Switzerland for one ofits foreign subsidiaries, which is conditional upon the Company meeting certain employment andinvestment thresholds. The impact of the tax holiday decreased income taxes by approximately $22.3 million,$119.5 million, and $45.9 million for fiscal years 2012, 2011, and 2010, respectively. The benefit of the taxholiday on diluted earnings per share was approximately $0.18 in fiscal year 2012, $0.96 in fiscal year 2011, and$0.36 in fiscal year 2010.
Effective from January 2007 through December 2014, Novellus has a tax holiday in Singapore for one of itsforeign subsidiaries, which is conditional upon Novellus meeting certain revenue, business spending andemployment thresholds. The benefit of the Singapore tax holiday for the Company’s fiscal year 2012 results isimmaterial.
Unremitted earnings of the Company’s foreign subsidiaries included in consolidated retained earningsaggregated to approximately $1.9 billion at June 24, 2012. These earnings are indefinitely reinvested in foreignoperations. If these earnings were remitted to the United States, they would be subject to U.S. and foreignwithholding taxes of approximately $430.5 million at current statutory rates. The Company’s federal income taxprovision includes U.S. income taxes on certain foreign-based income.
As of June 24, 2012, the total gross unrecognized tax benefits were $343.8 million compared to$181.5 million as of June 26, 2011, and $190.5 million as of June 27, 2010. During fiscal year 2012, grossunrecognized tax benefits increased by approximately $162.3 million, primarily related to the acquisition ofNovellus. The amount of unrecognized tax benefits that, if recognized, would impact the effective tax rate was$278.2 million, $120.4 million, and $153.8 million as of June 24, 2012, June 26, 2011, and June 27, 2010,respectively. The aggregate changes in the balance of gross unrecognized tax benefits were as follows:
(in millions)
Balance as of June 28, 2009 . . . . . . . . . . . . . . . . . . . . . . . . . . . . . . . . . . . . . . . . . . . . . . . . $ 178.4Settlements and effective settlements with tax authorities . . . . . . . . . . . . . . . . . . . . . . . . . . (1.3)Lapse of statute of limitations . . . . . . . . . . . . . . . . . . . . . . . . . . . . . . . . . . . . . . . . . . . . . . . . (8.1)Increases in balances related to tax positions taken during prior periods . . . . . . . . . . . . . . . 5.5Decreases in balances related to tax positions taken during prior periods . . . . . . . . . . . . . . (2.0)Increases in balances related to tax positions taken during current period . . . . . . . . . . . . . . 18.0
Balance as of June 27, 2010 . . . . . . . . . . . . . . . . . . . . . . . . . . . . . . . . . . . . . . . . . . . . . . . . $ 190.5Settlements and effective settlements with tax authorities . . . . . . . . . . . . . . . . . . . . . . . . . . (24.2)Lapse of statute of limitations . . . . . . . . . . . . . . . . . . . . . . . . . . . . . . . . . . . . . . . . . . . . . . . . (5.2)Increases in balances related to tax positions taken during prior periods . . . . . . . . . . . . . . . 13.7Decreases in balances related to tax positions taken during prior periods . . . . . . . . . . . . . . (13.4)Increases in balances related to tax positions taken during current period . . . . . . . . . . . . . . 20.1
Balance as of June 26, 2011 . . . . . . . . . . . . . . . . . . . . . . . . . . . . . . . . . . . . . . . . . . . . . . . . 181.5Settlements and effective settlements with tax authorities . . . . . . . . . . . . . . . . . . . . . . . . . . (0.2)Lapse of statute of limitations . . . . . . . . . . . . . . . . . . . . . . . . . . . . . . . . . . . . . . . . . . . . . . . . (6.6)Increases in balances related to tax positions taken during prior periods . . . . . . . . . . . . . . . 1.4Decreases in balances related to tax positions taken during prior periods . . . . . . . . . . . . . . (4.3)Increases in balances related to tax positions taken during current period . . . . . . . . . . . . . . 22.3Tax positions assumed in Novellus transaction . . . . . . . . . . . . . . . . . . . . . . . . . . . . . . . . . . 149.7
Balance as of June 24, 2012 . . . . . . . . . . . . . . . . . . . . . . . . . . . . . . . . . . . . . . . . . . . . . . . . $ 343.8
90

The Company recognizes interest expense and penalties related to the above unrecognized tax benefitswithin income tax expense. The Company had accrued $25.2 million, $16.9 million, and $18.5 million,cumulatively, for gross interest and penalties as of June 24, 2012, June 26, 2011 and June 27, 2010, respectively.
The Internal Revenue Service (“IRS”) is examining the Company’s and Novellus’ U.S. income tax returnsfor fiscal years through 2009. As of June 24, 2012, no significant adjustments have been proposed by the IRS.The Company is unable to make a reasonable estimate as to when cash settlements, if any, with the relevanttaxing authorities will occur. In addition, the Company is also subject to audits by foreign tax authorities.
The Company files U.S. federal, U.S. state, and foreign income tax returns. As of June 24, 2012, tax years2003-2011 remain subject to examination in the jurisdictions where the Company operates.
The Company is in various stages of the examinations in connection with all of its tax audits worldwide andit is difficult to determine when these examinations will be settled. It is reasonably possible that over the nexttwelve-month period the Company may experience an increase or decrease in its unrecognized tax benefits. It isnot possible to determine either the magnitude or the range of any increase or decrease at this time.
Note 16: Acquisitions
On June 4, 2012 (“the acquisition date”), the Company acquired all of the outstanding common shares ofNovellus in an all-stock transaction valued at approximately $3.0 billion. The results of Novellus’ operationshave been included in the consolidated financial statements for the period from June 4, 2012 to June 24, 2012.Lam’s primary reasons for this acquisition were to complement existing product offerings and to provideopportunities for revenue and cost synergies. Novellus’ primary business focus is to develop, manufacture, selland support equipment used in the fabrication of integrated circuits, commonly called chips or semiconductors.Customers for this equipment manufacture chips for sale or for incorporation in their own products, or providechip-manufacturing services to third parties. Novellus also develops, manufactures, sells and supports grinding,lapping and polishing equipment for a broad spectrum of industrial applications.
As a result of the acquisition, Lam Research issued common stock and equity-based awards, subject tocertain exceptions, as follows:
(i) each issued and outstanding share of common stock of Novellus was converted into 1.125 (the“exchange ratio”) shares of Lam Research common stock, with cash paid in lieu of fractional shares;
(ii) each outstanding option for Novellus’ common stock held by a then-current employee of Novellus,whether vested or unvested, was assumed by Lam Research and converted into an option (A) to acquirethat number of shares of Lam Research common stock (rounded down to the nearest whole share)equal to the product of (x) the number of shares of Novellus common stock for which such option wasexercisable immediately prior to the acquisition date multiplied by (y) the exchange ratio and (B) withan exercise price per share of Lam Research (rounded up to the nearest whole penny) equal to thequotient obtained by dividing (z) the exercise price per share of Novellus common stock subject tosuch option immediately prior to the acquisition date divided by (y) the exchange ratio. Each assumedstock option will be subject to, and exercisable and vested on, the same terms and conditions applicableto such assumed stock option (consistent with the terms of the applicable Novellus stock plan, theapplicable stock option agreement and any other applicable Novellus plan) as of immediately prior tothe acquisition date; and
(iii) each outstanding Novellus RSU and each outstanding Novellus performance-based RSU (“PSU”) heldby a then-current employee of Novellus, whether vested or unvested, was assumed by Lam Researchand converted into a restricted stock unit to acquire the number of shares of Lam Research commonstock (rounded down to the nearest whole share) equal to the product obtained by multiplying (x) thenumber of shares of Novellus common stock subject to such RSU or PSU, as applicable, immediately
91

prior to the acquisition date by (y) 1.125. Novellus PSUs that vest in connection with theconsummation of the acquisition will become fully vested with respect to the maximum number ofshares of Novellus common stock payable pursuant to such Novellus PSU. Each assumed RSU or PSU,as applicable, will be subject to, and vested on, the same terms and conditions applicable to suchassumed RSU or PSU.
Consideration Transferred
The table below details the consideration transferred to acquire Novellus:
Conversion Estimated(in thousands, except per share amounts) Calculation Fair Value
Lam common stock issued at merger . . . . . . . . . . . . . . . . . . . . . . . . . . . . . . 82,689Per share price of Lam common stock as of June 4, 2012 . . . . . . . . . . . . . . $ 35.99 $2,975,977
Estimated fair value of vested Lam equivalent restricted stock (1) . . . . . . . . $ 9,599Estimated fair value of vested Lam equivalent stock options (2) . . . . . . . . . . 41,412
Estimated purchase price consideration . . . . . . . . . . . . . . . . . . . . . . . . . . $3,026,988
(1) The fair value of Lam Research equivalent restricted stock as of the acquisition date was estimated basedupon the per share price of Lam Research common stock as of June 4, 2012, and giving effect to theexchange ratio of 1.125.
(2) The fair value of the Lam Research equivalent stock options as of the acquisition date was estimated usingthe Black-Scholes valuation model. Assumptions used are the same as those for acquired awards asdisclosed in Note 11 of Notes to Condensed Consolidated Financial Statements.
Net Assets Acquired
The transaction has been accounted for using the acquisition method of accounting which requires thatassets acquired and liabilities assumed be recognized at their fair values as of the acquisition date. The followingtable summarizes the assets acquired and liabilities assumed as of the acquisition date:
June 4, 2012
(in thousands)
Cash and investments . . . . . . . . . . . . . . . . . . . . . . . . . . . . . $1,059,859Accounts receivable . . . . . . . . . . . . . . . . . . . . . . . . . . . . . . 241,924Inventory . . . . . . . . . . . . . . . . . . . . . . . . . . . . . . . . . . . . . . 309,213Other current assets . . . . . . . . . . . . . . . . . . . . . . . . . . . . . . 56,314Property and equipment . . . . . . . . . . . . . . . . . . . . . . . . . . . 289,126Intangible assets . . . . . . . . . . . . . . . . . . . . . . . . . . . . . . . . . 1,219,100Goodwill . . . . . . . . . . . . . . . . . . . . . . . . . . . . . . . . . . . . . . 1,277,121Other long-term assets . . . . . . . . . . . . . . . . . . . . . . . . . . . . 35,826
Total assets acquired . . . . . . . . . . . . . . . . . . . . . 4,488,483Accounts payable . . . . . . . . . . . . . . . . . . . . . . . . . . . . . . . . (83,028)Accrued expenses and other current liabilities . . . . . . . . . (196,677)Deferred revenue . . . . . . . . . . . . . . . . . . . . . . . . . . . . . . . . (20,388)Debt . . . . . . . . . . . . . . . . . . . . . . . . . . . . . . . . . . . . . . . . . . (509,805)Other long-term liabilities . . . . . . . . . . . . . . . . . . . . . . . . . (323,471)Convertible notes - equity component . . . . . . . . . . . . . . . . (328,126)
Net assets acquired . . . . . . . . . . . . . . . . . . . . . . . . . . $3,026,988
92

The following table is a summary of the fair value estimates of the identifiable intangible assets and theiruseful lives:
UsefulLives
EstimatedFair ValueJune 4, 2012
(in thousands, except years)
Existing technology . . . . . . . . . . . . . . . . . . . . . . . . . . . . 7 $ 580,000Customer relationships . . . . . . . . . . . . . . . . . . . . . . . . . 6-10 580,000In-process research and design . . . . . . . . . . . . . . . . . . . Indefinite 30,000Patents . . . . . . . . . . . . . . . . . . . . . . . . . . . . . . . . . . . . . . 6 10,000Backlog . . . . . . . . . . . . . . . . . . . . . . . . . . . . . . . . . . . . . 1 10,000Additional development rights . . . . . . . . . . . . . . . . . . . Indefinite 9,100
Total . . . . . . . . . . . . . . . . . . . . . . . . . . . . . . . . . . . . . . . . $1,219,100
The goodwill recognized is attributable primarily to expected synergies and other benefits that the Companybelieves will result from combining the operations of Novellus with the operations of Lam. The $1.3 billiongoodwill that was acquired is not expected to be deductible for income tax purposes. As of June 24, 2012, therewere no changes in the recognized amounts of goodwill resulting from the acquisition of Novellus.
Preliminary Pre-Acquisition Contingencies Assumed
We have evaluated and continue to evaluate pre-acquisition contingencies relating to Novellus that existedas of the acquisition date. We have determined that certain of these pre-acquisition contingencies are probable innature and estimable as of the acquisition date and, accordingly, have preliminarily recorded our best estimatesfor these contingencies as a part of the purchase price allocation for Novellus. We continue to gather informationfor and evaluate these pre-acquisition contingencies, primarily related to tax positions that we have assumed fromNovellus. If we make changes to the amounts recorded or identify additional pre-acquisition contingenciesduring the remainder of the measurement period, such amounts recorded will be included in the purchase priceallocation during the measurement period and, subsequently, in our results of operations.
Acquisition Costs
The Company recognized $36 million of acquisition related costs that were expensed in the year endedJune 24, 2012. These costs are included within selling, general, and administrative expense in the ConsolidatedStatement of Operations.
Actual and Pro-forma Results
The amounts of revenue and net income (loss) of Novellus included in the Company’s consolidatedStatement of Operations from the acquisition date to June 24, 2012 are as follows:
(in thousands)
Revenue . . . . . . . . . . . . . . . . . . . . . . . . . . . . . . . . . . . . . . . $ 25,843Net income (loss) . . . . . . . . . . . . . . . . . . . . . . . . . . . . . . . . $(29,187)
The unaudited pro-forma results presented below include the effects of the Novellus acquisition as if it hadbeen consummated as of June 28, 2010. The pro forma results below include adjustments related to conformingrevenue accounting policies, depreciation and amortization to reflect the fair value of acquired property, plantand equipment and identifiable intangible assets, and the associated income tax impacts. The pro forma resultsfor the years ended June 24, 2012 include $122 million of costs related to inventory fair value adjustments onproducts sold, share-based compensation associated with accelerated vesting and acquisition-related costs, which
93

are not expected to occur in future quarters. The pro forma information does not necessarily reflect the actualresults of operations had the acquisition been consummated at the beginning of the fiscal reporting periodindicated nor is it indicative of future operating results. The pro forma information does not include anyadjustment for (i) potential revenue enhancements, cost synergies or other operating efficiencies that could resultfrom the acquisition or (ii) transaction or integration costs relating to the acquisition.
Year Ended
June 24,2012
June 26,2011
(in thousands, except per share amounts)
Pro forma revenue . . . . . . . . . . . . . . . . . . . . . $3,804,252 $4,743,797Pro forma net income . . . . . . . . . . . . . . . . . . . $ 152,981 $ 894,864Pro forma basic earnings per share . . . . . . . . $ 0.76 $ 4.34Pro forma diluted earnings per share . . . . . . . $ 0.74 $ 4.18
Note 17: Goodwill and Intangible Assets
Goodwill
There were no changes in the goodwill balance during the twelve months ended June 26, 2011. The balanceof goodwill increased from $169 million as of June 26, 2011 to $1.4 billion as of June 24, 2012 as a result of $1.3billion of goodwill acquired in the Novellus acquisition.
Of the $1.4 billion goodwill balance, $61 million is tax deductible and the remaining balance is not taxdeductible due to purchase accounting and applicable foreign law.
The Company’s goodwill is measured at fair value when an impairment exits. Goodwill is assessed at leastannually for impairment. The Company did not record impairments of goodwill during the years ended June 24,2012, June 26, 2011, or June 27, 2010.
Intangible Assets
The acquisition of Novellus during the quarter ended June 24, 2012 resulted in an increase of $1.2 billion inintangible assets. The following table provides the Company’s intangible assets as of June 24, 2012 (inthousands, except years):
Gross*AccumulatedAmortization Net
Weighted-Average Useful
Life (years)
Customer relationships . . . . . . . . . . . . . . . . . . . . . . . . . . . $ 615,411 $ (32,041) $ 583,370 9.04Existing technology . . . . . . . . . . . . . . . . . . . . . . . . . . . . . 642,311 (48,378) 593,933 6.97Patents . . . . . . . . . . . . . . . . . . . . . . . . . . . . . . . . . . . . . . . 30,870 (17,525) 13,345 6.05Backlog . . . . . . . . . . . . . . . . . . . . . . . . . . . . . . . . . . . . . . 10,000 (548) 9,452 1.00Other intangible assets . . . . . . . . . . . . . . . . . . . . . . . . . . . 35,216 (33,989) 1,227 4.10
Intangible assets subject to amortization . . . . . . . . . . . . . 1,333,808 (132,481) 1,201,327IP R&D . . . . . . . . . . . . . . . . . . . . . . . . . . . . . . . . . . . . . . . 30,000 — 30,000Development rights . . . . . . . . . . . . . . . . . . . . . . . . . . . . . 9,100 — 9,100
Intangible assets not subject to amortization . . . . . . . . . . 39,100 — 39,100
Total intangible assets . . . . . . . . . . . . . . . . . . . . . . . . . . . $1,372,908 $(132,481) $1,240,427
* Includes impact of foreign currency translation adjustments
94

The following table provides details of the Company’s intangible assets as of June 26, 2011 (in thousands,except years):
GrossAccumulatedAmortization Net
Weighted-Average Useful
Life (years)
Customer relationships . . . . . . . . . . . . . . . . . . . $ 35,226 $ (23,468) $11,758 6.90Existing technology . . . . . . . . . . . . . . . . . . . . . 61,941 (35,409) 26,532 6.68Patents . . . . . . . . . . . . . . . . . . . . . . . . . . . . . . . 20,670 (14,323) 6,347 6.11Other intangible assets . . . . . . . . . . . . . . . . . . . 35,216 (32,419) 2,797 4.10
Total intangible assets . . . . . . . . . . . . . . . . . . . $153,053 $(105,619) $47,434 6.06
The Company recognized $26.9 million, $21.0 million, and $23.9 million, in intangible asset amortizationexpense during fiscal years 2012, 2011, and 2010, respectively.
The estimated future amortization expense of intangible assets, excluding those with indefinite lives, as ofJune 24, 2012 was as follows (in thousands):
Fiscal Year Amount
2013 . . . . . . . . . . . . . . . . . . . . . . . . . . . . . . . . . . . . . . . . . . . $ 176,3922014 . . . . . . . . . . . . . . . . . . . . . . . . . . . . . . . . . . . . . . . . . . . 160,9682015 . . . . . . . . . . . . . . . . . . . . . . . . . . . . . . . . . . . . . . . . . . . 152,7282016 . . . . . . . . . . . . . . . . . . . . . . . . . . . . . . . . . . . . . . . . . . . 150,9052017 . . . . . . . . . . . . . . . . . . . . . . . . . . . . . . . . . . . . . . . . . . . 150,646Thereafter . . . . . . . . . . . . . . . . . . . . . . . . . . . . . . . . . . . . . . 409,688
$1,201,327
Note 18: Segment, Geographic Information and Major Customers
The Company operates in one reportable business segment: manufacturing and servicing of waferprocessing semiconductor manufacturing equipment. The Company’s material operating segments qualify foraggregation due to their customer base and similarities in economic characteristics, nature of products andservices, and processes for procurement, manufacturing and distribution.
The Company operates in six geographic regions: North America, Europe, Japan, Korea, Taiwan, and AsiaPacific. For geographical reporting, revenue is attributed to the geographic location in which the customers’facilities are located while long-lived assets are attributed to the geographic locations in which the assets arelocated.
Revenues and long-lived assets by geographic region were as follows:
Year Ended
June 24,2012
June 26,2011
June 27,2010
(in thousands)
Revenue:Korea . . . . . . . . . . . . . . . . . . . . . . . . . . . . . . $ 893,549 $ 756,660 $ 539,312Taiwan . . . . . . . . . . . . . . . . . . . . . . . . . . . . . 467,922 766,910 703,854North America . . . . . . . . . . . . . . . . . . . . . . . 458,531 393,004 186,036Japan . . . . . . . . . . . . . . . . . . . . . . . . . . . . . . 308,189 405,371 318,641Asia Pacific . . . . . . . . . . . . . . . . . . . . . . . . . 292,963 492,600 252,248Europe . . . . . . . . . . . . . . . . . . . . . . . . . . . . . 244,038 423,148 133,685
Total revenue . . . . . . . . . . . . . . . . . . . . $2,665,192 $3,237,693 $2,133,776
95

June 24,2012
June 26,2011
June 27,2010
(in thousands)
Long-lived assets:North America . . . . . . . . . . . . . . . . . . . . . . . . . . . $463,156 $191,221 $136,601Europe . . . . . . . . . . . . . . . . . . . . . . . . . . . . . . . . . 107,893 69,442 56,256Asia Pacific . . . . . . . . . . . . . . . . . . . . . . . . . . . . . 8,317 3,738 3,922Taiwan . . . . . . . . . . . . . . . . . . . . . . . . . . . . . . . . . 3,169 3,897 2,385Japan . . . . . . . . . . . . . . . . . . . . . . . . . . . . . . . . . . . 1,068 1,067 658Korea . . . . . . . . . . . . . . . . . . . . . . . . . . . . . . . . . . 993 1,093 514
Total long-lived assets . . . . . . . . . . . . . . . . . $584,596 $270,458 $200,336
In fiscal year 2012, three customers accounted for approximately 30%, 12%, and 10% of total revenues. Infiscal year 2011, one customer accounted for approximately 24% of total revenues. In fiscal year 2010, threecustomers accounted for approximately 24%, 15%, and 11% of total revenues.
Note 19: Restructuring and Asset Impairments
Prior to the end of each of the June 2008, December 2008, and March 2009 quarters, the Company initiatedthe announced restructuring activities and management, with the proper level of authority, approved specificactions under the June 2008, December 2008, and March 2009 Plans. Severance packages to affected employeeswere communicated in enough detail such that the employees could determine their type and amount of benefit.The termination of the affected employees occurred as soon as practical after the restructuring plans wereannounced. The amount of remaining future lease payments and certain contractual obligations for facilities theCompany ceased to use and included in the restructuring charges is based on management’s estimates usingknown prevailing real estate market conditions at that time based, in part, on the opinions of independent realestate experts. Leasehold improvements relating to the vacated buildings were written off, as it was determinedthat these items would have no future economic benefit to the Company and have been abandoned.
Accounting for restructuring activities, as compared to regular operating cost management activities,requires an evaluation of formally committed and approved plans. Restructuring activities have comparativelygreater strategic significance and materiality and may involve exit activities, whereas regular cost containmentactivities are more tactical in nature and are rarely characterized by formal and integrated action plans or exitinga particular product, facility, or service.
The following table summarizes restructuring and asset impairment charges (recoveries) during fiscal years2012, 2011, and 2010 for each restructuring Plan:
Year Ended
June 24,2012
June 26,2011
June 27,2010
(in thousands)
June 2008 Plan . . . . . . . . . . . . . . . . . . . . . . . . . . . . . . . . . . . . . . . . . . . $ (859) $ — $ (2,217)December 2008 Plan . . . . . . . . . . . . . . . . . . . . . . . . . . . . . . . . . . . . . . — (230) 92March 2009 Plan . . . . . . . . . . . . . . . . . . . . . . . . . . . . . . . . . . . . . . . . . — 11,809 20,891
Total restructuring and asset impairment charges incurred underrestructuring plans . . . . . . . . . . . . . . . . . . . . . . . . . . . . . . . . . . . . . . (859) 11,579 18,766
Asset impairments outside of specific restructuring plans . . . . . . . . . 1,725 — 5,986
Total restructuring and asset impairment charges . . . . . . . . . . . . . . . . $ 866 $11,579 $24,752
96

The amounts in the table above were reported in the Company’s consolidated statement of operations forfiscal years ended 2012, 2011, and 2010 as follows:
Year Ended
June 24,2012
June 26,2011
June 27,2010
(in thousands)
Cost of goods sold . . . . . . . . . . . . . . . . . . . . . . . . . . . . . . . . $ (859) $ — $ 3,438Operating expense . . . . . . . . . . . . . . . . . . . . . . . . . . . . . . . . 1,725 11,579 21,314
Total restructuring and asset impairments . . . . . . . . . . . . . . $ 866 $11,579 $24,752
June 2008 Plan
During the June 2008 quarter, the Company incurred restructuring expenses and asset impairment chargesrelated to the integration of SEZ and overall streamlining of the Company’s combined Clean Product Group(“June 2008 Plan”). Charges (recoveries) during fiscal years 2012, 2011, and 2010 were as follows:
Year Ended
June 24,2012
June 26,2011
June 27,2010
(in thousands)
Severance and benefits . . . . . . . . . . . . . . . . . . . . . . . . . . . . . . $ — $— $ (42)Inventory . . . . . . . . . . . . . . . . . . . . . . . . . . . . . . . . . . . . . . . . (859) — (2,175)
Total restructuring and asset impairment charges . . . . . . . . . $(859) $— $(2,217)
Total charges incurred as of June 24, 2012 under the June 2008 Plan were $34.9 million. There was noremaining liability under the June 2008 Plan as of either June 24, 2012 or June 26, 2011.
December 2008 Plan
During the December 2008 quarter, the Company incurred restructuring expenses and asset impairmentcharges designed to better align the Company’s cost structure with its business opportunities in consideration ofmarket and economic uncertainties (“December 2008 Plan”). Charges during fiscal years 2012, 2011, and 2010were as follows:
Year Ended
June 24,2012
June 26,2011
June 27,2010
(in thousands)
Severance and benefits . . . . . . . . . . . . . . . . . . . . . . . . . . . . . . $— $(230) $92
Total restructuring and asset impairment charges . . . . . . . . . $— $(230) $92
97

Below is a table summarizing activity relating to the December 2008 Plan:
Severance andBenefits
(in thousands)
Balance at June 28, 2009 . . . . . . . . . . . . . . . . . . . . . . . . . . $ 684Fiscal year 2010 expense . . . . . . . . . . . . . . . . . . . . . . . . . . 92Cash payments . . . . . . . . . . . . . . . . . . . . . . . . . . . . . . . . . . (497)
Balance at June 27, 2010 . . . . . . . . . . . . . . . . . . . . . . . . . . 279Cash payments . . . . . . . . . . . . . . . . . . . . . . . . . . . . . . . . . . (27)Fiscal year 2011 expense . . . . . . . . . . . . . . . . . . . . . . . . . . (230)
Balance at June 26, 2011 . . . . . . . . . . . . . . . . . . . . . . . . . . 22Cash payments . . . . . . . . . . . . . . . . . . . . . . . . . . . . . . . . . . (22)
Balance at June 24, 2012 . . . . . . . . . . . . . . . . . . . . . . . . . . $ —
Total charges incurred as of June 24, 2012 under the December 2008 Plan were $17.7 million.
March 2009 Plan
During the March 2009 quarter, the Company incurred restructuring expenses and asset impairment chargesdesigned to align the Company’s cost structure with its outlook for the current economic environment and futurebusiness opportunities (“March 2009 Plan”). Restructuring and asset impairment charges during fiscal years2012, 2011, and 2010 under the March 2009 Plan were as follows:
Year Ended
June 24,2012
June 26,2011
June 27,2010
(in thousands)
Severance and benefits . . . . . . . . . . . . . . . . . . . . . . . . . . . . . $— $ (43) $ 472Facilities . . . . . . . . . . . . . . . . . . . . . . . . . . . . . . . . . . . . . . . . 11,852 19,832Abandoned assets . . . . . . . . . . . . . . . . . . . . . . . . . . . . . . . . . — — 587
Total restructuring and asset impairment charges . . . . . . . . $— $11,809 $20,891
Below is a table summarizing activity relating to the March 2009 Plan:
Severance andBenefits Facilities
AbandonedAssets Total
(in thousands)
Balance at June 28, 2009 . . . . . . . . . . . . . . . . . . . . $ 3,925 $ 437 $ — $ 4,362Fiscal year 2010 expense . . . . . . . . . . . . . . . . . . . . 472 19,832 587 20,891Cash payments . . . . . . . . . . . . . . . . . . . . . . . . . . . . (4,132) (3,417) — (7,549)Non-cash charges . . . . . . . . . . . . . . . . . . . . . . . . . . — — (587) (587)
Balance at June 27, 2010 . . . . . . . . . . . . . . . . . . . . 265 16,852 — 17,117Fiscal year 2011 expense . . . . . . . . . . . . . . . . . . . . (43) 11,852 — 11,809Cash payments . . . . . . . . . . . . . . . . . . . . . . . . . . . . (222) (598) — (820)
Balance at June 26, 2011 . . . . . . . . . . . . . . . . . . . . — 28,106 — 28,106Cash payments . . . . . . . . . . . . . . . . . . . . . . . . . . . . — (357) — (357)
Balance at June 24, 2012 . . . . . . . . . . . . . . . . . . . . $ — $27,749 $ — $27,749
Total charges incurred as of June 24, 2012 under the March 2009 Plan were $61.3 million. The facilitiesbalance consists primarily of lease payments, net of sublease income, on vacated buildings and is expected to bepaid by the end of fiscal year 2015.
98

Acquired Restructuring Liabilities
In addition to restructuring plans initiated by the Company, a restructuring liability of $11.2 million wasassumed in the Novellus acquisition related to future rent obligations on unoccupied facilities.
Note 20: Stock Repurchase Program
On September 10, 2010, the Board of Directors authorized the repurchase of up to $250 million of Companycommon stock and on September 1, 2011 the Board of Directors authorized the repurchase of up to an additional$500 million of Company common stock. On December 14, 2011, the Board of Directors authorized therepurchase of up to $1.6 billion of Company common stock, which replaces the previous repurchaseauthorizations. These repurchases can be conducted on the open market or as private purchases and may includethe use of derivative contracts with large financial institutions, in all cases subject to compliance with applicablelaw. Repurchases will be funded using the Company’s available cash. This repurchase program has notermination date and may be suspended or discontinued at any time.
Repurchases under the repurchase program were as follows during the periods indicated:
Period
Total Number ofShares
RepurchasedTotal Cost ofRepurchase
Average Price PaidPer Share*
Amount AvailableUnder Repurchase
Program
(in thousands, except per share data)
Available balance as of June 26, 2011 . . . . . . $ 249,244Authorization of additional $500 million -
September 2011 . . . . . . . . . . . . . . . . . . . . . — $ — $ — $ 749,244Quarter ended September 25, 2011 . . . . . . . . 1,977 $ 74,287 $37.57 $ 674,957Quarter ended December 25, 2011 . . . . . . . . . 2,860 $110,637 $38.69 $ 564,320Authorization of replacement $1.6 billion
plan - December 2011 . . . . . . . . . . . . . . . . . $1,600,000Quarter ended March 25, 2012 . . . . . . . . . . . . 300 $ 12,513 $41.71 $1,587,487Quarter ended June 24, 2012 . . . . . . . . . . . . . 16,323 $675,554 $37.55 $ 911,933
* Average price excludes accelerated share repurchases that had not settled as of June 24, 2012 as the final priceper share for these repurchases was not known until each transactions’ settlement date in fiscal 2013.
In addition to shares repurchased under Board authorized repurchase program shown above, the Companyacquired 486,000 shares at a total cost of $20.5 million which the Company withheld through net sharesettlements to cover minimum tax withholding obligations upon the vesting of restricted stock unit awardsgranted under the Company’s equity compensation plans. The shares retained by the Company through these netshare settlements are not a part of the Board-authorized repurchase program but instead are authorized under theCompany’s equity compensation plans.
As part of its share repurchase program, the Company may from time-to-time enter into structured sharerepurchase arrangements with financial institutions using general corporate funds. During fiscal year 2012 sucharrangements included the following.
Cash Enhanced Share Repurchases
Under cash enhanced share repurchases, the Company is required to make an up-front cash payment inexchange for the right to receive shares of its common stock or cash at the expiration of the agreement,dependent upon the closing price of the Corporation’s common stock at the settlement date. During the yearended June 24, 2012 one such arrangement resulted in the receipt of 2.6 million shares upon settlement at anaggregate price of $100.0 million and two such arrangements were settled in cash for an aggregate of $130.2million. All cash enhanced share repurchase agreements during fiscal year 2012 were executed prior to theDecember 2011 $1.6 billion buyback authorization. As of June 24, 2012 there are no outstanding prepayments
99
under such arrangements. Under these arrangements, any prepayments or cash payments at settlement arerecorded as a component of Additional paid in capital in the Company’s Consolidated Balance Sheet.
Collared Accelerated Share Repurchases
During the year ended June 24, 2012, the Company entered into two share repurchase transactions underone master repurchase arrangement. Under these collared accelerated share repurchase transactions (“ASRs”),the Company made up-front cash payments of $375 million and $200 million, respectively, three days after therespective trade date in exchange for an initial delivery of 6.6 million and 3.9 million shares of its common stock,respectively. The number of shares to ultimately be repurchased by the Company is based generally on thevolume-weighted average price (“VWAP”) of the Company’s common stock during the term of the ASR minus apre-determined discount set at inception of the ASR, subject to collar provisions that provide a minimum andmaximum number of shares that the Company could repurchase under the agreements.
The minimum and maximum thresholds for each transaction are established based on the average of theVWAP prices for the Company’s common stock during an initial hedge period. The Company receivedincremental shares on top of the initial shares delivered such that the total number of shares received after theinitial hedge period equaled 8.8 million and 4.8 million shares, equivalent to the minimum number of shares tobe delivered under the terms of the ASRs, respectively. The ASRs were scheduled to end on or beforeSeptember 18, 2012 and October 9, 2012, respectively. However, each ASR is subject to acceleration at theoption of the counterparty at any time after June 27, 2012 and July 19, 2012, respectively. At the conclusion ofthe ASRs, the Company may receive additional shares based on the VWAP of the Company’s common stockduring the term of the agreement minus the pre-determined fixed discount, such that the total number of sharesreceived under the ASRs does not exceed the maximum of 10.8 million 6.6 million shares, respectively.
The Company accounted for each ASR as two separate transactions: (a) as shares of common stock acquiredin a treasury stock transaction recorded on the acquisition date and (b) as a forward contract indexed to theCompany’s own common stock and classified in stockholders’ equity. As such, the Company accounted for theshares that it received under the ASRs as a repurchase of its common stock for the purpose of calculatingearnings per common share. The Company has determined that the forward contract indexed to the Company’scommon stock met all of the applicable criteria for equity classification in accordance with the Derivatives andHedging topic of the FASB ASC, and, therefore, the ASRs were not accounted for as derivative instruments. Asof June 24, 2012, the aggregate repurchase price of $575.0 million is reflected as Treasury stock, at cost, in theCondensed consolidated balance sheet.
The counterparty designated July 6, 2012 as the accelerated termination date, at which time the Companysettled the $375 million ASR and received an additional 1.3 million shares of common stock in addition to theminimum shares already received, which represented a weighted average share price of approximately $36.80 forthe transaction period. The counterparty designated July 25, 2012 as the accelerated termination date, at whichtime the Company settled the $200 million ASR and received an additional 0.7 million shares of common stockin addition to the minimum shares already received, which represented a weighted average share price ofapproximately $36.12 for the transaction period.
Note 21: Legal Proceedings
The Company is either a defendant or plaintiff in various actions that have arisen from time to time in thenormal course of business, including intellectual property claims. The Company accrues for a liability when it isboth probable that a liability has been incurred and the amount of the loss can be reasonably estimated.Significant judgment is required in both the determination of probability and the determination as to whether aloss is reasonably estimable. These accruals are reviewed at least quarterly and adjusted to reflect the effects ofnegotiations, settlements, rulings, advice of legal counsel, and other information and events pertaining to aparticular matter. To the extent there is a reasonable possibility that the losses could exceed the amounts alreadyaccrued, the Company believes that the amount of any such additional loss would be immaterial to theCompany’s business, financial condition, and results of operations.
100

Report of Independent Registered Public Accounting Firm
The Board of Directors and Stockholders of Lam Research Corporation
We have audited the accompanying consolidated balance sheets of Lam Research Corporation as of June 24,2012 and June 26, 2011, and the related consolidated statements of operations, stockholders’ equity, and cashflows for each of the three years in the period ended June 24, 2012. Our audits also included the financialstatement schedule listed in the Index at Item 15. These financial statements and schedule are the responsibilityof the Company’s management. Our responsibility is to express an opinion on these financial statements andschedule based on our audits.
We conducted our audits in accordance with the standards of the Public Company Accounting OversightBoard (United States). Those standards require that we plan and perform the audit to obtain reasonable assuranceabout whether the financial statements are free of material misstatement. An audit includes examining, on a testbasis, evidence supporting the amounts and disclosures in the financial statements. An audit also includesassessing the accounting principles used and significant estimates made by management, as well as evaluatingthe overall financial statement presentation. We believe that our audits provide a reasonable basis for ouropinion.
In our opinion, the financial statements referred to above present fairly, in all material respects, theconsolidated financial position of Lam Research Corporation at June 24, 2012 and June 26, 2011, and theconsolidated results of its operations and its cash flows for each of the three years in the period ended June 24,2012, in conformity with U.S. generally accepted accounting principles. Also, in our opinion, the relatedfinancial statement schedule, when considered in relation to the basic financial statements taken as a whole,presents fairly in all material respects the information set forth therein.
We also have audited, in accordance with the standards of the Public Company Accounting Oversight Board(United States), Lam Research Corporation’s internal control over financial reporting as of June 24, 2012, basedon criteria established in Internal Control-Integrated Framework issued by the Committee of SponsoringOrganizations of the Treadway Commission and our report dated August 22, 2012 expressed an unqualifiedopinion thereon.
/s/ ERNST & YOUNG LLP
San Jose, CaliforniaAugust 22, 2012
101

Report of Independent Registered Public Accounting Firm
The Board of Directors and Stockholders of Lam Research Corporation
We have audited Lam Research Corporation’s internal control over financial reporting as of June 24, 2012,based on criteria established in Internal Control — Integrated Framework issued by the Committee of SponsoringOrganizations of the Treadway Commission (the COSO criteria). Lam Research Corporation’s management isresponsible for maintaining effective internal control over financial reporting, and for its assessment of theeffectiveness of internal control over financial reporting included in the accompanying Management’s Report onInternal Control Over Financial Reporting. Our responsibility is to express an opinion on the company’s internalcontrol over financial reporting based on our audit.
We conducted our audit in accordance with the standards of the Public Company Accounting OversightBoard (United States). Those standards require that we plan and perform the audit to obtain reasonable assuranceabout whether effective internal control over financial reporting was maintained in all material respects. Ouraudit included obtaining an understanding of internal control over financial reporting, assessing the risk that amaterial weakness exists, testing and evaluating the design and operating effectiveness of internal control basedon the assessed risk, and performing such other procedures as we considered necessary in the circumstances. Webelieve that our audit provides a reasonable basis for our opinion.
A company’s internal control over financial reporting is a process designed to provide reasonable assuranceregarding the reliability of financial reporting and the preparation of financial statements for external purposes inaccordance with generally accepted accounting principles. A company’s internal control over financial reportingincludes those policies and procedures that (1) pertain to the maintenance of records that, in reasonable detail,accurately and fairly reflect the transactions and dispositions of the assets of the company; (2) provide reasonableassurance that transactions are recorded as necessary to permit preparation of financial statements in accordancewith generally accepted accounting principles, and that receipts and expenditures of the company are being madeonly in accordance with authorizations of management and directors of the company; and (3) provide reasonableassurance regarding prevention or timely detection of unauthorized acquisition, use, or disposition of thecompany’s assets that could have a material effect on the financial statements.
Because of its inherent limitations, internal control over financial reporting may not prevent or detectmisstatements. Also, projections of any evaluation of effectiveness to future periods are subject to the risk thatcontrols may become inadequate because of changes in conditions, or that the degree of compliance with thepolicies or procedures may deteriorate.
As indicated in the accompanying Management’s Report on Internal Control Over Financial Reporting,management’s assessment of and conclusion on the effectiveness of internal control over financial reporting did notinclude the internal controls of Novellus Systems, which is included in the June 24, 2012 consolidated financialstatements of Lam Research Corporation, and constituted 25 percent and 23 percent of total and net assets,respectively, excluding acquisition method fair value adjustments as of June 24, 2012 and 1 percent of revenues, forthe year then ended. Our audit of internal control over financial reporting of Lam Research Corporation also did notinclude an evaluation of the internal control over financial reporting of Novellus Systems.
In our opinion, Lam Research Corporation maintained, in all material respects, effective internal controlover financial reporting as of June 24, 2012, based on the COSO criteria.
We also have audited, in accordance with the standards of the Public Company Accounting Oversight Board(United States), the consolidated balance sheets of Lam Research Corporation as of June 24, 2012 and June 26,2011, and the related consolidated statements of operations, stockholders’ equity and cash flows for each of thethree years in the period ended June 24, 2012 of Lam Research Corporation and our report dated August 22, 2012expressed an unqualified opinion thereon.
/s/ ERNST & YOUNG LLP
San Jose, CaliforniaAugust 22, 2012
102

SIGNATURES
Pursuant to the requirements of Section 13 or 15(d) of the Securities Exchange Act of 1934, as amended, theRegistrant has duly caused this Report to be signed on its behalf by the undersigned, thereunto duly authorized.
LAM RESEARCH CORPORATION
By /s/ Martin B. Anstice
Martin B. AnsticePresident and Chief Executive Officer
Dated: August 22, 2012
103

POWER OF ATTORNEY AND SIGNATURES
By signing this Annual Report on Form 10-K below, I hereby appoint each of Martin B. Anstice and ErnestE. Maddock, jointly and severally, as my attorney-in-fact to sign all amendments to this Form 10-K on mybehalf, and to file this Form 10-K (including all exhibits and other related documents) with the Securities andExchange Commission. I authorize each of my attorneys-in-fact to (1) appoint a substitute attorney-in-fact forhimself and (2) perform any actions that he believes are necessary or appropriate to carry out the intention andpurpose of this Power of Attorney. I ratify and confirm all lawful actions taken directly or indirectly by myattorneys-in-fact and by any properly appointed substitute attorneys-in-fact.
Pursuant to the requirements of the Securities Exchange Act of 1934, as amended, this Report has beensigned below by the following persons on behalf of the Registrant and in the capacities and on the datesindicated.
Signatures Title Date
Principal Executive Officer
/s/ Martin B. Anstice
Martin B. Anstice
President and Chief ExecutiveOfficer
August 22, 2012
Principal Financial Officer and PrincipalAccounting Officer
/s/ Ernest E. Maddock
Ernest E. Maddock
Senior Vice President, ChiefFinancial Officer, andChief Accounting Officer
August 22, 2012
Other Directors
/s/ James W. Bagley
James W. Bagley
Executive Chairman August 22, 2012
/s/ Stephen G. Newberry
Stephen G. Newberry
Vice Chairman August 22, 2012
/s/ Robert M. Berdahl
Robert M. Berdahl
Director August 22, 2012
/s/ Eric K. Brandt
Eric K. Brandt
Director August 22, 2012
/s/ Michael R. Cannon
Michael R. Cannon
Director August 22, 2012
/s/ Youssef A. El-Mansy
Youssef A. El-Mansy
Director August 22, 2012
/s/ Christine Heckart
Christine Heckart
Director August 22, 2012
/s/ Grant M. Inman
Grant M. Inman
Director August 22, 2012
/s/ Catherine P. Lego
Catherine P. Lego
Director August 22, 2012
104

Signatures Title Date
/s/ Kim Perdikou
Kim Perdikou
Director August 22, 2012
/s/ Krishna Saraswat
Krishna Saraswat
Director August 22, 2012
/s/ William R. Spivey
William R. Spivey
Director August 22, 2012
/s/ Abhi Talwalkar
Abhi Talwalkar
Director August 22, 2012
/s/ Delbert A. Whitaker
Delbert A. Whitaker
Director August 22, 2012
105

LAM RESEARCH CORPORATIONSCHEDULE II — VALUATION AND QUALIFYING ACCOUNTS
Additions
DescriptionBalance at
Beginning of PeriodCharged to Costs
and ExpensesWrite-offs, Net of
Recoveries (1)Balance at End of
Period
(in thousands)
YEAR ENDED JUNE 24, 2012Deducted from asset accounts:
Allowance for doubtful accounts . . . $ 4,720,000 $403,000 $ 125,000 $ 5,248,000YEAR ENDED JUNE 26, 2011Deducted from asset accounts:
Allowance for doubtful accounts . . . $10,609,000 $290,000 $(6,179,000) $ 4,720,000YEAR ENDED JUNE 27, 2010Deducted from asset accounts:
Allowance for doubtful accounts . . . $10,719,000 $ 45,000 $ (155,000) $10,609,000
(1) During fiscal year 2012, write-off, net of recoveries represents $0.1 million of recoveries against previouslywritten-off balancesDuring fiscal year 2011, write-off, net of recoveries represents $3.8 million release of reserve and $2.4million write-off of customer specific accounts.During fiscal year 2010, write-off, net of recoveries represents $0.2 million of write-offs of specificcustomer accounts.
106

LAM RESEARCH CORPORATION
ANNUAL REPORT ON FORM 10-KFOR THE FISCAL YEAR ENDED JUNE 24, 2012
EXHIBIT INDEX
Exhibit Description
3.1(2) Certificate of Incorporation of the Registrant, dated September 7, 1989; as amended by theAgreement and Plan of Merger, Dated February 28, 1990; the Certificate of Amendment datedOctober 28, 1993; the Certificate of Ownership and Merger dated December 15, 1994; the Certificateof Ownership and Merger dated June 25, 1999 and the Certificate of Amendment effective as ofMarch 7, 2000; and the Certificate of Amendment effective as of November 5, 2009.
3.2(14) Bylaws of the Registrant, as amended, dated June 2, 2012.
3.3(2) Certificate of Designation, Preferences and Rights of Series A Junior Participating Preferred Stockdated January 27, 1997.
4.1(16) Indenture (including Form of Notes), dated as of May 11, 2011, by and between Lam ResearchCorporation, and The Bank of New York Mellon Trust Company, N.A, as trustee, with respect to the2016 Notes
4.2(16) Indenture (including Form of Notes), dated as of May 11, 2011, by and between Lam ResearchCorporation, and The Bank of New York Mellon Trust Company, N.A, as trustee, with respect to the2018 Notes
4.8(5)* Amended and restated 1997 Stock Incentive Plan.
4.12(4)* Amended and restated 1999 Stock Option Plan.
4.13(11)* Lam Research Corporation 1999 Employee Stock Purchase Plan, as amended.
4.14(11)* Lam Research Corporation 2004 Executive Incentive Plan, as amended.
4.15(7)* Lam Research Corporation 2007 Stock Incentive Plan, as amended.
4.16(17)* Lam Research Corporation Elective Deferred Compensation Plan.
4.17(17)* Lam Research Corporation Elective Deferred Compensation Plan II.
4.18(20) Indenture between Novellus Systems, Inc. as Issuer and The Bank of New York Mellon TrustCompany, N.A. as Trustee, dated as of May 10, 2011, including the form of 2.625% SeniorConvertible Notes due 2041.
4.19(14) Supplemental Indenture among the Registrant, as Guarantor, Novellus Systems, Inc. as Issuer andThe Bank of New York Mellon Trust Company, N.A. as Trustee, dated as of June 4, 2012.
10.3(1)* Form of Indemnification Agreement.
10.99(3)* Form of Nonstatutory Stock Option Agreement — Lam Research Corporation 1997 Stock IncentivePlan.
10.102(6) Form of Restricted Stock Unit Award Agreement (U.S. Agreement A) — Lam Research Corporation1997 Stock Incentive Plan.
10.103(6) Form of Restricted Stock Unit Award Agreement (non-U.S. Agreement I-A) — Lam ResearchCorporation 1997 Stock Incentive Plan.
10.106(8)* Form of Restricted Stock Unit Award Agreement (U.S. Agreement) — Lam Research Corporation2007 Stock Incentive Plan
10.107(9) Form of Restricted Stock Unit Award Agreement — Outside Directors (U.S. Agreement) — LamResearch Corporation 2007 Stock Incentive Plan.
107

10.108(9) Form of Restricted Stock Unit Award Agreement — Outside Directors (non-U.S. Agreement) —Lam Research Corporation 2007 Stock Incentive Plan.
10.117(10) Lease Agreement (Fremont Building #1) between Lam Research Corporation and BNP ParibasLeasing Corporation, dated December 21, 2007.
10.118(10) Pledge Agreement (Fremont Building #1) between Lam Research Corporation and BNP ParibasLeasing Corporation, dated December 21, 2007.
10.119(10) Closing Certificate and Agreement (Fremont Building #1) between Lam Research Corporation andBNP Paribas Leasing Corporation, dated December 21, 2007.
10.120(10) Agreement Regarding Purchase and Remarketing Options (Fremont Building #1) between LamResearch Corporation and BNP Paribas Leasing Corporation, dated December 21, 2007.
10.121(10) Lease Agreement (Fremont Building #2) between Lam Research Corporation and BNP ParibasLeasing Corporation, dated December 21, 2007.
10.122(10) Pledge Agreement (Fremont Building #2) between Lam Research Corporation and BNP ParibasLeasing Corporation, dated December 21, 2007.
10.123(10) Closing Certificate and Agreement (Fremont Building #2) between Lam Research Corporation andBNP Paribas Leasing Corporation, dated December 21, 2007.
10.124(10) Agreement Regarding Purchase and Remarketing Options (Fremont Building #2) between LamResearch Corporation and BNP Paribas Leasing Corporation, dated December 21, 2007.
10.125(10) Lease Agreement (Fremont Building #3) between Lam Research Corporation and BNP ParibasLeasing Corporation, dated December 21, 2007.
10.126(10) Pledge Agreement (Fremont Building #3) between Lam Research Corporation and BNP ParibasLeasing Corporation, dated December 21, 2007.
10.127(10) Closing Certificate and Agreement (Fremont Building #3) between Lam Research Corporation andBNP Paribas Leasing Corporation, dated December 21, 2007.
10.128(10) Agreement Regarding Purchase and Remarketing Options (Fremont Building #3) between LamResearch Corporation and BNP Paribas Leasing Corporation, dated December 21, 2007.
10.129(10) Lease Agreement (Fremont Building #4) between Lam Research Corporation and BNP ParibasLeasing Corporation, dated December 21, 2007.
10.130(10) Pledge Agreement (Fremont Building #4) between Lam Research Corporation and BNP ParibasLeasing Corporation, dated December 21, 2007.
10.131(10) Closing Certificate and Agreement (Fremont Building #4) between Lam Research Corporation andBNP Paribas Leasing Corporation, dated December 21, 2007.
10.132(10) Agreement Regarding Purchase and Remarketing Options (Fremont Building #4) between LamResearch Corporation and BNP Paribas Leasing Corporation, dated December 21, 2007.
10.133(10) Lease Agreement (Livermore/Parcel 6) between Lam Research Corporation and BNP ParibasLeasing Corporation, dated December 18, 2007.
10.134(10) Pledge Agreement (Livermore/Parcel 6) between Lam Research Corporation and BNP ParibasLeasing Corporation, dated December 18, 2007.
10.135(10) Closing Certificate and Agreement (Livermore/Parcel 6) between Lam Research Corporation andBNP Paribas Leasing Corporation, dated December 18, 2007.
10.136(10) Agreement Regarding Purchase and Remarketing Options (Livermore/Parcel 6) between LamResearch Corporation and BNP Paribas Leasing Corporation, dated December 18, 2007.
108

10.137(10) Construction Agreement (Livermore/Parcel 6) between Lam Research Corporation and BNP ParibasLeasing Corporation, dated December 18, 2007.
10.138(10) Lease Agreement (Livermore/Parcel 7) between Lam Research Corporation and BNP ParibasLeasing Corporation, dated December 18, 2007.
10.139(10) Pledge Agreement (Livermore/Parcel 7) between Lam Research Corporation and BNP ParibasLeasing Corporation, dated December 18, 2007.
10.140(10) Closing Certificate and Agreement (Livermore/Parcel 7) between Lam Research Corporation andBNP Paribas Leasing Corporation, dated December 18, 2007.
10.141(10) Agreement Regarding Purchase and Remarketing Options (Livermore/Parcel 7) between LamResearch Corporation and BNP Paribas Leasing Corporation, dated December 18, 2007.
10.142(10) Construction Agreement (Livermore/Parcel 7) between Lam Research Corporation and BNP ParibasLeasing Corporation, dated December 18, 2007.
10.143(11) First Modification Agreement (Fremont Buildings #1, #2, #3, #4) between Lam ResearchCorporation and BNP Paribas Leasing Corporation, dated April 3, 2008.
10.144(11) First Modification Agreement (Livermore Parcel 6) between Lam Research Corporation and BNPParibas Leasing Corporation, dated April 3, 2008.
10.145(11) Second Modification Agreement (Livermore Parcel 6) between Lam Research Corporation and BNPParibas Leasing Corporation, dated July 9, 2008.
10.146(11) First Modification Agreement (Livermore Parcel 7) between Lam Research Corporation and BNPParibas Leasing Corporation, dated July 9, 2008.
10.148(12)*Form of Indemnification Agreement.
10.149(12)*Reformation of Stock Option Agreement.
10.150(13)*Stock Option Amendment and Special Bonus Agreement.
10.153(15)*Form of Change in Control Agreement.
10.154(15)*Employment Agreement with Ernest Maddock, dated July 1, 2009.
10.156(18)*Employment Agreement with Stephen G. Newberry, dated November 30, 2011.
10.157(18)*Employment Agreement with Martin B. Anstice, dated November 30, 2011.
10.158(19)*Employment Agreement with Timothy M. Archer, dated March 6, 2012.
10.159(18)*Form of Indemnification Agreement.
10.160(21) Assignment and Assumption of Lessee’s Interest in Lease (Units 8 and 9, Palo Alto) and Covenants,Conditions and Restrictions on Leasehold Interests (Units 1-12, Palo Alto) by and between VarianAssociates, Inc. and Novellus dated May 7, 1997.
10.161(22) Environmental Agreement by and between Varian Associates, Inc. and Novellus dated May 7, 1997.
10.162(23)*Form of Novellus Directors and Officers Indemnification Agreement.
10.163(24)*GaSonics International Corporation 1994 Stock Option/Stock Issuance plan, together with forms ofagreements thereunder, as assumed by Novellus.
10.164(24)*GaSonics International Corporation Supplemental Stock Option Plan, as assumed by Novellus.
10.165(25)*Novellus 2001 Stock Incentive Plan, as amended, together with forms of agreement thereunder.
10.166(26)*SpeedFam-IPEC, Inc. Amended and Restated 1995 Stock Plan, as assumed by Novellus.
109

10.167(26)* SpeedFam-IPEC, Inc. 2001 Nonstatutory Stock Option Plan, together with forms of agreementsthereunder, as assumed by Novellus.
10.168(26) Lease Guaranty between Novellus and Phoenix Industrial Investment Partners, L.P. dated January21, 2003.
10.169(27) Binding Memorandum of Understanding between Novellus, and Applied Materials, Inc., effectiveas of September 3, 2004. Portions of this exhibit have been omitted pursuant to a request forconfidential treatment.
10.170(28)* Novellus Amended Executive Voluntary Deferred Compensation Plan, as amended.
10.171(29)* Novellus Accelerated Stock Vesting Retirement Plan Summary.
10.172* Novellus Systems, Inc. 2011 Stock Incentive Plan, as amended July 18, 2012.
10.173* Forms of nonstatutory stock option agreement under the Novellus 2011 Stock Incentive Plan.
10.174* Forms of restricted stock unit award agreement under the Novellus 2011 Stock Incentive Plan.
21 Subsidiaries of the Registrant.
23.1 Consent of Independent Registered Public Accounting Firm.
24 Power of Attorney (See Signature page)
31.1 Rule 13a — 14(a) / 15d — 14(a) Certification (Principal Executive Officer)
31.2 Rule 13a — 14(a) / 15d — 14(a) Certification (Principal Financial Officer)
32.1 Section 1350 Certification — (Principal Executive Officer)
32.2 Section 1350 Certification — (Principal Financial Officer)
101.INS XBRL Instance Document
101.SCH XBRL Taxonomy Extension Schema Document
101.CAL XBRL Taxonomy Extension Calculation Linkbase Document
101.DEF XBRL Taxonomy Extension Definition Linkbase Document
101.LAB XBRL Taxonomy Extension Label Linkbase Document
101.PRE XBRL Taxonomy Extension Presentation Linkbase Document
(1) Incorporated by reference to the Registrant’s Quarterly Report on Form 10-Q for the quarter ended April 3,1988.
(2) Incorporated by reference to Registrant’s Amendment No. 2 to its Annual Report on Form 10K/A for thefiscal year ended June 25, 2000, and Registrant’s Current Report on Form 8-K dated November 5, 2009.
(3) Incorporated by reference to Registrant’s Annual Report on Form 10-K for the fiscal year ended June 27,2004.
(4) Incorporated by reference to Registrant’s Registration Statement on Form S-8 (No. 33-127936) filed withthe Securities and Exchange Commission on August 28, 2005.
(5) Incorporated by reference to Registrant’s Current Report on Form 8-K dated November 8, 2005.(6) Incorporated by reference to Registrant’s Current Report on Form 8-K dated February 6, 2006.(7) Incorporated by reference to Registrant’s Registration Statement on Form S-8 (No. 333-138545) filed with
the Securities and Exchange Commission on November 9, 2006.(8) Incorporated by reference to Registrant’s Quarterly Report on Form 10-Q for the quarter ended
December 24, 2006.(9) Incorporated by reference to Registrant’s Quarterly Report on Form 10-Q for the quarter ended March 25,
2007.
110

(10) Incorporated by reference to Registrant’s Annual Report on Form 10-K for the fiscal year ended June 24,2007.
(11) Incorporated by reference to Registrant’s Annual Report on Form 10-K for the fiscal year ended June 27,2010.
(12) Incorporated by reference to Registrant’s Current Report on Form 8-K dated November 13, 2008.(13) Incorporated by reference to Registrant’s Current Report on Form 8-K dated May 8, 2008.(14) Incorporated by reference to Registrant’s Current Report on Form 8-K dated June 4, 2012.(15) Incorporated by reference to Registrant’s Current Report on Form 8-K dated July 31, 2009(16) Incorporated by reference to Registrant’s Current Report on Form 8-K dated May 11, 2011(17) Incorporated by reference to Registrant’s Annual Report on Form 10-K for the fiscal year ended June 26,
2011.(18) Incorporated by reference to Registrant’s Current Report on Form 8-K dated December 5, 2011.(19) Incorporated by reference to Registrant’s Amendment No. 1 to Registration Statement on Form S-4, dated
March 6, 2012.(20) Incorporated by reference to Novellus’ Current Report on Form 8-K dated May 10, 2011 (SEC File No.
000-17157).(21) Incorporated by reference to Novellus’ Current Report on Form 8-K dated July 7, 1997 (SEC File No. 000-
17157).(22) Incorporated by reference to Novellus’ Current Report on Form 8-K dated July 7, 1997 (SEC File No. 000-
17157).(23) Incorporated by reference to Novellus’ Quarterly Report on Form 10-Q filed on August 13, 2002 (SEC File
No. 000-17157).(24) Incorporated by reference to Novellus’ Annual Report on Form 10-K filed on March 23, 2001 (SEC File
No. 000-17157).(25) Incorporated by reference to Novellus’ Quarterly Report on Form 10-Q filed on July 31, 2009 (SEC File No.
000-17157).(26) Incorporated by reference to Novellus’ Annual Report on Form 10-K filed on March 5, 2003 (SEC File No.
000-17157).(27) Incorporated by reference to Novellus’ Current Report on Form 8-K filed on September 24, 2004 (SEC File
No. 000-17157).(28) Incorporated by reference to Novellus’ Report on Form 10-Q filed on November 5, 2008 (SEC File No.
000-17157).(29) Incorporated by reference to Novellus’ Quarterly Report on Form 10-Q filed on November 2, 2010 (SEC
File No. 000-17157).* Indicates management contract or compensatory plan or arrangement in which executive officers of the
Company are eligible to participate.
111

Exhibit 21
SUBSIDIARIES OF THE REGISTRANT
SUBSIDIARY STATE OR OTHER JURISDICTION OF OPERATION
Lam Research AG Austria
Lam Research Management GmbH Austria
Novellus Systems Export, Inc. Barbados
GaSonics World Trade Inc. Barbados
IPEC FSC Ltd Barbados
IPEC International Sales FSC Ltd Barbados
Novellus Systems International, LLC California, United States
Angstron Systems, Inc. California, United States
Gamma Precision Technology California, United States
Novellus Systems International Holdings Ltd. Cayman Islands
Lam Research (Shanghai) Co., Ltd. China
Lam Research Semiconductor (Suzhou) Co., Ltd. China
Lam Research Service Co., Ltd. China
SEZ China Co. Ltd. China
Novellus Systems Semiconductor Equipment Shanghai Co. Ltd. China
Novellus Systems International Trading (Shanghai) Co. Ltd. China
Novellus International Holdco, Inc. Delaware, United States
SpeedFam-IPEC International Services, LLC Delaware, United States
Tmation Inc. Delaware, United States
Novellus Development Company, LLC Delaware, United States
Lam Research SAS France
Novellus Systems SARL France
Novellus Singapore Pte. Ltd., France Branch France
Lam Research GmbH Germany
Novellus Systems GmbH Germany
Novellus Systems Service GmbH Germany
NHL Sub GmbH Germany
Peter Wolters GmbH Germany
Novellus Systems (H.K.) Limited Hong Kong
Novellus Systems Service (Hong Kong) Limited Hong Kong
Peter Wolters of America, Inc. Illinois, United States
Novellus Systems (India) Pvt. Ltd. India
Peter Wolters Precision Solutions (India) Pvt. Ltd. India
Lam Research (Ireland) Limited Ireland
Novellus Systems Ireland Ltd. Ireland
Lam Research (Israel) Ltd. Israel
Novellus Systems Israel Ltd. Israel
GaSonics Israel Ltd. Israel
Novellus Systems International BV, Israel Branch Israel
Lam Research S.r.l. Italy
Novellus Systems Italy SRL Italy
Lam Research Co., Ltd. Japan

SUBSIDIARY STATE OR OTHER JURISDICTION OF OPERATION
Peter Wolters Japan Co., Ltd. Japan
Novellus Systems Japan, G.K. Japan
Novellus Singapore Pte. Ltd., Japan Branch Japan
Lam Research Korea Limited Korea
Lam Research Luxembourg S.à.r.l. Luxembourg
SpeedFam IPEC (Malaysia) Sdn. Bhd. Malaysia
Novellus Systems (Malaysia) Sdn. Bhd. Malaysia
Novellus Singapore Pte. Ltd., Malaysia Branch Malaysia
LAM Research B.V. Netherlands
Lam Research International B.V. Netherlands
Novellus Systems BV Netherlands
Novellus Systems International BV Netherlands
Voumard, Inc. New York, United States
Silfex, Incorporated Ohio, United States
Novellus Korea LLC Republic of South Korea
Novellus Singapore Pte. Ltd., Korea Branch Republic of South Korea
Lam Research Singapore Pte Ltd Singapore
SEZ Asia Pacific Pte. Ltd. Singapore
Novellus Systems International BV, Singapore Branch Singapore
Novellus Singapore Pte. Ltd. Singapore
Novellus Singapore Holdings Pte. Ltd. Singapore
Lam Research Holding GmbH Switzerland
Lam Research International Sàrl Switzerland
Novellus Systems (Schweiz) Holding GmbH Switzerland
Voumard Machines Co SARL Switzerland
Lam Research Co., Ltd. Taiwan
Novellus Systems (H.K.) Limited, Taiwan Branch Taiwan
Novellus Systems Service (Hong Kong) Limited, TaiwanBranch Taiwan
Lam Research Ltd. United Kingdom
Peter Wolters UK Ltd. United Kingdom
Novellus Systems UK Limited United Kingdom
Novellus Vietnam LLC Vietnam

Exhibit 23.1
CONSENT OF INDEPENDENT REGISTERED PUBLIC ACCOUNTING FIRM
We consent to the incorporation by reference in the Registration Statements (Form S-4 No. 333-30545 and333-179267) of Lam Research Corporation and in the related Prospectus and in the Registration Statements(Form S-8 Nos. 333-01011, 333-18115, 333-32981, 333-45265, 333-66833, 333-72751, 333-93115, 333-74500,333-84638, 333-127936, 333-138545, 333-156335, and 333-181878) pertaining to the amended and restated1996 Performance-Based Restricted Stock Plan, 1997 Stock Incentive Plan, 1999 Employee Stock Purchase Plan,1999 Stock Option Plan, 2007 Stock Incentive Plan, and the Savings Plus Plan, 401(k) of Lam ResearchCorporation and the Novellus Systems, Inc. 2011 Stock Incentive Plan, Novellus Systems, Inc. 2001 StockIncentive Plan, as amended, Novellus Systems, Inc. 2001 Non-Qualified Stock Option Plan, as amended,SpeedFam-IPEC, Inc. 2001 Nonstatutory Stock Option Plan, as amended, SpeedFam-IPEC, Inc. Amended andRestated 1995 Stock Plan, GaSonics International Corporation Supplemental Stock Option Plan, as amended,GaSonics International Corporation 1994 Stock Option/Stock Issuance Plan, as amended, and the NovellusSystems, Inc. Retirement Plan of our reports dated August 22, 2012, with respect to the consolidated financialstatements and schedule of Lam Research Corporation and the effectiveness of internal control over financialreporting of Lam Research Corporation included in its Annual Report (Form 10-K) for the year ended June 24,2012, filed with the Securities and Exchange Commission.
/s/ ERNST & YOUNG LLP
San Jose, CaliforniaAugust 22, 2012

Exhibit 31.1
RULE 13a-14(a)/15d-14(a) CERTIFICATION (PRINCIPAL EXECUTIVE OFFICER)
I, Martin B. Anstice, certify that:
1. I have reviewed this Annual Report on Form 10-K of Lam Research Corporation;
2. Based on my knowledge, this report does not contain any untrue statement of a material fact or omit to statea material fact necessary to make the statements made, in light of the circumstances under which suchstatements were made, not misleading with respect to the period covered by this report;
3. Based on my knowledge, the financial statements, and other financial information included in this report,fairly present in all material respects the financial condition, results of operations and cash flows of theregistrant as of, and for, the periods presented in this report;
4. The registrant’s other certifying officer and I are responsible for establishing and maintaining disclosurecontrols and procedures (as defined in Exchange Act Rules 13a-15(e) and 15d-15(e)) and internal controlover financial reporting (as defined in Exchange Act Rules 13a-15(f) and 15d-15(f)) for the registrant andhave:
a) designed such disclosure controls and procedures, or caused such disclosure controls and procedures tobe designed under our supervision, to ensure that material information relating to the registrant,including its consolidated subsidiaries, is made known to us by others within those entities, particularlyduring the period in which this report is being prepared;
b) designed such internal control over financial reporting, or caused such internal control over financialreporting to be designed under our supervision, to provide reasonable assurance regarding thereliability of financial reporting and the preparation of financial statements for external purposes inaccordance with generally accepted accounting principles;
c) evaluated the effectiveness of the registrant’s disclosure controls and procedures and presented in thisreport our conclusions about the effectiveness of the disclosure controls and procedures, as of the endof the period covered by this report based on such evaluation; and
d) disclosed in this report any change in the registrant’s internal control over financial reporting thatoccurred during the registrant’s most recent fiscal quarter (the registrant’s fourth fiscal quarter in thecase of an annual report) that has materially affected, or is reasonably likely to materially affect, theregistrant’s internal control over financial reporting; and
5. The registrant’s other certifying officer and I have disclosed, based on our most recent evaluation of internalcontrol over financial reporting, to the registrant’s auditors and the audit committee of the registrant’s boardof directors (or persons performing the equivalent functions):
a) all significant deficiencies and material weaknesses in the design or operation of internal control overfinancial reporting which are reasonably likely to adversely affect the registrant’s ability to record,process, summarize and report financial information; and
b) any fraud, whether or not material, that involves management or other employees who have asignificant role in the registrant’s internal control over financial reporting.
August 22, 2012
/s/ Martin B. Anstice
Martin B. AnsticePresident and Chief Executive Officer

Exhibit 31.2
RULE 13a-14(a)/15d-14(a) CERTIFICATION (PRINCIPAL FINANCIAL OFFICER)
I, Ernest E. Maddock, certify that:
1. I have reviewed this Annual Report on Form 10-K of Lam Research Corporation;
2. Based on my knowledge, this report does not contain any untrue statement of a material fact or omit to statea material fact necessary to make the statements made, in light of the circumstances under which suchstatements were made, not misleading with respect to the period covered by this report;
3. Based on my knowledge, the financial statements, and other financial information included in this report,fairly present in all material respects the financial condition, results of operations and cash flows of theregistrant as of, and for, the periods presented in this report;
4. The registrant’s other certifying officer and I are responsible for establishing and maintaining disclosurecontrols and procedures (as defined in Exchange Act Rules 13a-15(e) and 15d-15(e)) and internal controlover financial reporting (as defined in Exchange Act Rules 13a-15(f) and 15d-15(f)) for the registrant andhave:
a) designed such disclosure controls and procedures, or caused such disclosure controls and procedures tobe designed under our supervision, to ensure that material information relating to the registrant,including its consolidated subsidiaries, is made known to us by others within those entities, particularlyduring the period in which this report is being prepared;
b) designed such internal control over financial reporting, or caused such internal control over financialreporting to be designed under our supervision, to provide reasonable assurance regarding thereliability of financial reporting and the preparation of financial statements for external purposes inaccordance with generally accepted accounting principles;
c) evaluated the effectiveness of the registrant’s disclosure controls and procedures and presented in thisreport our conclusions about the effectiveness of the disclosure controls and procedures, as of the endof the period covered by this report based on such evaluation; and
d) disclosed in this report any change in the registrant’s internal control over financial reporting thatoccurred during the registrant’s most recent fiscal quarter (the registrant’s fourth fiscal quarter in thecase of an annual report) that has materially affected, or is reasonably likely to materially affect, theregistrant’s internal control over financial reporting; and
5. The registrant’s other certifying officer and I have disclosed, based on our most recent evaluation of internalcontrol over financial reporting, to the registrant’s auditors and the audit committee of the registrant’s boardof directors (or persons performing the equivalent functions):
a) all significant deficiencies and material weaknesses in the design or operation of internal control overfinancial reporting which are reasonably likely to adversely affect the registrant’s ability to record,process, summarize and report financial information; and
b) any fraud, whether or not material, that involves management or other employees who have asignificant role in the registrant’s internal control over financial reporting.
August 22, 2012
/s/ Ernest E. Maddock
Ernest E. MaddockSenior Vice President, Chief Financial Officer andChief Accounting Officer

Exhibit 32.1
SECTION 1350 CERTIFICATION (PRINCIPAL EXECUTIVE OFFICER)
In connection with the Annual Report of Lam Research Corporation (the “Company”) on Form 10-K for thefiscal period ending June 24, 2012 as filed with the Securities and Exchange Commission on the date hereof (the“Report”), I, Martin B. Anstice, President and Chief Executive Officer of the Company, certify, pursuant to 18U.S.C. Section 1350, as adopted pursuant to Section 906 of the Sarbanes-Oxley Act of 2002, that:
(1) The Report fully complies with the requirements of section 13(a) or 15(d) of the Securities Exchange Act of1934; and
(2) The information contained in the Report fairly presents, in all material respects, the financial condition andresults of operations of the Company.
August 22, 2012
/s/ Martin B. Anstice
Martin B. AnsticePresident and Chief Executive Officer
The foregoing certification is being furnished solely pursuant to 18 U.S.C. § 1350, as adopted pursuant to§ 906 of the Sarbanes-Oxley Act of 2002, and will not be deemed “filed” for purposes of Section 18 of theSecurities Exchange Act of 1934, as amended (the “Exchange Act”) or otherwise subject to the liability of thatsection. Such certification will not be deemed to be incorporated by reference into any filing under the SecuritiesAct of 1933, as amended, or the Exchange Act, except to the extent that Lam Research Corporation specificallyincorporates it by reference.

Exhibit 32.2
SECTION 1350 CERTIFICATION (PRINCIPAL FINANCIAL OFFICER)
In connection with the Annual Report of Lam Research Corporation (the “Company”) on Form 10-K for thefiscal period ending June 24, 2012 as filed with the Securities and Exchange Commission on the date hereof (the“Report”), I, Ernest E. Maddock, Senior Vice President, Chief Financial Officer and Chief Accounting Officer ofthe Company, certify, pursuant to 18 U.S.C. Section 1350, as adopted pursuant to Section 906 of the Sarbanes-Oxley Act of 2002, that:
(1) The Report fully complies with the requirements of section 13(a) or 15(d) of the Securities Exchange Act of1934; and
(2) The information contained in the Report fairly presents, in all material respects, the financial condition andresults of operations of the Company.
August 22, 2012
/s/ Ernest E. Maddock
Ernest E. MaddockSenior Vice President, Chief Financial Officerand Chief Accounting Officer
The foregoing certification is being furnished solely pursuant to 18 U.S.C. § 1350, as adopted pursuant to§ 906 of the Sarbanes-Oxley Act of 2002, and will not be deemed “filed” for purposes of Section 18 of theSecurities Exchange Act of 1934, as amended (the “Exchange Act”) or otherwise subject to the liability of thatsection. Such certification will not be deemed to be incorporated by reference into any filing under the SecuritiesAct of 1933, as amended, or the Exchange Act, except to the extent that Lam Research Corporation specificallyincorporates it by reference.

2300® Kiyo® Conductor Etch Family
2300® Flex™ Dielectric Etch Family
2300® Versys® Metal Metal Etch Family
2300® Syndion® TSV Etch Family
TCP® 9400DSiE™
MEMS/Deep SiliconEtch Family
VECTOR® PECVD Family
SPEED® HDP-CVD Family
ALTUS® W-CVD Family
SABRE® ECD Family
INOVA® PVD Family
SOLA® UVTP Family
etch
depo
sitio
nprod
ucts EXECUTIVE OFFICERS
Martin B. Anstice President and Chief Executive Officer
Timothy M. Archer Chief Operating Officer
Ernest E. Maddock Senior Vice President and Chief Financial Officer
Richard A. Gottscho, Ph.D. Senior Vice President, Global Products
Sarah A. O’Dowd, Esq. Group Vice President, Chief Legal Officer
Stephen G. Newberry Vice Chairman
BOARD OF DIRECTORS
James W. Bagley Chairman
Stephen G. Newberry Vice Chairman
Martin B. Anstice President and Chief Executive Officer
Robert M. Berdahl, Ph.D. President Emeritus, Association of American Universities
Eric K. Brandt Executive Vice President and Chief Financial Officer, Broadcom Corporation
Michael R. Cannon General Partner, MRC & LBC Partners, LLC
Youssef A. El-Mansy, Ph.D. Vice President, Director of Logic Technology Development, Intel Corporation (retired)
Christine A. Heckart Chief Marketing Officer, ServiceSource
Grant M. Inman General Partner, Inman Investment Management
Catherine P. Lego Member, Lego Ventures, LLC
Kim E. Perdikou Executive Vice President, Office of the Chief Executive Officer, Juniper Networks
Krishna C. Saraswat, Ph.D. Rickey/Nielsen Professor, School of Engineering, Stanford University
William R. Spivey, Ph.D. President and Chief Executive Officer, Luminent, Inc. (retired)
Abhijit Y. Talwalkar President and Chief Executive Officer, LSI Corporation
Delbert A. Whitaker Senior Vice President, Worldwide Analog and Standard Logic, Texas Instruments, Inc. (retired)
© 2012 Lam Research Corporation.
All rights reserved.
201209-05608/7K

2012
Annual Report
Lam
Res
earc
h Co
rpor
atio
n 2
012
Annu
al R
epor
t
Lam Research Corporation4650 Cushing ParkwayFremont, California 94538
Phone: 1.510.572.0200www.lamresearch.com