Embed Size (px)
Citation preview

INVESTOR PRESENTATION
September 2016
GRUPA AZOTY AT A GLANCE 2
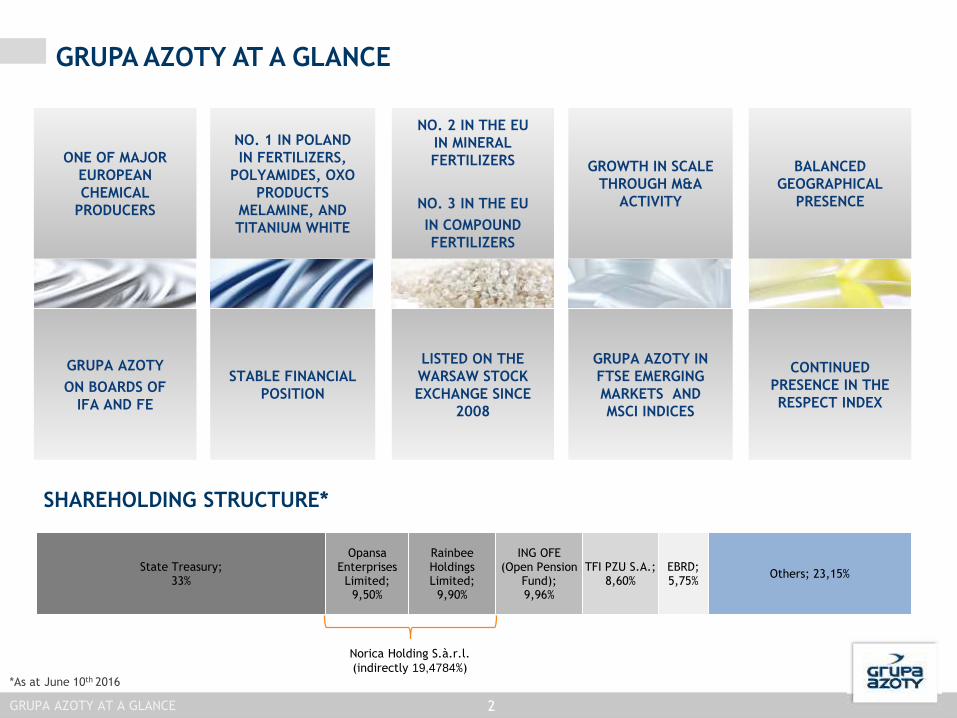
GRUPA AZOTY AT A GLANCE
ONE OF MAJOR
EUROPEAN
CHEMICAL
PRODUCERS
NO. 1 IN POLAND
IN FERTILIZERS,
POLYAMIDES, OXO
PRODUCTS
MELAMINE, AND
TITANIUM WHITE
NO. 2 IN THE EU
IN MINERAL
FERTILIZERS
NO. 3 IN THE EU
IN COMPOUND
FERTILIZERS
GROWTH IN SCALE
THROUGH M&A
ACTIVITY
BALANCED
GEOGRAPHICAL
PRESENCE
GRUPA AZOTY
ON BOARDS OF
IFA AND FE
STABLE FINANCIAL
POSITION
LISTED ON THE
WARSAW STOCK
EXCHANGE SINCE
2008
GRUPA AZOTY IN
FTSE EMERGING
MARKETS AND
MSCI INDICES
CONTINUED
PRESENCE IN THE
RESPECT INDEX
State Treasury; 33%
OpansaEnterprises Limited;
9,50%
RainbeeHoldings Limited;
9,90%
ING OFE (Open Pension
Fund); 9,96%
TFI PZU S.A.; 8,60%
EBRD; 5,75%
Others; 23,15%
Norica Holding S.à.r.l.
(indirectly 19,4784%)
SHAREHOLDING STRUCTURE*
*As at June 10th 2016
3
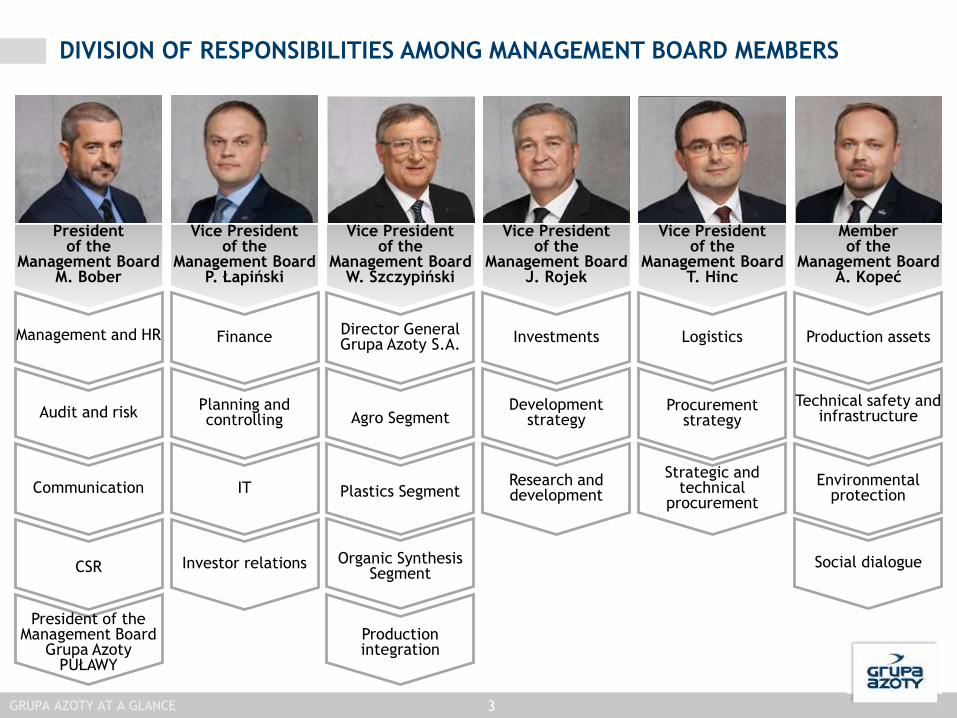
DIVISION OF RESPONSIBILITIES AMONG MANAGEMENT BOARD MEMBERS
Vice President of the
Management BoardP. Łapiński
Finance
Planning and controlling
IT
Investor relations
Management and HR
President of the
Management BoardM. Bober
Audit and risk
Communication
CSR
President of the Management Board
Grupa Azoty PUŁAWY
Memberof the
Management BoardA. Kopeć
Production assets
Technical safety and infrastructure
Environmental protection
Social dialogue
Vice President of the
Management BoardW. Szczypiński
Director General Grupa Azoty S.A.
Agro Segment
Plastics Segment
Organic Synthesis Segment
Production integration
Vice President of the
Management BoardT. Hinc
Logistics
Procurement strategy
Strategic and technical
procurement
Vice President of the
Management BoardJ. Rojek
Investments
Development strategy
Research and development
GRUPA AZOTY AT A GLANCE
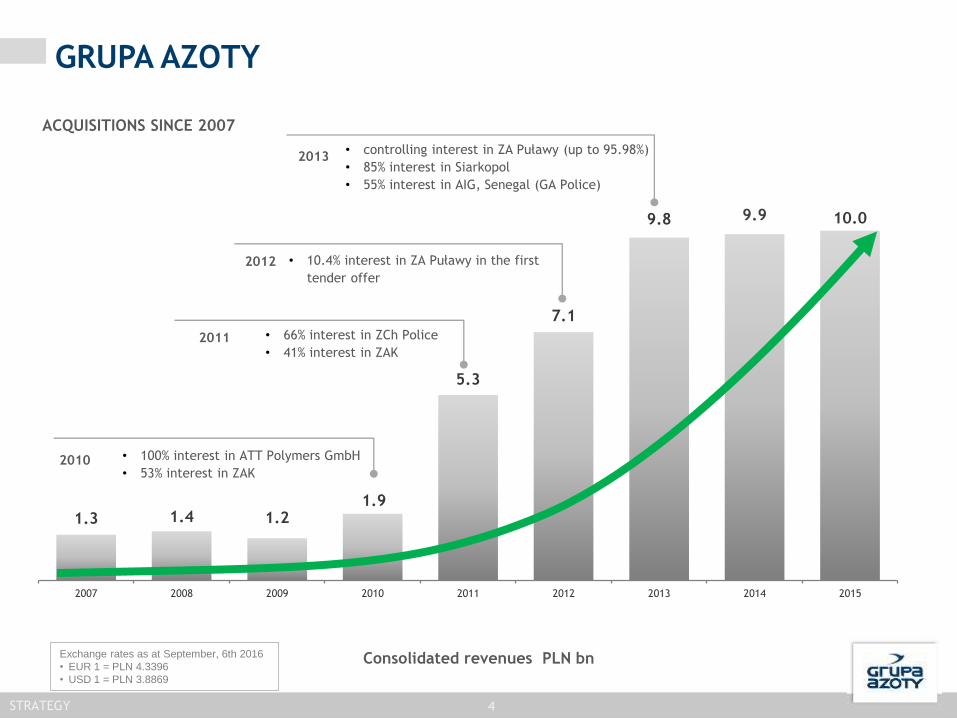
1.3 1.4 1.21.9
5.3
7.1
9.8 9.9 10.0
2007 2008 2009 2010 2011 2012 2013 2014 2015
2011 • 66% interest in ZCh Police
• 41% interest in ZAK
• 100% interest in ATT Polymers GmbH
• 53% interest in ZAK2010
4
GRUPA AZOTY
Consolidated revenues PLN bn
• controlling interest in ZA Puławy (up to 95.98%)
• 85% interest in Siarkopol
• 55% interest in AIG, Senegal (GA Police)
2013
• 10.4% interest in ZA Puławy in the first
tender offer
2012
ACQUISITIONS SINCE 2007
Exchange rates as at September, 6th 2016
• EUR 1 = PLN 4.3396
• USD 1 = PLN 3.8869
STRATEGY

5
CORE BUSINESS
Logistics
Production
ZMPPPort
Grupa Azoty PoliceUrea, NPK, NP, NS, Ammonia, TiO2
BBMTerminal
FosforyNPK, P
Grupa Azoty
ATT PolymersPA 6
Grupa Azoty PuławyAN, UAN, Urea, Melamine, CPL
Grupa Azoty SiarkopolSulfur
Grupa Azoty S.A.AN, CAN, ASN, AS, CPL, PA 6, POM
Compounding
AfriG S.A.Phosphorites
Grupa Azoty KędzierzynAN, CAN, Urea, OXO, Plasticizers
Z. A. Chorzów S.A.NPK, N, P, K
GRUPA AZOTY AT A GLANCE
GRUPA AZOTY AT A GLANCE
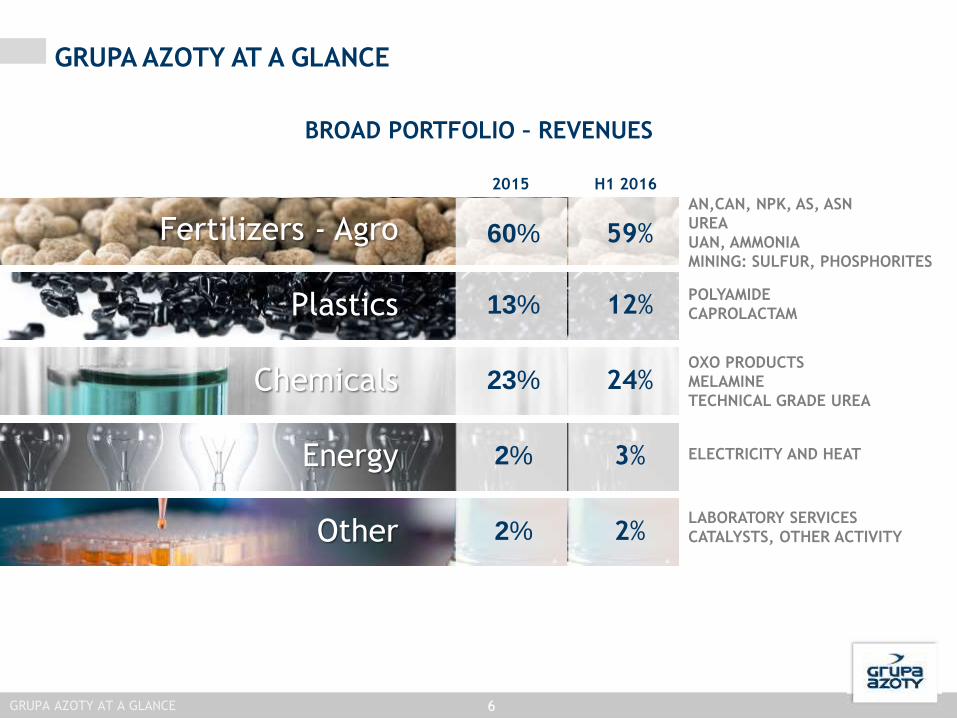
60%Fertilizers - Agro
6
BROAD PORTFOLIO – REVENUES
GRUPA AZOTY AT A GLANCE
AN,CAN, NPK, AS, ASN
UREA
UAN, AMMONIA
MINING: SULFUR, PHOSPHORITES
POLYAMIDE
CAPROLACTAM
OXO PRODUCTS
MELAMINE
TECHNICAL GRADE UREA
ELECTRICITY AND HEAT
LABORATORY SERVICES
CATALYSTS, OTHER ACTIVITY 2%Other
13%Plastics
23%Chemicals
2%Energy
2015 H1 2016
59%
12%
24%
3%
2%
GRUPA AZOTY AT A GLANCE

BUSINESS

BUSINESS 8
Notes: ¹ Compound fertilizers in total (AP, NPK, PK); ² Compound fertilizers + nitrogen fertilizers; ³ Among integrated producers
GRUPA AZOTY IS AN IMPORTANT PRODUCER IN THE REGION
Anwil Ciech Synthos
LARGEST CHEMICAL COMPANIES IN POLANDbased on 2015 revenues
FERTILIZERS
• No. 1 in compound fertilizers¹
• No. 1 in mineral fertilizers²
• No. 1 in fertilizers containing sulfur
• No. 1 in nitrogen fertilizers
FERTILIZERS
• No. 3 in compound fertilizers
• No. 2 in mineral fertilizers
PLASTICS, OXO, PIGMENTS, MELAMINE
• No. 1 in Polyamides
• No. 1 in OXO Alcohols and Plasticizers
• No. 1 in Titanium White
• No. 1 in Melamine
PLASTICS, OXO, MELAMINE
• No. 5 in Plasticizers
• No. 7 in OXO Alcohols
• No. 5 in Polyamide 6³
• No. 2 in Melamine

0 4 000 8 000 12 000 16 000 20 000
Azomures S.A.
Timac Agro(Groupe Roullier)
Achema JSC
Eurochem
Fertiberia
Borealis
Agrofert
Interagro*
(GK) Grupa Azoty
YARA
9
AGRO - FERTILIZERS
MANUFACTURER AS UREA AN CAN ASN UAN
AP/
NPK/
MIX
ACHEMA
AZOMURES
BASF
EuroChem
EUROCHEM
FERTIBERIA
GRUPA AZOTY
GROWHOW UK
NITROGENMUVEK
INTERAGRO
OCI NITROGEN
TIMAC AGRO
SKW PIESTERITZ
YARA
EXTENSIVE PORTFOLIO OF FERTILIZERS
[tt]
CAPACITIES
EU
2
Poland
1
Source: Fertilizers Europe
*Interagro with partners
BUSINESS
2015: 60%
H1 2016: 59%
REVENUES

10
PLASTICS
Source: PCI Nylon, YellowBook 2015
*Integrated
[tt]
POLYAMIDE 6
Poland
1
EU
5*
APPLICATIONS IN KEY SEGMENTS
0 5 10 15 20 25 30 35 40
Automotive
Films and coatings
Machine building
Electrical and electronic applications
Consumer goods
Household appliances
Other
%
• Polyamide 6 (PA6)
• Polyacetal (POM)
• Caprolactam
• Cyclohexanone
0 50 100 150 200 250
Savinesti
Caffaro FP
Nexis Fibers
Nurel
Ube
Beaulieu Nylon
Rhodia
Julon
Aquafil
Grupa Azoty
Domo
Radici
DSM
Lanxess
BASF
BUSINESS
H1 2016: 12%
2015: 13%
REVENUES

0 100 200 300 400 500
INEOS…
DEZA
Perstorp
Oltchim
OXEA
Grupa Azoty
Polynt
Evonik
BASF
Exxon Mobil
11
CHEMICALS
0 100 200 300 400 500
Oltchim
Grupa Azoty
Perstorp
Oxochimie (j.v. Arkema iINEOS)
OXEA
BASF
Melamine
0 20 40 60 80 100 120 140 160
Azomures S.A.
BASF SE
Grupa Azoty
Borealis Group
OCI Melamine
OXO**Plasticizers*
Poland
1
EU
3
Poland
1
EU
5
Poland
1
EU
5
[tt]
[tt]
[tt]
Source: Plasticizers Alkohols 2013 and Plasticizers (UE) 2013
* Production capacities for phthalate plasticizers and terephthalate plasticizers
** Production capacities for 2-EH, N-butanol, isobutanol
Oxochimie (j.v. of Arkema
and INEOS)
BUSINESS
2015: 23%
H1 2016: 24%
REVENUES
STRATEGY

VISION FOR GRUPA AZOTY
Organic
growth
Operational
excellence
Mergers
and
acquisitions
Grupa Azoty to remain one of the three leading players in
the European fertilizer market
Grupa Azoty to deliver industry-leading rates of return for
shareholders
13
Grupa Azoty to join the blue-chip index of the Warsaw
Stock Exchange
STRATEGY
2020 ROCE ≥ 14%
2014−2020
PLN 7bn to be spent on organic
growth
Consolidating a top-three position
in fertilizer manufacturing in EU
2020 EBIT MARGIN > 8%
2020 EBITDA MARGIN > 14%
CORPORATE OBJECTIVES
STRATEGY
0% 10% 20% 30% 40% 50% 60% 70% 80% 90% 100%
14
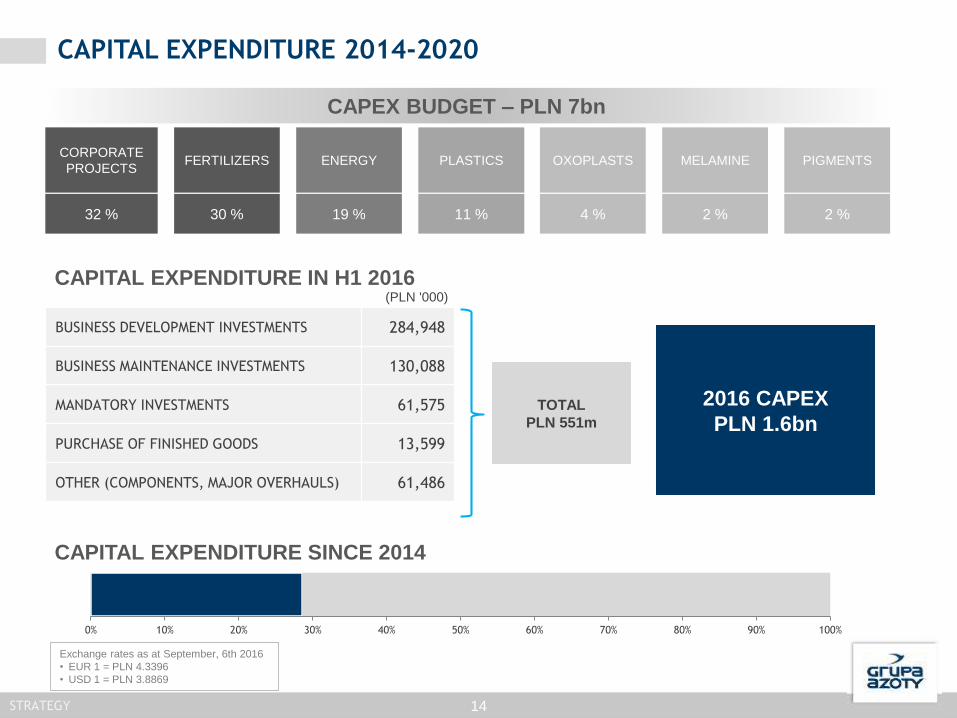
CORPORATE
PROJECTS
68 CAPEX PROJECTS
PLASTICSENERGYFERTILIZERS OXOPLASTS MELAMINE PIGMENTS
ORGANIC GROWTHCAPITAL EXPENDITURE 2014-2020
CAPEX BUDGET – PLN 7bn
32 % 11 %19 %30 % 4 % 2 % 2 %
CAPITAL EXPENDITURE IN H1 2016
2016 CAPEX
PLN 1.6bnTOTAL
PLN 551m
BUSINESS DEVELOPMENT INVESTMENTS 284,948
BUSINESS MAINTENANCE INVESTMENTS 130,088
MANDATORY INVESTMENTS 61,575
PURCHASE OF FINISHED GOODS 13,599
OTHER (COMPONENTS, MAJOR OVERHAULS) 61,486
(PLN '000)
CAPITAL EXPENDITURE SINCE 2014
STRATEGY
Exchange rates as at September, 6th 2016
• EUR 1 = PLN 4.3396
• USD 1 = PLN 3.8869
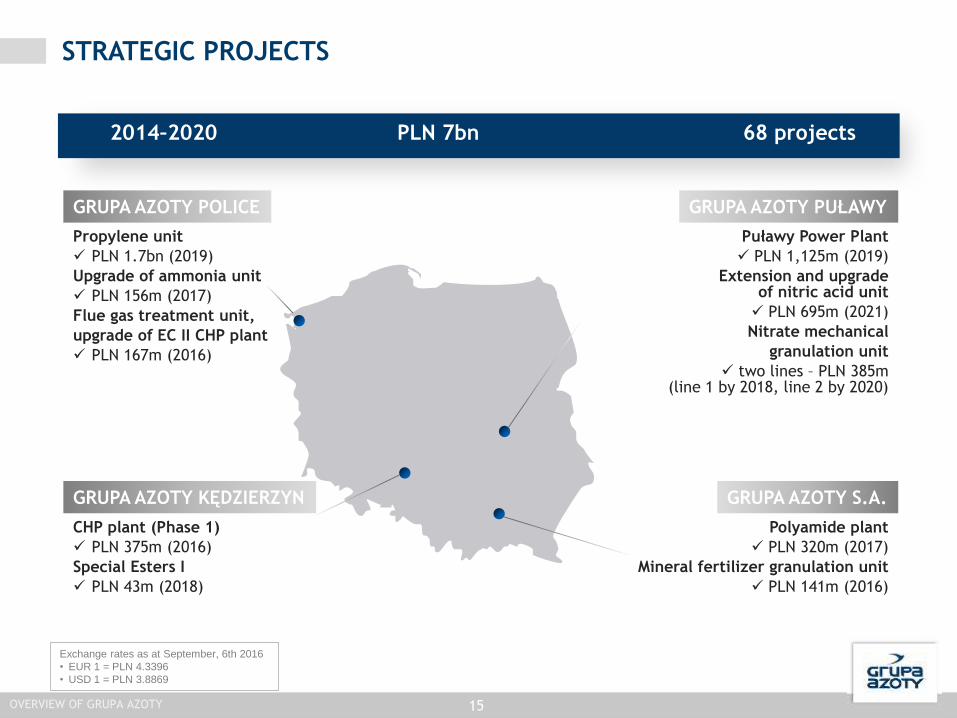
CHP plant (Phase 1)
PLN 375m (2016)
Special Esters I
PLN 43m (2018)
Polyamide plant
PLN 320m (2017)
Mineral fertilizer granulation unit
PLN 141m (2016)
Puławy Power Plant
PLN 1,125m (2019)
Extension and upgrade of nitric acid unit
PLN 695m (2021)
Nitrate mechanical
granulation unit
two lines – PLN 385m (line 1 by 2018, line 2 by 2020)
Propylene unit
PLN 1.7bn (2019)
Upgrade of ammonia unit
PLN 156m (2017)
Flue gas treatment unit,
upgrade of EC II CHP plant
PLN 167m (2016)
2014–2020 PLN 7bn 68 projects
15OVERVIEW OF GRUPA AZOTY
GRUPA AZOTY POLICE
GRUPA AZOTY KĘDZIERZYN
GRUPA AZOTY PUŁAWY
GRUPA AZOTY S.A.
STRATEGIC PROJECTS
Exchange rates as at September, 6th 2016
• EUR 1 = PLN 4.3396
• USD 1 = PLN 3.8869
16
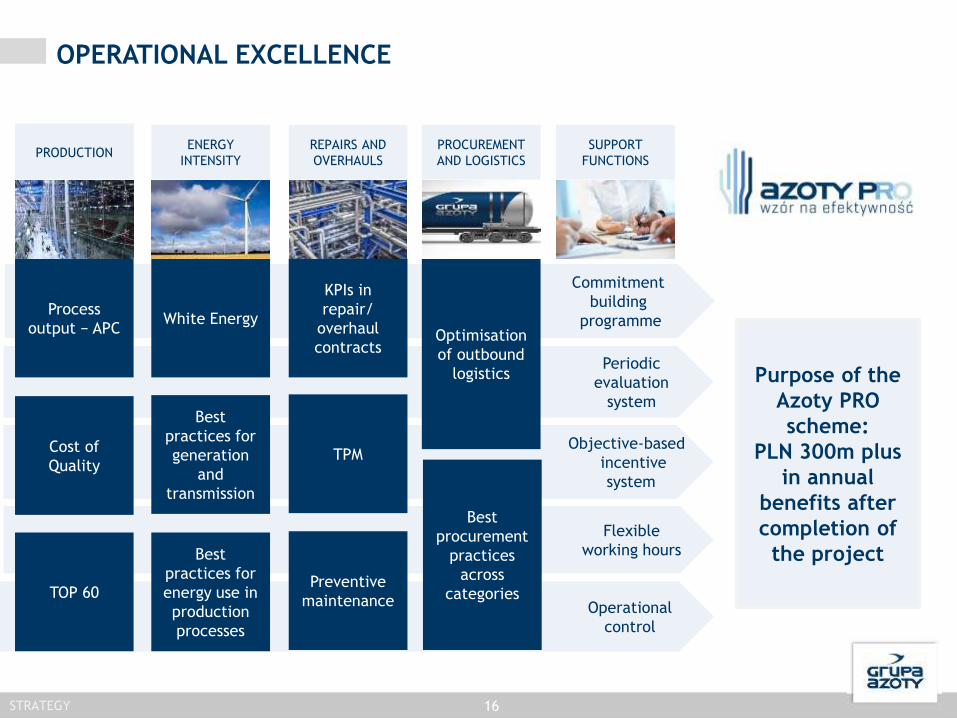
Commitment
building
programme
Periodic
evaluation
system
Objective-based
incentive
system
Flexible
working hours
Operational
control
Process
output − APC
Cost of
Quality
TOP 60
White Energy
Best
practices for
generation
and
transmission
Best
practices for
energy use in
production
processes
KPIs in
repair/
overhaul
contracts
TPM
Preventive
maintenance
Optimisation
of outbound
logistics
Best
procurement
practices
across
categories
PRODUKCJAENERGY
INTENSITY
REPAIRS AND
OVERHAULS
PROCUREMENT
AND LOGISTICS
SUPPORT
FUNCTIONS
OPERATIONAL EXCELLENCE
Purpose of the
Azoty PRO
scheme:
PLN 300m plus
in annual
benefits after
completion of
the project
PRODUCTION
STRATEGY

FINANCIAL HIGHLIGHTS

152
82
152
307
49
187
68
6.7%
3.4%
6.1%
12.4%
2.3%
Q2 2015** Q3 2015 Q4 2015 Q1 2016 Q2 2016
NET PROFIT
NET PROFIT(adjusted)*
NET PROFITMARGIN
292223
314
517
178
358
202
12.8%
9.3%
12.5%
20.9%
8.2%
Q2 2015** Q3 2015 Q4 2015 Q1 2016 Q2 2016
EBITDA
EBITDA(adjusted)*
EBITDA MARGIN
GRUPA AZOTY GROUP: KEY FINANCIALS
18
9,898
10,024
2014 2015
(PLNm)
822
1,315
862
1,359
2014 2015
265
692
298
727
2014 2015
FINANCIAL HIGHLIGHTS
2,276 2,401 2,503 2,4762,158
Q2 2015** Q3 2015 Q4 2015 Q1 2016 Q2 2016
REVENUE
*In 2015, adjusted for impairment losses on the benzene derived C-none production unit, fat processing unit and carbon disulfide unit in 2015.
In 2016, adjusted for estimated impairment loss recognised by African Investment Group S.A.
** Restated following application of uniform accounting policies across Grupa Azoty (see Section 2.2.c of the Supplementary information to the
financial statements)
Exchange rates as at September, 6th 2016
• EUR 1 = PLN 4.3396
• USD 1 = PLN 3.8869

777 695
465 99 29 10 25 35 605
PERFORMANCE BY SEGMENT
19
EBITDA
positive effect on EBITDA
negative effect on EBITDA
FINANCIAL HIGHLIGHTS
SEGMENT
(PLNm)
REVENUE EBITDA REVENUE EBITDA
H1 2015* H1 2016 H1 2015* H1 2016 2014 2015 2014 2015
Agro Fertilizers 3,055 2,742 556 496 5,580 6,058 594 998
Plastics 676 571 15 -25 1,460 1,248 -34 -10
Chemicals 1,210 1,128 93 165 2,506 2,302 46 135
Energy 101 119 42 39 195 209 80 78
Other Activities 69 74 71 20 157 207 136 114
* Restated following adoption of uniform accounting policies across the Group (see Section 2.2.c of the Supplementary
information to the financial statements)
Exchange rates as at September, 6th 2016
• EUR 1 = PLN 4.3396
• USD 1 = PLN 3.8869
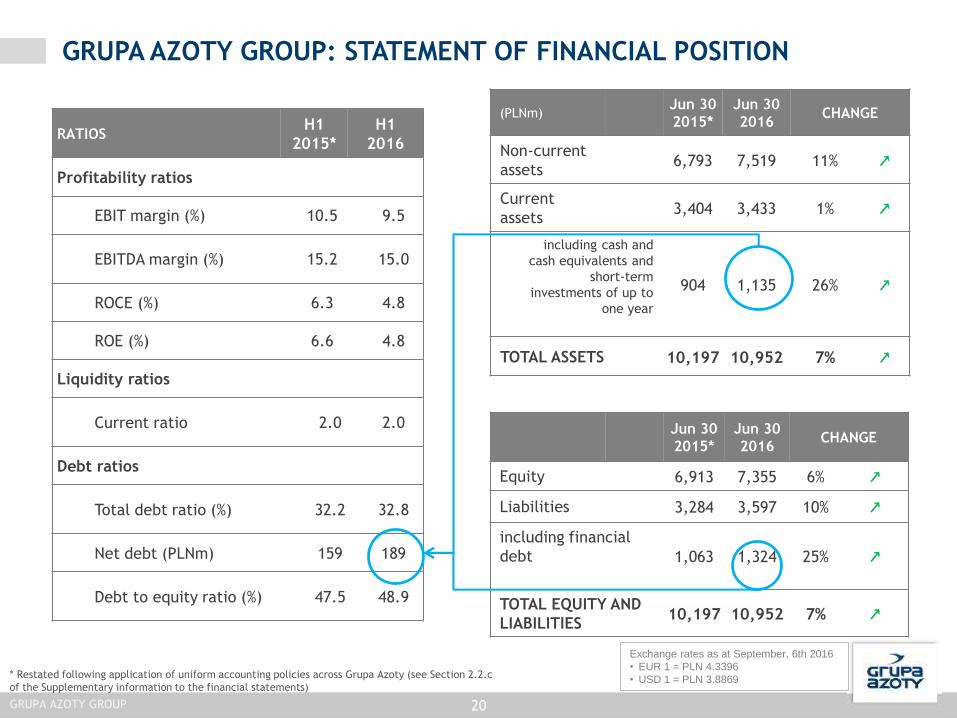
RATIOSH1
2015*
H1
2016
Profitability ratios
EBIT margin (%) 10.5 9.5
EBITDA margin (%) 15.2 15.0
ROCE (%) 6.3 4.8
ROE (%) 6.6 4.8
Liquidity ratios
Current ratio 2.0 2.0
Debt ratios
Total debt ratio (%) 32.2 32.8
Net debt (PLNm) 159 189
Debt to equity ratio (%) 47.5 48.9
Jun 30
2015*
Jun 30
2016CHANGE
Non-current
assets6,793 7,519 11% ↗
Current
assets3,404 3,433 1% ↗
including cash and
cash equivalents and
short-term
investments of up to
one year
904 1,135 26% ↗
TOTAL ASSETS 10,197 10,952 7% ↗
GRUPA AZOTY GROUP: STATEMENT OF FINANCIAL POSITION
Jun 30
2015*
Jun 30
2016CHANGE
Equity 6,913 7,355 6% ↗
Liabilities 3,284 3,597 10% ↗
including financial
debt 1,063 1,324 25% ↗
TOTAL EQUITY AND
LIABILITIES10,197 10,952 7% ↗
(PLNm)
(PLNm)
20GRUPA AZOTY GROUP
* Restated following application of uniform accounting policies across Grupa Azoty (see Section 2.2.c
of the Supplementary information to the financial statements)
Exchange rates as at September, 6th 2016
• EUR 1 = PLN 4.3396
• USD 1 = PLN 3.8869

0
1 000
2 000
3 000
4 000
5 000
6 000
7 000
8 000
9 000
10 000
2014 2015OtherDepreciation and amortisationLabour costsServicesRaw materials and consumables used
GRUPA AZOTY GROUP: COST STRUCTUREDRIVERS
↗ Lower cost of raw materials and consumables, attributable
to lower prices of energy (gas and coal) and petroleum
products (benzene and phenol), accompanied by increased
production volumes.
↗ Lower depreciation/amortisation, with one contributing
factor being an impairment loss recognised on the phthalic
anhydride unit in 2014.
↘ Higher cost of services related to higher sales (transport
costs)
↘ Higher cost of labour resulting from the Group's financial
performance
PLNm
-5%
40%
22%
7%
7%
6%
5%
5%4% 4%
Natural gas Other Activities
Potassium chloride Electricity
Coal Propylene
Phosphate rock Phenol
Benzene
21FINANCIAL HIGHLIGHTS
Exchange rates as at September, 6th 2016
• EUR 1 = PLN 4.3396
• USD 1 = PLN 3.8869
0
20
40
60
80
100
120
0
10000
20000
30000
40000
50000
60000
70000
Jun-0
8
Sep-0
8
Dec-0
8
Mar-
09
Jun-0
9
Sep-0
9
Dec-0
9
Mar-
10
Jun-1
0
Sep-1
0
Dec-1
0
Mar-
11
Jun-1
1
Sep-1
1
Dec-1
1
Mar-
12
Jun-1
2
Sep-1
2
Dec-1
2
Mar-
13
Jun-1
3
Sep-1
3
Dec-1
3
Mar-
14
Jun-1
4
Sep-1
4
Dec-1
4
Mar-
15
Jun-1
5
Sep-1
5
Dec-1
5
Mar-
16
Jun-1
6
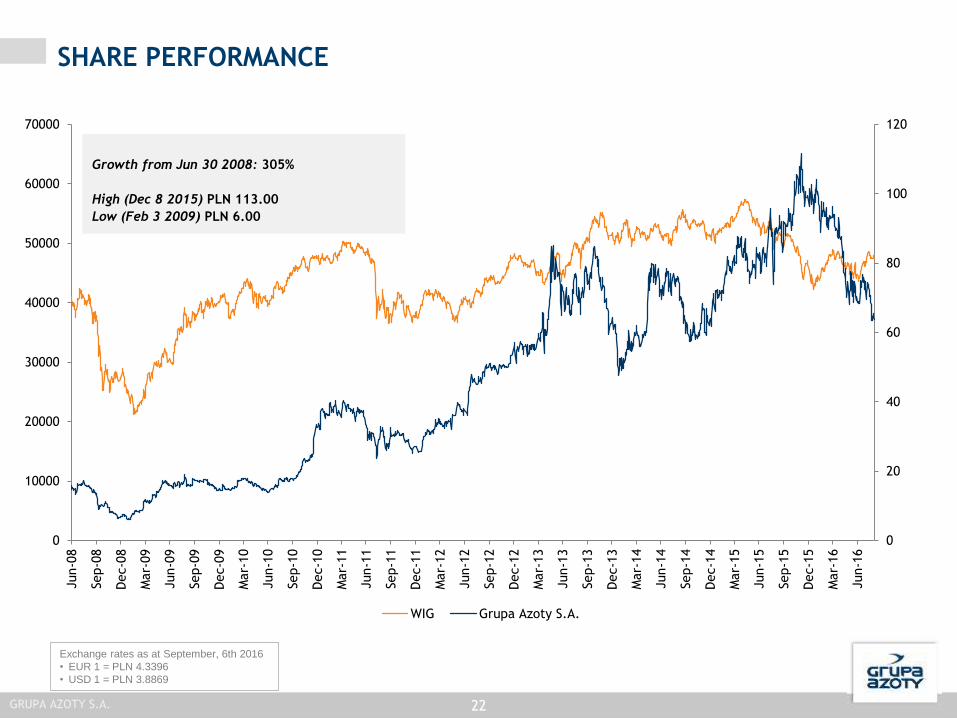
WIG Grupa Azoty S.A.
SHARE PERFORMANCE
Growth from Jun 30 2008: 305%
High (Dec 8 2015) PLN 113.00
Low (Feb 3 2009) PLN 6.00
GRUPA AZOTY S.A. 22
Exchange rates as at September, 6th 2016
• EUR 1 = PLN 4.3396
• USD 1 = PLN 3.8869
DISCLAIMER
DISCLAIMERThe information contained herein has been prepared by the Grupa Azoty Group (“the Group”) solely for the purpose of presentation to investors (“the
Presentation”). By participating in the meeting at which this Presentation is given or by referring to this Presentation you agree to the restrictions and disclaimers
presented below.
This Presentation does not constitute, or form any part of, and should not be considered as, an offer to sell or invitation to subscribe for, or as a guarantee of
purchase or other acquisition of any securities of any of the Group companies. Neither this presentation nor any part hereof may form the basis of, or be relied
upon in connection with, any subscription for or acquisition of any securities of the Group companies. Neither this Presentation nor any part hereof may form the
basis of, or be relied upon in connection with, any contract or commitment or investment decision relating to any securities of the Group companies. This
Presentation does not constitute a recommendation regarding any securities of the Group companies.
No statement or assurance, express or implied, has been made by or on behalf of the Group or any of its shareholders, members of its bodies, officers, employees,
agents or advisers or any other person as to the accuracy, completeness or reliability of the information or opinions contained in this Presentation. The discussion
of various subjects in this Presentation may include forward-looking statements. Forward-looking statements are different from statements of historical fact. They
can be identified by the use of such words as "expect", "intend", "plan", "believe", "anticipate", "will", "aim", "can", "would", "could", "continue" or similar
expressions. Forward-looking statements include statements about the financial performance, business strategy, plans and objectives of the Group (including
development plans relating to the Group). All forward-looking statements contained in this Presentation relate to matters involving known and unknown risks,
issues that are impossible to predict, and other factors. Actual results and achievements of the Group may materially differ from those given in past declarations,
and from the Company’s past performance and achievements. Forward-looking statements are made based on various assumptions about future events, including
assumptions regarding the current and future business strategies of the Group and its future business environment. Although the Group believes that its estimates
and assumptions are reasonable, they may prove to be incorrect. The information, opinions and forward-looking statements contained herein are valid only on the
date of this Presentation and are subject to change without notice. Unless required by law, the Group and its advisors are not obliged to publish any updates or
modify any information, data or statements contained in this Presentation in the event of a change to the Group’s strategy or plans or the occurrence of any facts
or circumstances that will have an effect on the Group’s strategy or plans. Please note that the only reliable source of data on the Group's and Group companies’
financial performance, as well as forecasts, events and indicators relating to the Group and the Group companies, are the current and periodic reports released by
the Group companies to comply with the applicable disclosure requirements under Polish law.
Neither the Group nor any of its shareholders, members of its bodies, officers, employees, agents or advisers nor any other person shall be liable for any loss arising
due to the use of this Presentation or its contents, or otherwise in connection with this Presentation.
Neither the Group nor any of its shareholders, members of its bodies, officers, employees, agents or advisers nor any other person is required to provide the
recipients of this Presentation with any additional information or to update this Presentation.
This Presentation contains information on the chemical industry in Poland and abroad, including information on the market share of the Company and some of its
competitors. In each case the source of such information is provided, and such information has not been subject to independent verification by or on behalf of the
Group.
This Presentation is not for distribution to or use by any person or entity in any jurisdiction where such distribution or use would be contrary to local law or would
oblige the Group or any of its affiliates to obtain an authorisation, license or exemption from the registration requirements under applicable laws. Neither this
Presentation nor any part hereof may be copied or transmitted into the United States, and cannot be disseminated, directly or indirectly in the United States.
Failure to comply with this restriction may constitute a violation of US securities laws. Persons who come into possession of this Presentation should observe all the
above limitations. Any securities referred to herein have not been and will not be registered under the US Securities Act of 1933. Any such securities may not be
offered or sold in the United States, except pursuant to an exemption or in a transaction not subject to the registration requirements of the Act.
23
THANK YOU FOR YOUR ATTENTIONFor more information visit www.grupaazoty.com
Contact: [email protected]