Embed Size (px)
Citation preview
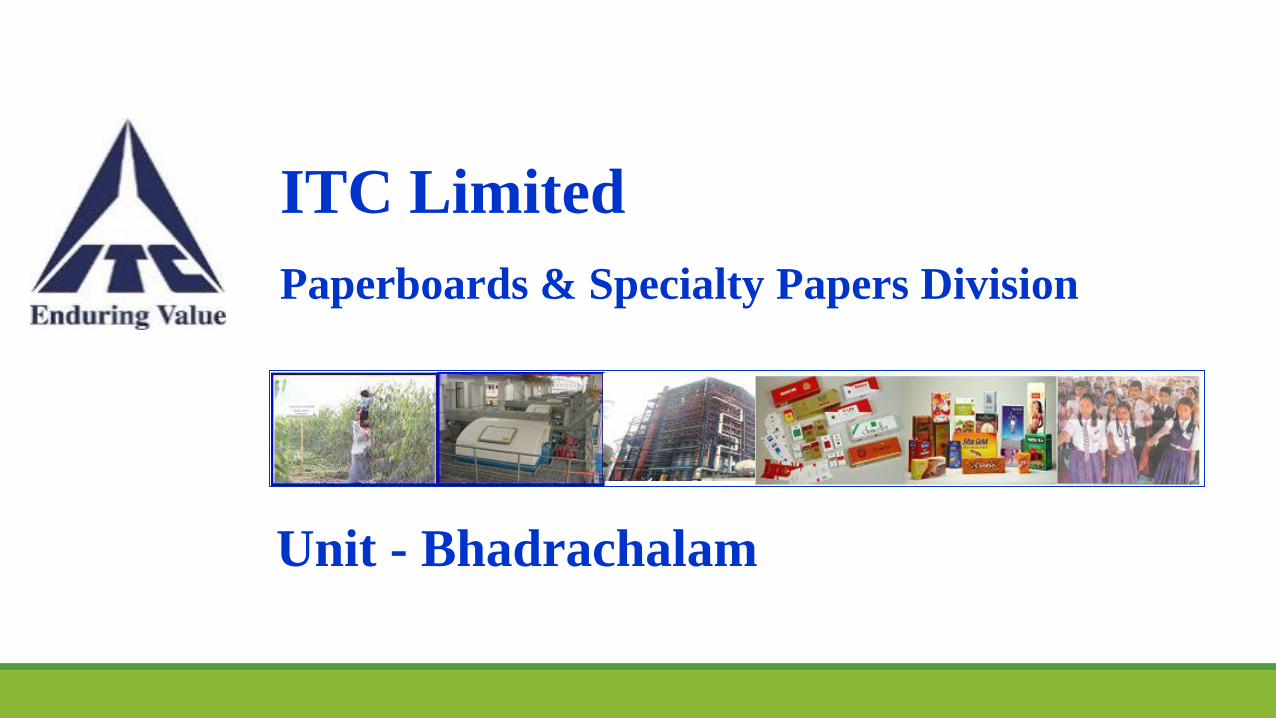
ITC Limited
Paperboards & Specialty Papers Division
Unit - Bhadrachalam

ITC PSPD 2
Company Profile
Unit- Bhadrachalam of PSPD, a Division of ITC Ltd, is India’s largest and most technologically advanced Pulp & Paper manufacturing facility.
7.4 Lakh TPA Paper and Paper Board & 3.13 Lakh TPA Bleached pulp capacity. 1 Lakh TPA BCTMP (Bleached Chemi Thermo Mechanical Pulp) Pulp capacity.
Core Competency: >99% self sufficiency through in-house co-generation. Greened over 6.2 Lakh hectares through Social and Farm Forestry GreenCo Platinum certified by CII-GBC ISO 9001, 14001 an OHSAS 18001, BRC-IoP & FSC-CoC Certified ISO 50001:2011 Certified Carbon Positive for 12 consecutive years. Water Positive for 15 years in a row. Solid Waste recycling positive for 10 years in a row. > 48.2 % of total energy consumed is from renewable sources, >50% for the unit. TPM Methodology – A way of life
Building a sustainable, secure and inclusive future through Triple Bottom Line approach- Economic, Environmental & Social

ITC PSPD 3
Process at Unit Bhadrachalam
ITC PSPD 4
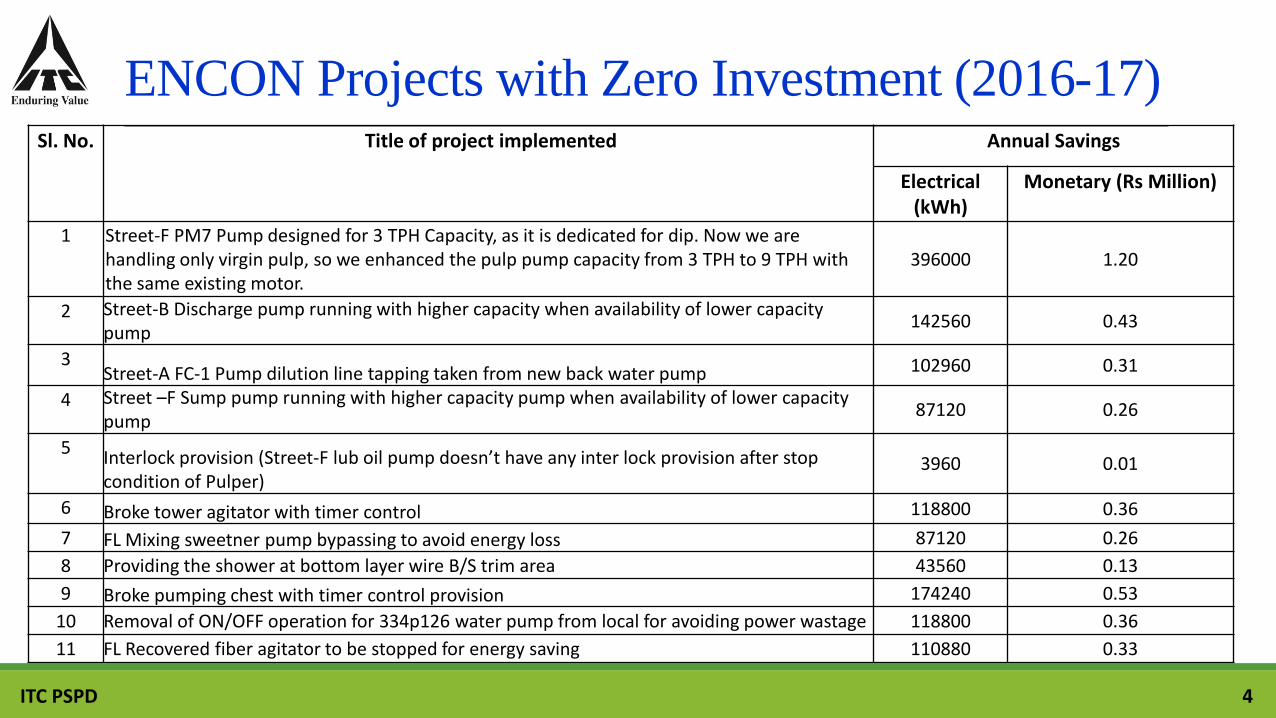
ENCON Projects with Zero Investment (2016-17)Sl. No. Title of project implemented Annual Savings
Electrical(kWh)
Monetary (Rs Million)
1 Street-F PM7 Pump designed for 3 TPH Capacity, as it is dedicated for dip. Now we are handling only virgin pulp, so we enhanced the pulp pump capacity from 3 TPH to 9 TPH with the same existing motor.
396000 1.20
2 Street-B Discharge pump running with higher capacity when availability of lower capacity pump
142560 0.43
3Street-A FC-1 Pump dilution line tapping taken from new back water pump 102960 0.31
4 Street –F Sump pump running with higher capacity pump when availability of lower capacity pump
87120 0.26
5Interlock provision (Street-F lub oil pump doesn’t have any inter lock provision after stop condition of Pulper)
3960 0.01
6 Broke tower agitator with timer control 118800 0.36
7 FL Mixing sweetner pump bypassing to avoid energy loss 87120 0.26
8 Providing the shower at bottom layer wire B/S trim area 43560 0.13
9 Broke pumping chest with timer control provision 174240 0.53
10 Removal of ON/OFF operation for 334p126 water pump from local for avoiding power wastage 118800 0.36
11 FL Recovered fiber agitator to be stopped for energy saving 110880 0.33

ITC PSPD 5
ENCON Projects with Zero Investment (2016-17)Sl. No. Title of project implemented Annual Savings
Electrical(kWh)
Monetary (Rs Million)
12 VP-2 Pulley size modification in PM3 522720 1.58
13 PM#6 Optimization of Vacuum system (Stopping of 1 standby vacuum pump) 1680000 5.07
14 PM#6 Optimization of Refiners (Increasing the Consistency from 3.6 to 4.1- running 3 refiners against4 refiners (Except 80GSM)
1584000 4.78
15 PM#6 - Reducing the running hrs of Couch Pit thick stock pump (90KW) (Interlock changed to 90% to 80% for couch pit lean stock pump)
201600 0.61
16 Efficiency improvement of pumps through coatings on the inside of Pumps (12 no’s) 504000 1.52
17 Sending of RO rejects to Raw water channel directly. 75600 0.23
18 EOP line B transfer pp can be stopped if take direct line from line B to line A. 168000 0.51
19 Condensate water loop closure for conservation & energy saving. 126000 0.38
Total 6247920 18.87
~ 1.01% of the Electrical Energy saved through zero investment projects

ITC PSPD 6
ENCON Projects with Zero Investment
ZERO investment projects are coming from shop floor / TPM where Every employee irrespective of level contributing in Energy & Resource Conservation.
Total 61 projects with ZERO investments implemented in 3 years resulted saving of Rs. 41.6 Million.
Year No. of Zero Investment
Projects
Annual Energy Saved
(Million kWh)
Annual Thermal Energy Saved
(MT Coal)
Savings(Rs. Million)
2014-15 20 3.63 228 2.9
2015-16 14 0.88 7156 19.8
2016-17 19 6.25 - 18.87
Total 53.0 10.8 7384.3 41.6

ITC PSPD 7
Major ENCON Projects with Investment (2016-17)
S.No Title of Project Annual Saving Payback period
(Months)Electrical
(kWh)Savings
(Rs Million)Investment(Rs Million)
1 PM3 Vacuum system optimization (Replacement with energy efficient pumps)
720000 1.914.42 27.8
2 PM4 Vacuum system optimization (Replacement with energy efficientpumps)
3104000 8.2319.70 28.7
3 PM5 Vacuum system optimization (Replacement with energy efficientpumps)
1880000 4.9813.51 32.5
4 PM6 Vacuum system optimization (Replacing of existing vacuum pump with energy efficient pumps)
3328000 8.8212.04 16.4
5 Light emitting plasma for HI-Mast towers (Existing metal halide with LEP Lights)
214620 0.574.63 50.9
Total 9246620 24.50 54.29 -
* Simple payback period for the implemented ENCON measures is less than 3 years

ITC PSPD 8
ENCON Projects Status (Overall)
Year
No. of Projects
Annual Electrical Savings achieved
Annual thermal savings Total Annual Savings
Investment Made
Units Million
Rs Million
Tons of Coal or oil
RsMillion
Rs Million Rs Million
2014-15 26.0 5.7 14.1 228.0 2.9 19.9 16.5
2015-16 23.0 4.9 11.3 9556.0 25.4 36.7 29.4
2016-17 24.0 15.5 43.4 0.0 0.0 43.4 54.3
Total 73.0 26.0 68.8 9784.0 28.3 100.0 100.2
Overall payback period for the implemented ENCON measures is less than 1.5 year
* Combined with & without investment projects

ITC PSPD 9
11281116
1103 1097
1000
1050
1100
1150
2013-14 2014-15 2015-16 2016-17
Sp. P
ow
er (
kWh
/T)
11281116
11031115
1,000
1,050
1,100
1,150
2013-14 2014-15 2015-16 2016-17
Sp. P
ow
er k
Wh
/T)
2.7%
Specific Power Consumption Trend(With out new project trails)
Efforts for efficiency improvement at various stages has maintained reducing trend of specific energy consumption.
Specific Energy Consumption Trends (SEC)
1.2%
Specific Power Consumption Trend(With new project trails)

ITC PSPD 10
5.73 5.67 5.61 5.55
4.5
5.0
5.5
6.0
2013-14 2014-15 2015-16 2016-17
Sp. P
ow
er (
kWh
/T)
5.73 5.67 5.61 5.68
4.0
4.5
5.0
5.5
6.0
2013-14 2014-15 2015-16 2016-17
Sp. S
team
(T/
T)
3.1%
Efforts for efficiency improvement at various stages has maintained
reducing trend of specific energy consumption.
Specific Energy Consumption Trends (SEC)
Specific Steam Consumption Trend(With out new project trails)
Specific Steam Consumption Trend(With out new project trails)
0.9%
ITC PSPD 11
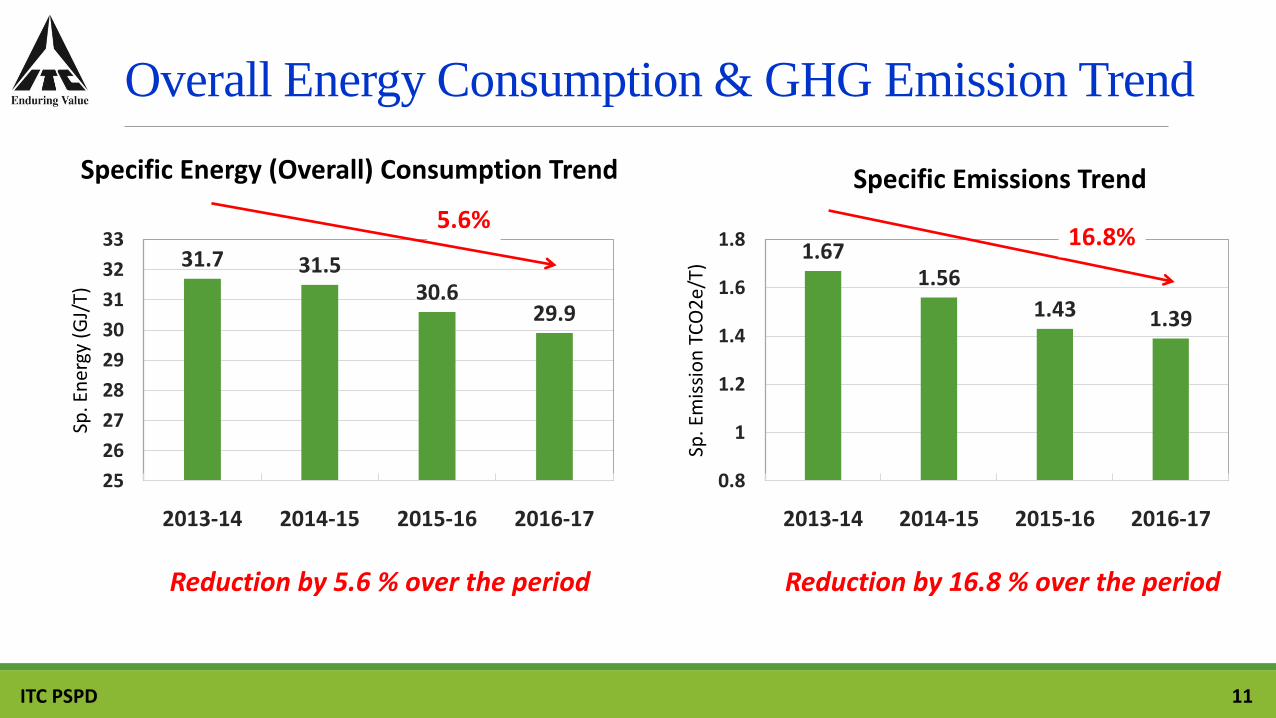
Overall Energy Consumption & GHG Emission Trend
1.671.56
1.43 1.39
0.8
1
1.2
1.4
1.6
1.8
2013-14 2014-15 2015-16 2016-17
Sp. E
mis
sio
n T
CO
2e/
T)
Specific Emissions Trend
31.7 31.530.6
29.9
25
26
27
28
29
30
31
32
33
2013-14 2014-15 2015-16 2016-17
Sp. E
ner
gy (
GJ/
T)
Specific Energy (Overall) Consumption Trend
Reduction by 5.6 % over the period Reduction by 16.8 % over the period
5.6%16.8%
ITC PSPD 12
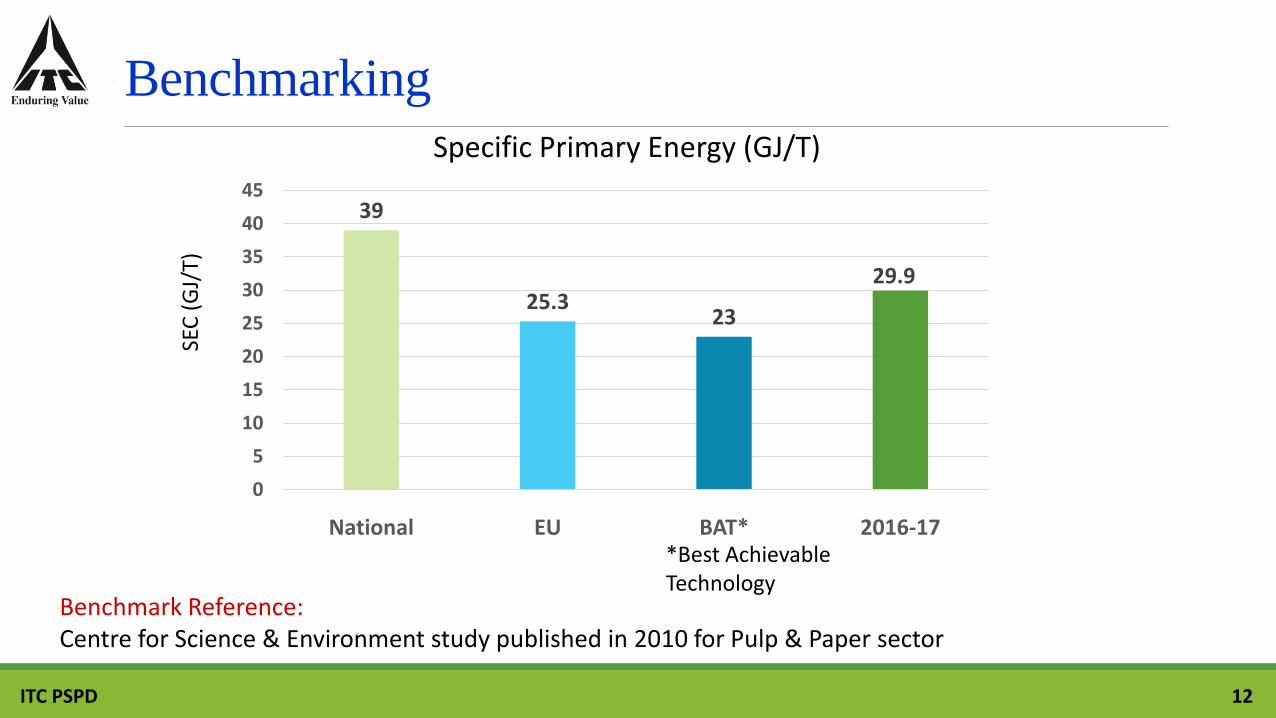
Benchmarking
Benchmark Reference: Centre for Science & Environment study published in 2010 for Pulp & Paper sector
Specific Primary Energy (GJ/T)
39
25.323
29.9
0
5
10
15
20
25
30
35
40
45
National EU BAT* 2016-17*Best Achievable Technology
SEC
(G
J/T)

Innovative Project 1Enhancing Renewable Energy From Chemical Recovery Boilers
Objective: Enhancing Renewable Energy from Chemical Recovery Boilers.
Trigger Ideas: Increasing bio fuel concentration (Reduction of water content in the Bio fuel to reduce-
-vapour content in flue gas) Reduction of heat going out with flue gases. Further scope was found to increase the boiler feed water temperature from-
127 to 135 Deg C to generate more steam.
Actions Taken: Modify with a recirculation line to increase retention time for dissolving ash. High temperature is going to upper furnace due to flame height is high.
The challenge was to reduce the height of flame. The idea was changing of spray gun to change the spray pattern in co-current to counter-
-current to flue gas path. Installation of internally modified spray gun for improving spray pattern such that, More-
-black liquor solids (BLS) reaches the hearth, there by reduced carry over to upper surface.
Challenges : Line jamming leading to boiler downtime. Challenge was to reduce the height of flame.

Innovative Project 1Enhancing Renewable Energy From Chemical Recovery Boilers
Key Process Changes: Increasing black liquor solids Long circulation of ash Change of type of gun
Benefits: Idea1: 11000 MT of steam - 111 Lakhs Idea2: 18000 MT of steam - 172 Lakhs Idea3: 31000 MT of steam - 162 Lakhs

ITC PSPD 15
Innovative Project 2
Elimination of Coal Tar Disposal
Objective:Reduction / Elimination of Coal Tar Disposal
Trigger: Handling / Transportation for Disposal of the hazardous waste to the
recycler High consumption of Furnace oil in lime kilns Waste generated from energy source resulting energy loss
Action taken: Collection & Transportation system developed Piping modification for Tar handling system Installation of Tri canter for Moisture removal

ITC PSPD 16
64.1 62
52.5 50.7 48.7 48
25
35
45
55
65
75
Fuel
Co
ns.
(kg
/T L
ime)
Fuel (FO) Consumption Trend
Benefits• Reduction of Furnace Oil more than 15 kg per ton of lime is achieved• Tar tanker movement to a longer distance eliminated and hence
transportation fuel savings• Risk to environment and society through disposal by sale is
eliminated
Innovative Project 2
Elimination of Coal Tar Disposal

ITC PSPD 17
Innovative Project 3
Real Time Energy Optimization System (Visual Mesa)
Objective:To optimize the generation side efficiency
with reduction in energy losses in system while balancing power & steam generation system
Benefits:Reduction in fuel consumption (Coal)
through improvement in overall cycle efficiency of power generation
Achieved efficiency improvement by 0.6% over the normal operating scenarios.

ITC PSPD 18
Energy Monitoring Systems (EMS)Energy consumption is monitored by Energy Meters installed at end users & viewed in the DCS for effective monitoring & control.
Leveraging technology & latest energy consumption monitoring systems in place
DCS – Process & energy control for all facilities.
SCADA – Electrical energy Monitoring and Load Management
ABB Smart Client – Real time monitoring at individual desktop
xMII - Auto generated email reporting for major plant parameters
SAP – Daily Business Reporting
ExaQ – Energy optimization Software
Visual Mesa – Real time energy optimization software
Monthly-mill performance review reports.
Energy cell monthly report on energy consumption & conservation.
Energy Monitoring DCS Screen

ITC PSPD 19
Employee Involvement & Team Work

ITC PSPD 20
Implementation Methodology
Operational Efficiency Improvement Cycle

ITC PSPD 21
Implementation of ISO 50001:2011 (EnMS)
Continual improvement of energy performance by complying with the requirements of ISO 50001:2011 Energy Management System (EnMS) standards. (The PDCA approach)
Formulation of Energy Policy Initial Energy Review, Baseline establishment Identification of EnPIs Identification of objectives, targets & management
programs Operational Controls, Documentation Internal auditor Training Internal audit Audit findings closing Management Review Certification Audit Stage-1 Certification Audit Stage-2

ITC PSPD 22
Green Co CertificationAs a part of our commitment to sustainability, Green Co is a driving tool for continual improvement in:
Energy Conservation(Power, Water & Steam) Increasing renewable energy Reduce GHG Emissions Material conservation , Reuse & Recycling Waste management & reduction Sustainable Product design & End of life management Environment Impact reduction in Supply chain Management
Certification Date: 17.06.2016

ITC PSPD 23
Renewable Energy Sources Utilization
Renewable Energy Share 2016-17 Improved utilization of Black Liquor Solids
Improvement in Biomass through Internal efforts
Efficiency improvement in Green energy systems.
Improved utilization of wind power
Renewable Energy Share %, 54.21%
Fossil Energy
Share %, 45.79%

ITC PSPD 24
Utilization of Renewable Energy Sources Green Boiler
o A biomass fired boiler to fire plantation biomass and coal at 70:30 ratio to utilize the waste from plantation & Wood Bark.
Solar PVo 20kWp SPV plant installed at plantation facilityo Additional 80 kWp SPV in plan
Wind Energyo Commissioned 46 MW wind power generation facility for displacing electrical energy
generated through coal
Biogas planto Generating biogas from food waste & ETP secondary sludge
Light pipeso Avoiding energy consumption for artificial lighting at daytimeo Installed in Paper Godown

ITC PSPD 25
Utilization of Waste Material as Fuel
100% waste utilization/ recycling
Chipper dust & bark used in Green Boiler for steam generation (Also contributing in renewable energy generation)
Lime sludge recycled with Lime Kiln.
100 % Fly ash utilization by way of manufacture of Fly Ash Bricks
Andritz Press sludge is utilized by external agency for card Board manufacturing & Egg tray manufacturing
Effluent Treated discharge for irrigation / plantations.

ITC PSPD 26
Associates Involvement
• Conducted audits for Associate manufacturers & worked on targets & ways to achieve those
• Introduction of excellence levels to all associates
• Format developed for selection of Associates & explained to them based on their specific energy consumption & reduction trends
• Identification of best practices, sharing & rewarding the performers
• Awareness creation programs conducted for Associates
Energy Reduction Trends of Associates

ITC PSPD 27
Thank You