Embed Size (px)
Citation preview

General Commands Reference Guide B
TRACE32 Online Help
TRACE32 Directory
TRACE32 Index
TRACE32 Documents ......................................................................................................................
General Commands ......................................................................................................................
General Commands Reference Guide B .................................................................................. 1
History ...................................................................................................................................... 4
BMC .......................................................................................................................................... 5
BMC Benchmark counters 5
BMC.<counter> Benchmark counters 6
BMC.<counter>.EVENT Assign event to counter 6
BMC.<counter>.FORMAT Counter value format 6
BMC.<counter>.RATIO Set two counters in relation 7
BMC.<counter>.SIZE Specify counter size 7
BMC.AtoBTrace Capture multiple alpha-beta counter values 8
BMC.AutoInit Automatic initialization 9
BMC.CLOCK Provide core clock for cycle counter 9
BMC.Init Initialize counters 9
BMC.PROfile Display counter changes per second 10
BMC.RESet Reset benchmark counter configuration 10
BMC.SELect Select counter for statistic analysis 11
BMC.state Display BMC configuration window 12
BMC.STATistic.sYmbol Flat run-time analysis with benchmark counter 15
BookMark ................................................................................................................................. 16
BookMark Address and trace bookmarks 16
BookMark.CHange Edit the settings of a bookmark 17
BookMark.Create Create a new address bookmark 18
BookMark.Delete Delete an existing bookmark 19
BookMark.EditRemark Add/edit remark of a bookmark 20
BookMark.EXPORT Export bookmarks to an XML file 21
BookMark.List List all existing bookmarks 23
BookMark.RESet Resets all bookmarks 24
BookMark.Toggle Toggles a single address bookmark 25
Break ........................................................................................................................................ 26
Break Breakpoints 26
Breakpoints within the TRACE32 Debugger 26
Temporary Breakpoints 27
General Commands Reference Guide B 1 ©1989-2018 Lauterbach GmbH

Break System of the TRACE32-ICE 28
Break System of the TRACE32-FIRE 29
Breakpoint Types 29
Mouse 30
Asynchronous Breaks 30
Break.Asm Stop program/set temporary breakpoint and switch to Asm mode 31
Break.BackGround Break background task 31
Break.Delete Delete breakpoints 32
Break.DeleteFAST Delete fast breakpoints 33
Break.DeleteHll Delete HLL breakpoints 33
Break.direct Stop program execution or set temporary breakpoints 35
Break.DISable Disable breakpoints 36
Break.ENable Enable breakpoints 38
Break.HALT Program break in hold 38
Break.Hll Stop program/set temporary breakpoint and switch to HLL mode 40
Break.IMPLementation Breakpoint implementation 41
Break.IMPLementation BACKGROUND (ICE only) 42
Break.IMPLementation FOREGROUND (ICE only) 43
Break.IMPLementation Program OFF (ICE only) 43
Break.IMPLementation Program SOFT (ICE only) 43
Break.Init Initialize breakpoints 44
Break.List Display list of breakpoints 44
Break.ListFAST Delete fast breakpoints 44
Break.Mix Stop program/set temporary breakpoint and switch to MIX mode 46
Break.MONitor Switch back to stop mode debugging 46
Break.Pass Define pass condition for breakpoint 48
Break.RESet Delete all breakpoints and reset the TRACE32 break system 48
Break.Set Set breakpoints 49
TRACE32-ICD and TRACE32-FIRE 50
On-chip Breakpoints 51
Breakpoint Types 63
Real-time vs. Intrusive Breakpoints 64
Breakpoint Options 65
TRACE32-ICE 83
Break.SetFAST Set fast breakpoints 83
Break.SetFunc Mark HLL functions 84
Break.SetHll Set HLL breakpoints 85
Break.SetLine Mark HLL lines 86
Break.SetMONitor Switch to run mode debugging at the next “Go” 87
Break.SetSec Protect program sections 87
Break.SetTask Stop the program execution when task is scheduled 88
BSDL ......................................................................................................................................... 89
BSDL Boundary scan description language 89
General Commands Reference Guide B 2 ©1989-2018 Lauterbach GmbH

BSDL.BYPASSall Check bypass mode 90
BSDL.CHECK Enable test result checking 90
BSDL.FILE Load a BSDL file 90
BSDL.FLASH Flash programming 91
BSDL.FLASH.IFCheck Check flash interface definition 91
BSDL.FLASH.IFDefine Define flash interface 93
BSDL.FLASH.IFMap Map flash interface 94
BSDL.FLASH.INIT Initialize flash interface 95
BSDL.HARDRESET TAP reset via TRST 95
BSDL.IDCODEall Check ID codes 96
BSDL.LoadDR Load data register from file 96
BSDL.MOVEDOWN Move selected chip downwards 97
BSDL.MOVEUP Move selected chip upwards 97
BSDL.ParkState Select JTAG parking state 98
BSDL.RESet Reset boundary scan configuration 98
BSDL.RUN Run JTAG sequence 99
BSDL.SAMPLEall Sample all signals 99
BSDL.SELect Select a chip 100
BSDL.SET Set chip parameters 100
BSDL.SetAndRun Immediate data register takeover 106
BSDL.SOFTRESET TAP reset via TMS 107
BSDL.state Display BSDL chain configuration window 108
BSDL.SToreDR Store data register to file 109
BSDL.TwoStepDR Single/double data register shift 110
BSDL.UNLOAD Unload a chip from chain 110
BTrace ...................................................................................................................................... 111
BTrace Script-controlled trace sink 111
BTrace.state Display BTrace configuration window 111
Usage:
(B) command only available for ICD(E) command only available for ICE(F) command only available for FIRE
General Commands Reference Guide B 3 ©1989-2018 Lauterbach GmbH

General Commands Reference Guide B
Version 22-Mar-2018
History
11-Jan-18 Added description of the command BMC.AtoBTrace.
General Commands Reference Guide B 4 ©1989-2018 Lauterbach GmbH

BMC
BMC Benchmark counters
The BMC (BenchMark Counter) commands provide control and usage of the on-chip performance monitoring capabilities. Benchmark counters are on-chip counters that count specific hardware events, e.g., the number of executed instructions.
The benchmark counters can be configured via the TRACE32 command line, a PRACTICE script (*.cmm), or the BMC.state window.
See also
■ BMC.<counter> ■ BMC.AtoBTrace ■ BMC.AutoInit ■ BMC.CLOCK ■ BMC.Init ■ BMC.PROfile ■ BMC.RESet ■ BMC.SELect ■ BMC.state ❏ BMC.CLOCK() ❏ BMC.COUNTER() ❏ BMC.OVERFLOW()
▲ ’ARM Specific Benchmarking Commands’ in ’ARM Debugger’▲ ’ARM specific Benchmarking Commands’ in ’ARMv8-A/-R Debugger’▲ ’CPU specific BenchMarkCounter Commands’ in ’TMS320C5X Debugger’▲ ’CPU specific BenchMarkCounter Commands’ in ’TMS320C6X Debugger’▲ ’ARM Specific Benchmarking Commands’ in ’Cortex-M Debugger’▲ ’CPU specific BenchMarkCounter Commands’ in ’Hexagon Debugger’▲ ’Command Reference: BenchMarkCounter’ in ’Qorivva MPC5xxx/SPC5xx Debugger and NEXUS Trace’▲ ’CPU specific BenchMarkCounter Commands’ in ’PCP Debugger Reference’▲ ’CPU specific BenchMarkCounter Commands’ in ’PPC600 Family Debugger’▲ ’CPU specific BenchMarkCounter Commands’ in ’PQIII Debugger’▲ ’CPU specific BenchMarkCounter Commands’ in ’QorIQ Debugger and NEXUS Trace’▲ ’Command Reference: BenchMarkCounter’ in ’RH850 Debugger and Trace’▲ ’CPU specific BenchMarkCounter Commands’ in ’SH2, SH3 and SH4 Debugger’▲ ’Debugging’ in ’TriCore Debugger and Trace’▲ ’CPU specific BenchmarkCounter Commands’ in ’Intel® x86/x64 Debugger’▲ ’BMC Functions (Benchmark Counter)’ in ’General Functions’▲ ’Release Information’ in ’Release History’
General Commands Reference Guide B 5 ©1989-2018 Lauterbach GmbH

BMC.<counter> Benchmark counters
See also
■ BMC.<counter>.EVENT ■ BMC.<counter>.FORMAT ■ BMC.<counter>.RATIO ■ BMC.<counter>.SIZE ■ BMC ■ BMC.state
BMC.<counter>.EVENT Assign event to counter
Assigns an event to a counter.
See also
■ BMC.<counter>
BMC.<counter>.FORMAT Counter value format
Sets up the display format for the for each benchmark counter.
See also
■ BMC.<counter>
Format: BMC.<counter>.EVENT [<event> | <event_number>]
<event> Event name defined by core manufacturer.
<event_number> Custom event ID.
BMC.<counter>.EVENT ClockCycles ; <counter> counts clock cycles
BMC.<counter> ClockCycles ; equivalent
Format: BMC.<counter>.FORMAT <format>
BMC.<counter>.FORMAT DECimal Display the counter value in decimal format.
BMC.<counter>.FORMAT HEXadecimal Display the counter value in hexadecimal format.
General Commands Reference Guide B 6 ©1989-2018 Lauterbach GmbH

BMC.<counter>.RATIO Set two counters in relation
It might be useful to set two counter values in relation to each other, e.g. data cache accesses (DCACCESS) and data cache misses (DCMISS).
See also
■ BMC.<counter>
▲ ’ARM Specific Benchmarking Commands’ in ’ARM Debugger’
BMC.<counter>.SIZE Specify counter size
Specifies the width of a counter. Counters are cascaded to provide a counter of a bigger size.
See also
■ BMC.<counter>
Format: BMC.<counter>.RATIO X/<counter _n>
BMC.<counter>.EVENT DCMISS
BMC.<counter>.RATIO X/DCACCESS
Format: BMC.<counter>.SIZE <size>
BMC.<counter>.SIZE 32BIT
General Commands Reference Guide B 7 ©1989-2018 Lauterbach GmbH

BMC.AtoBTrace Capture multiple alpha-beta counter values
Allows you to use a stripped-down version of BMC.STATistic.sYmbol if your target is not an CortexM3. However, the target must support Alpha and Beta breakpoints!
The above BMC.STATistic.sYmbol window can be reproduced as follows:
See also
■ BMC ■ BMC.state
Format: BMC.AtoBTrace [ON | OFF]
BMC.REset ;Clear previous AtoB traceBMC.AtoBTrace ON ;Enable AtoB trace BMC.AutoInit ON ;Automatically reset counter values ;after each capture.
;Configure counters and enable AtoB breakpoint triggersBMC.<counter0>.EVENT INST-CMPBMC.<counter0>.ATOB ON BMC.<counter1>.EVENT INSTW-FTBMC.<counter1>.ATOB ON
GOSUB capture_func func13 1s ;Do the actual captureGOSUB capture_func func17 1sGOSUB capture_func func21 1sBMC.STATistic.sYmbolENDDO
capture_func: ENTRY &funcname &time
Register.Set PC <start> ;Start from known location Break.SetFunc &funcname ;Will set Alpha and Beta breakpoints Go WAIT &time ;Wait until function has been executed Break; Break.Delete /Alpha ;Clear breakpoints for next run Break.Delete /Beta RETURN
General Commands Reference Guide B 8 ©1989-2018 Lauterbach GmbH

BMC.AutoInit Automatic initialization
The BMC.Init command will be executed automatically, when the user program is started.
See also
■ BMC ■ BMC.state
BMC.CLOCK Provide core clock for cycle counter
TRACE32 calculates and displays time information, if clock cycles are counted and the core clock is known.
See also
■ BMC ■ BMC.state
BMC.Init Initialize counters
All counters are set to their initialization values.
See also
■ BMC ■ BMC.state
Format: BMC.AutoInit [ON | OFF]
Format: BMC.CLOCK <clock>
BMC.<counter> ClockCylces
BMC.CLOCK 450.Mhz
Format: BMC.Init
General Commands Reference Guide B 9 ©1989-2018 Lauterbach GmbH

BMC.PROfile Display counter changes per second
If the target system allows to read the event counters while the program execution is running, TRACE32 can sample the values of up to three counters periodically. The counter changes per second are displayed graphically. The default sampling rate is 10 times per second.
See also
■ BMC ■ BMC.state
BMC.RESet Reset benchmark counter configuration
Resets the BenchMark Counter configuration to the default settings.
See also
■ BMC ■ BMC.state
Format: BMC.PROfile [<y_scale>]
Format: BMC.RESet
Push Legend to get a color legend
General Commands Reference Guide B 10 ©1989-2018 Lauterbach GmbH

BMC.SELect Select counter for statistic analysis
The exported event counter values can be combined with the exported instruction flow in order to get a clearer understanding of the program behavior. The command BMC.SELect allows to specify which counter is combined with the instruction flow to get a statistical evaluation.
See also
■ BMC ■ BMC.state
Format: BMC.SELect <counter>
<counter>: COUNTER0 | COUNTER1 | …
General Commands Reference Guide B 11 ©1989-2018 Lauterbach GmbH
BMC.state Display BMC configuration window[Step-by-Step Procedure] [Example]
Displays the BMC.state window, where you can assign events to benchmark counters in order to count these events and compare one counter in relation to another counter. The benchmarking results are displayed in the BMC.state window.
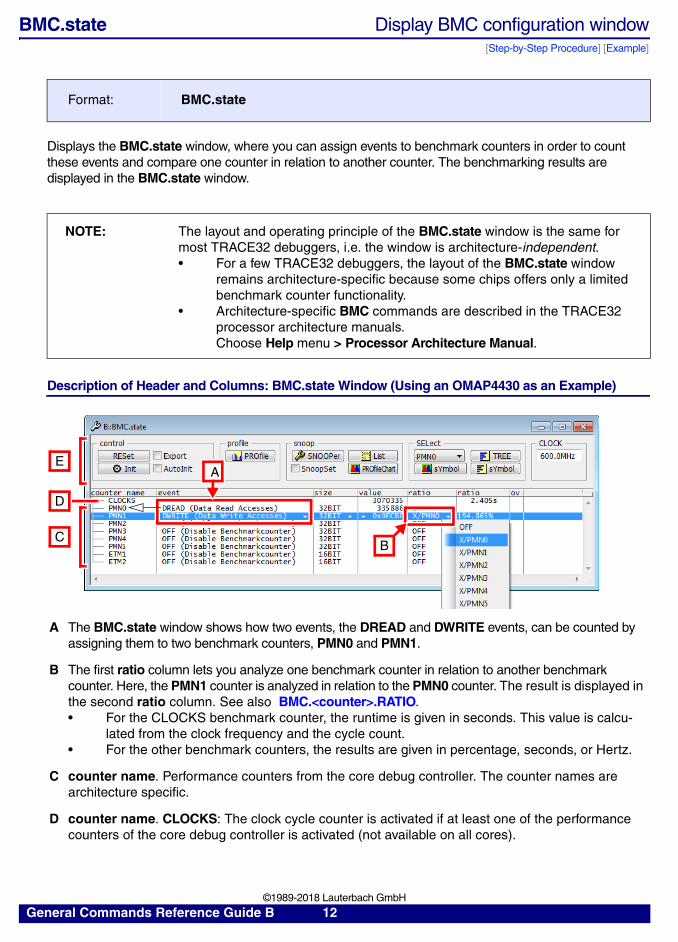
Description of Header and Columns: BMC.state Window (Using an OMAP4430 as an Example)
Format: BMC.state
NOTE: The layout and operating principle of the BMC.state window is the same for most TRACE32 debuggers, i.e. the window is architecture-independent.• For a few TRACE32 debuggers, the layout of the BMC.state window
remains architecture-specific because some chips offers only a limited benchmark counter functionality.
• Architecture-specific BMC commands are described in the TRACE32 processor architecture manuals.Choose Help menu > Processor Architecture Manual.
A The BMC.state window shows how two events, the DREAD and DWRITE events, can be counted by assigning them to two benchmark counters, PMN0 and PMN1.
B The first ratio column lets you analyze one benchmark counter in relation to another benchmark counter. Here, the PMN1 counter is analyzed in relation to the PMN0 counter. The result is displayed in the second ratio column. See also BMC.<counter>.RATIO.• For the CLOCKS benchmark counter, the runtime is given in seconds. This value is calcu-
lated from the clock frequency and the cycle count.• For the other benchmark counters, the results are given in percentage, seconds, or Hertz.
C counter name. Performance counters from the core debug controller. The counter names are architecture specific.
D counter name. CLOCKS: The clock cycle counter is activated if at least one of the performance counters of the core debug controller is activated (not available on all cores).
B
E
D
C
A
General Commands Reference Guide B 12 ©1989-2018 Lauterbach GmbH

To Assign Events to Benchmark Counters via the User Interface TRACE32 PowerView:
1. At the TRACE32 command line type, BMC.state to open the window.
2. In the counter name column, click the benchmark counter you want to configure.
The selected row is highlighted in blue. Little white down-arrows indicate that you can configure the values in these columns via drop-down lists [A].
3. In the event column, right-click the white down-arrow, and then select the event to be counted [B].
E Header. For descriptions of the commands in the BMC.state window, please refer to the BMC.* commands in this chapter. Example: For information about the AutoInit check box, see BMC.AutoInit.
- event.The drop-down list shows the name of the event together with a short description in parentheses. The available events are device-specific. See BMC.<counter>.EVENT.
- size. Displays the size of the performance counters. For architectures providing variable counter sizes, the counter size can be adjusted with the BMC.<counter>.SIZE command.
- value. Number of hardware events counted. Right-click to display the value as decimal or hex. In a PRACTICE script, you can format the value as hex or decimal using the command BMC.<counter>.FORMAT, see example.
- ratio. See [B].
- ov. Counter overflow.
General Commands Reference Guide B 13 ©1989-2018 Lauterbach GmbH

PRACTICE Script Example for the OMAP4430:
See also
■ BMC ■ BMC.<counter> ■ BMC.AtoBTrace ■ BMC.AutoInit ■ BMC.CLOCK ■ BMC.Init ■ BMC.PROfile ■ BMC.RESet ■ BMC.SELect
▲ ’Command Reference’ in ’TriCore Debugger and Trace’▲ ’Release Information’ in ’Release History’
BMC.state ;open the BMC.state window
BMC.CLOCK 600.0MHz ;baseline for all benchmark counter ;calculations
;columns 'counter name' and 'event'BMC.PMN0.EVENT DREAD ;assign the DREAD event to the PMN0 counterBMC.PMN1.EVENT DWRITE ;assign the DWRITE event to the PMN1 counter
;'value' column ;for demo purposes let's format the valueBMC.PMN1.FORMAT HEXadecimal ;of PMN1 as hex
;'ratio' columnBMC.PMN1.RATIO X/PMN0 ;analyze PMN1 in relation to PMN0
BMC.PROfile ;the BMC.PROfile window displays the current ;number of events per second. ;______ if 0 events.
Go ;start real-time emulation - the BMC windowsWAIT 1.s ;are updated while the emulation is runningBreak ;stop emulation
General Commands Reference Guide B 14 ©1989-2018 Lauterbach GmbH

BMC.STATistic.sYmbol Flat run-time analysis with benchmark counter
The instruction flow recorded to the selected trace sink (command Trace.METHOD) is synthesized with recorded benchmark counter information in order to display a flat function run-time analysis.
Example for Cortex-M3 (ETM instruction flow plus benchmark counter information via ITM):
Format: BMC.STATistic.sYmbol
Trace.METHOD CAnalyzer ; specify CombiProbe as source for; the instruction flow
…
ITM.RESet ; reset ITM configuration
ITM.DataTrace OFF ; deactivate data trace
ITM.ON ; activate ITM
BMC.Trace ON ; enable the export of the ; benchmark counter information; via the ITM
BMC.SELect LSU ; select LSU counter for the ; synthesis
… ; fill trace
BMC.STATistic.sYmbol ; perform the synthesis and display ; the result
General Commands Reference Guide B 15 ©1989-2018 Lauterbach GmbH

BookMark
BookMark Address and trace bookmarks
There are two types of bookmarks, which are distinguished by their color:
• Address bookmarks are marked with a small green rectangle.
• Trace bookmarks are marked with a small yellow rectangle.
Using bookmarks, you can mark, locate, and identify trace records of interest or addresses of interest. For code coverage, you can use bookmarks to add comments to not-executed code.
It is recommended that you use bookmarks together with the /Track option to improve navigation: Let’s assume that the List.auto /Track window is already open. When you single-click any of the address bookmarks in the BookMark.List window, the cursor in the List.auto /Track window automatically points to the corresponding assembler code. See figure below.
When you double-click an address bookmark in the BookMark.List window, a new List window opens at the bookmarked address.
When you double-click a trace bookmark in the BookMark.List window, a new <trace>.List window opens at the bookmarked trace record.
See also
■ BookMark.CHange ■ BookMark.Create ■ BookMark.Delete ■ BookMark.EditRemark ■ BookMark.EXPORT ■ BookMark.List ■ BookMark.RESet ■ BookMark.Toggle ■ <trace>.BookMark ■ <trace>.BookMarkToggle ■ <trace>.GOTO ■ <trace>.TRACK ■ IProbe.BookMark
NOTE: Bookmark names are case sensitive.
General Commands Reference Guide B 16 ©1989-2018 Lauterbach GmbH

BookMark.CHange Edit the settings of a bookmark
Opens a dialog where you can change the settings of a bookmark and rename the bookmark. In addition, you can use the BookMark.CHange command to create a new bookmark. Alternatively, you can right-click the desired bookmark in the BookMark.List window, and then select Change.
Example:
See also
■ BookMark
Format: BookMark.CHange "<bookmark_name>" <address> | <time> [<file>] [<line>]
<bookmark_name> Bookmark names are case sensitive.
<time>, <file>, <line> The parameters <time>, <file>, and <line> are reserved for the scripting-mode of TRACE32, they are not needed in the dialog-mode of TRACE32.
;displays the settings for the bookmark "Loop"BookMark.CHange "Loop"
;TRACE32 suggests a new bookmark name by incrementing to the next ;bookmark numberBookMark.CHange
;the bookmark name is incremented, and the new bookmark will refer;to the symbol main (see screenshot below)BookMark.CHange , main
Opens the Browse Symbols dialog. (sYmbol.Browse.sYmbol)
General Commands Reference Guide B 17 ©1989-2018 Lauterbach GmbH

BookMark.Create Create a new address bookmark
Creates a new address bookmark. If the <bookmark_name> exists already, the command BookMark.Create will overwrite the address bookmark with the new parameters.
Examples:
See also
■ BookMark ■ <trace>.BookMark
Format: BookMark.Create "<bookmark_name>" <address> | <time> [<file>] [<line>]
NOTE: To create a trace bookmark, use the <trace>.BookMark command.
<bookmark_name> Bookmark names are case sensitive.
<time>, <file>, <line> The parameters <time>, <file>, and <line> are reserved for the scripting-mode of TRACE32, they are not needed in the dialog-mode of TRACE32.
; create a new bookmark at 0x1000 and label it "start"BookMark.Create "start" 0x1000
; create a new bookmark at the entry of func24 and name it "My_Code"BookMark.Create "My_Code" func24
; overwrites the existing bookmark called "My_Code" with the address; 0x2000BookMark.Create "My_Code" 0x2000
General Commands Reference Guide B 18 ©1989-2018 Lauterbach GmbH

BookMark.Delete Delete an existing bookmark
Deletes an existing bookmark.
See also
■ BookMark
Format: BookMark.Delete "<bookmark_name>" [<address> | <time>] [<file>] [<line>]
<bookmark_name> Bookmark names are case sensitive.
<time>, <file>, <line> The parameters <time>, <file>, and <line> are reserved for the scripting-mode of TRACE32, they are not needed in the dialog-mode of TRACE32.
BookMark.Delete "start" ; Delete the bookmark named "start"
BookMark.Delete "My_Code" ; Delete the bookmark "My_Code"
General Commands Reference Guide B 19 ©1989-2018 Lauterbach GmbH

BookMark.EditRemark Add/edit remark of a bookmark
Adds a user-defined <remark> to a <bookmark_name>.
• To edit or delete a remark via the BookMark.List window, right-click the remark, and then select the desired option from the popup menu.
• To edit or delete a remark via the TRACE32 command line, assign the desired string or empty string to <remark>.
Adding another remark to the same bookmark-symbol combination overwrites the previous remark. However, you can add multiple remarks to the same symbol if you also assign multiple bookmarks to that symbol, as shown in the example below.
Example:
See also
■ BookMark ■ <trace>.BookMark
Format: BookMark.EditRemark "<bookmark_name>" [<remark>]
;open the Bookmark.List windowBookMark.List
;create a bookmark for symbol main and add a remarkBookMark.Create "any_BM" mainBookMark.EditRemark "any_BM" "This is a remark for main"
;create two new bookmarks at the entry of the symbol “func24”;and name the bookmarks "My_Code1, My_Code2"BookMark.Create "My_Code1" func24BookMark.Create "My_Code2" func24
;for each bookmark of symbol “func24”, add one remark:BookMark.EditRemark "My_Code1" "This is remark 1 for func24"BookMark.EditRemark "My_Code2" "This is remark 2 for func24"
General Commands Reference Guide B 20 ©1989-2018 Lauterbach GmbH

BookMark.EXPORT Export bookmarks to an XML file
Exports all or selected bookmarks to an XML file. The XML file is formatted by placing a transformation template (*.xsl) in the same folder as the XML file.
Using the STOre <file> BookMark command, you can save the bookmark list as a PRACTICE script (*.cmm).
Example 1: All existing bookmarks are exported. The unformatted result is displayed in TRACE32, and the formatted result is displayed in a browser window.
The tildes ~~ expand to your TRACE32 system directory, by default c:\t32.
Format: BookMark.EXPORT <file> <range> <address> [/Append]
<range> Range filter for exporting bookmarks that are located within a specified address range.
<address> Address filter for exporting an individual bookmark located at a specified address.
Append The bookmarks displayed in the BookMark.List window are appended at the end of the file.
;export all bookmarksBookMark.EXPORT "~~/bookmarks.xml" ,
;for demo purposes: let's assume that you have added another bookmarkBookMark.Create "any_BM" R:0x1FF8 ;e.g. at this address
;append the new bookmark to the previous XML fileBookMark.EXPORT "~~/bookmarks.xml" R:0x1FF8 /Append
;for demo purposes: let's open the unformatted result in the internal;TRACE32 editorEDIT.OPEN "~~/bookmarks.xml"
;place the transformation template in the same folder as the XML fileCOPY "~~/demo/coverage/single_file_report/t32transform.xsl" \ "~~/t32transform.xsl"
;you can now open the formatted result in an external browser windowOS.Command start iexplore.exe "file:///C:/t32/bookmarks.xml"
General Commands Reference Guide B 21 ©1989-2018 Lauterbach GmbH

Example 2: A more complex demo script is included in your TRACE32 installation. To access the script, run this command:B::CD.PSTEP ~~/demo/coverage/example.cmm
See also
■ BookMark
▲ ’Trace-based Code Coverage’ in ’Nexus Training’
A Unformatted result.
B Example of a formatted result in a browser window.
A
B
General Commands Reference Guide B 22 ©1989-2018 Lauterbach GmbH

BookMark.List List all existing bookmarks
Displays all existing bookmarks. There are two types of bookmarks, which are distinguished by their color:
• Address bookmarks are marked with a small green rectangle.
• Trace bookmarks are marked with a small yellow rectangle.
The same bookmark color codes are also used in other TRACE32 windows.
Example:
See also
■ BookMark ■ <trace>.BookMark ■ <trace>.BookMarkToggle ■ AutoSTOre ■ STOre
▲ ’Trace-based Code Coverage’ in ’Nexus Training’
Format: BookMark.List
A Address bookmark.
B Trace bookmark.
BookMark.List ; display all bookmarks in a list
B
A
General Commands Reference Guide B 23 ©1989-2018 Lauterbach GmbH

BookMark.RESet Resets all bookmarks
Resets the bookmarking system. Alternatively, click Delete All in the BookMark.List window.
See also
■ BookMark
Format: BookMark.RESet
BookMark.RESet ; reset all the bookmarks in the bookmarking system
General Commands Reference Guide B 24 ©1989-2018 Lauterbach GmbH

BookMark.Toggle Toggles a single address bookmark
Switches a single address bookmark on or off. TRACE32 executes the same command when you right-click in a List.auto window, and then choose Toggle Bookmark (see figure below).
The resulting bookmark names are auto-incremented 1, 2, 3, etc. User-defined bookmark names can be created via the command line. A small green rectangle next to the address/line number indicates an address bookmark.
Example:
See also
■ BookMark ■ <trace>.BookMarkToggle
Format: BookMark.Toggle "<bookmark_name>" [<address> | <time>] [<file>] [<line>]
<bookmark_name> User-defined bookmark name. An auto-incremented bookmark name can be generated via the command line if a comma is entered instead of a user-defined name.
<time>, <file>, <line> The parameters <time>, <file>, and <line> are reserved for the scripting-mode of TRACE32, they are not needed in the dialog-mode of TRACE32.
List.auto /Track ;display source listingBookMark.List ;display all bookmarks in a list
BookMark.Toggle , 0x2290 ;switch on a bookmark at 0x2290 and ;auto-increment the bookmark name
BookMark.Toggle "start" 0x1000 ;switch on a bookmark at 0x1000 and ;label it "start"
BookMark.Toggle "start" ;switch off the existing bookmark
Address bookmark at line 692.
General Commands Reference Guide B 25 ©1989-2018 Lauterbach GmbH

Break
Break Breakpoints
See also
■ Break.Asm ■ Break.BackGround ■ Break.Delete ■ Break.DeleteFAST ■ Break.DeleteHll ■ Break.direct ■ Break.DISable ■ Break.ENable ■ Break.HALT ■ Break.Hll ■ Break.IMPLementation ■ Break.Init ■ Break.List ■ Break.ListFAST ■ Break.Mix ■ Break.MONitor ■ Break.Pass ■ Break.RESet ■ Break.Set ■ Break.SetFAST ■ Break.SetFunc ■ Break.SetHll ■ Break.SetLine ■ Break.SetMONitor ■ Break.SetSec ■ Break.SetTask ■ List ■ Step ❏ Break.Alpha.EXIST() ❏ Break.Beta.EXIST() ❏ Break.Charly.EXIST()
▲ ’Break Functions’ in ’General Functions’▲ ’Breakpoints’ in ’Debugger Basics - Training’▲ ’Breakpoints’ in ’Debugger Basics - SMP Training’
Breakpoints within the TRACE32 Debugger
The TRACE32 Debuggers use a mix of Software and Onchip breakpoints to stop the program execution.
A Software breakpoint replaces an instruction in the target memory by a “breakpoint” instruction. The number of software breakpoints is unlimited.
Onchip breakpoints use resources provided by the chip/core to realize a breakpoint. Onchip breakpoints are only available in a limited number. A detailed list of the available Onchip breakpoints listed by processor architectures is provide on page 51.
Permanent breakpoint are used most of the time. Permanent breakpoints are controlled using Break.Set or Break.Delete commands.
But TRACE32 provides also so-called temporary breakpoints (see next page).
A detailed introduction into the breakpoint usage can be found in:
• “Debugger Basics - Training” (training_debugger.pdf).
• “Debugger Basics - SMP Training” (training_debugger_smp.pdf).
General Commands Reference Guide B 26 ©1989-2018 Lauterbach GmbH
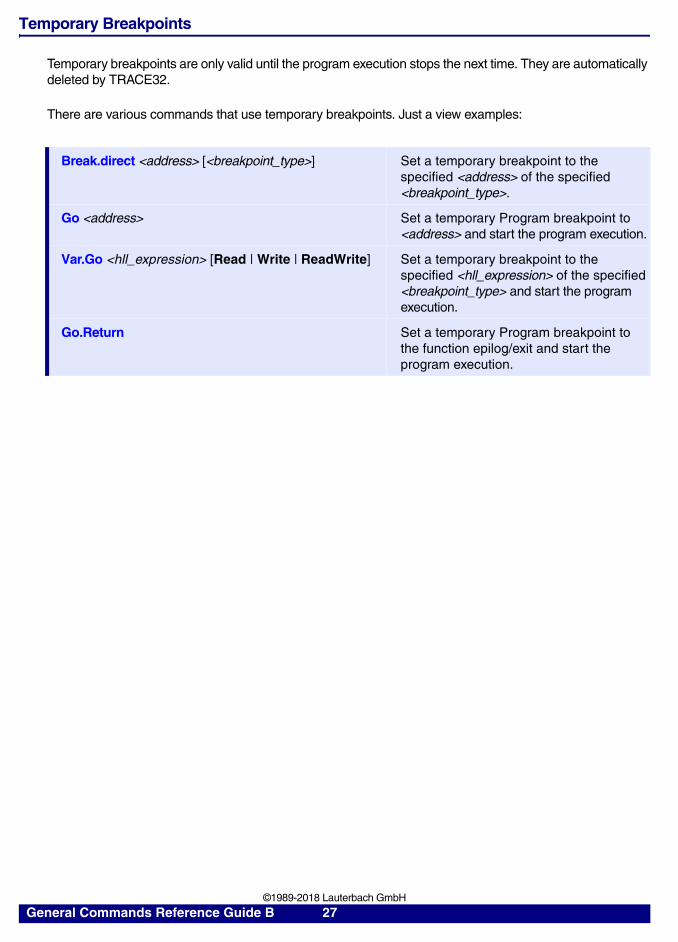
Temporary Breakpoints
Temporary breakpoints are only valid until the program execution stops the next time. They are automatically deleted by TRACE32.
There are various commands that use temporary breakpoints. Just a view examples:
Break.direct <address> [<breakpoint_type>] Set a temporary breakpoint to the specified <address> of the specified <breakpoint_type>.
Go <address> Set a temporary Program breakpoint to <address> and start the program execution.
Var.Go <hll_expression> [Read | Write | ReadWrite] Set a temporary breakpoint to the specified <hll_expression> of the specified <breakpoint_type> and start the program execution.
Go.Return Set a temporary Program breakpoint to the function epilog/exit and start the program execution.
General Commands Reference Guide B 27 ©1989-2018 Lauterbach GmbH

Break System of the TRACE32-ICE
The TRACE32-ICE system has a second memory. It can be activated separately from emulation memory and is used for marking breakpoints or breakpoint ranges. Initialization takes place automatically when breakpoints are set. Unused memory can be freed for reallocation if so required. Breakpoint mapping is done in 4K blocks. A maximum of 8 different breakpoints can be set in any given program address or data address. The breakpoint should not be considered as breakpoints only, but also as address identifiers used by the analyzer trigger system or the performance analyzer.
BREAK DATA
C B A W R S H P 7 .......... 0
Analyzer
EmulationSystem Target
Trigger
Spot
General Commands Reference Guide B 28 ©1989-2018 Lauterbach GmbH

Break System of the TRACE32-FIRE
TRACE32-FIRE can use a mix of on-chip, software and hardware breakpoints. A software breakpoint replaces an instruction in the target memory by a “breakpoint” instruction. Other breakpoint types (e.g. read/write breakpoints) may be implemented using On-Chip resources or the trigger system of FIRE. The implementation is CPU dependent. Hardware breakpoints are implemented in a breakpoint memory and allow a virtually unlimited number of breakpoints. The hardware breakpoints are mainly used as address selectors for the analyzer or as read/write breakpoints. On some targets Program breakpoints can also be implemented in hardware. The Break.IMPLementation command allows to choose the default implementation of breakpoints.
Breakpoint Types
All CPU specific features of the on-chip interface are supported on TRACE32-ICD and TRACE32-FIRE. Data breakpoints with special features may be available for some CPUs. For details refer to the CPU specific Processor Architecture Manual.
Program This is the default breakpoint for the program code range. Program breakpoints can only be set at the beginning of commands, that is to say, set for address ranges only if these are externally accessed jump addresses. This protects data areas from being accessed unintentionally. When the address is accessed by a data cycle, this breakpoint is ignored (only TRACE32-ICE).
Hll This breakpoint is only used on TRACE32-ICE. High-level language debugging is supported by hardware. To this end, all lines of high-level language code are flagged appropriately. Flagging is done automatically when the debug information is loaded together with the program.
Read, Write Both these breakpoint groups are used for flagging program variables. If the Read Data and Write Data options have been set in the TrMain.Set command, then triggering takes place only when data is accessed (only TRACE32-ICE).
Alpha, Beta, Charly, Delta (BF),Echo (BF)
Alpha, Beta, Charly, Delta and Echo breakpoints are address selectors which can be used both as a breakpoint, as well as an address selector for the analyzer.On TRACE32-ICE in addition, Spot, Read, Write, Alpha, Beta and Charly breakpoints are used for address flagging in conjunction with the performance analyzer. Thus, 63 non-overlapping memory ranges can be defined. The breakpoint function is disabled whenever the performance analyzer needs BREAK RAM. Program and high-level language breakpoints, nevertheless, can still be set.
General Commands Reference Guide B 29 ©1989-2018 Lauterbach GmbH

Mouse
The most common way to set breakpoints is using the mouse. Press the menu mouse button to select this function while the mouse cursor is on the place you like to set breakpoints. It is also possible to toggle breakpoints by clicking on the breakpoint display field in the left scale.
Asynchronous Breaks
Real-time emulation may be stopped by the keyboard or by trigger events. The program is stopped at the next assembler or HLL line by the command Break.direct.
In HLL the system waits for 500 ms to break on the HLL line and then it is switched-over to assembler break system (TRACE32-ICE only).
In an ESI-based ROM-monitor configuration the NMI pin of one EPROM adapter must be connected to the NMI pin of the CPU to be able to stop the running system.
Go Till Here Sets the default breakpoints as a temporary breakpoint and starts the emulation.
Default Breakpoints Sets or clears the default breakpoints. One TRACE32-ICD and FIRE this is a Program breakpoint. On TRACE32-ICE it can be selected by the SETUP.BREAKDEF command. It is either a combination of Program, Read and Write or only a Program breakpoint.
Spotpoint Sets or clears a spot point. On TRACE32-ICE it will also enable the SPOT system.
Breakpoints … Select breakpoint menu to set or delete separate breakpoints.
39 30 2F 30
E::Data.dumprCBAWRSHP address 0 1 2 3 0123
D:000000 F3 C3 00 02 ....D:000004 00 00 00 00 ....D:000008 00 00 00 00 ....D:00000C 00 00 00 00 ....
P D:00001090/0
D:000014 30 2F30 30 0/00
D:000018 00 0000 00 ....
D:00001C 00 0000 00 ....
D:000020 00 0000 00 ....
Go Till Here
SpotpointSet PC HereDisplay MemoryBreakpoint …Go Till …
Default Breakpoint
General Commands Reference Guide B 30 ©1989-2018 Lauterbach GmbH

Break.Asm Stop program/set temporary breakpoint and switch to Asm mode
Stops the program execution or sets a temporary breakpoint and switches the debug mode to Asm.
See also
■ Break ■ Break.direct
Format: Break.Asm [<address> …[/<breaktype> …]]
<breaktype>: Program | ReadWrite | Read | Write
Onchip | HARD | SOFT
ProgramPass | ProgramFail
MemoryReadWrite | MemoryRead | MemoryWriteRegisterReadWrite | RegisterRead | RegisterWriteVarReadWrite | VarRead | VarWriteDATA[.Byte | .Word | .Long] <value> …
Alpha | Beta | Charly | Delta | Echo
WATCH | BusTrigger | BusCountTraceEnable | TraceData | TraceON | TraceOFF | TraceTrigger
SpotDISable | DISableHIT | NoMark | EXcludeTASK <magic_number> | <task_id> | <task_name>COUNT <value>CONDition <expression> [/AfterStep]VarCONDition <hll_expression> [/AfterStep]CMD <command_string>RESUME
DIALOG | DIALOGADVANCED
Hll (E) DEFault (E)ALL (E)AllNotHll (E)
<breaktype> For a description of the breakpoint types and breakpoint options, see Break.Set.
General Commands Reference Guide B 31 ©1989-2018 Lauterbach GmbH

ICE only
Break.BackGround Break background task
This command can only be executed if a background task was activated (see TASK command).
See also
■ Break ■ Break.direct
▲ ’Release Information’ in ’Release History’
Break.Delete Delete breakpoints
Deletes all breakpoints if used without a parameter.
Format: Break.BackGround
Format: Break.Delete [[<address> | <addressrange>] [/<breaktype> …]]
<breaktype>: Program | ReadWrite | Read | Write
Onchip | HARD | SOFT
ProgramPass | ProgramFailAlpha | Beta | Charly | Delta | Echo
WATCH | BusTrigger | BusCountTraceEnable | TraceData | TraceON | TraceOFF | TraceTrigger
TASK <magic_number> | <task_id> | <task_name>
Program | Hll | Spot | Read | Write (E)Alpha | Beta | Charly (E)Data (E)DEFault (E)ALLAllNotHll (E)
<address>, <addrressrange>
Specifying an <address> or an <addressrange> allows to delete only the specified breakpoint.
<breaktype> Specifying a <breaktype> allow to delete all breakpoints of this type.
For a description of the breakpoint types and breakpoint options, see Break.Set.
General Commands Reference Guide B 32 ©1989-2018 Lauterbach GmbH

TRACE32-ICE only:
See also
■ Break ■ Break.direct ■ Var.Break.Delete
▲ ’Breakpoint Memory’ in ’ICE User’s Guide’▲ ’Breakpoint Handling’ in ’Debugger Basics - Training’▲ ’Breakpoint Handling’ in ’Debugger Basics - SMP Training’▲ ’Breakpoint Handling’ in ’Training FIRE Basics’▲ ’Breakpoints’ in ’Training ICE Basics’
ICE only
Break.DeleteFAST Delete fast breakpoints
Deletes FAST breakpoints (some ICE emulators only)
See also
■ Break ■ Break.direct
Break.Delete ; delete all breakpoints
Break.Delete 0x1000--0x1fff ; delete all breakpoints; in the address range of 0x1000 to 0x1fff
Break.Delete func9 ; delete the breakpoint at the entry; to the function func9
Break.Delete mstatic1 /Read ; delete read breakpoints on integer; variable mstatic1
; delete write breakpoint on array flagsVar.Break.Delete flags /Write
Break.Delete /Hll ; Erase all high-level language; breakpoints
Break.Delete Var.RANGE(INTERRUPT) /Hll ; Erase HLL breakpoints in; interrupt routine
Format: Break.DeleteFAST [<address> | <addressrange>]
General Commands Reference Guide B 33 ©1989-2018 Lauterbach GmbH

ICE only
Break.DeleteHll Delete HLL breakpoints
The HLL breakpoints in the range are removed. Partial set HLL breakpoints allow selective debugging of modules or functions. Functions without breakpoints are executed in real time, when performing an HLL step.
See also
■ Break ■ Break.direct
▲ ’Breakpoint Memory’ in ’ICE User’s Guide’
Format: Break.Delete [[<address> | <addressrange>] [/<breaktype> …]]
<breaktype>: ProgramHll (E)SpotReadWriteAlphaBetaCharlyDelta (BF)Echo (BF)DataDEFaultALLAllNotHll
Format: Break.DeleteHll [<range> | <module> | <function>]
Break.DeleteHll \mcc ; module 'mcc' will execute in real-time
Break.DeleteHll int_func ; interrupt function 'int_func' in real-time
General Commands Reference Guide B 34 ©1989-2018 Lauterbach GmbH

Break.direct Stop program execution or set temporary breakpoints
Break.direct stops the program execution, if no address parameter is specified
If address parameters are provided, Break.direct sets so-called temporary breakpoints at the specified addresses. A temporary breakpoint is valid until the program stops the next time. Once the program stops, all temporary breakpoints are deleted by the debugger. One application is to set temporary breakpoints on multiple alternative execution paths, if it is not known which one will be taken.
Format: Break.direct [<address> …[/<breaktype> …]]
<breaktype>: Program | ReadWrite | Read | Write
Onchip | HARD | SOFT
ProgramPass | ProgramFail
MemoryReadWrite | MemoryRead | MemoryWriteRegisterReadWrite | RegisterRead | RegisterWriteVarReadWrite | VarRead | VarWriteDATA[.Byte | .Word | .Long] <value> …
Alpha | Beta | Charly | Delta | Echo
WATCH | BusTrigger | BusCountTraceEnable | TraceData | TraceON | TraceOFF | TraceTrigger
SpotDISable | DISableHIT | NoMark | EXcludeTASK <magic_number> | <task_id> | <task_name>COUNT <value>CONDition <expression> [/AfterStep]VarCONDition <hll_expression> [/AfterStep]CMD <command_string>RESUME
DIALOG | DIALOGANVANCED
Program | Hll | Spot | Read | Write (E)Alpha | Beta | Charly (E)Data (E)DEFault (E)ALLAllNotHll (E)
<breaktype> For a description of the breakpoint types and breakpoint options, see Break.Set.
General Commands Reference Guide B 35 ©1989-2018 Lauterbach GmbH

See also
■ Break ■ Break.Asm ■ Break.BackGround ■ Break.Delete ■ Break.DeleteFAST ■ Break.DeleteHll ■ Break.DISable ■ Break.ENable ■ Break.HALT ■ Break.Hll ■ Break.IMPLementation ■ Break.Init ■ Break.List ■ Break.ListFAST ■ Break.Mix ■ Break.MONitor ■ Break.Pass ■ Break.RESet ■ Break.Set ■ Break.SetFAST ■ Break.SetFunc ■ Break.SetHll ■ Break.SetLine ■ Break.SetMONitor ■ Break.SetSec ■ Break.SetTask ■ Go.direct ■ Var.Break.direct
NOTE: The Break.direct command can be abbreviated to break or even b. Do not be mislead to believe that break was an abbreviation for the command Break.Set.
Also note the convention used in TRACE32 manuals to spell commands with all mandatory letters capitalized.
GoBreak
; start program execution; stop program execution
Break 0x1000
Go
; set a temporary Program breakpoint at; address 0x1000; start the program execution
Break main /Program ; set a temporary breakpoint of the type; Program to the entry of the function; main
Break \main\100 ; set a temporary breakpoint to line 100; of module "main"
Break func1 func9
Go
Go func1 func9
; set temporary breakpoints to the entries; of the functions func1 and func9; start the program execution
; or identical
Var.Break ast /Read ; set a temporary Read breakpoint to ; the variable ast
General Commands Reference Guide B 36 ©1989-2018 Lauterbach GmbH
Debugger / FIRE only
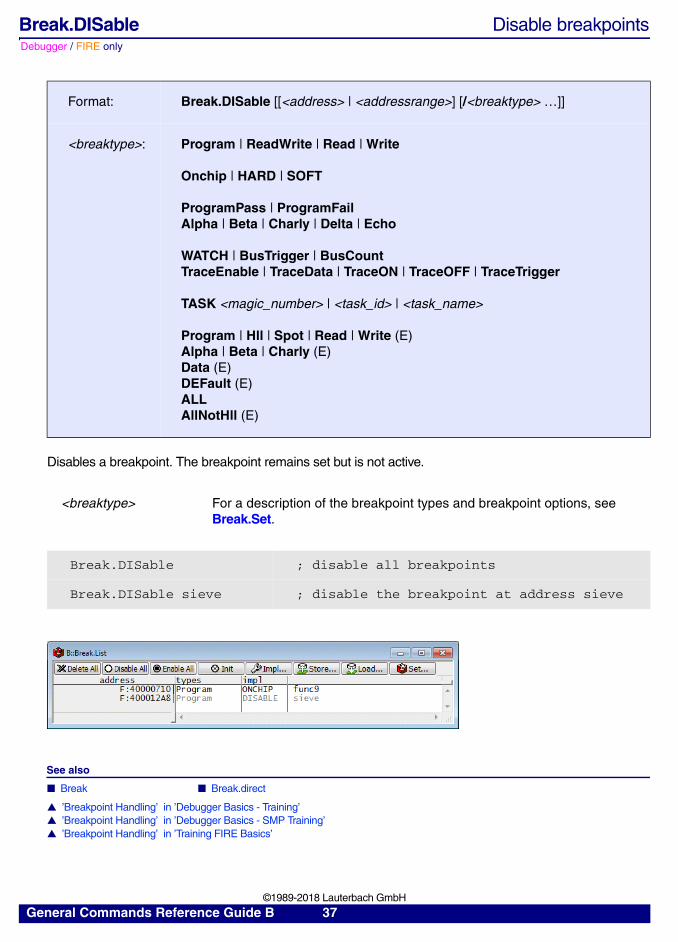
Break.DISable Disable breakpoints
Disables a breakpoint. The breakpoint remains set but is not active.
See also
■ Break ■ Break.direct
▲ ’Breakpoint Handling’ in ’Debugger Basics - Training’▲ ’Breakpoint Handling’ in ’Debugger Basics - SMP Training’▲ ’Breakpoint Handling’ in ’Training FIRE Basics’
Format: Break.DISable [[<address> | <addressrange>] [/<breaktype> …]]
<breaktype>: Program | ReadWrite | Read | Write
Onchip | HARD | SOFT
ProgramPass | ProgramFailAlpha | Beta | Charly | Delta | Echo
WATCH | BusTrigger | BusCountTraceEnable | TraceData | TraceON | TraceOFF | TraceTrigger
TASK <magic_number> | <task_id> | <task_name>
Program | Hll | Spot | Read | Write (E)Alpha | Beta | Charly (E)Data (E)DEFault (E)ALLAllNotHll (E)
<breaktype> For a description of the breakpoint types and breakpoint options, see Break.Set.
Break.DISable ; disable all breakpoints
Break.DISable sieve ; disable the breakpoint at address sieve
General Commands Reference Guide B 37 ©1989-2018 Lauterbach GmbH

Break.ENable Enable breakpoints
Enables a breakpoint. The breakpoint becomes active again.
See also
■ Break ■ Break.direct
▲ ’Breakpoint Handling’ in ’Debugger Basics - Training’▲ ’Breakpoint Handling’ in ’Debugger Basics - SMP Training’▲ ’Breakpoint Handling’ in ’Training FIRE Basics’
Format: Break.ENable [[<address> | <addressrange>] [/<breaktype> …]]
<breaktype>: Program | ReadWrite | Read | Write
Onchip | HARD | SOFT
ProgramPass | ProgramFailAlpha | Beta | Charly | Delta | Echo
WATCH | BusTrigger | BusCountTraceEnable | TraceData | TraceON | TraceOFF | TraceTrigger
TASK <magic_number> | <task_id> | <task_name>
Program | Hll | Spot | Read | Write (E)Alpha | Beta | Charly (E)Data (E)DEFault (E)ALLAllNotHll (E)
<breaktype> For a description of the breakpoint types and breakpoint options, see Break.Set.
Break.DISable sieve ; disable the breakpoint at address sieve
Break.ENable sieve ; enable the breakpoint at address sieve
General Commands Reference Guide B 38 ©1989-2018 Lauterbach GmbH

ICE only
Break.HALT Program break in hold
If the emulation CPU is in hold state (not executing bus cycles), emulation cannot be interrupted since a break can only occur during command execution. The Break.HALT command forces an NMI interrupt to leave the hold state. On some processors this command cannot stop the emulation, but only calls the NMI function. In this case a program breakpoint must be set at the beginning of the NMI function, or after the STOP/HALT command.
See also
■ Break ■ Break.direct
Format: Break.HALT
E::Break nmiinterruptE::Break.HALT
; stop on entry to NMI routine; leave the hold state
General Commands Reference Guide B 39 ©1989-2018 Lauterbach GmbH

Break.Hll Stop program/set temporary breakpoint and switch to HLL mode
Stops the program execution or sets a temporary breakpoint and switches the debug mode to Hll.
See also
■ Break ■ Break.direct
▲ ’Real-time Emulation’ in ’ICE User’s Guide’
Format: Break.Hll [<address> …[/<breaktype> …]]
<breaktype>: Program | ReadWrite | Read | Write
Onchip | HARD | SOFT
ProgramPass | ProgramFail
MemoryReadWrite | MemoryRead | MemoryWriteRegisterReadWrite | RegisterRead | RegisterWriteVarReadWrite | VarRead | VarWriteDATA[.Byte | .Word | .Long] <value> …
Alpha | Beta | Charly | Delta | Echo
WATCH | BusTrigger | BusCountTraceEnable | TraceData | TraceON | TraceOFF | TraceTrigger
SpotDISable | DISableHIT | NoMark | EXcludeTASK <magic_number> | <task_id> | <task_name>COUNT <value>CONDition <expression> [/AfterStep]VarCONDition <hll_expression> [/AfterStep]CMD <command_string>RESUME
DIALOG | DIALOGADVANCED
Hll (E) DEFault (E)ALL (E)AllNotHll (E)
<breaktype> For a description of the breakpoint types and breakpoint options, see Break.Set.
General Commands Reference Guide B 40 ©1989-2018 Lauterbach GmbH

Break.IMPLementation Breakpoint implementation
Defines the default implementation of breakpoints. Without parameters the command opens a dialog window for the selection.
Format: Break.IMPLementation [<breaktype> <impl>]
Break.IMPLementation BACKGROUND [ON | OFF] (E)Break.IMPLementation FOREGROUND [ON | OFF] (E)Break.SELect (deprecated)
<impl>: AUTOOnchipSOFTHARDOFF (E)
AUTO Leave it to the debugger to use the appropriate breakpoint implementation.
SOFT Advise TRACE32 to implement this breakpoint type as SOFTware breakpoint.
Onchip Advise TRACE32 to implement this breakpoint type as Onchip breakpoint.
General Commands Reference Guide B 41 ©1989-2018 Lauterbach GmbH

Break.IMPLementation BACKGROUND (ICE only)
If no parameters are specified the default ON is assumed. By means of the ON or OFF options background program break can be set.
The following example uses a background program to serve interrupts while the emulation is stopped. The interrupt program may not be stopped while serving the interrupt, otherwise the target peripherals are left in an invalid state. Break Enable Background is turned off for this reason. As the 'C' breakpoint is taken asynchronously, it should be placed between NOPs to ensure that the interrupt is not taken while the background program is stopping.
The target background program contains only a loop:
The emulator setup is as follows:
ON A background program break may take place anywhere within the program. This is the default.
OFF A background program break can only take place at points defined by means of the Charly breakpoint. This breakpoint is taken asynchronously, i.e. after the location has been fetched by the processor.
background:
bg_spot:
disable_interruptsnopnopnopnopnopnopnopnopnopenable_interruptsjump background
;'C' breakpoint set here
Register.Set pc background /Task Background
Register.Set sp 0x10000 /Task Background Break.Set bg_spot /CharlyBreak.IMPLementation BACKGROUND OFF
Go.BackGround …
; Set program counter of; background register set; set stack pointer ; set stop point for; background
; start background task
General Commands Reference Guide B 42 ©1989-2018 Lauterbach GmbH

Break.IMPLementation FOREGROUND (ICE only)
This function enables the unqualified spot function for real-time emulation. Every time the debug interface needs control of the emulation CPU (dump, register access) the emulation is interrupted for a short time.
Break.IMPLementation Program OFF (ICE only)
Disables the Program breakpoints. Can be used to disable the breakpoint without deleting them. Read and Write breakpoints are not affected. See Go.NoBreak for similar function.
Break.IMPLementation Program SOFT (ICE only)
Enables Software breakpoints. Software breakpoints replace the opcode in the used program by another instruction.
Hardware breakpoints of TRACE32-ICE use special hardware instead of modifying the user program. The advantage of hardware breakpoints is the ability to work in EPROMs and to set an unlimited number of breakpoints. The disadvantage is the frequency limit, as hardware breakpoints require emulation breakpoint memory. To overcome the speed limit it is possible to use software breakpoints instead of hardware ones. The default breakpoint type must be changed also in this case. Software breakpoints are not implemented for all processors on TRACE32 ICE.
See also
■ Break ■ Break.direct
Break.IMPLementation FOREGROUND ONData.Set port1 0x34 Data.In port2 Break.IMPLementation FOREGROUND OFF
; Break enable on; Output to port; Read port 2; Break enable off
Go
Break.IMPLementation Program OFFGoBreakBreak.IMPLementation Program HARD
; run with program ; breakpoints enabled; program breakpoints off; run with breakpoints disabled; break immediately; allow breakpoints again
Break.IMPLementation Program SOFTSETUP.BREAKDEF Program
; select software breakpoints; default breakpoints ; are 'Program'
General Commands Reference Guide B 43 ©1989-2018 Lauterbach GmbH

Break.Init Initialize breakpoints
Break.Init deletes all temporary breakpoints, sets all permanent breakpoint again and resets the breakpoint counters.
See also
■ Break ■ Break.direct
▲ ’Breakpoint Memory’ in ’ICE User’s Guide’▲ ’Release Information’ in ’Release History’
Break.List Display list of breakpoints
Displays a list of all breakpoints.
The following options are mainly used for diagnosis:
See also
■ Break ■ Break.direct
▲ ’Breakpoint Memory’ in ’ICE User’s Guide’▲ ’Release Information’ in ’Release History’▲ ’Breakpoint Handling’ in ’Debugger Basics - Training’▲ ’Breakpoint Handling’ in ’Debugger Basics - SMP Training’
Format: Break.Init
Format: Break.List [/<option>]
<option>: Onchip | Physical | HARD
Onchip Display details on the Onchip breakpoints (for diagnostic purposes).
Physical Summarizes the details about all breakpoints (for diagnostic purposes).
HARD Display details on the HARDware breakpoints (for diagnostic purposes).
General Commands Reference Guide B 44 ©1989-2018 Lauterbach GmbH

▲ ’Breakpoint Handling’ in ’Training FIRE Basics’▲ ’Breakpoints’ in ’Training ICE Basics’
ICE only
Break.ListFAST Delete fast breakpoints
Lists FAST breakpoints (some ICE emulators only)
See also
■ Break ■ Break.direct
Format: Break.ListFAST [[<address> | <addressrange>]
General Commands Reference Guide B 45 ©1989-2018 Lauterbach GmbH

Break.Mix Stop program/set temporary breakpoint and switch to MIX mode
Stops program execution or sets a temporary breakpoint and switches the debug mode to Mix.
See also
■ Break ■ Break.direct
Format: Break.Mix [<address> …[/<breaktype> …]]
<breaktype>: Program | ReadWrite | Read | Write
Onchip | HARD | SOFT
ProgramPass | ProgramFail
MemoryReadWrite | MemoryRead | MemoryWriteRegisterReadWrite | RegisterRead | RegisterWriteVarReadWrite | VarRead | VarWriteDATA[.Byte | .Word | .Long] <value> …
Alpha | Beta | Charly | Delta | Echo
WATCH | BusTrigger | BusCountTraceEnable | TraceData | TraceON | TraceOFF | TraceTrigger
SpotDISable | DISableHIT | NoMark | EXcludeTASK <magic_number> | <task_id> | <task_name>COUNT <value>CONDition <expression> [/AfterStep]VarCONDition <hll_expression> [/AfterStep]CMD <command_string>RESUME
DIALOG | DIALOGADVANCED
Hll (E) DEFault (E)ALL (E)AllNotHll (E)
<breaktype> For a description of the breakpoint types and breakpoint options, see Break.Set.
General Commands Reference Guide B 46 ©1989-2018 Lauterbach GmbH

Debugger / FIRE only
Break.MONitor Switch back to stop mode debugging
Stop the program execution and switch back to stop mode debugging if this is possible within the debug environment.
A debugger works by default in so-called Stop Mode Debugging: The core(s) and thus the whole system are stopped at a breakpoint. All debugging features are handled by TRACE32 by accessing via JTAG to the onchip debug logic.
Stop Mode Debugging has many advantages, but however has a serious disadvantage: As soon as the processor stops, interrupts are no longer served and all communication interfaces are stopped. The usual result of this is that external devices that communicate with the target application via Ethernet, Bluetooth or CAN will cut the connection as the application is no longer responding. Therefore, stopping at a breakpoint can change the state of the overall system. Trying to continue debugging may then be meaningless.
Run Mode Debugging does not have this disadvantage. Here all debugging features are handled by TRACE32 by communicating with a debug monitor running on the core under debug.
The main debug monitors that are supported by TRACE32 are Real Monitor from ARM and GDB.
The command Go.MONitor is used to switch to run mode debugging. Break.MONitor is used to switch back to stop mode debugging.
See also
■ Break ■ Break.direct ■ Break.SetMONitor ■ Go.MONitor
Format: Break.MONitor
General Commands Reference Guide B 47 ©1989-2018 Lauterbach GmbH

Break.Pass Define pass condition for breakpoint
When the program execution is stopped by a breakpoint, and the boolean expression is true, the program execution is automatically restarted. The feature can be cleared by entering the command without arguments.
The following commands shows how a condition can be directly assigned to a single breakpoint.
See also
■ Break ■ Break.direct
▲ ’Real-time Emulation’ in ’ICE User’s Guide’
Break.RESet Delete all breakpoints and reset the TRACE32 break system
Deletes all breakpoints and resets the TRACE32 break system.
See also
■ Break ■ Break.direct
Format: Break.Pass [<boolean_expression>]
Break.Pass Register(a7)>0x1000
Break.Set 0x100Break.Set sieve+34Go…Break.Pass
; automatically restart the program; execution at a breakpoint hit, if ; the register A7 is larger than ; 0x1000; set a breakpoint; set a second breakpoint; start the program execution
; remove the pass condition
Break.Set sieve+34 /Program /CONDition Register(r9)==0
Go
Break.Delete sieve+34
Format: Break.RESet
General Commands Reference Guide B 48 ©1989-2018 Lauterbach GmbH

Break.Set Set breakpoints[Breakpoint Types] [Breakpoint Options]
The Break.Set command sets a breakpoint. Without parameters, the command opens a dialog window for setting breakpoints.
Format: Break.Set [<address>|<range>] [/<breaktype> …]] [/<impl>]
<impl>: HARD (BF)SOFT (BF)Onchip (BF)
<breaktype>: Program | ReadWrite | Read | Write
Onchip | HARD | SOFT
ProgramPass | ProgramFail
MemoryReadWrite | MemoryRead | MemoryWriteRegisterReadWrite | RegisterRead | RegisterWriteVarReadWrite | VarRead | VarWriteDATA[.Byte | .Word | .Long] <value> …
Alpha | Beta | Charly | Delta | Echo
WATCH | BusTrigger | BusCountTraceEnable | TraceData | TraceON | TraceOFF | TraceTrigger
SpotDISable | DISableHIT | NoMark | EXcludeTASK <magic_number> | <task_id> | <task_name>COUNT <value>CONDition <expression> [/AfterStep]VarCONDition <hll_expression> [/AfterStep]CMD <command_string>RESUMEDIALOG | DIALOGADVANCED
Program | Hll | Spot | Read | Write (E)Alpha | Beta | Charly (E)Data (E)DEFault (E)ALLAllNotHll (E)
General Commands Reference Guide B 49 ©1989-2018 Lauterbach GmbH

A detailed introduction into the breakpoint usage can be found in:
• “Debugger Basics - Training” (training_debugger.pdf).
• “Debugger Basics - SMP Training” (training_debugger_smp.pdf).
TRACE32-ICD and TRACE32-FIRE
The following breakpoint implementations are available:
NOTE: Do not erroneously abbreviate the command Break.Set <address> as Break <address>
The command Break.Set <address> sets a permanent breakpoint, whereas the command Break <address> sets a breakpoint that is automatically deleted when the program execution is stopped the next time (temporary breakpoint).
HARD The resources for the breakpoints are provided by the TRACE32 development tool.
SOFT The code at the breakpoint location is patched with a break instruction. A software breakpoint usually requires RAM at the breakpoint location.If you want to set software breakpoints to instructions in FLASH refer to command FLASH.Auto.
Onchip The resources for the breakpoints are provided by the chip.
General Commands Reference Guide B 50 ©1989-2018 Lauterbach GmbH

On-chip Breakpoints
The list on page 4 gives an overview of the availability and the usage of the Onchip breakpoints. The following notations are used:
• Onchip breakpoints: Total amount of available Onchip breakpoints.
• Program breakpoints: Number of Onchip breakpoints that can be used to set Program break-points into onchip FLASH or NOR FLASH.
• Read/Write breakpoints: Number of Onchip breakpoints that stop the program when a read or write to a certain address happens.
• Data value breakpoint: Number of Onchip data breakpoints that stop the program when a spe-cific data value is written to an address or when a specific data value is read from an address.
Single address
For some processor architectures Onchip breakpoints can only mark single addresses (e.g Cortex-A9).
Address ranges
Most processor architectures allow to mark address ranges with Onchip breakpoints. It is very common that one Onchip breakpoint marks the start address of the address range while the second Onchip breakpoint marks the end address (e.g. MPC57xx).
The command TrOnchip.VarCONVert allows to control how range breakpoints are set for scalars (int, float, double).
The current setting can be inspected by using the command TrOnchip.view.
TrOnchip.VarCONVert ON If a breakpoint is set to a scalar variable (int, float, double) the breakpoint is set to the start address of the variable.+ Requires only one single address breakpoint.- Program will not stop on unintentional accesses to the variable’s address space.
TrOnchip.VarCONVert OFF If a breakpoint is set to a scalar variable (int, float, double) breakpoints are set to all memory addresses that store the variable value.
+ The program execution stops also on any unintentional accesses to the variable’s address space.- Requires two onchip breakpoints since a range breakpoint is used.
General Commands Reference Guide B 51 ©1989-2018 Lauterbach GmbH
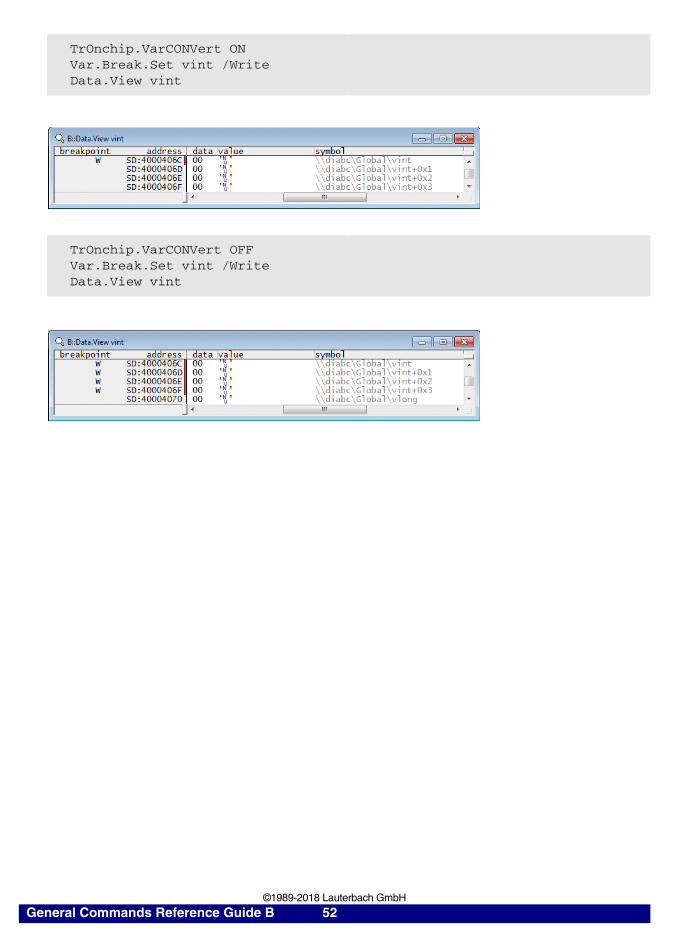
TrOnchip.VarCONVert ONVar.Break.Set vint /WriteData.View vint
TrOnchip.VarCONVert OFFVar.Break.Set vint /WriteData.View vint
General Commands Reference Guide B 52 ©1989-2018 Lauterbach GmbH

Bit masks
A number of processor architectures provide only bit masks or fixed range sizes to mark an address range with Onchip breakpoints. In this case the address range is always enlarged to the smallest bit mask/next allowed range that includes the address range.
It is recommended to control which addresses are actually marked with breakpoints by using the Break.List /Onchip command:
Breakpoint setting:
Var.Break.Set flags
Break.List
Break.List /Onchip
General Commands Reference Guide B 53 ©1989-2018 Lauterbach GmbH

RISC/CISC Processors
FamilyOnchipBreakpoints
ProgramBreakpoints
Read/WriteBreakpoint
Data ValueBreakpoints
68HC1268HC12A
up to 2 up to 2 single address
up to 2 single address
1
68HC16 — — — —
68k6833x6834x68360
——1
——1
——1
———
78K0R 1 1 single address 1 single address 1
Andes 0 … 8 up to 8 up to 8range as bit mask
up to 8
APS 3 instruction 3 single address — —
ARM11 6 instruction2 read/write
6single address
2single address
—
ARM7ARM9Janus
2 or(1 if software break-points are used)
up to 2range as bit mask
up to 2range as bit mask
2
ARP32 2 instruction2 read/write
2 range as bit mask
up to 2 range as bit mask
up to 2
AVR32 6 instruction2 read/write
6range as bit mask
2range as bit mask
2
AVR8 4 up to 4range as bit mask
up to 2range as bit mask
1
C166SV2 4 up to 4 up to 4 writeup to 1 read
up to 4 writeup to 1 read
ColdFire 4 instruction, 2 read/write
3 single address, 1 bit mask
2 single address or 2 ranges
2
Cortex-A5 3 instruction2 read/write
3single address
2range as bit mask, break before make
—
Cortex-A7Cortex-A9Cortex-A15Cortex-A17Cortex-A32Cortex-A35Cortex-A53Cortex-A57Cortex-A72Cortex-A73
6 instruction4 read/write
6single address
4range as bit mask, break before make
—
General Commands Reference Guide B 54 ©1989-2018 Lauterbach GmbH

Cortex-A8 6 instruction2 read/write
6range as bit mask
2range as bit mask, break before make
—
Cortex-M0/M0+
1-2 by DW(Data Wachtpoint unit)
1-4 by BU(Breakpoint Unit)
1-2 by DW range as bit mask
1-4 by BUsingle addr. only onchip flash only
1-2 by DWrange as bit mask
—
Cortex-M1 1/2 by DW(Data Wachtpoint unit)
2/4 by BPU(Breakpoint Unit)
1 or 2 by DWrange as bit mask
2 or 4 (BPU)single addr. onlyonchip flash only
1 or 2 by DW range as bit mask
—
Cortex-M3 4 by DWT(Data Wachtpoint and Trace unit)
6 by FPB(Flash Patch and Breakpoint unit)
4 by DWTaddr. range onlybreak-after-makerange as bit mask
6 by FPBsingle addr. onlyonchip flash onlybreak-before-make
4 by DWT range as bit mask
1needs two DWT comparators
Cortex-M4 1 or 4 by DWT(Data Wachtpoint and Trace unit)
2 or 6 by FPB(Flash Patch and Breakpoint unit)
1 or 4 by DWTaddr. range onlybreak-after-makerange as bit mask
2 or 6 by FPBsingle addr. onlyonchip flash onlybreak-before-make
1 or 4 by DWTrange as bit mask
0 or 1needs two DWT comparators
Cortex-M7 2 or 4 by DWT(Data Wachtpoint and Trace unit)
4 or 8 by FPB(Flash Patch and Breakpoint unit)
2 or 4 by DWTaddr. range onlybreak-after-makerange as bit mask
4 or 8 by FPBsingle addr. onlyonchip flash onlybreak-before-make
2 or 4 by DWTrange as bit mask
1
Cortex-R4 Cortex-R5
2-8 instruction1-8 read/write
2-8range as bit mask
1-8range as bit mask, break before make
—
FamilyOnchipBreakpoints
ProgramBreakpoints
Read/WriteBreakpoint
Data ValueBreakpoints
General Commands Reference Guide B 55 ©1989-2018 Lauterbach GmbH

Cortex-R7 6 instruction4 read/write
6single address
4range as bit mask, break before make
—
eTPU 2 up to 2 single address
up to 2 read/writerange as bitmask
2(only with write breakpoints)
GTM(only MPC)
up to 4 up to 4 up to 4 2
H8S 2 up to 2 up to 2range as bit mask
2
H8SX 4 up to 4 up to 4range as bit mask
1
M32R 4 instruction2 read/write
4 single address 2 single address or2 ranges
2
MCORE 2 2 single address or1 range as bit mask
2range as bit mask
—
MCS12MCS12C
up to 3 up to 3 single address
up to 3 single address
1
MCS8 2 up to 2 single address
up to 2 single address(reduced to 1 if com-bined with data)
1
MGT5100 1 instruction(No on-chip break-point,if software break-points are used)1 read/write
1/0 single address 1 single address —
MIPS32MIPS64
up to 15 instructionup to 15 read/write
up to 15range as bit mask
up to 15range as bit mask
up to 15
MPC500MPC800
4 instruction,2 read/write
4 single address or 2 breakpoint ranges
2 single address or 1 breakpoint range
2
MPC5200 2 instruction (reduced to 1 if soft-ware breakpoints are used)2 read/write
2/12 single address or 1 breakpoint range
22 single address or 1 breakpoint range
—
MPC55xx 4 instruction2 read/write
4 single address or 2 breakpoint ranges
2 single address or 1 breakpoint range
—
MPC563x 4 instruction2 read/write
4 single address or 2 breakpoint ranges
2 single address or 1 breakpoint range
2
FamilyOnchipBreakpoints
ProgramBreakpoints
Read/WriteBreakpoint
Data ValueBreakpoints
General Commands Reference Guide B 56 ©1989-2018 Lauterbach GmbH

MPC564xMPC567x
8 instruction2 read/write
8 single addressor4 single address and 2 breakpoint ranges
2 single address or 1 breakpoint range
2
MPC57xx(e200z0)
4 instruction2 read/write
4 single address or 2 breakpoint ranges
2 single address or 1 breakpoint range
—
MPC57xx(e200z2*, e200z4*, e200z7*)
8 instruction4 read/write
8 single addressor4 single address and 2 breakpoint ranges
4 single address or 2 breakpoint range
2
MPC74xxMPC86xx
1 instruction(No on-chip break-point,if software break-points are used)1 read/write
1/0 single address 1 single address —
MPC8240MPC8245MPC825xMPC826x(PQ2)
1 instruction(No on-chip break-point, if software breakpoints are used)
1/0 single address — —
MPC8247MPC8248MPC827xMPC8280(PQ27)
MPC83xx(PQ2 Pro)
2 instruction (reduced to 1 if soft-ware breakpoints are used)2 read/write
2/12 single address or1 breakpoint range
22 single address or 1 breakpoint range
—
MPC85xx(PQ3)
2 instruction (reduced to 1 if soft-ware breakpoints are used)2 read/write
2/12 single address or 1 breakpoint range
2 2 single address or 1 breakpoint rangebreak before make
—
MSP430 2 … 8 2 … 8ranges require 2 breakpoints
2 … 8ranges require 2 ...4 breakpoints
2 … 8
PPC401PPC403
2 instruction, 2 read/write
2 single address or 2 ranges
2 single address or 2 ranges
—
PPC405PPC44x
4 instruction, 2 read/write
4 single address or 2 address ranges
2 single address or 1 address range
2
FamilyOnchipBreakpoints
ProgramBreakpoints
Read/WriteBreakpoint
Data ValueBreakpoints
General Commands Reference Guide B 57 ©1989-2018 Lauterbach GmbH

PPC600 1 instruction(no on-chip break-point,if software break-points are used)
1/0 single address — —
PPC740PPC750
1 instruction(No on-chip break-point,if software break-points are used)1 read/write
1/0 single address 1 single address —
PWR-ficient
2 instruction, 2 read/write
2 single address or 1 breakpoint range
2 single address or 1 breakpoint range
—
QORIQ 2 instruction, 2 read/write
2 single addr.,or 1 large range,or 2 ranges up to 4 kB, or 1 single address and 1 range up to 4 kB
2 single addr.,or 1 large range,or 2 ranges up to 4 kB, or 1 single address and 1 range up to 4 kB
—
RH850 12 12range as bit mask
12range as bit mask
12
RX 8 instruction4 read/write
8 range as bit mask
41 breakpoint rangeothers range as bit mask
4
S12XS12Z
4 up to 4 single address or 2 address ranges
up to 4 single address or 2 address ranges
1
SH2AST4A
10 up to 10 up to 10range as bit mask
2
SH3 2 up to 2 up to 2range as bit mask
—
SH4ST40
6 up to 6 up to 6range as bit mask
2
SH7047SH7144/45
1 up to 1 up to 1 —
SH7058 12 up to 12 up to 12range as bit mask
up to 12
STM8 2 0 up to 2 up to 2
Super10 up to 8 up to 8 up to 8 8
TriCore(AUDO-MAX, AURIX)
up to 8 up to 8 single address orup to 4 ranges
up to 8 single address orup to 4 ranges
—
FamilyOnchipBreakpoints
ProgramBreakpoints
Read/WriteBreakpoint
Data ValueBreakpoints
General Commands Reference Guide B 58 ©1989-2018 Lauterbach GmbH

TriCore(up to AUDO-FG)
up to 4 instructionup to 4 read/write
up to 4 single address orup to 2 ranges
up to 4 single address orup to 2 ranges
—
V850E1 2
4 or 8 instruction(onchip flash only)
4 or 8 single address
2 single address or 1 range
2 single address or 1 range
2
V850E2 4
8 instruction(onchip flash only)
8 single address
4range as bit mask
4range as bit mask
4
x86/x64 4 4single address
4
Write or Read/Write
single address or ranges of 2, 4 or 8 bytes (aligned)
—
XC2000/XE16x
4 up to 4 up to 4 writeup to 1 read
up to 4 writeup to 1 read
XC800 4 up to 4up to 1 range (2 single needed)
up to 1 single address read or address rangeup to 1 single address write or address range
—
XSCALE 2 instruction/2 read/write
2 single address 2 single address or1 range as bit mask
—
FamilyOnchipBreakpoints
ProgramBreakpoints
Read/WriteBreakpoint
Data ValueBreakpoints
General Commands Reference Guide B 59 ©1989-2018 Lauterbach GmbH

DSP Processors
FamilyOnchipBreakpoints
ProgramBreakpoints
Read/WriteBreakpoints
Data ValueBreakpoints
APEX 4 4 single address — —
Blackfin 6 instruction2 read/write
6 single address or3 ranges
2 single address or1 range
—
CEVA-X 4 instruction4 read/write
4 single address 4 single address or range
2
DSP56K56k/56300/5680056100
21
21
21
—
DSP5630056800E
2 up to 2 single address
up to 1 single address
—
MMDSP 2 instruction1 read/write
2 single address 1 single address 1
OAKTeakLiteTeakLite IITeak
3 instruction1 read/write
3 single address 1 single addressorrange as bit mask
1
StarCore 12 up to 12 single address or up to 6 ranges
up to 6 single address orup to 3 ranges
1
STN8810STN8815STN8820
2 up to 2 up to 2 1
TeakLite III 2 instruction1 read/write
2 single address 2 single address or 1 range
1
TMS320C28x
2 2 single address — —
TMS320C54x
2 2 single address — —
TMS320C55x
4 up to 4 single address
up to 3 data, 1 breakpoint range and 2 bit masks
up to 3
TMS320C62x
1 1 single address — —
TMS320C64x
up to 4 up to 4 single address
— —
General Commands Reference Guide B 60 ©1989-2018 Lauterbach GmbH

Softcores
Configurable Cores
TMS320C67x
1 1 single address — —
ZSP400 — — — —
ZSP500 4 up to 4 single address
up to 1range as bit mask
1
FamilyOnchipBreakpoints
Program Breakpoints
Read/Write Breakpoint
Data ValueBreakpoints
MicroBlaze 0 … 4 instruction0 … 4 read/write
0 … 4range as bit mask
0 … 4range as bit mask
—
NIOS2 0/4/8(configurable)
up to 4 up to 4 single address or2 ranges
up to 4
FamilyOnchipBreakpoints
ProgramBreakpoints
Read/Write Breakpoint
Data ValueBreakpoints
ARC600/700
ARC-EM
0/2/4/8 up to 0/2/4/8range as bit mask
up to 0/2/4/8range as bit mask
up to 0/1/2/4only writes,only in “full’ mode
range as bit mask
ARCtangent-A4
ARCtangent-A5
0/2/4/8 up to 0/2/4/8range requires 2 breakpoints
up to 0/2/4/8write onlyrange requires 2 breakpoints
up to 0/1/2/4only writes,only in “full’ mode
range requires 2 breakpoints
BeyondBA22
up to 8 up to 8 range requires 2 breakpoints
up to 8 range requires 2 breakpoints
up to 8 range requires 2 breakpoints
FamilyOnchipBreakpoints
ProgramBreakpoints
Read/WriteBreakpoints
Data ValueBreakpoints
General Commands Reference Guide B 61 ©1989-2018 Lauterbach GmbH

Diamond Cores
2 up to 2range as bit mask
up to 2range as bit mask
2
M8051EW 0, 1, 2 or 4 up to 4 up to 4 single addresses for read or writerange requires 2 breakpointsor 2 single address read/write,max 1 read/write range
same as read/writebreakpoints
FamilyOnchipBreakpoints
ProgramBreakpoints
Read/Write Breakpoint
Data ValueBreakpoints
General Commands Reference Guide B 62 ©1989-2018 Lauterbach GmbH

Breakpoint Types
[Back to Top]
The following breakpoint types are available:
There are two flavours of breakpoints:
• Break after make
The program execution is stopped after the read/write access was performed respectively after the instruction marked with the breakpoint was executed.
• Break before make
The program execution is stopped before the instruction marked with the breakpoint was executed respectively before the read/write access was performed.
Program The program execution is stopped before the instruction marked with the breakpoint is executed (for most processor architectures).
Default implementation for a Program breakpoint is SOFT for nearly all processor architectures.
ReadWrite The program executions is stopped at a read or write access to the specified address. Default implementation for a read/write breakpoint is Onchip.
Read The program executions is stopped at a read access to the specified address.Default implementation for a read breakpoint is Onchip.
Write The program executions is stopped at a write access to the specified address. Default implementation for a write breakpoint is Onchip.
General Commands Reference Guide B 63 ©1989-2018 Lauterbach GmbH

Real-time vs. Intrusive Breakpoints
Real-time breakpoints
The usage of a breakpoint does not influence the real-time behavior of the application program.
Intrusive breakpoints
The usage of the breakpoint influences the real-time behavior. Intrusive breakpoints perform as follows:
Each stop to perform the check suspends the program execution for at least 1 ms.
The (short-time) display of a red S in the state line indicates that an intrusive breakpoint was hit.
TRACE32 implements real-time breakpoints whenever possible.
Intrusive breakpoints are marked with a special breakpoint indicator:
Perform check
Check not ok
Check ok
Program execution
Breakpoint hit
Stop
Program restart
General Commands Reference Guide B 64 ©1989-2018 Lauterbach GmbH

Breakpoint Options
[Back to Top]If an instruction is conditionally executed (e.g. BGT - Branch Greater Then, LDREQB - Load Byte if Equal), TRACE32 stops shortly to check the status flags in order to find out if the condition is satisfied.
• ProgramPass (intrusive breakpoint)
• ProgramFail (intrusive breakpoint)
Stop program execution at ProgramPassbreakpoint
Check status flag for
Condition not satisfiedContinue programexecution
Keep stop of program execution
Condition satisfied
condition
Stop program execution at ProgramFailbreakpoint
Condition satisfied Continue programexecution
Keep stop of program execution
Condition not satisfied
Check status flag for
condition
General Commands Reference Guide B 65 ©1989-2018 Lauterbach GmbH

The following options can be used, if the on-chip debug unit of your processor makes it possible to stop the program execution when a read or write access to an address is performed by a specific code section. If this feature is not supported by your processor, these options are deactivated.
Examples:
NOTE: The following options are not available for all processor architectures!
MemoryReadWrite Set a MemoryReadWrite breakpoint.
MemoryRead Set a MemoryRead breakpoint.
MemoryWrite Set a MemoryWrite breakpoint.
VarReadWrite Set a MemoryReadWrite breakpoint to a static variable.
VarRead Set a MemoryRead breakpoint to a static variable.
VarWrite Set a MemoryWrite breakpoint to a static variable.
; Stop the program execution when an instruction of the code range; 0xA100--0xA32D writes to the address 0x400Break.Set 0xA100--0xA32D /MemoryWrite 0x400
; Stop the program execution when an instruction of the function sieve; writes to the variable flagsVar.Break.Set sieve /VarWrite flags
General Commands Reference Guide B 66 ©1989-2018 Lauterbach GmbH

The following option can be used, if the on-chip debug unit of you processor makes it possible to stop the program execution when a read or write access to a core register is performed by a specific code section. If this feature is not supported by your processor, these options are deactivated.
Examples:
RegisterReadWrite Set a breakpoint which stops the cpu on a core register access.
RegisterRead Set a breakpoint which stops the cpu on a core register read.
RegisterWrite Set a breakpoint which stops the cpu on a core register write.
VarReadWrite Set a RegisterReadWrite breakpoint to a register variable.
VarRead Set a RegisterRead breakpoint to a register variable.
VarWrite Set a RegisterWrite breakpoint to a register variable.
; Stop the program execution when an instruction of the code range; 0xA100--0xA32D writes to register R1
Break.Set 0xA100--0xA32D /RegisterWrite R1
; Stop the program execution when an instruction of the function sieve; writes to the register variable i
Var.Break.Set sieve /VarWrite i
General Commands Reference Guide B 67 ©1989-2018 Lauterbach GmbH

The following options are only used together with the on-chip trigger unit of the processor. Please refer to the TrOnchip commands.
If the option Spot is selected, the program execution is only stopped shortly to update the TRACE32 screen when the breakpoint is hit. As soon as the screen is updated, the program execution continues. Each stop at a breakpoint with the option Spot takes approximately 50 … 100 ms.
Alpha Set an Alpha breakpoint.
Beta Set an Beta breakpoint.
Charly Set an Charly breakpoint.
Delta Set an Delta breakpoint.
Echo Set an Echo breakpoint.
Break.Set func1 Alpha
TrOnchip.IW0 Ibus Alpha
TrOnchip.IW0 WATCH ON
; Example for MPC500/800; Generate a pulse on the processor pin IWP0; if the function func1 is entered
; Set an Alpha breakpoint to the entry of; func1; The addresses marked with Alpha; breakpoints define the Ibus address; Generate a pulse on IWP0 when IW0 is hit
Spot Set the option Spot for a breakpoint.
Break.Set func7 /Program /Spot ; When the program breakpoint ; at the entry of function; func7 is hit update the; TRACE32 screen.
Break.Set data /Write /Spot ; Update the TRACE32 screen ; when a write access to the ; address data occurred.
Var.Break.Set flags[3] /Write /Spot ; Update the TRACE32 screen ; when a write access to the ; variable flags[3] occurred.
General Commands Reference Guide B 68 ©1989-2018 Lauterbach GmbH

The following options can be used, if they are supported by the used processor, they are deactivated otherwise.
Examples:
WATCH If the option WATCH is set, the program execution is not stopped at a breakpoint hit, the WATCH facility of the processor is activated instead. Examples for the WATCH facility are: Watchpoint Hit Messages with NEXUS; a short pulse on a watchpoint pin for the MPC5xx family etc.
BusTrigger If the option BusTrigger is set, the program execution is not stopped at a breakpoint hit, a pulse for the internal trigger bus of the TRACE32 development tool is generated instead. For information about the internal trigger bus refer to the TrBus command.
BusCount If the option BusCount is set, the program execution is not stopped at a breakpoint hit, the breakpoint hits are counted by the TRACE32 counter system instead. For more information about the TRACE32 counter system refer to the Counter command.
Break.Set sieve /Program /Watch ; Activate the WATCH facility of; your processor when the; function sieve is entered.
Break.Set sieve /Program /BusTrigger
TrBus.RESet
TrBus.Connect Out
TrBus.Mode Low
; Generate a 100 ns pulse for; the TRACE32 internal trigger; bus when the function sieve ; is entered; Configure the TRACE32 internal; trigger bus; The TRIGGER connector of the; TRACE32 development tool works; as output; A 100 ns low pulse is; generated on TRIGGER
Break.Set sieve /Program /BusCount
Count.RESetCount.Mode EventHigh
; Count the entries to the; function sieve
General Commands Reference Guide B 69 ©1989-2018 Lauterbach GmbH

The following options are available if a trace is used and trace control features are provided either by the used processor or by the TRACE32 hardware. These options are deactivated otherwise.
Examples:
TraceEnable Enable the trace on the specified event.
TraceData Sample the complete program flow and the specified data event.
TraceON Switch the sampling to the trace ON on the specified event.
TraceOFF Switch the sampling to the trace OFF on the specified event.
TraceTrigger Stop the sampling to the trace on the specified event. A trigger delay is possible.
; Sample only the function entries to func5 to the trace bufferBreak.Set func5 /Program /TraceEnable
; Sample only write accesses to the variable vint into the trace bufferVar.Break.Set vint /Write /TraceEnable
; Sample the complete program flow plus all write accesses to the ; variable vlong into the trace bufferVar.Break.Set vlong /Write /TraceData
; Start the sampling to the trace buffer, when the function func7 is ; entered and stop the sampling to the trace buffer after the variable; WriteBuffer was readBreak.Set func7 /Program /TraceONVar.Break.Set WriteBuffer /Read /TraceOFF
; Sample another 2000. records to the trace buffer after the function; func23 was enteredBreak.Set func23 /Program /TraceTriggerTrace.TDelay 2000.
General Commands Reference Guide B 70 ©1989-2018 Lauterbach GmbH

Examples:
DISable Set the specified breakpoint, but disable it.
DISableHit Disable the breakpoint after it was hit.
NoMark Don’t display a breakpoint indicator on the TRACE32 screen.
EXclude The breakpoint is inverted:• by the inverting logic of the on-chip trigger unit• by setting the specified breakpoint to the following 2 address
ranges0x0--(start_of_breakpoint_range -1)(end_of_breakpoint_range+1)--end_of_memory
The EXclude option only applies to the implementation Onchip or Hardware.If the implementation is Onchip and the Onchip trigger unit does not provide an inverting logic, the processor has to provide the facility to set the specified breakpoint type on 2 address ranges.
; Set a Write breakpoint to the address data but disable itBreak.Set data /Write /DISable
; Set a Program breakpoint to the entry of the function sieve. Disable; the breakpoint after it was hit.Break.Set sieve /Program /DISableHit
; Set a Write breakpoint to the code range 0x3F000--0x3FAFF to make sure; that no write access happens to your code range, but suppress the; display of a break indicatorBreak.Set 0x3F000--0x3FAFF /Write /NoMark
; Stop the program execution when a instruction outside of the function; sieve accesses the variable flagsVar.Break.Set sieve; /VarReadWrite flags; /EXclude
General Commands Reference Guide B 71 ©1989-2018 Lauterbach GmbH

The following options allow to stop the program execution when a specific data value is read or written.
Examples:
• Not all data widths are supported for all architectures. Quad will normally not be available for most 8-, 16- or 32-bit architectures. TByte and HByte are only available for specific DSP architectures.
• If the processor provides data value breakpoints (see “On-chip Breakpoints” in General Commands Reference Guide B, page 51 (general_ref_b.pdf)) a real-time data value breakpoint is possible.
• TRACE32 provides an intrusive data value breakpoint, if the processor does not provide data value breakpoints.
DATA.Byte <value> Define the data value for a byte access.
DATA.Word <value> Define the data value for a word access.
DATA.Long <value> Define the data value for a long access.
DATA.Quad <value> Define the data value for a quad access.
DATA.TByte <value> Define the data value for a triple-byte access.
DATA.HByte <value>
Define the data value for a hexabyte access.
DATA.auto <value> Define the data value for an HLL variable. The access width is taken from the HLL information. If there is no HLL information available, the architecture width is taken.
; Stop the program execution when 0x33 is written to the address buffer; via a byte writeBreak.Set buffer /Write /DATA.Byte 0x33
; Stop the program execution when 0xf00023aa is read from the address; long_value via a long readBreak.Set long_value /Read /DATA.Long 0xf00023aa
; Stop the program execution when 0x0 is written to the variable ; flags[3]Var.Break.Set flags[12] /Write /DATA 0x0
Break.Set word_value /Write /DATA.Word 0yxxxxxxxxxxxxxxx1
General Commands Reference Guide B 72 ©1989-2018 Lauterbach GmbH

An intrusive data value breakpoint for “break after make” processors is implemented as follows:
Specified data value?
No
Yes
Program execution
Breakpoint hit at intrusive
Stop
restart program
data value breakpoint
Debugger reads data value at read/write address
General Commands Reference Guide B 73 ©1989-2018 Lauterbach GmbH

An intrusive data value breakpoint for “break before make” processors is implemented as follows:
A intrusive data value breakpoint on a memory-mapped I/O register can result in a failing read or destructive write access.
Specified data value?
NoYes
Program execution
Breakpoint hit at intrusive
Stop
restart program
data value breakpoint
Debugger reads data value at read address
Readaccess?
Debugger simulates write access
No
Yes
General Commands Reference Guide B 74 ©1989-2018 Lauterbach GmbH

If a hex number is entered to identify the TASK, it is interpreted as magic.
If a decimal number is entered to identify the TASK, it is interpreted as task ID. If the RTOS does not assign a task ID, the decimal number is interpreted as magic instead.
Task-specific real-time breakpoints are available for:
TASK <magic_number> | <task_id> | <task_name>
The program execution is only stopped at the breakpoint when the specified task is running at the breakpoint hit.
Real-time breakpoint if the processor architecture provides a context ID register and if this register is maintained by the RTOS, intrusive breakpoint otherwise.
For information about the parameters, see “What to know about Magic Numbers, Task IDs and Task Names” (general_ref_t.pdf).
; Stop the program execution at the entry to func12 only if the task; with the magic 0x2c4 is runningBreak.Set func7 /Program /Task 0x2c4
; Stop the program execution at the entry to func9 only if the task; with the ID 14. is runningBreak.Set func7 /Program /Task 14.; if the RTOS doesn’t assign IDs, the ID is interpreted as magic
; Stop the program execution at the entry to func7 only if the task with; the name task5 is runningBreak.Set func7 /Program /Task task5
ARM7/ARM9 By chaining the 2 on-chip breakpoints.
ARM11 Via the context ID register.
Cortex-A/-R Via the context ID register.
ColdFire Via ASID (Address Space Identifier) for V4 architecture.
MMDSP8820 Via thread_ref register.
General Commands Reference Guide B 75 ©1989-2018 Lauterbach GmbH

Examples:
; example ARM7/ARM9; disable all on-chip breakpointsBreak.DISable /Onchip; set task-specific real-time breakpointBreak.Set buzzer_high /Program /Onchip /TASK smxKillTask
; example ARM11/Cortex; inform the debugger that your RTOS operates the Context ID registerTrOnchip.ContextID ONBreak.Set DPhysicalDevice::Info /Program /Onchip /TASK EKern.exe:Thread1
; example for MMDSP8820; if the RTOS operates the thread_ID registerBreak.Set buzzer_high /Program /Onchip /TASK smxTask
General Commands Reference Guide B 76 ©1989-2018 Lauterbach GmbH

If no task-specific real-time breakpoints are available, task-specific breakpoints are implemented as intrusive breakpoints.
The on-chip debug units for the following processor architectures provide on-chip counters:
COUNT <value> Stop the program execution after <value> breakpoint hits. Implementation: If the on-chip trigger unit provides a counter and the breakpoint is implemented as Onchip, this counter is used.
Otherwise the program execution is stopped shortly at each breakpoint hit, the counter is incremented and the program execution is restarted if the current counter value is smaller then <value>. The current counter value is displayed in the Break.List window.Use the Break.Init command to reset the counter.
Architecture On-chip Counters
MMDSP 1 x 16-bit counter
MPC500/800 2 x 16-bit counter for instructions2 x 16-bit counter for data
MPC5500 2 x 16-bit counter(not MPC551x)
SH2A 1 x 12-bit counter
SH4 2 x 32-bit counter
StarCore 1 x 30-bit counter
Super10 1 x 16-bit counter
Stop program execution at task-related breakpoint
Check for specified
Not specified taskContinue programexecution
Keep stop of program execution
Specified task
task
General Commands Reference Guide B 77 ©1989-2018 Lauterbach GmbH

On-chip counter allow to count the event of interest in real-time. TRACE32 uses the on-chip counters only if the implementation /Onchip is used:
If no on-chip counter is provided by the on-chip debug unit or if the implementing /SOFT is used for a Program breakpoint, an intrusive breakpoint is used to count the event of interest.
; Stop the program execution after 5 entries to func25
Break.Set func25 /Program /Onchip /COUNT 5.
; Stop the program execution after 5 entries to func25
Break.Set func25 /Program /SOFT /COUNT 5.
Stop program execution at breakpoint with counter
Check the counter
Not final valueContinue programexecution
Keep stop of program execution
Final value
value
General Commands Reference Guide B 78 ©1989-2018 Lauterbach GmbH

CONDition<expression>
The program execution is only stopped at the breakpoint if the specified condition is true. The condition has to be defined in the TRACE32 syntax (intrusive breakpoint).
VarCONDition<hll_expression>
The program execution is only stopped at the breakpoint if the specified HLL condition is true. The condition has to be defined in the syntax of your programming language (intrusive breakpoint).
AfterStep AfterStep forces TRACE32 to perform an assembler step before the specified condition is verified. This option might be useful:• If a Program breakpoint with condition is set to a register-indirect
call instruction• If a Read/Write breakpoint with condition is set and the processor
architecture under debug stops before the read/write access occurred.
General Commands Reference Guide B 79 ©1989-2018 Lauterbach GmbH

Examples:
; Stop the program execution at the instruction address 0x2228 only if; the contents of Register R7 is greater 5.Break.Set 0x2228 /Program /COND Register(R7)>5
; Stop the program execution at the register-indirect call at 0x2228 ; only if the contents of Register R7 is greater 5, perform the register-; indirect call before the condition is verifiedBreak.Set 0x2228 /Program /COND Register(R7)>5 /AfterStep
Program execution is suspended at a breakpoint with condition
NoContinue with program
Stop program execution
Yes
Conditionis
true?
Verifycondition
execution
AfterStepcheck box
Yes
Perform assembler single step
No
ON?
General Commands Reference Guide B 80 ©1989-2018 Lauterbach GmbH

; Stop the program execution at a write access to vint only if flags[12]; is equal to 0Var.Break.Set vint /Write /VarCONDition (flags[12]==0)
; Stop the program execution at a write access to vint only if flags[12]; is equal to 0 and vint is greater 10; perform an assembler single step because the processor architecture; stops before the write access occurs (break-before make breakpoint)Var.Break.Set vint /Write /VarCOND (flags[12]==0)&&(vint>10.) /AfterStep
; Stop the program execution at the instruction address 0x2228 only if; the contents of address 0x1234 has value of 0x55.Break.Set 0x2228 /Program /COND Data.Word(D:0x1234)==0x55
General Commands Reference Guide B 81 ©1989-2018 Lauterbach GmbH

CMD <string> Execute 1 or more TRACE32 commands when the breakpoint is hit.
RESUME [ON | OFF] ON: Restart the program execution after the commands are executed. Please be aware that the execution of a single TRACE32 commands takes at least 200 ms.OFF: The program execution is not resumed.
It is recommended to set RESUME to OFF, if CMD• starts a PRACTICE script with the command DO• commands are used that open processing windows like
Trace.STATistic.Func, Trace.Chart.sYmbol or CTS.Listbecause the program execution is restarted before these commands are finished.
; Save the contents to register R12 to the file outreg1.lst whenever; the breakpoint is hit.
Open #1 outreg1.lst /CreateBreak.Set sieve\17 /P /CMD "write #1 ""R12="" register(r12)" /RESUMEClose #1
DIALOG Open a standard Break.Set dialog for the breakpoint configuration.
DIALOGADVANCED Open a full Break.Set dialog for the breakpoint configuration (advanced features).
General Commands Reference Guide B 82 ©1989-2018 Lauterbach GmbH

TRACE32-ICE
See also
■ Break ■ Break.direct ■ Var.Break.Set
▲ ’Breakpoint Memory’ in ’ICE User’s Guide’▲ ’TRACE32 Support for Emulation Devices’ in ’MCDS User’s Guide’
Program Set a Program breakpoint.
Hll Set an HLL breakpoint. HLL breakpoints are set automatically when a file containing symbol and debug information is loaded.
Spot Set a Spot breakpoint. Additional control for a Spot breakpoint is available via the Spot command group.
Read Set a Read breakpoint.
Write Set a Write breakpoint.
Data Set a ReadWrite breakpoint.
Break.Set func2 /Program ; Set a Program breakpoint to the entry of; func2
Break.Set data /Write ; Set a Write breakpoint to the address data
Break.Set func2 /Spot ; Set a Spot breakpoint to the entry of func2
Break.Set data /Spot ; Set a Spot breakpoint to the address data
Alpha Set an Alpha breakpoint. An Alpha breakpoint can either be used together with the TrMain command or as an address selector for a trigger program.
Beta Set a Beta breakpoint. A Beta breakpoint can either be used together with the TrMain command or as an address selector for a trigger program.
Charly Set a Charly breakpoint. A Charly breakpoint can either be used together with the TrMain command or as an address selector for a trigger program.
DEFault Set a Program, Read and Write breakpoint.
ALL Set a Program, Read, Write, Sport, Alpha, Beta and Charly breakpoint.
AllNotHll Set a Program, Read, Write, Sport, Alpha, Beta and Charly breakpoint.
General Commands Reference Guide B 83 ©1989-2018 Lauterbach GmbH
▲ ’Release Information’ in ’Release History’▲ ’Breakpoint Handling’ in ’Debugger Basics - Training’▲ ’Breakpoint Handling’ in ’Debugger Basics - SMP Training’▲ ’Breakpoint Handling’ in ’Training FIRE Basics’▲ ’Breakpoints’ in ’Training ICE Basics’
ICE only
Break.SetFAST Set fast breakpoints
Sets FAST breakpoints (some ICE emulators only)
See also
■ Break ■ Break.direct
FIRE / ICE only
Break.SetFunc Mark HLL functions
All HLL functions are marked with breakpoints. The entry point with Alpha and the exit point with Beta. The breakpoints can then be used for statistic analysis (see Analyzer.STATistic) or for function runtime and nesting displays (see Analyzer.List).
Format: Break.SetFAST [[<address> | <addressrange>]
Format: Break.SetFunc [<range> | <module>] [/<option>]
<option>: TAGSALLRETALLBXNPreFetchSIMPLEPATCHPreFetch [<length>] [<align>]ONLYABINTR
General Commands Reference Guide B 84 ©1989-2018 Lauterbach GmbH
See also
■ Break ■ Break.direct
▲ ’Breakpoint Memory’ in ’ICE User’s Guide’▲ ’Release Information’ in ’Release History’▲ ’Statistic Functions’ in ’Training FIRE Analyzer’▲ ’Statistic Functions’ in ’Training ICE Analyzer’
TAGS Processors with cache or prefetch can cause serious problems for statistic analysis. The best workaround is to make a data access base analysis. For this purpose extra code is added at each function entry and exit. This code writes to two variable to tag the entry or exit of a function. With the option TAGS all symbols beginning with '_r_' are marked with Alpha and Beta. These symbols can be generated by Microtec compilers to support performance analysis.
ALLRET Tag any return instruction found in the function. This option is useful when the compiler produces more than one exit point for a function, but doesn't inform the debugger about it.
ALLB(only ARM)
Tag any BX instruction found in the function.
SIMPLE Tag the last instruction of a function even when the default strategy for determining the end of a function would be different.
PATCH Use debug patch information.
NPreFetch With this option the Alpha breakpoints are set to the first location of the function. For proper statistic analysis the prefetch detection software must be turned on with the command Analyzer.STATistic.PreFetch. Without this option the Alpha breakpoint is set a few bytes after the function entry to be not accessed by prefetch cycles when executing the previous function.
PreFetch The first argument defines the number of byte prefetched by the CPU. The second argument is the fetch size in bytes. Without this option the default values for the selected CPU will be used.
ONLYAB Uses only Alpha and Beta breakpoints. When the INTR option is also set then the combination of both will be used to mark interrupt functions. The option is required when the Charly is not available (e.g. when using ROM breakpoints on the C167 Bondout).
INTR Marks the beginning of the function by Alpha and Charly (or Alpha and Beta on ECC8), as required for interrupt programs.
Break.SetFunc ; marks all functions
Break.SetFunc 0x1000--0x2fff ; marks functions in address range
Break.SetFunc \mcc ; marks all functions in one module
General Commands Reference Guide B 85 ©1989-2018 Lauterbach GmbH

ICE only
Break.SetHll Set HLL breakpoints
The HLL lines are marked with HLL breakpoints. This is normally done automatically during download of a program. Partial set HLL breakpoints allow selective debugging of modules or functions. Functions without breakpoints are executed in real time, when performing an HLL step.
See also
■ Break ■ Break.direct
▲ ’Breakpoint Memory’ in ’ICE User’s Guide’
Format: Break.SetHll [<range> | <module> | <function>]
Break.SetHll ; marks all lines
Break.SetHll 0x1000--0x2fff ; marks lines in address range
Break.SetHll \mcc ; marks lines in one module
Break.SetHll main ; marks lines in function 'main'
General Commands Reference Guide B 86 ©1989-2018 Lauterbach GmbH

ICE only
Break.SetLine Mark HLL lines
The HLL lines are marked with Alpha breakpoints. The breakpoints are set short after the first instruction of the line, to prevent the access of the breakpoint by a prefetch of the CPU. The breakpoints can be used either for HLL line sampling on ECC8 or HA120 or for performance analysis on HLL line (see Analyzer.STATistic.Line). The NPreFetch option sets the Alpha breakpoints directly on the place of an HLL breakpoint without offset.
See also
■ Break ■ Break.direct
▲ ’Breakpoint Memory’ in ’ICE User’s Guide’
Break.SetMONitor Switch to run mode debugging at the next “Go”
Switches to run mode debugging at the next Go.
See also
■ Break ■ Break.direct ■ Break.MONitor ■ Go.MONitor
Format: Break.SetLine [<range> | <module> | <function>] [/<option>]
<option>: NPreFetchPreFetch [<length>] [<align>]Alpha | Beta | Charly
Break.SetLine ; marks all lines
Break.SetLine 0x1000--0x2fff ; marks lines in address range
Break.SetLine \mcc ; marks lines in one module
Break.SetLine main ; marks lines in function 'main'
Break.SetLine /NPreFetchAnalyzer.ReProgram samplealphaAnalyzer.List List.HllOnly
; mark all HLL lines with Alpha; selective trace of Alpha marked; cycles; display of source in analyzer
Format: Break.SetMONitor [ON | OFF]
General Commands Reference Guide B 87 ©1989-2018 Lauterbach GmbH

ICE only
Break.SetSec Protect program sections
The areas defined in the section table are protected against illegal access by setting breakpoints. The program code is protected against read and write, the data areas against execution etc. After executing this command the breakpoints on the stack or I/O space must be removed. This command offers the same security as an MMU does.
See also
■ Break ■ Break.direct
▲ ’Breakpoint Memory’ in ’ICE User’s Guide’
Break.SetTask Stop the program execution when task is scheduled
Sets a breakpoint to stop as soon as the task is scheduled. This function is only available, if the debugger is configured with the appropriate OS awareness.
Depending on the capabilities of the OS and the awareness, this command may set a conditional breakpoint onto the OS variable that holds the current task, or a breakpoint to stop as soon as the saved PC of this task is read. The program execution will be stopped inside the kernel scheduler. You can then step up to the calling task manually.
See also
■ Break ■ Break.direct
Format: Break.SetSec
Format: Break.SetTask <magic_number> | <task_id> | <task_name>
<magic_number>, etc.
For information about the parameters, see “What to know about Magic Numbers, Task IDs and Task Names” (general_ref_t.pdf).
Break.SetTask 7. ; set a breakpoint to the next entry of task 7
Break.SetTask "module1" ; set a breakpoint to the next entry of the; task module1
General Commands Reference Guide B 88 ©1989-2018 Lauterbach GmbH

BSDL
BSDL Boundary scan description language
The BSDL commands are used for reading boundary scan description language (IEE1149-1) files, performing boundary scan tests and program external flash memories via the boundary scan chain. For more information and step-by-step procedures, refer to “Boundary Scan User´s Guide” (boundary_scan.pdf).
For configuration, use the TRACE32 command line, a PRACTICE script (*.cmm), or the BSDL.state window.
The following TRACE32 ■ commands and ❏ functions() are available to configure the boundary scan chain.
See also
■ BSDL.BYPASSall ■ BSDL.CHECK ■ BSDL.FILE ■ BSDL.FLASH ■ BSDL.HARDRESET ■ BSDL.IDCODEall ■ BSDL.LoadDR ■ BSDL.MOVEDOWN ■ BSDL.MOVEUP ■ BSDL.ParkState ■ BSDL.RESet ■ BSDL.RUN ■ BSDL.SAMPLEall ■ BSDL.SELect ■ BSDL.SET ■ BSDL.SetAndRun ■ BSDL.SOFTRESET ■ BSDL.state ■ BSDL.SToreDR ■ BSDL.TwoStepDR ■ BSDL.UNLOAD ❏ BSDL.GetDRBit() ❏ BSDL.GetPortLevel()
▲ ’What to know about Boundary Scan’ in ’Boundary Scan User’s Guide’▲ ’FLASH Programming via Boundary Scan’ in ’eMMC FLASH Programming User’s Guide’▲ ’Boundary Scan Description Language (BSDL) Functions’ in ’General Functions’▲ ’FLASH Programming via Boundary Scan’ in ’Serial FLASH Programming User’s Guide’
General Commands Reference Guide B 89 ©1989-2018 Lauterbach GmbH
BSDL.BYPASSall Check bypass mode
Sets all chips in the boundary scan chain in BYPASS mode and shifts a 32bit random number through it. If this test fails, an error will be reported.
See also
■ BSDL ■ BSDL.state
BSDL.CHECK Enable test result checking
Enables or disables the test result checking for boundary scan. When enabled all data register bits with expect high or low are checked after a BSDL.RUN / BSDL.RUN DR command. If a test fails, an error message is printed.
See also
■ BSDL ■ BSDL.state
BSDL.FILE Load a BSDL file
Loads a BSDL file and place its entity on the current position in the boundary scan chain.
See also
■ BSDL ■ BSDL.state
Format: BSDL.BYPASSall
Format: BSDL.CHECK ON | OFF
Format: BSDL.FILE <filename>
General Commands Reference Guide B 90 ©1989-2018 Lauterbach GmbH

BSDL.FLASH Flash programming
BSDL.FLASH command group is used for programming non-volatile memories via boundary scan. The following protocols are supported:
• Common flash interface (NOR flash memory)
• I2C
• SPI
• eMMC
With the BSDL.FLASH commands the boundary scan chain is prepared for flash programming, the flash programming itself is done with either the FLASH or FLASHFILE commands.
See also
■ BSDL.FLASH.IFCheck ■ BSDL.FLASH.IFDefine ■ BSDL.FLASH.IFMap ■ BSDL.FLASH.INIT ■ BSDL ■ FLASH ■ FLASHFILE
▲ ’FLASH’ in ’General Commands Reference Guide F’▲ ’FLASHFILE’ in ’General Commands Reference Guide F’
BSDL.FLASH.IFCheck Check flash interface definition
Checks if flash definition is valid and all required flash ports are mapped to a device port. The check results are displayed in the area window.
NOR flash:
• Required ports (will cause an error, if not mapped):
OE (output enable)
WE (write enable)
A0 - An (address ports, number n of address ports is defined with BSDL.FLASH.IFDefine)
DQ0-DQm (data ports, number m of data ports is defined with BSDL.FLASH.IFDefine)
• Optional ports (will cause a warning, if not mapped):
CE (chip enable)
RB (ready/busy)
BYTE (data bus width selection)
RESET (flash hardware reset)
WP (write protection/acceleration input)
Format: BSDL.FLASH.IFCheck
General Commands Reference Guide B 91 ©1989-2018 Lauterbach GmbH

SPI flash:
• Required ports (will cause an error, if not mapped):
CE (chip enable / chip select)
SCK (serial data clock)
SI (serial data input)
SO (serial data output)
I2C flash:
• Required ports (will cause an error, if not mapped):
SDA (serial data)
SCL (serial clock)
MMC flash:
• Required ports (will cause an error, if not mapped):
CLK (Clock)
CMD (Command)
DAT0 - DATn (Data I/O)
See also
■ BSDL.FLASH
General Commands Reference Guide B 92 ©1989-2018 Lauterbach GmbH

BSDL.FLASH.IFDefine Define flash interface
Defines the flash memory configuration:
See also
■ BSDL.FLASH
Format: BSDL.FLASH.IFDefine RESet <nor_param> | <spi_param> | <i2c_param> | <mmc_param>
<nor_param>: NOR <chip_number> <addr_size> <data_size>
<spi_param>: SPI <chip_number>
<i2c_param>: I2C <chip_number>
<mmc_param>:
MMC <chip_number> <data_size>
RESet Resets the BSDL flash configuration.
NOR Selects NOR flash memory type.
SPI Selects SPI flash memory type.
I2C Selects I2C flash memory type.
MMC Selects MMC flash memory type.
<chip_number> Number of the chip in the boundary scan chain to which the flash memory is connected.
<addr_size> Number of address ports of the flash memory
<data_size> Number of data ports of the flash memory (max. 32 bit for NOR flash; 1, 4, or 8 bit for MMC flash)
BSDL.FLASH.IFDefine DELete
BSDL.FLASH.IFDefine NOR 2. 23. 16.
; deletes all BSDL flash; configurations; defines a NOR flash on chip; 2 of the boundary scan chain; with 23 address ports (A0-; A22)and 16 data ports (DQ0-; DQ15)
General Commands Reference Guide B 93 ©1989-2018 Lauterbach GmbH

BSDL.FLASH.IFMap Map flash interface{
Maps the generic flash ports to the device ports.
See also
■ BSDL.FLASH
Format: BSDL.FLASH.IFMap <flash_port> <device_port>
<flash_port> Generic flash port namesNOR flash:• CE (chip enable), OE (output enable), WE (write enable),
RB (ready busy), BYTE, RESET, WP (write protection)• CE2, OE2, WE2, RB2, BYTE2, RESET2, WP2• CE3, OE3, WE3, RB3, BYTE3, RESET3, WP3• CE4, OE4, WE4, RB4, BYTE4, RESET4, WP4• A* (address), DQ* (data input/output)SPI flash:• CE (chip enable), SCK (serial clock), SI (Master output, slave
input), SO (Master input, slave output)I2C (FLASH EEPROM): • SCL (serial clock), SDA (serial data)MMC flash:• CLK (Clock), CMD (Command), DAT0 - DAT7 (Data I/O)
<device_port> Device port name (from the corresponding BSDL file, case insensitive)
BSDL.FLASH.IFMap CE PR7C
BSDL.FLASH.IFMap DQ15 PR12A
; Maps the generic NOR flash port CE ; to the device port PR7C
; Maps the generic NOR flash port; DQ15 to the device port PR12A
General Commands Reference Guide B 94 ©1989-2018 Lauterbach GmbH

BSDL.FLASH.INIT Initialize flash interface
Initializes the boundary scan chain for flash programming. The boundary scan register of the device to which the flash memory is connected, will be initialized to the parameter value, the flash control ports will be set in the inactive state (all control ports set to ’1’, data output driver disabled, address ports set to ’0’).
The chip, which is connected to the flash memory is set to EXTEST mode, all other chips are set to BYPASS mode.
See also
■ BSDL.FLASH
BSDL.HARDRESET TAP reset via TRST
TRST port is toggled and the TAP controllers are set to the “Select-DR-SCAN” state.
See also
■ BSDL ■ BSDL.state
Format: BSDL.FLASH.INIT SAFE | SAMPLE | ZERO | ONE | NONE
SAFE The boundary scan register is initialized to the SAFE (defined in the corresponding BSDL file).
SAMPLE A SAMPLE run is executed and the sampled data are taken for initialization.
ZERO The boundary scan register is initialized to all zero.
ONE The boundary scan register is initialized to all one.
NONE The boundary scan register is not initialized, it must be initialized before with BSDL.SET, otherwise its state will be undefined.
Format: BSDL.HARDRESET
General Commands Reference Guide B 95 ©1989-2018 Lauterbach GmbH

BSDL.IDCODEall Check ID codes
Sets all chips in the boundary scan chain in IDCODE mode and checks the resulting ID codes. Chips, without an ID code register will be set in BYPASS mode. If this test fails, an error will be reported.
See also
■ BSDL ■ BSDL.state
BSDL.LoadDR Load data register from file
Loads the content of file <file_name> into data register <register_name> of IC <chip_number>.
• If the file <file_name> contains more date than data register <register_name>, the redundant data from the file <file_name> will be ignored.
• If the file <file_name> contains less data than data register <register_name> only the least significant bits of data register <register_name> will be loaded.
The BINary format is byte wise, the first byte will be the first 8 bit of the data register <register_name>.
Format: BSDL.IDCODEall
Format: BSDL.LoadDR <chip_number> <register_name> <file_name> [/<option>]
<option>: ASCIIBINary
<chip_number> Number of IC in the boundary scan chain, if the boundary scan chain has only one IC, this parameter can be omitted.
<register_name> Data register name (must be defined in BSDL file).
<file_name> File with register data
ASCII File format is ASCII.
BINary File format is binary (default).
General Commands Reference Guide B 96 ©1989-2018 Lauterbach GmbH

The ASCII format is 1 bit per line. Line comments starts with “//”:
See also
■ BSDL ■ BSDL.SToreDR
BSDL.MOVEDOWN Move selected chip downwards
Moves the selected chip down by one position (i.e. increase chip number by one).
Chip is either selected by the command BSDL.SELect or in the BSDL.state window.
See also
■ BSDL ■ BSDL.state
BSDL.MOVEUP Move selected chip upwards
Moves the selected chip up by one position (i.e. decrease chip number by one).
Chip is either selected by the command BSDL.SELect or in the BSDL.state window.
See also
■ BSDL ■ BSDL.state
// IC001 = CPU_TEST// DR = USER_DATA[56]10000100 // 211
Format: BSDL.MOVEDOWN
Format: BSDL.MOVEUP
General Commands Reference Guide B 97 ©1989-2018 Lauterbach GmbH

BSDL.ParkState Select JTAG parking state
Selects the parking state for the JTAG state machine. The parking state is the state where the JTAG state machine will stop after a BSDL.HARDRESET, BSDL.SOFTRESET or a BSDL.RUN command. The default parking state after a BSDL.RESet is Run-Test/Idle.
See also
■ BSDL
BSDL.RESet Reset boundary scan configuration
Deletes the boundary scan configuration and set all boundary scan options to their default values
See also
■ BSDL
Format: BSDL.ParkState Run-Test/Idle | Select-DR-Scan
Run-Test/Idle Selects Run-Test/Idle as parking state for the JTAG state machine
Select-DR-Scan Selects Select-DR-Scan as parking state for the JTAG state machine
If the parking states of the debug and the boundary scan functions are different, unintended side effects may occur. See “Configure Boundary Scan Engine” (boundary_scan.pdf) for details.
Format: BSDL.RESet
General Commands Reference Guide B 98 ©1989-2018 Lauterbach GmbH

BSDL.RUN Run JTAG sequence
The BSDL.RUN command will apply (i.e. shift out) the instruction and data register settings to the boundary scan chain. Without any option, the instruction register settings are applied first and the data register settings are applied second.
See also
■ BSDL ■ BSDL.state
BSDL.SAMPLEall Sample all signals
Sets all chips in the boundary scan chain in SAMPLE mode and runs a sample test. The results can be viewed in the result window (see BSDL.SET).
See also
■ BSDL ■ BSDL.state
Format: BSDL.RUN [IR | DR]
IR With the option IR only the instruction register settings are applied,
DR With the option DR only the data register settings are applied.
When a DR shift is executed, the result data can be viewed in the settings/result window (opens with BSDL.SET <chip_number> or double click on the corresponding entry in the BSDL.state entity list).
Format: BSDL.SAMPLEall
General Commands Reference Guide B 99 ©1989-2018 Lauterbach GmbH

BSDL.SELect Select a chip
Selects <chip_number> for the commands BSDL.MOVEUP, BSDL.MOVEDOWN, and BSDL.FILE.
• BSDL.MOVEUP, BSDL.MOVEDOWN: The selected chip is moved.
• BSDL.FILE: The loaded entity is placed after the selected chip
See also
■ BSDL ■ BSDL.state
BSDL.SET Set chip parameters
The command BSDL.SET modifies the instruction and data register settings for a chip in the boundary scan chain. The settings are applied to the system with BSDL.RUN command.
If the boundary scan chain has only chip, the <chip_number> can be omitted.
Format: BSDL.SELect [<chip_number>]
Format: BSDL.SET [<chip_number>] [<set_selection>]
<set_selection>:
<ir_conf> | <dr_conf> | <bsr_conf> | <port_conf> | <pinmap_conf> | <options>
<ir_conf>: IR <instr_name> | <opcode>
<dr_conf>: DR <bit_slice> ZERO | ONE | ExpectH | ExpectL | ExpectX | <opcode>
<bsr_conf>: BSR <bit_slice> ZERO | ONE | SAFE | SAMPLE | DISable | ENable | Drive0 | Drive1 | ExpectH | ExpectL | ExpectX | <opcode>
<port_conf>: PORT <port_name> 1 | 0 | Z | H | L | X
<pinmap_conf>:
PINMAP <pinmap_name>
<options>: OPTION IN | OUT | BIDI | OBSERVE | INTERN | ALL | SPOTLIGHT | MARKLINES | BSRHISTORY ON | OFF
General Commands Reference Guide B 100 ©1989-2018 Lauterbach GmbH

With <chip_number> as the only parameter BSDL.SET will open the settings/result window for <chip_number>.
Depending on the selected instruction, the data area of the settings/result window shows the results of the last DR scan operation. The instruction and the view options for the chip can be modified.
The information from the BSDL file can be viewed by toggling the data area to the “File info” view. It shows the provided instructions, compliance pattern, boundary scan register, TAP parameters, etc.
BSDL.SET 4. ; opens the settings/result window for chip 4
General Commands Reference Guide B 101 ©1989-2018 Lauterbach GmbH

Instruction register settings
IR Selects the instruction register for the BSDL.SET command.
<instr_name> Instruction names of the selected chip: SAMPLE/PRELOAD, BYPASS, EXTESTDepending on the chip more instructions may be available.
<opcode> One or more 64 bit integer values, only n(=instruction register size) bits are used other bits will be ignored.
General Commands Reference Guide B 102 ©1989-2018 Lauterbach GmbH

Data register settings
Boundary scan register settings
BSDL.SET 4. IR SAMPLE
BSDL.SET 4. IR 0x023
; sets chip 4 in SAMPLE mode
; sets the instruction register of chip 4 to; 0x023 (bits > instruction size will be; ignored
DR Selects the data register for the BSDL.SET command. The currently selected instruction determines the data register size, the upper index of the bit slice will be cut, if it exceed the data register size
<bit_slice> Bit slice can be:i--k: the bits from i to k will be modifiedi : bit i will be modified* : all bits will be modified
ZERO The selected bit slice will be set to zero.
ONE The selected bit slice will be set to one.
ExpectH The selected bit slice will be set to “expect high” (for read register)
ExpectL The selected bit slice will be set to “expect low” (for read register)
ExpectX The selected bit slice will be set to “ignore” (for read register)
<opcode> One or more 64 bit integer values, only n (=bit slice size) bits are used other bits will be ignored.
BSDL.SET 4. DR 3.--16. ONE
BSDL.SET 4. DR 0 ZERO
BSDL.SET 1. DR * 0x1234
; sets the bits 3..16 of chip 4 to one
; sets the bit 0 of chip 4 to zero
; sets data register of chip 1 to 0x1234; all bits > 15 will be set to zero
BSR Selects the boundary scan register for the BSDL.SET command.Register size is equal to the boundary scan register size, the upper index of the bit slice will cut, if it exceed the register size
<bit_slice> Bit slice can be:i--k : the bits from i to k will be modifiedi : bit i will be modified* : all bits will be modified
General Commands Reference Guide B 103 ©1989-2018 Lauterbach GmbH

The settings for the boundary scan register are only meaningful in PRELOAD, EXTEST or INTEST mode.
Port settings
ZERO The selected bit slice will be set to zero.
ONE The selected bit slice will be set to one.
SAFE The selected bit slice will be set to the SAFE state (according the BSDL file).
SAMPLE The selected bit slice will be set to previously sampled data.
DISable All ports in the selected bit slice will be disabled (if a control cell is defined)
ENable All ports in the selected bit slice will be enabled (if a control cell is defined)
Drive0 All ports in the selected bit slice will drive ’0’, if the port is an output or bidi. Output drivers will be enabled, if required.
Drive1 All ports in the selected bit slice will drive ’1’, if the port is an output or bidi. Output drivers will be enabled, if required.
ExpectH The selected bit slice will be set to “expect high” (for read register)
ExpectL The selected bit slice will be set to “expect low” (for read register)
ExpectX The selected bit slice will be set to “ignore” (for read register)
<opcode> One or more 64 bit integer values, only n (=bit slice size) bits are used other bits will be ignored.
BSDL.SET 4. BSR * SAMPLE
BSDL.SET 1. BSR * SAFE
BSDL.SET 1. BSR 2--7 Drive0
; initializes the boundary scan register; of chip 4 with a previous sample run; initializes the boundary scan register; of chip 1 to SAFE values; drive 0 to the ports which are control-; led by the register bits 2..7 of chip 1
PORT Selects the port settings for the BSDL.SET command. The boundary scan register is modified for this port (drive/expect value, enable/disable output)
<port_name> Name of the port, which should be modified. The port name must be listed in the definition of the boundary register in the BSDL file.
1 The selected port is set to drive 1 (only for output/bidir ports).
General Commands Reference Guide B 104 ©1989-2018 Lauterbach GmbH

Pin map settings
This command can be used, if no default pin map is defined in the BSDL file or if it has multiple pin maps. It has only an effect on the data output shown in the BSDL.SET window (boundary register view, fileinfo view).
0 The selected port is set to drive 0 (only for output/bidir ports).
Z The selected port is set to drive ’Z’ (only for output/bidir ports).
H The selected port is set to expect high (only for input/bidir ports).
L The selected port is set to expect low (only for input/bidir ports).
X The selected port is set to ignore result (only for input/bidir ports).
BSDL.SET 4. PORT PL7A 1BSDL.SET 3. PORT PS1 H
; set port PL7A of IC4 to “drive 1”; set port PS1 of IC3 to “expect high”
PINMAP Selects the pin map settings for the BSDL.SET command.
<pinmap_name> Name of the pin map, which should be selected. It must be a valid pin map from the BSDL file.
BSDL.SET 3. PINMAP TQFP_48 ; select pin map TQFP_48 for IC3
General Commands Reference Guide B 105 ©1989-2018 Lauterbach GmbH

Option settings
The options can be turned on or off.
See also
■ BSDL ■ BSDL.state
BSDL.SetAndRun Immediate data register takeover
Enables or disables the set and run feature. If enabled, a modification of a data register bit or bitslice will cause an immediate BSDL.RUN, i.e. the modified settings are applied immediately to the boundary scan register chain.
See also
■ BSDL ■ BSDL.state
OPTION Selects the options menu for the command BSDL.SET.
IN Show/hide inputs in result window.
OUT Show/hide outputs in result window.
BIDI Show/hide bidi ports in result window.
OBSERVE Show/hide observer cells in result window.
INTERN Show/hide internal cells in result window.
ALL Show/hide all cells in result window.
SPOTLIGHT Enable/disable the spotlight function in result window (Sample mode).
MARKLINES Enable/disable alternating line colors in result window.
BSRHISTORY Enable/disable graphical history view for boundary scan register in result window (Sample mode).
BSDL.SET 4. OPTION IN ON
BSDL.SET 4. OPTION INTERN OFF
; show inputs in the settings/result; window for chip 4; hide internal registers in the; settings/result window for chip 4
Format: BSDL.SetAndRun ON | OFF
General Commands Reference Guide B 106 ©1989-2018 Lauterbach GmbH

BSDL.SOFTRESET TAP reset via TMS
A TMS reset (5 TCK cycles with TMS=’1’) are executed and the TAP controllers are set to the “Select-DR-SCAN” state.
See also
■ BSDL ■ BSDL.state
Format: BSDL.SOFTRESET
General Commands Reference Guide B 107 ©1989-2018 Lauterbach GmbH
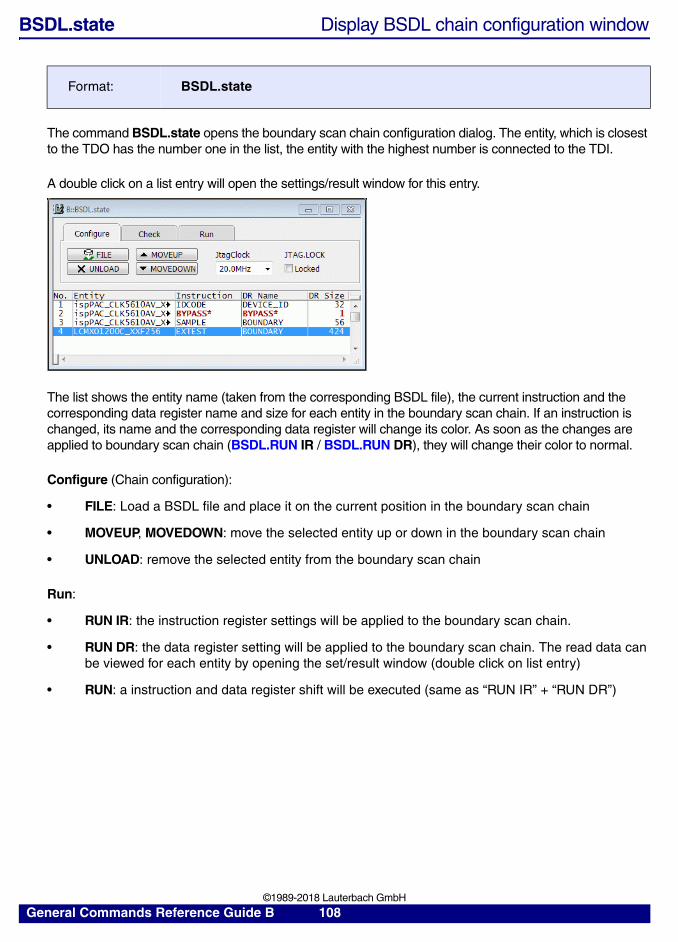
BSDL.state Display BSDL chain configuration window
The command BSDL.state opens the boundary scan chain configuration dialog. The entity, which is closest to the TDO has the number one in the list, the entity with the highest number is connected to the TDI.
A double click on a list entry will open the settings/result window for this entry.
The list shows the entity name (taken from the corresponding BSDL file), the current instruction and the corresponding data register name and size for each entity in the boundary scan chain. If an instruction is changed, its name and the corresponding data register will change its color. As soon as the changes are applied to boundary scan chain (BSDL.RUN IR / BSDL.RUN DR), they will change their color to normal.
Configure (Chain configuration):
• FILE: Load a BSDL file and place it on the current position in the boundary scan chain
• MOVEUP, MOVEDOWN: move the selected entity up or down in the boundary scan chain
• UNLOAD: remove the selected entity from the boundary scan chain
Run:
• RUN IR: the instruction register settings will be applied to the boundary scan chain.
• RUN DR: the data register setting will be applied to the boundary scan chain. The read data can be viewed for each entity by opening the set/result window (double click on list entry)
• RUN: a instruction and data register shift will be executed (same as “RUN IR” + “RUN DR”)
Format: BSDL.state
General Commands Reference Guide B 108 ©1989-2018 Lauterbach GmbH

Checks:
• BYPASSall: BYPASS mode for all entities will be set and tested, the result is shown right to this button
• IDCODEall: IDCODE mode is set for all entities (if defined in the BSDL file) and tested, the result is shown right to this button
• SAMPLEall: SAMPLE mode for all entities will be set and tested, the results for each entity can be viewed in the set/result window (double click on list entry)
See also
■ BSDL ■ BSDL.BYPASSall ■ BSDL.CHECK ■ BSDL.FILE ■ BSDL.HARDRESET ■ BSDL.IDCODEall ■ BSDL.MOVEDOWN ■ BSDL.MOVEUP ■ BSDL.RUN ■ BSDL.SAMPLEall ■ BSDL.SELect ■ BSDL.SET ■ BSDL.SetAndRun ■ BSDL.SOFTRESET ■ BSDL.TwoStepDR ■ BSDL.UNLOAD ❏ BSDL.GetDRBit() ❏ BSDL.GetPortLevel()
▲ ’Boundary Scan Description Language (BSDL) Functions’ in ’General Functions’
BSDL.SToreDR Store data register to file
Stores the data register <register_name> to file <file_name>.
See also
■ BSDL ■ BSDL.LoadDR
Format: BSDL.SToreDR <chip_number> <register_name> <file_name> [/<option>]
<option>: ASCIIBINary
<chip_number> Number of IC in the boundary scan chain, if the boundary scan chain has only one IC, this parameter can be omitted.
<register_name> Data register name (must be defined in BSDL file).
<file_name> File for register data
ASCII File format is ASCII.
BINary (default) File format is binary.
General Commands Reference Guide B 109 ©1989-2018 Lauterbach GmbH

BSDL.TwoStepDR Single/double data register shift
Enables or disables double data register shift execution. When enabled, each BSDL.RUN DR command will execute 2 data register shifts (BSDL.RUN will execute 1 instruction register shift and 2 data register shifts).
This option is useful in interactive connection test, when 1 device acts as a signal driver and another as a signal receiver.
See also
■ BSDL ■ BSDL.state
BSDL.UNLOAD Unload a chip from chain
Removes one or all chips from the boundary scan chain configuration.
See also
■ BSDL ■ BSDL.state
Format: BSDL.TwoStepDR ON | OFF
ON With TwoStepDR enabled, the modified data register of the driver is shifted twice and the effect on the receiver could be observed immediately.
OFF Without TwoStepDR mode, the modified data register of the driver would be shifted in and the data register from the previous cycle would be shifted out. To see the modified signal from the driver on the receiver, a second BSDL.RUN DR is required.
Format: BSDL.UNLOAD <chip_number> | ALL
<chip_number> The <chip_number> is removed from the configuration.
ALL All chips are removed from the configuration.
General Commands Reference Guide B 110 ©1989-2018 Lauterbach GmbH

BTrace
BTrace Script-controlled trace sink
BTrace.state Display BTrace configuration window
Displays the BTrace.state window, where you can configure the BTrace.
Format: BTrace.state
General Commands Reference Guide B 111 ©1989-2018 Lauterbach GmbH