Embed Size (px)
Citation preview
Training Simulator and Demo Software
TRACE32 Online Help
TRACE32 Directory
TRACE32 Index
TRACE32 Training ............................................................................................................................
Training Simulator and Demo Software ...................................................................................... 1
About the Demo .......................................................................................................................... 2
Starting the TRACE32 Simulator .............................................................................................. 2
User Interface - TRACE32 PowerView ...................................................................................... 3
Program Listing and Program Counter 3
TRACE32 Commands 4
TRACE32 Command Line and Softkeys 4
Single Stepping 5
Window Captions - What makes them special in TRACE32 6
Memory ........................................................................................................................................ 7
Displaying Memory 7
Modifying Memory 8
Debugging the Program 9
Displaying the Nesting of Functions 12
Breakpoints ................................................................................................................................. 13
Setting Software Breakpoints 13
Listing all Breakpoints 14
Setting a Program Breakpoint to Any Code Line within a Function 15
Setting a Spot Breakpoint 16
Adding a Watch on a Variable 17
Removing Breakpoints 17
HLL Variables ............................................................................................................................. 18
Displaying HLL Variables 18
Displaying HLL Variables of the Current Program Context 19
Using the Symbol Browser 19
Formatting HLL Variables 20
Modifying Variables 21
Mini Quiz - Check Your Learning Progress ............................................................................. 21
Training Simulator and Demo Software 1 ©1989-2018 Lauterbach GmbH
Training Simulator and Demo Software
Version 22-Mar-2018
About the Demo
What is this? This is a guided tour through TRACE32 - a tutorial. We use a simple program example in C to illustrate the most important debug features, and give lots of helpful tips & tricks for everyday use.How long does this tutorial take? 0.5 to 1 hrs.
How can I learn most from this tutorial? Work completely through all chapters in sequence and then do the quiz at the end.Where can I download the TRACE32 Simulator for the hands-on debug session? From:http://www.lauterbach.com/download.html. You do not need any hardware for this tutorial.
Starting the TRACE32 Simulator
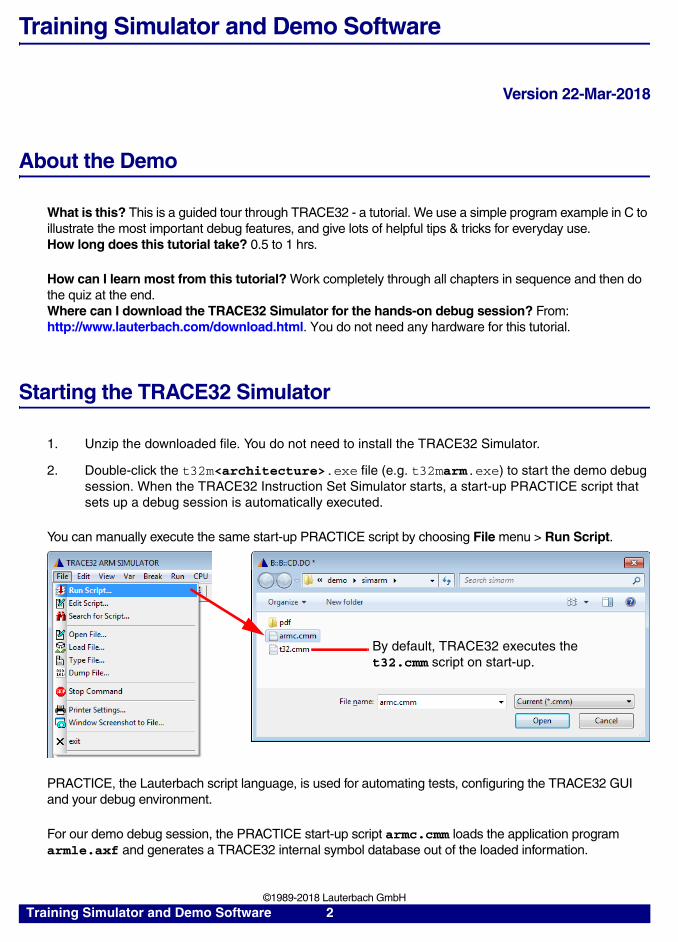
1. Unzip the downloaded file. You do not need to install the TRACE32 Simulator.
2. Double-click the t32m<architecture>.exe file (e.g. t32marm.exe) to start the demo debug session. When the TRACE32 Instruction Set Simulator starts, a start-up PRACTICE script that sets up a debug session is automatically executed.
You can manually execute the same start-up PRACTICE script by choosing File menu > Run Script.
PRACTICE, the Lauterbach script language, is used for automating tests, configuring the TRACE32 GUI and your debug environment.
For our demo debug session, the PRACTICE start-up script armc.cmm loads the application program armle.axf and generates a TRACE32 internal symbol database out of the loaded information.
By default, TRACE32 executes the t32.cmm script on start-up.
Training Simulator and Demo Software 2 ©1989-2018 Lauterbach GmbH
User Interface - TRACE32 PowerView
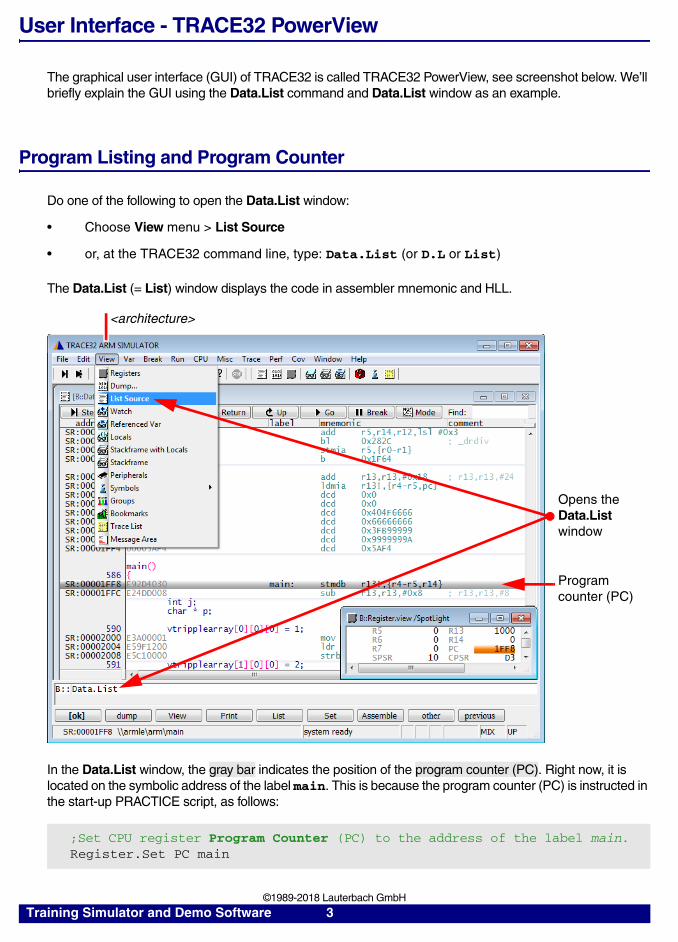
The graphical user interface (GUI) of TRACE32 is called TRACE32 PowerView, see screenshot below. We’ll briefly explain the GUI using the Data.List command and Data.List window as an example.
Program Listing and Program Counter
Do one of the following to open the Data.List window:
• Choose View menu > List Source
• or, at the TRACE32 command line, type: Data.List (or D.L or List)
The Data.List (= List) window displays the code in assembler mnemonic and HLL.
In the Data.List window, the gray bar indicates the position of the program counter (PC). Right now, it is located on the symbolic address of the label main. This is because the program counter (PC) is instructed in the start-up PRACTICE script, as follows:
;Set CPU register Program Counter (PC) to the address of the label main.Register.Set PC main
Opens the Data.List window
Program counter (PC)
<architecture>
Training Simulator and Demo Software 3 ©1989-2018 Lauterbach GmbH
TRACE32 Commands
You can execute commands in TRACE32 PowerView via the usual suspects:
1. Menus on the menu bar
2. Buttons on the main toolbar and the buttons on the toolbars of TRACE32 windows
3. Context menus in TRACE32 windows
Additionally in TRACE32, you can execute commands via the TRACE32 command line and the softkeys below the command line.
TRACE32 Command Line and Softkeys
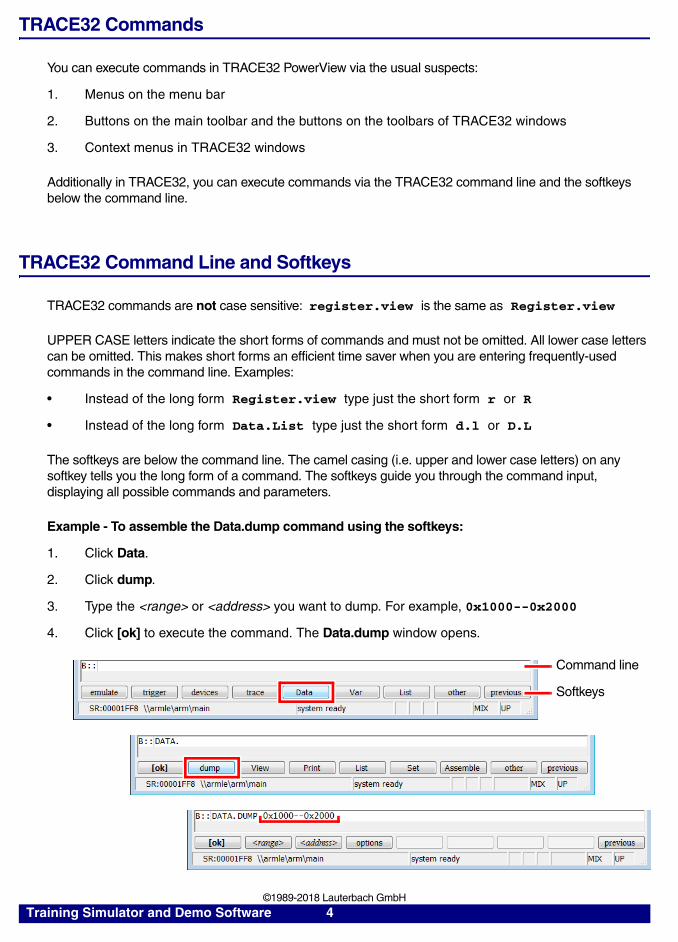
TRACE32 commands are not case sensitive: register.view is the same as Register.view
UPPER CASE letters indicate the short forms of commands and must not be omitted. All lower case letters can be omitted. This makes short forms an efficient time saver when you are entering frequently-used commands in the command line. Examples:
• Instead of the long form Register.view type just the short form r or R
• Instead of the long form Data.List type just the short form d.l or D.L
The softkeys are below the command line. The camel casing (i.e. upper and lower case letters) on any softkey tells you the long form of a command. The softkeys guide you through the command input, displaying all possible commands and parameters.
Example - To assemble the Data.dump command using the softkeys:
1. Click Data.
2. Click dump.
3. Type the <range> or <address> you want to dump. For example, 0x1000--0x2000
4. Click [ok] to execute the command. The Data.dump window opens.
Softkeys
Command line
Training Simulator and Demo Software 4 ©1989-2018 Lauterbach GmbH
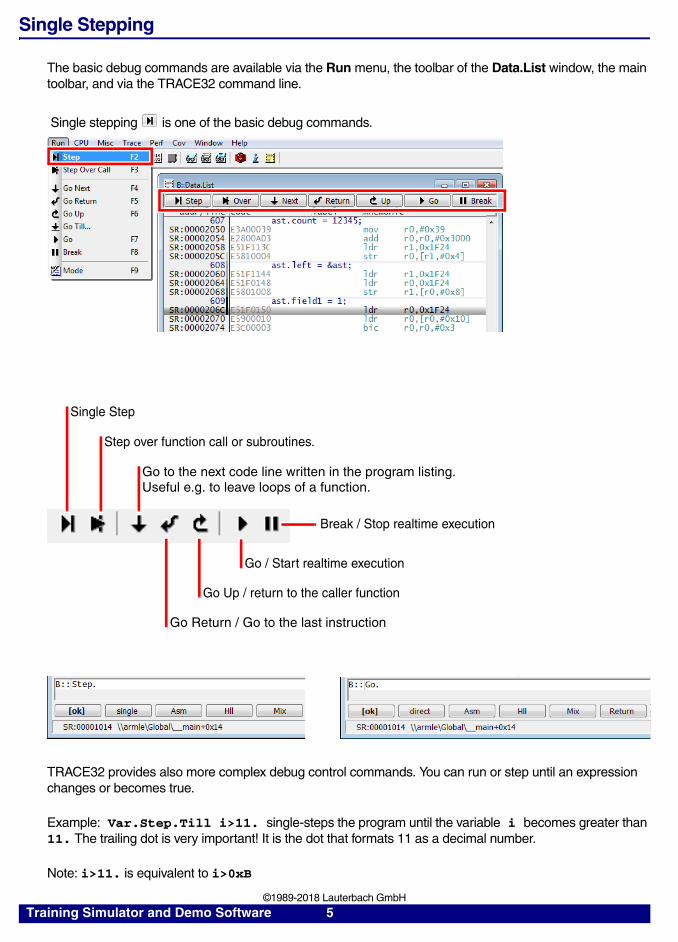
Single Stepping
The basic debug commands are available via the Run menu, the toolbar of the Data.List window, the main toolbar, and via the TRACE32 command line.
Single stepping is one of the basic debug commands.
TRACE32 provides also more complex debug control commands. You can run or step until an expression changes or becomes true.
Example: Var.Step.Till i>11. single-steps the program until the variable i becomes greater than 11. The trailing dot is very important! It is the dot that formats 11 as a decimal number.
Note: i>11. is equivalent to i>0xB
Step over function call or subroutines.
Go to the next code line written in the program listing.
Go Return / Go to the last instruction
Useful e.g. to leave loops of a function.
Single Step
Break / Stop realtime execution
Go / Start realtime execution
Go Up / return to the caller function
Training Simulator and Demo Software 5 ©1989-2018 Lauterbach GmbH
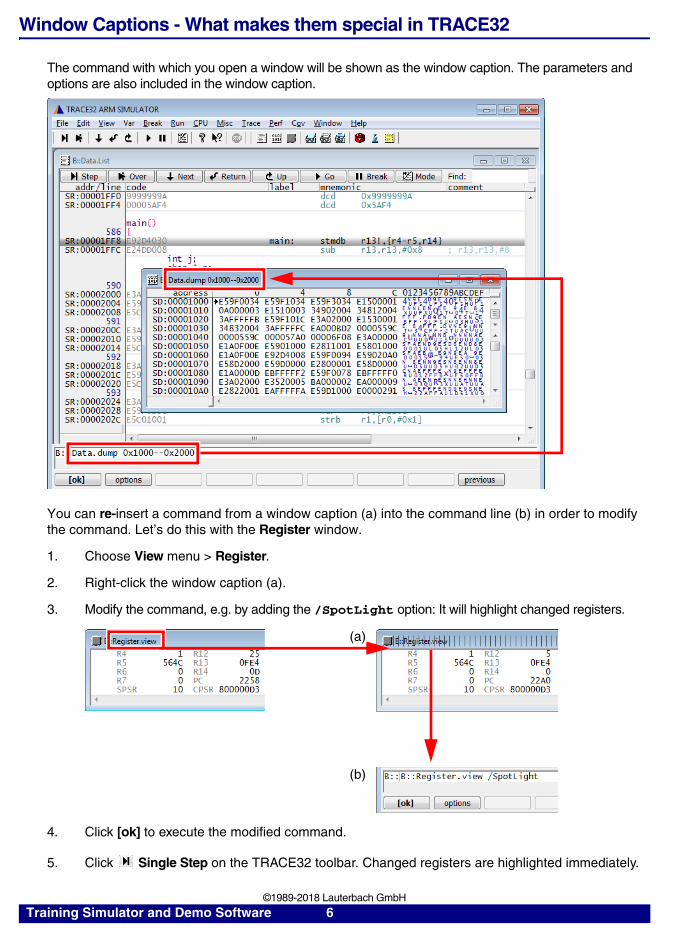
Window Captions - What makes them special in TRACE32
The command with which you open a window will be shown as the window caption. The parameters and options are also included in the window caption.
You can re-insert a command from a window caption (a) into the command line (b) in order to modify the command. Let’s do this with the Register window.
1. Choose View menu > Register.
2. Right-click the window caption (a).
3. Modify the command, e.g. by adding the /SpotLight option: It will highlight changed registers.
4. Click [ok] to execute the modified command.
5. Click Single Step on the TRACE32 toolbar. Changed registers are highlighted immediately.
(a)
(b)
Training Simulator and Demo Software 6 ©1989-2018 Lauterbach GmbH
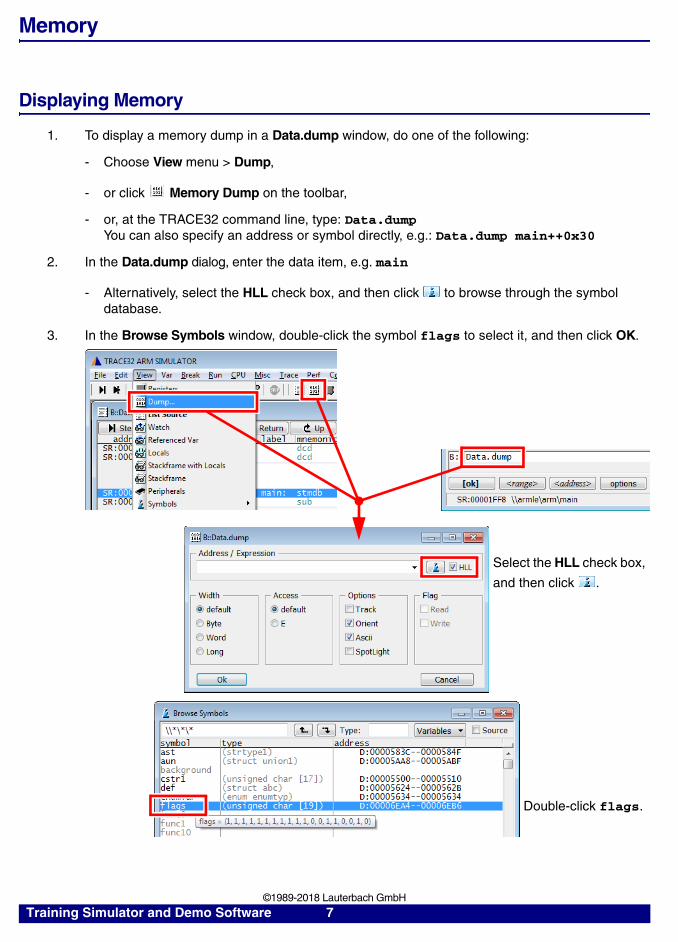
Memory
Displaying Memory
1. To display a memory dump in a Data.dump window, do one of the following:
- Choose View menu > Dump,
- or click Memory Dump on the toolbar,
- or, at the TRACE32 command line, type: Data.dumpYou can also specify an address or symbol directly, e.g.: Data.dump main++0x30
2. In the Data.dump dialog, enter the data item, e.g. main
- Alternatively, select the HLL check box, and then click to browse through the symbol database.
3. In the Browse Symbols window, double-click the symbol flags to select it, and then click OK.
Select the HLL check box,
and then click .
Double-click flags.
Training Simulator and Demo Software 7 ©1989-2018 Lauterbach GmbH
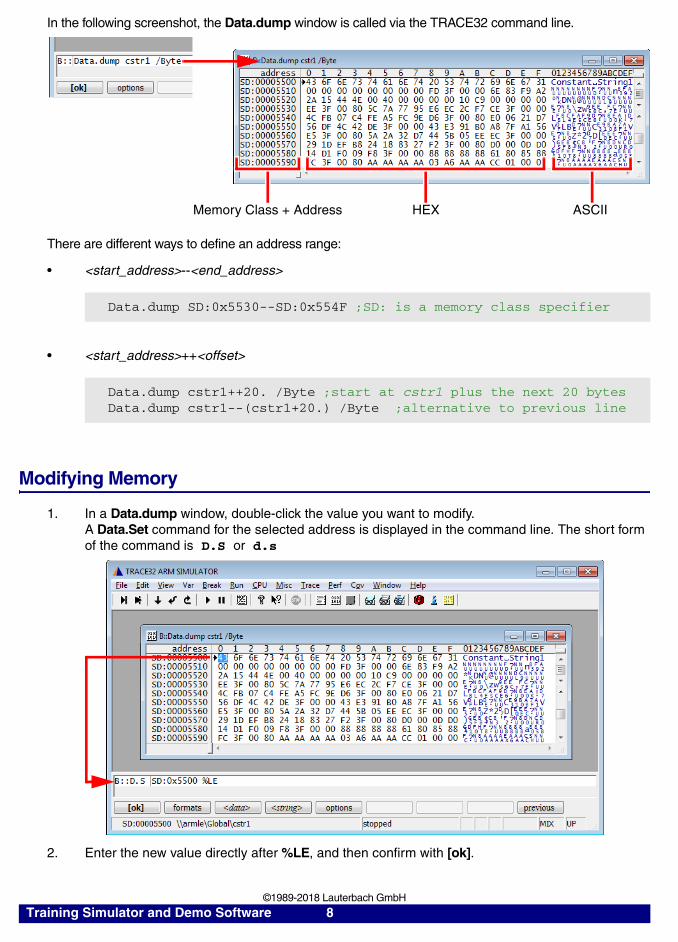
In the following screenshot, the Data.dump window is called via the TRACE32 command line.
There are different ways to define an address range:
• <start_address>--<end_address>
• <start_address>++<offset>
Modifying Memory
1. In a Data.dump window, double-click the value you want to modify. A Data.Set command for the selected address is displayed in the command line. The short form of the command is D.S or d.s
2. Enter the new value directly after %LE, and then confirm with [ok].
Data.dump SD:0x5530--SD:0x554F ;SD: is a memory class specifier
Data.dump cstr1++20. /Byte ;start at cstr1 plus the next 20 bytesData.dump cstr1--(cstr1+20.) /Byte ;alternative to previous line
Memory Class + Address HEX ASCII
Training Simulator and Demo Software 8 ©1989-2018 Lauterbach GmbH
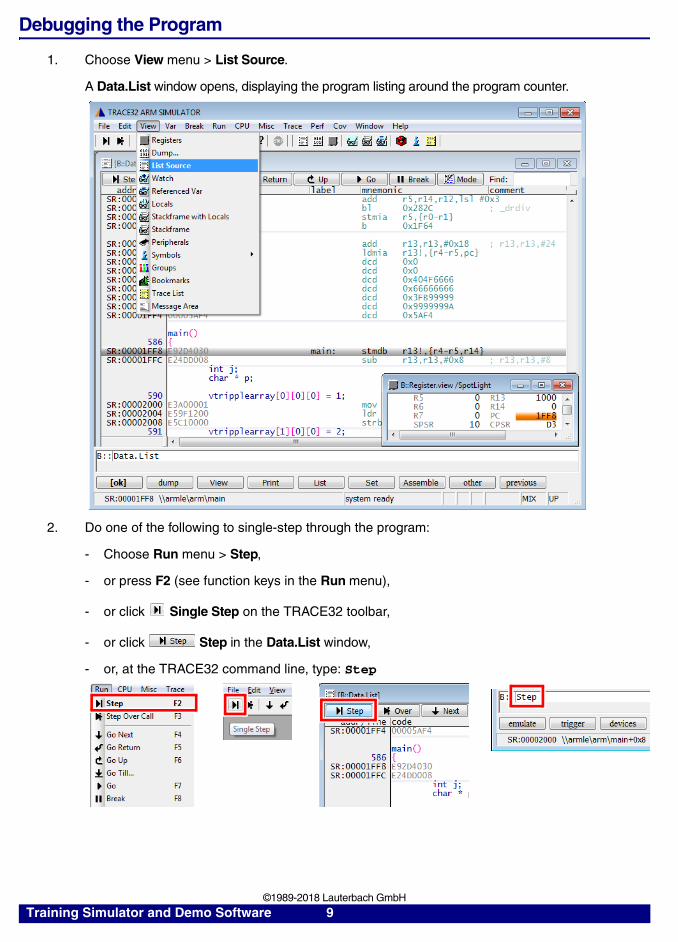
Debugging the Program
1. Choose View menu > List Source.
A Data.List window opens, displaying the program listing around the program counter.
2. Do one of the following to single-step through the program:
- Choose Run menu > Step,
- or press F2 (see function keys in the Run menu),
- or click Single Step on the TRACE32 toolbar,
- or click Step in the Data.List window,
- or, at the TRACE32 command line, type: Step
Training Simulator and Demo Software 9 ©1989-2018 Lauterbach GmbH
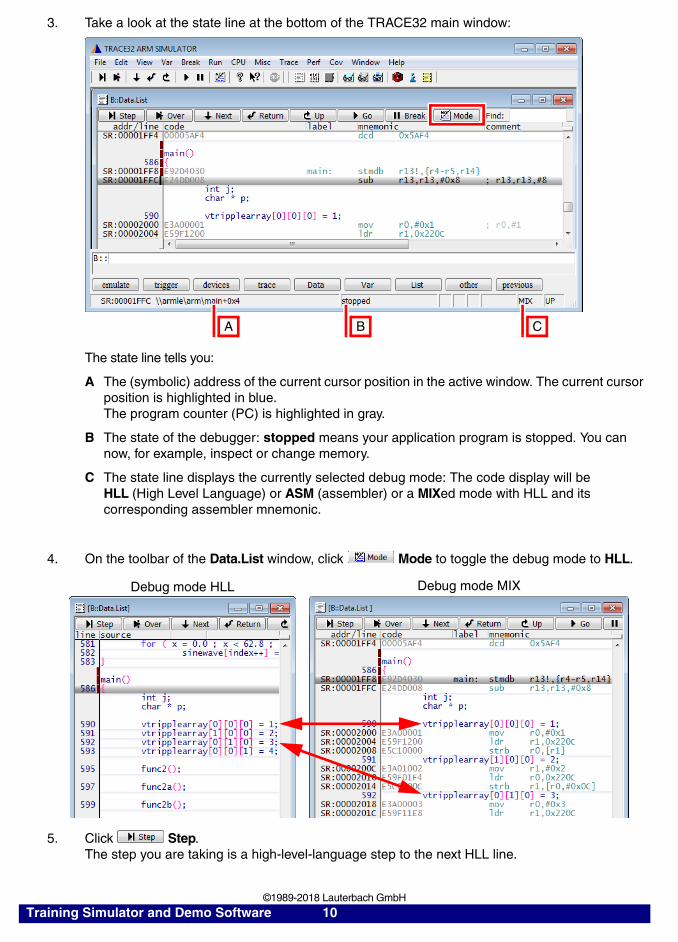
3. Take a look at the state line at the bottom of the TRACE32 main window:
4. On the toolbar of the Data.List window, click Mode to toggle the debug mode to HLL.
5. Click Step. The step you are taking is a high-level-language step to the next HLL line.
The state line tells you:
A The (symbolic) address of the current cursor position in the active window. The current cursor position is highlighted in blue.The program counter (PC) is highlighted in gray.
B The state of the debugger: stopped means your application program is stopped. You can now, for example, inspect or change memory.
C The state line displays the currently selected debug mode: The code display will be HLL (High Level Language) or ASM (assembler) or a MIXed mode with HLL and its corresponding assembler mnemonic.
A B C
Debug mode HLL Debug mode MIX
Training Simulator and Demo Software 10 ©1989-2018 Lauterbach GmbH
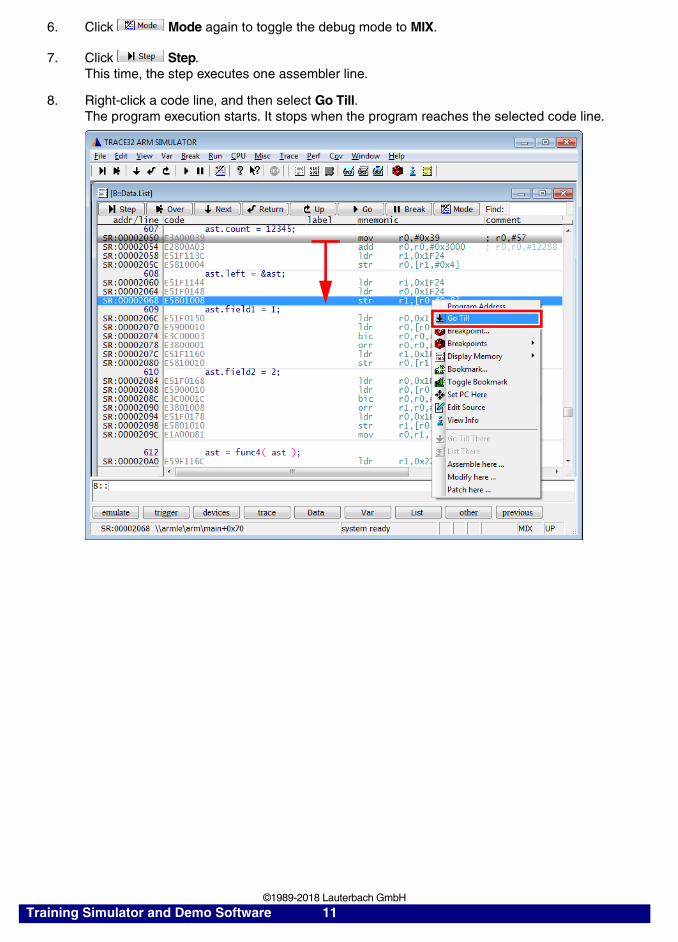
6. Click Mode again to toggle the debug mode to MIX.
7. Click Step. This time, the step executes one assembler line.
8. Right-click a code line, and then select Go Till. The program execution starts. It stops when the program reaches the selected code line.
Training Simulator and Demo Software 11 ©1989-2018 Lauterbach GmbH
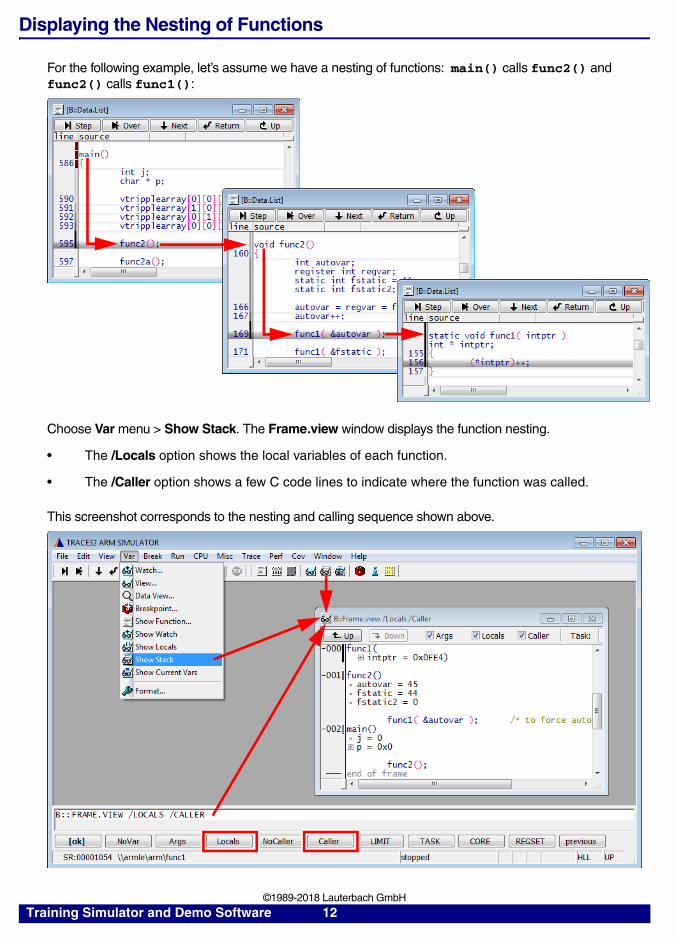
Displaying the Nesting of Functions
For the following example, let’s assume we have a nesting of functions: main() calls func2() and func2() calls func1():
Choose Var menu > Show Stack. The Frame.view window displays the function nesting.
• The /Locals option shows the local variables of each function.
• The /Caller option shows a few C code lines to indicate where the function was called.
This screenshot corresponds to the nesting and calling sequence shown above.
Training Simulator and Demo Software 12 ©1989-2018 Lauterbach GmbH
Breakpoints
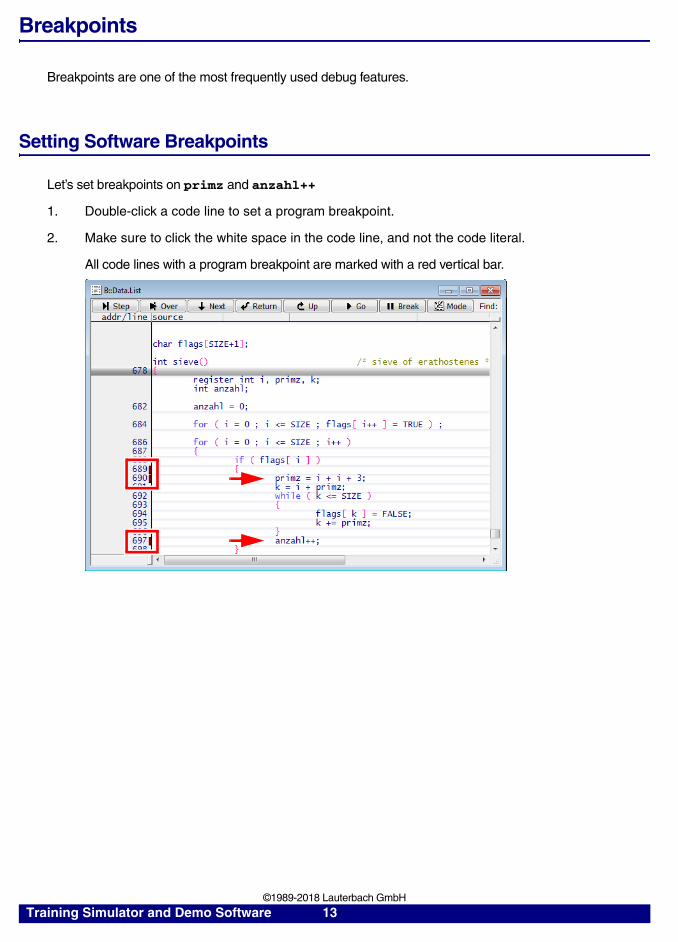
Breakpoints are one of the most frequently used debug features.
Setting Software Breakpoints
Let’s set breakpoints on primz and anzahl++
1. Double-click a code line to set a program breakpoint.
2. Make sure to click the white space in the code line, and not the code literal.
All code lines with a program breakpoint are marked with a red vertical bar.
Training Simulator and Demo Software 13 ©1989-2018 Lauterbach GmbH
Listing all Breakpoints
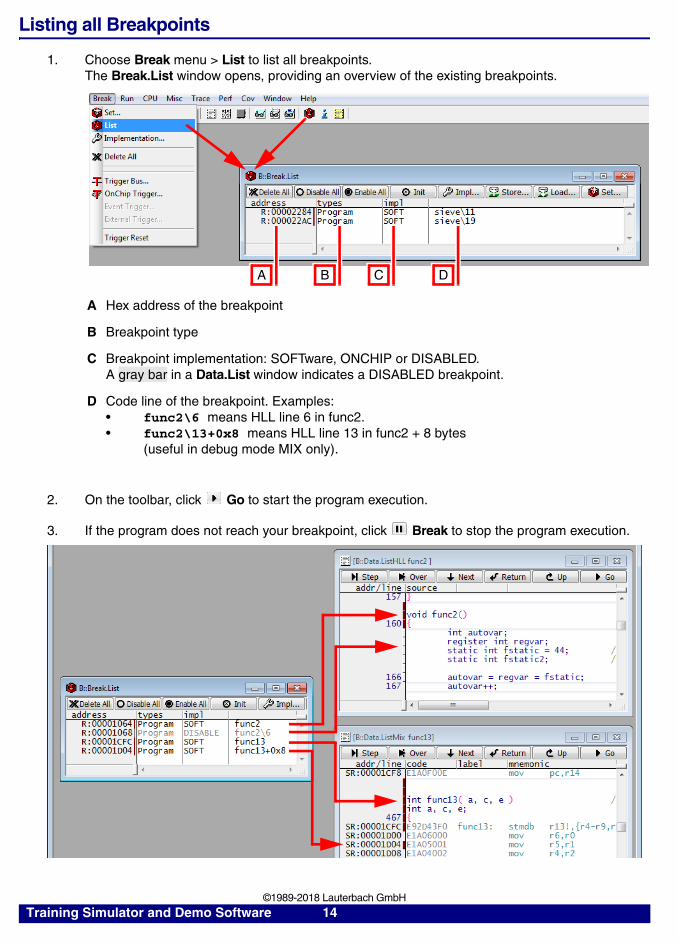
1. Choose Break menu > List to list all breakpoints. The Break.List window opens, providing an overview of the existing breakpoints.
2. On the toolbar, click Go to start the program execution.
3. If the program does not reach your breakpoint, click Break to stop the program execution.
A Hex address of the breakpoint
B Breakpoint type
C Breakpoint implementation: SOFTware, ONCHIP or DISABLED. A gray bar in a Data.List window indicates a DISABLED breakpoint.
D Code line of the breakpoint. Examples:• func2\6 means HLL line 6 in func2. • func2\13+0x8 means HLL line 13 in func2 + 8 bytes
(useful in debug mode MIX only).
A B C D
Training Simulator and Demo Software 14 ©1989-2018 Lauterbach GmbH
Setting a Program Breakpoint to Any Code Line within a Function
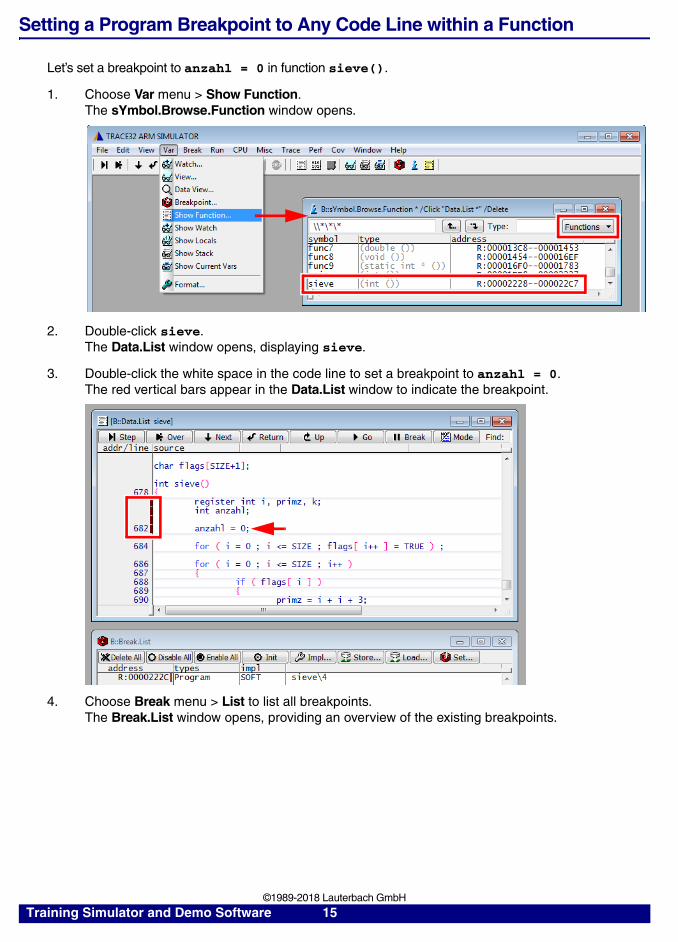
Let’s set a breakpoint to anzahl = 0 in function sieve().
1. Choose Var menu > Show Function. The sYmbol.Browse.Function window opens.
2. Double-click sieve. The Data.List window opens, displaying sieve.
3. Double-click the white space in the code line to set a breakpoint to anzahl = 0.The red vertical bars appear in the Data.List window to indicate the breakpoint.
4. Choose Break menu > List to list all breakpoints.The Break.List window opens, providing an overview of the existing breakpoints.
Training Simulator and Demo Software 15 ©1989-2018 Lauterbach GmbH
Setting a Spot Breakpoint
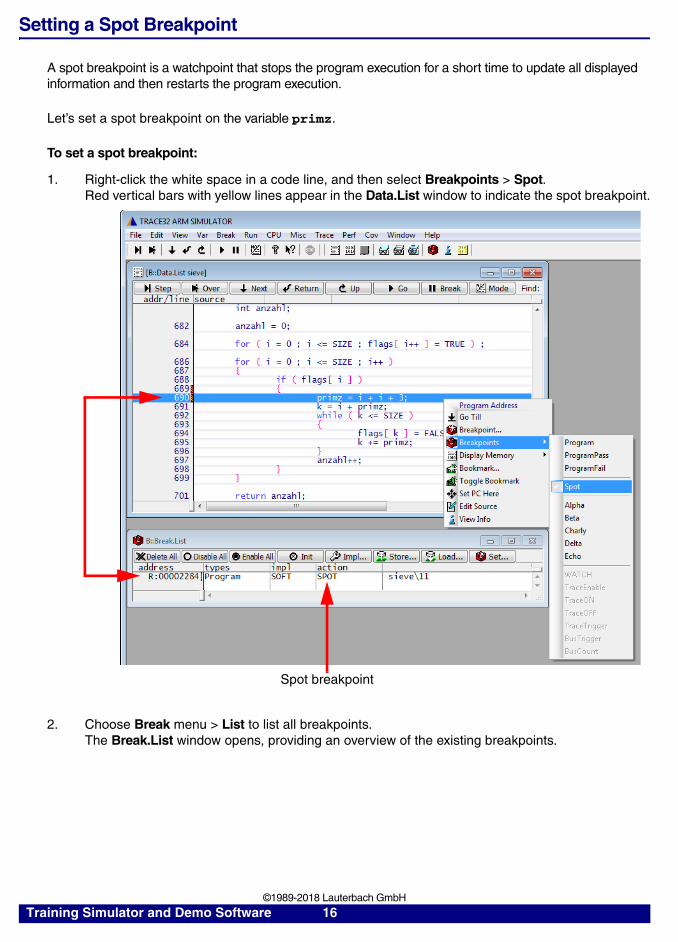
A spot breakpoint is a watchpoint that stops the program execution for a short time to update all displayed information and then restarts the program execution.
Let’s set a spot breakpoint on the variable primz.
To set a spot breakpoint:
1. Right-click the white space in a code line, and then select Breakpoints > Spot.Red vertical bars with yellow lines appear in the Data.List window to indicate the spot breakpoint.
2. Choose Break menu > List to list all breakpoints.The Break.List window opens, providing an overview of the existing breakpoints.
Spot breakpoint
Training Simulator and Demo Software 16 ©1989-2018 Lauterbach GmbH
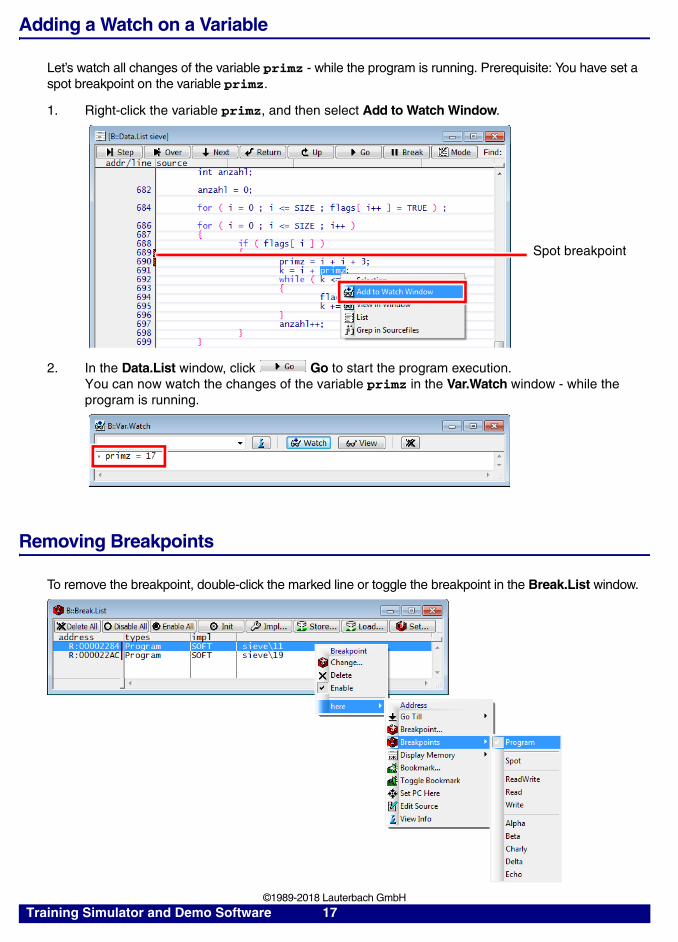
Adding a Watch on a Variable
Let’s watch all changes of the variable primz - while the program is running. Prerequisite: You have set a spot breakpoint on the variable primz.
1. Right-click the variable primz, and then select Add to Watch Window.
2. In the Data.List window, click Go to start the program execution.You can now watch the changes of the variable primz in the Var.Watch window - while the program is running.
Removing Breakpoints
To remove the breakpoint, double-click the marked line or toggle the breakpoint in the Break.List window.
Spot breakpoint
Training Simulator and Demo Software 17 ©1989-2018 Lauterbach GmbH
HLL Variables
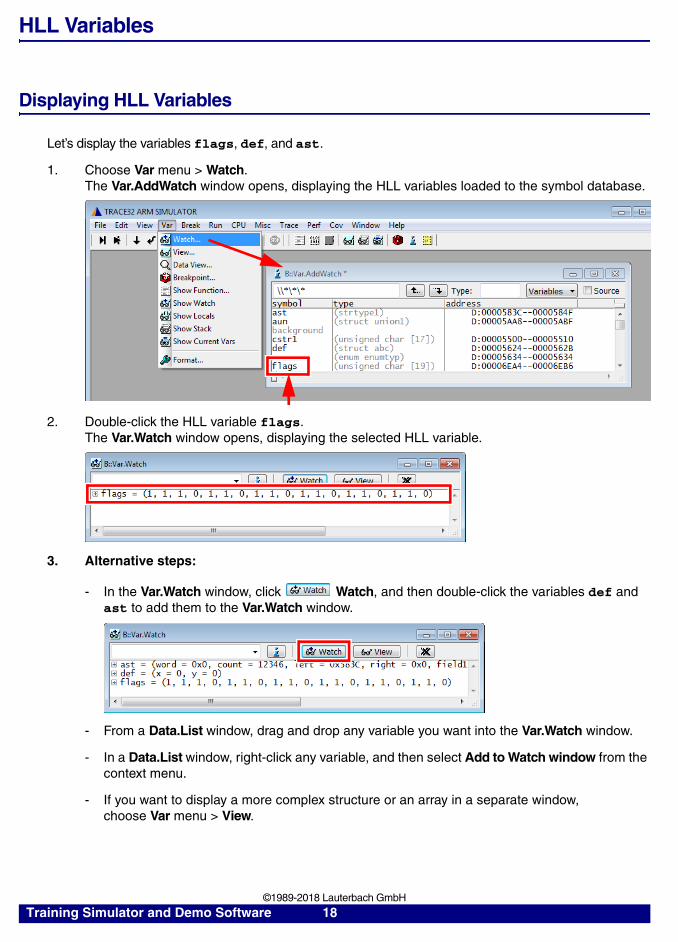
Displaying HLL Variables
Let’s display the variables flags, def, and ast.
1. Choose Var menu > Watch.The Var.AddWatch window opens, displaying the HLL variables loaded to the symbol database.
2. Double-click the HLL variable flags.The Var.Watch window opens, displaying the selected HLL variable.
3. Alternative steps:
- In the Var.Watch window, click Watch, and then double-click the variables def and ast to add them to the Var.Watch window.
- From a Data.List window, drag and drop any variable you want into the Var.Watch window.
- In a Data.List window, right-click any variable, and then select Add to Watch window from the context menu.
- If you want to display a more complex structure or an array in a separate window, choose Var menu > View.
Training Simulator and Demo Software 18 ©1989-2018 Lauterbach GmbH
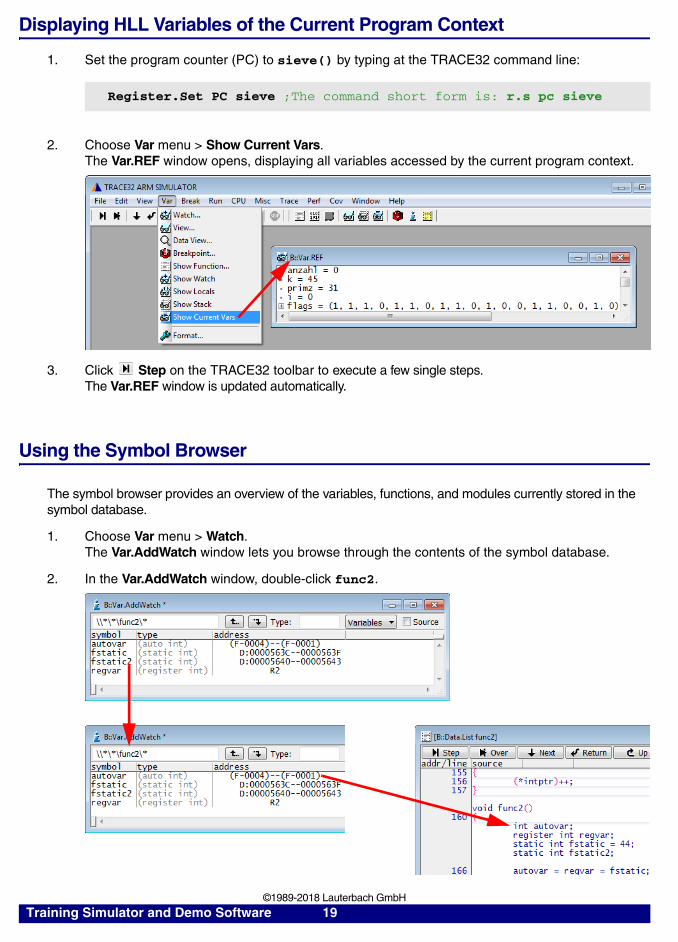
Displaying HLL Variables of the Current Program Context
1. Set the program counter (PC) to sieve() by typing at the TRACE32 command line:
2. Choose Var menu > Show Current Vars.The Var.REF window opens, displaying all variables accessed by the current program context.
3. Click Step on the TRACE32 toolbar to execute a few single steps. The Var.REF window is updated automatically.
Using the Symbol Browser
The symbol browser provides an overview of the variables, functions, and modules currently stored in the symbol database.
1. Choose Var menu > Watch.The Var.AddWatch window lets you browse through the contents of the symbol database.
2. In the Var.AddWatch window, double-click func2.
Register.Set PC sieve ;The command short form is: r.s pc sieve
Training Simulator and Demo Software 19 ©1989-2018 Lauterbach GmbH
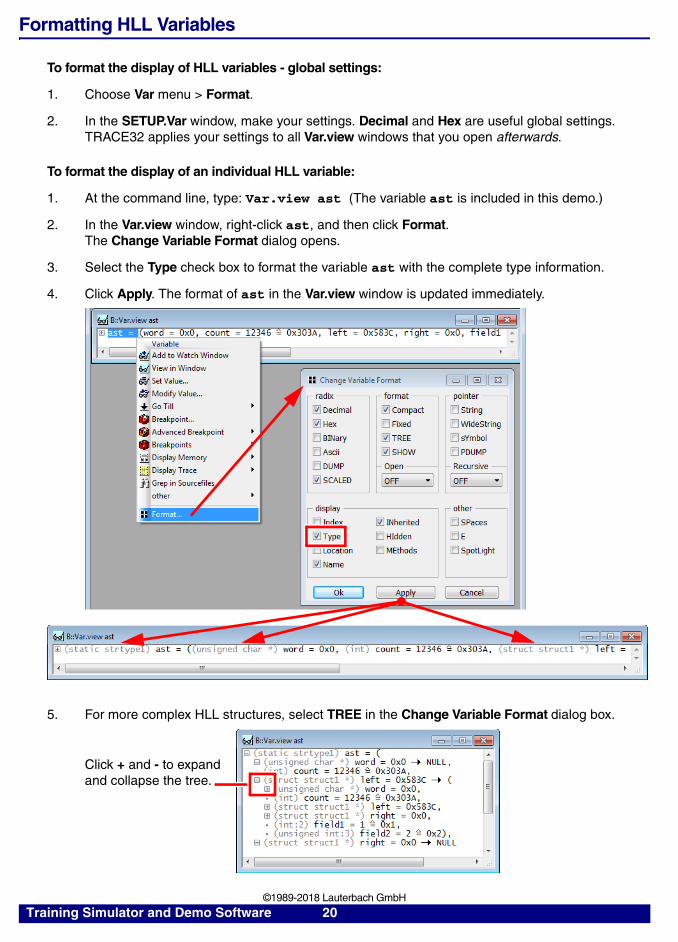
Formatting HLL Variables
To format the display of HLL variables - global settings:
1. Choose Var menu > Format.
2. In the SETUP.Var window, make your settings. Decimal and Hex are useful global settings.TRACE32 applies your settings to all Var.view windows that you open afterwards.
To format the display of an individual HLL variable:
1. At the command line, type: Var.view ast (The variable ast is included in this demo.)
2. In the Var.view window, right-click ast, and then click Format.The Change Variable Format dialog opens.
3. Select the Type check box to format the variable ast with the complete type information.
4. Click Apply. The format of ast in the Var.view window is updated immediately.
5. For more complex HLL structures, select TREE in the Change Variable Format dialog box.
Click + and - to expand and collapse the tree.
Training Simulator and Demo Software 20 ©1989-2018 Lauterbach GmbH
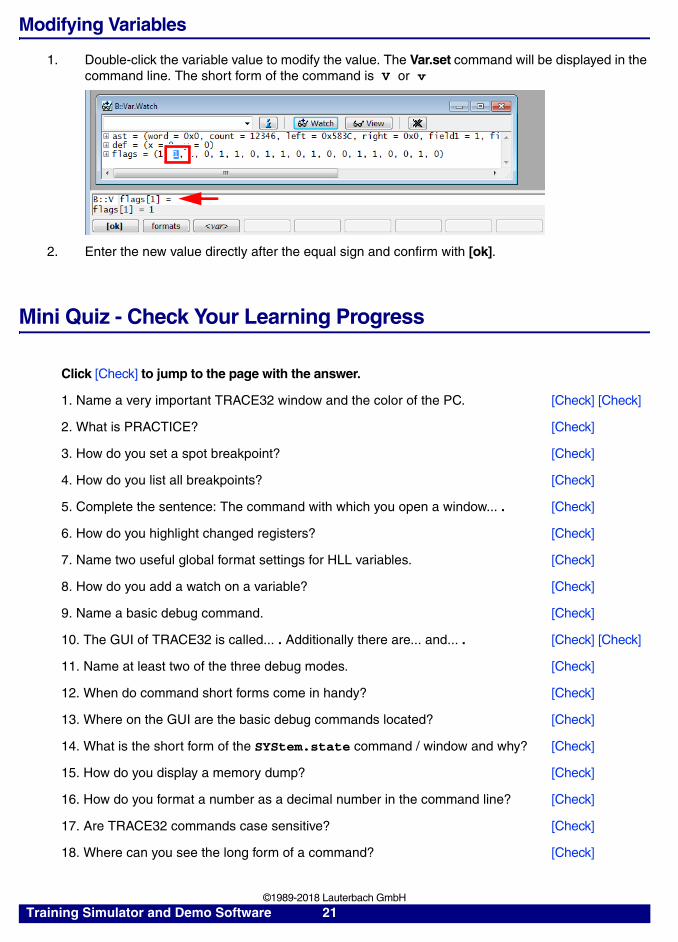
Modifying Variables
1. Double-click the variable value to modify the value. The Var.set command will be displayed in the command line. The short form of the command is V or v
2. Enter the new value directly after the equal sign and confirm with [ok].
Mini Quiz - Check Your Learning Progress
Click [Check] to jump to the page with the answer.
1. Name a very important TRACE32 window and the color of the PC. [Check] [Check]
2. What is PRACTICE? [Check]
3. How do you set a spot breakpoint? [Check]
4. How do you list all breakpoints? [Check]
5. Complete the sentence: The command with which you open a window... . [Check]
6. How do you highlight changed registers? [Check]
7. Name two useful global format settings for HLL variables. [Check]
8. How do you add a watch on a variable? [Check]
9. Name a basic debug command. [Check]
10. The GUI of TRACE32 is called... . Additionally there are... and... . [Check] [Check]
11. Name at least two of the three debug modes. [Check]
12. When do command short forms come in handy? [Check]
13. Where on the GUI are the basic debug commands located? [Check]
14. What is the short form of the SYStem.state command / window and why? [Check]
15. How do you display a memory dump? [Check]
16. How do you format a number as a decimal number in the command line? [Check]
17. Are TRACE32 commands case sensitive? [Check]
18. Where can you see the long form of a command? [Check]
Training Simulator and Demo Software 21 ©1989-2018 Lauterbach GmbH