Embed Size (px)
Citation preview
Page 2 of 34 -----------------------------2016 Lauterbach Group Sustainable Report-----------------------------
Lauterbach Group Sustainability Report January 2017
Our sustainability report is a being published to provide our shareholders, stakeholders and group members with a detailed report of our ongoing economic, environmental and/or social accountability pertaining to everyday business activities. This report covers a wide range of our business topics and their interrelationship to our economic, environmental, and social sustainable performance metrics. Every effort is being made to focus on transmitting the vital information with a clear and precise purpose – whether positive or negative, to our specified audiences.
This report is our key platform for communicating our governing sustainability performance metrics, operating efficiencies and natural resource use. The information captured within this report has been compiled, researched, and tracked to provide ongoing data analysis, improve efficiency, and reduce waste while constructing business transparency. We review our sustainable concepts by declaring that everything we do impacts the triple bottom line (Social, Economics, and Environmental). The benefits or consequences of our actions either affect social accountability, economic prosperity, and/or our environmental stewardship. Sustainability is really seen as our capacity to endure, encompassing business practices and resources, member’s roles and responsibilities, supply chain partnerships, technology use, and world affects.
We believe in complete transparency and this report will look to highlight both our strengths and our weaknesses in our sustainability efforts.
Our 2017 mission slogan is “Success is a Choice!” Our continual improvements focus on growth and profitability in all business areas through exceptional actions; we must secure our group member’s future. We will improve our top client relationships through planned account action. We will expand growth of REsouluteTM, coupon and film/paper label products, as well as, the distribution of MASC Store products. We will use technology; including Digital Print, OmniMarkTM, eCommerce and CRM to facilitate growth, simplify activities and lower cost. We will improve efficiency and lower overall costs in our production area. We will simplify the LPS, re-energize our efforts in sustainability and safety. We will improve group care satisfaction and engagement.
Page 3 of 34 -----------------------------2016 Lauterbach Group Sustainable Report-----------------------------
LAUTERBACH GROUP SUSTAINABILITY REPORT ............................................................................................................................ 2
SOCIAL SUSTAINABILITY ......................................................................................................................................................................... 5
Supply Chain Management .......................................................................................................................................................................... 5 Community.................................................................................................................................................................................................. 6 Work Environment ...................................................................................................................................................................................... 7
Member Safety ...................................................................................................................................................................................... 8 Building Security (Safety) ....................................................................................................................................................................... 9 Environmental Safety .......................................................................................................................................................................... 10 Cleanliness and Hygiene Safety ........................................................................................................................................................... 10 Regulatory Safety ................................................................................................................................................................................ 10
ECONOMIC SUSTAINABILITY .................................................................................................................................................................. 12
Supply Chain Partnerships ......................................................................................................................................................................... 12
Supply Procurement ............................................................................................................................................................................ 12 Client Support and Services ................................................................................................................................................................. 13
Improve Business Practices ....................................................................................................................................................................... 14
Digital Press Platform .......................................................................................................................................................................... 14 Water Consumption ............................................................................................................................................................................. 14 Energy Consumption ........................................................................................................................................................................... 15
Waste Management .................................................................................................................................................................................. 16
Recycling/Material Waste .................................................................................................................................................................... 17 Pallet Restoration ................................................................................................................................................................................ 18 Press Spoilage ...................................................................................................................................................................................... 18 Plate Spoilage ...................................................................................................................................................................................... 19 Setup Time Reduction ......................................................................................................................................................................... 20
ENVIRONMENTAL SUSTAINABILITY .......................................................................................................................................................... 21
Environmental Endorsement ..................................................................................................................................................................... 21
LEED Green Building ............................................................................................................................................................................ 22 L.I.F.E. ............................................................................................................................................................................................... 22 Green Tier ............................................................................................................................................................................................ 22
Water ........................................................................................................................................................................................................ 22
Gallons of Water Treated and Recycled ................................................................................................................................................ 23
Energy Usage ............................................................................................................................................................................................. 24
Renewable ........................................................................................................................................................................................... 25 Electrical (KWH) ................................................................................................................................................................................... 25 Natural Gas (Therms) ........................................................................................................................................................................... 26
Clean Air .................................................................................................................................................................................................... 27
Carbon Footprint .................................................................................................................................................................................. 28 Regulatory Wastes ............................................................................................................................................................................... 29
Landfill Stewards ....................................................................................................................................................................................... 29
Recycled Material ................................................................................................................................................................................ 31 Metals and E-Wastes ........................................................................................................................................................................... 31 Pallet Reuse ......................................................................................................................................................................................... 32
WHAT NOW? .................................................................................................................................................................................... 32
2017 GOALS ..................................................................................................................................................................................... 33
2016 YEAR-END GOAL SUMMARY ........................................................................................................................................................ 33
Social Sustainability Goals ......................................................................................................................................................................... 33 Economic Sustainability Goals ................................................................................................................................................................... 33 Environmental Sustainability Goals ............................................................................................................................................................ 34

Page 4 of 34 -----------------------------2016 Lauterbach Group Sustainable Report-----------------------------
Page 5 of 34 -----------------------------2016 Lauterbach Group Sustainable Report-----------------------------
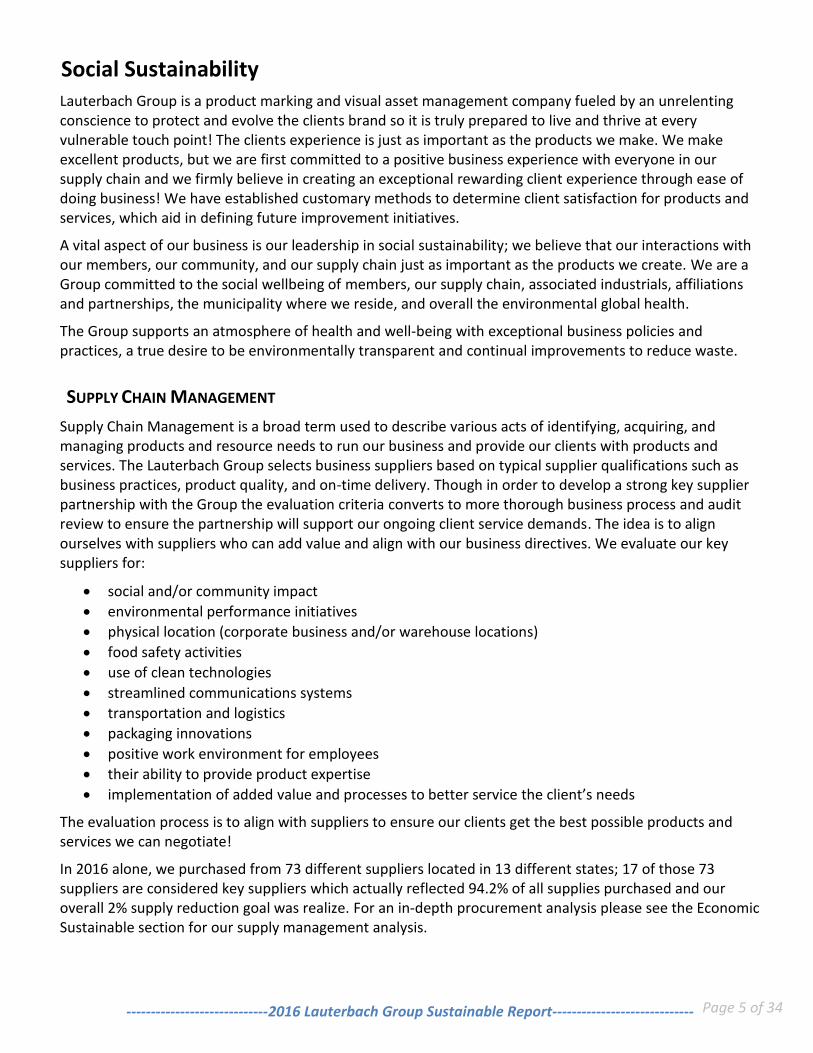
Social Sustainability Lauterbach Group is a product marking and visual asset management company fueled by an unrelenting conscience to protect and evolve the clients brand so it is truly prepared to live and thrive at every vulnerable touch point! The clients experience is just as important as the products we make. We make excellent products, but we are first committed to a positive business experience with everyone in our supply chain and we firmly believe in creating an exceptional rewarding client experience through ease of doing business! We have established customary methods to determine client satisfaction for products and services, which aid in defining future improvement initiatives.
A vital aspect of our business is our leadership in social sustainability; we believe that our interactions with our members, our community, and our supply chain just as important as the products we create. We are a Group committed to the social wellbeing of members, our supply chain, associated industrials, affiliations and partnerships, the municipality where we reside, and overall the environmental global health.
The Group supports an atmosphere of health and well-being with exceptional business policies and practices, a true desire to be environmentally transparent and continual improvements to reduce waste.
SUPPLY CHAIN MANAGEMENT
Supply Chain Management is a broad term used to describe various acts of identifying, acquiring, and managing products and resource needs to run our business and provide our clients with products and services. The Lauterbach Group selects business suppliers based on typical supplier qualifications such as business practices, product quality, and on-time delivery. Though in order to develop a strong key supplier partnership with the Group the evaluation criteria converts to more thorough business process and audit review to ensure the partnership will support our ongoing client service demands. The idea is to align ourselves with suppliers who can add value and align with our business directives. We evaluate our key suppliers for:
social and/or community impact
environmental performance initiatives
physical location (corporate business and/or warehouse locations)
food safety activities
use of clean technologies
streamlined communications systems
transportation and logistics
packaging innovations
positive work environment for employees
their ability to provide product expertise
implementation of added value and processes to better service the client’s needs
The evaluation process is to align with suppliers to ensure our clients get the best possible products and services we can negotiate!
In 2016 alone, we purchased from 73 different suppliers located in 13 different states; 17 of those 73 suppliers are considered key suppliers which actually reflected 94.2% of all supplies purchased and our overall 2% supply reduction goal was realize. For an in-depth procurement analysis please see the Economic Sustainable section for our supply management analysis.
Page 6 of 34 -----------------------------2016 Lauterbach Group Sustainable Report-----------------------------
COMMUNITY
Community can be defined in many ways depending on your views. We define it as a social alliance which is an occupational arrangement with common interests groups in our physical regional location. We see our commitment to the community’s social well-being as a cornerstone to good business accountability which is driven from defined business policies and practices, community support structures, and environmental stewardship actions.
The Sussex area is an extraordinary place to work, live, and play. We want to do our part to participate in our community’s triple bottom line. We are dedicated and committed to treating our production wastewater so that we reduce water treatment actions by the municipality. We have been and currently are very involved in the community through multiple community donations and service projects.
Lauterbach Group has made significant community investments in the public library, recreation programs, and various local and village parkway systems. We sponsor village anniversary celebrations, run/walk activities, and local farm growers with group member’s participation and registration contributions. We source from local suppliers, warehouse retailers, minority businesses, and farm growers (wherever possible) to reduce our carbon footprint and increase tax dollars staying within our local community. Local industries and trades help to support a healthy work environment with our fun day activities, group sponsored lunches, fruit Mondays, onsite chair massages, along with production and maintenance fundamentals. We have a thriving workplace and have received many awards for our community support efforts; we recently received the Successfully Sussex Award for our “extra efforts to make Sussex a better place to live, work, and play”. Sussex is truly an excellent community for us and our future growth! Our outreach program for 2016 supported CSA local farm growers and contributed with individual members’ membership share costs.
Efforts to support the global community are seen as opportunities to extend our support outside our local community. We are an outstanding member of Flexographic Technical Association (FTA) and Tag and Label Manufacturing Industries (TLMI) and actively participate in developing systems to aid and help the flexographic and tag and label manufacturing industries. Members participate in outreach training activities, industry webinars, and even arbitrating yearly international awards. We are recognized as a company that goes beyond regulatory requirements by the State of Wisconsin’s DNR with our acceptance into the Green Tier Program. Additionally, members actively support and participate in related Green Tier sponsored sustainable events. We have participated in the Green Master program and educational outreach efforts to promote Wisconsin sustainable initiatives; truly outperforming many larger companies. We promote environmental health by residing in a LEED Sliver certified building [US Green Building Council (USGBC)] to lessen our footprint and our impact on the natural environment. We are dedicated and continue to support the American Heart Association’s, 100 Holes for Heroes and the Susan G. Komen Foundation for Breast Cancer on a yearly basis. We have received the Best Workplace in the Americas Award for “creating an environment where members can thrive along with the business through sound human resources practices”.
Our Group strongly believes in education and the education of our next generation! Members’ actively and enthusiastically participate to provide training at recognized educational, environmental, and sustainable conferences, colleges, and associated industries. We provide members with ongoing business and safety education and host internships throughout the year in many workforce areas, including Accounting, Sales, Marketing, and Graphical Design. Throughout the school year we work directly with the local high schools to provide employment and on the job training. During summer months, we offer temporary work to high school and college students alike. Furthermore, member’s college bound high school seniors can request and submit for our $1,500 Group Forward Scholarship(s).
Page 7 of 34 -----------------------------2016 Lauterbach Group Sustainable Report-----------------------------
WORK ENVIRONMENT
Lauterbach Group pays great attention to creating a friendly and rewarding work environment for everyone and safety plays a vital part in our workplace practices. Safety awareness is everyone’s business! Group safety policies and practices are in place to keep members, guests, contractors, and our environment safe. Our Safety Policy Manual is reviewed annually by Human Resource Administrator and Safety Manager to determine if practices must be changed and/or updated according to governing directives. Every January, we review our evacuation polices to ensure that leadership, supervisors, members, and guests are instructed for proper evacuation practices and activities. Fortunately for us, our monthly safety education, safety reviews, and near miss activates appears to be proactively identifying potential risk hazards and addressing improvement actions before an incident or fatality befalls the Group. If an accident does occur, we have a team of first responders equipped to address and contain the incident until the appropriate professional response team appears on site. Furthermore, throughout the facility, you will find state of the art comprehensive environmental safety system(s) that monitor, notify, and are equipped for fast shutdown needs to react to any and all situations.
We have an exceptionally friendly working environment, which establishes a healthy dialogue between members and leadership. All are encouraged to contribute ideas or suggestions informally to leadership or formally though our online Suggestion box tool and/or one of our formal recognition systems. Our true conviction is to obtain a fresh perspective from those that participate directly or indirectly in the business practice or activity. Hence, our no door policy creates an open dialog environment where all ideas to drive improvements are welcomed. Literally speaking though, we have no doors that further aids in reducing our heating and venation costs. If members are not comfortable with open dialog (no-door policy), we encourage our members to submit cost saving improvements for business production practices and activities to thru the Applied Principle and Amplio submissions systems. Providing an exceptional client experience is an essential part of service and doing business, which is exactly why we encourage members to recognize other members that surpass professionalism thru the Outstanding Service Recognition system. Additionally, the online desktop Suggestion box is a place where brainstorm ideas are encouraged and members are asked to formally write-up and submit those “storm” ideas for change and/or cost saving opportunities.
Excellence in hygiene and sanitation policies and practices is required throughout the facility. Workstations, training rooms, conference rooms, and the cafeteria all are stocked with hand sanitization systems. Reminder signs to wash hands and sanitize are strategically placed throughout the facility.
Upon hire each member receives a Group Members Handbook (employee handbook) from the Human Resource Administrator and who will additionally provide updates and changes to the manual yearly and/or as deemed necessary. The members’ handbook helps to define Group policies, practices, and the compensation and benefit package, as well as other relative information. To drive home our values, members are provided with a personal hand sanitizer with a carrier, personalize closed cover drinking mug, and the current year’s business Vision card upon hire. The Vision card is created yearly to help communicate the vision, mission, values, and the defined goals and objectives for the Group. Group member’s compensation and benefits package consists of:
Complete Insurance Package (medical, vision, dental, life, and short term and long term disability)
Generous 401(k) Retirement Plan
529 College Savings Plan
Generous Universal Time Off
Paid Holidays
Education Reimbursement
Page 8 of 34 -----------------------------2016 Lauterbach Group Sustainable Report-----------------------------
Attractive Office Environment
Internal Growth Opportunities
Paid Uniform Service
Continuing Professional Education
Group Sponsored Smoking Cessation Programs
Group Sponsored Fruit Mondays, Luncheons, Snacks, and Beverages
Group Sponsored Professional Association Membership and Training
Group Sponsored Health and Wellness Programs
Group Sponsored Service Awards
Every new member goes through a defined structured onboarding and educational development designed to facilitate and familiarize the Groups values, defined goals, and policies to drive environmental stewardship, lean practitioners, and activity leaders. Members are required to participate in two ongoing monthly educational proficiency teachings: one to drive safety-first and the other to drive quality practice/product type awareness. All education is electronically tracked and members are required to review until a passing grade is achieved.
Member Safety
All new and long-standing members undertake a rigorous and attentive safety program daily, monthly and annually to raise safety awareness and keep members safe. After all, the first step to safety is awareness and we understand that safety education is significance in driving that awareness. The idea is that Group Members should be able to recognize potential hazards, properly address hazards and respond to potential accidents. Our mandatory monthly safety training (videos presentation format) has an accompanying quiz to verify member’s retention of the safety education. Members are required to review the educational training until they receive a passing score of 70%. Ongoing virtual training continues to educate and remind members’ that safety and eliminating hazards is our first priority.
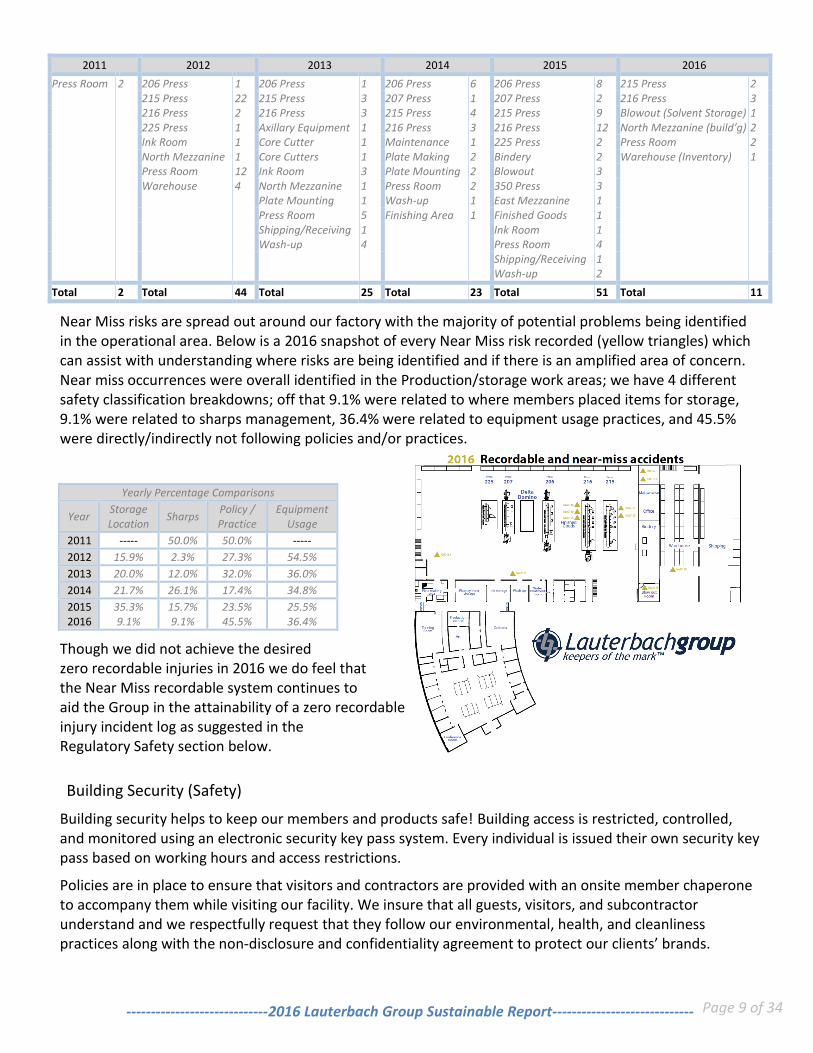
In November of 2011, we established an innovative near miss reporting program where members are to report any event that could be a potential danger, hazard, or accident, even though no mishap, misfortune, disaster has taken place. We believe a near miss reporting program proactively aids in eliminating safety concerns which is better than any reactive safety system. In order to ensure everyone’s safety, we must remove and fix potential hazards before an accident occurs, not after. Near miss reports are evaluated and addressed for correction and prevention. Near Misses are posted and reviewed with members during standup shift meetings and during near miss walk-a-rounds’ that drive and raise awareness of identified risk or damage and what specific corrective measure were taken to correct and eliminate the potential risk or danger. The total Near Miss risks identified are documented in the chart below according to year of occurrence and area identified.
Page 9 of 34 -----------------------------2016 Lauterbach Group Sustainable Report-----------------------------
2011 2012 2013 2014 2015 2016
Press Room 2 206 Press 1 206 Press 1 206 Press 6 206 Press 8 215 Press 2 215 Press 22 215 Press 3 207 Press 1 207 Press 2 216 Press 3 216 Press 2 216 Press 3 215 Press 4 215 Press 9 Blowout (Solvent Storage) 1 225 Press 1 Axillary Equipment 1 216 Press 3 216 Press 12 North Mezzanine (build’g) 2 Ink Room 1 Core Cutter 1 Maintenance 1 225 Press 2 Press Room 2 North Mezzanine 1 Core Cutters 1 Plate Making 2 Bindery 2 Warehouse (Inventory) 1 Press Room 12 Ink Room 3 Plate Mounting 2 Blowout 3 Warehouse 4 North Mezzanine 1 Press Room 2 350 Press 3 Plate Mounting 1 Wash-up 1 East Mezzanine 1 Press Room 5 Finishing Area 1 Finished Goods 1 Shipping/Receiving 1 Ink Room 1 Wash-up 4 Press Room 4 Shipping/Receiving 1 Wash-up 2
Total 2 Total 44 Total 25 Total 23 Total 51 Total 11
Near Miss risks are spread out around our factory with the majority of potential problems being identified in the operational area. Below is a 2016 snapshot of every Near Miss risk recorded (yellow triangles) which can assist with understanding where risks are being identified and if there is an amplified area of concern. Near miss occurrences were overall identified in the Production/storage work areas; we have 4 different safety classification breakdowns; off that 9.1% were related to where members placed items for storage, 9.1% were related to sharps management, 36.4% were related to equipment usage practices, and 45.5% were directly/indirectly not following policies and/or practices.
Yearly Percentage Comparisons
Year Storage Location
Sharps Policy / Practice
Equipment Usage
2011 ----- 50.0% 50.0% -----
2012 15.9% 2.3% 27.3% 54.5%
2013 20.0% 12.0% 32.0% 36.0%
2014 21.7% 26.1% 17.4% 34.8%
2015 35.3% 15.7% 23.5% 25.5% 2016 9.1% 9.1% 45.5% 36.4%
Though we did not achieve the desired zero recordable injuries in 2016 we do feel that the Near Miss recordable system continues to aid the Group in the attainability of a zero recordable injury incident log as suggested in the Regulatory Safety section below.
Building Security (Safety)
Building security helps to keep our members and products safe! Building access is restricted, controlled, and monitored using an electronic security key pass system. Every individual is issued their own security key pass based on working hours and access restrictions.
Policies are in place to ensure that visitors and contractors are provided with an onsite member chaperone to accompany them while visiting our facility. We insure that all guests, visitors, and subcontractor understand and we respectfully request that they follow our environmental, health, and cleanliness practices along with the non-disclosure and confidentiality agreement to protect our clients’ brands.
Page 10 of 34 -----------------------------2016 Lauterbach Group Sustainable Report-----------------------------
Environmental Safety
Every effort is made to ensure that environmental preference is given to all procurement activities. Our procurement process gives preference to suppliers that generate positive attributes that integrate sustainability and considerations for product selection to reduce the impact throughout the life cycle of the product. We believe that sustainable products are:
healthy for consumers do not contain know food allergens safe for workers environmentally sound beneficial to local communities economically viable
Simply put, we believe procurement must consider what products are made of, where they come from, who made them, how they will be ultimately disposed of and if the purchase is really necessary. We are about buying goods and services that have a sustainability premium and avoid those products or contractors that have poor operating practices and sourcing activities. It boils down to mutual social benefits, workforce development, environmental and financial prosperity.
Cleanliness and Hygiene Safety
To maintain our facilities cleanliness and hygiene, policies and practices are in place to insure that cleanliness and hygiene are maintained throughout our office, operational areas, and restroom facilities. Our environment health and hygiene safety practices are defined for our members, guests, contractors, as well as our supply chain. We assure products produced are developed and manufactured under the similar ridged restrictions to protect products produced utilizing food safety and quality guidelines.
Regulatory Safety
Regulatory compliancy is a minimalistic approach showing exceptional superiority in the application of regulatory guidelines that is expected and anticipated! Not only do we conscientiously comply with regulatory requirements, we make every effort to surpass requirements. Regardless of the regulatory requirements and reporting needs, we believe that proper application of regulatory guidelines and standards help to drive safe actions and practices. Our safety record reveals the Group’s commitment to keeping members, guests, and contactors safe!
United States Department of Labor provides workplace safety knowledge, education and in addition provides data to compare labor safety practices against similar business. If our recordable safety occurrences or incidents are symbolic of what our future will be like, we are definitely are on the right track. With no lost time occurrences in the past 6 years, we remain on track to celebrate 7 years in July 2017. Labor comparison data confirms we offer members, guests, and contractors a safe workplace as we now lie below the Wisconsin Private Industry, Printing sector averages in incident rate for the past five years.
Page 11 of 34 -----------------------------2016 Lauterbach Group Sustainable Report-----------------------------
Area Sector Industry
Private Industry, Wisconsin Manufacturing Printing and related Support Activities
Year 2010 2011 2012 2013 2014 2015 2016
Case Type
Lau
terb
ach
Pri
vate
Ind
ust
ry
Lau
terb
ach
Pri
vate
Ind
ust
ry
Lau
terb
ach
Pri
vate
Ind
ust
ry
Lau
terb
ach
Pri
vate
Ind
ust
ry
Lau
terb
ach
Pri
vate
Ind
ust
ry
Lau
terb
ach
Pri
vate
Ind
ust
ry
Lau
terb
ach
Pri
vate
Ind
ust
ry
Total 2.0 3.6 2.0 4.0 0 4.1 0 3.6 0 3.4 0 2.3 4.3
no
t av
aila
ble
Days Away 12.3 0.8 1.0 0.9 0 1.1 0 1.1 0 1.0 0 0.7 0
Job Transfer/Restriction 59.4 1.1 0 1.2 0 1.1 0 1.1 0 1.0 0 0.6 0
DART 71.7 2.0 1.0 2.1 0 2.2 0 2.1 0 2.0 0 1.2 0
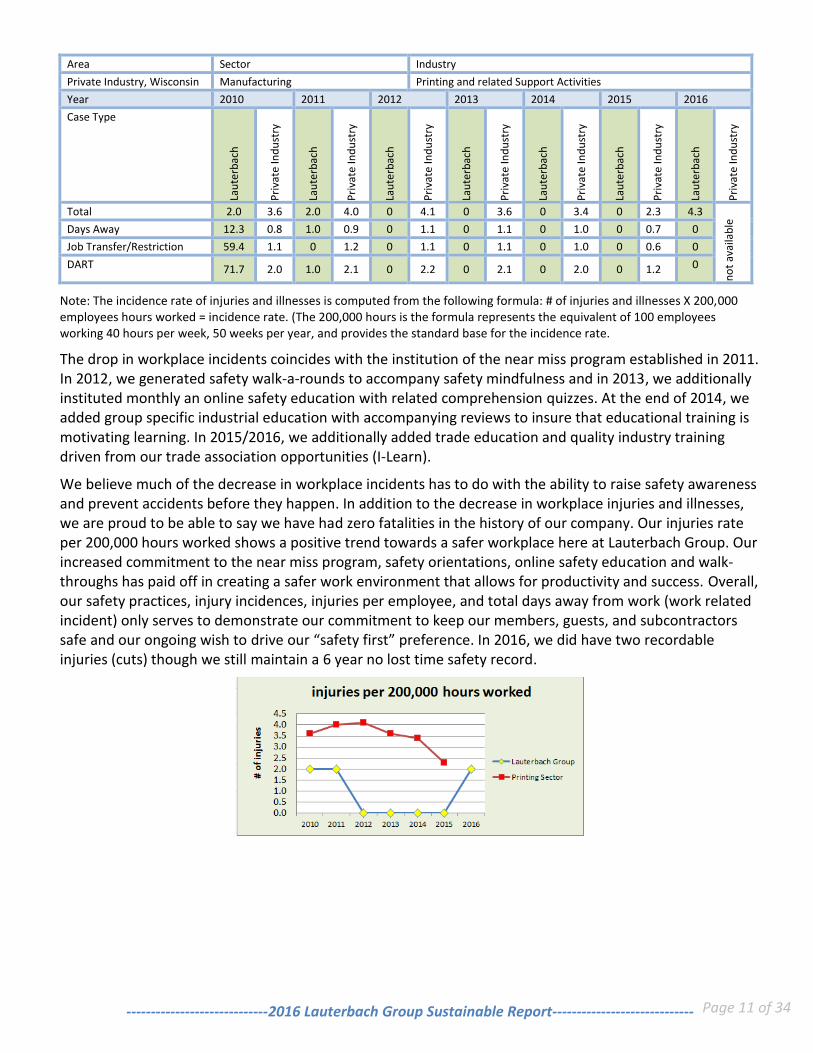
Note: The incidence rate of injuries and illnesses is computed from the following formula: # of injuries and illnesses X 200,000 employees hours worked = incidence rate. (The 200,000 hours is the formula represents the equivalent of 100 employees working 40 hours per week, 50 weeks per year, and provides the standard base for the incidence rate.
The drop in workplace incidents coincides with the institution of the near miss program established in 2011. In 2012, we generated safety walk-a-rounds to accompany safety mindfulness and in 2013, we additionally instituted monthly an online safety education with related comprehension quizzes. At the end of 2014, we added group specific industrial education with accompanying reviews to insure that educational training is motivating learning. In 2015/2016, we additionally added trade education and quality industry training driven from our trade association opportunities (I-Learn).
We believe much of the decrease in workplace incidents has to do with the ability to raise safety awareness and prevent accidents before they happen. In addition to the decrease in workplace injuries and illnesses, we are proud to be able to say we have had zero fatalities in the history of our company. Our injuries rate per 200,000 hours worked shows a positive trend towards a safer workplace here at Lauterbach Group. Our increased commitment to the near miss program, safety orientations, online safety education and walk-throughs has paid off in creating a safer work environment that allows for productivity and success. Overall, our safety practices, injury incidences, injuries per employee, and total days away from work (work related incident) only serves to demonstrate our commitment to keep our members, guests, and subcontractors safe and our ongoing wish to drive our “safety first” preference. In 2016, we did have two recordable injuries (cuts) though we still maintain a 6 year no lost time safety record.
Page 12 of 34 -----------------------------2016 Lauterbach Group Sustainable Report-----------------------------
Economic Sustainability We are all aware that demand will drive commodity costs and organizations must remain cost compensatory to stay alive in a global economy. Therefore, to be a cost efficient business, we look for ways to reduce costs associated with financial burdens. Lauterbach Group has determined that economic prosperity advantages stem from three key areas of business; supply chain management, improve business practices, and waste management. A true understanding of our supply chain, business practices, and waste streams are critical features to fully embracing reduction needs while continually lowering costs and our effects on the environment. Business expenses are being reduced in many areas due to our commitment to effectively use materials, supplies, and reduce natural resources used. Though, further cost and waste reductions initiatives lie in many essential business activities of client management, order management, procurement, and production. We understand that reducing costs thru solid partnerships saves money, allowing us to keep our Group pricing competitive. Economic prosperity (financial bottom line) is all about creating solid partnerships with members, suppliers, and clients to aid and drive costs downward thru the reducing, reusing, and recycling model.
SUPPLY CHAIN PARTNERSHIPS
We are all about getting connected, creating intelligent accessible information to rapidly respond and react fully to our clients, Group members, suppliers, and marketplace needs. We offer digital technologies in a variety of platforms to integrate and streamline practices for order placements, purchasing, art management, inventory turns, product release, educational and industrial support. Our approach is not to create a fundamental digital connection; it is about creating a unified physical flow, for shared information, educational talents, and material needs across multiple platforms. Utilizing social media, mobile communications, cloud computing, etc. we are reinventing our supply chain strategies as an indispensable business management practice.
There are supply types that can only be obtained from a distinct supplier; in those cases, our procurement activities may be slightly modified to address these exception items. Otherwise, key supplier partnerships are the primary element for providing our clients with product markings and visual asset management services. Our key supplier partnerships have helped and continually drive a powerful streamlined, collaborative, and competitive advantage to our clients and the marketplace.
Supply Procurement
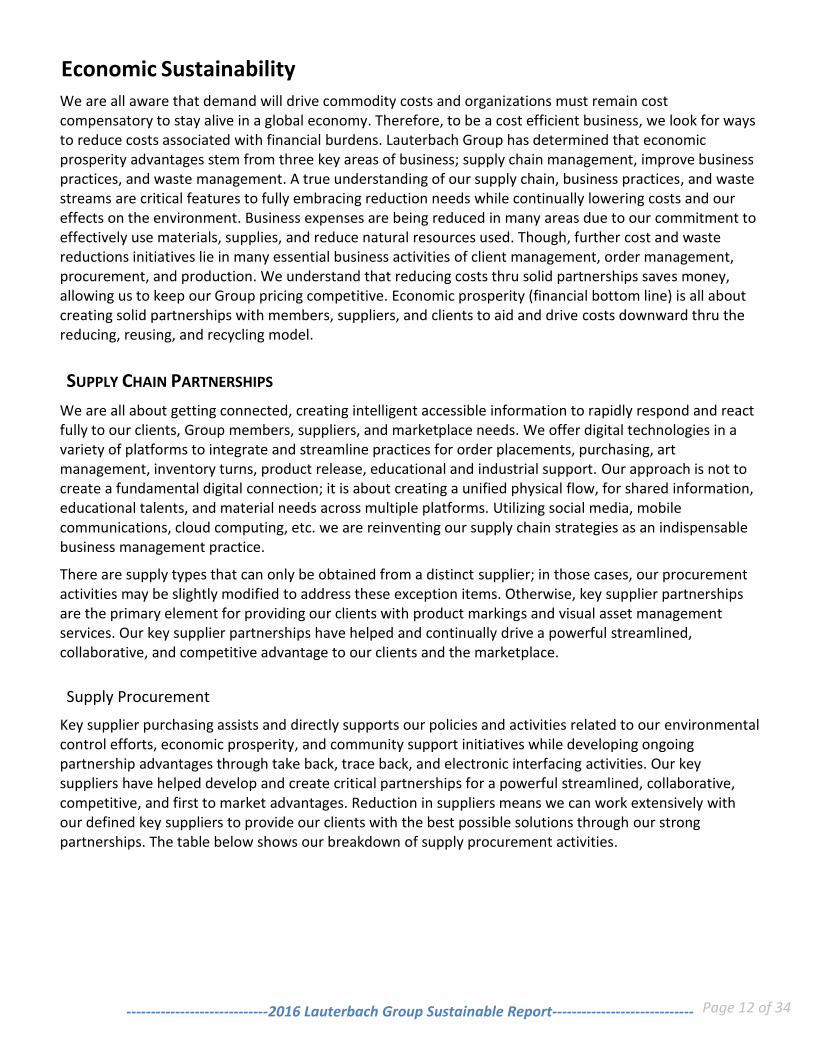
Key supplier purchasing assists and directly supports our policies and activities related to our environmental control efforts, economic prosperity, and community support initiatives while developing ongoing partnership advantages through take back, trace back, and electronic interfacing activities. Our key suppliers have helped develop and create critical partnerships for a powerful streamlined, collaborative, competitive, and first to market advantages. Reduction in suppliers means we can work extensively with our defined key suppliers to provide our clients with the best possible solutions through our strong partnerships. The table below shows our breakdown of supply procurement activities.
Page 13 of 34 -----------------------------2016 Lauterbach Group Sustainable Report-----------------------------
Supplier Purchasing
Total Purchases 2014 2015 2016 Key Supplier Purchasing 2014 2015 2016Entire Supply Purchases 100.0% 100.0% 100.0% % of Key Suppliers Purchases 95.9% 96.2% 94.2%
% of Purchases w/130 miles 94.3% 95.0% 95.7% % of Key Suppliers Purchases w/130 miles 75.0% 76.5% 76.5%
% of Suppliers w/130 miles 72.6% 64.9% 67.1% % of Key Suppliers w/130 Miles 91.5% 92.7% 91.2%
% of Wisconsin Suppliers 33.9% 31.1% 32.9% % of Wisconsin Key Suppliers 25.0% 23.5% 23.5%
% of Wisconsin Purchases 25.7% 16.3% 16.3% % of Wisconsin Key Supplier Purchases 25.4% 15.6% 16.3%
Total Suppliers 62 74 73 Key Suppliers 16 17 17
-- 1% 2%Overall Reduction (%) in Supply Purchases Per Sales Revenue
Client Support and Services
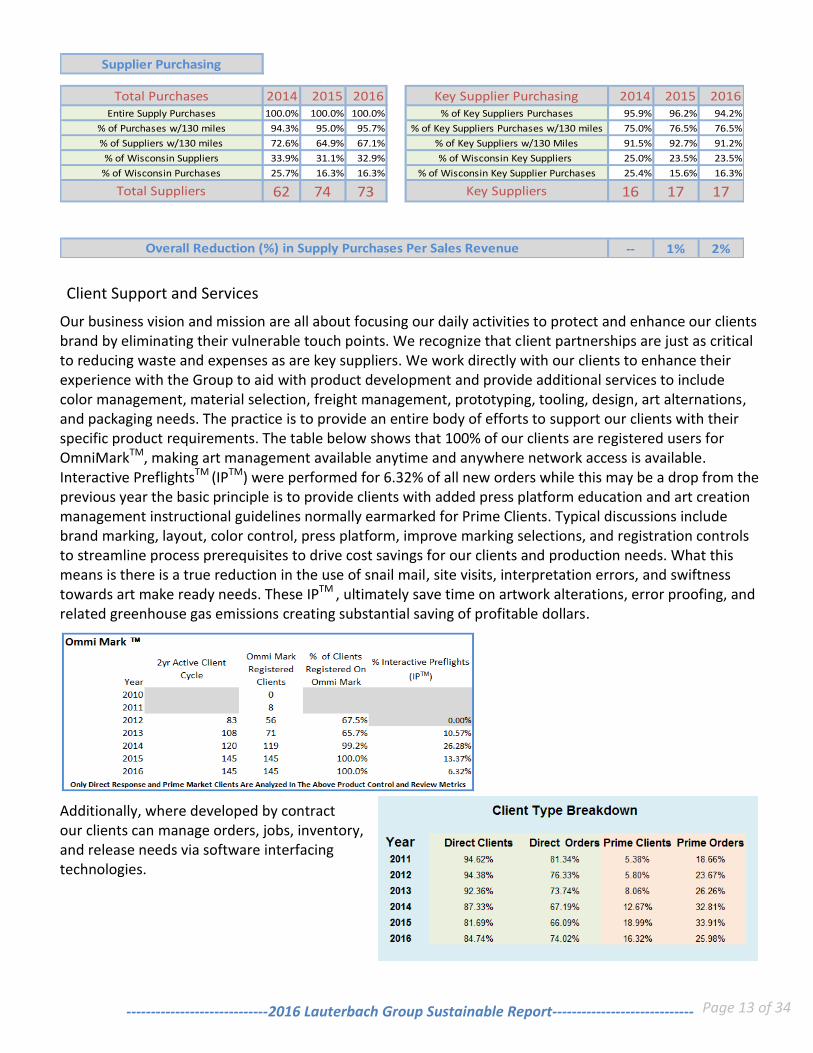
Our business vision and mission are all about focusing our daily activities to protect and enhance our clients brand by eliminating their vulnerable touch points. We recognize that client partnerships are just as critical to reducing waste and expenses as are key suppliers. We work directly with our clients to enhance their experience with the Group to aid with product development and provide additional services to include color management, material selection, freight management, prototyping, tooling, design, art alternations, and packaging needs. The practice is to provide an entire body of efforts to support our clients with their specific product requirements. The table below shows that 100% of our clients are registered users for OmniMarkTM, making art management available anytime and anywhere network access is available. Interactive PreflightsTM (IPTM) were performed for 6.32% of all new orders while this may be a drop from the previous year the basic principle is to provide clients with added press platform education and art creation management instructional guidelines normally earmarked for Prime Clients. Typical discussions include brand marking, layout, color control, press platform, improve marking selections, and registration controls to streamline process prerequisites to drive cost savings for our clients and production needs. What this means is there is a true reduction in the use of snail mail, site visits, interpretation errors, and swiftness towards art make ready needs. These IPTM , ultimately save time on artwork alterations, error proofing, and related greenhouse gas emissions creating substantial saving of profitable dollars.
Additionally, where developed by contract our clients can manage orders, jobs, inventory, and release needs via software interfacing technologies.
Page 14 of 34 -----------------------------2016 Lauterbach Group Sustainable Report-----------------------------
IMPROVE BUSINESS PRACTICES
Efficiencies remain a critical and important feature of sustainability at Lauterbach Group utilizing the Lauterbach Productivity System to define our key business policies, practices, and resource needs. Lauterbach Productivity System is fundamentally a PlanDoCheckAct systems that monitors, controls, and analyze business practices for mistake proofing, elimination of wastes, and improve efficiencies. It really is all about creating a business structure to allow for continuous sustainable improvements! Productivity practiced and their efficiencies can always be reviewed, improved and/or enhanced based on simple analysis and tracking practices. Fundamental practices improvement actions are taken to reduce expenses creating a cost-saving or in some instances revenue generation. We educate and train members to review, monitor and improve their daily practices using the 5s methodology to reduce wastes. We educate that reduction in wastes not only is the right thing to do, it is a driving force in economic prosperity. Creating transparency in everything we do is our way of doing business creating what is coined as sustainable transparency (environmental friendly and process reliability).
Digital Press Platform
Applying and keeping informed of the latest in technologies is truly identified as a capacity to endure. With sustainability it is all about evolving and opening to change. Every effort is made to ensure that replacements and enhancements are driven with cost reduction to operational practices. In 2014/2015, we added a digital printing (Domino) and converting center (Delta), which allowed for a 24 hour turnaround time from order approval to shipment of goods and services. Job setup is reduced to the push of a button instead of the traditional flexographic print setup time of 4 hours and it is noteworthy to mention the press platform uses less electricity than the other press platforms. This push button setup practically eliminates spoilage waste, provides a consistent ink flow, and reduces supply needs while streamlining batch processing and consecutive printing. Our 2016 ongoing resource management analysis and improvement projects have redefined color management practices for improvement color across press platforms to include full color gamut utilizing process colors (CMYK), product costing, supply management, press capacity, and client order management and forecasting.
Water Consumption
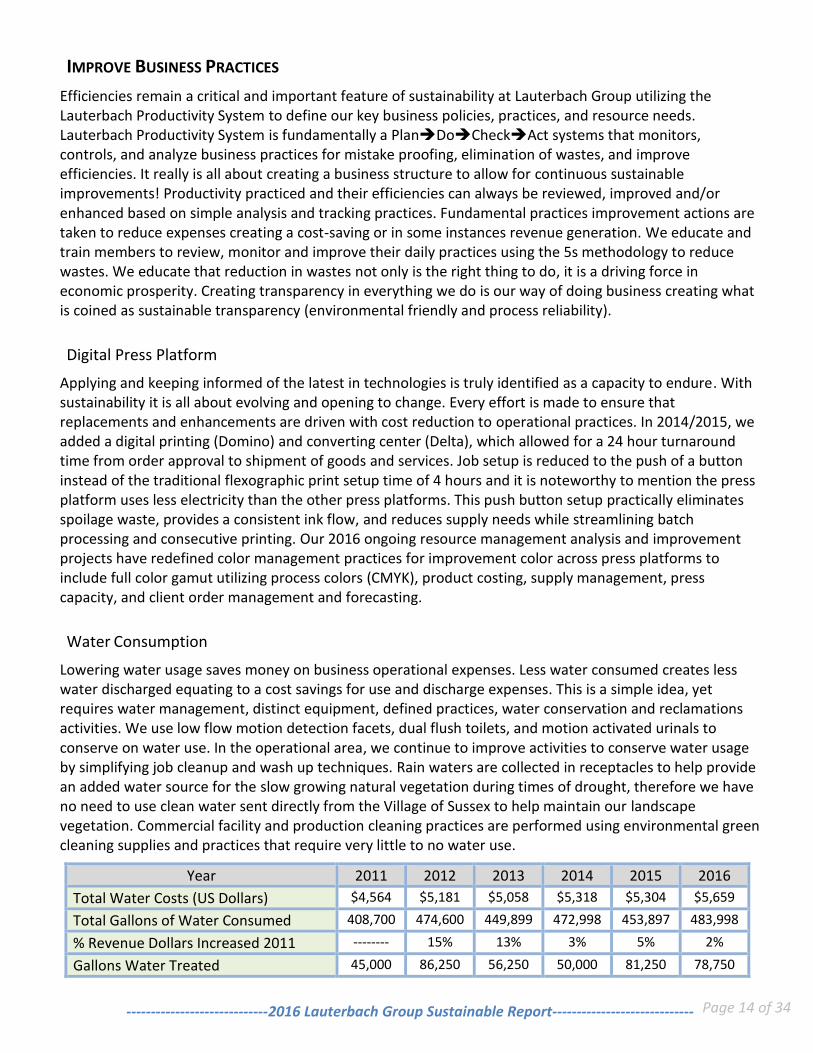
Lowering water usage saves money on business operational expenses. Less water consumed creates less water discharged equating to a cost savings for use and discharge expenses. This is a simple idea, yet requires water management, distinct equipment, defined practices, water conservation and reclamations activities. We use low flow motion detection facets, dual flush toilets, and motion activated urinals to conserve on water use. In the operational area, we continue to improve activities to conserve water usage by simplifying job cleanup and wash up techniques. Rain waters are collected in receptacles to help provide an added water source for the slow growing natural vegetation during times of drought, therefore we have no need to use clean water sent directly from the Village of Sussex to help maintain our landscape vegetation. Commercial facility and production cleaning practices are performed using environmental green cleaning supplies and practices that require very little to no water use.
Year 2011 2012 2013 2014 2015 2016
Total Water Costs (US Dollars) $4,564 $5,181 $5,058 $5,318 $5,304 $5,659
Total Gallons of Water Consumed 408,700 474,600 449,899 472,998 453,897 483,998
% Revenue Dollars Increased 2011 -------- 15% 13% 3% 5% 2%
Gallons Water Treated 45,000 86,250 56,250 50,000 81,250 78,750
Page 15 of 34 -----------------------------2016 Lauterbach Group Sustainable Report-----------------------------
Year 2011 2012 2013 2014 2015 2016
Pounds of Solid Waste Removed (lbs) 4,388 13,156 5,355 5,067 8,789 8,459
% Water Used For Production Cleanup 11.0% 18.2% 12.5% 10.6% 17.90% 16.27%
Over the past six years of monitoring water usage we were on a steady decline in our water usage per revenue dollars in both the operational area as well as the corporate administrative center. Our 2014 and 2016 data are compromised due to several water failures. Even with the loss of clean water, we reduced the amount of total water used since our baseline year 2012. With changes in production setup team, we did see cleanup water usage increase in 2015 and 2016 with a small improvement in 2016.
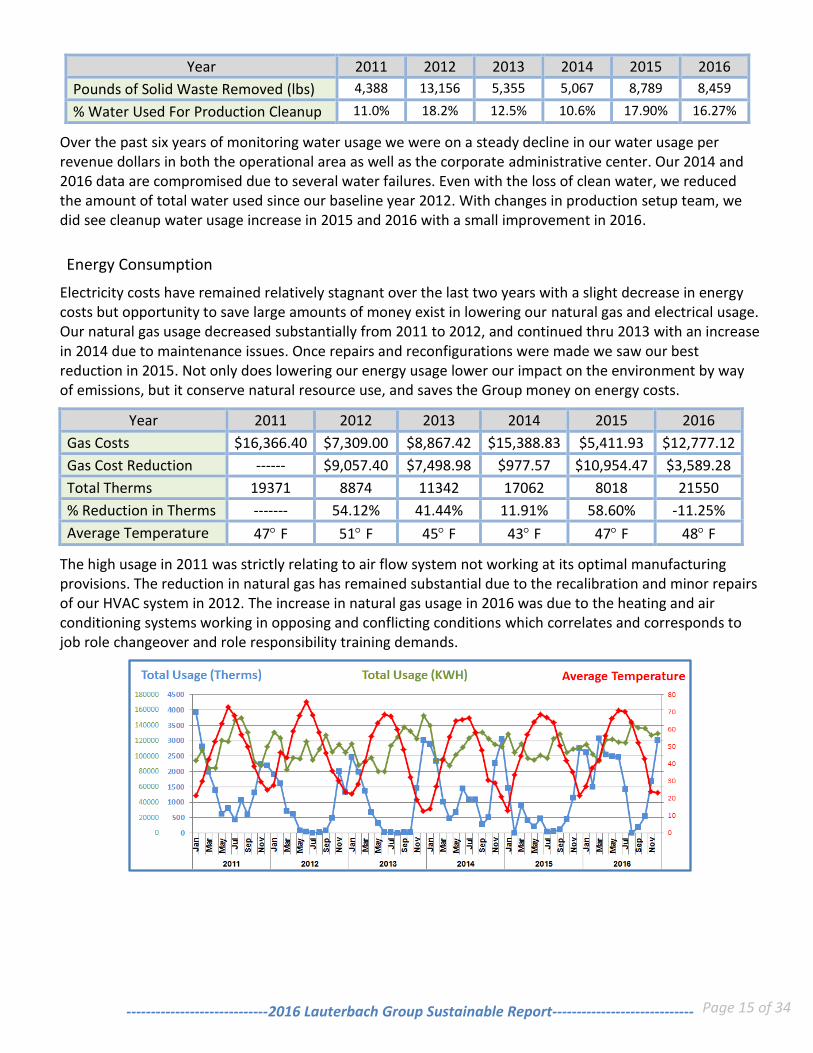
Energy Consumption
Electricity costs have remained relatively stagnant over the last two years with a slight decrease in energy costs but opportunity to save large amounts of money exist in lowering our natural gas and electrical usage. Our natural gas usage decreased substantially from 2011 to 2012, and continued thru 2013 with an increase in 2014 due to maintenance issues. Once repairs and reconfigurations were made we saw our best reduction in 2015. Not only does lowering our energy usage lower our impact on the environment by way of emissions, but it conserve natural resource use, and saves the Group money on energy costs.
Year 2011 2012 2013 2014 2015 2016
Gas Costs $16,366.40 $7,309.00 $8,867.42 $15,388.83 $5,411.93 $12,777.12
Gas Cost Reduction ------ $9,057.40 $7,498.98 $977.57 $10,954.47 $3,589.28
Total Therms 19371 8874 11342 17062 8018 21550
% Reduction in Therms ------- 54.12% 41.44% 11.91% 58.60% -11.25%
Average Temperature 47F 51F 45 F 43 F 47 F 48 F
The high usage in 2011 was strictly relating to air flow system not working at its optimal manufacturing provisions. The reduction in natural gas has remained substantial due to the recalibration and minor repairs of our HVAC system in 2012. The increase in natural gas usage in 2016 was due to the heating and air conditioning systems working in opposing and conflicting conditions which correlates and corresponds to job role changeover and role responsibility training demands.

Page 16 of 34 -----------------------------2016 Lauterbach Group Sustainable Report-----------------------------
The Group’s has defined policies, practices, and purchasing activities that outline actions to conserve on energy usage and to ensure that certified energy system technologies are the preferred procurement choice. We make many efforts to reduce our electricity usage through motion detection lighting systems, software controls to utilize natural lighting conditions, solar energy, energy efficient computing systems, utilization of computer sleep and auto shutdown controls, virtual servers, high efficient cafeteria appliances, and strategic production scheduling. Increase in electrical use over the past two years is reflective of new press platform technologies added to the Group’s portfolio.
Year 2011 2012 2013 2014 2015 2016
Total Costs $151,736 $149,472 $154,299 $158,137 $156,733 $168,188
Total KWH 1,329,900 1,307,100 1,339,500 1,366,500 1,315,200 1,462800
KWH Cost per Sales $ 0.088 0.073 0.077 0.087 0.082 0.095
Revenue Increases Baseline 17.98% 14.62% 3.19% 5.43% 1.84%
% KWH Reduction Baseline 1.71% -0.72% -2.75% 1.11% -9.99%
Average KWH per Sq/Ft $1.71 $1.68 $1.72 $1.75 $1.69 $1.88
Average Temperature 47F 51F 44F 43F 47F 48F
WASTE MANAGEMENT
Waste is anything that affects our profitability; directly or indirectly. The idea behind waste management is to streamline processes to keep lowering wastes, while improving product quality and lowering expenses throughout our business practices to aid in providing an exceptional client experience. By eliminating undesirable wastes, we actually support effective and efficient process controls, whereas reducing associated resource expenses and wastes. Our members are our greatest assets. They are the critical feature in helping to improve and reduce waste in all our activities. Educating our members is a key focus point to making the largest impact to identify, simplify, and streamline system activities to reduce waste.
The two main waste management tools that empower our Group Members’ to identify and remove wastes are the 3R’s (reduce, reuse, and recycle) and 5S’s (sort, shine, set in order, standardize, and sustain). These two methods help our members to identify and eliminate undesirable waste in their essential business activities such as: client management, purchasing, manufacturing, natural resource use, and process waste. We have shown considerable improvement in reducing costs associated with supply use, process needs/controls, and our ability to reuse or recycle waste. The waste management concept model has been identified and classified into five key areas of interests: materials, pallets, press spoilage, plate spoilage, and setup reduction; these five key areas assist members with staying focused on our specific business waste activities.
Page 17 of 34 -----------------------------2016 Lauterbach Group Sustainable Report-----------------------------
While our first priority is to reduce the amount of waste created, we continue to seek out alternative recycling options to reduce our landfill waste while ideally creating waste profit. In order to get the true picture of landfill waste reduction, it is essential to normalize/equalize the service costs associated with wastes. In the above table, we define our service rate increased per year since the baseline year (2011). Profitability would be clear if landfill and recycling costs would have been stable across the 6 years; though associated costs are truly a moving target and difficult to normalize. In spite of the constant recycling fluctuations (cost and materials), we have average a 41% landfill waste diversion. As waste stream costs increased year after year, it is important to note that dollars spent on waste does not necessary reflect the true nature of waste reduction and waste management efforts. As we continue to search for suitable ways to reduce material waste, we anticipate continued waste reductions from process simplifications efforts. Further assessment reviews on dollars associated with recycling efforts and waste management tracking will need to be modified to obtain a true assessment of waste costs reduction.
In the early years of recycling for profit (2011-2013), we worked directly with a recycling warehouse that distributed our waste streams generating substantial revenue for the Group. Due to restructuring of recycling warehouses this type of revenue recycling is no longer available to the Group. Our current recycling initiatives are spread across multiple vendors and facilities designed to refurbish, recycle and reprocess particular wastes though our waste diversion does not drive revenue as in the past, it still diverts those waste from landfills with a cost saving diversion expense. Diverting wastes in the past was a profitable environment initiative. Today, it’s about being diversion stewards for the environment!
Recycling/Material Waste
Our efforts to minimize waste materials sent to landfill only helps to demonstrate the Group’s desire to be stewards for the environment while ideally reducing our waste expenses. We attempt to create zero waste yet our main force is to reduce, reuse, and recycle as much as possible. Key factors that help reduce waste costs are concepts driven from Lean manufacturing initiatives. In the past years, our steady decline in wastes created throughout our business practices has had a substantial impact in reducing our total waste sent to landfill. Recycling and refurbishing initiatives continues to divert landfill wastes in spite of the limited recycling and refurbishing plants in the state of Wisconsin. (It really is about reducing waste not just diversion from landfill.) Reduction in waste revenue has declined since 2012 with the reduction of refurbishment facilities paying in Wisconsin for manufacturing wastes. Regardless, the Group continues to find avenues for our affected waste streams enduring with our environmental stewardship principle; reduce waste and divert from landfill! Recycling really is only a small step in reducing waste to landfill, our main focus is reducing the waste from it source creation. The following data table shows landfill and recycling waste management tracking.
Year 2011 2012 2013 2014 2015 2016
Landfill Waste (lbs) 961,240 896,220 889,240 790,660 760,560 913,760
Diverted Waste (lbs) 423,191 748,287 745,831 565,920 575,195 570,330
Page 18 of 34 -----------------------------2016 Lauterbach Group Sustainable Report-----------------------------
Year 2011 2012 2013 2014 2015 2016
Total Pounds of Waste (lbs) 1,384,431 1,644,507 1,635,071 1,356,580 1,335,755 1,484,090
% Diverted From Landfill 31% 46% 46% 42% 43% 38%
Landfill Waste per Revenue Dollar ($) 6.34% 5.01% 5.12% 5.05% 4.76% 3.69%
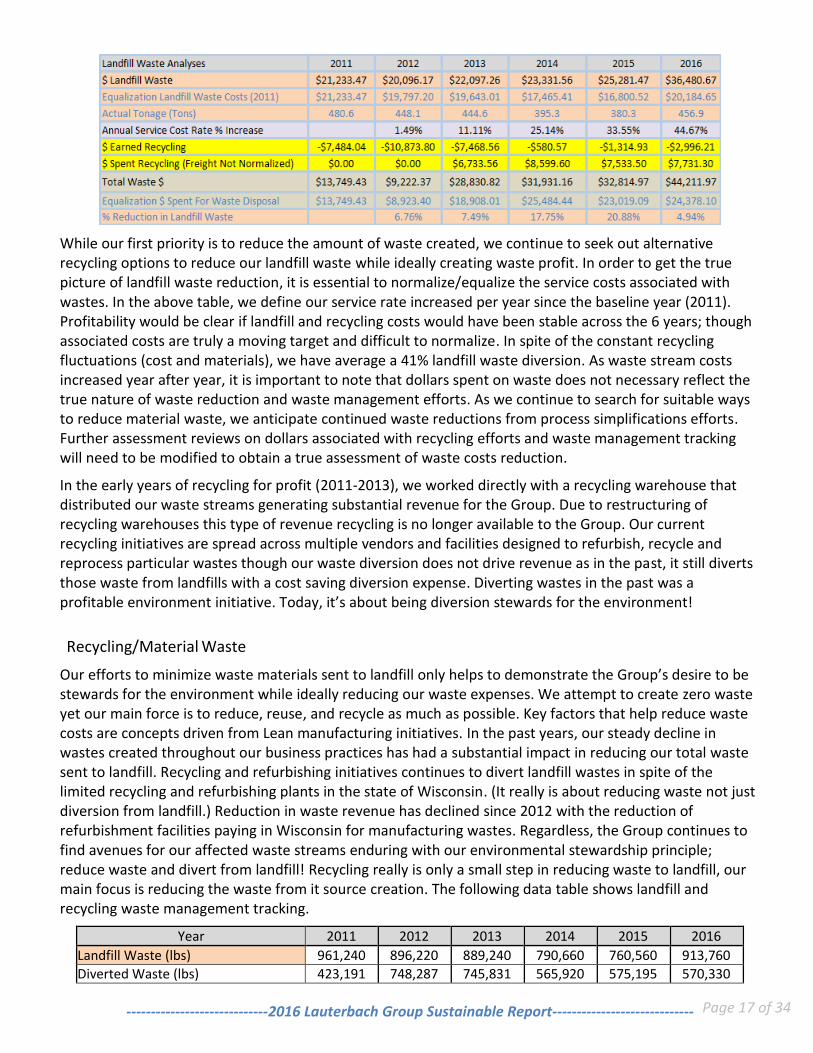
Pallet Restoration
Pallet restoration is not just about recycling pallets for material reuse, reclaiming pallets, or even reusing/refurbishing pallets; it is all about supplier relationships, right size palletizing with simplified packaging needs, and understanding our client needs. Substantial dollars are saved through reduction in pallet purchases, pallet standardization, and added refurbishment/repair efforts. Our emphasis on reclaiming right size pallets and repairing pallets has led to costs savings through lowering new pallet purchases. 100% all pallets are reclaimed, recycled, or used and zero pallets go to landfill. We understand that being able to reuse incoming pallet for shipment of goods is a critical feature to reducing packaging expenses. Pallets come in a variety of sizes across regions and industries. Therefore, we continue to work closely with our supply chain to match incoming pallet specifications for outgoing client shipment needs. The tables below show the Pallet restoration efforts since conception and cost savings generated.
Year 2011 2012 2013 2014 2015 2016
New Pallet 1806 1804 1600 1000 1100 700
Pallets Reclaimed 4254 5562 5250 4056 4329 4468
$ Savings $29,778 $38,934 $36,750 $28,392 $30,303 $31,276
% Reused ------ 79.65% 82.31% 79.89% 90.88% 92.30%
Recycled 1260 1428 1296 871 1022 876
Pallets Shipped 2660 (July to December) 5867 5638 4039 4934 4770
Pallets Repaired 0 0 25 0 224 217
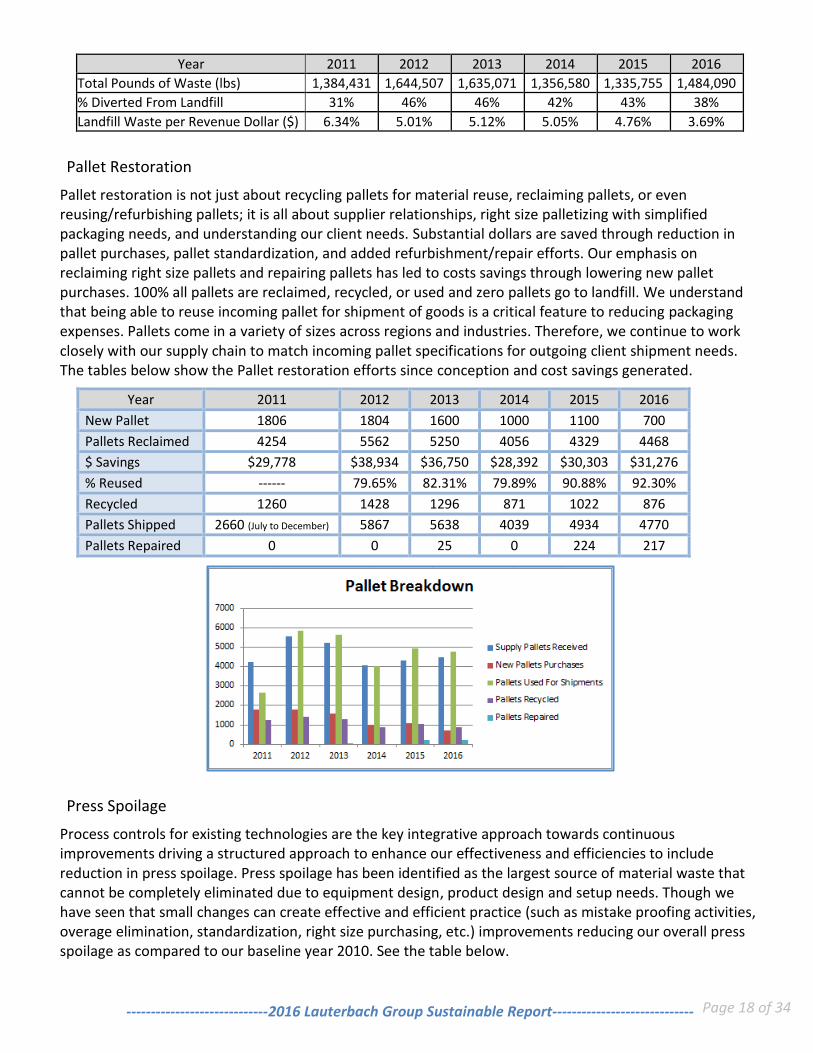
Press Spoilage
Process controls for existing technologies are the key integrative approach towards continuous improvements driving a structured approach to enhance our effectiveness and efficiencies to include reduction in press spoilage. Press spoilage has been identified as the largest source of material waste that cannot be completely eliminated due to equipment design, product design and setup needs. Though we have seen that small changes can create effective and efficient practice (such as mistake proofing activities, overage elimination, standardization, right size purchasing, etc.) improvements reducing our overall press spoilage as compared to our baseline year 2010. See the table below.
Page 19 of 34 -----------------------------2016 Lauterbach Group Sustainable Report-----------------------------
Year 2010 2011 2012 2013 2014 2015 2016
Press Spoilage Improvement Baseline 28.8 % 36.5% 42.4% 47.1% 58.8% 52.9%
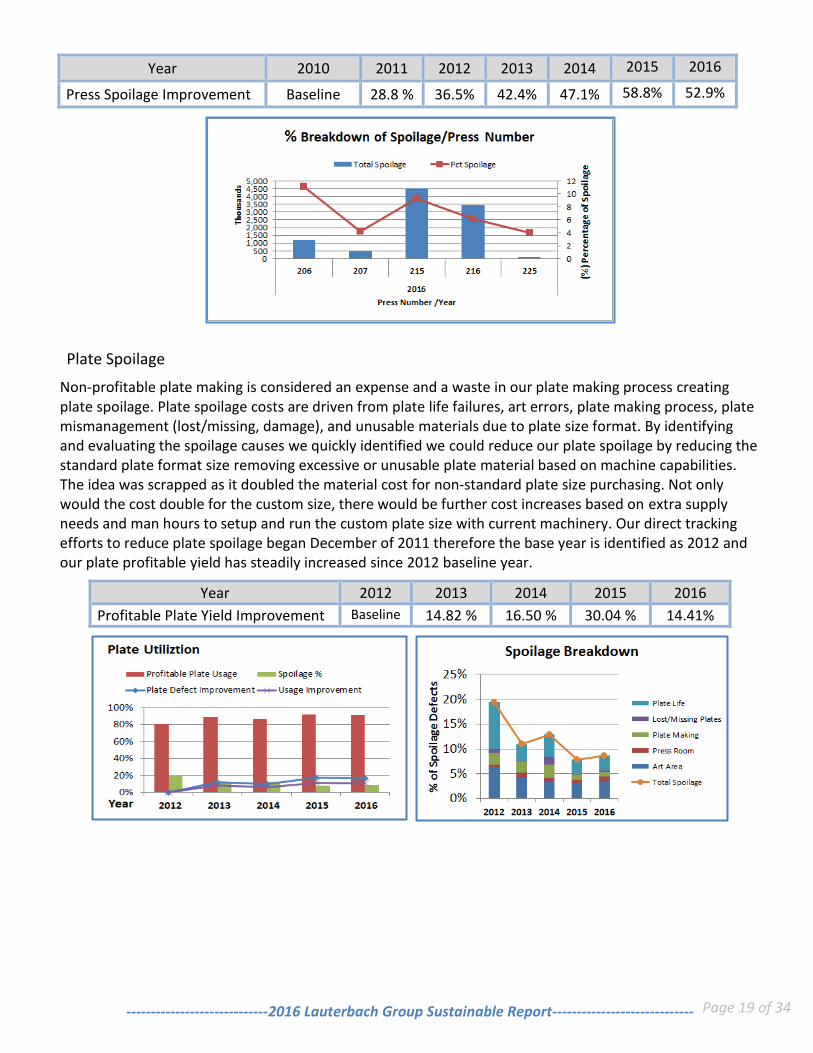
Plate Spoilage
Non-profitable plate making is considered an expense and a waste in our plate making process creating plate spoilage. Plate spoilage costs are driven from plate life failures, art errors, plate making process, plate mismanagement (lost/missing, damage), and unusable materials due to plate size format. By identifying and evaluating the spoilage causes we quickly identified we could reduce our plate spoilage by reducing the standard plate format size removing excessive or unusable plate material based on machine capabilities. The idea was scrapped as it doubled the material cost for non-standard plate size purchasing. Not only would the cost double for the custom size, there would be further cost increases based on extra supply needs and man hours to setup and run the custom plate size with current machinery. Our direct tracking efforts to reduce plate spoilage began December of 2011 therefore the base year is identified as 2012 and our plate profitable yield has steadily increased since 2012 baseline year.
Year 2012 2013 2014 2015 2016
Profitable Plate Yield Improvement Baseline 14.82 % 16.50 % 30.04 % 14.41%
Page 20 of 34 -----------------------------2016 Lauterbach Group Sustainable Report-----------------------------
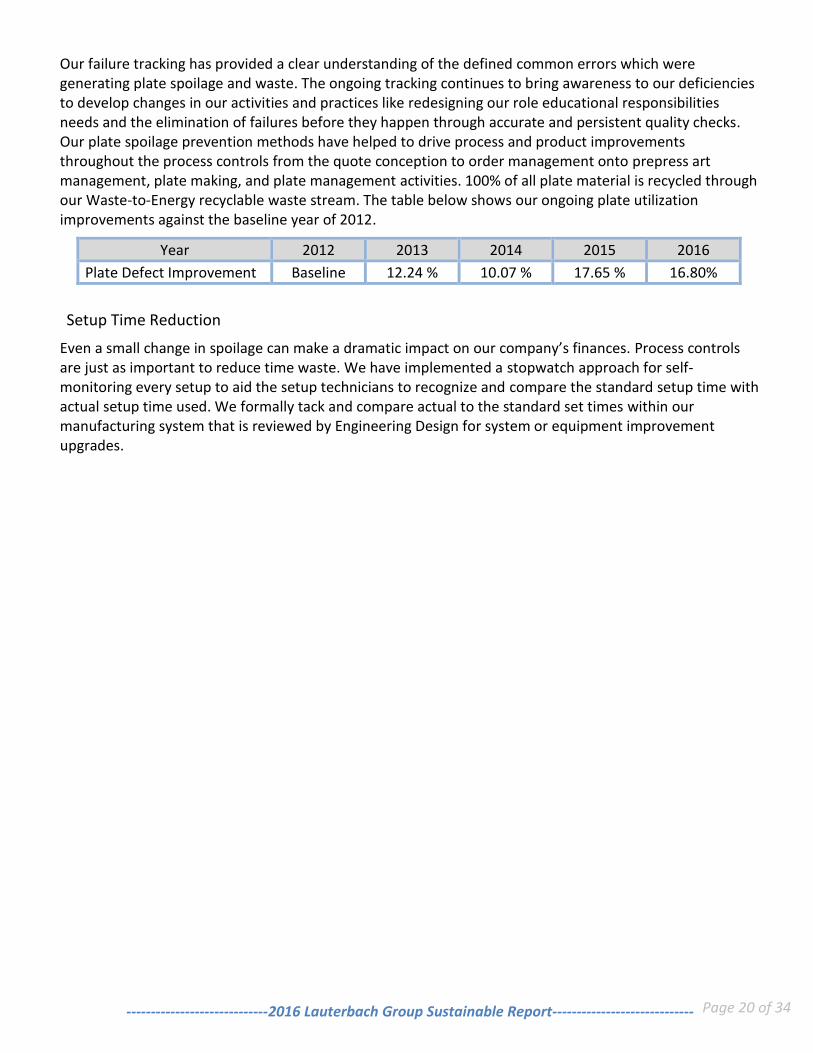
Our failure tracking has provided a clear understanding of the defined common errors which were generating plate spoilage and waste. The ongoing tracking continues to bring awareness to our deficiencies to develop changes in our activities and practices like redesigning our role educational responsibilities needs and the elimination of failures before they happen through accurate and persistent quality checks. Our plate spoilage prevention methods have helped to drive process and product improvements throughout the process controls from the quote conception to order management onto prepress art management, plate making, and plate management activities. 100% of all plate material is recycled through our Waste-to-Energy recyclable waste stream. The table below shows our ongoing plate utilization improvements against the baseline year of 2012.
Year 2012 2013 2014 2015 2016
Plate Defect Improvement Baseline 12.24 % 10.07 % 17.65 % 16.80%
Setup Time Reduction
Even a small change in spoilage can make a dramatic impact on our company’s finances. Process controls are just as important to reduce time waste. We have implemented a stopwatch approach for self-monitoring every setup to aid the setup technicians to recognize and compare the standard setup time with actual setup time used. We formally tack and compare actual to the standard set times within our manufacturing system that is reviewed by Engineering Design for system or equipment improvement upgrades.
Page 21 of 34 -----------------------------2016 Lauterbach Group Sustainable Report-----------------------------
Environmental Sustainability Lauterbach Group is dedicated to environmental stewardship through lean concepts and methods to reduce, reuse, and recycle, while creating transparency through making information reviewable, retrievable, and readily available. Our productivity management system continues to look for methods and avenues to provide an exceptional experience with our members, clients, and community with an ongoing directive to align with environmentally friendly strategies. We recognize the importance of protecting our world for future generations and have been and continue to strive to be a leader in environmental sustainability. In addition to zero environmental incidents or fines in the history of our company, we have been recognized for our environmental sustainability efforts through multiple awards and certifications. We have received environmental excellence awards and recognitions from Tag and Label Manufactures Institute (TLMI), Flexographic Technical Association (FTA); certification recognition from Sustainable Forestry Initiative (SFI), Forest Stewardship Council (FSC), and the U.S. Green Building Council. Regulatory compliances are seen as a baseline structure for doing good business. Our belief is not about minimal requirements we strive for an exceptional client experience and as a result have been recognized by Wisconsin Department of Natural Resources as a company that not only surpasses basic requirements but a company that excels environmental excellence though our acceptance into the Green Tier program of Wisconsin.
A common misconception exists that environmental efforts only help the environment and are costly creating a loss in profitable dollars. This is a misconception! Landfill waste reduction helps generate profit through reduction in expenses detailed in the economic sustainable section above. Environment sustainability for the Group is really about embracing the need to reduce our demand on natural resource needs and wastes within our business practices. Environmental stewardship is practices throughout the business model to include the building infrastructure and landscaping demands. Energy, water, air, protection and security are common methods of protecting the environment. Through these basic environmental concepts, we have adopted practices that have reduced these natural resource use while developing and promoting process efficiencies, sourcing and procurement activities, and resource management. We recognize that we cannot achieve sustainability or profitability without practicing lean concepts in all our business needs and activities.
ENVIRONMENTAL ENDORSEMENT
The Flexographic Technical Association (FTA) is a world‘s leading professional society dedicated to the advancement of the flexographic industry. As active members we participate in many of the educational, networking, exchange forums, technical and sustainable support structures, award programs, certification programs, and subcommittees.
Tag and Label Manufactures Institute, Inc. (TLMI) is a premier association for the North American narrow web industry. TLMI association provides networking, business solutions, educational resources, award
recognition, and the L.I.F.E. certification to assist and enhance the narrow web tag, label, and packaging industries. We support and participate in associated online educational, hosted webinars, TLMI LIFE subcommittee, and supported conferences driving continuous improvements activities within our industry.
Page 22 of 34 -----------------------------2016 Lauterbach Group Sustainable Report-----------------------------
Printing Industries of America, (PIA) is dedicated to the advancement of the graphic communications industry worldwide with in-depth, quality research, reports, products, services, and more. Being a member of PIA helps drive sector education and professional training in our industry. PIA also helps drive and promote networking and camaraderie within our professional trade associations. It provides wider access to industry information; helps drive a common governmental voice that adds to resource availability, cost reductions, and bulk ordering, participate and support conferences driving continuous improvements activities within our industry
LEED Green Building
We moved into our new facility and community in 2009. The Group’s facility has been recognized as LEED Sliver certified by the U.S. Green Building Council (USGBC) for efforts to reduce natural resource needs and reduce our impact on the environment. LEED is an acronym for Leadership in Energy & Environment Design. Our focus was to design a state of the art facility that would reduce our overhead business costs like gas, electricity, water, lighting, transportation needs, etc. The byproduct of those desires truly helped to set the stage for our business sustainable practices. We continue to review methods to reduce, reuse, recycle, and reclaim to reduce our impact on the environment, enhance our economic prosperity, and become a transparent business.
L.I.F.E.
Label Initiative for the Environment was developed by one of TLMI subcommittees in order to assist members with finding cost effective ways to reduce their company’s environmental
footprint. L.I.F.E.Program was designed to offer an auditable environmental certification tailored specifically to the narrow web printing and converting industry. The environmental program provides a flexible, robust framework for continuous environmental improvements.
We are L.I.F.E. certified since December of 2012. L.I.F.E. and is third party audited by NSF
an internationally recognized auditing registrar. L.I.F.E.is a recognized environmental management practice by Wisconsin Department of Natural Resources (DNR)
Green Tier
Wisconsin Department of Natural Resources (DNR) recognizes Wisconsin businesses that surpass regulatory compliances with the opportunity to participation in the Green Tier 1 or 2 programs. The Lauterbach Group is a Green Tier 1 program participate demonstrating our commitment and enhanced environmental innovations and our proactive management group As participates we have demonstrated that our defined Environmental Management System (EMS) is functionally equivalent to ISO-14001 environmental certification recognized internationally.
WATER
Water conservation is one of the most important environmental efforts in today’s world. The cleanliness and amount of water available continues to decrease but here at Lauterbach Group, we make a concerted effort to make sure we conserve our water as much as possible. Low dual flush toilets and motion detection bathroom faucets cut down on water usage in the building. Additionally, we use water reduction devices in order to minimize water usage through our production activities.
Page 23 of 34 -----------------------------2016 Lauterbach Group Sustainable Report-----------------------------
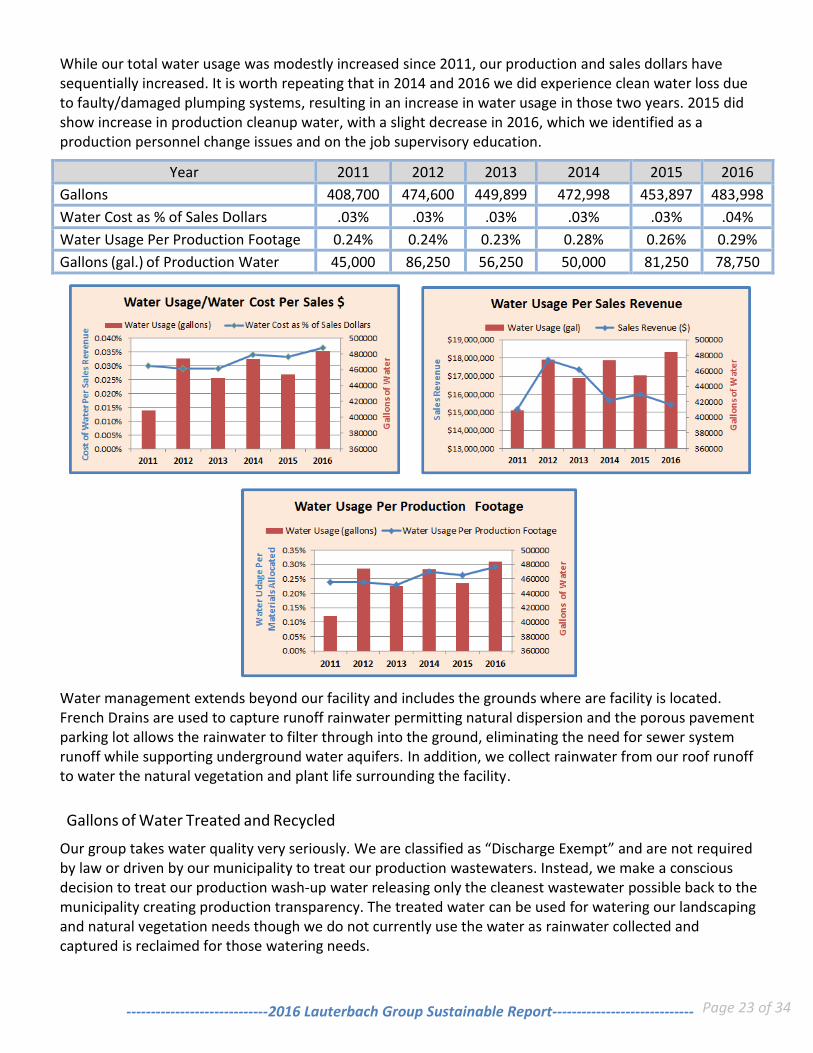
While our total water usage was modestly increased since 2011, our production and sales dollars have sequentially increased. It is worth repeating that in 2014 and 2016 we did experience clean water loss due to faulty/damaged plumping systems, resulting in an increase in water usage in those two years. 2015 did show increase in production cleanup water, with a slight decrease in 2016, which we identified as a production personnel change issues and on the job supervisory education.
Year 2011 2012 2013 2014 2015 2016
Gallons 408,700 474,600 449,899 472,998 453,897 483,998
Water Cost as % of Sales Dollars .03% .03% .03% .03% .03% .04%
Water Usage Per Production Footage 0.24% 0.24% 0.23% 0.28% 0.26% 0.29%
Gallons (gal.) of Production Water 45,000 86,250 56,250 50,000 81,250 78,750
Water management extends beyond our facility and includes the grounds where are facility is located. French Drains are used to capture runoff rainwater permitting natural dispersion and the porous pavement parking lot allows the rainwater to filter through into the ground, eliminating the need for sewer system runoff while supporting underground water aquifers. In addition, we collect rainwater from our roof runoff to water the natural vegetation and plant life surrounding the facility.
Gallons of Water Treated and Recycled
Our group takes water quality very seriously. We are classified as “Discharge Exempt” and are not required by law or driven by our municipality to treat our production wastewaters. Instead, we make a conscious decision to treat our production wash-up water releasing only the cleanest wastewater possible back to the municipality creating production transparency. The treated water can be used for watering our landscaping and natural vegetation needs though we do not currently use the water as rainwater collected and captured is reclaimed for those watering needs.
Page 24 of 34 -----------------------------2016 Lauterbach Group Sustainable Report-----------------------------
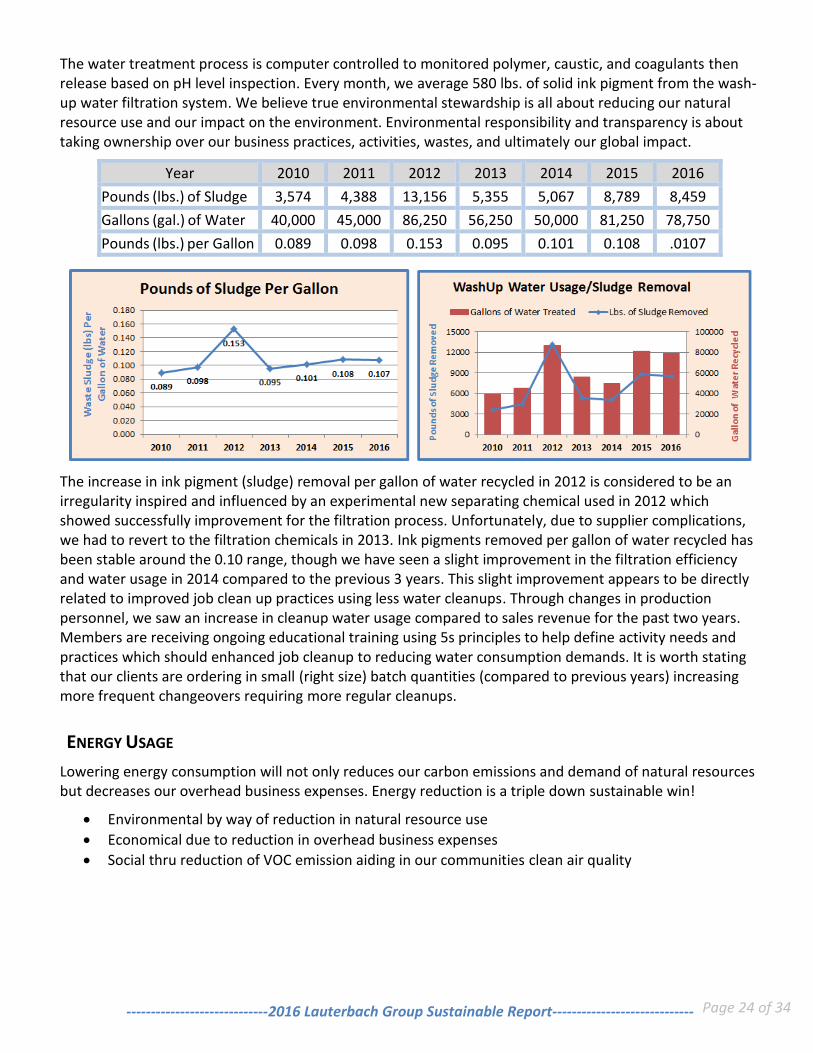
The water treatment process is computer controlled to monitored polymer, caustic, and coagulants then release based on pH level inspection. Every month, we average 580 lbs. of solid ink pigment from the wash-up water filtration system. We believe true environmental stewardship is all about reducing our natural resource use and our impact on the environment. Environmental responsibility and transparency is about taking ownership over our business practices, activities, wastes, and ultimately our global impact.
Year 2010 2011 2012 2013 2014 2015 2016
Pounds (lbs.) of Sludge 3,574 4,388 13,156 5,355 5,067 8,789 8,459
Gallons (gal.) of Water 40,000 45,000 86,250 56,250 50,000 81,250 78,750
Pounds (lbs.) per Gallon 0.089 0.098 0.153 0.095 0.101 0.108 .0107
The increase in ink pigment (sludge) removal per gallon of water recycled in 2012 is considered to be an irregularity inspired and influenced by an experimental new separating chemical used in 2012 which showed successfully improvement for the filtration process. Unfortunately, due to supplier complications, we had to revert to the filtration chemicals in 2013. Ink pigments removed per gallon of water recycled has been stable around the 0.10 range, though we have seen a slight improvement in the filtration efficiency and water usage in 2014 compared to the previous 3 years. This slight improvement appears to be directly related to improved job clean up practices using less water cleanups. Through changes in production personnel, we saw an increase in cleanup water usage compared to sales revenue for the past two years. Members are receiving ongoing educational training using 5s principles to help define activity needs and practices which should enhanced job cleanup to reducing water consumption demands. It is worth stating that our clients are ordering in small (right size) batch quantities (compared to previous years) increasing more frequent changeovers requiring more regular cleanups.
ENERGY USAGE
Lowering energy consumption will not only reduces our carbon emissions and demand of natural resources but decreases our overhead business expenses. Energy reduction is a triple down sustainable win!
Environmental by way of reduction in natural resource use
Economical due to reduction in overhead business expenses
Social thru reduction of VOC emission aiding in our communities clean air quality
Page 25 of 34 -----------------------------2016 Lauterbach Group Sustainable Report-----------------------------
Lauterbach Group lowers electric usage and costs through lighting conservation system and motion lighting sensors throughout the building. We manage scheduling preferences to ensure that presses are fully scheduled and are not sitting ideal consuming electricity resources during man-hour scheduling. The building design allows for more natural light flow into the building, reducing our need for high intensity light during the day light hours. Instead, we are able to use natural lighting to light the majority of the building during sun-filled days. (Our corporate lighting system automatically adjusted based on the natural lighting available and motion detection systems.) Additionally, we have high bay light systems that are individually controllable allowing us to use less electricity based on scheduling demands. We reclaim our air compressors process heat to heat our shipping and receiving areas reducing the need for any additional heating source.
Renewable
In order to create environmentally favorable outputs, we commit ourselves to using environmentally favorable inputs. We have recommitted our efforts to find ways to utilize and increase our percentage of renewable inputs versus fossil fuel and nonrenewable energies. We use renewable solar power faucets and urinals in our production area bathrooms. We have solar powered clocks and temperature gauges throughout the corporate areas. Truck lifts are battery operated, and every alkaline battery is replaced with a rechargeable battery and are recycled as batteries expire. Rechargeable batteries actually create less battery waste and recycling demands. Currently, WE Energies supplies 3.68 % of renewable electric energies to our facility as a standard. While our renewable energy remains relatively small, we aim to increase this amount as more efficient renewable energy technologies become available.
Electrical (KWH)
Electric costs are a large portion of our total energy usage; even a small reduction can have a very large effect on our bottom line and profitability. The Group has developed an energy policy that defines conservation initiatives for electric usage throughout the facility to include operational practices, networking technologies, purchasing, and office practices. Electrical conservative efforts include:
new technologies,
efficient appliances,
press platforms,
virtual server,
high efficient laptops,
smart phone technologies,
programmable heating, air, and ventilation systems,
auto-adjustable lighting systems,
auto shut down monition detection lighting systems,
independent high bay lighting systems,
renewable energy use,
use of LED (Light Emitting Diodes) and CFL (Compact Florescent Lights) schemes,
no personal radio or space heaters,
nightly shut down practices, etc.
Page 26 of 34 -----------------------------2016 Lauterbach Group Sustainable Report-----------------------------
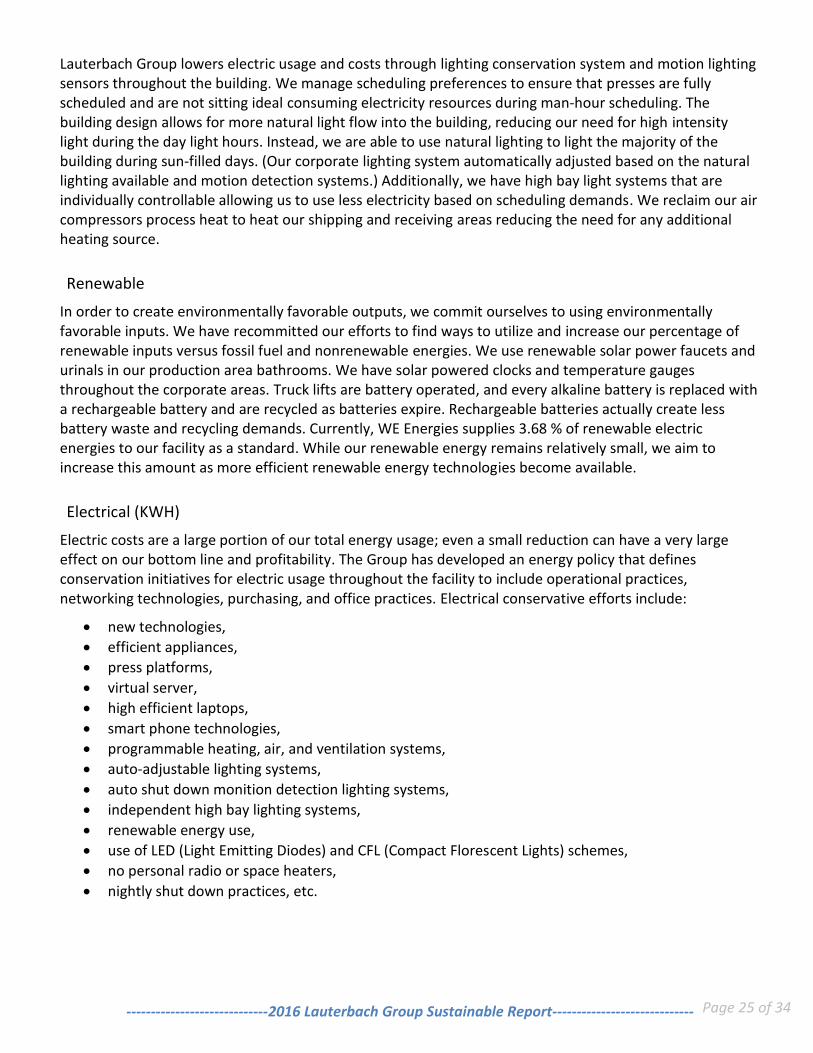
Our total electric was relatively stagnant since 2011 (baseline year), with a slight increase in energy use in 2014 with the addition press platform, than again in 2015 with Delta Converter. However, in 2016 we saw a hug spike in energy usage and identified that the settings had been adjusted causing heating and cooling systems to run simultaneously. This discrepancy went unnoticed and no warnings were issued from the system that should have triggered a formal review. In 2014, we made process activity adjustments generating a 1% reduction in electrical (KWH) usage since the baseline year even with the additions of the press platforms. The graphs below show a snapshot over the past six years. In 2014 and 2015, we added additional press platforms to accommodate our growing business needs, slightly driving our energy usage up per square footage; though we were able to modify daily practices resulting in a reduction in 2015 from the (2011) baseline year. Energy consumption in 2016 is still under review with our third party preventative maintenance-contracting agency.
Year 2011 2012 2013 2014 2015 2016
% KWH Increase -------- -1.71% 0.72% 2.75% -1.11% 9.99%
Total KWH Usage 1,329,900 1,307,100 1,339,500 1,366,500 1,315,200 1,462,800
Average Temperature 47F 51F 44F 43F 47F 48F
Average KWH Cost per Sq Ft $1.71 $1.68 $1.72 $1.75 $1.69 $1.88
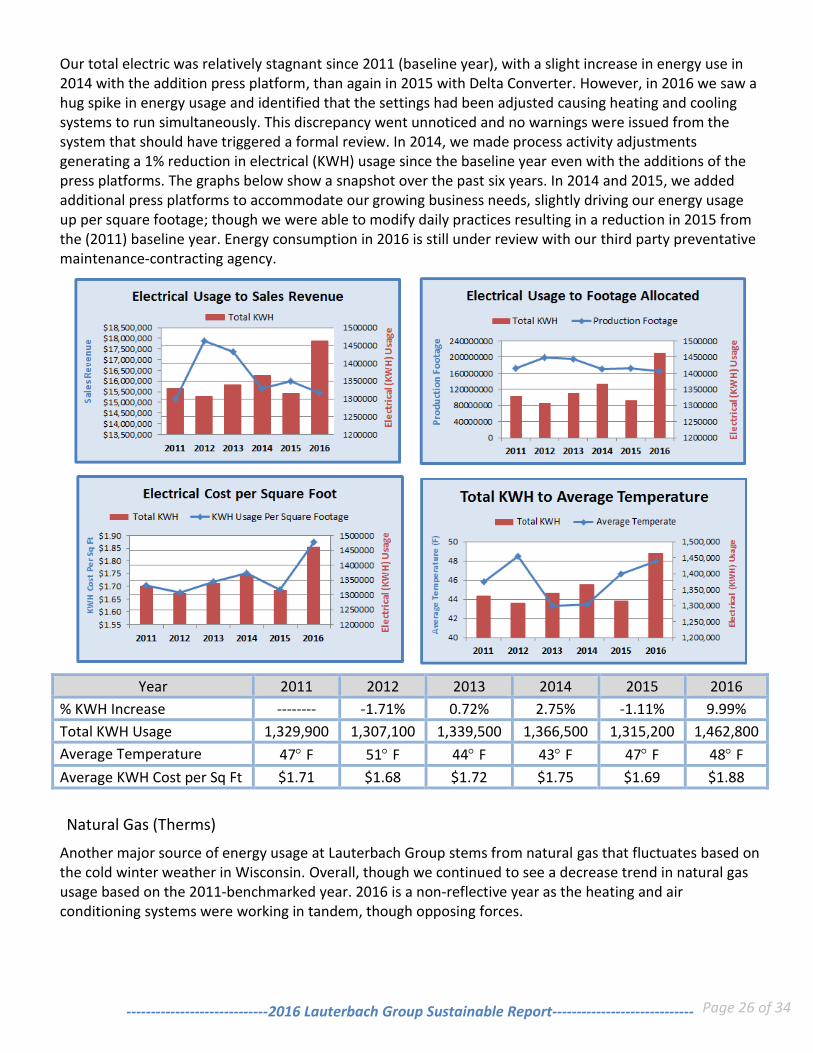
Natural Gas (Therms)
Another major source of energy usage at Lauterbach Group stems from natural gas that fluctuates based on the cold winter weather in Wisconsin. Overall, though we continued to see a decrease trend in natural gas usage based on the 2011-benchmarked year. 2016 is a non-reflective year as the heating and air conditioning systems were working in tandem, though opposing forces.
Page 27 of 34 -----------------------------2016 Lauterbach Group Sustainable Report-----------------------------
Year 2011 2012 2013 2014 2015 2016
Total Therms 19,371 8,874 11,342 17,062 8,018 21,550
% Reduction in Therms Baseline 54.19% 41.45% 11.92% 58.61% -11.25%
Average Temperature 47F 51F 44F 43F 47F 48F
Average Cost per Sq/Ft $0.02 $0.01 $0.01 $0.02 $0.01 $0.02
CLEAN AIR
Air quality refers to the state of the air surrounding us; yet clean air quality refers to clean, clear, and unpolluted air. Air contamination prevention is about reducing or eliminating the waste at the source, modifying production processes, promoting use of non-toxic or less-toxic substances, implementing conservation techniques, and reusing materials rather than putting them into the waste stream. Here at the Lauterbach Group, we have implemented many methods to reduce air contaminations and are considered quantity exempt. Our ongoing effort to reduce unwanted air pollutants includes:
Natural gas use is dedicated to heating the office and operational areas only. We reclaim exhaust heat from the air compressors to heat the shipping and receiving area.
Air emissions of equipment are reduced due to low growing grasses and native vegetation which results in the actual reduction in maintaining landscaping the facility grounds
Only Low to No (VOC) inks are used in our production process
Use of environmental friendly cleaning chemicals and supplies throughout the facility
Office and manufacturing personal aid in the managing daily, weekly, and monthly cleaning needs in their designated areas; quarterly and yearly activities are scheduled and managed by management.
Page 28 of 34 -----------------------------2016 Lauterbach Group Sustainable Report-----------------------------
Rodent and Pest Control is performed in an environmentally and food friendly fashion by a 3rd party environmentally certified contractor. Only live traps are allowed within the facility and chemical sprays are prohibited. Use of bated traps and sprays is minimal on the facilities grounds and is achieved using environmental friendly products.
A climate controlled facility with regulated air flow system to ensure clean air is available for everyone; which is monitored and sustained daily while a 3rd party contracted service performs required preventative maintenance monthly.
Green plants are placed throughout the office area to assist with making our environment attractive and benefit members with a natural air filtration. The bright open workspace motivates members to surround their personal space with plants aiding in air filtration.
Janitorial and custodial services are provided through contractor using green cleaning methods and environmental friendly products to reduce chemical toxins and air pollutants. Custodial services are providing the facility with janitorial services 3 times a week during business hours and off set that for monthly, quarterly, and yearly cleaning needs.
Staff is to consume food in the cafeteria and member’s food must be stored in a closed container or sealable bag. Unconsumed food cannot be stored in desks and only items in their original closed container are permitted in desks. Everyone is banned from eating in the production area and office personnel are limited to no-odor foods.
Lauterbach Group, Inc. has established a tobacco-free campus for all group members, clients, contractors and visitors that apply directly to the facility, grounds and company owned or leased vehicles as well as our neighbors surrounding properties.
Our business reported our air emissions for many years in accordance with standard regulatory reporting procedures disclosing our environmental footprint, greenhouse gas and contaminated emissions. Within the last few years, we are no longer required by the state to report air emissions data; tracking is performed on-site. Our air emissions are so low that is it accurate to state our emissions are low to none.
Carbon Footprint
Carbon footprint has become a hot topic among industries and a measure of a company’s environmental success and impact. Our group not only cares about how our actions affect ourselves, but also the community and world around us. Due to our company’s small size, our carbon footprint data is limited making it difficult to obtain complete data. We believe the principle use of reduce, reuse, and recycle helps keeps the focus on reduction of supplies, consumption of natural resource, waste management while utilizing environmentally friendly chemicals and practices to ultimately reduce our carbon footprint as a byproduct or offshoot of those activities.
Yearly CO2 Emissions 2011 2012 2013 2014 2015 2016
Natural Gas (Metric Tons) 103 47 60 91 43 114
Electricity (Metric Tons) 571,850 552,410 553,752 606,932 556,229 687,957
Yearly VOC Emissions 2011 2012 2013 2014 2015 2016
Ink Consumption (lbs) 3903 4500 4200 3856 3902 3304
Forklift Propane (lbs) --- --- 287 349 403 411
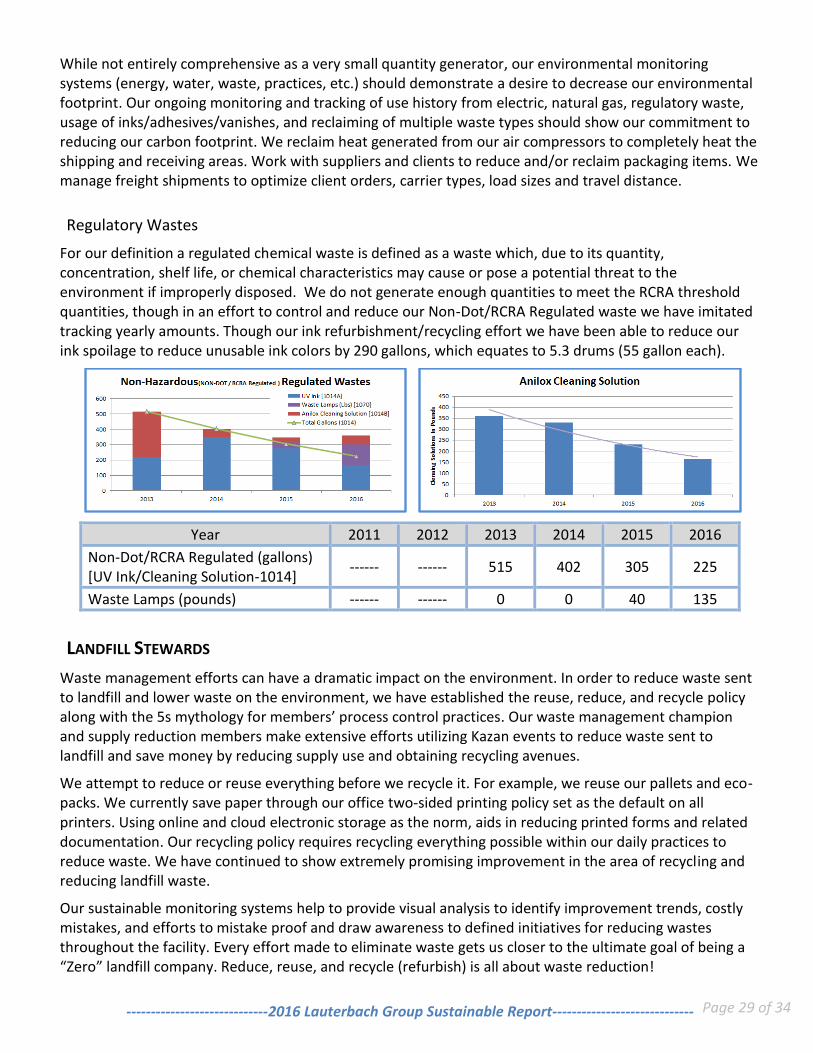
Page 29 of 34 -----------------------------2016 Lauterbach Group Sustainable Report-----------------------------
While not entirely comprehensive as a very small quantity generator, our environmental monitoring systems (energy, water, waste, practices, etc.) should demonstrate a desire to decrease our environmental footprint. Our ongoing monitoring and tracking of use history from electric, natural gas, regulatory waste, usage of inks/adhesives/vanishes, and reclaiming of multiple waste types should show our commitment to reducing our carbon footprint. We reclaim heat generated from our air compressors to completely heat the shipping and receiving areas. Work with suppliers and clients to reduce and/or reclaim packaging items. We manage freight shipments to optimize client orders, carrier types, load sizes and travel distance.
Regulatory Wastes
For our definition a regulated chemical waste is defined as a waste which, due to its quantity, concentration, shelf life, or chemical characteristics may cause or pose a potential threat to the environment if improperly disposed. We do not generate enough quantities to meet the RCRA threshold quantities, though in an effort to control and reduce our Non-Dot/RCRA Regulated waste we have imitated tracking yearly amounts. Though our ink refurbishment/recycling effort we have been able to reduce our ink spoilage to reduce unusable ink colors by 290 gallons, which equates to 5.3 drums (55 gallon each).
Year 2011 2012 2013 2014 2015 2016
Non-Dot/RCRA Regulated (gallons) [UV Ink/Cleaning Solution-1014]
------ ------ 515 402 305 225
Waste Lamps (pounds) ------ ------ 0 0 40 135
LANDFILL STEWARDS
Waste management efforts can have a dramatic impact on the environment. In order to reduce waste sent to landfill and lower waste on the environment, we have established the reuse, reduce, and recycle policy along with the 5s mythology for members’ process control practices. Our waste management champion and supply reduction members make extensive efforts utilizing Kazan events to reduce waste sent to landfill and save money by reducing supply use and obtaining recycling avenues.
We attempt to reduce or reuse everything before we recycle it. For example, we reuse our pallets and eco-packs. We currently save paper through our office two-sided printing policy set as the default on all printers. Using online and cloud electronic storage as the norm, aids in reducing printed forms and related documentation. Our recycling policy requires recycling everything possible within our daily practices to reduce waste. We have continued to show extremely promising improvement in the area of recycling and reducing landfill waste.
Our sustainable monitoring systems help to provide visual analysis to identify improvement trends, costly mistakes, and efforts to mistake proof and draw awareness to defined initiatives for reducing wastes throughout the facility. Every effort made to eliminate waste gets us closer to the ultimate goal of being a “Zero” landfill company. Reduce, reuse, and recycle (refurbish) is all about waste reduction!
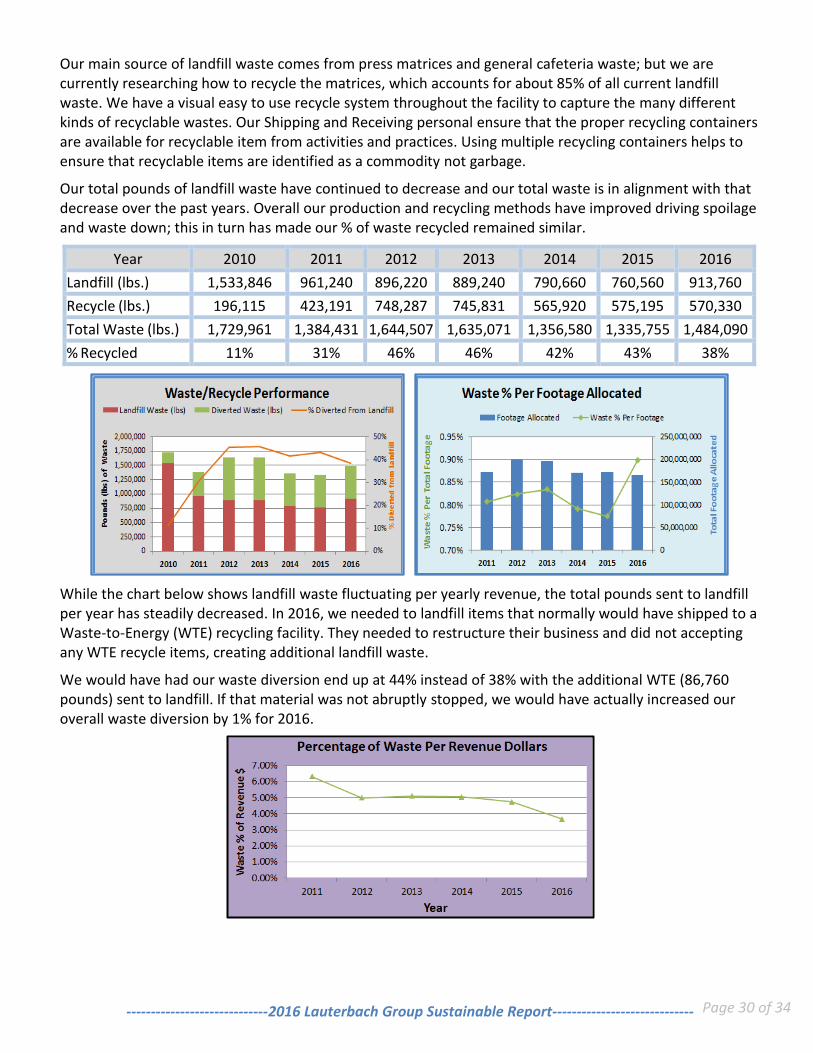
Page 30 of 34 -----------------------------2016 Lauterbach Group Sustainable Report-----------------------------
Our main source of landfill waste comes from press matrices and general cafeteria waste; but we are currently researching how to recycle the matrices, which accounts for about 85% of all current landfill waste. We have a visual easy to use recycle system throughout the facility to capture the many different kinds of recyclable wastes. Our Shipping and Receiving personal ensure that the proper recycling containers are available for recyclable item from activities and practices. Using multiple recycling containers helps to ensure that recyclable items are identified as a commodity not garbage.
Our total pounds of landfill waste have continued to decrease and our total waste is in alignment with that decrease over the past years. Overall our production and recycling methods have improved driving spoilage and waste down; this in turn has made our % of waste recycled remained similar.
Year 2010 2011 2012 2013 2014 2015 2016
Landfill (lbs.) 1,533,846 961,240 896,220 889,240 790,660 760,560 913,760
Recycle (lbs.) 196,115 423,191 748,287 745,831 565,920 575,195 570,330
Total Waste (lbs.) 1,729,961 1,384,431 1,644,507 1,635,071 1,356,580 1,335,755 1,484,090
% Recycled 11% 31% 46% 46% 42% 43% 38%
While the chart below shows landfill waste fluctuating per yearly revenue, the total pounds sent to landfill per year has steadily decreased. In 2016, we needed to landfill items that normally would have shipped to a Waste-to-Energy (WTE) recycling facility. They needed to restructure their business and did not accepting any WTE recycle items, creating additional landfill waste.
We would have had our waste diversion end up at 44% instead of 38% with the additional WTE (86,760 pounds) sent to landfill. If that material was not abruptly stopped, we would have actually increased our overall waste diversion by 1% for 2016.
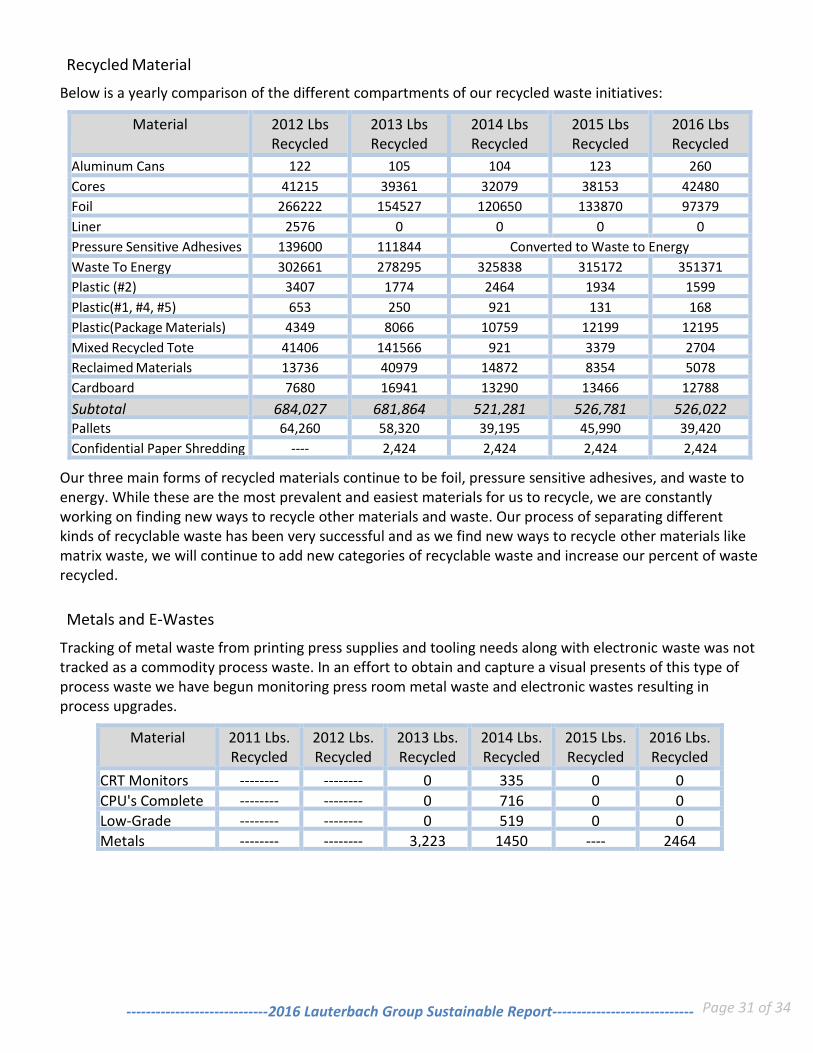
Page 31 of 34 -----------------------------2016 Lauterbach Group Sustainable Report-----------------------------
Recycled Material
Below is a yearly comparison of the different compartments of our recycled waste initiatives:
Material 2012 Lbs Recycled
2013 Lbs Recycled
2014 Lbs Recycled
2015 Lbs Recycled
2016 Lbs Recycled
Aluminum Cans 122 105 104 123 260
Cores 41215 39361 32079 38153 42480
Foil 266222 154527 120650 133870 97379
Liner 2576 0 0 0 0
Pressure Sensitive Adhesives 139600 111844 Converted to Waste to Energy
Waste To Energy 302661 278295 325838 315172 351371
Plastic (#2) 3407 1774 2464 1934 1599
Plastic(#1, #4, #5) 653 250 921 131 168
Plastic(Package Materials) 4349 8066 10759 12199 12195
Mixed Recycled Tote 41406 141566 921 3379 2704
Reclaimed Materials 13736 40979 14872 8354 5078
Cardboard 7680 16941 13290 13466 12788
Subtotal 684,027 681,864 521,281 526,781 526,022 Pallets 64,260 58,320 39,195 45,990 39,420
Confidential Paper Shredding ---- 2,424 2,424 2,424 2,424
Our three main forms of recycled materials continue to be foil, pressure sensitive adhesives, and waste to energy. While these are the most prevalent and easiest materials for us to recycle, we are constantly working on finding new ways to recycle other materials and waste. Our process of separating different kinds of recyclable waste has been very successful and as we find new ways to recycle other materials like matrix waste, we will continue to add new categories of recyclable waste and increase our percent of waste recycled.
Metals and E-Wastes
Tracking of metal waste from printing press supplies and tooling needs along with electronic waste was not tracked as a commodity process waste. In an effort to obtain and capture a visual presents of this type of process waste we have begun monitoring press room metal waste and electronic wastes resulting in process upgrades.
Material 2011 Lbs. Recycled
2012 Lbs. Recycled
2013 Lbs. Recycled
2014 Lbs. Recycled
2015 Lbs. Recycled
2016 Lbs. Recycled
CRT Monitors -------- -------- 0 335 0 0
CPU's Complete -------- -------- 0 716 0 0
Low-Grade -------- -------- 0 519 0 0
Metals -------- -------- 3,223 1450 ---- 2464
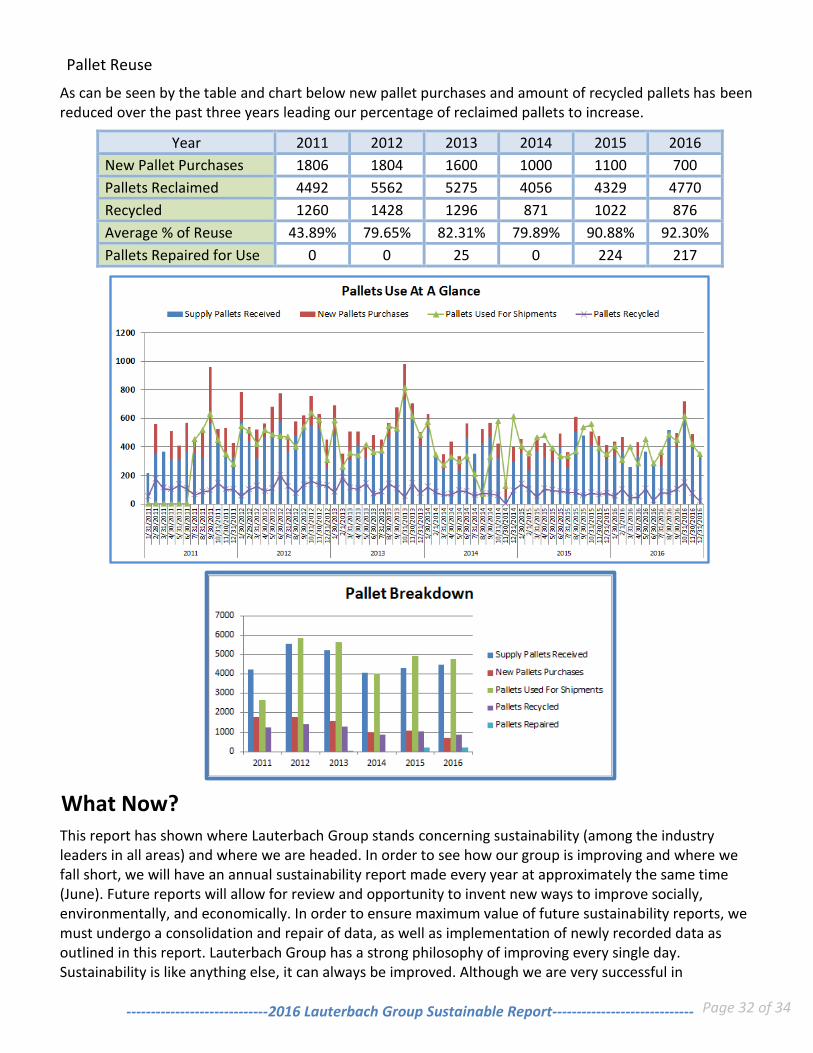
Page 32 of 34 -----------------------------2016 Lauterbach Group Sustainable Report-----------------------------
Pallet Reuse
As can be seen by the table and chart below new pallet purchases and amount of recycled pallets has been reduced over the past three years leading our percentage of reclaimed pallets to increase.
Year 2011 2012 2013 2014 2015 2016
New Pallet Purchases 1806 1804 1600 1000 1100 700
Pallets Reclaimed 4492 5562 5275 4056 4329 4770
Recycled 1260 1428 1296 871 1022 876
Average % of Reuse 43.89% 79.65% 82.31% 79.89% 90.88% 92.30%
Pallets Repaired for Use 0 0 25 0 224 217
What Now? This report has shown where Lauterbach Group stands concerning sustainability (among the industry leaders in all areas) and where we are headed. In order to see how our group is improving and where we fall short, we will have an annual sustainability report made every year at approximately the same time (June). Future reports will allow for review and opportunity to invent new ways to improve socially, environmentally, and economically. In order to ensure maximum value of future sustainability reports, we must undergo a consolidation and repair of data, as well as implementation of newly recorded data as outlined in this report. Lauterbach Group has a strong philosophy of improving every single day. Sustainability is like anything else, it can always be improved. Although we are very successful in
Page 33 of 34 -----------------------------2016 Lauterbach Group Sustainable Report-----------------------------
sustainability, we are still able to improve and we strive for improvement in sustainability socially, environmentally, and economically.
2017 Goals 1. Increase % Of Waste Recycled 2. Reduce Total Water Usage 3. Reduce Production Clean-Up Water Usage 4. Increase Average Reuse Of Pallets By 2%
5. Simplify Plate Utilization Tracking 6. Increase Plate Usability by 3% 7. Improve Policies And Practices Awareness By 5% 8. Develop/Align A New Environmental Sustainable Goal(s) With One Key Supplier 9. Members to Complete 24 Individual Educational Events (Safety, Sustainability, Productivity) 10. Zero Injuries With Zero Loss Time Incidences
2016 Year-End Goal Summary
SOCIAL SUSTAINABILITY GOALS
1. Reduce supply purchases by 2% Page=11 & 12 Year-End Goal Outcome= Achieved; 2 % Reduction in Supply Purchases
2. Institute 1 new community outreach program Page=5 Year-End Goal Outcome= Achieved; CSA local farm growers with LGI membership cost contribution
3. Create member driven sustainability idea system Page=6 Year-End Goal Outcome= Achieved; Online Desktop Suggestion Box
4. Continue as a Zero workplace injury and illness facility Page=9 & 10 Year-End Goal Outcome= Not Realized; There was 2 recorded minor cut injuries in 2016 with no lost time for the past 6 years
ECONOMIC SUSTAINABILITY GOALS
1. Reduce Waste by 10% Page=15 & 16 Year-End Goal Outcome= Actual 4.94% Reduction. It is noteworthy to mention that 43.38 Tons of WTE Materials (normally recycled) was sent to landfill due to recycling facility restructuring. Without that hiccup in 2016 we would have exceeded the defined goal at 13.97% reduction.
2. Reclaim (Repaired)/Refurbished 10% of Recycled Pallets Page=17 Year-End Goal Outcome= Achieved; 24.69% [Repaired 217/Recycled 879]
3. Improve Press Spoilage by 33% Page=17 & 18 Year-End Goal Outcome= Achieved; 52.9 % from Baseline Year
Page 34 of 34 -----------------------------2016 Lauterbach Group Sustainable Report-----------------------------
4. Improve and Consolidate Data (Analysis) Page=11-13 and Throughout Our 2016 Sustainable Report Year-End Goal Outcome= Achieved; 100% Client Are Registered On Omni Mark, On-line Members Educational Training, Sustainable Reporting Consistence from Year To Year
ENVIRONMENTAL SUSTAINABILITY GOALS
1. Increase % of waste recycled to 55% Page=29 Year-End Goal Outcome= Actual 4.94% Reduction actual waste percentage came in at 38%. It is noteworthy to mention that 43.38 Tons of WTE Materials (normally recycled) was sent to landfill due to recycling facility restructuring. Without that hiccup in 2016 we would have seen only 44% waste recycling.
2. Reduce total water usage by 10% Page=21 &22 Year-End Goal Outcome= Actual Total Water Usage Increased by 6%
3. Reduce production clean-up water Page=21-23 Year-End Goal Outcome= Achieved; Production Wash Water Usage was reduced by 3%
4. Get lbs. of sludge above 0.12 per gallon (Goal is Not Realistic) Page=21-23 Year-End Goal Outcome=Actual .0107 per gallon
5. Reduce electric usage by 10% Page=23-26 (24) Year-End Goal Outcome= Actual outcome was a 10% increase instead of decease. Energy consumption increase is under review with our third party contracting agency.
6. Reduce natural gas usage by 10% Page=23-26 (25-26) Year-End Goal Outcome= Actual increase of 11% from the baseline year. Energy consumption increase is under review with our third party contracting agency.
7. Increase average reuse (of pallets by 3% Page=31 Year-End Goal Outcome=Achieved; 9.3% Reuse [4770 Pallets Reused over 4329 pallets in 2015]