Embed Size (px)
Citation preview

General Commands Reference Guide C
TRACE32 Online Help
TRACE32 Directory
TRACE32 Index
TRACE32 Documents ......................................................................................................................
General Commands ......................................................................................................................
General Commands Reference Guide C .................................................................................. 1
History ...................................................................................................................................... 8
CACHE ...................................................................................................................................... 9
CACHE View and modify CPU cache contents 9
CACHE.CLEAN Clean CACHE 9
CACHE.ComPare Compare CACHE with memory 10
CACHE.DUMP Dump CACHE 11
CACHE.FLUSH Clean and invalidate CACHE 12
CACHE.GET Get CACHE contents 13
CACHE.INFO View all information related to an address 13
CACHE.INVALIDATE Invalidate CACHE 13
CACHE.List List CACHE contents 14
CACHE.ListFunc List cached functions 15
CACHE.ListLine tbd. 16
CACHE.ListModule tbd. 16
CACHE.ListVar List cached variables 17
CACHE.LOAD tbd.
CACHE.RELOAD Reload CACHE 18
CACHE.SAVE tbd.
CACHE.UNLOAD tbd.
CACHE.view Display CACHE control register 19
CAnalyzer ................................................................................................................................. 20
CAnalyzer Trace features of Compact Analyzer 20
Trace Method CAnalyzer 21
CAnalyzer - Compact Analyzer specific Trace Commands ................................................. 22
CAnalyzer.<specific_cmds> Overview of CAnalyzer-specific commands 22
CAnalyzer.DecodeMode Define how to decode the received trace data 22
CAnalyzer.PipeWRITE Define a named pipe as trace sink 23
CAnalyzer.SAMPLE Set sample time offset 25
CAnalyzer.ShowFocus Display data eye 26
CAnalyzer.ShowFocusClockEye Show clock eye 29
CAnalyzer.ShowFocusEye Show data eyes 30
General Commands Reference Guide C 1 ©1989-2019 Lauterbach GmbH

CAnalyzer.TERMination Configure parallel trace termination 32
CAnalyzer.TOut Route trigger to PODBUS (CombiProbe/uTrace) 32
CAnalyzer.TraceCLOCK Configure the trace port frequency 33
CAnalyzer.WRITE Define a file as trace sink 34
Generic CAnalyzer Trace Commands ................................................................................... 35
CAnalyzer.ACCESS Define access path to source code for trace decoding 35
CAnalyzer.Arm Arm the trace 35
CAnalyzer.AutoArm Arm automatically 35
CAnalyzer.AutoFocus Calibrate AUTOFOCUS preprocessor 35
CAnalyzer.AutoInit Automatic initialization 35
CAnalyzer.BookMark Set a bookmark in trace listing 35
CAnalyzer.BookMarkToggle Toggles a single trace bookmark 36
CAnalyzer.Chart Display trace contents graphically 36
CAnalyzer.CLOCK Clock to calculate time out of cycle count information 36
CAnalyzer.ComPare Compare trace contents 36
CAnalyzer.CustomTrace Custom trace 36
CAnalyzer.CustomTraceLoad Load a DLL for trace analysis/Unload all DLLs 36
CAnalyzer.DISable Disable the trace 36
CAnalyzer.DRAW Plot trace data against time 37
CAnalyzer.EXPORT Export trace data for processing in other applications 37
CAnalyzer.FILE Load a file into the file trace buffer 37
CAnalyzer.Find Find specified entry in trace 37
CAnalyzer.FindAll Find all specified entries in trace 37
CAnalyzer.FindChange Search for changes in trace flow 37
CAnalyzer.Get Display input level 37
CAnalyzer.GOTO Move cursor to specified trace record 37
CAnalyzer.Init Initialize trace 38
CAnalyzer.List List trace contents 38
CAnalyzer.ListNesting Analyze function nesting 38
CAnalyzer.ListVar List variable recorded to trace 38
CAnalyzer.LOAD Load trace file for offline processing 38
CAnalyzer.Mode Set the trace operation mode 38
CAnalyzer.OFF Switch off 38
CAnalyzer.PipePROTO.load Define a user-supplied DLL as trace sink 38
CAnalyzer.PortFilter Specify utilization of trace memory 39
CAnalyzer.PortType Specify trace interface 39
CAnalyzer.PROfileChart Profile charts 39
CAnalyzer.PROfileSTATistic Statistical analysis in a table versus time 39
CAnalyzer.PROTOcol Protocol analysis 39
CAnalyzer.REF Set reference point for time measurement 39
CAnalyzer.RESet Reset command 39
CAnalyzer.SAVE Save trace for postprocessing in TRACE32 40
CAnalyzer.SelfArm Automatic restart of trace recording 40
General Commands Reference Guide C 2 ©1989-2019 Lauterbach GmbH
CAnalyzer.SIZE Define buffer size 40
CAnalyzer.SnapShot Restart trace capturing once 40
CAnalyzer.SPY Adaptive Stream and Analysis 40
CAnalyzer.state Display trace configuration window 40
CAnalyzer.STATistic Statistic analysis 40
CAnalyzer.STREAMCompression Select compression mode for streaming 41
CAnalyzer.STREAMFILE Specify temporary streaming file path 41
CAnalyzer.STREAMFileLimit Set size limit for streaming file 41
CAnalyzer.STREAMLOAD Load streaming file from disk 41
CAnalyzer.STREAMSAVE Save streaming file to disk 41
CAnalyzer.TDelay Trigger delay 41
CAnalyzer.TestFocus Test trace port recording 41
CAnalyzer.TestFocusClockEye Scan clock eye 42
CAnalyzer.TestFocusEye Check signal integrity 42
CAnalyzer.THreshold Optimize threshold for trace lines 42
CAnalyzer.TraceCONNECT Select on-chip peripheral sink 42
CAnalyzer.TRACK Set tracking record 42
CAnalyzer.TSELect Select trigger source 42
CAnalyzer.View Display single record 42
CAnalyzer.ZERO Align timestamps of trace and timing analyzers 43
CIProbe ..................................................................................................................................... 44
CIProbe Trace with Analog Probe and CombiProbe/uTrace 44
ClipStore .................................................................................................................................. 45
ClipSTOre Store settings to clipboard 45
CLOCK ...................................................................................................................................... 46
CLOCK Display date and time 46
CLOCK.BACKUP Set backup clock frequency 46
CLOCK.DATE Alias for DATE command 47
CLOCK.OFF Disable clock frequency computation 47
CLOCK.ON Enable clock frequency computation 47
CLOCK.OSCillator Set board oscillator frequency 48
CLOCK.Register Display PLL related registers 48
CLOCK.RESet Reset CLOCK command group settings 48
CLOCK.state Display clock frequencies 49
CLOCK.VCOBase Set 'VCOBase' clock frequency 49
CLOCK.VCOBaseERAY Set 'FlexRay VCOBase' clock frequency 50
CMI ............................................................................................................................................ 51
CMI Clock management interface 51
CORE ........................................................................................................................................ 52
CORE Cores in an SMP system 52
Overview CORE 52
CORE.ADD Add core/thread to the SMP system 53
General Commands Reference Guide C 3 ©1989-2019 Lauterbach GmbH
CORE.ASSIGN Assign a set of physical cores/threads to the SMP system 54
CORE.List List information about cores 60
CORE.NUMber Assign a number of cores/threads to the SMP system 61
CORE.ReMove Remove core from the SMP system 62
CORE.select Change currently selected core 62
CORE.SHOWACTIVE Show active/inactive cores in an SMP system 63
Count ........................................................................................................................................ 65
Count Universal counter 65
Overview Count 65
Counter of TRACE32-ICD 65
Counter of TRACE32-ICE 66
Level Display 67
Glitch Detection 67
Display Window 68
Counter of TRACE32-FIRE 69
Level Display 70
Counter Functions 70
Count.AutoInit Automatic counter reset 71
Count.Enable Counter control 71
Count.Gate Gate time 72
Count.GLitch Glitch detector 72
Count.GO Start measurement 74
Count.Init Reset counter 74
Count.Mode Mode selection 75
Count.OUT Forward counter input signal to trigger system/output 77
Count.PROfile Graphic counter display 77
Count.RESet Reset command 79
Count.Select Select input source 80
Count.state State display 83
COVerage ................................................................................................................................. 84
COVerage Trace-based code coverage 84
COVerage.ACCESS Set the memory access mode 85
COVerage.ADD Add trace contents to database 86
COVerage.Delete Modify coverage 86
COVerage.EXPORT Export code coverage information to an XML file 87
COVerage.EXPORT.CBA Export HLL lines in CBA format 88
COVerage.EXPORT.ListFunc Export the HLL functions 89
COVerage.EXPORT.ListGroup Export the groups 92
COVerage.EXPORT.ListLine Export the HLL lines 93
COVerage.EXPORT.ListModule Export the modules 93
COVerage.EXPORT.ListVar Export the HLL variables 94
COVerage.EXPORT.<command>.SOURCE tbd. 95
COVerage.EXPORT.<command>.sYmbol tbd. 96
General Commands Reference Guide C 4 ©1989-2019 Lauterbach GmbH

COVerage.Init Clear coverage database 97
COVerage.List Coverage display 97
COVerage.ListFunc Display code coverage for HLL functions 98
COVerage.ListFunc.SOURCE Filter functions by source file 99
COVerage.ListFunc.sYmbol Filter functions by symbol names 100
COVerage.ListGroup Display coverage for groups 101
COVerage.ListLine Display coverage for HLL lines 102
COVerage.ListLine.SOURCE tbd. 103
COVerage.ListLine.sYmbol Define filter for symbols of HLL lines 103
COVerage.ListModule Display coverage for modules 104
COVerage.ListModule.SOURCE tbd. 105
COVerage.ListModule.sYmbol tbd. 105
COVerage.ListVar Display coverage for variable 106
COVerage.ListVar.SOURCE tbd. 108
COVerage.ListVar.sYmbol tbd. 108
COVerage.LOAD Load coverage database from file 109
COVerage.MAP Map the coverage to a different range 110
COVerage.METHOD Select code coverage method 111
COVerage.Mode Activate code coverage for virtual targets 114
COVerage.OFF Deactivate coverage 114
COVerage.ON Activate coverage 115
COVerage.Option Set coverage options 116
COVerage.Option.BLOCKMode tbd. 116
COVerage.Option.EXLiteralPools Ignore literal pools for coverage 116
COVerage.Option.NoStaticInfo Skip the generation of static flow information 117
COVerage.Option.SourceMetric Set coverage criterion for HLL lines 117
COVerage.Option.StaticInfo Perform code coverage precalculations 122
COVerage.RESet Clear coverage database 123
COVerage.SAVE Save coverage database to file 123
COVerage.Set Coverage modification 123
COVerage.state Configure coverage 124
COVerage.StaticInfo Generate static program flow information 125
COVerage.TreeWalkSETUP Prepare a tree with code coverage symbols 126
COVerage.TreeWalkSETUP.<sub_cmd> tbd. 127
CTS ........................................................................................................................................... 128
CTS Context tracking system (CTS) 128
Trace-based Debugging 129
Full HLL Trace Display 130
Reconstruction of Trace Gaps (TRACE32-ICD) 130
CTS.CACHE CTS cache analysis 130
CTS.CACHE.Allocation Define the cache allocation technique 132
CTS.CACHE.Chart Graphical display of cache analysis 133
Display Cache Hit/Cache Miss/Cache Victim Rate for the Individual Cache 135
General Commands Reference Guide C 5 ©1989-2019 Lauterbach GmbH

Display the Number of Stalls 136
Display the Bus Utilization for the Individual Busses 137
CTS.CACHE.CYcles Define counting method for cache analysis 137
CTS.CACHE.DefineBus Define bus interface 138
CTS.CACHE.L1Architecture Define architecture for L1 cache 139
CTS.CACHE.ListAddress Address based cache analysis 140
CTS.CACHE.ListFunc Function based cache analysis 141
CTS.CACHE.ListLine HLL line based cache analysis 142
CTS.CACHE.ListModules Module based cache analysis 142
CTS.CACHE.ListRequests Display request for a single cache line 143
CTS.CACHE.ListSet Cache set based cache analysis 144
CTS.CACHE.ListVar Variable based cache analysis 144
CTS.CACHE.MMUArchitecture Define MMU architecture for cache control 145
CTS.CACHE.Mode Define memory coherency strategy 146
CTS.CACHE.Replacement Define the replacement strategy 147
CTS.CACHE.RESet Reset settings of CTS cache window 148
CTS.CACHE.SETS Define the number of cache sets 148
CTS.CACHE.Sort Define sorting for all list commands 148
CTS.CACHE.state Display settings of CTS cache analysis 149
CTS.CACHE.Tags Define address mode for cache lines 150
CTS.CACHE.TLBArchitecture Define architecture for the TLB 151
CTS.CACHE.View Display the results for the cache analysis 152
CTS.CACHE.ViewBPU Display statistic for branch prediction unit 156
CTS.CACHE.ViewBus Display statistics for the bus utilization 157
CTS.CACHE.ViewStalls Display statistics for idles/stalls 158
CTS.CACHE.WAYS Define number of cache ways 159
CTS.CACHE.Width Define width of cache line 160
CTS.CAPTURE Copy real memory to the virtual memory for CTS 160
CTS.GOTO Select the specified record for CTS (absolute) 161
CTS.INCremental CTS displays intermediate results while processing 161
CTS.Init Restart CTS processing 162
CTS.List List trace contents 163
CTS.Mode Operation mode 165
CTS.OFF Switch off trace-based debugging 165
CTS.ON Switch on trace-based debugging 165
CTS.PROCESS Process cache analysis 166
CTS.RESet Reset the CTS settings 166
CTS.SELectiveTrace Trace contains selective trace information 167
CTS.SKIP Select the specified record for CTS (relative) 167
CTS.state Display CTS settings 168
CTS.TAKEOVER Take memory/registers reconstructed by CTS over to target 169
CTS.UseCACHE Cache analysis for CTS 170
CTS.UseConst Use constants for the CTS processing 171
General Commands Reference Guide C 6 ©1989-2019 Lauterbach GmbH

CTS.UseMemory Use memory contents for CTS 172
CTS.UseReadCycle Use read cycles for CTS 173
CTS.UseRegister Use the CPU registers for CTS 173
CTS.UseSIM Use instruction set simulator for CTS 174
CTS.UseVM Use the virtual memory contents as initial values for CTS 175
CTS.UseWriteCycle Use write cycles for CTS 176
Usage:
(B) command only available for ICD(E) command only available for ICE(F) command only available for FIRE
General Commands Reference Guide C 7 ©1989-2019 Lauterbach GmbH

General Commands Reference Guide C
Version 06-Nov-2019
History
11-Jul-19 New commands: COVerage.ListFunc.SOURCE, COVerage.ListLine.SOURCE, COVerage.ListModule.SOURCE, and COVerage.ListVar.SOURCE.
11-Jul-19 New commands: COVerage.EXPORT.ListFunc.SOURCE, COVerage.EXPORT.ListLine.SOURCE, COVerage.EXPORT.ListModule.SOURCE, COVerage.EXPORT.ListVar.SOURCE, and COVerage.TreeWalkSETUP.SOURCE.
08-Jul-19 New command: COVerage.Option.BLOCKMode. Added example to command COVerage.EXPORT.CBA.
05-Mar-19 New commands: COVerage.EXPORT.ListFunc.sYmbol, COVerage.EXPORT.ListLine.sYmbol, COVerage.EXPORT.ListModule.sYmbol, and COVerage.EXPORT.ListVar.sYmbol.
05-Mar-19 continued: COVerage.ListFunc.sYmbol, COVerage.ListLine.sYmbol, COVerage.ListModule.sYmbol, and COVerage.ListVar.sYmbol.
17-Aug-18 The introduction for the command group CAnalyzer was completely updated.
13-Aug-18 Added description for the commands CAnalyzer.SAMPLE, CAnalyzer.ShowFocus, CAnalyzer.ShowFocusClockEye, and CAnalyzer.TERMination.
28-Sep-17 Description for command COVerage.METHOD was updated.
General Commands Reference Guide C 8 ©1989-2019 Lauterbach GmbH

CACHE
CACHE View and modify CPU cache contents
Using the CACHE command group, you can view and modify the CPU cache contents. Note that some targets support only a subset of the CACHE.* commands.
When you are trying to execute a command that is not supported for your target, TRACE32 displays the error message “unknown command”.
For targets without accessible CPU cache, the entire CACHE command group is locked.
See also
■ CACHE.CLEAN ■ CACHE.ComPare ■ CACHE.DUMP ■ CACHE.FLUSH ■ CACHE.GET ■ CACHE.INFO ■ CACHE.INVALIDATE ■ CACHE.List ■ CACHE.ListFunc ■ CACHE.ListLine ■ CACHE.ListModule ■ CACHE.ListVar ■ CACHE.RELOAD ■ CACHE.view ❏ CACHE.DC.DIRTY() ❏ CACHE.DC.LRU() ❏ CACHE.DC.VALID()
▲ ’Cache Analysis and Maintenance’ in ’ARMv8-A/-R Debugger’▲ ’CACHE Functions’ in ’General Function Reference’
CACHE.CLEAN Clean CACHE
Writes back modified (dirty) lines to the next cache level or memory. Only the specified cache is affected.
In case the operation is not supported by the CPU, the result will be a “function not implemented” error message.
See also
■ CACHE ■ CACHE.view
Format: CACHE.CLEAN <cache>
<cache>: IC | DC | L2
General Commands Reference Guide C 9 ©1989-2019 Lauterbach GmbH

CACHE.ComPare Compare CACHE with memory
Compares CACHE contents with memory contents.
Example:
See also
■ CACHE ■ CACHE.view
▲ ’Release Information’ in ’Release History’
Format: CACHE.ComPare <cache>
<cache>: IC | DC | L2
CACHE.ComPare DC ; compare contents of the data CACHE with the; memory
General Commands Reference Guide C 10 ©1989-2019 Lauterbach GmbH

CACHE.DUMP Dump CACHE
Displays a hex dump of the CACHE contents. This command extracts useful information from the raw data read from the target and present them in a table in sequential order of the sets and ways. By default, only valid cache lines are presented.
The CACHE.DUMP window typically involves multiple columns, some of which are used to present architecture-specific attributes of the cache lines. In the following table, we describe some commonly presented attributes. Please refer to the design manual of the respective architecture to understand the detailed meaning of these attributes.
Format: CACHE.DUMP <cache> [/<options>]
<cache>: IC | DC | L2
<options>: ALL | RAW | ValidOnly
RAW Dump also the raw data. If the option RAW is used, all cache lines, no matter valid or not, will be displayed.
Attribute Description
Valid • Column Name: “v”.
• Value “V” : valid.
• Value “-” : invalid.
Dirty • Column Name: “d”.
• Value “D” : dirty.
• Value “-” : not dirty.
Secure • Column Name: “sec”.
• Value “s” : secure.
• Value “ns” : non-secure.
B::CACHE.DUMP IC
address set way v l d u 00 04 08 0c address
IC:09C0 001C 00 V - 0 7FBD0734 7C6CE9D6 83A1000C 83C10010 ..\diabp8\func10+0x394
IC:11C0 001C 01 V - 0 93A1000C 93C10010 93E10014 9001001C ..\diabp8\sieve+0x0C
IC:09D0 001D 00 V - 0 83E10014 8001001C 7C0803A6 38210018 ..\diabp8\func10+0x3A4
IC:11D0 001D 01 V - 0 3B800000 3BE00000 2C1F0012 4181001C ..\diabp8\sieve+0x1C
IC:11E0 001E 00 V - 1 3D800001 398CC468 39600001 7D6CF9AE ..\diabp8\sieve+0x2C
IC:09E0 001E 01 V - 1 4E800020 00000000 00000401 80030000 ..\diabp8\func10+0x3B4
IC:11F0 001F 00 V - 1 3BFF0001 4BFFFFE4 3BE00000 2C1F0012 ..\diabp8\sieve+0x3C
IC:09F0 001F 01 V - 1 9421FFE8 7C0802A6 93A1000C 93C10010 ..\diabp8\func10+0x3C4
IC:0A00 0020 00 V - 0 93E10014 9001001C 3BE30000 3BC40000 ..\diabp8\func10+0x3D4
General Commands Reference Guide C 11 ©1989-2019 Lauterbach GmbH

See also
■ CACHE ■ CACHE.view
▲ ’Cache Analysis and Maintenance’ in ’ARMv8-A/-R Debugger’▲ ’Release Information’ in ’Release History’
CACHE.FLUSH Clean and invalidate CACHE
Writes back modified (dirty) lines to the next cache level or memory and invalidate the entire cache. Only the specified cache is affected.
In case the operation is not supported by the CPU, the result will be a “function not implemented” error message.
See also
■ CACHE ■ CACHE.view
▲ ’Cache Analysis and Maintenance’ in ’ARMv8-A/-R Debugger’
Shared • Column Name: “s”.
• Value “S”: shared.
• value “-”: non-shared.
Coherence • Column Name: “c”
• The possible values of this column depend on the cache coherence protocol used by the architecture. E.g, for the MOESI protocol:
- Value “M” : modified.
- Value “O” : owned.
- Value “E” : exclusive.
- Value “S” : shared.
- Value “I” : invalid.
Format: CACHE.FLUSH <cache>
<cache>: IC | DC | L2
Attribute Description
General Commands Reference Guide C 12 ©1989-2019 Lauterbach GmbH

CACHE.GET Get CACHE contents
Synchronizes the TRACE32 software with the target on the entire cache. TRACE32 loads all cache lines for which it does not have up-to-date data. For diagnostic purposes only.
See also
■ CACHE ■ CACHE.view
CACHE.INFO View all information related to an address
Displays all information related to a physical address. If the given address is logical, TRACE32 first translates it into physical. The information contains:
• All cache lines that cache the physical address, including both instruction and data cache.
• All TLB entries that contain translation rules for the physical address.
• All mmu entries that contain translation rules for the physical address (or all pages mapped to the given physical address), including both the task and kernel MMU entries.
See also
■ CACHE ■ CACHE.view
Format: CACHE.GET
Format: CACHE.INFO <address>
General Commands Reference Guide C 13 ©1989-2019 Lauterbach GmbH

CACHE.INVALIDATE Invalidate CACHE
Invalidates the entire cache. Only the specified cache is affected. In case the operation is not supported by the CPU, the result will be a “function not implemented” error message.
See also
■ CACHE ■ CACHE.view
▲ ’Cache Analysis and Maintenance’ in ’ARMv8-A/-R Debugger’
CACHE.List List CACHE contents
Displays a list of the CACHE contents.
See also
■ CACHE ■ CACHE.view
Format: CACHE.INVALIDATE <cache>
<cache>: IC | DC | L2
Format: CACHE.List <cache>
<cache>: IC | DC | L2
B::CACHE.List DCaddress dcache
C:0000C310--0000C32F dirtway 00 \\Diabp8\Global\__predef_fname+0x4CC:0000C330--0000C33F way 00 \\Diabp8\Global\__argvC:0000C340--0000C34F dirtway 01 \\Diabp8\Global\__heap_ptrC:0000C350--0000C35F dirtway 00 \\Diabp8\diabp8\func2\fstatic2C:0000C360--0000C37F dirtway 01 \\Diabp8\Global\vstruct1+0x4C:0000C380--0000C38F dirtway 00 \\Diabp8\Global\vucharC:0000C390--0000C3AF dirtway 01 \\Diabp8\Global\vpushortC:0000C3B0--0000C3CF dirtway 00 \\Diabp8\Global\vppppulongC:0000C3D0--0000C3DF dirtway 01 \\Diabp8\Global\funcptrC:0000C3E0--0000C41F dirtway 00 \\Diabp8\Global\__no_malloc_warningC:0000C420--0000C47F \\Diabp8\Global\freeptr+0x8C:0000C480--0000C50F dirtway 01 \\Diabp8\Global\vtdef2C:0000C510--0000C52F dirtway 00 \\Diabp8\Global\stra1+0x8
General Commands Reference Guide C 14 ©1989-2019 Lauterbach GmbH

CACHE.ListFunc List cached functions
Displays how much of each function is cached.
Detailed information about a function is displayed by double-clicking the function.
See also
■ CACHE ■ CACHE.view
Format: CACHE.ListFunc <cache>
<cache>: IC | DC | L2
B::CACHE.ListFuncaddress valid dirty locked
P:00000030--000012E4 -"diabp8 62.476% 0.000% 0.000%P:00000030--0000004B +'func0 0.000% 0.000% 0.000%P:00000058--0000008B +'func1 0.000% 0.000% 0.000%P:00000098--0000012B +'func2 0.000% 0.000% 0.000%P:00000138--0000019B +'func2a 0.000% 0.000% 0.000%P:000001A8--00000207 +'func2b 0.000% 0.000% 0.000%P:00000214--0000027B +'func2d 0.000% 0.000% 0.000%P:00000288--000002A7 +'func3 0.000% 0.000% 0.000%P:000002B4--00000323 +'func4 53.571% 0.000% 0.000%P:00000330--0000037B +'func5 100.000% 0.000% 0.000%P:00000388--0000058B +'func8 23.255% 0.000% 0.000%
B::D.L P:0x2B4 /ICACHEicache addr/line code label mnemonicway xx 224 {way 01 P:000002B4 9421FFF0 func4: stwu r1,-0x10(r1)way 01 P:000002B8 7C0802A6 mflr r0way 01 P:000002BC 93E1000C stw r31,0x0C(r1)
P:000002C0 90010014 stw r0,0x14(r1)P:000002C4 90810008 stw r4,0x8(r1)P:000002C8 3BE30000 mr r31,r3
225 str.count++;P:000002CC 81810008 lwz r12,0x8(r1)P:000002D0 81610008 lwz r11,0x8(r1)P:000002D4 816B0004 lwz r11,0x4(r11)P:000002D8 396B0001 addi r11,r11,0x1P:000002DC 916C0004 stw r11,0x4(r12)
way 00 227 return str;way 00 P:000002E0 397F0000 mr r11,r31way 00 P:000002E4 81810008 lwz r12,0x8(r1)way 00 P:000002E8 812C0000 lwz r9,0x0(r12)way 00 P:000002EC 814C0004 lwz r10,0x4(r12)
General Commands Reference Guide C 15 ©1989-2019 Lauterbach GmbH

CACHE.ListLine tbd.
tbd.
See also
■ CACHE ■ CACHE.view
CACHE.ListModule tbd.
tbd.
See also
■ CACHE ■ CACHE.view
Format: CACHE.ListLine <cache>
<cache>: IC | DC | L2
Format: CACHE.ListModule <cache>
<cache>: IC | DC | L2
General Commands Reference Guide C 16 ©1989-2019 Lauterbach GmbH
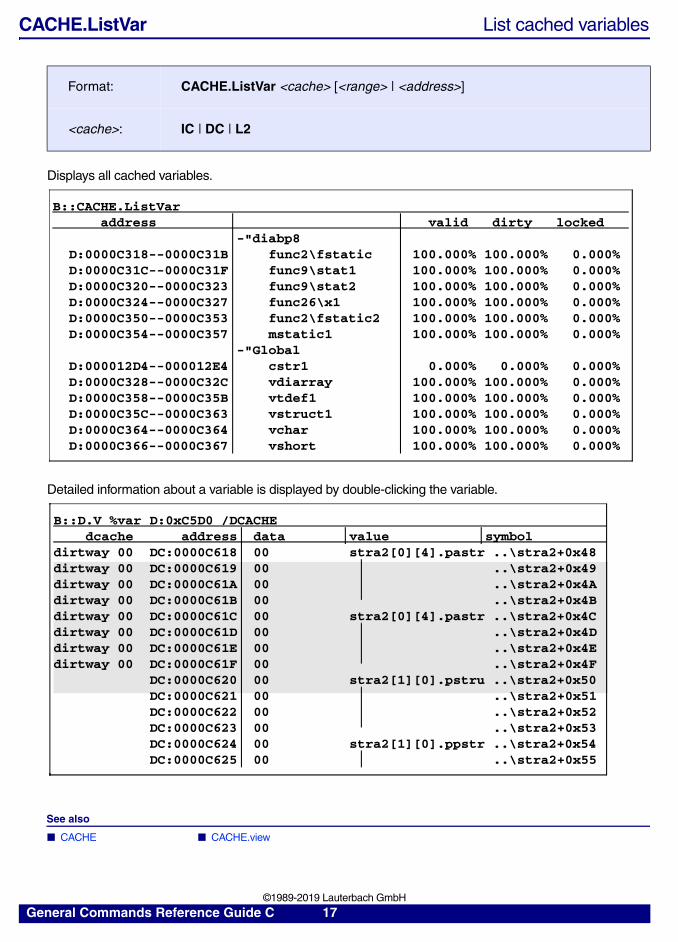
CACHE.ListVar List cached variables
Displays all cached variables.
Detailed information about a variable is displayed by double-clicking the variable.
See also
■ CACHE ■ CACHE.view
Format: CACHE.ListVar <cache> [<range> | <address>]
<cache>: IC | DC | L2
B::CACHE.ListVaraddress valid dirty locked
-"diabp8D:0000C318--0000C31B func2\fstatic 100.000% 100.000% 0.000%D:0000C31C--0000C31F func9\stat1 100.000% 100.000% 0.000%D:0000C320--0000C323 func9\stat2 100.000% 100.000% 0.000%D:0000C324--0000C327 func26\x1 100.000% 100.000% 0.000%D:0000C350--0000C353 func2\fstatic2 100.000% 100.000% 0.000%D:0000C354--0000C357 mstatic1 100.000% 100.000% 0.000%
-"GlobalD:000012D4--000012E4 cstr1 0.000% 0.000% 0.000%D:0000C328--0000C32C vdiarray 100.000% 100.000% 0.000%D:0000C358--0000C35B vtdef1 100.000% 100.000% 0.000%D:0000C35C--0000C363 vstruct1 100.000% 100.000% 0.000%D:0000C364--0000C364 vchar 100.000% 100.000% 0.000%D:0000C366--0000C367 vshort 100.000% 100.000% 0.000%
B::D.V %var D:0xC5D0 /DCACHEdcache address data value symbol
dirtway 00 DC:0000C618 00 stra2[0][4].pastr ..\stra2+0x48dirtway 00 DC:0000C619 00 ..\stra2+0x49dirtway 00 DC:0000C61A 00 ..\stra2+0x4Adirtway 00 DC:0000C61B 00 ..\stra2+0x4Bdirtway 00 DC:0000C61C 00 stra2[0][4].pastr ..\stra2+0x4Cdirtway 00 DC:0000C61D 00 ..\stra2+0x4Ddirtway 00 DC:0000C61E 00 ..\stra2+0x4Edirtway 00 DC:0000C61F 00 ..\stra2+0x4F
DC:0000C620 00 stra2[1][0].pstru ..\stra2+0x50DC:0000C621 00 ..\stra2+0x51DC:0000C622 00 ..\stra2+0x52DC:0000C623 00 ..\stra2+0x53DC:0000C624 00 stra2[1][0].ppstr ..\stra2+0x54DC:0000C625 00 ..\stra2+0x55
General Commands Reference Guide C 17 ©1989-2019 Lauterbach GmbH

CACHE.LOAD tbd.
tbd.
The default extension of the file name is *.cd.
CACHE.RELOAD Reload CACHE
Deletes all cache data that TRACE32 already loaded. Cache data that is needed afterwards will be reloaded from the target. For diagnostic purpose only.
See also
■ CACHE ■ CACHE.view
CACHE.SAVE tbd.
tbd.
The default extension of the file name is *.cd.
CACHE.UNLOAD tbd.
tbd.
Format: CACHE.LOAD
Format: CACHE.RELOAD
Format: CACHE.SAVE
Format: CACHE.UNLOAD
General Commands Reference Guide C 18 ©1989-2019 Lauterbach GmbH
The default extension of the file name is *.cd.
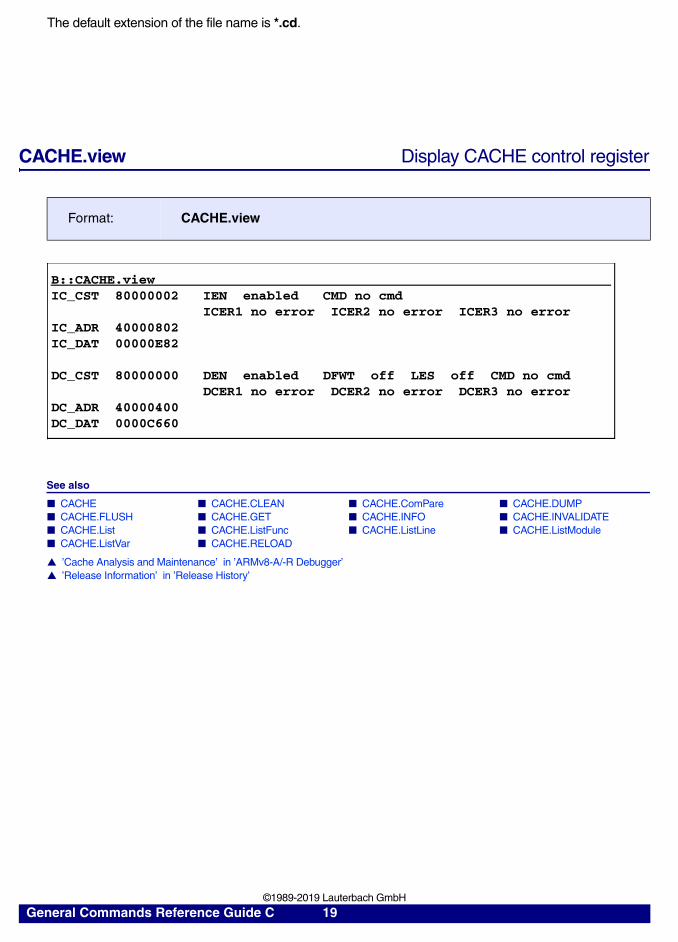
CACHE.view Display CACHE control register
See also
■ CACHE ■ CACHE.CLEAN ■ CACHE.ComPare ■ CACHE.DUMP ■ CACHE.FLUSH ■ CACHE.GET ■ CACHE.INFO ■ CACHE.INVALIDATE ■ CACHE.List ■ CACHE.ListFunc ■ CACHE.ListLine ■ CACHE.ListModule ■ CACHE.ListVar ■ CACHE.RELOAD
▲ ’Cache Analysis and Maintenance’ in ’ARMv8-A/-R Debugger’▲ ’Release Information’ in ’Release History’
Format: CACHE.view
B::CACHE.viewIC_CST 80000002 IEN enabled CMD no cmd
ICER1 no error ICER2 no error ICER3 no errorIC_ADR 40000802IC_DAT 00000E82
DC_CST 80000000 DEN enabled DFWT off LES off CMD no cmdDCER1 no error DCER2 no error DCER3 no error
DC_ADR 40000400DC_DAT 0000C660
General Commands Reference Guide C 19 ©1989-2019 Lauterbach GmbH
CAnalyzer
CAnalyzer Trace features of Compact Analyzer
CAnalyzer is the command group that controls the trace of the following TRACE32 tools:
• TRACE32 CombiProbe
Further information is provided by “CombiProbe for Cortex-M User’s Guide” (combiprobe_cortexm.pdf) or by “Intel® x86/x64 Debugger” (debugger_x86.pdf).
• uTrace
Further information is provided by “uTrace for Cortex-M User’s Guide” (microtrace_cortexm.pdf).
• PowerDebug PRO and ARM Debug Cable
The SWV (Serial Wire Viewer) recording capability of the ARM Debug Cable if it is used together with PowerDebug PRO
See also
■ Trace.METHOD
▲ ’CAnalyzer - Compact Analyzer specific Trace Commands’ in ’General Commands Reference Guide C’▲ ’Generic CAnalyzer Trace Commands’ in ’General Commands Reference Guide C’▲ ’Release Information’ in ’Release History’
General Commands Reference Guide C 20 ©1989-2019 Lauterbach GmbH

Trace Method CAnalyzer
If the TRACE32 development tool is equipped with a Compact Analyzer, the trace method CAnalyzer has to be used.
Implementation of the trace memory
• TRACE32 CombiProbe provides 128 MB of trace memory• uTrace provides 256 MB of trace memory• TRACE32 PowerDebug PRO provides 32 MB of trace memory
Sampling uTraceThe uTrace can record all types of trace information generated by the Cortex-M trace infrastructure.
TRACE32 CombiProbeThe TRACE32 CombiProbe can be used for the following type of trace information:
• Any type of trace information generated by a STM or a comparable trace generation unit.
• All types of trace information generated by the Cortex-M trace infrastructure.
TRACE32 PowerDebug PRO/ARM Debug CableTRACE32 PowerDebug PRO/ARM Debug Cable can record ITM generated trace information exported over SWO.
Influence on the real-time behavior
Trace generation is usually done in real-time. An exception is system trace information generated by code instrumentation.
Fastest sampling rate
uTraceThe max. sampling rate is 200 MBit/s per trace channel if a TRACE32 MIPI34 Whisker is used or 400 MBit/s per trace channel if a TRACE32 MIPI20T-HS Whisker is used.
TRACE32 CombiProbeThe max. sampling rate is 200 MBit/s per trace channel or 400 MBit/s per trace channel if a TRACE32 MIPI20T-HS Whisker for Arm/Cortex is used.
TRACE32 PowerDebug PRO/ARM Debug CableThe max. sampling rate is 100 MHz/s, but TRACE32 Streaming is possible without limitations.
General Commands Reference Guide C 21 ©1989-2019 Lauterbach GmbH

CAnalyzer - Compact Analyzer specific Trace Commands
CAnalyzer.<specific_cmds> Overview of CAnalyzer-specific commands
See also
■ CAnalyzer.SAMPLE ■ CAnalyzer.ShowFocus ■ CAnalyzer.ShowFocusClockEye ■ CAnalyzer.ShowFocusEye ■ CAnalyzer.DecodeMode ■ CAnalyzer.PipeWRITE ■ CAnalyzer.TERMination ■ CAnalyzer.TOut ■ CAnalyzer.TraceCLOCK ■ CAnalyzer.WRITE
▲ ’CAnalyzer’ in ’General Commands Reference Guide C’
CAnalyzer.DecodeMode Define how to decode the received trace data
Default: AUTO.
This Compact Analyzer command can be used to explicitly define how the recorded trace data should be decoded. In general, the CombiProbe will try to use the correct setting automatically, dependent on the CPU selection and enabled debug features (like ITM for example). Nevertheless, it is possible that you explicitly
Format: CAnalyzer.DecodeMode <format>
<format>: AUTOSDTISTPSTP64STPV2STPV2LESWVITM (deprecated) use SWV instead.CSITMCSETMCSSTM
General Commands Reference Guide C 22 ©1989-2019 Lauterbach GmbH

need to specify the trace decoding in cases where the debugger chooses the wrong defaults; for example if you are debugging an ARM core, which implements an ITM and at the same time an STP module and you now need to specify which of the two outputs you are actually recording.
See also
■ CAnalyzer.<specific_cmds>
CAnalyzer.PipeWRITE Define a named pipe as trace sink
This Compact Analyzer command is used to define a Windows named pipe (or Unix named pipe) as trace sink. Up to 8 named pipes can be defined as trace sinks simultaneously.
AUTO Automatically derive settings.The chosen mode depends on SYStem.CPU, the SYStem.CONFIG settings and CAnalyzer.TraceCONNECT.
SDTI System Debug Trace Interface (SDTI) by Texas Instruments.
STP STP protocol (MIPI STPv1, D32 packets).
STP64 STP64 protocol (MIPI STPv1, D64 packets).
STPV2 STPv2 protocol (MIPI STPv2, big endian mode).
STPV2LE STPv2 protocol (MIPI STPv2, little endian mode).
SWV ITM data transferred via Serial Wire Output.
CSITM ITM data transferred via a TPIU continuous mode.The trace ID is taken from the ITM component configuration.
CSETM ETM + optionally ITM data transferred via TPIU continuous mode.The trace IDs are taken from the ETM and ITM component configuration.
CSSTM STM data transferred via TPIU continuous mode.The trace ID is taken from the STM component configuration.
Format: CAnalyzer.PipeWRITE <pipe_name> [/<options>]
<options>: ChannelID <channel_id>MasterID <master_id>XtiMaster DSP | CPU | MCU (XTIv2)XtiMaster DSP | CPU1 | CPU2 (SDTI)Payload
General Commands Reference Guide C 23 ©1989-2019 Lauterbach GmbH

The named pipe has to be created by the receiving application, before you can connect to the named pipe. If the pipe is not already connected to a receiving application, the debugger software will report an error.
If you use this command without specifying a pipe name, all open pipes currently used as trace sinks are closed.
The options are the same as for the CAnalyzer.WRITE command.
See also
■ CAnalyzer.<specific_cmds>
General Commands Reference Guide C 24 ©1989-2019 Lauterbach GmbH

CAnalyzer.SAMPLE Set sample time offset
Use this command to manually configure the sample times of the trace channels. It is typically used to restore values previously stored using the Store... button of the CAnalyzer.ShowFocus window or with the STOre CAnalyzerFocus command.
The availability of this command depends on the plugged hardware. It is only available with either the MIPI20T-HS whisker, or if the SWV capability of the ARM Debug Cable v5 is used together with the PowerDebug PRO.
Examples:
See also
■ CAnalyzer.<specific_cmds>
▲ ’Release Information’ in ’Release History’
Format: CAnalyzer.SAMPLE [<channel>] <time>
<channel>:(parallel)
D0 | D1 | D2 | D3
<channel>:(SWV)
SWO0 | SWO1 | SWO2 | SWO3 | SWO4 | SWO5 | SWO6 | SWO7
<channel> Trace signal to be configuredIf the parameter is omitted, all signals are configured with the <time> setting.
<time>(parallel)
Parameter Type: Float. The value is interpreted as time in nanoseconds.Sample time offset to trace clock:• Positive value: Data is sampled after the clock edge.• Negative value: Data is sampled before the clock edge.
<time>(SWV)
Parameter Type: Float. The value is interpreted as time in nanoseconds.Sample time offset to nominal sample point derived from CAnalyzer.TraceCLOCK setting:• Positive value: Data is sampled after nominal sample point.• Negative value: Data is sampled before nominal sample point.
; Set the delay for all channels to 0CAnalyzer.SAMPLE , 0.0
; Set the delay for the D0 line to 0.4 nsCAnalyzer.SAMPLE D0 0.4
General Commands Reference Guide C 25 ©1989-2019 Lauterbach GmbH
CAnalyzer.ShowFocus Display data eye
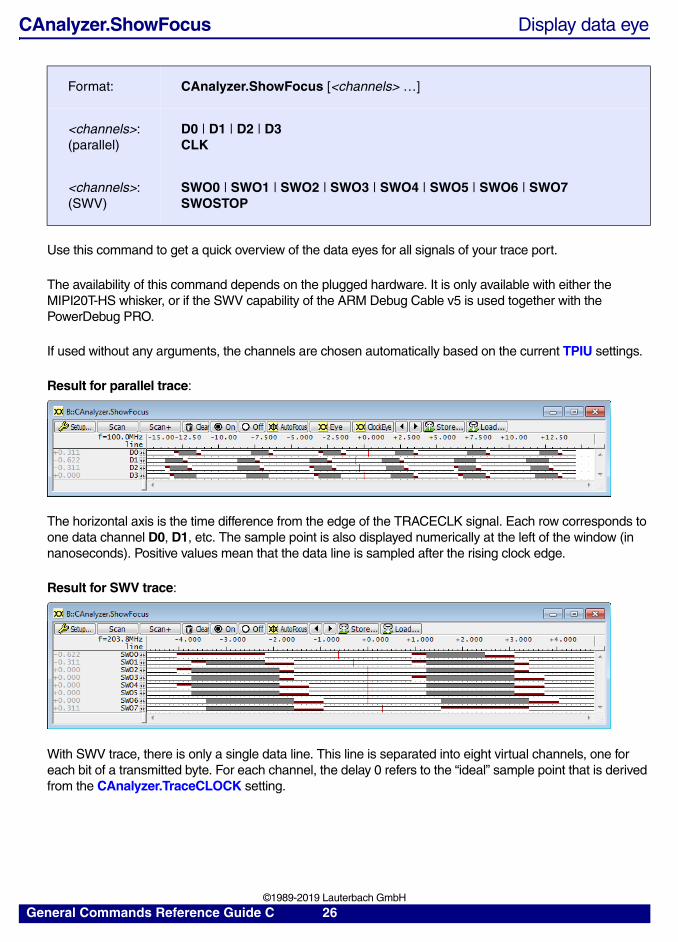
Use this command to get a quick overview of the data eyes for all signals of your trace port.
The availability of this command depends on the plugged hardware. It is only available with either the MIPI20T-HS whisker, or if the SWV capability of the ARM Debug Cable v5 is used together with the PowerDebug PRO.
If used without any arguments, the channels are chosen automatically based on the current TPIU settings.
Result for parallel trace:
The horizontal axis is the time difference from the edge of the TRACECLK signal. Each row corresponds to one data channel D0, D1, etc. The sample point is also displayed numerically at the left of the window (in nanoseconds). Positive values mean that the data line is sampled after the rising clock edge.
Result for SWV trace:
With SWV trace, there is only a single data line. This line is separated into eight virtual channels, one for each bit of a transmitted byte. For each channel, the delay 0 refers to the “ideal” sample point that is derived from the CAnalyzer.TraceCLOCK setting.
Format: CAnalyzer.ShowFocus [<channels> …]
<channels>:(parallel)
D0 | D1 | D2 | D3CLK
<channels>:(SWV)
SWO0 | SWO1 | SWO2 | SWO3 | SWO4 | SWO5 | SWO6 | SWO7SWOSTOP
General Commands Reference Guide C 26 ©1989-2019 Lauterbach GmbH

Color Legend
• White areas represent periods where the corresponding data line was stable.
• Gray areas indicate that changes of the data line were detected for both rising and falling clock edges.
• Parallel trace: Red areas show that the data line changed only on rising or falling clock edges, not both.
• SWV and parallel trace: Red lines indicate the sample points for each data line.
General Commands Reference Guide C 27 ©1989-2019 Lauterbach GmbH

Description of Buttons in the CAnalyzer.ShowFocus Window
The toolbar buttons of the CAnalyzer.ShowFocus window have the following functions:
See also
■ CAnalyzer.<specific_cmds>
▲ ’Release Information’ in ’Release History’
Setup… Open CAnalyzer.state window to configure the trace.
Scan Perform a CAnalyzer.TestFocus scan.This replaces the currently displayed data with a new scan of a test pattern.
Scan+ Perform a CAnalyzer.TestFocus /Accumulate scan.This works like Scan, but adds to the existing data.
Clear Clears the currently displayed data.
On Enables continuous capture. No specific test pattern is generated, but the capture can run in parallel to the recording of normal trace data. The CAnalyzer.ShowFocus window updates continuously.
Off Disables continuous capture.
AutoFocus Perform a CAnalyzer.AutoFocus scan.
Eye Open a CAnalyzer.ShowFocusEye window.
ClockEye Open a CAnalyzer.ShowFocusClockEye window.
Store… Save the current configuration to a file (STOre <file> CAnalyzerFocus).
Load… Load a configuration from a file(DO <file>).
Move all sampling points one step to the left.
Move all sampling points one step to the right.
General Commands Reference Guide C 28 ©1989-2019 Lauterbach GmbH
CAnalyzer.ShowFocusClockEye Show clock eye
This command is only available when a MIPI20T-HS whisker is used for parallel trace.
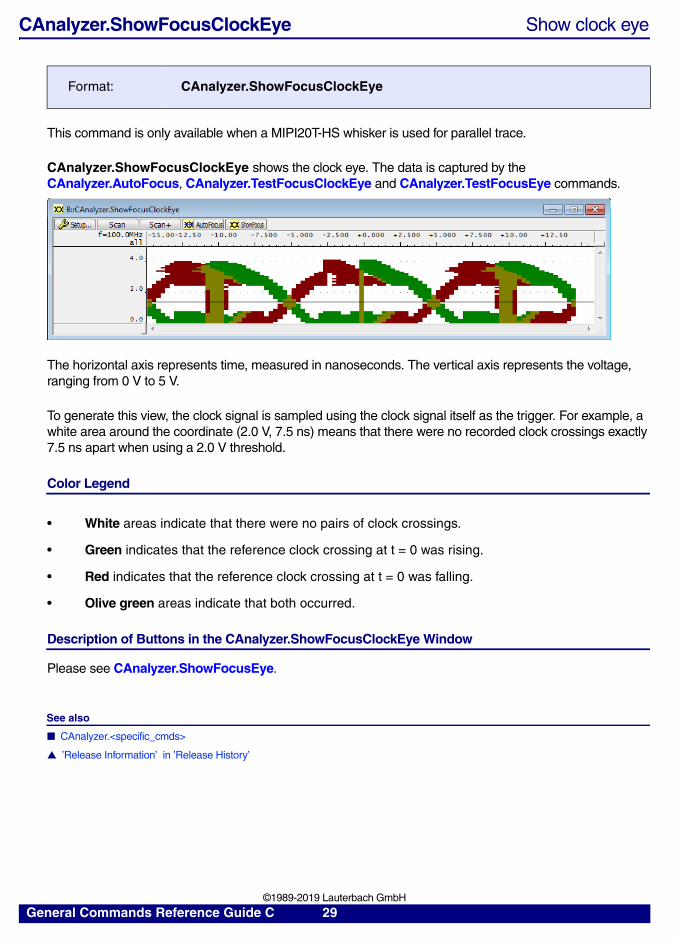
CAnalyzer.ShowFocusClockEye shows the clock eye. The data is captured by the CAnalyzer.AutoFocus, CAnalyzer.TestFocusClockEye and CAnalyzer.TestFocusEye commands.
The horizontal axis represents time, measured in nanoseconds. The vertical axis represents the voltage, ranging from 0 V to 5 V.
To generate this view, the clock signal is sampled using the clock signal itself as the trigger. For example, a white area around the coordinate (2.0 V, 7.5 ns) means that there were no recorded clock crossings exactly 7.5 ns apart when using a 2.0 V threshold.
Color Legend
• White areas indicate that there were no pairs of clock crossings.
• Green indicates that the reference clock crossing at t = 0 was rising.
• Red indicates that the reference clock crossing at t = 0 was falling.
• Olive green areas indicate that both occurred.
Description of Buttons in the CAnalyzer.ShowFocusClockEye Window
Please see CAnalyzer.ShowFocusEye.
See also
■ CAnalyzer.<specific_cmds>
▲ ’Release Information’ in ’Release History’
Format: CAnalyzer.ShowFocusClockEye
General Commands Reference Guide C 29 ©1989-2019 Lauterbach GmbH

CAnalyzer.ShowFocusEye Show data eyes
This command is only available when a MIPI20T-HS whisker is used.
CAnalyzer.ShowFocusEye shows the data eyes. The data is captured by the CAnalyzer.AutoFocus, CAnalyzer.TestFocusClockEye and CAnalyzer.TestFocusEye commands.
This screenshot shows multiple eyes overlaid on each other.
This screenshot shows a single data eye.
Color Legend
• White areas indicate that the data was stable (no changes were observed).
• Green indicates that the data changed in response to a rising clock edge at t = 0.
• Red indicates that the data changed in response to a falling clock edge at t = 0.
• Olive green areas indicate that both occurred.
Format: CAnalyzer.ShowFocusEye [<channels> …]
<channels>: D0 | D1 | D2 | D3
General Commands Reference Guide C 30 ©1989-2019 Lauterbach GmbH

Description of Buttons in the CAnalyzer.ShowFocusEye Window
The toolbar buttons of the CAnalyzer.ShowFocusEye window have the following functions:
See also
■ CAnalyzer.<specific_cmds>
Setup… Open CAnalyzer.state window to configure the trace.
Scan Perform a CAnalyzer.TestFocusEye scan.This replaces the currently displayed data with a new scan of a test pattern.
Scan+ Perform a CAnalyzer.TestFocusEye /Accumulate scan.This works like Scan, but adds to the existing data.
AutoFocus Perform a CAnalyzer.AutoFocus scan.
ShowFocus Open a CAnalyzer.ShowFocus window.
Channel up/down Switch between displayed channels. The default view shows all selected channels overlaid onto each other.
Move the sampling points of all visible channels one step to the left.
Move the sampling points of all visible channels one step to the right.
General Commands Reference Guide C 31 ©1989-2019 Lauterbach GmbH

CAnalyzer.TERMination Configure parallel trace termination
Configures the termination of the trace data and clock signals (TRACED0 to TRACED3 and TRACECLK) on the MIPI20T-HS whisker.
This command is only available if a MIPI20T-HS whisker is plugged. This whisker has a switchable 100 Ohm parallel termination to GND. It has no effect in Serial Wire Viewer (SWV) mode.
See also
■ CAnalyzer.<specific_cmds>
▲ ’Release Information’ in ’Release History’
CAnalyzer.TOut Route trigger to PODBUS (CombiProbe/uTrace)
When the BusA check box is enabled, the CombiProbe/uTrace will send out a trigger on the PODBUS, as soon as a trigger event is detected in the trace data.
For information about PODBUS devices, see "Interaction between independent PODBUS devices".
See also
■ CAnalyzer.<specific_cmds>
Format: CAnalyzer.TERMination [ON | OFF | ALways]
ON Termination is enabled while the trace is armed.This is the default and recommended setting. Parallel termination reduces overshoots of the electrical signals.
OFF Termination is disabled completely.Use this if your target’s drivers are too weak to drive against the termination.
ALways Termination is always enabled.
Format: CAnalyzer.TOut BusA ON | OFF
Trace.METHOD.CAnalyzer ; select the trace method Compact AnalyzerTrace.state ; open the Trace.state windowTrace.TOut BusA ON ; enable the BusA check box
General Commands Reference Guide C 32 ©1989-2019 Lauterbach GmbH

CAnalyzer.TraceCLOCK Configure the trace port frequency
This Compact Analyzer command is used to manually configure the frequency of the trace port. The bit rate of the Serial Wire Output (SWO) signal is used as frequency.
Examples:
To auto-detect the bit rate, click the AutoFocus button in the CAnalyzer window or type at the command line:
See also
■ CAnalyzer.<specific_cmds>
Format: CAnalyzer.TraceCLOCK <frequency> CAnalyzer.ExportClock <frequency> (deprecated)
<frequency> (CombiProbe and µTrace)
Frequency range:• Minimum: 60 kHz • Maximum: 100 MHzYou might need to select an appropriate SWO clock divider to remain in the allowed range. For an example, see TPIU.SWVPrescaler.
CAnalyzer.TraceCLOCK 32MHz
CAnalyzer.AutoFocus
General Commands Reference Guide C 33 ©1989-2019 Lauterbach GmbH

CAnalyzer.WRITE Define a file as trace sink
This Compact Analyzer command is used to define a file as trace sink. Up to 8 files can be specified as trace sinks simultaneously.
See also
■ CAnalyzer.<specific_cmds>
Format: CAnalyzer.WRITE <file> [/<options>]
<options>: ChannelID <channel_id>MasterID <master_id>XtiMaster DSP | CPU | MCU (XTIv2)XtiMaster DSP | CPU1 | CPU2 (SDTI)Payload
<file> If you use this command without specifying a <file> name, all open files currently used as trace sinks are closed.
ChannelIDMasterID
If you record MIPIs STP trace (System Trace Protocol), then the options /ChannelID and /MasterID are available. You can use this options to only store messages into the file, which match the given ChannelID or MasterID. You can specify a single value, a range of values or a bitmask for the ChannelID and MasterID.
If you record ARMs ITM trace, the MasterID option is not available, because ITM does not use master IDs.
Payload The /Payload option specifies, that only the payload of the ITM or STP messages is stored into the file.
General Commands Reference Guide C 34 ©1989-2019 Lauterbach GmbH

Generic CAnalyzer Trace Commands
CAnalyzer.ACCESS Define access path to source code for trace decoding
See command <trace>.ACCESS in 'General Commands Reference Guide T' (general_ref_t.pdf, page 122).
CAnalyzer.Arm Arm the trace
See command <trace>.Arm in 'General Commands Reference Guide T' (general_ref_t.pdf, page 125).
CAnalyzer.AutoArm Arm automatically
See command <trace>.AutoArm in 'General Commands Reference Guide T' (general_ref_t.pdf, page 126).
CAnalyzer.AutoFocus Calibrate AUTOFOCUS preprocessor
See command <trace>.AutoFocus in 'General Commands Reference Guide T' (general_ref_t.pdf, page 126).
CAnalyzer.AutoInit Automatic initialization
See command <trace>.AutoInit in 'General Commands Reference Guide T' (general_ref_t.pdf, page 131).
CAnalyzer.BookMark Set a bookmark in trace listing
See command <trace>.BookMark in 'General Commands Reference Guide T' (general_ref_t.pdf, page 134).
General Commands Reference Guide C 35 ©1989-2019 Lauterbach GmbH

CAnalyzer.BookMarkToggle Toggles a single trace bookmark
See command <trace>.BookMarkToggle in 'General Commands Reference Guide T' (general_ref_t.pdf, page 136).
CAnalyzer.Chart Display trace contents graphically
See command <trace>.Chart in 'General Commands Reference Guide T' (general_ref_t.pdf, page 138).
CAnalyzer.CLOCK Clock to calculate time out of cycle count information
See command <trace>.CLOCK in 'General Commands Reference Guide T' (general_ref_t.pdf, page 170).
CAnalyzer.ComPare Compare trace contents
See command <trace>.ComPare in 'General Commands Reference Guide T' (general_ref_t.pdf, page 171).
CAnalyzer.CustomTrace Custom trace
See command <trace>.CustomTrace in 'General Commands Reference Guide T' (general_ref_t.pdf, page 174).
CAnalyzer.CustomTraceLoad Load a DLL for trace analysis/Unload all DLLs
See command <trace>.CustomTraceLoad in 'General Commands Reference Guide T' (general_ref_t.pdf, page 175).
CAnalyzer.DISable Disable the trace
See command <trace>.DISable in 'General Commands Reference Guide T' (general_ref_t.pdf, page 176).
General Commands Reference Guide C 36 ©1989-2019 Lauterbach GmbH

CAnalyzer.DRAW Plot trace data against time
See command <trace>.DRAW in 'General Commands Reference Guide T' (general_ref_t.pdf, page 180).
CAnalyzer.EXPORT Export trace data for processing in other applications
See command <trace>.EXPORT in 'General Commands Reference Guide T' (general_ref_t.pdf, page 191).
CAnalyzer.FILE Load a file into the file trace buffer
See command <trace>.FILE in 'General Commands Reference Guide T' (general_ref_t.pdf, page 205).
CAnalyzer.Find Find specified entry in trace
See command <trace>.Find in 'General Commands Reference Guide T' (general_ref_t.pdf, page 207).
CAnalyzer.FindAll Find all specified entries in trace
See command <trace>.FindAll in 'General Commands Reference Guide T' (general_ref_t.pdf, page 211).
CAnalyzer.FindChange Search for changes in trace flow
See command <trace>.FindChange in 'General Commands Reference Guide T' (general_ref_t.pdf, page 212).
CAnalyzer.Get Display input level
See command <trace>.Get in 'General Commands Reference Guide T' (general_ref_t.pdf, page 214).
CAnalyzer.GOTO Move cursor to specified trace record
See command <trace>.GOTO in 'General Commands Reference Guide T' (general_ref_t.pdf, page 216).
General Commands Reference Guide C 37 ©1989-2019 Lauterbach GmbH

CAnalyzer.Init Initialize trace
See command <trace>.Init in 'General Commands Reference Guide T' (general_ref_t.pdf, page 226).
CAnalyzer.List List trace contents
See command <trace>.List in 'General Commands Reference Guide T' (general_ref_t.pdf, page 230).
CAnalyzer.ListNesting Analyze function nesting
See command <trace>.ListNesting in 'General Commands Reference Guide T' (general_ref_t.pdf, page 242).
CAnalyzer.ListVar List variable recorded to trace
See command <trace>.ListVar in 'General Commands Reference Guide T' (general_ref_t.pdf, page 245).
CAnalyzer.LOAD Load trace file for offline processing
See command <trace>.LOAD in 'General Commands Reference Guide T' (general_ref_t.pdf, page 248).
CAnalyzer.Mode Set the trace operation mode
See command <trace>.Mode in 'General Commands Reference Guide T' (general_ref_t.pdf, page 253).
CAnalyzer.OFF Switch off
See command <trace>.OFF in 'General Commands Reference Guide T' (general_ref_t.pdf, page 257).
CAnalyzer.PipePROTO.load Define a user-supplied DLL as trace sink
See command <trace>.PipePROTO.load in 'General Commands Reference Guide T' (general_ref_t.pdf, page 259).
General Commands Reference Guide C 38 ©1989-2019 Lauterbach GmbH

CAnalyzer.PortFilter Specify utilization of trace memory
See command <trace>.PortFilter in 'General Commands Reference Guide T' (general_ref_t.pdf, page 260).
CAnalyzer.PortType Specify trace interface
See command <trace>.PortType in 'General Commands Reference Guide T' (general_ref_t.pdf, page 262).
CAnalyzer.PROfileChart Profile charts
See command <trace>.PROfileChart in 'General Commands Reference Guide T' (general_ref_t.pdf, page 265).
CAnalyzer.PROfileSTATistic Statistical analysis in a table versus time
See command <trace>.PROfileSTATistic in 'General Commands Reference Guide T' (general_ref_t.pdf, page 283).
CAnalyzer.PROTOcol Protocol analysis
See command <trace>.PROTOcol in 'General Commands Reference Guide T' (general_ref_t.pdf, page 285).
CAnalyzer.REF Set reference point for time measurement
See command <trace>.REF in 'General Commands Reference Guide T' (general_ref_t.pdf, page 299).
CAnalyzer.RESet Reset command
See command <trace>.RESet in 'General Commands Reference Guide T' (general_ref_t.pdf, page 300).
General Commands Reference Guide C 39 ©1989-2019 Lauterbach GmbH
CAnalyzer.SAVE Save trace for postprocessing in TRACE32
See command <trace>.SAVE in 'General Commands Reference Guide T' (general_ref_t.pdf, page 302).
CAnalyzer.SelfArm Automatic restart of trace recording
See command <trace>.SelfArm in 'General Commands Reference Guide T' (general_ref_t.pdf, page 306).
CAnalyzer.SIZE Define buffer size
See command <trace>.SIZE in 'General Commands Reference Guide T' (general_ref_t.pdf, page 317).
CAnalyzer.SnapShot Restart trace capturing once
See command <trace>.SnapShot in 'General Commands Reference Guide T' (general_ref_t.pdf, page 319).
CAnalyzer.SPY Adaptive Stream and Analysis
See command <trace>.SPY in 'General Commands Reference Guide T' (general_ref_t.pdf, page 319).
CAnalyzer.state Display trace configuration window
See command <trace>.state in 'General Commands Reference Guide T' (general_ref_t.pdf, page 321).
CAnalyzer.STATistic Statistic analysis
See command <trace>.STATistic in 'General Commands Reference Guide T' (general_ref_t.pdf, page 324).
General Commands Reference Guide C 40 ©1989-2019 Lauterbach GmbH
CAnalyzer.STREAMCompression Select compression mode for streaming
See command <trace>.STREAMCompression in 'General Commands Reference Guide T' (general_ref_t.pdf, page 433).
CAnalyzer.STREAMFILE Specify temporary streaming file path
See command <trace>.STREAMFILE in 'General Commands Reference Guide T' (general_ref_t.pdf, page 434).
CAnalyzer.STREAMFileLimit Set size limit for streaming file
See command <trace>.STREAMFileLimit in 'General Commands Reference Guide T' (general_ref_t.pdf, page 435).
CAnalyzer.STREAMLOAD Load streaming file from disk
See command <trace>.STREAMLOAD in 'General Commands Reference Guide T' (general_ref_t.pdf, page 436).
CAnalyzer.STREAMSAVE Save streaming file to disk
See command <trace>.STREAMSAVE in 'General Commands Reference Guide T' (general_ref_t.pdf, page 438).
CAnalyzer.TDelay Trigger delay
See command <trace>.TDelay in 'General Commands Reference Guide T' (general_ref_t.pdf, page 439).
CAnalyzer.TestFocus Test trace port recording
See command <trace>.TestFocus in 'General Commands Reference Guide T' (general_ref_t.pdf, page 442).
General Commands Reference Guide C 41 ©1989-2019 Lauterbach GmbH

CAnalyzer.TestFocusClockEye Scan clock eye
See command <trace>.TestFocusClockEye in 'General Commands Reference Guide T' (general_ref_t.pdf, page 444).
CAnalyzer.TestFocusEye Check signal integrity
See command <trace>.TestFocusEye in 'General Commands Reference Guide T' (general_ref_t.pdf, page 445).
CAnalyzer.THreshold Optimize threshold for trace lines
See command <trace>.THreshold in 'General Commands Reference Guide T' (general_ref_t.pdf, page 446).
CAnalyzer.TraceCONNECT Select on-chip peripheral sink
See command <trace>.TraceCONNECT in 'General Commands Reference Guide T' (general_ref_t.pdf, page 452).
CAnalyzer.TRACK Set tracking record
See command <trace>.TRACK in 'General Commands Reference Guide T' (general_ref_t.pdf, page 453).
CAnalyzer.TSELect Select trigger source
See command <trace>.TSELect in 'General Commands Reference Guide T' (general_ref_t.pdf, page 454).
CAnalyzer.View Display single record
See command <trace>.View in 'General Commands Reference Guide T' (general_ref_t.pdf, page 457).
General Commands Reference Guide C 42 ©1989-2019 Lauterbach GmbH

CAnalyzer.ZERO Align timestamps of trace and timing analyzers
See command <trace>.ZERO in 'General Commands Reference Guide T' (general_ref_t.pdf, page 459).
General Commands Reference Guide C 43 ©1989-2019 Lauterbach GmbH

CIProbe
CIProbe Trace with Analog Probe and CombiProbe/uTrace
CIProbe is the command group that is used to configure, display, and evaluate trace information recorded with a TRACE32 Analog Probe connected to a TRACE32 CombiProbe/uTrace tool option.
See also
■ <trace>.Arm ■ <trace>.AutoArm ■ <trace>.AutoInit ■ <trace>.DISable ■ <trace>.DRAW ■ <trace>.GOTO ■ <trace>.Init ■ <trace>.List ■ <trace>.Mode ■ <trace>.OFF ■ <trace>.RESet ■ <trace>.SIZE ■ <trace>.STREAMCompression ■ <trace>.STREAMFILE ■ <trace>.TRACK
▲ ’CIProbe Functions (Analog Probe for CombiProbe or µTrace)’ in ’General Function Reference’
General Commands Reference Guide C 44 ©1989-2019 Lauterbach GmbH

ClipStore
ClipSTOre Store settings to clipboard
Stores settings in the format of PRACTICE commands to the clipboard.
Example:
Result:
See also
■ AutoSTOre ■ STOre ■ SETUP.STOre
▲ ’Store Settings’ in ’EPROM/FLASH Simulator’
Format: ClipSTOre [%<format>] [<item> …]
<format>: sYmbol | NosYmbol
<item>: default | ALL | Win | WinPAGE | Symbolic | HEX | SYStem …
<item>, <format> For a detailed descriptions, refer to the STOre command.
ClipSTOre SYStem ; store the settings of the SYStem.state window; to the clipboard
SYSTEM.RESETSYSTEM.MEMACCESS DENIEDSYSTEM.CPUACCESS DENIEDSYSTEM.CPU MPC860SYSTEM.JTAGCLOCK 1000000.SYSTEM.OPTION DCREAD ONSYSTEM.OPTION NOTRAP OFFSYSTEM.OPTION CLEARBE OFFSYSTEM.OPTION BRKNOMSK OFFSYSTEM.OPTION FREEZEPIN OFFSYSTEM.OPTION WATCHDOG OFFSYSTEM.OPTION IBUS SERALLSYSTEM.OPTION LITTLEEND OFFSYSTEM.OPTION NODATA OFFSYSTEM.OPTION SIUMCR 0x400000SYSTEM.MODE UP
General Commands Reference Guide C 45 ©1989-2019 Lauterbach GmbH

CLOCK
CLOCK Display date and time
The command group CLOCK is used to display and calculate the system clock configuration. The results are also used to decode the on-chip trace timestamp information in complex scenarios.
Currently this feature is only implemented for TriCore, PCP, and GTM.
For architectures that do not have the CLOCK command group, CLOCK is an alias for DATE.
See also
■ CLOCK.BACKUP ■ CLOCK.DATE ■ CLOCK.OFF ■ CLOCK.ON ■ CLOCK.OSCillator ■ CLOCK.Register ■ CLOCK.RESet ■ CLOCK.state ■ CLOCK.VCOBase ■ CLOCK.VCOBaseERAY ■ DATE
▲ ’Release Information’ in ’Release History’
CLOCK.BACKUP Set backup clock frequency
Default: 100.0MHz (TriCore, device dependent)
Configure the backup clock frequency. Required to compute the clock frequencies when TriCore switches to the backup clock. Check CPU data sheet for details.
TriCore only, device dependent.
See also
■ CLOCK ■ CLOCK.state
Format: CLOCK.BACKUP <frequency>
General Commands Reference Guide C 46 ©1989-2019 Lauterbach GmbH

CLOCK.DATE Alias for DATE command
Alias for the DATE command.
See also
■ CLOCK ■ CLOCK.state
CLOCK.OFF Disable clock frequency computation
Default: OFF
Disables the computation of clock frequencies.
See also
■ CLOCK ■ CLOCK.state
CLOCK.ON Enable clock frequency computation
Enables the computation of clock frequencies.
Prior to enabling the computation of clock frequencies, it is recommended to configure the clock sources (oscillator, backup, VCOBase). The resulting clock frequencies are also used for decoding on-chip trace timestamps, if supported by device and TRACE32.
See also
■ CLOCK ■ CLOCK.state
Format: CLOCK.DATE
Format: CLOCK.OFF
Format: CLOCK.ON
General Commands Reference Guide C 47 ©1989-2019 Lauterbach GmbH

CLOCK.OSCillator Set board oscillator frequency
Default: 20.0MHz (TriCore)
Configures the board oscillator clock frequency. Check board oscillator and/or schematics.
See also
■ CLOCK ■ CLOCK.state
CLOCK.Register Display PLL related registers
Opens the PLL or system clock register section within the device’s peripheral file.
See also
■ CLOCK ■ CLOCK.state
CLOCK.RESet Reset CLOCK command group settings
Resets all CLOCK command group related settings to defaults.
See also
■ CLOCK ■ CLOCK.state
Format: CLOCK.OSCillator <frequency>
Format: CLOCK.Register
Format: CLOCK.RESet
General Commands Reference Guide C 48 ©1989-2019 Lauterbach GmbH

CLOCK.state Display clock frequencies
Opens a dialog with all computed clock frequencies and related settings.
See also
■ CLOCK ■ CLOCK.BACKUP ■ CLOCK.DATE ■ CLOCK.OFF ■ CLOCK.ON ■ CLOCK.OSCillator ■ CLOCK.Register ■ CLOCK.RESet ■ CLOCK.VCOBase ■ CLOCK.VCOBaseERAY
CLOCK.VCOBase Set "VCOBase" clock frequencyTriCore only, device dependent
Default: device dependent
Configures the VCO base clock frequency. Required when TriCore PLL operates in free-running mode. Check CPU data sheet for details.
See also
■ CLOCK ■ CLOCK.state
Format: CLOCK.state
A For descriptions of the commands in the CLOCK.state window, please refer to the CLOCK.* commands in this chapter. Example: For information about ON, see CLOCK.ON.
Format: CLOCK.VCOBase <frequency>
A
General Commands Reference Guide C 49 ©1989-2019 Lauterbach GmbH

CLOCK.VCOBaseERAY Set "FlexRay VCOBase" clock frequencyTriCore only, device dependent
Default: device dependent
Configures the FlexRay VCO base clock frequency. Required when TriCore FlexRay PLL operates in free-running mode. Check CPU data sheet for details.
See also
■ CLOCK ■ CLOCK.state
Format: CLOCK.VCOBaseERAY <frequency>
General Commands Reference Guide C 50 ©1989-2019 Lauterbach GmbH

CMI
CMI Clock management interface
For a description of the CMI commands and CMITrace commands, see “System Trace User’s Guide” (trace_stm.pdf).
General Commands Reference Guide C 51 ©1989-2019 Lauterbach GmbH

CORE
CORE Cores in an SMP system
See also
■ CORE.ADD ■ CORE.ASSIGN ■ CORE.List ■ CORE.NUMber ■ CORE.ReMove ■ CORE.select ■ CORE.SHOWACTIVE ❏ CORE.ISACTIVE() ❏ CORE.ISASSIGNED() ❏ CORE.LOGICALTOPHYSICAL() ❏ CORE.NAMES() ❏ CORE.NUMBER() ❏ CORE.PHYSICALTOLOGICAL()
▲ ’CORE Functions’ in ’General Function Reference’
Overview CORE
With the CORE command group, TRACE32 supports debugging of SMP systems (symmetric multiprocessing).
For various architectures like ARM, MIPS, PowerPC, and SH4 there are chips containing two or more identical cores.
When debugging SMP systems with TRACE32, the context (Register window, Data.List window, etc.) of a single core is displayed at a time, but it is possible to switch to another core within the same TRACE32 instance. In contrast to this, all debug actions as Go or Break are effected on all cores to maintain synchronicity between the cores.
To set up an SMP System the commands SYStem.CONFIG.CoreNumber and CORE.ASSIGN or CORE.NUMber are necessary. The SYStem.CONFIG window and commands define how the access to a certain hardware thread can be achieved and how many hardware threads are available. The CORE commands assign the hardware threads to the SMP system that is handled by this TRACE32 instance. In case there are multiple SMP systems configured on the chip, the command SYStem.CONFIG.CORE is necessary to define different SMP System indices (Y) that are used as start value for the command CORE.NUMber and the information whether the SMP System is located at a different or the same chip by the chip index (X).
tbd.
General Commands Reference Guide C 52 ©1989-2019 Lauterbach GmbH

CORE.ADD Add core/thread to the SMP system
Adds a physical core/thread to the SMP System. This synchronizes it with other cores/threads when debug features are applied to the SMP System.
See also
■ CORE ■ CORE.select
Format: CORE.ADD <core> | <thread>THREAD.ADD (deprecated)
Core 1 Core 2 Core 3 Core 4 ... Core M
SYStem.CONFIG window SYStem.CONFIG.CoreNumber M
CORE.ASSIGN A B C
or CORE.NUMber N
A B C or Y..Y+N-1
SYStem.CONFIG.CORE Y X
Assignment of Cores
Core 0 Core 1 Core N-1
SMP System Y
Chip X
SMP System Y+1
0 1 2or 0 .. N-1
Setup of SMP Systems
Chip X+1
Target System
...
General Commands Reference Guide C 53 ©1989-2019 Lauterbach GmbH
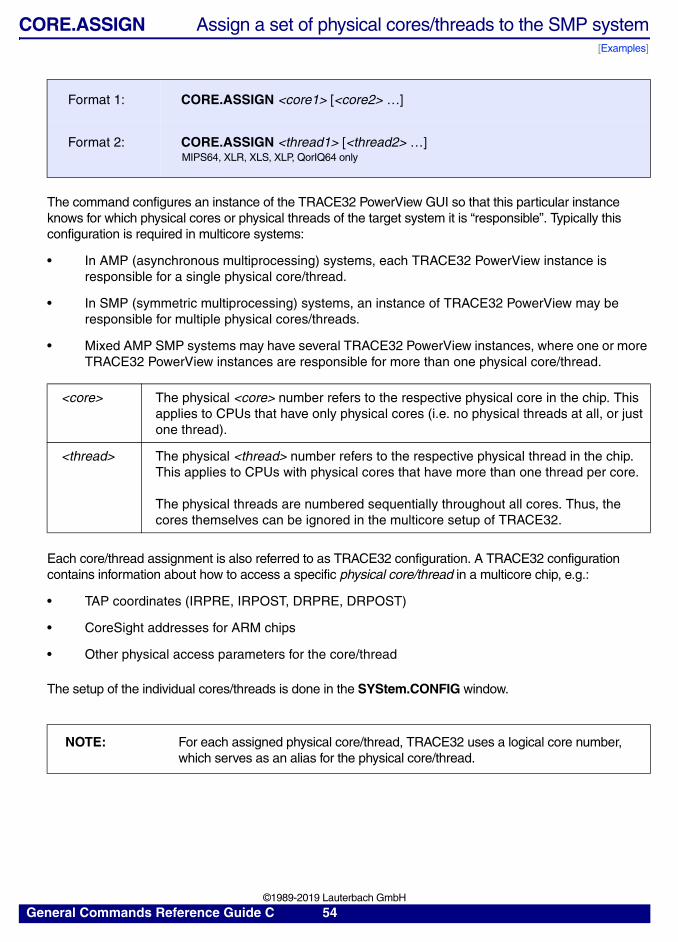
CORE.ASSIGN Assign a set of physical cores/threads to the SMP system[Examples]
The command configures an instance of the TRACE32 PowerView GUI so that this particular instance knows for which physical cores or physical threads of the target system it is “responsible”. Typically this configuration is required in multicore systems:
• In AMP (asynchronous multiprocessing) systems, each TRACE32 PowerView instance is responsible for a single physical core/thread.
• In SMP (symmetric multiprocessing) systems, an instance of TRACE32 PowerView may be responsible for multiple physical cores/threads.
• Mixed AMP SMP systems may have several TRACE32 PowerView instances, where one or more TRACE32 PowerView instances are responsible for more than one physical core/thread.
Each core/thread assignment is also referred to as TRACE32 configuration. A TRACE32 configuration contains information about how to access a specific physical core/thread in a multicore chip, e.g.:
• TAP coordinates (IRPRE, IRPOST, DRPRE, DRPOST)
• CoreSight addresses for ARM chips
• Other physical access parameters for the core/thread
The setup of the individual cores/threads is done in the SYStem.CONFIG window.
Format 1: CORE.ASSIGN <core1> [<core2> …]
Format 2: CORE.ASSIGN <thread1> [<thread2> …] MIPS64, XLR, XLS, XLP, QorIQ64 only
<core> The physical <core> number refers to the respective physical core in the chip. This applies to CPUs that have only physical cores (i.e. no physical threads at all, or just one thread).
<thread> The physical <thread> number refers to the respective physical thread in the chip. This applies to CPUs with physical cores that have more than one thread per core.
The physical threads are numbered sequentially throughout all cores. Thus, the cores themselves can be ignored in the multicore setup of TRACE32.
NOTE: For each assigned physical core/thread, TRACE32 uses a logical core number, which serves as an alias for the physical core/thread.
General Commands Reference Guide C 54 ©1989-2019 Lauterbach GmbH

Examples
To illustrate the CORE.ASSIGN command, the following examples are provided:
• Example 1 - Assignment of Physical Cores
• Example 2 - Assignment of Physical Threads (MIPS specific)
• Example 3 - Core Assignment for an SMP-4 / AMP-3 Setup (MIPS specific)
• Example 4 - Core Assignment for an AMP-2 Setup (MIPS specific)
Example 1 - Assignment of Physical Cores
In this example, the physical cores 1, 2, 4, and 5 of a multicore chip are assigned to TRACE32; core 3 is not used in this example setup. The resulting logical cores can be seen from the Cores pull-down list in TRACE32.
CORE.ASSIGN 1. 2. 4. 5. ;assign the physical cores 1, 2, 4, and 5
Right-click to open the Cores pull-down list.In the status line, this box shows the currently selected core, here core 0.
Resulting logical coresAssigned physical cores
General Commands Reference Guide C 55 ©1989-2019 Lauterbach GmbH
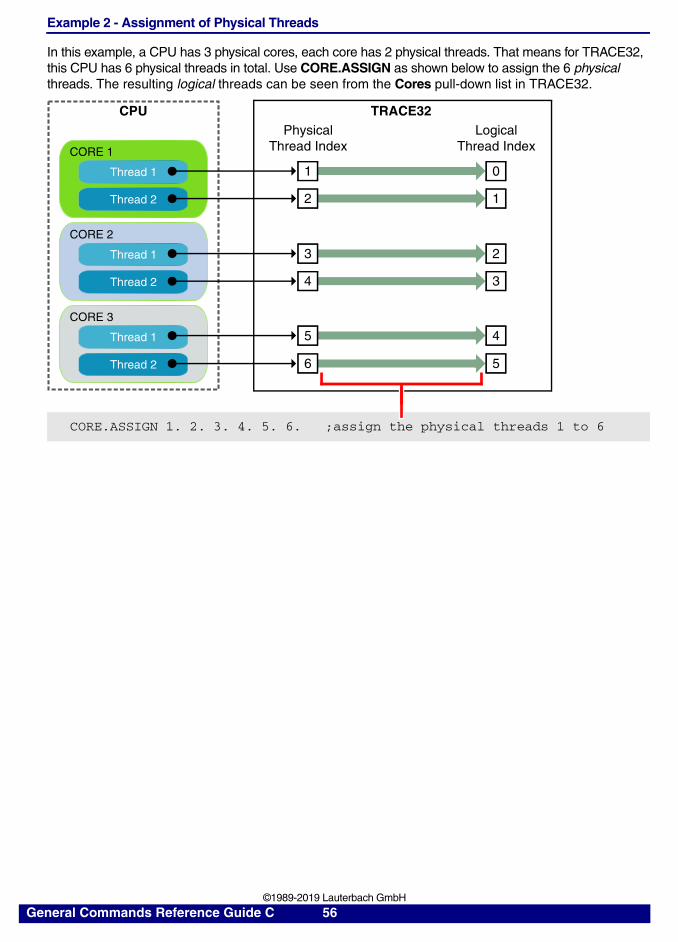
Example 2 - Assignment of Physical Threads
In this example, a CPU has 3 physical cores, each core has 2 physical threads. That means for TRACE32, this CPU has 6 physical threads in total. Use CORE.ASSIGN as shown below to assign the 6 physical threads. The resulting logical threads can be seen from the Cores pull-down list in TRACE32.
CORE 1
Thread 2
Thread 1
CORE 2
Thread 2
Thread 1
CORE 3
Thread 2
Thread 1
TRACE32
3
4
2
3
5
6
4
5
CPU
1
2
0
1
PhysicalThread Index
LogicalThread Index
CORE.ASSIGN 1. 2. 3. 4. 5. 6. ;assign the physical threads 1 to 6
General Commands Reference Guide C 56 ©1989-2019 Lauterbach GmbH

Example 3: Core Assignment for an SMP-4 / AMP-3 Setup (MIPS specific)
The figure shows an SMP-4 / AMP-3 setup. For this kind of setup, the six cores need to be assigned to three TRACE32 PowerView GUIs. The target is a MIPS64 with six cores (CPU CN6335).
Code required for assigning the cores 1 to 4 to the first TRACE32 PowerView GUI:
Code required for assigning core 5 to the second TRACE32 PowerView GUI:
SYStem.CPU CN63XX ; Select the target CPU (MIPS CN6335).
; Inform TRACE32 about the total number of cores of this multicore chip.SYStem.CONFIG.CoreNumber 6.
; Start core assignment at this <core> of this <chip>.SYStem.CONFIG.CORE 1. 1.
; Assign the cores 1 to 4 to the first TRACE32 PowerView GUI.CORE.ASSIGN 1. 2. 3. 4.
; This step needs to be repeated for the second TRACE32 PowerView GUI: SYStem.CPU CN63XX Select the target CPU (MIPS CN6335).
; This step needs to be repeated for the second TRACE32 PowerView GUI: ; Inform TRACE32 about the total number of cores of this multicore chip.SYStem.CONFIG.CoreNumber 6.
; Start core assignment at this <core> of this <chip>.SYStem.CONFIG.CORE 5. 1.
; Assign the core 5 to the second TRACE32 PowerView GUI.CORE.ASSIGN 5.
AMP-3
AMP1 AMP2 AMP3
1st TRACE32 GUI 2nd TRACE32 GUI 3rd TRACE32 GUI
General Commands Reference Guide C 57 ©1989-2019 Lauterbach GmbH

Code required for assigning core 6 to the third TRACE32 PowerView GUI:
Example 4: AMP-2 Setup (MIPS specific)
The figure shows an AMP-2 setup, which in turn consists of an SMP-2 and SMP-4 setup. For this kind of setup, the six cores need to be assigned to two TRACE32 PowerView GUIs. The target is a MIPS64 with six cores (CPU CN6335).
Code required for assigning the cores 1 and 2 to the first TRACE32 PowerView GUI:
; This step needs to be repeated for the third TRACE32 PowerView GUI: SYStem.CPU CN63XX Select the target CPU (MIPS CN6335).
; This step needs to be repeated for the third TRACE32 PowerView GUI: ; Inform TRACE32 about the total number of cores of this multicore chip.SYStem.CONFIG.CoreNumber 6.
; Start core assignment at this <core> of this <chip>.SYStem.CONFIG.CORE 6. 1.
; Assign the core 6 to the third TRACE32 PowerView GUI.CORE.ASSIGN 6.
SYStem.CPU CN63XX ; Select the target CPU (MIPS CN6335).
; Inform TRACE32 about the total number of cores of this multicore chip.SYStem.CONFIG.CoreNumber 6.
; Start core assignment at this <core> of this <chip>.SYStem.CONFIG.CORE 1. 1.
; Assign the cores 1 and 2 to the first TRACE32 PowerView GUI.CORE.ASSIGN 1. 2.
AMP-2
AMP1 AMP2
1st TRACE32 PowerView GUI 2nd TRACE32 PowerView GUI
General Commands Reference Guide C 58 ©1989-2019 Lauterbach GmbH

Code required for assigning the cores 3 to 6 to the second TRACE32 PowerView GUI:
See also
■ CORE ■ CORE.select ■ SYStem.CONFIG.CORE ■ TargetSystem.state ❏ CORE.ISASSIGNED()
; This step needs to be repeated for the second TRACE32 PowerView GUI: SYStem.CPU CN63XX ; Select the target CPU (MIPS CN6335).
; This step needs to be repeated for the second TRACE32 PowerView GUI: ; Inform TRACE32 about the total number of cores of this multicore chip.SYStem.CONFIG.CoreNumber 6.
; Start core assignment at this <core> of this <chip>.SYStem.CONFIG.CORE 3. 1.; Assign the cores 3 to 6 to the first TRACE32 PowerView GUI.CORE.ASSIGN 3. 4. 5. 6.
NOTE: The numbering of physical and logical cores is as follows:
• “Physical cores” may have numbers starting with 1.
• “Logical cores” have numbers starting with 0.
General Commands Reference Guide C 59 ©1989-2019 Lauterbach GmbH

CORE.List List information about cores
Lists for each core the location of the PC (program counter) and the current task. The list is empty while the cores are running and updated as soon as the program execution is stopped.
Description of Columns in the CORE.List Window
See also
■ CORE ■ CORE.select ■ TASK.List.tasks ❏ CORE()
▲ ’PowerView - Screen Display’ in ’PowerView User’s Guide’
Format: CORE.List
sel Task selected for debugging.
core Logical core number.
stop Stopped core.
state Architecture-specific states, e.g. power down.
pc Location of the PC.
symbol Symbol information about the PC
task Active task on core.
General Commands Reference Guide C 60 ©1989-2019 Lauterbach GmbH

CORE.NUMber Assign a number of cores/threads to the SMP system
Assigns multiple physical cores/threads to the SMP system. The cores/threads are assigned in a linear sequence and without gaps.
The setup of the cores/threads is done in the SYStem.CONFIG window. The assignment starts with the <core> parameter of the SYStem.CONFIG.CORE command and iterates through the number of cores/threads passed to the CORE.NUMber command.
Example 1 shows how to assign the first 4 cores of a chip. In our example, chip 1 has 7 cores.
Example 2 shows how to assign the cores 3 to 6 of a chip. In our example, chip 1 has 7 cores.
See also
■ CORE ■ CORE.select ■ TargetSystem.state
Format: CORE.NUMber <number_of_cores> | <number_of_threads>
; <core> <chip> i.e. start at core 1 of chip 1SYStem.CONFIG.CORE 1. 1.
CORE.NUMber 4. ;assign the first 4 cores. ;this assignment corresponds to: CORE.ASSIGN 1. 2. 3. 4.
1 2 3 4 5 6 7
; <core> <chip> i.e. start at core 3 of chip 1SYStem.CONFIG.CORE 3. 1.
CORE.NUMber 4. ;assign cores 3 to 6, i.e. 4 cores. ;this assignment corresponds to: CORE.ASSIGN 3. 4. 5. 6.
3 42 751 6
General Commands Reference Guide C 61 ©1989-2019 Lauterbach GmbH

CORE.ReMove Remove core from the SMP system
Removes a physical core from the SMP system.
See also
■ CORE ■ CORE.select
CORE.select Change currently selected core
Changes the currently selected core to the specified <logical_core>. As a result the debugger view is changed to <logical_core> and all commands without /CORE <number> option apply to <logical_core>.
The number of the selected core is displayed in the state line at the bottom of the TRACE32 main window.
See also
■ CORE ■ CORE.ADD ■ CORE.ASSIGN ■ CORE.List ■ CORE.NUMber ■ CORE.ReMove ■ CORE.SHOWACTIVE ■ MACHINE.select ■ TASK.select ❏ CORE()
Format: CORE.ReMove <core>THREAD.ReMove (deprecated)
Format: CORE.select <logical_core>THREAD.select (deprecated)
NOTE: CORE.List shows the states of all cores and allows to switch between cores with a simple mouse-click.
General Commands Reference Guide C 62 ©1989-2019 Lauterbach GmbH

CORE.SHOWACTIVE Show active/inactive cores in an SMP system
Opens a window with a color legend, displaying individual colors and numbers for the cores assigned to TRACE32:
• Gray indicates that a core is inactive.
An inactive core is not executing any code. The debugger can neither control nor talk to this core. A core is inactive if it is not clocked or not powered or held in reset.
• Colors other than gray (e.g. orange, green, yellow) indicate that a core is active.
An active core is executing code and the debugger has full control. A core is active if it is clocked, powered and not in reset.
Clicking a number switches the debugger view to the selected core. The window background is highlighted in the same color as the selected core.
For example, when you click 1 in the CORE.SHOWACTIVE window, the Register.view window updates accordingly. The green background color tells you that this register information refers to core 1 (see screenshots below):
Example: Let’s assume a multicore chip has 6 cores, and just 4 cores of them are assigned to the TRACE32 PowerView GUI. The CORE.SHOWACTIVE window lets you switch between the assigned 4 cores. If you want to pin a window to a particular core, append /CORE <number> to the window command (see source example below):
Format: CORE.SHOWACTIVE
Core 1 = green Register.view window = green = Core 1
General Commands Reference Guide C 63 ©1989-2019 Lauterbach GmbH

See also
■ CORE ■ CORE.select ■ CmdPOS ■ FramePOS ■ SETUP.COLOR ❏ CORE.ISACTIVE()
▲ ’PowerView - Screen Display’ in ’PowerView User’s Guide’
;- The cores 1, 2, 4, 5 (= four cores) are assigned to the TRACE32 ; PowerView GUI;- The cores 3 and 6 are skipped (= two cores)CORE.ASSIGN 1. 2. 4. 5.SYStem.Up
;Open the CORE.SHOWACTIVE window. It has four entries because;four cores were assigned to the TRACE32 PowerView GUI via CORE.ASSIGNCORE.SHOWACTIVE ;To select a core, click the core number you want
;alternatively, use this command to select the core you want:CORE.select 1 ;e.g. select core 1
Register.view ;displays register information and source listing Data.List func1 ;from the core currently selected in the ;CORE.SHOWACTIVE window, i.e. core 1
Register.view /CORE 3. ;displays register information from core 3Data.List func1 /CORE 3. ;and source listing from core 3, ;independently of the core currently selected ;in the CORE.SHOWACTIVE window
General Commands Reference Guide C 64 ©1989-2019 Lauterbach GmbH

Count
Count Universal counter
See also
■ Count.AutoInit ■ Count.Enable ■ Count.Gate ■ Count.GLitch ■ Count.GO ■ Count.Init ■ Count.Mode ■ Count.OUT ■ Count.PROfile ■ Count.RESet ■ Count.Select ■ Count.state ❏ Count.Frequency()
▲ ’Count’ in ’EPROM/FLASH Simulator’▲ ’Count Functions’ in ’General Function Reference’▲ ’Release Information’ in ’Release History’
Overview Count
Counter of TRACE32-ICD
The universal counter system TRACE32-ICD can measure the frequency of the target clock (if the target clock is connected to the debug cable) or the signal on the count line of the Stimuli Generator.
The input multiplexer enables the target clock line if a debug module is used and Count.Select is entered while the device B: (TRACE32-ICD) is selected.
The input multiplexer enables the count line of the Stimuli Generator if a Stimuli Generator is connected and Count.Select is entered while the device ESI: (EPROM Simulator) is selected.
If only the debug module or only the Stimuli Generator is connected, the input multiplexer enables the present input signal independent of the device selection.
Using the Count.OUT command the input signal is issued to the trigger connector on the PODBUS interface. By that the trigger output is disabled.
TriggerMUX Trigger
in/out
BDMtarget CLK Input Universal
Multiplexer CounterSTGcount line
of PODBUinterfac
General Commands Reference Guide C 65 ©1989-2019 Lauterbach GmbH

Counter of TRACE32-ICE
The universal counter is the logic measurement system to sample pulses and frequencies. The input multiplexer enables the counter to measure all important CPU lines and all external probe inputs. Therefore the counter input normally must not be hard wired to the signal. Together with the port analyzer all peripheral pins of microcontroller chips may be attached.
The count ranges are:
The input signal is selected with the command Count.Select. The command Count.Mode is used to change the counter mode and the Count.Gate command defines the gate time. Frequency and event measurement may be qualified by the foreground running signal.
If there is no event counting, it is possible to activate more than one count window. Every window represents a separate counter. For example it is possible to check the clock frequency and the pulse width on some probe inputs simultaneous.
Frequency 0 … 20 MHz
CPU clock 0 … 80 MHz
VCO 0 … 80 MHz
Pulse width 100 ns … 300 days
Period 100 ns … 300 days
Events 2.8 * 10E+14 max. rate 10 MHz
ClockVCO Universal... counter.................. Input... multiplexer Glitch... detect.................. SIGnal...... (TriggerEvent, TriggerIn)...
Schematic of Universal Counter and Glitch Detector
General Commands Reference Guide C 66 ©1989-2019 Lauterbach GmbH

Level Display
If there is no signal (frequency is zero), the level of the input signal is displayed (high or low level). The threshold level is defined by the input probes (fixed to 1.4 V or variable).
Glitch Detection
A special glitch detection circuit checks the measurement signal, if there is more than one edge between two measurement points. In a microprocessor based system some signals are allowed only to change one time within a CPU cycle. If there are more edges, this normally is defined as a hardware or design problem. The time raster for glitch detection may be fixed or generated by the signal itself. The glitch detection is stored and is reset on programming the counter again. The glitch detector may be used to trigger the emulator (command TrMain.Set Glitch).
Signal
Raster
Glitch Glitch no Glitch
General Commands Reference Guide C 67 ©1989-2019 Lauterbach GmbH

Display Window
; test xtal frequencyCount.Mode FrequencyCount.Select ClockCount.Gate 0.1sCount.GOIF COUNT.VALUE()<1000000.
PRINT "Oscillator Error"
; test reset lineCount.Mode FrequencyCount.Select RESetCount.GOIF COUNT.VALUE()!=0.
PRINT "RESET floating"IF COUNT.LEVEL()==0
PRINT "RESET active"
; test pulse width on trigger probeNAME.Set t0 test-Count.Mode PulsLowCount.Select test-Count.GOIF COUNT.VALUE()<10.us
STOP "Puls too short"IF COUNT.VALUE()>11.us
STOP "Puls too long"
. . 7 .9 9 9 .9 2 0 . Hz Clock (*80) Glitch
Gate Value Unit Channel Glitch detection
Resolution
General Commands Reference Guide C 68 ©1989-2019 Lauterbach GmbH

Counter of TRACE32-FIRE
The universal counter is the logic measurement system to sample pulses and frequencies. The input multiplexer enables the counter to measure all important CPU lines and all external probe inputs. Therefore the counter input normally must not be hard wired to the signal. Together with the port analyzer all peripheral pins of microcontroller chips may be attached.
The count ranges are:
The input signal is selected with the command Count.Select. The command Count.Mode is used to change the counter mode and the Count.Gate function defines the gate time. Frequency and event measurement may be qualified by the foreground running signal.
If there is no event counting, it is possible to activate more than one count window. Every window represents a separate counter. For example it is possible to check the clock frequency and the pulse width on some probe inputs simultaneous.
Frequency 0 … 100 MHz
CPU clock 0 … 100 MHz
VCO 0 … 100 MHz
Pulse width 100 ns … 300 days
Period 100 ns … 300 days
Events 2.8 * 10E+14 max. rate 10 MHz
ClockVCO
Universal
...
counter
...
...
...
...
...
... Input
... multiplexer
...
...
...
...
...
...
...
...
...
...
Schematic of Universal Counter
Trigger in/out ofPODBUS interface
General Commands Reference Guide C 69 ©1989-2019 Lauterbach GmbH

Level Display
If there is no signal (frequency is zero), the level of the input signal is displayed (high or low level). The threshold level is defined by the input probes (fixed to 1.4 V or variable).
Counter Functions
To use the result of the measurement in automatic test programs, some functions are defined to get the counter state. The functions are valid only if the Count.Go command is executed.
Count.Frequency()
The result of a frequency measurement
Count.LEVEL()
The actual level of the counter signal (Low = 0, High = 1)
Count.Time()
The result of a period or pulse duration measurement
Count.VALUE()
The result of a event count measurement
Count.GLITCH() (E)
Result of glitch detector (true = glitch occurred)
General Commands Reference Guide C 70 ©1989-2019 Lauterbach GmbH
Count.AutoInit Automatic counter reset
If AutoInit is selected, the counter is initialized when emulation is started (Go or Step).
See also
■ Count ■ Count.state
▲ ’Count’ in ’EPROM/FLASH Simulator’
ICE only
Count.Enable Counter control
Selects the active mode of the counter.
See also
■ Count ■ Count.state
Format: Count.AutoInit [ON | OFF]
Format: Count.Enable [<mode>]
<mode>: AlwaysRunning
Always The measurement is not controlled by the emulation functions.
Running The measurement is active only on foreground emulation.
; count the clock cycles until program break
Count.Select ClockCount.Mode EventCount.Enable RunningBreak.Set 0x1000Go
; select cpu clock; set to event count; count on real-time emulation only; set breakpoint; start program
; count external events while emulation is running
Count.Select E0Count.Mode EventLowCount.Enable RunningGo progend
; select external probe; set event mode to falling edge; go till
General Commands Reference Guide C 71 ©1989-2019 Lauterbach GmbH
▲ ’Count’ in ’EPROM/FLASH Simulator’▲ ’Emulator Functions’ in ’FIRE User’s Guide’▲ ’Universal Counter’ in ’ICE User’s Guide’
Count.Gate Gate time
The gate time has two functions. On measuring frequencies it defines the sample time (gate time). The precision of the measurement increases with the gate time. If pulse measurement is selected, the gate time is the max. time for the pulse width. To measure very long pulses the gate time must be set to infinite.
See also
■ Count ■ Count.state
▲ ’Emulator Functions’ in ’FIRE User’s Guide’▲ ’Universal Counter’ in ’ICE User’s Guide’▲ ’Universal Counter’ in ’ICE User’s Guide’
Format: Count.Gate [<time>]
<time>: 0.01s … 10.0s0. (= infinite gate time)
Count.Gate 0.1s ; set gate time to 0.1 s
Count.Gate 0. ; infinite gate time
General Commands Reference Guide C 72 ©1989-2019 Lauterbach GmbH
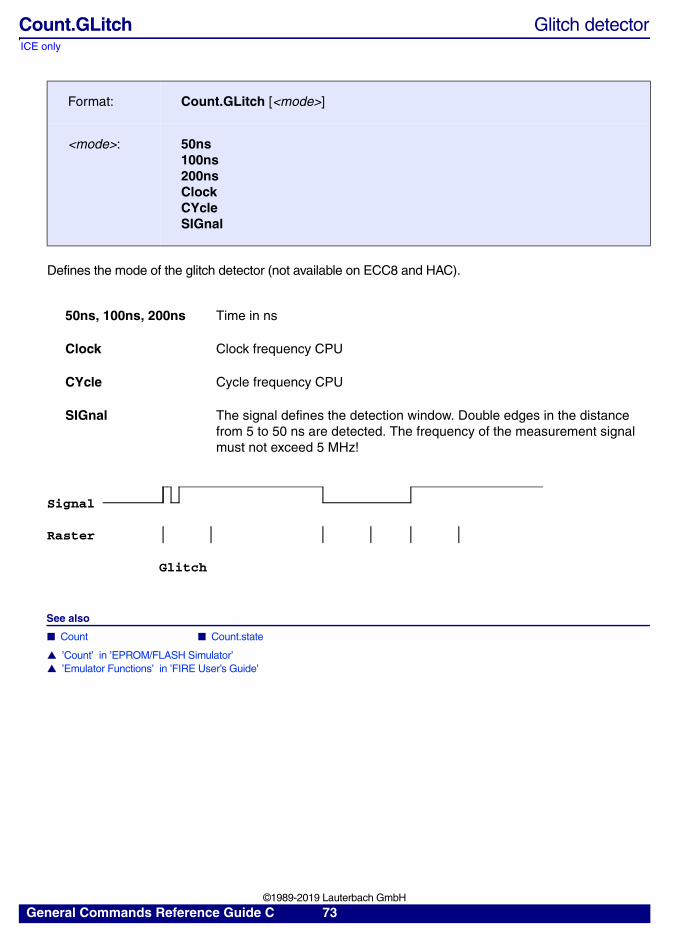
ICE only
Count.GLitch Glitch detector
Defines the mode of the glitch detector (not available on ECC8 and HAC).
See also
■ Count ■ Count.state
▲ ’Count’ in ’EPROM/FLASH Simulator’▲ ’Emulator Functions’ in ’FIRE User’s Guide’
Format: Count.GLitch [<mode>]
<mode>: 50ns100ns200nsClockCYcleSIGnal
50ns, 100ns, 200ns Time in ns
Clock Clock frequency CPU
CYcle Cycle frequency CPU
SIGnal The signal defines the detection window. Double edges in the distance from 5 to 50 ns are detected. The frequency of the measurement signal must not exceed 5 MHz!
Signal
Raster
Glitch
General Commands Reference Guide C 73 ©1989-2019 Lauterbach GmbH
Count.GO Start measurement
Start single measurement of the frequency counter. This command is usually used only in PRACTICE scripts.
See also
■ Count ■ Count.state ❏ Count.Frequency() ❏ Count.Time() ❏ Count.VALUE()
▲ ’Count’ in ’EPROM/FLASH Simulator’
Count.Init Reset counter
The counter is reset (counter value to zero), running measurement cycles are stopped. The counter modes and the channel selection are not changed.
See also
■ Count ■ Count.state
▲ ’Count’ in ’EPROM/FLASH Simulator’▲ ’Emulator Functions’ in ’FIRE User’s Guide’▲ ’Universal Counter’ in ’ICE User’s Guide’
Format: Count.GO
Count.Select CycleCount.Mode FrequencyCount.Gate 0.1sCount.GOPRINT COUNT.VALUE()
; start measurement; print value
Format: Count.Init
General Commands Reference Guide C 74 ©1989-2019 Lauterbach GmbH

Count.Mode Mode selection
Select mode of the counter.
Frequency
Frequency measurement. The range is up to 20 MHz on external signals and up to 80 MHz for CLOCK and VCO measurement. Depending on the gate time the resolution is from 0.2 Hz to 800 Hz, which is displayed behind the result in the display window.
Period
Period time. The resolution is 100 ns, the maximum range up to 300 days
PulsHigh
Measurement of time between the rising and the falling edge
PulsLow
Measurement of time between the falling and the rising edge
Format: Count.Mode [<mode>]
<mode>: FrequencyPeriodPulsLowPulsHighEventLowEventHighEventHOld
Period
Puls High
PulsLow
General Commands Reference Guide C 75 ©1989-2019 Lauterbach GmbH

EventHigh
Event count on rising edges
EventLow
Event count on falling edges
EventHOld
The event count is stopped. On starting the previous event count mode, the counter is not cleared.
See also
■ Count ■ Count.state
▲ ’Count’ in ’EPROM/FLASH Simulator’▲ ’Emulator Functions’ in ’FIRE User’s Guide’▲ ’Universal Counter’ in ’ICE User’s Guide’
Count.Mode PulsHigh ; pulse time high
Count.Mode Period ; period duration
Count.Mode EventHighCount.Mode EventHOldCount.Mode EventHigh
; event count rising edge; stop event count; continue event count
1003 1004 1005
1003 1004 1005
1003 1004 hold 1005 1006EventHigh Hold EventHigh
General Commands Reference Guide C 76 ©1989-2019 Lauterbach GmbH

Count.OUT Forward counter input signal to trigger system/output
Default: OFF.
When enabled, the input signal of the counter module is forwarded to the Podbus Trigger system. From there it can be used with other devices connected to the Podbus chain. It is also possible to forward the signal to the trigger connector on the debug interface (FIRE: Trigger BNC connector). This is done with TrBus.Connect Out.
See also
■ Count ■ Count.state
▲ ’Count’ in ’EPROM/FLASH Simulator’
Count.PROfile Graphic counter display
The count rate is displayed in graphic mode. The counter mode must be EventHigh or EventLow. The display is updated and shift every 100 ms or slower. The profiler system is a very effective subsystem to show transfer or interrupt rates in a running system (see also Analyzer.PROfile). An opened window may be zoomed by the function keys. An auto zooming feature displays the results always with the best vertical scaling. The auto zoom is switched off by supplying a scale factor, manual zoom or vertical scrolling. The scale factor must be a power of 2.
Format: Count.OUT [ON | OFF]
Format: Count.PROfile [<gate>] [<scale>]
<gate>: 0.1s | 1.0s | 10.0s
<scale>: 1 … 32768.
NOTE: Open windows that make dualport memory access may influence the profiling window!
General Commands Reference Guide C 77 ©1989-2019 Lauterbach GmbH

;---- profile interrupt rate ----------------------------------
Break.Set INT_routine /Alpha
TrEvent.Select Alpha
; set address mark on beginning of; interrupt routine; set event selector to breakpoint; alpha
Count.Mode EventLowCount.Select EventGoCount.PROfile
; event measurement
; start emulation; display window
;---- profile data transfer rate -------------------------
Break.Set V.RANGE(buffer1) /AlphaTrEvent.Select Alpha
; mark buffer area; set event selector to breakpoint; alpha
Count.Mode EventLowCount.Select EventGoCount.PROfile
; event measurement
; start emulation; display window
E::Count.PROfile-25.0s 0.
events/sec100.
50.
0.
Zoom In T Zoom Out T Zoom In Y Zoom Out Y Hold AutoZoom
General Commands Reference Guide C 78 ©1989-2019 Lauterbach GmbH

See also
■ Count ■ Count.state
▲ ’Count’ in ’EPROM/FLASH Simulator’▲ ’Emulator Functions’ in ’FIRE User’s Guide’▲ ’Universal Counter’ in ’ICE User’s Guide’
Count.RESet Reset command
The counter system is initialized to the reset state after power up.
See also
■ Count ■ Count.state
▲ ’Count’ in ’EPROM/FLASH Simulator’▲ ’Emulator Functions’ in ’FIRE User’s Guide’▲ ’Universal Counter’ in ’ICE User’s Guide’
Buttons
Zoom In T Zoom in vertical axis by factor 2.
Zoom Out T Zoom out vertical axis by factor 2.
Zoom In Y Zoom in horizontal axis by factor 2.
Zoom Out Y Zoom out horizontal axis by factor 2.
Hold Stop Updating.
AutoZoom Auto zooming of the vertical axis.
Format: Count.RESet
General Commands Reference Guide C 79 ©1989-2019 Lauterbach GmbH
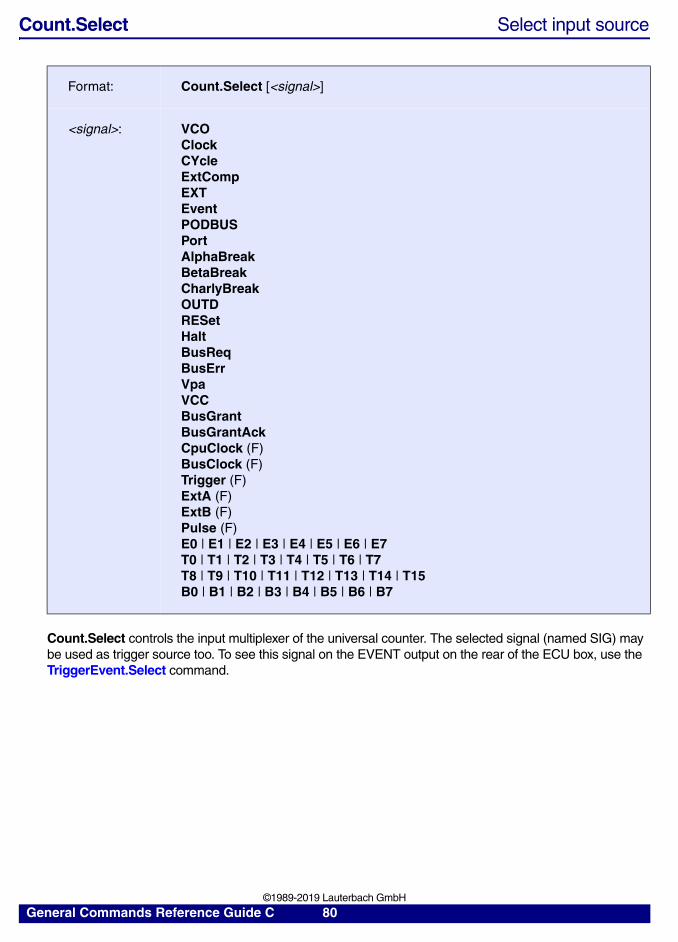
Count.Select Select input source
Count.Select controls the input multiplexer of the universal counter. The selected signal (named SIG) may be used as trigger source too. To see this signal on the EVENT output on the rear of the ECU box, use the TriggerEvent.Select command.
Format: Count.Select [<signal>]
<signal>: VCOClockCYcleExtCompEXTEventPODBUSPortAlphaBreakBetaBreakCharlyBreakOUTDRESetHaltBusReqBusErrVpaVCCBusGrantBusGrantAckCpuClock (F)BusClock (F)Trigger (F)ExtA (F)ExtB (F)Pulse (F)E0 | E1 | E2 | E3 | E4 | E5 | E6 | E7T0 | T1 | T2 | T3 | T4 | T5 | T6 | T7T8 | T9 | T10 | T11 | T12 | T13 | T14 | T15B0 | B1 | B2 | B3 | B4 | B5 | B6 | B7
General Commands Reference Guide C 80 ©1989-2019 Lauterbach GmbH

VCO(TRACE32-ICE ECU32 only, TRACE32-FIRE)
Clock frequency VCO
Clock Clock frequency of the emulation CPU (external or internal)
CYcle OUT.D Signal of the trigger unit (additional event counter or profiler).
RESet, Halt, Bus-Req, BusGrant, …
Cycle signal of emulation CPU. Normally generated by the data strobe.
ExtComp(TRACE32-ICE ECU32 only)
Comparator output of the external input (see command TriggerIn).
EXT(TRACE32-ICE ECU32 only)
External trigger event. Defined by the command TriggerIn.
Event(TRACE32-ICE ECU32 only)
Event signal. Selected by command TriggerEvent.Select.
PODBUS Signal selected by the external PODBUS probes.
Port This signal is the channel selected by the port analyzer.
AlphaBreak, Beta-Break, CharlyBreak(TRACE32-ICE ECC8 only)
Breakpoint events.
OUTD (TRACE32-ICE ECC8 only)
Signal lines from emulation probeThese signal names differ on the TRACE32-ICE module used for emulation.
B0, B1, B2, B3, B4, B5, B6, B7
Inputs lines on BANK probe
E0, E1, E2, E3, E4, E5, E6, E7(TRACE32-ICE ECU32 only)
Input lines on EXTERNAL probe
General Commands Reference Guide C 81 ©1989-2019 Lauterbach GmbH
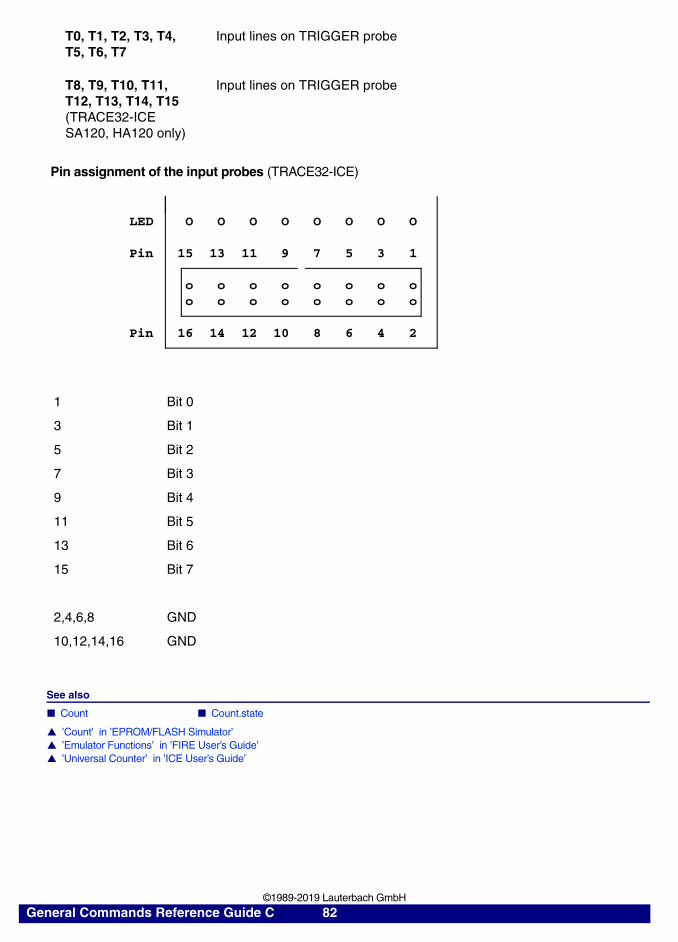
Pin assignment of the input probes (TRACE32-ICE)
See also
■ Count ■ Count.state
▲ ’Count’ in ’EPROM/FLASH Simulator’▲ ’Emulator Functions’ in ’FIRE User’s Guide’▲ ’Universal Counter’ in ’ICE User’s Guide’
T0, T1, T2, T3, T4, T5, T6, T7
Input lines on TRIGGER probe
T8, T9, T10, T11, T12, T13, T14, T15(TRACE32-ICE SA120, HA120 only)
Input lines on TRIGGER probe
1 Bit 0
3 Bit 1
5 Bit 2
7 Bit 3
9 Bit 4
11 Bit 5
13 Bit 6
15 Bit 7
2,4,6,8 GND
10,12,14,16 GND
LED O O O O O O O O
Pin 15 13 11 9 7 5 3 1
o o o o o o o oo o o o o o o o
Pin 16 14 12 10 8 6 4 2
General Commands Reference Guide C 82 ©1989-2019 Lauterbach GmbH

Count.state State display
Displays the measurement value and setup of the frequency counter. The number of channels and the configuration depends on the development tool and the CPU used.
See also
■ Count ■ Count.AutoInit ■ Count.Enable ■ Count.Gate ■ Count.GLitch ■ Count.GO ■ Count.Init ■ Count.Mode ■ Count.OUT ■ Count.PROfile ■ Count.RESet ■ Count.Select ❏ Count.Frequency() ❏ Count.LEVEL() ❏ Count.Time() ❏ Count.VALUE()
▲ ’Count’ in ’EPROM/FLASH Simulator’▲ ’Emulator Functions’ in ’FIRE User’s Guide’▲ ’Universal Counter’ in ’ICE User’s Guide’
Format: Count.state
General Commands Reference Guide C 83 ©1989-2019 Lauterbach GmbH

COVerage
COVerage Trace-based code coverage
The COVerage command group uses the program flow information from the trace for a detailed code coverage analysis. If you are interested in the number of times an operation was executed (rather than “executed or not”), use the ISTATistic command.
The coverage information is kept in a database. This database can be saved to disk to reload it later. This allows to combine the results of independent test runs. The results of the analysis can be displayed both at the assembly and at the HLL source code level.
The following training documents contain background information and a step-by-step description for the accomplishment of the code coverage:
• “AURIX Trace Training” (training_aurix_trace.pdf)
• “Nexus Training” (training_nexus.pdf)
• “ARM-ETM Training” (training_arm_etm.pdf)
A demo script is included in your TRACE32 installation. To access the script, run this command: B::CD.PSTEP ~~/demo/coverage/example.cmm
See also
■ COVerage.ACCESS ■ COVerage.ADD ■ COVerage.Delete ■ COVerage.EXPORT ■ COVerage.Init ■ COVerage.List ■ COVerage.ListFunc ■ COVerage.ListGroup ■ COVerage.ListLine ■ COVerage.ListModule ■ COVerage.ListVar ■ COVerage.LOAD ■ COVerage.MAP ■ COVerage.METHOD ■ COVerage.Mode ■ COVerage.OFF ■ COVerage.ON ■ COVerage.Option ■ COVerage.RESet ■ COVerage.SAVE ■ COVerage.Set ■ COVerage.state ■ COVerage.StaticInfo ■ COVerage.TreeWalkSETUP ■ BookMark ■ RTS ■ sYmbol.ECA ❏ COVerage.BDONE() ❏ COVerage.SCOPE() ❏ COVerage.SourceMetric() ❏ COVerage.TreeWalk()
▲ ’Introduction’ in ’Application Note for t32cast’▲ ’COVerage Functions’ in ’General Function Reference’
General Commands Reference Guide C 84 ©1989-2019 Lauterbach GmbH

COVerage.ACCESS Set the memory access mode
Allows you to modify the memory access mode for the commands COVerage.EXPORT and COVerage.StaticInfo. The command allows to specify the memory accesses that are carried out if the CPU is running and the two commands are executed.
If the CPU is halted, only the option VM has an effect on the memory access mode.
See also
■ COVerage ■ COVerage.state
Format: COVerage.ACCESS [auto | VM | DualPort] (deprecated)Use Trace.ACCESS instead.
auto • Accesses the TRACE32 virtual memory (VM:) If a program, e.g. an ELF file, has been loaded to the VM memory with the Data.LOAD <file> /PlusVM command.
• If no program has been loaded to the VM memory, TRACE32 forces a runtime memory access.
VM Accesses the TRACE32 virtual memory (VM:).
DualPort Forces runtime memory access.
General Commands Reference Guide C 85 ©1989-2019 Lauterbach GmbH

COVerage.ADD Add trace contents to database
The trace contents is processed and added to the coverage database.
Example:
See also
■ COVerage ■ COVerage.state
▲ ’Trace-based Code Coverage’ in ’AURIX Trace Training’▲ ’Trace-based Code Coverage’ in ’Nexus Training’
COVerage.Delete Modify coverage
Marks the defined range as 'never' executed.
See also
■ COVerage ■ COVerage.state
Format: COVerage.ADD [/<option>] <trace>.COVerage.add (deprecated)
<option>: FILEFlowTrace | BusTraceAlpha
FILE Takes trace memory contents loaded by Trace.FILE.
FlowTrace The trace works as a program flow trace. This option is usually not required.
BusTrace Trace works as a bus trace. This option is usually not required.
Alpha (only TRACE32-ICE and TRACE32-FIRE)Mark all covered instructions with AlphaBreak. Usa a trigger program with the following trigger instruction (Sample.enable IF !AlphaBreak) to trace infrequently executed functions.
Analyzer.Mode StackGo sieve…COVerage.ADD
; clear trace buffer and use stack mode; run a part of the application
; process the trace buffer
Format: COVerage.Delete [<address> | <range>]
General Commands Reference Guide C 86 ©1989-2019 Lauterbach GmbH
COVerage.EXPORT Export code coverage information to an XML file
Using the COVerage.EXPORT commands, you can export code coverage information for all HLL functions, lines, modules, or variables to an XML file.
In addition, TRACE32 provides an XSL transformation template for formatting the XML file. The formatting is automatically applied to the XML file when it is opened in an external browser window. Prerequisite: The XSL file is placed in the same folder as the XML file.
For an export example and demo scripts, see COVerage.EXPORT.ListFunc.
See also
■ COVerage.EXPORT.<command>.SOURCE ■ COVerage.EXPORT.<command>.sYmbol ■ COVerage.EXPORT.CBA ■ COVerage.EXPORT.ListFunc ■ COVerage.EXPORT.ListGroup ■ COVerage.EXPORT.ListLine ■ COVerage.EXPORT.ListModule ■ COVerage.EXPORT.ListVar ■ COVerage ■ COVerage.state ■ ISTATistic.EXPORT ■ List.EXPORT ■ SETUP.XSLTSTYLESHEET
▲ ’Release Information’ in ’Release History’
General Commands Reference Guide C 87 ©1989-2019 Lauterbach GmbH

COVerage.EXPORT.CBA Export HLL lines in CBA format
Exports coverage information about HLL lines to a file in CBA format for import to VectorCAST/CBA.
Example:
See also
■ COVerage.EXPORT ■ COVerage.Option.BLOCKMode
Format: COVerage.EXPORT.CBA <file> [/Append]
<file> The default extension of the file name is *.cba. If you omit the extension, it is added automatically on file creation.
COVerage.stateCOVerage.Option.SourceMetric StatementCOVerage.Option.BLOCKMode ON ;for a comparison of ON and OFF, see below
COVerage.EXPORT.CBA ~~\hll-lines-blockmode-on.cba
A With COVerage.Option.BLOCKMode ON, the line number range for each entry is printed.
B With COVerage.Option.BLOCKMode OFF, only the number of the last line is printed.
A B
General Commands Reference Guide C 88 ©1989-2019 Lauterbach GmbH

COVerage.EXPORT.ListFunc Export the HLL functions[Examples]
Exports coverage information about HLL functions to an XML file.
Example of an XML export file opened in an external browser window:
<file>
Name of the XML file that stores the code coverage information. The file extension *.xml can be omitted.
Format: COVerage.EXPORT.ListFunc <file> [<string> | <range>] [/<option>]
<option>: FILE | Append | TOrder | SOrder
Table of Contents: Click to jump to the table you want.
Press these keys to jump to the table you want.Click to toggle the display of the listing.
General Commands Reference Guide C 89 ©1989-2019 Lauterbach GmbH

<string>
Defines a filter for the source files that you want to export. The filter consists of the file path and refers only to source files that are listed in the tree column of a COVerage.ListFunc, COVerage.ListModule, etc. window.
Example for <string>:
<range>
Filter for exporting the specified address range or symbol range.
The address range can be specified as follows:
• Start and end address.
• Only start address. Exports items from the start address up to the maximum address of the current address space.
The symbol range can be specified as program, module, or function.
Example: This script line exports code coverage information for three symbol ranges.
FILE
For a description of the FILE option, see COVerage.ListFunc.
APPEND
Appends the coverage information to an existing XML file - without overwriting the current file contents.
;export the code coverage information for all HLL functions with;a source path that matches the pattern "*/gnu/sub/*"COVerage.EXPORT.ListFunc C:\t32\coverage.xml "*/gnu/sub/*"
;export the code coverage information for all modules with a file path;that matches the pattern "*crt0.s"COVerage.EXPORT.ListModule C:\t32\coverage.xml "*crt0.s" /Append
;export the code coverage information for three symbol rangesCOVerage.EXPORT.ListFunc C:\t32\coverage.xml \\myprog\func13 func10 \ \\prog2
NOTE: The backslash \ can be used as a line continuation character in PRACTICE script files (*.cmm). No white space permitted after the backslash.
General Commands Reference Guide C 90 ©1989-2019 Lauterbach GmbH
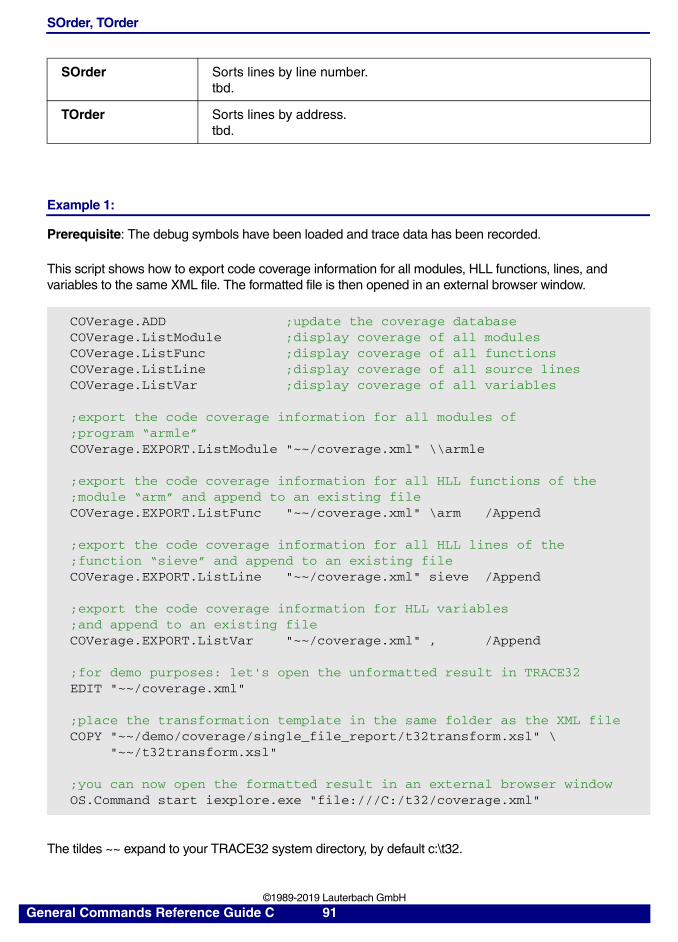
SOrder, TOrder
Example 1:
Prerequisite: The debug symbols have been loaded and trace data has been recorded.
This script shows how to export code coverage information for all modules, HLL functions, lines, and variables to the same XML file. The formatted file is then opened in an external browser window.
The tildes ~~ expand to your TRACE32 system directory, by default c:\t32.
SOrder Sorts lines by line number.tbd.
TOrder Sorts lines by address.tbd.
COVerage.ADD ;update the coverage databaseCOVerage.ListModule ;display coverage of all modulesCOVerage.ListFunc ;display coverage of all functionsCOVerage.ListLine ;display coverage of all source linesCOVerage.ListVar ;display coverage of all variables
;export the code coverage information for all modules of ;program “armle”COVerage.EXPORT.ListModule "~~/coverage.xml" \\armle
;export the code coverage information for all HLL functions of the;module “arm” and append to an existing fileCOVerage.EXPORT.ListFunc "~~/coverage.xml" \arm /Append
;export the code coverage information for all HLL lines of the;function “sieve” and append to an existing fileCOVerage.EXPORT.ListLine "~~/coverage.xml" sieve /Append
;export the code coverage information for HLL variables;and append to an existing fileCOVerage.EXPORT.ListVar "~~/coverage.xml" , /Append
;for demo purposes: let's open the unformatted result in TRACE32EDIT "~~/coverage.xml"
;place the transformation template in the same folder as the XML fileCOPY "~~/demo/coverage/single_file_report/t32transform.xsl" \ "~~/t32transform.xsl"
;you can now open the formatted result in an external browser windowOS.Command start iexplore.exe "file:///C:/t32/coverage.xml"
General Commands Reference Guide C 91 ©1989-2019 Lauterbach GmbH
Example 2:
A more complex demo script is included in your TRACE32 installation. To access the script, run this command: B::CD.PSTEP ~~/demo/coverage/example.cmm
This demo script also tells you how to include a listing in the XML export file.
See also
■ COVerage.EXPORT ■ COVerage.ListFunc
COVerage.EXPORT.ListGroup Export the groups
Exports the code coverage information for the current groups to an XML file. For a description of the command line arguments, a screenshot of an export example, and PRACTICE script examples, see COVerage.EXPORT.ListFunc.
Please refer to COVerage.ListGroup for a PRACTICE script example that illustrates the use of the command.
See also
■ COVerage.EXPORT
Format: COVerage.EXPORT.ListGroup <file> [/<option>] (deprecated)
<option>: Append
General Commands Reference Guide C 92 ©1989-2019 Lauterbach GmbH

COVerage.EXPORT.ListLine Export the HLL lines
Exports coverage information about HLL lines to an XML file.
For a description of the command line arguments, a screenshot of an export example, and PRACTICE script examples, see COVerage.EXPORT.ListFunc.
See also
■ COVerage.EXPORT ■ COVerage.ListLine
COVerage.EXPORT.ListModule Export the modules
Exports coverage information about modules to an XML file.
For a description of the command line arguments, a screenshot of an export example, and PRACTICE script examples, see COVerage.EXPORT.ListFunc.
See also
■ COVerage.EXPORT ■ COVerage.ListModule
Format: COVerage.EXPORT.ListLine <file> [<string> | <range>] [/<option>]
<option>: FILE | Append
Format: COVerage.EXPORT.ListModule <file> [<string> | <range>] [/<option>]
<option>: FILE | Append
General Commands Reference Guide C 93 ©1989-2019 Lauterbach GmbH

COVerage.EXPORT.ListVar Export the HLL variables
Exports coverage information for HLL variables to an XML file.
For a description of the command line arguments, a screenshot of an export example, and PRACTICE script examples, see COVerage.EXPORT.ListFunc.
See also
■ COVerage.EXPORT ■ COVerage.ListVar
Format: COVerage.EXPORT.ListVar <file> [<string> | <range>] [/<option>]
<option>: FILE | Append
General Commands Reference Guide C 94 ©1989-2019 Lauterbach GmbH

COVerage.EXPORT.<command>.SOURCE tbd.
Exports coverage information to an XML file. You can use the names of source files to control which coverage information you want to export.
tbd.
Example:
See also
■ COVerage.EXPORT
Format: COVerage.EXPORT.<command>.SOURCE <file> [<source_file>…] [/<option>]
<command>: ListFunc | ListLine | ListModule | ListVar
<option>: Append
ListFunc tbd.
ListLine tbd.
ListModule tbd.
ListVar tbd.
<file>, <option> For descriptions, see COVerage.EXPORT.ListFunc.
<symbol> tbd.
tbd.
General Commands Reference Guide C 95 ©1989-2019 Lauterbach GmbH

COVerage.EXPORT.<command>.sYmbol tbd.
Exports coverage information to an XML file. You can use symbol names to control which coverage information you want to export.
Example: In this script line, only the symbol main as well as symbols matching the patterns func1? and *eve* are exported:
See also
■ COVerage.EXPORT
Format: COVerage.EXPORT.<command>.sYmbol <file> [<symbol>…] [/<option>]
<command>: ListFunc | ListLine | ListModule | ListVar
<option>: Append
ListFunc Defines a filter for the symbols of the HLL functions you want to export.
ListLine Defines a filter for the symbols of the HLL lines you want to export.
ListModule Defines a filter for the symbols of the modules you want to export.
ListVar Defines a filter for the symbols of the HLL variables you want to export.
<file>, <option> For descriptions, see COVerage.EXPORT.ListFunc.
<symbol> You can use one or more symbol names as filter criteria. The wildcards ‘*’ and ‘?’ are supported. Only symbols matching the filter criteria are exported.
COVerage.EXPORT.ListFunc.sYmbol ~~\coverage.xml main func? *eve*
General Commands Reference Guide C 96 ©1989-2019 Lauterbach GmbH

COVerage.Init Clear coverage database
Deletes all code coverage information for HLL source code statements, assembly instructions and data values.
See also
■ COVerage ■ COVerage.state
COVerage.List Coverage display
Displays the results of the coverage analysis.
Double-clicking a line opens a List window, showing the context of and more details about the covered code.
See also
■ COVerage.ListFunc ■ COVerage.ListGroup ■ COVerage.ListLine ■ COVerage.ListModule ■ COVerage.ListVar ■ COVerage ■ COVerage.state
Format: COVerage.Init<trace>.COVerage.Init (deprecated)
Format: COVerage.List [<address> | <range>]<trace>.COVerage.List (deprecated)
General Commands Reference Guide C 97 ©1989-2019 Lauterbach GmbH

COVerage.ListFunc Display code coverage for HLL functions
Displays the results of the coverage analysis related to HLL functions.
If the command contains no parameters, then all HLL functions are displayed (see screenshot below).
Double-clicking a line displays the function and detailed information about the code coverage in a List window.
<range> or <address>
Format: COVerage.ListFunc [<range>…] [<address>…] ["<path>" [/<option>]] <trace>.COVerage.ListFunc (deprecated)
<option>: FILE | TOrder | SOrder
; display function-based code coverage starting at address 0x5000COVerage.ListFunc 0x5000
; display function-based code coverage for the specified address rangeCOVerage.ListFunc 0x5394--0x630f
; display function-based code coverage for the specified moduleCOVerage.ListFunc \jquant2
; display function-based code coverage for the specified functionsCOVerage.ListFunc find_nearby_colors finish_pass1 jinit_2pass_quantizer
General Commands Reference Guide C 98 ©1989-2019 Lauterbach GmbH

"<path>" [/FILE]]
Display function-based code coverage for all functions in the specified source files. You can use the build path or in conjunction with the option /FILE the debug path of the source file.
SOrder, TOrder
See also
■ COVerage.ListFunc.SOURCE ■ COVerage.ListFunc.sYmbol ■ COVerage.List ■ COVerage.ListLine ■ COVerage.ListModule ■ COVerage ■ COVerage.EXPORT.ListFunc ■ COVerage.state
▲ ’Release Information’ in ’Release History’▲ ’Trace-based Code Coverage’ in ’ARM-ETM Training’
COVerage.ListFunc.SOURCE Filter functions by source file
Lists the functions using <source_file> as filter criterion.
tbd.
COVerage.ListFunc "D:\work\rweiss\demo\mpc5xxx\mpc5646c_jpeg\jdpostct.c"
COVerage.ListFunc "D:\work\rweiss\demo\mpc5xxx\mpc5646c_jp*"
COVerage.ListFunc "J:\AND\mpc5646c_jpeg\jdpostct.c" /FILE
COVerage.ListFunc "J:\AND\mpc5646c_jpeg\jdp*" /FILE
SOrder Sorts lines by line number.tbd.
TOrder Sorts lines by address.tbd.
Format: COVerage.ListFunc.SOURCE [<source_file>…] [/<option>]
<option>: SOrder | TOrder
<source_file> You can use one or more source file names as filter criteria. The wildcards ‘*’ and ‘?’ are supported. Only functions matching the filter criteria are displayed. tbd.
<option> For a description of the options, see COVerage.ListFunc.
General Commands Reference Guide C 99 ©1989-2019 Lauterbach GmbH
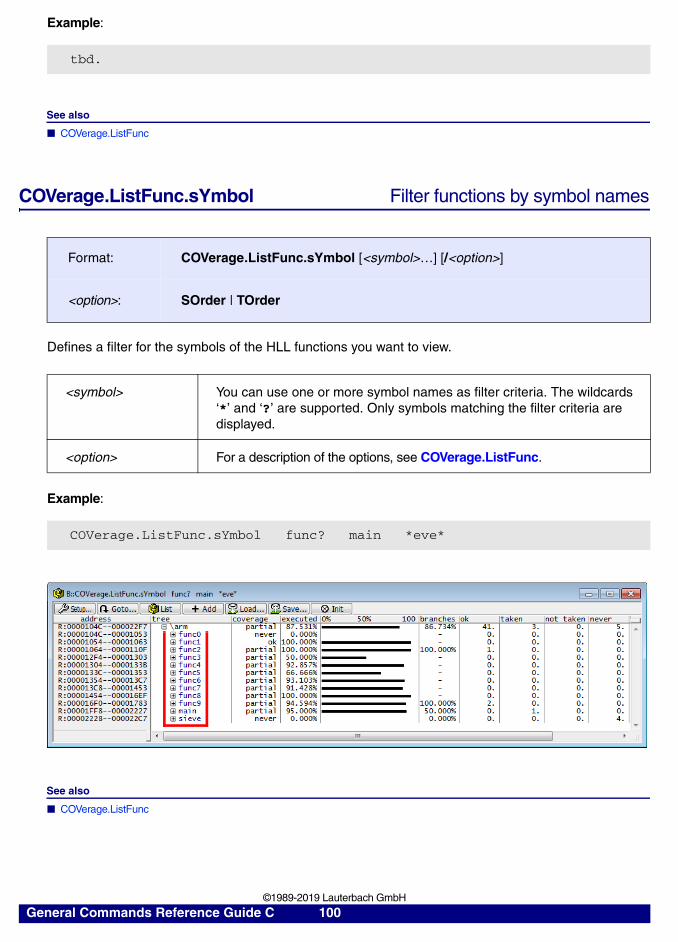
Example:
See also
■ COVerage.ListFunc
COVerage.ListFunc.sYmbol Filter functions by symbol names
Defines a filter for the symbols of the HLL functions you want to view.
Example:
See also
■ COVerage.ListFunc
tbd.
Format: COVerage.ListFunc.sYmbol [<symbol>…] [/<option>]
<option>: SOrder | TOrder
<symbol> You can use one or more symbol names as filter criteria. The wildcards ‘*’ and ‘?’ are supported. Only symbols matching the filter criteria are displayed.
<option> For a description of the options, see COVerage.ListFunc.
COVerage.ListFunc.sYmbol func? main *eve*
General Commands Reference Guide C 100 ©1989-2019 Lauterbach GmbH

COVerage.ListGroup Display coverage for groups
Groups are created with the GROUP.Create command. Using the COVerage.ListGroup command, you can display the results of the coverage analysis for these groups.
The string enclosed between quotation marks (e.g. “arm_uppermemory”) is a user-definable group name. Open the GROUP.List window to enable or disable a group. The COVerage.ListGroup window updates accordingly.
Double-clicking a line displays detailed coverage information about the respective address range or symbol.
Example:
See also
■ COVerage.List ■ COVerage ■ COVerage.state
Format: COVerage.ListGroup (deprecated)
COVerage.ADD ;Update the coverage databaseGROUP.Create "arm_lowermemory" sYmbol.BEGIN(func0)--sYmbol.END(func3)GROUP.Create "arm_middlememory" sYmbol.BEGIN(func4)--sYmbol.END(func25)GROUP.Create "arm_uppermemory" sYmbol.BEGIN(func27)--sYmbol.END(func40)
Group.DISABLE "arm_uppermemory"
COVerage.ListGroup ;Open the COVerage.ListGroup window
Gray means that this group is disabled.
General Commands Reference Guide C 101 ©1989-2019 Lauterbach GmbH

COVerage.ListLine Display coverage for HLL lines
Displays the results of the coverage analysis related to HLL lines.
If the command contains no arguments, then all HLL lines are displayed. If <string> or <range> arguments are passed, then only items matching the filter criteria are displayed (for a source code example, see below).
Example:
See also
■ COVerage.ListLine.SOURCE ■ COVerage.ListLine.sYmbol ■ COVerage.List ■ COVerage.ListFunc ■ COVerage.ListModule ■ COVerage ■ COVerage.EXPORT.ListLine ■ COVerage.state
▲ ’Release Information’ in ’Release History’
Format: COVerage.ListLine [<string> | <range>] [/<option>]<trace>.COVerage.ListLine (deprecated)
<option>: FILE | SOrder | TOrder
<string>, <range>, etc.
For a description of command line arguments <string>, <range>, etc., see COVerage.ListFunc.
COVerage.ADD ;Update the coverage database
COVerage.ListLine "*chario.c" ;Display all items which contain the ;file chario.cCOVerage.ListLine main ;Display coverage for function main
General Commands Reference Guide C 102 ©1989-2019 Lauterbach GmbH
COVerage.ListLine.SOURCE tbd.
tbd.
See also
■ COVerage.ListLine
COVerage.ListLine.sYmbol Define filter for symbols of HLL lines
Defines a filter for the symbols of the HLL lines you want to view.
See also
■ COVerage.ListLine
Format: COVerage.ListLine.SOURCE [<source_file>…] [/<option>]
<option>: SOrder | TOrder
<source_file> tbd.
<option> For a description of the options, see COVerage.ListFunc.
Format: COVerage.ListLine.sYmbol [<symbol>…] [/<option>]
<option>: SOrder | TOrder
<symbol> You can use one or more symbol names as filter criteria. The wildcards ‘*’ and ‘?’ are supported. Only symbols matching the filter criteria are displayed.
<option> For a description of the options, see COVerage.ListFunc.
General Commands Reference Guide C 103 ©1989-2019 Lauterbach GmbH

COVerage.ListModule Display coverage for modules
Displays the results of the coverage analysis related to modules. Double-clicking a line displays the function and detailed information about the coverage.
If the command contains no arguments, then all modules are displayed. If <string> or <range> arguments are passed, then only items matching the filter criteria are displayed (for a source code example, see below).
Example:
See also
■ COVerage.ListModule.SOURCE ■ COVerage.ListModule.sYmbol ■ COVerage.List ■ COVerage.ListFunc ■ COVerage.ListLine ■ COVerage ■ COVerage.EXPORT.ListModule ■ COVerage.state
▲ ’Release Information’ in ’Release History’
Format: COVerage.ListModule [<string> | <range>] [/<option>]<trace>.COVerage.ListModule (deprecated)
<option>: FILE | SOrder | TOrder
<string>, <range>, etc.
For a description of command line arguments <string>, <range>, etc., see COVerage.ListFunc.
COVerage.ADD ;Update the coverage database
COVerage.ListModule "math.h" ;Display all items which contain the ;file math.hCOVerage.ListModule \cppdemo ;Display coverage for module cppdemo
General Commands Reference Guide C 104 ©1989-2019 Lauterbach GmbH
COVerage.ListModule.SOURCE tbd.
tbd.
See also
■ COVerage.ListModule
COVerage.ListModule.sYmbol tbd.
Defines a filter for the symbols of the modules you want to view.
See also
■ COVerage.ListModule
Format: COVerage.ListModule.SOURCE [<source_file>…] [/<option>]
<option>: SOrder | TOrder
<source_file> tbd.
<option> For a description of the options, see COVerage.ListFunc.
Format: COVerage.ListModule.sYmbol [<symbol>…] [/<option>]
<option>: SOrder | TOrder
<symbol> You can use one or more symbol names as filter criteria. The wildcards ‘*’ and ‘?’ are supported. Only symbols matching the filter criteria are displayed.
<option> For a description of the options, see COVerage.ListFunc.
General Commands Reference Guide C 105 ©1989-2019 Lauterbach GmbH
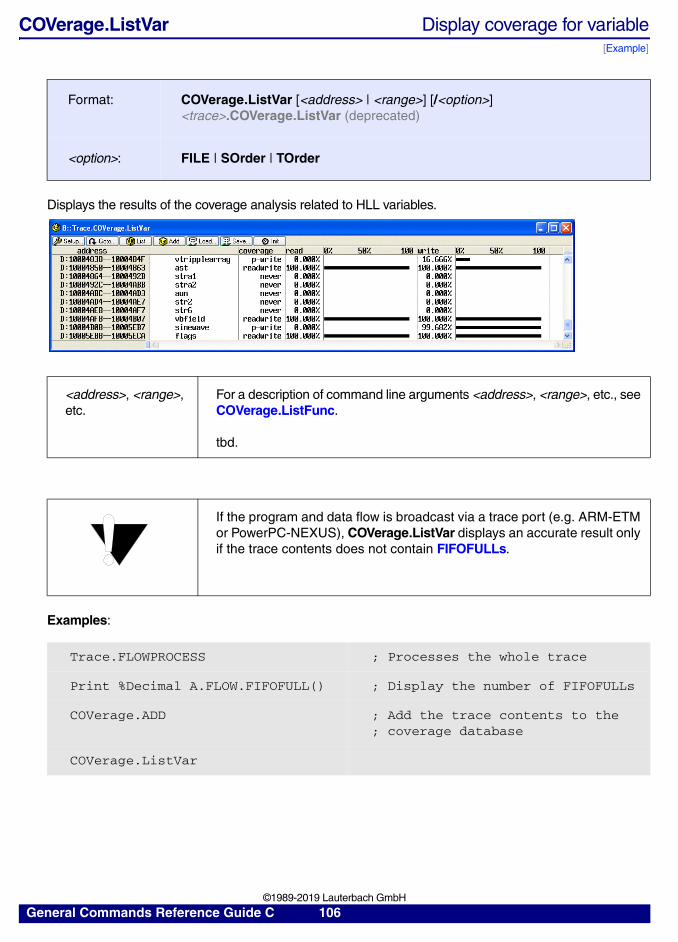
COVerage.ListVar Display coverage for variable[Example]
Displays the results of the coverage analysis related to HLL variables.
Examples:
Format: COVerage.ListVar [<address> | <range>] [/<option>]<trace>.COVerage.ListVar (deprecated)
<option>: FILE | SOrder | TOrder
<address>, <range>, etc.
For a description of command line arguments <address>, <range>, etc., see COVerage.ListFunc.
tbd.
If the program and data flow is broadcast via a trace port (e.g. ARM-ETM or PowerPC-NEXUS), COVerage.ListVar displays an accurate result only if the trace contents does not contain FIFOFULLs.
Trace.FLOWPROCESS ; Processes the whole trace
Print %Decimal A.FLOW.FIFOFULL() ; Display the number of FIFOFULLs
COVerage.ADD ; Add the trace contents to the; coverage database
COVerage.ListVar
General Commands Reference Guide C 106 ©1989-2019 Lauterbach GmbH

See also
■ COVerage.ListVar.SOURCE ■ COVerage.ListVar.sYmbol ■ COVerage.List ■ COVerage ■ COVerage.EXPORT.ListVar ■ COVerage.state
; display coverage analysis for all variables located in the specified; address rangeCOVerage.ListVar 0x10004600--0x100046ff
; display coverage analysis for all variables located at the specified; address or higherCOVerage.ListVar 0x10004800
General Commands Reference Guide C 107 ©1989-2019 Lauterbach GmbH

COVerage.ListVar.SOURCE tbd.
tbd.
See also
■ COVerage.ListVar
COVerage.ListVar.sYmbol tbd.
Defines a filter for the symbols of the HLL variables you want to view.
See also
■ COVerage.ListVar
Format: COVerage.ListVar.SOURCE [<source_file>…] [/<option>]
<option>: SOrder | TOrder
<source_file> tbd.
<option> For a description of the options, see COVerage.ListFunc.
Format 2: COVerage.ListVar.sYmbol [<symbol>…] [/<option>]
<option>: SOrder | TOrder
<symbol> You can use one or more symbol names as filter criteria. The wildcards ‘*’ and ‘?’ are supported. Only symbols matching the filter criteria are displayed.
<option> For a description of the options, see COVerage.ListFunc.
General Commands Reference Guide C 108 ©1989-2019 Lauterbach GmbH

COVerage.LOAD Load coverage database from file
Loads the code coverage information from a file. The currently available code coverage information is discarded.
See also
■ COVerage ■ COVerage.state
▲ ’Trace-based Code Coverage’ in ’Nexus Training’
Format: COVerage.LOAD <file> [/<option>] <trace>.COVerage.LOAD (deprecated)
<option>: ReplaceADDSUBtract
<file> Name of the file with a previously saved code coverage data set. The default extension of the file name is *.acd. The file extension *.acd can be omitted.
Replace (default)
Removes the current coverage information of TRACE32 and replaces it with the stored coverage data set of the file.
ADD Keeps the current coverage information of TRACE32 and updates it with the stored coverage data set of the file.
SUBtract Removes all coverage information of TRACE32 that is also present in the stored coverage data set of the file.
General Commands Reference Guide C 109 ©1989-2019 Lauterbach GmbH

COVerage.MAP Map the coverage to a different range
Allows to summarize the coverage of a code section that is available several times in a program, e.g. a shared library that is used more the once.
Maps the code coverage of a source range to a destination range. Both ranges have to have the same length.
See also
■ COVerage ■ COVerage.state
Format: COVerage.MAP <source> <destination> [/<option>]
<option>: ReplaceADDSUBtract
<source> The address range whose code coverage is mapped to another one.
<destination> The address range whose code coverage is updated.
Replace Removes the current coverage information of the destination range and replaces it with the coverage data of the source range.
ADD Keeps the current coverage information of the destination range, but updates it with the coverage data of the source range.
SUBtract Removes all coverage information of the destination range that is also present in the coverage data set of the source range.
General Commands Reference Guide C 110 ©1989-2019 Lauterbach GmbH

COVerage.METHOD Select code coverage method
TRACE32 supports various code coverage methods. The code coverage method INCremental is supported for all processor architectures, as long as information about the executed instructions is recorded by a TRACE32 trace tool or by an onchip trace buffer. All other methods are subject to restrictions.
Format: COVerage.METHOD INCremental | SPY | RTS | ART | Hardware
INCremental INCRemental code coverage is based on the trace recording. After the trace recording stopped the command COVerage.ADD can be used to add the current trace recording to the code coverage database.
Incremental code coverage is the preferred method for the Trace.Modes Fifo, Stack and Leash, but it can also be used in conjunction with the Trace.Mode STREAM.
SPY SPY code coverage is based on the trace recording. It can only be selected if the Trace.Mode STREAM is active. While trace data is being recorded, streaming to the host is automatically interrupted at regular intervals in order to update the coverage database.
SPY code coverage is only recommended if the processor/trace protocol in use is not supported by RTS. For setup details, refer to the example below.
SPY code coverage is only possible for static code and is otherwise subject to the same restrictions as Trace.Mode STREAM.
RTS RTS stands for Real-time Processing. The COVerage.METHOD RTS is automatically enabled if RTS.ON. Trace data are processed while recording and a live display of the code coverage results is possible. For details refer to the examples given in the description of the RTS command group.
RTS code coverage is subject to the same restrictions as the RTS command group.
ART ART code coverage is based on the assembler single steps recorded to the TRACE32 Advanced Register Trace ART. The code coverage database is updated after every single step. ART code coverage is only supported for a limited number of processor architectures. If you processor architecture is not supported, please contact the Lauterbach technical support.
General Commands Reference Guide C 111 ©1989-2019 Lauterbach GmbH
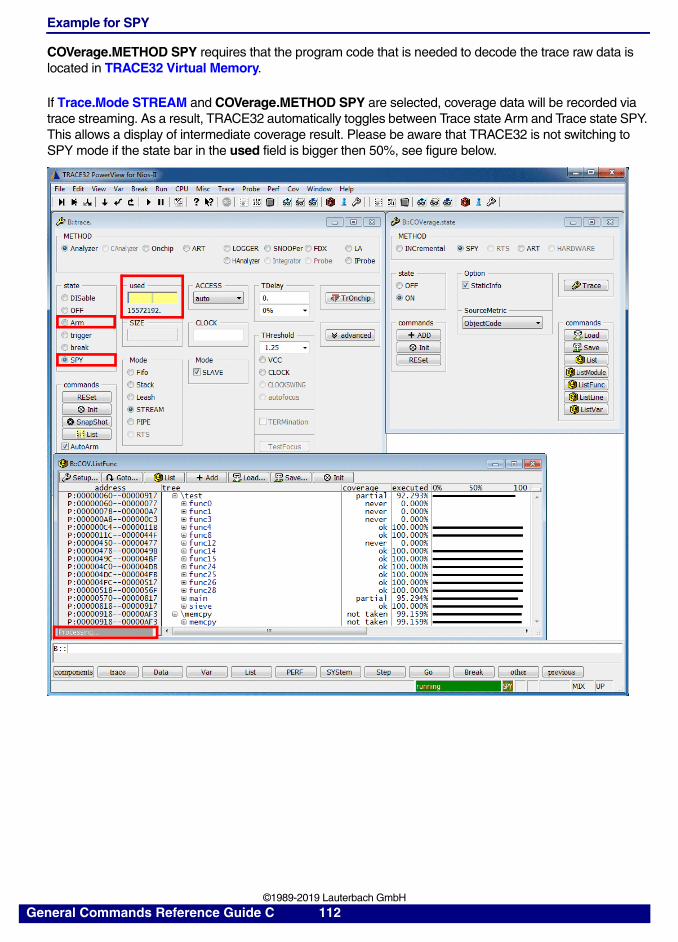
Example for SPY
COVerage.METHOD SPY requires that the program code that is needed to decode the trace raw data is located in TRACE32 Virtual Memory.
If Trace.Mode STREAM and COVerage.METHOD SPY are selected, coverage data will be recorded via trace streaming. As a result, TRACE32 automatically toggles between Trace state Arm and Trace state SPY. This allows a display of intermediate coverage result. Please be aware that TRACE32 is not switching to SPY mode if the state bar in the used field is bigger then 50%, see figure below.
General Commands Reference Guide C 112 ©1989-2019 Lauterbach GmbH

See also
■ COVerage ■ COVerage.state ■ <trace>.Mode ■ ART ■ RTS.ON
▲ ’Release Information’ in ’Release History’
Data.LOAD … /PlusVM ; with the option PlusVM the; object code is loaded to the ; target and the TRACE32 virtual; memory.
…
Trace.Mode STREAM ; switch trace to STREAM mode
COVerage.METHOD SPY ; switch coverage to SPY mode
COVerage.ListFunc ; open window to display coverage; for HLL functions
COVerage.ON ; advise TRACE32 to display ; intermediate coverage results
Go ; start program execution
…
General Commands Reference Guide C 113 ©1989-2019 Lauterbach GmbH
COVerage.Mode Activate code coverage for virtual targets
Activates code coverage for virtual targets with minimal trace activation.
See also
■ COVerage ■ COVerage.state
COVerage.OFF Deactivate coverage
Coverage data will not be recorded.
See also
■ COVerage ■ COVerage.state
Format: COVerage.Mode <mode>
<mode>: FastCOVerage [ON | OFF]
FastCOVerage Code coverage via the MCD interface. TRACE32 instructs a virtual target via the MCD interface to perform a code coverage analysis. Upon completion of the coverage analysis, the coverage information is imported to the TRACE32 coverage database with the COVerage.ADD command.
Prerequisite: COVerage.METHOD.INCremental is selected in the COVerage.state window.
Format: COVerage.OFF
General Commands Reference Guide C 114 ©1989-2019 Lauterbach GmbH

COVerage.ON Activate coverage
Activates the currently selected COVerage.METHOD.
See also
■ COVerage ■ COVerage.state
Format: COVerage.ON
General Commands Reference Guide C 115 ©1989-2019 Lauterbach GmbH

COVerage.Option Set coverage options
Using the COVerage.Option command group, you can configure how TRACE32 processes or displays code coverage data.
See also
■ COVerage.Option.BLOCKMode ■ COVerage.Option.EXLiteralPools ■ COVerage.Option.NoStaticInfo ■ COVerage.Option.SourceMetric ■ COVerage.Option.StaticInfo ■ COVerage ■ COVerage.state
COVerage.Option.BLOCKMode tbd.
Changes how code coverage measurements are applied to HLL lines.
tbd.tbd.
Example: Please refer to COVerage.EXPORT.CBA.
See also
■ COVerage.Option ■ COVerage.EXPORT.CBA
COVerage.Option.EXLiteralPools Ignore literal pools for coverage
Excludes all literal pools within HLL functions and lines from the calculation of the coverage in the COVerage.ListModule, COVerage.ListFunc, and COVerage.ListLine windows. HLL functions and lines are capable of achieving full coverage, even though they contain literal pools within their address range.
See also
■ COVerage.Option
Format: COVerage.Option.BLOCKMode [ON | OFF]
ON The code coverage result applies to all associated HLL lines.
OFF The code coverage result is applied only to the last HLL line.
Format: COVerage.Option.EXLiteralPools [ON | OFF] (deprecated)
General Commands Reference Guide C 116 ©1989-2019 Lauterbach GmbH

COVerage.Option.NoStaticInfo Skip the generation of static flow information
See also
■ COVerage.Option
COVerage.Option.SourceMetric Set coverage criterion for HLL lines
Sets the code coverage criterion for HLL lines that is used for the display of listings and in export files. Blocks of assembly instructions are not affected by this option.
Format: COVerage.Option.NoStaticInfo [ON | OFF] (deprecated)Use COVerage.Option.StaticInfo instead.
Format: COVerage.Option.SourceMetric <criterion>
<criterion>: ObjectCodeStatementDecisionMCDC
ObjectCode Maps the tags of the corresponding block of assembly instructions to the HLL line. See• “Tags for Object Code Coverage ARM-PTM, ARM-ETMv4 and
ETM.COND OFF, all not ARM traces”, page 118.
• “Tags for Object Code Coverage ARM-ETMv1, ARM-ETMv3, ARM-ETMv4 and ETM.COND not OFF”, page 118.
• “Tags for Object Code Coverage Data Trace”, page 119.
Statement Indicates if an HLL line has achieved the code coverage criterion statement coverage. See “Tags for Statement Coverage”, page 121.
Decision Indicates if an HLL line has achieved the code coverage criterion decision coverage. See “Tags for Decision Coverage”, page 121.
MCDC Modified condition/decision coverage (MC/DC).Indicates if an HLL line has achieved the code coverage criterion modified condition/decision coverage. See “Tags for Modified Condition/Decision Coverage (MC/DC)”, page 121.
General Commands Reference Guide C 117 ©1989-2019 Lauterbach GmbH

For the selections Statement and Decision the available debug symbol information is used to improve the accuracy of the code coverage. E.g. literal pools and alignment padding blocks are excluded from the code coverage calculations.
Tags for Object Code Coverage ARM-PTM, ARM-ETMv4 and ETM.COND OFF, all not ARM traces
If trace information is only generated for direct and indirect branches the following tags are used to indicate the coverage status of single assembly instructions:
• ok: The assembly instruction has been fully covered. This tag indicates for conditional branches that the condition to trigger the jump in the program flow has been evaluated true and false at least once respectively. For all other assembly instruction this tag has the meaning that the opcode has been executed.
• taken: The conditional branch has only been taken. This tag indicates that the condition to trigger the jump in the program flow has been evaluated only true and never false.
• not taken: The conditional branch has never been taken. This tag means that the condition to trigger the jump in the program flow has been evaluated only false and never true.
• never: The assembly instruction has never been executed. In case of a conditional branch this tag signals that the condition to trigger the jump in the program flow has never been evaluated.
If a tag marks the coverage status of HLL source code statements and if trace information is only generated for direct and indirect branches, the following definitions apply:
• ok: The HLL source code statement(s) have been fully covered. All associated assembly instructions have been fully covered.
• partial: The HLL source code statement(s) have not been fully covered. At least one associated assembly instruction has not been fully covered.
• branches: The HLL source code statement(s) have not been fully covered. At least one associated conditional branch has only been taken and at least one other has never been taken. In addition all other assembly instructions have been fully covered.
• taken: The HLL source code statement(s) have not been fully covered. At least one associated conditional branch has only been taken and all other assembly instructions have been fully covered.
• not taken: The HLL source code statement(s) have not been fully covered. At least one associated conditional branch has never been taken and all other assembly instructions have been fully covered.
• never: The HLL source code statement(s) have been never executed. None of the associated assembly instructions has been executed.
Tags for Object Code Coverage ARM-ETMv1, ARM-ETMv3, ARM-ETMv4 and ETM.COND not OFF
The ARM-ETMv1, ETMv3 and ETMv4 allow conditional instructions. If trace information is generated for direct and indirect branches, and for conditional instructions the following tags are used to specify the coverage status of single assembly instructions:
• ok: The assembly instruction has been fully covered. This tag indicates for conditional instructions that the predicate has been evaluated true and false at least once. For all other assembly instructions this tag has the meaning that the opcode has been executed.
General Commands Reference Guide C 118 ©1989-2019 Lauterbach GmbH

• only exec: The conditional instruction has only been executed. This tag indicates that the predicate has been evaluated only true and never false.
• not exec: The conditional instruction has never been executed. This tag means that the predicate has been evaluated only false and never true.
• never: The assembly instruction has never been executed. In case of a conditional instruction this tag states that the predicate has never been evaluated.
If a tag marks the coverage status of HLL source code statements and if trace information is generated for direct and indirect branches, and for conditional instructions, the following tagging applies:
• ok: The HLL source code statement(s) have been fully covered. All associated assembly instructions have been fully covered.
• partial: The HLL source code statement(s) have not been fully covered. At least one associated assembly instruction has not been fully covered.
• cond exec: The HLL source code statement(s) have not been fully covered. At least one associated conditional instruction has only been executed and at least one other has been never executed. In addition all other assembly instructions have been fully covered.
• only exec: The HLL source code statement(s) have not been fully covered. At least one associated conditional instruction has been only executed and all other assembly instructions have been fully covered.
• not exec: The HLL source code statement(s) have not been fully covered. At least one associated conditional instruction has never been executed and all other assembly instructions have been fully covered.
• never: The HLL source code statement(s) have never been executed. None of the associated assembly instructions has been executed.
Tags for Object Code Coverage Data Trace
A data trace allows the tracking of read and write accesses. If data trace information is available, it is automatically combined with the coverage information of assembly and source ode statements.
For the use of a data trace the coverage status of a single data value is specified by the following set of tags:
• read: The data value has been read. This tag indicates that at least one read access to the data value has taken place.
• write: The data value has been written. This tag means that at least one write access to the data value has occurred.
• readwrite: A data value has been read and written. This tag is used in case of at least one read and one write access to the data value.
• never: A data value has never been accessed. This tag specifies that neither a read nor a write access to the data value has been recorded.
General Commands Reference Guide C 119 ©1989-2019 Lauterbach GmbH
The coverage status of HLL source code statements that have associated data values is indicated by the following tags if a data trace is available:
• rdwr ok: The HLL source code statement(s) have been fully covered. All associated assembly instructions have been fully covered and at least one read and write access to the data values has been recorded.
• write ok: The HLL source code statement(s) have been fully covered. All associated assembly instructions have been fully covered and at least one write access to the data values has been recorded.
• read ok: The HLL source code statement(s) have been fully covered. All associated assembly instructions have been fully covered and at least one read access to the data values has been recorded.
• partial: The HLL source code statement(s) have not been fully covered. At least one of the associated assembly instructions has not been fully covered. The amount of read and write accesses that have taken place is not further specified.
• readwrite: The HLL source code statement(s) have never been executed. None of the associated assembly instructions has been executed and all of the data values have been read and written at least once.
• write: The HLL source code statement(s) have never been executed. None of the associated assembly instructions has been executed and all of the data values have been written at least once and not read.
• read: The HLL source code statement(s) have never been executed. None of the associated assembly instructions has been executed and all of the data values have been read at least once and not written.
• p-rd write: The HLL source code statement(s) have never been executed. None of the associated assembly instructions has been executed and all of the data values have been written at least once. In addition at least one data value has been read.
• p-wr read: The HLL source code statement(s) have never been executed. None of the associated assembly instructions has been executed and all of the data values have been read at least once. In addition at least one data value has been written.
• p-rd p-wr: The HLL source code statement(s) have never been executed. None of the associated assembly instructions has been executed and at least one of the data values has been read and one written.
• p-write: The HLL source code statement(s) have never been executed. None of the associated assembly instructions has been executed and at least one of the data values has been written.
• p-read: The HLL source code statement(s) have never been executed. None of the associated assembly instructions has been executed and at least one of the data values has been read.
• never: The HLL source code statement(s) have never been executed. None of the associated assembly instructions has been executed and neither read nor write accesses to the data values have been recorded.
General Commands Reference Guide C 120 ©1989-2019 Lauterbach GmbH

Tags for Statement Coverage
Statement coverage is achieved for a group of HLL source code statements as soon as one of its associated assembly instructions has been partially executed.
If a tag marks the coverage status of HLL source code statements, the following definitions apply:
• stmt: The measured code coverage of the HLL source code statement(s) is sufficient to achieve statement coverage.
• incomplete: The measured code coverage of the HLL source code statement(s) is not sufficient to achieve statement coverage.
Tags for Decision Coverage
Decision coverage is achieved for a group of HLL source code statements as soon as all of its associated assembly instructions have been fully covered.
If a tag marks the coverage status of HLL source code statements, the following definitions apply:
• stmt+dc: The measured code coverage of the HLL source code statement(s) is sufficient to achieve decision coverage.
• incomplete: The measured code coverage of the HLL source code statement(s) is not sufficient to achieve decision coverage.
Tags for Modified Condition/Decision Coverage (MC/DC)
MC/DC is achieved for a group of HLL source code statements as soon as the independence effect of all of its associated conditional branches/instructions has been demonstrated.
If a tag marks the coverage status of HLL source code statements, the following definitions apply:
• stmt+mc/dc: The range contains one or more HLL source code statements. The measured code coverage of the HLL source code statement(s) is sufficient to achieve MC/DC.
• mc/dc: The HLL source code statement(s) contain a decision. The measured code coverage of the HLL source code statement(s) is sufficient to achieve MC/DC.
• stmt: The HLL source code statement(s) do not contain a decision. The measured code coverage of the HLL source code statement(s) is sufficient to achieve statement coverage.
• incomplete: The measured code coverage of the HLL source code statement(s) is not sufficient to achieve MC/DC.
See also
■ COVerage.Option ■ sYmbol.ECA ❏ COVerage.SourceMetric()
▲ ’Release Information’ in ’Release History’
General Commands Reference Guide C 121 ©1989-2019 Lauterbach GmbH

COVerage.Option.StaticInfo Perform code coverage precalculations
Performs the following precalculations for the code coverage if ON:
• Object code coverage
- IT block preprocessing to improve the coverage results for ARM Thumb code.
- Counting the conditional branches for the conditional branch analysis.
• Statement and decision coverage
- Detection of literal pools and alignment padding blocks.
- Counting the instructions for modules/functions without source code information.
See also
■ COVerage.Option
Format: COVerage.Option.StaticInfo [ON | OFF]
ON (default) Perform precalculations.
OFF Do not perform precalculations (recommended in the case of issues with the code coverage).
General Commands Reference Guide C 122 ©1989-2019 Lauterbach GmbH

COVerage.RESet Clear coverage database
Discards the complete code coverage information and restores the default code coverage settings.
See also
■ COVerage ■ COVerage.state
▲ ’Trace-based Code Coverage’ in ’ARM-ETM Training’▲ ’Trace-based Code Coverage’ in ’Nexus Training’
COVerage.SAVE Save coverage database to file
Saves the code coverage information to a file.
See also
■ COVerage ■ COVerage.state
▲ ’Trace-based Code Coverage’ in ’Nexus Training’
COVerage.Set Coverage modification
Marks the defined range as fully executed (ok).
See also
■ COVerage ■ COVerage.state
Format: COVerage.RESet<trace>.COVerage.RESet (deprecated)
Format: COVerage.SAVE <file><trace>.COVerage.SAVE (deprecated)
<file> The default extension of the file name is *.acd.
Format: COVerage.Set [<address> | <range>]<trace>.COVerage.Set (deprecated)
General Commands Reference Guide C 123 ©1989-2019 Lauterbach GmbH

COVerage.state Configure coverage
Opens the COVerage.state window, where you can configure the code coverage analysis and display the results.
See also
■ COVerage ■ COVerage.ACCESS ■ COVerage.ADD ■ COVerage.Delete ■ COVerage.EXPORT ■ COVerage.Init ■ COVerage.List ■ COVerage.ListFunc ■ COVerage.ListGroup ■ COVerage.ListLine ■ COVerage.ListModule ■ COVerage.ListVar ■ COVerage.LOAD ■ COVerage.MAP ■ COVerage.METHOD ■ COVerage.Mode ■ COVerage.OFF ■ COVerage.ON ■ COVerage.Option ■ COVerage.RESet ■ COVerage.SAVE ■ COVerage.Set ■ COVerage.StaticInfo ■ COVerage.TreeWalkSETUP ■ RTS.OFF
▲ ’Release Information’ in ’Release History’▲ ’Trace-based Code Coverage’ in ’ARM-ETM Training’
Format: COVerage.state
A For descriptions of the commands in the COVerage.state window, please refer to the COVerage.* commands in this chapter. Example: For information about the ListFunc button, see COVerage.ListFunc.
B Click to display the results of the code coverage analysis.
A B
General Commands Reference Guide C 124 ©1989-2019 Lauterbach GmbH
COVerage.StaticInfo Generate static program flow information
The command COVerage.StaticInfo is required to have complete and accurate coverage information also regarding code paths that are not covered in the analyzed program run (and thus not represented in the analyzed trace data).
The command performs a static analysis of all program code (based on the loaded code segments) in order to detect the total number of conditional instructions (e.g. EQ.MOV, NE.MOV,...) or conditional branches (BEQ, BNE, ...) present in the program code.
The type of analysis performed depends on the features supported by the active trace protocol. For ETM conditional instructions are detected whereas for PTM only conditional branches are detected (because the PTM protocol does not output data regarding conditional instructions).
Executing the command enables the following columns in the COVerage.ListFunc window:
• ETM: the conds column displays the percentage of fully covered conditional instructions (covered conditional instructions / total number of conditional instructions).
• PTM: the branches column displays the percentage of fully covered conditional branches (covered conditional branches / total number of conditional branches).
• The never column displays the number of uncovered (not executed) conditional instructions (ETM) respectively conditional branches (PTM).
A hyphen (-) in one of these columns indicates that a function does not include conditional instructions (ETM) or conditional branches (PTM).
See also
■ COVerage ■ COVerage.state
Format: COVerage.StaticInfo
General Commands Reference Guide C 125 ©1989-2019 Lauterbach GmbH

COVerage.TreeWalkSETUP Prepare a tree with code coverage symbols
Prepares a tree with modules, functions, and HLL lines. The tree can be traversed with the PRACTICE function COVerage.TreeWalk().
See also
■ COVerage.TreeWalkSETUP.<sub_cmd> ■ COVerage ■ COVerage.state ❏ COVerage.TreeWalk()
Format: COVerage.TreeWalkSETUP [<range>…] [<address>…] ["<path>" [/FILE]]
<path>
FILE
Defines a filter criterion for the source files that you want to export. The filter consists of the file path and refers only to source files that are listed in the source or file column of a sYmbol.List.SOURCE window.
You can use the build path or in conjunction with the option /FILE the debug path of the source file.
<range> or <address>
Filter for exporting the specified address or symbol range. The address range can be specified as follows:• Start and end address. • Only start address. Includes items in the tree from the start
address up to the maximum address of the current address space.• Symbol
General Commands Reference Guide C 126 ©1989-2019 Lauterbach GmbH

COVerage.TreeWalkSETUP.<sub_cmd> tbd.
Example:
See also
■ COVerage.TreeWalkSETUP
Format: COVerage.TreeWalkSETUP.<sub_cmd>
<sub_cmd>: SOURCE [<source_file>]sYmbol [<symbol>…]
SOURCE tbd.
sYmbol Defines a filter for the symbols you want to include in the tree.
<symbol> You can use one or more symbol names as filter criteria. The wildcards ‘*’ and ‘?’ are supported. Only symbols matching the filter criteria are displayed.
tbd.
General Commands Reference Guide C 127 ©1989-2019 Lauterbach GmbH

CTS
CTS Context tracking system (CTS)
CTS (Context Tracking System) is a technique that allows the context of the target system to be reconstructed for each single record sampled to the trace buffer. Context of the target system means here the contents of the CPU registers, the memories, the caches and TLBs (for selected architectures only).
See also
■ CTS.CACHE ■ CTS.CAPTURE ■ CTS.GOTO ■ CTS.INCremental ■ CTS.Init ■ CTS.List ■ CTS.Mode ■ CTS.OFF ■ CTS.ON ■ CTS.PROCESS ■ CTS.RESet ■ CTS.SELectiveTrace ■ CTS.SKIP ■ CTS.state ■ CTS.TAKEOVER ■ CTS.UseCACHE ■ CTS.UseConst ■ CTS.UseMemory ■ CTS.UseReadCycle ■ CTS.UseRegister ■ CTS.UseSIM ■ CTS.UseVM ■ CTS.UseWriteCycle ■ Go.Back
▲ ’TRACE32 Support for Emulation Devices’ in ’MCDS User’s Guide’▲ ’Release Information’ in ’Release History’
General Commands Reference Guide C 128 ©1989-2019 Lauterbach GmbH
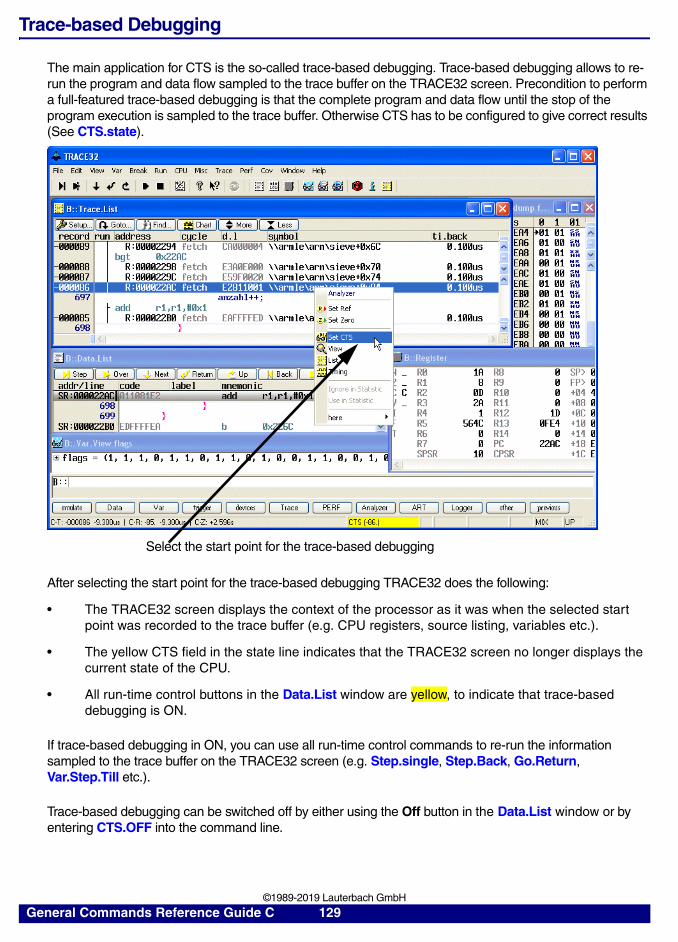
Trace-based Debugging
The main application for CTS is the so-called trace-based debugging. Trace-based debugging allows to re-run the program and data flow sampled to the trace buffer on the TRACE32 screen. Precondition to perform a full-featured trace-based debugging is that the complete program and data flow until the stop of the program execution is sampled to the trace buffer. Otherwise CTS has to be configured to give correct results (See CTS.state).
After selecting the start point for the trace-based debugging TRACE32 does the following:
• The TRACE32 screen displays the context of the processor as it was when the selected start point was recorded to the trace buffer (e.g. CPU registers, source listing, variables etc.).
• The yellow CTS field in the state line indicates that the TRACE32 screen no longer displays the current state of the CPU.
• All run-time control buttons in the Data.List window are yellow, to indicate that trace-based debugging is ON.
If trace-based debugging in ON, you can use all run-time control commands to re-run the information sampled to the trace buffer on the TRACE32 screen (e.g. Step.single, Step.Back, Go.Return, Var.Step.Till etc.).
Trace-based debugging can be switched off by either using the Off button in the Data.List window or by entering CTS.OFF into the command line.
Select the start point for the trace-based debugging
General Commands Reference Guide C 129 ©1989-2019 Lauterbach GmbH

Full HLL Trace Display
If the complete program and data flow until the stop of the program execution is sampled to the trace buffer TRACE32 can display a full HLL trace containing also register and stack variables. See the command CTS.List.
Reconstruction of Trace Gaps (TRACE32-ICD)
CTS.List can also be used to reconstruct trace information:
• trace information lost through an overload of the trace port can be reconstructed in most cases.
• if only read cycles are sampled to prevent an overload of the trace port, CTS can reconstruct all write cycles.
CTS.CACHE CTS cache analysis
TRACE32 allows to perform a cache analysis using CTS technology, i.e. based on the program execution captured in a trace recording.
The cache analysis requires detailed knowledge of the structure of the CPU’s cache. For most CPUs TRACE32 is aware of the cache structure.
To check if TRACE32 has the correct information for the cache structure of your CPU, open the CTS.CACHE.state window. To define the cache structure for TRACE32, use the TRACE32 command line or adjust the settings in the CTS.CACHE.state window.
Format: CTS.CACHE
General Commands Reference Guide C 130 ©1989-2019 Lauterbach GmbH
After CTS is switched to ON and CTS.Mode CACHE is selected, the contents of the caches and TLBs can be reconstructed. The cache analysis can be used for the following tasks:
• To support you to improve the cache hit rate by changing code and data locations
• To verify the cache hit rates after code changes
• To identify candidates for TCMs (tightly coupled memory) or faster memories
• To support you to find performance or bus bottlenecks
• To support you to improve the system performance and to reduce the power consumption
• To support you to try and verify different cache strategies
• To support you to identify optimum cache configuration and sizes for new silicons
The command group CTS.CACHE provides also the following advanced performance analysis features:
• Analysis of the branch prediction unit
• Analysis of the external bus interface
• Analysis of idle/stall operations
Even if these commands analyze different aspects of a microcontroller they are summarized here.
See also
■ CTS.CACHE.Allocation ■ CTS.CACHE.Chart ■ CTS.CACHE.CYcles ■ CTS.CACHE.DefineBus ■ CTS.CACHE.L1Architecture ■ CTS.CACHE.ListAddress ■ CTS.CACHE.ListFunc ■ CTS.CACHE.ListLine ■ CTS.CACHE.ListModules ■ CTS.CACHE.ListRequests ■ CTS.CACHE.ListSet ■ CTS.CACHE.ListVar ■ CTS.CACHE.MMUArchitecture ■ CTS.CACHE.Mode ■ CTS.CACHE.Replacement ■ CTS.CACHE.RESet ■ CTS.CACHE.SETS ■ CTS.CACHE.Sort ■ CTS.CACHE.state ■ CTS.CACHE.Tags ■ CTS.CACHE.TLBArchitecture ■ CTS.CACHE.View ■ CTS.CACHE.ViewBPU ■ CTS.CACHE.ViewBus ■ CTS.CACHE.ViewStalls ■ CTS.CACHE.WAYS ■ CTS.CACHE.Width ■ CTS ■ CTS.state
▲ ’Release Information’ in ’Release History’
General Commands Reference Guide C 131 ©1989-2019 Lauterbach GmbH

CTS.CACHE.Allocation Define the cache allocation technique
Defines the CACHE structure.
The command CTS.CACHE.Allocation describes how the CPU deals with a cache miss on a data store/write access.
See also
■ CTS.CACHE ■ CTS.CACHE.state
Format: CTS.CACHE.Allocation <cache> ReadAlloc | WriteAlloc
<cache>: ICDCL2L3
ReadAlloc The data from a memory address is only loaded to the cache on read/load accesses.
WriteAlloc The data from a memory address is loaded to the cache on a store/write access and the new data is written in the cache line. If it is also stored/written to memory depends on the cache mode (write-through or copy-back).
CTS.CACHE.Allocation IC ReadAlloc ; the instruction cache is a; read allocate cache
General Commands Reference Guide C 132 ©1989-2019 Lauterbach GmbH
CTS.CACHE.Chart Graphical display of cache analysis
Displays the results of the cache analysis in a graphical format.
Format: CTS.CACHE.Chart IC | DC | L2 | L3 <string> <range> <value> [/<option>]
CTS.CACHE.Chart STALLS <string> <range> <value> [/<option>]
CTS.CACHE.Chart BUS0 | BUS1 | BUS2 | BUS3 <string> <range> <value> [/<option>]
<option>: FileTrackZoomTrack
<string> Perform a cache analysis from the trace record marked with the bookmark <string> to the end of the trace buffer and display the result graphically.
<range> Perform a cache analysis for the defined record range and display the result graphically.
<value> Perform a cache analysis from the trace record <value> to the end of the trace buffer and display the result graphically.
File Use the trace contents loaded with the command <trace>.LOAD.
Track Track the CTS.CACHE.Chart window with other trace windows (e.g. with the Trace.Chart.sYmbol window).Tracking to record number or time is possible.
ZoomTrack Track the CTS.CACHE.Chart window with other trace chart windows (e.g. with the Trace.Chart.sYmbol window). If the zooming of the other trace chart window is changed the CTS.CACHE.Chart window is zoomed accordingly.
General Commands Reference Guide C 133 ©1989-2019 Lauterbach GmbH

Examples:
CTS.CACHE.Chart IC "bookmark" ; perform a cache analysis for; the instruction cache; start the analysis at the; record that is marked with; the bookmark "bookmark" end; the analysis at the end of; the trace buffer display the; result graphically
CTS.CACHE.Chart DC (-10000.)--(-5000.) ; perform a cache analysis for; the data cache; start the analysis at; :record (-10000.); end the analysis at the; record (-5000.); display the result; graphically
CTS.CACHE.Chart L2 (-15500.) ; perform a cache analysis for; the level 2 cache; start the analysis at the; :record t(-15500.); end the analysis at the end; of the trace buffer; display the result ; graphically
General Commands Reference Guide C 134 ©1989-2019 Lauterbach GmbH

Display Cache Hit/Cache Miss/Cache Victim Rate for the Individual Cache
The upper edge of the diagram represents the sum of all memory accesses.
Color key:
Green The cache hits
Blue The cache misses
Red The cache victims
Yellow Accesses that are categorized by the cache analysis as unknown. For details refer to CTS.CACHE.View.
Purple The trashes and the write accesses to read-allocated cache(accesses to cached memory that don’t end up in the cache)
Turquoise The accesses to not cached memory
General Commands Reference Guide C 135 ©1989-2019 Lauterbach GmbH

Display the Number of Stalls
Color key:
CTS.CACHE.Chart IC ; display cache analysis for the; instruction cache graphically
Trace.Chart.Func /ZoomTrack ; display matching trace contents; on HLL function level
Green Stall-free instructions
Red Interlock stalls caused by e.g. resource conflicts between instructions, data dependency …
Blue Memory stalls caused by e.g. cache misses, TLB misses, accesses to slow memory …All stalls that are not interlock stalls are regarded as memory stalls.
CTS.CACHE.Chart STALLS
General Commands Reference Guide C 136 ©1989-2019 Lauterbach GmbH

Display the Bus Utilization for the Individual Busses
The command CTS.CACHE.Chart BUSx displays the number of clock cycles in which the CPU used the specified bus. The bus interface has to be defined by the command CTS.CACHE.DefineBus.
See also
■ CTS.CACHE ■ CTS.CACHE.DefineBus ■ CTS.CACHE.state ■ CTS.CACHE.View ■ CTS.CACHE.ViewBus ■ CTS.CACHE.ViewStalls ■ <trace>.Chart.Func ■ <trace>.Chart.sYmbol
CTS.CACHE.CYcles Define counting method for cache analysis
Defines which method is used to count the cache hit/cache miss rate.
See also
■ CTS.CACHE ■ CTS.CACHE.state
CTS.CACHE.Chart BUS0
Format: CTS.CACHE.CYcle Core | Bus | NonSequential
Core The hit or miss counter is incremented on every core cycle.
Bus The hit or miss counter is incremented on every bus cycle.
NonSequential The hit or miss counter is only incremented if the CPU accesses a new cache line or performs a non-sequential access.
General Commands Reference Guide C 137 ©1989-2019 Lauterbach GmbH

CTS.CACHE.DefineBus Define bus interface
Defines the bus interface that is the base for the analysis of the bus utilization by the commands CTS.CACHE.ViewBus and CTS.CACHE.Chart BUSx.
The supported bus type is either SIMPLE32 or SIMPLE64. SIMPLE indicates that the number of clock cycles required by each type of memory access can be directly given.
Format: CTS.CACHE.DefineBus <bus> <range> SIMPLE32 | SIMPLE64 <frequency> <unknown> <read> <readreq> <readline> <write> <writeseq> <writeline> <writehalf>
<bus>: BUS0BUS1BUS2BUS3
<range> Memory range addressed by the bus. The physical address has to be specified (memory class A:)
<frequency> Bus frequency.
<unknown> Average number of clock cycles required by a memory access that is categorized as unknown by the cache analysis.
<read> Number of clock cycles required by a memory read access.
<readseq> Number of clock cycles required by a subsequent memory read access (e.g. burst access).
<readline> Number of clock cycles required by a cache line fill.
<write> Number of clock cycles required by a memory write access.
<writeseq> Number of clock cycles required by a subsequent memory write access (e.g. burst access).
<writeline> Number of clock cycles required to write the contents of a cache line back to memory (copy back).
<writehalf> Number of clock cycles required to write the contents of half a cache line back to memory (copy back).
General Commands Reference Guide C 138 ©1989-2019 Lauterbach GmbH

See also
■ CTS.CACHE ■ CTS.CACHE.Chart ■ CTS.CACHE.state
CTS.CACHE.L1Architecture Define architecture for L1 cache
Defines the CACHE structure. This command defines the architecture of the level 1 cache.
See also
■ CTS.CACHE ■ CTS.CACHE.state
CTS.CACHE.DefineBus BUS0 A:0++0xffffffff SIMPLE64 100.MHz1. 1. 1. 4. 1. 1. 4. 2.
CTS.CACHE.DefineBus BUS1 A:0x80000000++0x1ffffff SIMPLE32 100.MHz5. 8. 1. 6. 7. 1. 8. 4.
Format: CTS.CACHE.L1Architecture Harvard | Unified | UnifiedSplit
Harvard The L1 cache has Harvard architecture, that means there is an instruction cache and a data cache available.
Unified The L1 cache is a unified cache, that means the same cache is used for instruction fetches and data loads/stores.
UnifiedSplit The L1 cache is a unified cache, that means the same cache is used for instruction fetches and data loads/stores.But TRACE32 splits the unified cache in an instruction and data cache for the cache analysis. The splitting is based on the cycle type (e.g. read, write, ptrace, exec).
General Commands Reference Guide C 139 ©1989-2019 Lauterbach GmbH
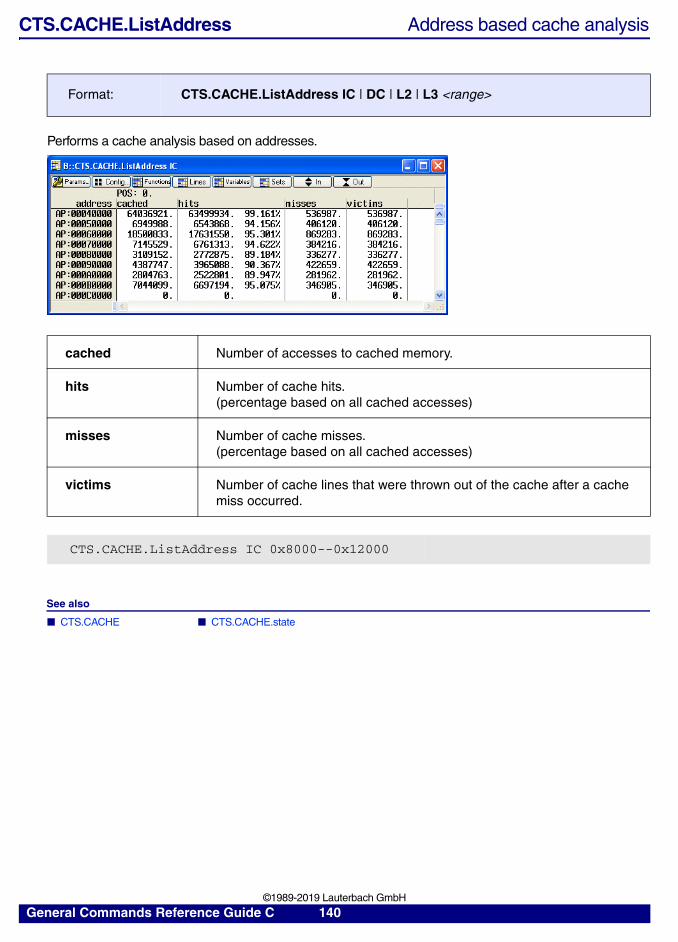
CTS.CACHE.ListAddress Address based cache analysis
Performs a cache analysis based on addresses.
See also
■ CTS.CACHE ■ CTS.CACHE.state
Format: CTS.CACHE.ListAddress IC | DC | L2 | L3 <range>
cached Number of accesses to cached memory.
hits Number of cache hits.(percentage based on all cached accesses)
misses Number of cache misses.(percentage based on all cached accesses)
victims Number of cache lines that were thrown out of the cache after a cache miss occurred.
CTS.CACHE.ListAddress IC 0x8000--0x12000
General Commands Reference Guide C 140 ©1989-2019 Lauterbach GmbH

CTS.CACHE.ListFunc Function based cache analysis
Performs a function-based cache analysis.
See also
■ CTS.CACHE ■ CTS.CACHE.state
Format: CTS.CACHE.ListFunc IC | DC | L2 | L3 [<range> | <address>]
CTS.CACHE.ListFunc IC 8000++0fff ; perform a function based cache; cache analysis for the specified; address range
General Commands Reference Guide C 141 ©1989-2019 Lauterbach GmbH

CTS.CACHE.ListLine HLL line based cache analysis
Performs an HLL-line-based cache analysis.
See also
■ CTS.CACHE ■ CTS.CACHE.state
CTS.CACHE.ListModules Module based cache analysis
Performs a module-based cache analysis.
See also
■ CTS.CACHE ■ CTS.CACHE.state
Format: CTS.CACHE.ListLine IC | DC | L2 | L3 [<range> | <address>]
CTS.CACHE.ListLine IC dosomethingbad
Format: CTS.CACHE.ListModules IC | DC | L2 | L3 [<range> | <address>]
General Commands Reference Guide C 142 ©1989-2019 Lauterbach GmbH
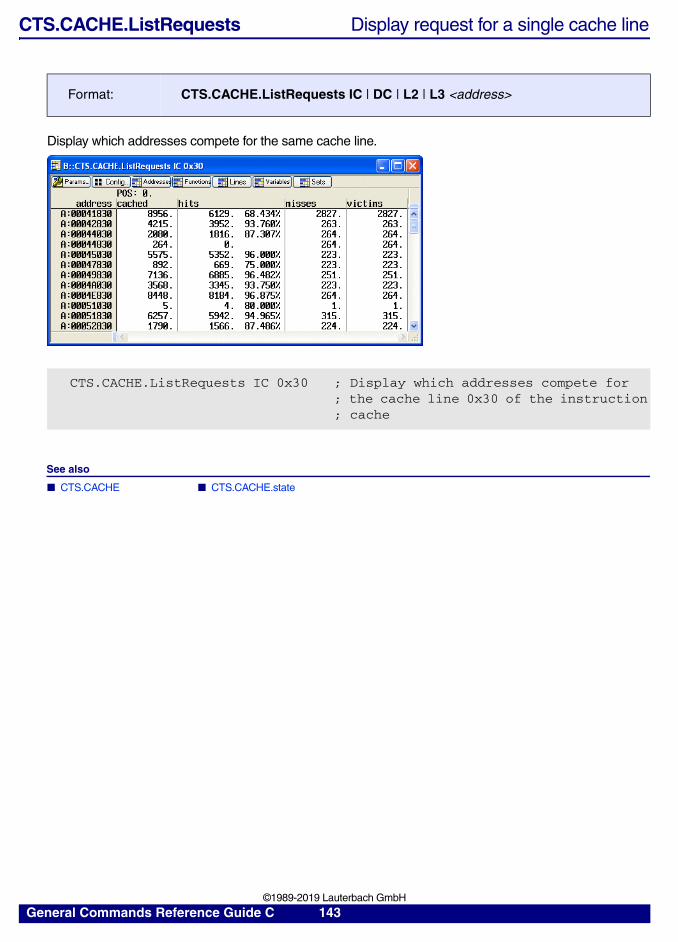
CTS.CACHE.ListRequests Display request for a single cache line
Display which addresses compete for the same cache line.
See also
■ CTS.CACHE ■ CTS.CACHE.state
Format: CTS.CACHE.ListRequests IC | DC | L2 | L3 <address>
CTS.CACHE.ListRequests IC 0x30 ; Display which addresses compete for; the cache line 0x30 of the instruction; cache
General Commands Reference Guide C 143 ©1989-2019 Lauterbach GmbH

CTS.CACHE.ListSet Cache set based cache analysis
Performs a cache analysis based on cache sets.
See also
■ CTS.CACHE ■ CTS.CACHE.state
CTS.CACHE.ListVar Variable based cache analysis
Performs a cache analysis based on variables.
See also
■ CTS.CACHE ■ CTS.CACHE.state
Format: CTS.CACHE.ListSet IC | DC | L2 | L3
Format: CTS.CACHE.ListVar IC | DC | L2 | L3 [<range> | <address>]
General Commands Reference Guide C 144 ©1989-2019 Lauterbach GmbH

CTS.CACHE.MMUArchitecture Define MMU architecture for cache control
If the MMU architecture is set, the cache analysis takes all manipulations on the cache control registers into account for the cache analysis:
• Cache flushes
• Switch-on and switch-off of the caches
• Cache locks
If CTS.CACHE.MMUArchitecture is set to NONE, the manipulations on the cache control registers are not taken into account for the cache analysis.
See also
■ CTS.CACHE ■ CTS.CACHE.state
Format: CTS.CACHE.MMUArchitecture <control>
<control>: NONEARM920TARM922TARM925TARM926EJARM946EARM1136JM341MPC55XX
General Commands Reference Guide C 145 ©1989-2019 Lauterbach GmbH

CTS.CACHE.Mode Define memory coherency strategy
Defines the CACHE structure. This command defines the strategy used for the memory coherency for each cache.
See also
■ CTS.CACHE ■ CTS.CACHE.state
Format: CTS.CACHE.Mode IC | DC | L2 | L3 <mode>
<mode>: CopyBackWriteThroughMMU
CopyBack Copy back strategy guarantees memory coherency.When a cache hit occurred for a data store/write, the cache contents is updated and the corresponding cache line is marked as dirty. The data value is copied back to memory when the contents of the cache line is evicted.
WriteThrough Write Through strategy guarantees memory coherency.When a cache hit occurs for a data store/write, the cache contents is updated and the data is also stored/written to memory.
MMU The strategy for memory coherency is taken from the MMU.
General Commands Reference Guide C 146 ©1989-2019 Lauterbach GmbH
CTS.CACHE.Replacement Define the replacement strategy
Defines the CACHE structure. This command defines the replacement strategy for each cache.
See also
■ CTS.CACHE ■ CTS.CACHE.state
Format: CTS.CACHE.Replacement <cache> <replace>
<cache>: IC | DC | L2 | L3 | ITLB | DTLB | TLB0 | TLB1
<replace>: CyclicFreeCyclicPseudoCyclicFreePseudoCyclicRandomFreeRandomLRUMMU
Cyclic Cyclic (round-robin) replacement strategy is used. One round robin counter for each cache set.
FreeCyclic Cyclic (round-robin) replacement strategy is used, but if an empty cache line is found it is filled first.
PseudoCyclic Cyclic (round-robin) replacement strategy is used. But there is only one round robin counter for all cache sets.
FreePseudoCyclic Cyclic (round-robin) replacement strategy is used• but if an empty cache line is found it is filled first• but there is only one round robin counter for all cache sets
Random Random replacement strategy is used.
FreeRandom Random replacement strategy is used, but if an empty cache line is found it is filled first.
LRU Last recently used replacement strategy is used.
MMU The replacement strategy is defined by the CPU.Please use CTS.CACHE.Replacement MMU is your CPU uses a not listed replacement strategy.
General Commands Reference Guide C 147 ©1989-2019 Lauterbach GmbH

CTS.CACHE.RESet Reset settings of CTS cache window
Resets the settings of the CTS.CACHE window.
See also
■ CTS.CACHE ■ CTS.CACHE.state
CTS.CACHE.SETS Define the number of cache sets
Defines the CACHE structure. This command defines the number of cache sets for each cache.
See also
■ CTS.CACHE ■ CTS.CACHE.state
CTS.CACHE.Sort Define sorting for all list commands
Defines the sorting for all list commands.
See also
■ CTS.CACHE ■ CTS.CACHE.state
Format: CTS.CACHE.RESet
Format: CTS.CACHE.SETS <cache> <sets>
<cache>: IC | DC | L2 | L3 | ITLB | DTLB | TLB0 | TLB1
CTS.CACHE.SETS IC 4. ; The instruction CACHE has 4 sets
CTS.CACHE.SETS DC 4. ; The data CACHE has 4 sets
Format: CTS.CACHE.Sort OFF | Address | Victims
General Commands Reference Guide C 148 ©1989-2019 Lauterbach GmbH

CTS.CACHE.state Display settings of CTS cache analysis
Displays the cache structure of your CPU in the CTS.CACHE.state window. For background information, see CTS.CACHE.
See also
■ CTS.CACHE ■ CTS.CACHE.Allocation ■ CTS.CACHE.Chart ■ CTS.CACHE.CYcles ■ CTS.CACHE.DefineBus ■ CTS.CACHE.L1Architecture ■ CTS.CACHE.ListAddress ■ CTS.CACHE.ListFunc ■ CTS.CACHE.ListLine ■ CTS.CACHE.ListModules ■ CTS.CACHE.ListRequests ■ CTS.CACHE.ListSet ■ CTS.CACHE.ListVar ■ CTS.CACHE.MMUArchitecture ■ CTS.CACHE.Mode ■ CTS.CACHE.Replacement ■ CTS.CACHE.RESet ■ CTS.CACHE.SETS ■ CTS.CACHE.Sort ■ CTS.CACHE.Tags ■ CTS.CACHE.TLBArchitecture ■ CTS.CACHE.View ■ CTS.CACHE.ViewBPU ■ CTS.CACHE.ViewBus ■ CTS.CACHE.ViewStalls ■ CTS.CACHE.WAYS ■ CTS.CACHE.Width ■ CTS.state
Format: CTS.CACHE.state
General Commands Reference Guide C 149 ©1989-2019 Lauterbach GmbH

CTS.CACHE.Tags Define address mode for cache lines
Defines the CACHE structure.
See also
■ CTS.CACHE ■ CTS.CACHE.state
Format: CTS.CACHE.Tags IC | DC | L2 | L3 <tag>
<tag>: VIVTPIPTVIPTAVIVT
VIVT Virtual Index, Virtual TagThe logical address is used as tag for a cache line.
PIPT Physical Index, Physical TagThe physical address is used as tag for a cache line.
VIPT Virtual Index, Physical Tag
AVIVT Address Space ID + Virtual Index, Virtual Tag
General Commands Reference Guide C 150 ©1989-2019 Lauterbach GmbH
CTS.CACHE.TLBArchitecture Define architecture for the TLB
Defines the CACHE structure. This command defines the architecture for the TLB cache.
See also
■ CTS.CACHE ■ CTS.CACHE.state
Format: CTS.CACHE.TLBArchitecture Harvard | Unified | UnifiedSplit
Harvard The TLB cache has Harvard architecture, that means there is an instruction TLB and a data TLB available.
Unified The TLB cache is a unified cache, that means the same TLB is used for instruction fetches and data loads/stores.
UnifiedSplit The TLB cache is a unified cache, that means the same TLB is used for instruction fetches and data loads/stores.But TRACE32 splits the unified cache in an instruction and data TLB for the cache analysis. The splitting is based on the cycles type (e.g. read/write/ptrace/exec).(not implemented yet)
General Commands Reference Guide C 151 ©1989-2019 Lauterbach GmbH

CTS.CACHE.View Display the results for the cache analysis[Columns] [Buttons]
Displays the results for the cache analysis. CTS.Mode CACHE has to be selected before any calculation can be started. The calculation of the results for the cache analysis can be activated as follows:
• By using the command CTS.PROCESS. That way the complete trace contents is analyzed.
• By selecting a part of the trace contents e.g. a function. The starting point for the analysis is selected by setting a reference point (command Analyzer.REF) to the relevant trace record.
The endpoint for the analysis is selected by setting the CTS point (command CTS.GOTO) to the relevant trace record.
Format: CTS.CACHE.View
General Commands Reference Guide C 152 ©1989-2019 Lauterbach GmbH
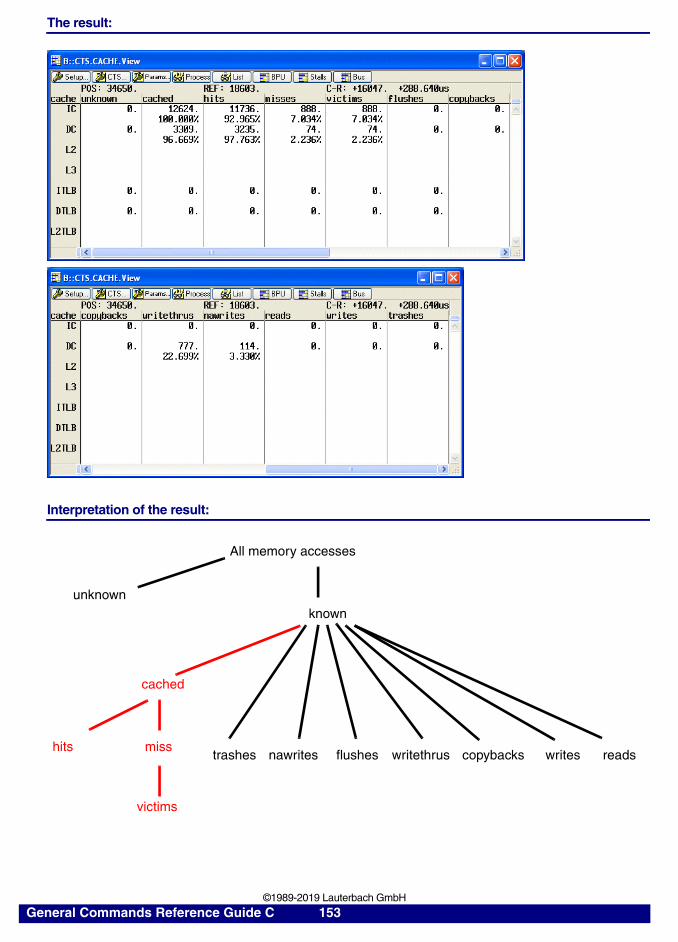
The result:
Interpretation of the result:
All memory accesses
cached
hits miss
victims
readswrites
unknownknown
copybackswritethrusnawritestrashes flushes
General Commands Reference Guide C 153 ©1989-2019 Lauterbach GmbH
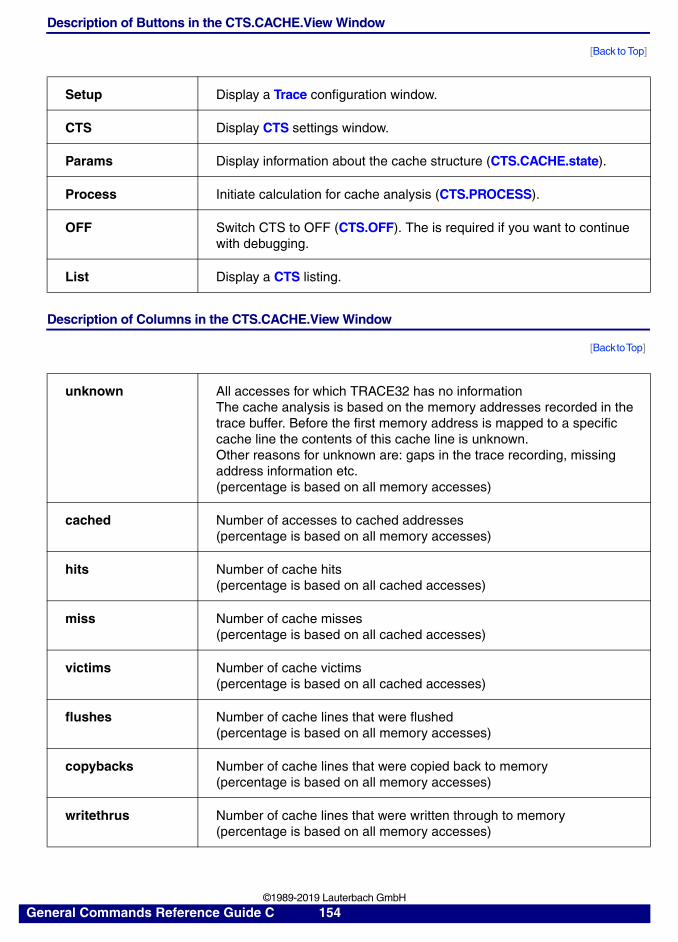
Description of Buttons in the CTS.CACHE.View Window
[Back to Top]
Description of Columns in the CTS.CACHE.View Window
[Back to Top]
Setup Display a Trace configuration window.
CTS Display CTS settings window.
Params Display information about the cache structure (CTS.CACHE.state).
Process Initiate calculation for cache analysis (CTS.PROCESS).
OFF Switch CTS to OFF (CTS.OFF). The is required if you want to continue with debugging.
List Display a CTS listing.
unknown All accesses for which TRACE32 has no informationThe cache analysis is based on the memory addresses recorded in the trace buffer. Before the first memory address is mapped to a specific cache line the contents of this cache line is unknown. Other reasons for unknown are: gaps in the trace recording, missing address information etc.(percentage is based on all memory accesses)
cached Number of accesses to cached addresses(percentage is based on all memory accesses)
hits Number of cache hits(percentage is based on all cached accesses)
miss Number of cache misses(percentage is based on all cached accesses)
victims Number of cache victims(percentage is based on all cached accesses)
flushes Number of cache lines that were flushed(percentage is based on all memory accesses)
copybacks Number of cache lines that were copied back to memory(percentage is based on all memory accesses)
writethrus Number of cache lines that were written through to memory(percentage is based on all memory accesses)
General Commands Reference Guide C 154 ©1989-2019 Lauterbach GmbH

See also
■ CTS.CACHE ■ CTS.CACHE.Chart ■ CTS.CACHE.state
nawrites Writes in a read-allocated cache(percentage is based on all memory accesses)
reads Number of not-cached reads(percentage is based on all memory accesses)
writes Number of not-cached writes(percentage is based on all memory accesses)
trashes Discarded accesses (ARM11 only)(percentage is based on all memory accesses)
General Commands Reference Guide C 155 ©1989-2019 Lauterbach GmbH

CTS.CACHE.ViewBPU Display statistic for branch prediction unit
For details about the program flow prediction please refer to your processor manual.
See also
■ CTS.CACHE ■ CTS.CACHE.state
Format: CTS.CACHE.ViewBPU
BTAC Branch Target Address Cache / Branch Folding
STATIC Static Branch Predictor
RSTACK Return Stack
instrs Total number of instructions.
branches Total number of branches.
taken Number of taken branches.
nottaken Number of not-taken branches.
predictions Total number of branch predictions.
unknown Since the contents of Branch Target Address Cache is unknown at the beginning of the analysis, the first <size_of_branch_target_address_cache> predictions are unknown.
misses No entry was found in the Branch Target Address Cache for the branch source address.
hits An entry for the branch source address was found in the Branch Target Address Cache and the prediction was correct.
fails An entry for the branch source address was found in the Branch Target Address Cache, but the prediction failed.
General Commands Reference Guide C 156 ©1989-2019 Lauterbach GmbH

CTS.CACHE.ViewBus Display statistics for the bus utilization
Displays a detailed analysis of the bus utilization.
See also
■ CTS.CACHE ■ CTS.CACHE.Chart ■ CTS.CACHE.state
Format: CTS.CACHE.ViewBus
unknown Number of clock cycles consumed by memory accesses that are categorized as unknown by the cache analysis
read Number of clock cycles consumed by memory read accesses
readseq Number of clock cycles consumed by subsequent memory read accesses (e.g. burst access)
readline Number of clock cycles consumed by cache line fill operations
write Number of clock cycles consumed by memory write accesses
writeseq Number of clock cycles consumed by subsequent memory write accesses (e.g. burst access)
writeline Number of clock cycles consumed by writing the contents of a cache line back to memory (copy back)
writehalf Number of clock cycles consumed by writing the contents of half a cache line back to memory (copy back)
bytes Number of bytes transferred via the external bus interface
clocks Number of clock cycles the external bus was busy
bytes/s Transmission rate
clocks/s Transmission frequency
used Bus load in percentage
General Commands Reference Guide C 157 ©1989-2019 Lauterbach GmbH

CTS.CACHE.ViewStalls Display statistics for idles/stalls
Analyses over the measurement interval how much cycles/time was taken by idles/stalls and how much cycles/time the CPU was really working.
Format: CTS.CACHE.ViewStalls
total Number of analyzed clock cyclesmeasurement time
idles Number of idles cycles (the CPU is not executing instructions)time the CPU was in idle modepercentage of time/clocks the CPU was in idle modenumber of time the CPU was in idle stateThe number of idles states is calculated as follows:• number of times the CPU went in power-down or sleep mode (e.g.
for the ARM architecture the number of times a Wait for Interrupt CP15 operation was performed)
• number of times a single instruction last more the 1000. clock cycles
work Number of cycles the processor was workingtime the CPU was workingpercentage of time the processor was workingnumber of instructions that were executed by the processor
stalls Number of stalls
time the CPU was stalled
percentage of time the CPU was stalled
mstalls Number of memory stallstime taken by memory stallspercentage of time taken by memory stallsMemory stalls are caused by e.g. cache misses, TLB misses, accesses to slow memory …
General Commands Reference Guide C 158 ©1989-2019 Lauterbach GmbH
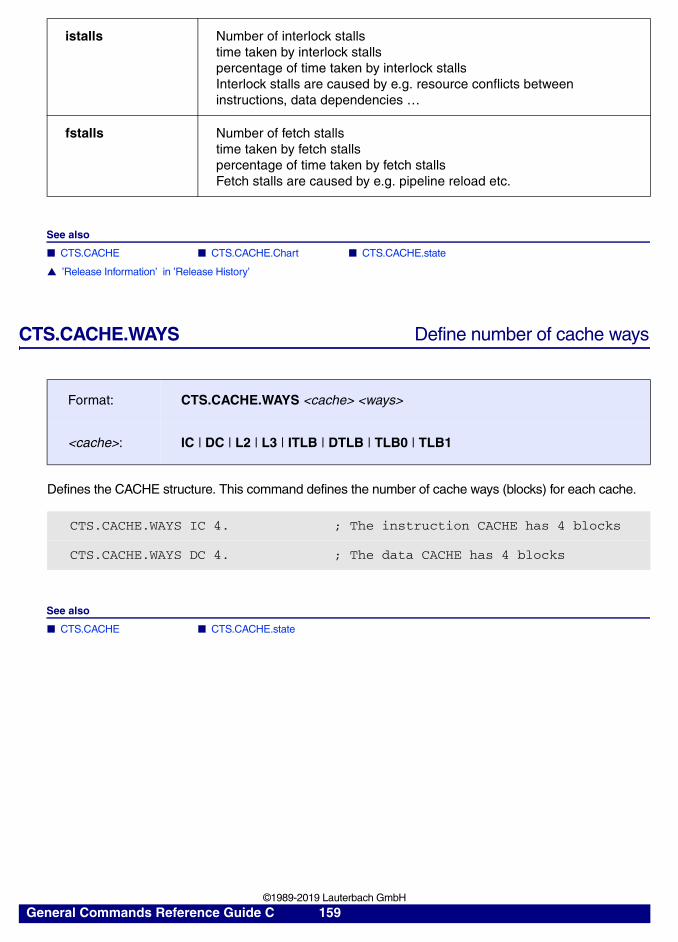
See also
■ CTS.CACHE ■ CTS.CACHE.Chart ■ CTS.CACHE.state
▲ ’Release Information’ in ’Release History’
CTS.CACHE.WAYS Define number of cache ways
Defines the CACHE structure. This command defines the number of cache ways (blocks) for each cache.
See also
■ CTS.CACHE ■ CTS.CACHE.state
istalls Number of interlock stallstime taken by interlock stallspercentage of time taken by interlock stallsInterlock stalls are caused by e.g. resource conflicts between instructions, data dependencies …
fstalls Number of fetch stallstime taken by fetch stallspercentage of time taken by fetch stallsFetch stalls are caused by e.g. pipeline reload etc.
Format: CTS.CACHE.WAYS <cache> <ways>
<cache>: IC | DC | L2 | L3 | ITLB | DTLB | TLB0 | TLB1
CTS.CACHE.WAYS IC 4. ; The instruction CACHE has 4 blocks
CTS.CACHE.WAYS DC 4. ; The data CACHE has 4 blocks
General Commands Reference Guide C 159 ©1989-2019 Lauterbach GmbH
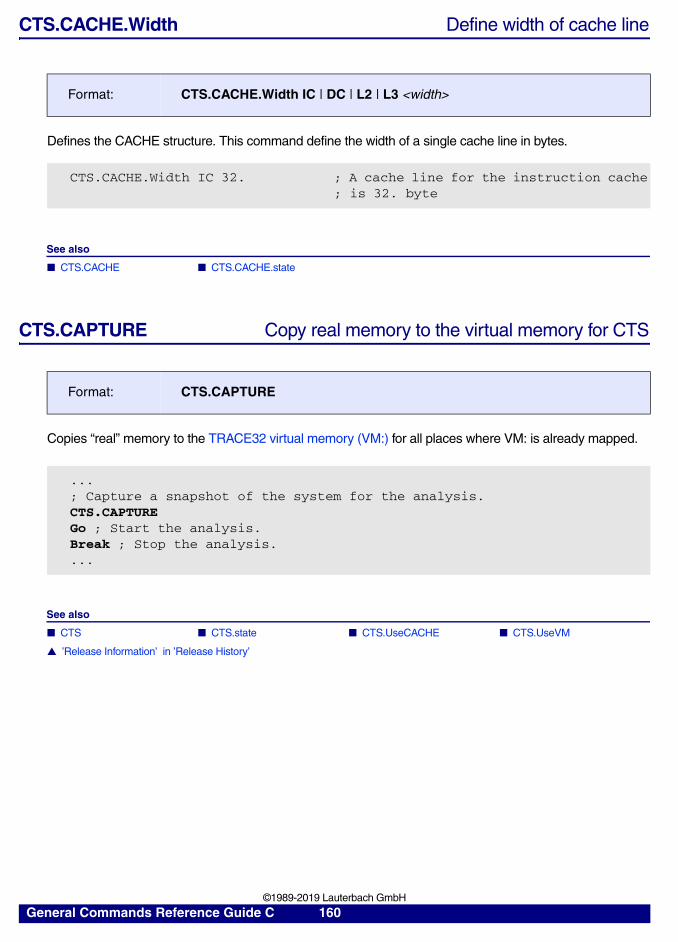
CTS.CACHE.Width Define width of cache line
Defines the CACHE structure. This command define the width of a single cache line in bytes.
See also
■ CTS.CACHE ■ CTS.CACHE.state
CTS.CAPTURE Copy real memory to the virtual memory for CTS
Copies “real” memory to the TRACE32 virtual memory (VM:) for all places where VM: is already mapped.
See also
■ CTS ■ CTS.state ■ CTS.UseCACHE ■ CTS.UseVM
▲ ’Release Information’ in ’Release History’
Format: CTS.CACHE.Width IC | DC | L2 | L3 <width>
CTS.CACHE.Width IC 32. ; A cache line for the instruction cache; is 32. byte
Format: CTS.CAPTURE
...; Capture a snapshot of the system for the analysis.CTS.CAPTURE Go ; Start the analysis.Break ; Stop the analysis....
General Commands Reference Guide C 160 ©1989-2019 Lauterbach GmbH

CTS.GOTO Select the specified record for CTS (absolute)
Selects the specified record for the trace based debugging. If CTS is OFF, CTS is switched to ON by this command.
This command can be used to set the starting point for trace-based debugging.
See also
■ CTS ■ CTS.state
CTS.INCremental CTS displays intermediate results while processing
See also
■ CTS ■ CTS.state
Format: CTS.GOTO <record> [/FILE]
FILE Takes trace memory contents loaded by <trace>.LOAD.
CTS.GOTO -123. ; Select record -123. for CTS
Format: CTS.INCremental [ON | OFF]
ON CTS.List displays intermediate results while TRACE32 is processing the trace contents.
OFF CTS.List displays the result after TRACE32 has completely processed the trace contents.
General Commands Reference Guide C 161 ©1989-2019 Lauterbach GmbH
CTS.Init Restart CTS processing
Restarting the CTS processing has effects:
• CTS.List is reprocessed.
• The target context for trace-based debugging is re-processed.
• The new settings of the CTS window take effect.
See also
■ CTS ■ CTS.state
Format: CTS.Init
General Commands Reference Guide C 162 ©1989-2019 Lauterbach GmbH
CTS.List List trace contents
Format: CTS.List [<record> | <record_ range>] [<items> …] [/<options>]
<options>: FILETrackMark <item> TASK <task_magic> | <task_id> | <task_name> <other_generic_options>
<items>: %<format>DEFault | ALL | CPU | LINE | PORTSRunCYcle | Data[.<subitem> | BDATA | List[.<subitem>]Address | BAddress | FAddress| sYmbol | sYmbolN | PAddress | PsYmbol | VarTIme[.<subitem>]FUNC | FUNCR | FUNCVar | IGNORELeVel | MARK[.<marker> | FLAG[.<flag_index>]Trigger | Trigger.A | Trigger.BSPARE<special_lines>
<format>: Ascii | BINary | Decimal | Hex | Signed | UnsignedHighLow | TimingTimeAuto | TimeFixedLEN <size>
<options> For a detailed description of all other parameters and options, refer to the <trace>.List command.
TASK <task_magic>, etc.
Filters the CTS.List window by the specified task.
See also “What to know about the Task Parameters” (general_ref_t.pdf).
General Commands Reference Guide C 163 ©1989-2019 Lauterbach GmbH

Description of Buttons in the CTS.List Window
Cache analysis results (when enabled) are shown in the following formats:
• <cache_mode> <cyclecount>?Information about a number of accesses is unknown.
• <cache_mode> <hits>/<misses>Regular cached cycles.
• <cache_mode> <hits>/<misses>/<bypasses>Bypasses are cycles that where not using the cache (non-allocated write cycles or trash cycles).
See also
■ CTS ■ CTS.state
▲ ’Release Information’ in ’Release History’
Setup … Open a <trace>.state window to configure the trace.
CTS … Open a CTS.view window to configure CTS.
Goto … Open a <trace>.GOTO dialog box to move the cursor to a specific record.
Find … Open a <trace>.Find dialog box to search for specific entries in the trace.
TREE Open a Trace.STATistic.TREE /CTS window to display the call structure of the trace contents as a tree.
Chart Display the program execution time at different symbols as a time chart. See the <trace>.Chart.sYmbol /CTS command.
More/Less The More and Less button allow to switch between the following displays:• Interrupts and task levels• Function nesting• HLL lines• HLL lines and disassembled code• All CPU cycles
General Commands Reference Guide C 164 ©1989-2019 Lauterbach GmbH

CTS.Mode Operation mode
See also
■ CTS ■ CTS.state
CTS.OFF Switch off trace-based debugging
Trace-based debugging is switch to off. The current context of the target system is re-displayed on the TRACE32 screen.
See also
■ CTS ■ CTS.state
CTS.ON Switch on trace-based debugging
Switches trace-based debugging to ON. The starting point is either 0./1. or the last selected record.
Format: CTS.Mode [Full | Memory | CACHE]
Full (default) The trace contains the full program and data flow information.
Memory The trace contains only data flow information, a selective trace on specific data accesses was performed. CTS can reconstruct the memory contents only.CTS is used here e.g. to reconstruct the contents of several HLL variables or task control block information.
CACHE Reconstruct the contents of caches and TBLs (only required if a cache analysis is performed).
Format: CTS.OFF
Format: CTS.ON
General Commands Reference Guide C 165 ©1989-2019 Lauterbach GmbH

Use CTS.GOTO to switch CTS to ON with at specific starting point.
See also
■ CTS ■ CTS.state
▲ ’Release Information’ in ’Release History’
CTS.PROCESS Process cache analysis
Switches CTS to ON and calculates the results for the cache analysis by processing the complete trace contents.
See also
■ CTS ■ CTS.state
CTS.RESet Reset the CTS settings
Resets the CTS setting and switch trace based debugging to off.
See also
■ CTS ■ CTS.state
Format: CTS.PROCESS [/FILE]
Format: CTS.RESet
General Commands Reference Guide C 166 ©1989-2019 Lauterbach GmbH
CTS.SELectiveTrace Trace contains selective trace information
See also
■ CTS
CTS.SKIP Select the specified record for CTS (relative)
Selects a specific record for CTS relative to the currently selected record.
See also
■ CTS ■ CTS.state
Format: CTS.SELectiveTrace [ON | OFF]
ON A selective trace was performed, so the trace buffer does not contain the complete program and data flow. The sampling to the trace buffer is either controlled by the development tool or by the processor. In this case CTS clears the register and memory context after each discontinuance of the program/data flow.It is recommended to switch CTS.UseMemory to OFF (not supported for all CPUs).
OFF (default) The trace contains the relevant program and data flow.
Format: CTS.SKIP <delta> [/FILE]
CTS.SKIP 20.
General Commands Reference Guide C 167 ©1989-2019 Lauterbach GmbH
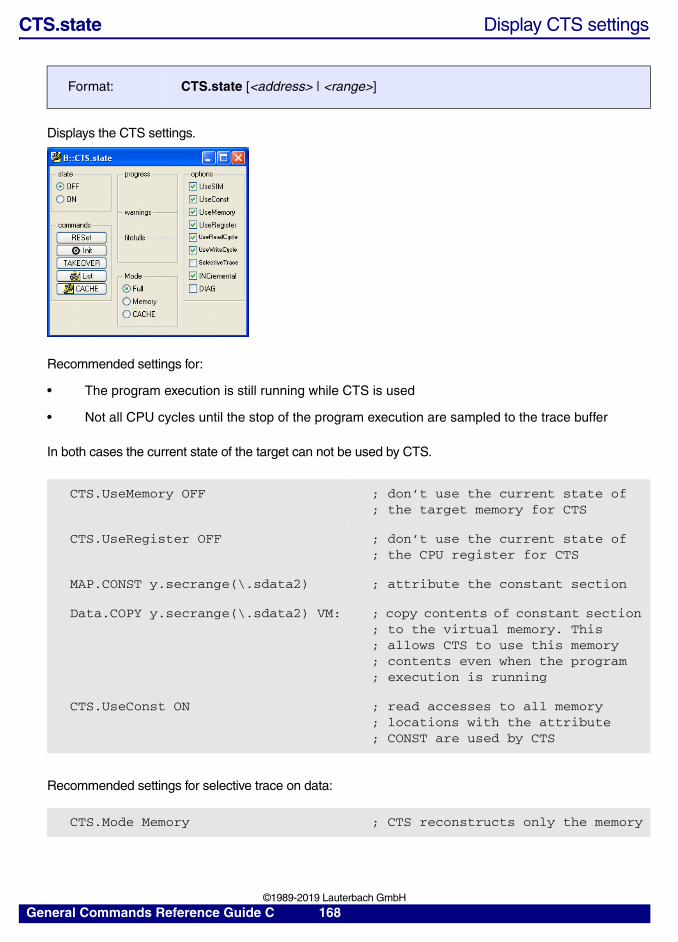
CTS.state Display CTS settings
Displays the CTS settings.
Recommended settings for:
• The program execution is still running while CTS is used
• Not all CPU cycles until the stop of the program execution are sampled to the trace buffer
In both cases the current state of the target can not be used by CTS.
Recommended settings for selective trace on data:
Format: CTS.state [<address> | <range>]
CTS.UseMemory OFF ; don’t use the current state of; the target memory for CTS
CTS.UseRegister OFF ; don’t use the current state of; the CPU register for CTS
MAP.CONST y.secrange(\.sdata2) ; attribute the constant section
Data.COPY y.secrange(\.sdata2) VM: ; copy contents of constant section ; to the virtual memory. This; allows CTS to use this memory; contents even when the program; execution is running
CTS.UseConst ON ; read accesses to all memory; locations with the attribute; CONST are used by CTS
CTS.Mode Memory ; CTS reconstructs only the memory
General Commands Reference Guide C 168 ©1989-2019 Lauterbach GmbH

Recommended settings if a selective trace is used:
The following settings are only necessary if the not sampled parts of the program/data flow change the memory or register contents.
Recommended settings if only the program flow is sampled to the trace buffer:
See also
■ <trace>.Chart.sYmbol ■ CTS ■ CTS.CACHE ■ CTS.CACHE.state ■ CTS.CAPTURE ■ CTS.GOTO ■ CTS.INCremental ■ CTS.Init ■ CTS.List ■ CTS.Mode ■ CTS.OFF ■ CTS.ON ■ CTS.PROCESS ■ CTS.RESet ■ CTS.SKIP ■ CTS.TAKEOVER ■ CTS.UseCACHE ■ CTS.UseConst ■ CTS.UseMemory ■ CTS.UseReadCycle ■ CTS.UseRegister ■ CTS.UseSIM ■ CTS.UseVM ■ CTS.UseWriteCycle ■ Go.BackTillWarning ■ Go.TillWarning
CTS.TAKEOVER Take memory/registers reconstructed by CTS over to target
If CTS is active, the TRACE32 screen displays the contents of the registers and memories as they have been when the currently active CTS record (see the yellow CTS field in the state line) was sampled to the state line. The command CTS.TAKEOVER takes the register and memory contents over to the target and deactivates CTS.
See also
■ CTS ■ CTS.state
CTS.SELectiveTrace ON ; Clear memory and register context; at each discontinuance of the; program/data flow
CTS.UseMemory OFF ; CTS doesn’t use the current; memory
CTS.UseRegister OFF ; CTS doesn’t use the current CPU; registers
CTS.UseMemory OFF ; CTS doesn’t use the current; memory
Format: CTS.TAKEOVER
General Commands Reference Guide C 169 ©1989-2019 Lauterbach GmbH
CTS.UseCACHE Cache analysis for CTS
This command is typically used for short trace recordings to minimize the number of unknown cycles. It uses the current cache contents for cache analysis. Together with CTS.CAPTURE it will also use the initial cache contents.
Example:
See also
■ CTS.UseConst ■ CTS.UseMemory ■ CTS.UseReadCycle ■ CTS.UseRegister ■ CTS.UseSIM ■ CTS.UseWriteCycle ■ CTS ■ CTS.CAPTURE ■ CTS.state
Format: CTS.UseCache [ON | OFF]
NOTE: Not all processors support debug access to the cache.
ON The cache is included in the analysis.
OFF The cache is excluded from the analysis. Information that is not analyzed is labeled “unknown” on the TRACE PowerView GUI. In addition, the percentage of unknown information is displayed.
...; It is recommended to make this setting very early on in a script.CTS.UseCache ON...; -------------------------------------------------------------------; 1st analysis: Capture a snapshot of the system for the analysis.CTS.CaptureGoBreak...
; -------------------------------------------------------------------; 2nd analysisCTS.CaptureGoBreak...
General Commands Reference Guide C 170 ©1989-2019 Lauterbach GmbH
CTS.UseConst Use constants for the CTS processing
CTS.UseConst become effective after CTS.UseMemory is set to OFF.
See also
■ CTS.UseCACHE ■ CTS.UseMemory ■ CTS.UseReadCycle ■ CTS.UseRegister ■ CTS.UseSIM ■ CTS.UseVM ■ CTS.UseWriteCycle ■ CTS ■ CTS.state
Format: CTS.UseConst [ON | OFF]
ON Read accesses to all memory locations that have the mapper attribute CONST are evaluated by CTS even if CTS.UseMemory is switched to OFF.
OFF Memory locations with the attribute CONST are not used by CTS.
General Commands Reference Guide C 171 ©1989-2019 Lauterbach GmbH

CTS.UseMemory Use memory contents for CTS
See also
■ CTS.UseCACHE ■ CTS.UseConst ■ CTS.UseReadCycle ■ CTS.UseRegister ■ CTS.UseSIM ■ CTS.UseVM ■ CTS.UseWriteCycle ■ CTS ■ CTS.state ■ MAP.VOLATILE
▲ ’Release Information’ in ’Release History’
Format: CTS.UseMemory [ON | OFF]
ON (default) The memory contents is used by CTS. • When a memory location was not accessed by the program sec-
tion sampled to the trace buffer, CTS assumes, that the memory location had the current contents during all program steps.
• When there was no write access to a memory location by the pro-gram section sampled to the trace buffer, CTS assumes, that the current contents was read by read accesses to this memory loca-tion sampled to the trace buffer.
To set CTS.UseMemory to ON requires, that all CPU cycles until the stop of the program execution were sampled to the trace buffer. Memory ranges that are changed not only by the CPU core e.g. peripherals or dual-ported memories can be excluded by using the MAP.VOLATILE command
OFF CTS.UseMemory OFF is required:• if not all CPU cycles until the stop of the program execution were
sampled to the trace buffer.• if the program execution is still running while CTS is used.• if no data flow is sampled to the trace buffer.MAP.CONST can be used to define memory ranges with constant contents that are used by CTS if CTS.UseConst is set to ON.
General Commands Reference Guide C 172 ©1989-2019 Lauterbach GmbH
CTS.UseReadCycle Use read cycles for CTS
See also
■ CTS.UseRegister ■ CTS.UseCACHE ■ CTS.UseConst ■ CTS.UseMemory ■ CTS.UseSIM ■ CTS.UseVM ■ CTS.UseWriteCycle ■ CTS ■ CTS.state
CTS.UseRegister Use the CPU registers for CTS
See also
■ CTS.UseReadCycle ■ CTS.UseCACHE ■ CTS.UseConst ■ CTS.UseMemory ■ CTS.UseSIM ■ CTS.UseVM ■ CTS.UseWriteCycle ■ CTS ■ CTS.state
▲ ’Release Information’ in ’Release History’
Format: CTS.UseReadCycle [ON | OFF]
ON (default) CTS uses the read cycles sampled to the trace buffer.
OFF CTS doesn’t use the read cycles sampled to the trace buffer. This is required if a bus trace is used and the processor is using a write through cache.
Format: CTS.UseRegister [ON | OFF]
ON (default) CTS uses the current contents of the CPU registers. When a CPU register was not accessed by the program section sampled to the trace buffer, CTS assumes, that the register had the current contents during all program steps.
OFF CTS doesn’t use the current contents of the CPU registers. This is required if the program execution is still running when CTS is used or if the program execution was still running after the sampling to the trace buffer was stopped.
General Commands Reference Guide C 173 ©1989-2019 Lauterbach GmbH

CTS.UseSIM Use instruction set simulator for CTS
See also
■ CTS.UseCACHE ■ CTS.UseConst ■ CTS.UseMemory ■ CTS.UseReadCycle ■ CTS.UseRegister ■ CTS.UseVM ■ CTS.UseWriteCycle ■ CTS ■ CTS.state
Format: CTS.UseSIM [ON | OFF]
ON (default) CTS uses the instruction set simulator.
OFF (For error diagnosis only.)
General Commands Reference Guide C 174 ©1989-2019 Lauterbach GmbH

CTS.UseVM Use the virtual memory contents as initial values for CTS
This command is typically used for short trace recordings to minimize the number of unknown cycles. It allows you to use the virtual memory contents as initial values for CTS. When you use the command, make sure that the trace recording contains the program start.
See also
■ CTS.UseConst ■ CTS.UseMemory ■ CTS.UseReadCycle ■ CTS.UseRegister ■ CTS.UseSIM ■ CTS.UseWriteCycle ■ CTS ■ CTS.CAPTURE ■ CTS.state
Format: CTS.UseVM [ON | OFF]
ON The virtual memory contents (VM:) are used as initial values for CTS.This allows you to have valid memory contents even for the first record.
OFF The virtual memory contents are not used.
...; It is recommended to make this setting very early on in a script.CTS.UseVM ON...; ---------------------------------------------------------------------; For the 1st analysis:
; Before the trace is started, data can be copied to the virtual memory; (VM:) of TRACE32.; Copy contents of specified address range to TRACE32 virtual memory.Data.Copy 0x3fa000++0xfff VM:; Start the trace recording and completely fill the trace buffer.GoBreak...; ---------------------------------------------------------------------; For the 2nd analysis:
; Repeat the above Data.Copy command.CTS.CAPTURE; Start the trace recording and completely fill the trace buffer.GoBreak...
General Commands Reference Guide C 175 ©1989-2019 Lauterbach GmbH
CTS.UseWriteCycle Use write cycles for CTS
See also
■ CTS.UseCACHE ■ CTS.UseConst ■ CTS.UseMemory ■ CTS.UseReadCycle ■ CTS.UseRegister ■ CTS.UseSIM ■ CTS.UseVM ■ CTS ■ CTS.state
Format: CTS.UseWriteCycle [ON | OFF]
ON CTS uses the write cycles sampled to the trace buffer.
OFF CTS doesn’t use the write cycles samples to the trace buffer. This is required if a bus trace is used and the processor is using a copy back cache.
General Commands Reference Guide C 176 ©1989-2019 Lauterbach GmbH


![AT Reference Guide - Multi-Tech Systems, Inc.€¦ · DE910- Series AT commands reference guide – AT commands [...]](https://img.dokumen.tips/doc/110x75/6062516d02f817666972114c/at-reference-guide-multi-tech-systems-inc-de910-series-at-commands-reference.jpg)


![AT Reference Guide - multitech.com€¦ · CE910 Series AT commands reference guide – commands [...]](https://img.dokumen.tips/doc/110x75/6062516d02f817666972114f/at-reference-guide-ce910-series-at-commands-reference-guide-a-commands-.jpg)