Embed Size (px)
Citation preview

BioMed CentralBMC Neuroscience
ss
Open AcceResearch articleSpeech target modulates speaking induced suppression in auditory cortexMaria I Ventura1, Srikantan S Nagarajan1 and John F Houde*2Address: 1Department of Radiology, University of California, San Francisco, San Francisco, CA, USA and 2Department of Otolaryngology, University of California, San Francisco, San Francisco, CA, USA
Email: Maria I Ventura - [email protected]; Srikantan S Nagarajan - [email protected]; John F Houde* - [email protected]
* Corresponding author
AbstractBackground: Previous magnetoencephalography (MEG) studies have demonstrated speaking-induced suppression (SIS) in the auditory cortex during vocalization tasks wherein the M100response to a subject's own speaking is reduced compared to the response when they hearplayback of their speech.
Results: The present MEG study investigated the effects of utterance rapidity and complexity onSIS: The greatest difference between speak and listen M100 amplitudes (i.e., most SIS) was foundin the simple speech task. As the utterances became more rapid and complex, SIS was significantlyreduced (p = 0.0003).
Conclusion: These findings are highly consistent with our model of how auditory feedback isprocessed during speaking, where incoming feedback is compared with an efference-copy derivedprediction of expected feedback. Thus, the results provide further insights about how speechmotor output is controlled, as well as the computational role of auditory cortex in transformingauditory feedback.
BackgroundThe role of auditory feedback in speech production is atopic of longstanding interest that has been investigatedvia a number of methods, most recently in studies usingfunctional neuroimaging methods. Previous studies usingmagnetoencephalography (MEG) have revealed a phe-nomenon called speaking-induced suppression (SIS): areduced response in auditory cortex to self-producedspeech, compared with its response to externally-pro-duced speech. These studies examined the M100response, also called the N100m response, which is themost significant peak in the magnetic response of cortexoccurring approximately 100ms after the onset of an audi-
tory stimulus[1], and found a dampened auditory M100response to a person's own voice when speaking com-pared to conditions in which a person listens to recordedspeech being played back to them [2-4]. Researchers havealso found that when self-generated voice sounds weredifferent from the expected sounds, auditory cortexresponse was maximal, but if the output during speechproduction matched the expected sound, cortical activityin the auditory cortex was suppressed [5]. Heinks-Maldo-nado, Nagarajan and Houde [6] proposed a precise for-ward model for speech production. They suggested that aforward model operates in the auditory system duringspeech production, which caused maximal suppression of
Published: 13 June 2009
BMC Neuroscience 2009, 10:58 doi:10.1186/1471-2202-10-58
Received: 12 January 2009Accepted: 13 June 2009
This article is available from: http://www.biomedcentral.com/1471-2202/10/58
© 2009 Ventura et al; licensee BioMed Central Ltd. This is an Open Access article distributed under the terms of the Creative Commons Attribution License (http://creativecommons.org/licenses/by/2.0), which permits unrestricted use, distribution, and reproduction in any medium, provided the original work is properly cited.
Page 1 of 11(page number not for citation purposes)
BMC Neuroscience 2009, 10:58 http://www.biomedcentral.com/1471-2202/10/58
the auditory cortical response to the incoming sounds thatmost closely match the speech sounds predicted by themodel. Researchers have argued that precise auditory sup-pression during speech allows the auditory system to dis-tinguish between internally and externally producedspeech sounds [7,8].
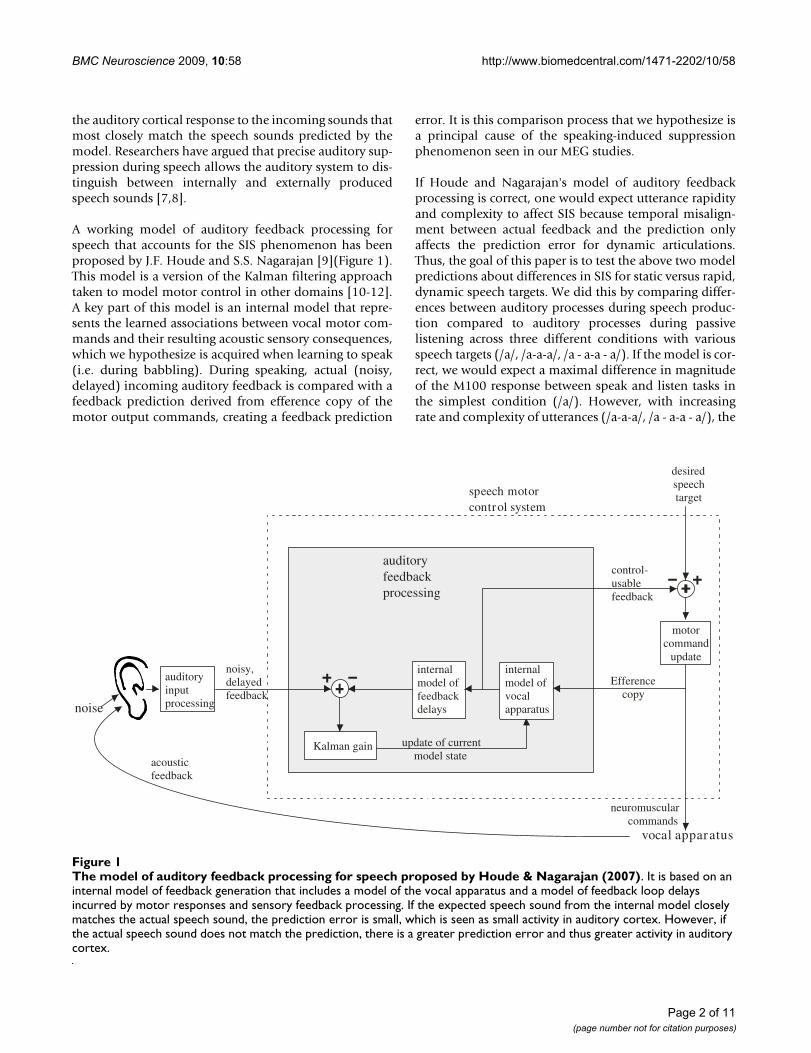
A working model of auditory feedback processing forspeech that accounts for the SIS phenomenon has beenproposed by J.F. Houde and S.S. Nagarajan [9](Figure 1).This model is a version of the Kalman filtering approachtaken to model motor control in other domains [10-12].A key part of this model is an internal model that repre-sents the learned associations between vocal motor com-mands and their resulting acoustic sensory consequences,which we hypothesize is acquired when learning to speak(i.e. during babbling). During speaking, actual (noisy,delayed) incoming auditory feedback is compared with afeedback prediction derived from efference copy of themotor output commands, creating a feedback prediction
error. It is this comparison process that we hypothesize isa principal cause of the speaking-induced suppressionphenomenon seen in our MEG studies.
If Houde and Nagarajan's model of auditory feedbackprocessing is correct, one would expect utterance rapidityand complexity to affect SIS because temporal misalign-ment between actual feedback and the prediction onlyaffects the prediction error for dynamic articulations.Thus, the goal of this paper is to test the above two modelpredictions about differences in SIS for static versus rapid,dynamic speech targets. We did this by comparing differ-ences between auditory processes during speech produc-tion compared to auditory processes during passivelistening across three different conditions with variousspeech targets (/a/, /a-a-a/, /a - a-a - a/). If the model is cor-rect, we would expect a maximal difference in magnitudeof the M100 response between speak and listen tasks inthe simplest condition (/a/). However, with increasingrate and complexity of utterances (/a-a-a/, /a - a-a - a/), the
The model of auditory feedback processing for speech proposed by Houde & Nagarajan (2007)Figure 1The model of auditory feedback processing for speech proposed by Houde & Nagarajan (2007). It is based on an internal model of feedback generation that includes a model of the vocal apparatus and a model of feedback loop delays incurred by motor responses and sensory feedback processing. If the expected speech sound from the internal model closely matches the actual speech sound, the prediction error is small, which is seen as small activity in auditory cortex. However, if the actual speech sound does not match the prediction, there is a greater prediction error and thus greater activity in auditory cortex.
auditoryfeedbackprocessing
internalmodel offeedbackdelays
auditoryinputprocessing
neuromuscularcommands
speech motorcontrol system
Efferencecopy
acousticfeedback
Kalman gain update of currentmodel state
desiredspeechtarget
motorcommand
update
noise
vocal apparatus
noisy,delayedfeedback
control-usablefeedback
internalmodel ofvocalapparatus
Page 2 of 11(page number not for citation purposes)

BMC Neuroscience 2009, 10:58 http://www.biomedcentral.com/1471-2202/10/58
speaking induced suppression should be reduced, and thedifference in magnitude of the M100 response betweenspeak and listen amplitudes should be smaller in the com-plex utterances.
ResultsWe first examine the Auditory Evoked Field (AEF)response to simple tones in all subjects. The AEF M100data revealed no hemispheric differences in the amplitudeof the response from each hemisphere (Figure 2). How-ever, there was a hemispheric difference for M100 latency,p = .002, showing that the right hemisphere processedpure tones more quickly than the left hemisphere acrossall 10 participants.
Second, we analyzed the acoustic output amplitude, i.e.volume through the earphones that subjects' heard, inboth speak and listen tasks. This analysis revealed signifi-cant difference between conditions, p = 0.000033, but notacross task. Overall, participants produced /a/ moreloudly than /a-a-a/ which they in turn produced moreloudly than /a - a-a - a/. However, no differences werefound in the acoustic amplitude that the subject heardduring the speak and listen tasks in these conditions.Responses to speech sounds during speaking and listening
showed that M100 listen amplitudes decreased as the vol-ume of the stimuli decreased (see Figure 3).
An analysis of the sensor Root Mean Square (RMS) M100amplitude data during speech tasks revealed significanthemisphere and task differences. A repeated measuresANOVA with condition, task and hemispheres as factorsrevealed significant differences for hemisphere, p = .0336,and task, p = 0.000035. In contrast, M100 latency datarevealed no significant differences.
Source space analysis using virtual sensors were used toanalyze the M100 response arising from auditory cortex ineach hemisphere in a 3 × 2 × 2 repeated measure ANOVA.The virtual sensor M100 amplitude data revealed signifi-cant differences for hemisphere, p = 4.42e-08, task, p =.0001 and a trend towards significance for the interactionbetween condition and task, p = .0504. To further investi-gate this interaction between task (speak or listen) andcondition (static versus dynamic speech targets), we com-pared virtual M100 amplitude data from the simplespeech target (condition 1) versus dynamic speech targets(conditions 2 and 3 combined). This ANOVA revealed sig-nificant differences for hemisphere, p = 0.000003, task, p= 0.0005, and a significant interaction between task and
The global field power (RMS) for the average Auditory Evoked FieldFigure 2The global field power (RMS) for the average Auditory Evoked Field. AEF response was evoked with 120, 1 kHz pure tones. M100 response was observed in both hemispheres. There was no hemispheric difference for amplitude. However, there was a hemispheric difference for latency; mainly, the right hemisphere processed tones on average 9.5 msec faster than the left hemisphere. Standard Error (±) shown in dashed line.
Am
plitu
de (
fT)
Time (ms) Time (ms)
Left Hemisphere
AEF
Right Hemisphere
AEF
-100 0 100 200 300 -100 0 100 200 3000 0
50 50
100 100
Page 3 of 11(page number not for citation purposes)

BMC Neuroscience 2009, 10:58 http://www.biomedcentral.com/1471-2202/10/58
Page 4 of 11(page number not for citation purposes)
Mean audio output levels across conditionsFigure 3Mean audio output levels across conditions. The acoustic output data shows that participants produced /a/ more loudly than /a-a-a/ which they in turn produced more loudly than /a - a-a - a/. However, calibration of the acoustic stimuli ensured that the volume through the earphones was equivalent in both speak and listen tasks in each condition. Standard Error (±) shown in dashed line. Output shown as acoustic power in dB SPL (ambient baseline noise in the scanner room was 50 dB).
Mean Audio Output LevelsPo
wer
(dB
)Po
wer
(dB
)Po
wer
(dB
)
/a/
/a-a-a/
/a – a-a – a/
Time (ms)
SE plus Speak SE minus SE plus Listen SE minus
-200 -100 0 100 200 300 400 500
-200 -100 0 100 200 300 400 500
-200 -100 0 100 200 300 400 500
x1012
x1012
50
50
50
70
75
80
70
75
80
70
75
80

BMC Neuroscience 2009, 10:58 http://www.biomedcentral.com/1471-2202/10/58
condition, p = .0353. Interestingly, the interactionbetween hemisphere and task did not reach significance,p = .0878 suggesting that task effects are similar across thetwo hemispheres.
Additional analyses of the virtual sensor amplitude datarevealed differences in the responses between speak andlisten tasks between conditions (see Figures 4 and 5). Tospecifically examine these differences across conditionsindependent of task, the percent difference was calculatedper condition: (amplitudelisten - amplitudespeak)/ampli-tudelisten. Results for the left hemisphere were as follows:in condition 1 (/a/), mean listen amplitude was 9.5 nA-mand mean speak amplitude was 4.0 nA-m, resulting in apercent difference between speak and listen amplitudes of58%; in condition 2 (/a-a-a/), mean listen amplitude was7.0 nA-m and mean speak amplitude was 3.5 nA-m,resulting in a percent difference of 50%; and in condition3 (/a - a-a - a/), mean listen amplitude was 5.9 nA-m andmean speak amplitude was 3.8 nA-m, resulting in a per-cent difference of 35%. This analysis showed that thegreatest difference between speak and listen amplitudes inthe auditory cortex occurred in the simplest speaking con-dition. As the speech stimuli became more rapid and com-plex, the differences between speak and listen amplitudesdecreased. A similar trend was also observed in the righthemisphere, although there was an overall dampenedresponse to speech stimuli in the right hemisphere: incondition 1, mean listen amplitude was 3.5 nA-m andmean speak amplitude was 2.2 nA-m, resulting in a per-cent difference between speak and listen amplitudes of38%; in condition 2, mean listen amplitude was 3.3 nA-mand mean speak amplitude was 2.8 nA-m, resulting in apercent difference of 15%; and in condition 3, mean listenamplitude was 2.35 nA-m and mean speak amplitude was2.22 nA-m, resulting in a percent difference of 5%. Thedifference between speak and listen amplitudes wasreduced as the utterances became more rapid and com-plex. To specifically test whether any increase in dynamicsof speech target would increase SIS, we compared SIS per-cent differences from the simple speech target (condition1) versus dynamic speech targets (conditions 2 and 3combined) across hemispheres. This two-way ANOVAwith condition and hemisphere as factors, revealed a sig-nificant difference for condition, p = 0.0003, but neitherhemisphere, p = 0.8, nor the interaction between hemi-sphere and condition, p = 0.39, was significant. Therefore,SIS modulation for dynamic targets is bilateral, in spite ofoverall hemispheric differences in both speak and listentasks.
No differences were observed in sensor RMS or virtualsensor M100 response latencies in the speech tasks.
DiscussionRapidity and complexity of the uttered syllable appears tomodulate SIS of the M100 amplitude. SIS percent differ-ences were largest with simple, static utterances in condi-tion 1, smaller with rapid utterances in condition 2, andsmallest with complex utterances in condition 3. Thus, thegreatest difference between speak and listen M100 ampli-tudes was found in the static speech target (/a/), comparedto the dynamic utterances (/a-a-a/ and /a - a-a - a/). Thesefindings are consistent with predictions from our modelof speech feedback processing. The greatest speakinginduced suppression was observed in condition 1 with thesimple utterance presumably because the internal repre-sentation, or mental model, for that utterance was largelystatic and therefore easy to produce and match. However,with increasing rate and complexity of utterances (condi-tions 2 & 3), the auditory feedback predictions becamemore dynamic and more difficult to keep in temporal reg-istry with the incoming auditory feedback, resulting in apoorer match with it, and, thus, a less suppressedresponse.
The differences in amplitude results across conditions arealso in accord with Houde and Nagarajan's (2007) modelof speech feedback processing: one's expectation for aspeech sound (including volume) is related to the activityobserved in the auditory cortex. If a participant spoke /a/loudly, that participant could predict the sound of thatutterance and the auditory cortex will not be "surprised"by the volume of the utterance. In such a scenario, onewould expect to observe attenuated activity, or reducedactivity in the auditory cortex. If a participant spoke /a-a-a/ at a reduced volume, that participant could still predictthe sound of that utterance and one would again expect toobserve attenuated activity in the auditory cortex. How-ever, during the listen task, participants could not predictthe sound or volume of the auditory stimuli. Therefore,the auditory cortex behaved correspondingly: largeramplitudes were observed with louder stimuli, andsmaller amplitudes were observed with more quiet stim-uli. This is directly related to the prediction/expectancyaspect of the model proposed by Houde and Nagarajan: ifone's internal representation for a speech sound (includ-ing volume) matches the actual speech sound, then sup-pression or attenuation of cortical activity in the auditorycortex is observed. This process of matching one's internalrepresentation of a speech sound to the actual speechsound is only possible in the speak task. On the otherhand, all stimuli are unexpected during the listen task,and thus response in the auditory cortex should behavesolely according to the properties of the auditory stimuli(i.e. larger M100 amplitudes with louder stimuli, etc.).
Page 5 of 11(page number not for citation purposes)

BMC Neuroscience 2009, 10:58 http://www.biomedcentral.com/1471-2202/10/58
Page 6 of 11(page number not for citation purposes)
Virtual sensor M100 amplitude of SIS in auditory cortexFigure 4Virtual sensor M100 amplitude of SIS in auditory cortex. When the activity in the auditory cortex is isolated, a damp-ened response is observed in the right hemisphere. Maximal difference between speak and listen amplitudes was observed in the first condition with the simplest utterance, /a/. As the speech stimuli increased in rate and complexity, the difference between speak and listen amplitudes was reduced. Standard Error (±) shown in dashed line.
Virtual Channel Estimate ofAuditory Cortical ActivityLeft Hemisphere Right Hemisphere
/a/ /a/
/a-a-a/ /a-a-a/
/a – a-a – a / /a – a-a – a/
Time (ms) Time (ms)
Am
plitu
de (
nA-m
)A
mpl
itude
(nA
-m)
Am
plitu
de (
nA-m
)
SE plus Speak SE minus SE plus Listen SE minus
-100 -50 0 50 100 150 200 250 300
-100 -50 0 50 100 150 200 250 300-100 -50 0 50 100 150 200 250 300
-100 -50 0 50 100 150 200 250 300
-100 -50 0 50 100 150 200 250 300 -100 -50 0 50 100 150 200 250 300
x106x106
x106x106
x106x106

BMC Neuroscience 2009, 10:58 http://www.biomedcentral.com/1471-2202/10/58
Given that different auditory stimuli were used in thisstudy, the hemispheric differences in observed responsesare noteworthy. Several studies have reported no hemi-spheric differences when tones were used [13,14]. This isconsistent with our findings: significant activations wereobserved in primary auditory cortex (mainly, in Heschl'sgyri) in both hemispheres when pure tones were used [1].In contrast, previous literature suggests that the left hemi-sphere is dominant during speech and language percep-tion [2,4]. Therefore, a more dominant response wasexpected to occur in the left hemisphere, in other words adampened response in the right hemisphere wasexpected, when speech stimuli were used. During both thespeak and listen tasks, we observed this overall dampenedM100 amplitude response in the right hemisphere. How-ever, the effect of condition on SIS is the same across bothhemispheres. Thus, in spite of the overall hemispheric dif-ferences in response to speech, the processing of auditoryfeedback during speaking may be similar across the twohemispheres.
ConclusionThese findings provide additional support for our concep-tual model of speech motor control, and as such providethe impetus to test other predictions from the model. Inaddition, these findings also provide better insights intothe speech motor control system, and the computationalrole of auditory cortex in transforming auditory feedback.The SIS paradigm used in this study may benefit the studyof disorders such as schizophrenia, in which patients lackthe ability to distinguish between internally and exter-nally produced speech sounds [15]. It may also benefit thestudy of speech production impediments such as stutter-ing [16,17], where altered auditory feedback has beenshown to be fluency-enhancing.
MethodsParticipantsTen healthy right-handed English speaking volunteers (6males, 4 females; mean age 25 years; range: 21–42) partic-ipated in this study. All participants gave their informedconsent after procedures had been fully explained. Thestudy was performed with the approval of the Universityof California, San Francisco Committee for HumanResearch.
Experimental Design and ProcedureCalibration of the acoustic stimuli was conducted prior tostarting the experiment to ensure that the volume throughthe earphones was equivalent in both speak and listentasks. Each MEG session began and ended by recordingAuditory Evoked Field (AEF) responses, which were elic-ited with 120 single 600-msec duration tones (1 kHz),presented binaurally at 70 dB sound pressure level (SPL).
The experiment went as follows: participants viewed aprojection monitor. The screen background was black,and three white dots appeared in the center of the screen.Each dot disappeared one by one to simulate a count-down (3-2-1). When all three dots disappeared and thescreen was completely black, participants were instructedto speak the designated speech target. The experimentincluded three different speech targets (refer to Table 1and Figure 6). In condition 1, also referred to as the sim-ple speech condition, participants were instructed to pro-duce the sound, /a/, 75 times (the speak task). The averageduration of each utterance /a/ was approximately 100 ms.The 75 recorded utterances of /a/ were then played back tothe participants (the listen task) in the same experimentaldesign as the speak task: participants viewed the screen,"3-2-1" dots disappeared, and when the screen was black,the utterances were played back through the earphonesunaltered. Conditions 2 and 3 are referred to as the rapidand complex speech conditions. These conditions had thesame speak and listen tasks as in condition 1, except thatin condition 2, participants were instructed to produce thesound, /a-a-a/, at a rapid consistent rate, with approxi-mately 50 ms between each repetition of /a/. In condition3, participants were instructed to produce a more complexsound, /a - a-a - a/, emphasizing the two middle syllablesby changing the rate of production of the two middle syl-lables. During the speak and listen tasks, the MEG acqui-sition system recorded 3.5 seconds of data (i.e. 2 secbefore the utterance and 1.5 sec after the utterance) at asampling rate of 1200 Hz.
A key feature of the experiment design related to analysisof the results is that the experiment is fundamentally acomparison between the speaking and listening condi-tions. Thus, although there are likely to be measureabledifferences in the audio recorded for productions of the
Speaking Induced Suppression (SIS) percent difference: (amplitudelisten - amplitudespeak)/amplitudelistenFigure 5Speaking Induced Suppression (SIS) percent differ-ence: (amplitudelisten - amplitudespeak)/amplitudelisten. We compared SIS in simple (condition 1) vs. complex (condi-tions 2 & 3) across hemispheres.
SIS: Percent Difference
0
10
20
30
40
50
60
Left Hemisphere Right Hemisphere
% D
iffe
ren
ce
Simple (condition 1) Complex (condition 2 & 3)
Page 7 of 11(page number not for citation purposes)
BMC Neuroscience 2009, 10:58 http://www.biomedcentral.com/1471-2202/10/58
three different speech targets used in the experiment (e.g.,f0, formants), for each target, the audio heard by the sub-ject is the same in both the speaking and listening condi-tions. Any response characteristics specific to the audiofeatures of a given target are therefore removed when wecompare responses to this target between the speakingand listening conditions.
A structural magnetic resonance image (MRI) wasobtained for each participant at the Magnetic ResonanceScience Center of UCSF. The whole head was imaged on a1.5T General Electric scanner with approximately 124slices, 1.5 mm thick.
Data Acquisition and ProcessingMagnetic fields were recorded using a 275 channel wholecortex MEG/EEG system (VSM MedTech Ltd., Coquitlam,British Columbia, Canada) from participants in ashielded room (Figure 7). Three fiducial points weredefined on the surface of each participant's head usingclear anatomic landmarks: left and right preauricularpoints and the nasion. The fiduciary points were used tosuperimpose the MEG data with the structural MRI foreach participant [18].
Auditory Evoked Field (AEF) data (average response to120 single pure tones) were band-pass filtered at 2–40 Hz,the third gradient of the magnetic field was calculated,and the DC offset was removed [6]. The average AEF wasanalyzed using equivalent current dipole (ECD) tech-niques [19]. Single dipole localizations for each hemi-sphere were obtained and the AEF response to 1 kHz puretones elicited cortical activity in the auditory cortex inboth hemispheres. Average MNI coordinates for left hem-isphere (x, y, z) = -62.5, -20.6, 9.5 and for right hemi-sphere (x, y, z) = 61.8, -11.5, 8.18, revealed activation inprimary auditory cortex (Brodmann areas 41, 42) andsuperior temporal gyrus in the normalized brain acrosssubjects.
To assess activity changes in auditory cortex, two methodswere used: standard Root Mean Square (RMS) averaging
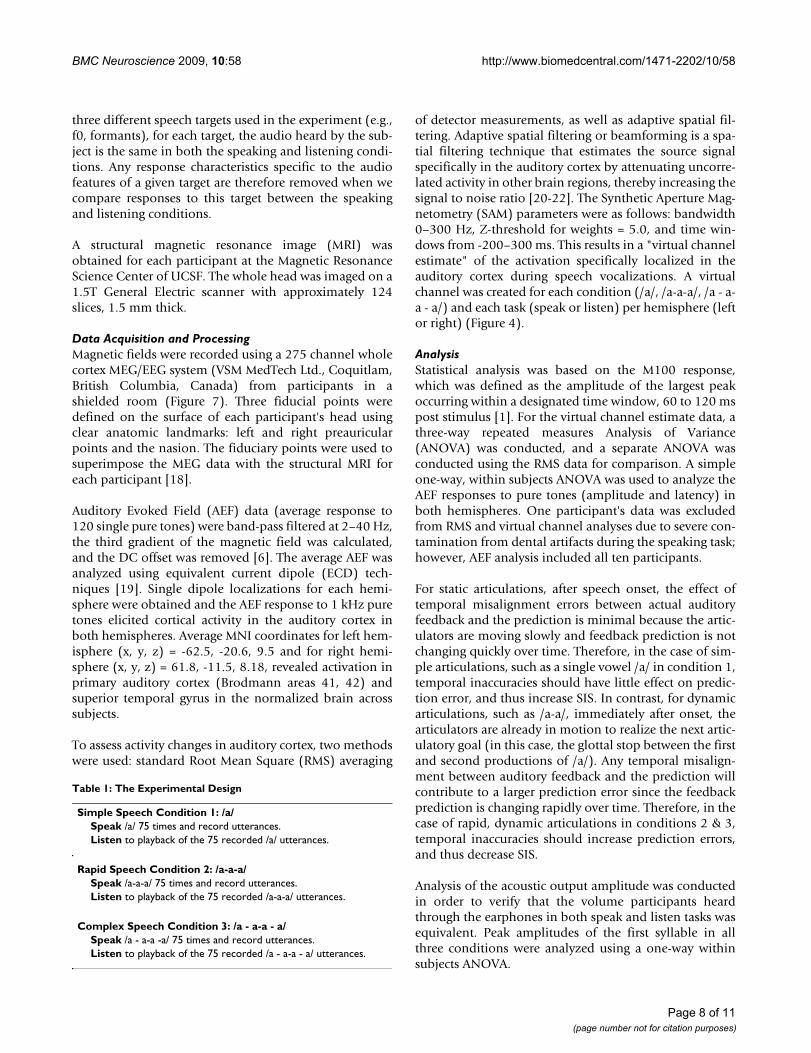
of detector measurements, as well as adaptive spatial fil-tering. Adaptive spatial filtering or beamforming is a spa-tial filtering technique that estimates the source signalspecifically in the auditory cortex by attenuating uncorre-lated activity in other brain regions, thereby increasing thesignal to noise ratio [20-22]. The Synthetic Aperture Mag-netometry (SAM) parameters were as follows: bandwidth0–300 Hz, Z-threshold for weights = 5.0, and time win-dows from -200–300 ms. This results in a "virtual channelestimate" of the activation specifically localized in theauditory cortex during speech vocalizations. A virtualchannel was created for each condition (/a/, /a-a-a/, /a - a-a - a/) and each task (speak or listen) per hemisphere (leftor right) (Figure 4).
AnalysisStatistical analysis was based on the M100 response,which was defined as the amplitude of the largest peakoccurring within a designated time window, 60 to 120 mspost stimulus [1]. For the virtual channel estimate data, athree-way repeated measures Analysis of Variance(ANOVA) was conducted, and a separate ANOVA wasconducted using the RMS data for comparison. A simpleone-way, within subjects ANOVA was used to analyze theAEF responses to pure tones (amplitude and latency) inboth hemispheres. One participant's data was excludedfrom RMS and virtual channel analyses due to severe con-tamination from dental artifacts during the speaking task;however, AEF analysis included all ten participants.
For static articulations, after speech onset, the effect oftemporal misalignment errors between actual auditoryfeedback and the prediction is minimal because the artic-ulators are moving slowly and feedback prediction is notchanging quickly over time. Therefore, in the case of sim-ple articulations, such as a single vowel /a/ in condition 1,temporal inaccuracies should have little effect on predic-tion error, and thus increase SIS. In contrast, for dynamicarticulations, such as /a-a/, immediately after onset, thearticulators are already in motion to realize the next artic-ulatory goal (in this case, the glottal stop between the firstand second productions of /a/). Any temporal misalign-ment between auditory feedback and the prediction willcontribute to a larger prediction error since the feedbackprediction is changing rapidly over time. Therefore, in thecase of rapid, dynamic articulations in conditions 2 & 3,temporal inaccuracies should increase prediction errors,and thus decrease SIS.
Analysis of the acoustic output amplitude was conductedin order to verify that the volume participants heardthrough the earphones in both speak and listen tasks wasequivalent. Peak amplitudes of the first syllable in allthree conditions were analyzed using a one-way withinsubjects ANOVA.
Table 1: The Experimental Design
Simple Speech Condition 1: /a/Speak /a/ 75 times and record utterances.Listen to playback of the 75 recorded /a/ utterances.
Rapid Speech Condition 2: /a-a-a/Speak /a-a-a/ 75 times and record utterances.Listen to playback of the 75 recorded /a-a-a/ utterances.
Complex Speech Condition 3: /a - a-a - a/Speak /a - a-a -a/ 75 times and record utterances.Listen to playback of the 75 recorded /a - a-a - a/ utterances.
Page 8 of 11(page number not for citation purposes)

BMC Neuroscience 2009, 10:58 http://www.biomedcentral.com/1471-2202/10/58
Page 9 of 11(page number not for citation purposes)
A sample of the three speech targetsFigure 6A sample of the three speech targets. In condition 1, participants were instructed to produce the utterance /a/ 75 times; average duration of each utterance /a/ was approximately 100 ms. In condition 2, participants were instructed to produce the utterance /a-a-a/ 75 times; approximately 50 ms separated each repetition of /a/. In condition 3, participants were instructed to produce the utterance /a - a-a - a/ 75 times; the rate of production of the two middle syllables was increased.
Simple Speech Condition 1: /a/
Rapid Speech Condition 2: /a – a – a/
Complex Speech Condition 3: /a – a-a – a/

BMC Neuroscience 2009, 10:58 http://www.biomedcentral.com/1471-2202/10/58
Authors' contributionsSSN and JFH conceived of the study and participated in itsdesign. MIV coordinated the study, recruited participantsand collected the imaging data. JFH and MIV performedstatistical analysis. All authors contributed to writing themanuscript and approved the final draft.
AcknowledgementsThe authors would like to thank Susanne Honma and Anne Findlay for their technical assistance. This work was supported by a grant from the National Institute on Deafness and other Communication Disorders (RO1 DC006435).
References1. Reite M, Adams M, Simon J, Teale P, Sheeder J, Richardson D, Grabbe
R: Auditory M100 component 1: relationship to Heschl's gyri.Cognitive Brain Research 1994, 2:13-20.
2. Curio G, Neuloh G, Numminen J, Jousmaki V, Hari R: Speakingmodifies voice-evoked activity in the human auditory cortex.Human Brain Mapping 2000, 9:183-191.
3. Gunji A, Hoshiyama M, Kakigi R: Auditory response followingvocalization: a magnetoencephalographic study. Clinical Neu-rophysiology 2001, 112:514-520.
4. Houde JF, Nagarajan SS, Sekihara K, Merzenich MM: Modulation ofthe auditory cortex during speech: an MEG study. Journal ofCognitive Neuroscience 2002, 14(8):1125-1138.
5. Hirano S, Kojima H, Naito Y, Honjo I, Kamoto Y, Okazawa H, IshizuK, Yonekura Y, Nagahama Y, Fukuyama H, Konishi J: Corticalprocessing mechanism for vocalization with auditory verbalfeedback. NeuroReport 1997, 8:2379-2382.
6. Heinks-Maldonado TH, Nagarajan SS, Houde JF: Magnetoencepha-lographic evidence for a precise forward model in speechproduction. NeuroReport 2006, 17(13):1375-1379.
7. Heinks-Maldonado TH, Mathalon DH, Gray M, Ford JM: Fine-tuningof auditory cortex during speech production. Psychophysiology2005, 42:180-190.
8. Eliades SJ, Wang X: Dynamics of auditory-vocal interaction inmonkey auditory cortex. Cerebral Cortex 2005, 15:1510-1523.
The apparatus and experimental set upFigure 7The apparatus and experimental set up. A 275 channel whole cortex MEG/EEG system was used (VSM MedTech Ltd.). All electronic equipment (the stimulus laptop, attenuator, digital signal processor, and amplifier) was placed outside of the mag-netically shielded room. A directional microphone, plastic air tube earphones, an MEG compatible button, and monitor were in the room with the participant.
MEG detector ar ray
air -tube earphones
Inside Outside of the magnetically shielded room
condenser mic
MEG-compatible button
MEG data acquisition tr igger
Laptop PCDSP
attn
LCD
Projection screen
Page 10 of 11(page number not for citation purposes)

BMC Neuroscience 2009, 10:58 http://www.biomedcentral.com/1471-2202/10/58
Publish with BioMed Central and every scientist can read your work free of charge
"BioMed Central will be the most significant development for disseminating the results of biomedical research in our lifetime."
Sir Paul Nurse, Cancer Research UK
Your research papers will be:
available free of charge to the entire biomedical community
peer reviewed and published immediately upon acceptance
cited in PubMed and archived on PubMed Central
yours — you keep the copyright
Submit your manuscript here:http://www.biomedcentral.com/info/publishing_adv.asp
BioMedcentral
9. Houde JF, Nagarajan SS, Heinks-Maldonado T: Dynamic corticalimaging of speech compensation for auditory feedback per-turbations. Proceedings of the 153rd Meeting of the Acoustical Societyof America: Salt Lake City, UT 2007.
10. Kalman RE: A new approach to linear filtering and predictionproblems. Trans ASME – Journal of Basic Engineering 1960,82(1):35-45.
11. Wolpert DM, Ghahramani Z: Computational principles ofmovement neuroscience. Nat Neurosci 2000,3(Suppl):1212-1217.
12. Wolpert DM, Ghahramani Z, Jordan MI: An internal modelforsensorimotor integration. Science 1995, 269(5232):1880-1882.
13. Eulitz C, Diesch E, Pantev C, Hampson S, Elbert T: Magnetic andelectric brain activity evoked by the processing of tone andvowel stimuli. J Neurosci 1995, 15(4):2748-55.
14. Gootjes L, Raij T, Salmelin R, Hari R: Left-hemisphere dominancefor processing of vowels: a whole-scalp neuromagnetic study.NeuroReport 1999, 10(14):2987-91.
15. Heinks-Maldonado TH, Mathalon DH, Houde JF, Gray M, FaustmanWO, Ford JM: Relationship of imprecise corollary discharge inSchizophrenia to auditory hallucinations. Arch Gen Psychiatry2007, 64:286-296.
16. Saltuklaroglu T, Kalinowski J, Dayalu VN, Stuart A, Rastatter MP: Vol-untary stuttering suppresses true stuttering: a window onthe speech perception-production link. Perception & Psychophys-ics 2004, 66(2):249-254.
17. Brown S, Ingham RJ, Ingham JC, Laird AR, Fox PT: Stuttered andfluent speech production: an ALE meta-analysis of functionalneuroimaging studies. Human Brain Mapping 2005, 25:105-117.
18. Sun J, Wu J, Li S, Wu Y, Liu L: Localization of the human lan-guage cortex by magnetic source imaging. Chinese Medical Jour-nal 2003, 116(7):1039-1042.
19. Biermann-Ruben K, Salmelin R, Schnitzler A: Right rolandic activa-tion during speech perception in stutterers: a MEG study.NeuroImage 2005, 25(3):793-801.
20. Bardouille T, Picton TW, Ross B: Correlates of eye blinking asdetermined by synthetic aperture magnetometry. ClinicalNeurophysiology 2006, 117:952-958.
21. Oshino S, Kato A, Wakayama A, Taniguchi M, Hirata M, Yoshimine T:Magnetoencephalographic analysis of cortical oscillatoryactivity in patients with brain tumors: synthetic aperturemagnetometry (SAM) functional imaging of delta bandactivity. NeuroImage 2007, 34:957-964.
22. Sekihara K, Nagarajan SS, Poeppel D, Marantz A: Performance ofan MEG adaptive-beamformer source reconstruction tech-nique in the presence of additive low-rank interference. IEEETrans Biomed Eng 2004, 51(1):90-99.
Page 11 of 11(page number not for citation purposes)