Embed Size (px)
Citation preview
FEHMARNBELT HYDROGRAPHY
Prepared for: Femern A/S
By: DHI/IOW Consortium
in association with LICengineering, Bolding & Burchard and Risø DTU
Final Report
FEHMARNBELT FIXED LINK
HYDROGRAPHIC SERVICES (FEHY)
Marine Soil - Impact Assessment
Sea Bed Morphology of the
Fehmarnbelt Area
E1TR0059 - Volume I
FEHMARNBELT HYDROGRAPHY
Responsible editor:
FEHY consortium / co DHI
Agern Allé 5
DK-2970 Hørsholm
Denmark
FEHY Project Director: Ian Sehested Hansen, DHI
www.dhigroup.com
Please cite as:
FEHY (2013). Fehmarnbelt Fixed Link EIA.
Marine Soil – Impact Assessment.
Seabed Morphology of the Fehmarnbelt Area.
Report No. E1TR0059 - Volume I
Report: 140 pages
May 2013
ISBN 978-87-92416-35-3
Maps:
Unless otherwise stated:
DDO Orthofoto: DDO®, copyright COWI
Geodatastyrelsen (formerly Kort- og Matrikelstyrelsen), Kort10 and 25 Matrikelkort
GEUS (De Nationale Geologiske Undersøgelser for Danmark og Grønland)
HELCOM (Helsinki Commission – Baltic Marine Environment Protection Commission)
Landesamt für Vermessung und Geoinformation Schleswig-Holstein (formerly Landes-
vermessungsamt Schleswig-Holstein) GeoBasis-DE/LVermGeo SH
Model software geographic plots: Also data from Farvandsvæsenet and Bundesamt für
Seeschifffahrt und Hydrographie
Photos:
Photos taken by consortium members unless otherwise stated
© Femern A/S 2013
All rights reserved.
The sole responsibility of this publication lies with the author. The European Union is not
responsible for any use that may be made of the information contained therein.
E1TR0059 Vol I i FEHY
TABLE OF CONTENTS
0 EXTENDED SUMMARY ..................................................................................... 1 0.1 Environmental theme and assessed components ............................................... 1 0.2 Assessment of impacts of main tunnel alternative .............................................. 3 0.3 Assessment of impacts of main bridge alternative .............................................. 8 0.4 Comparison of bridge and tunnel alternatives ................................................... 14
1 INTRODUCTION ............................................................................................ 18 1.1 Environmental theme .................................................................................... 18 1.2 Environmental components assessed .............................................................. 20
2 THE FEHMARNBELT FIXED LINK PROJECT ........................................................ 22 2.1 General description of the project ................................................................... 22 2.1.1 The Immersed Tunnel (E-ME August 2011) ...................................................... 22 2.1.2 The Cable Stayed Bridge (Variant 2 B-EE, October 2010) ................................... 28 2.2 Relevant project pressures ............................................................................. 31 2.2.1 Project pressures for the main tunnel alternative .............................................. 32 2.2.2 Project pressures for the main bridge alternative .............................................. 33
3 DATA AND METHODS .................................................................................... 36 3.1 Area of investigation ..................................................................................... 36 3.1.1 Bathymetry .................................................................................................. 36 3.1.2 Surface sediments ........................................................................................ 36 3.1.3 Sea bed forms .............................................................................................. 36 3.2 The Assessment Methodology ......................................................................... 39 3.2.1 Overview of terminology ................................................................................ 39 3.2.2 The Impact Assessment Scheme..................................................................... 41 3.2.3 Assessment Tools ......................................................................................... 41 3.2.4 Assessment Criteria and Grading .................................................................... 43 3.2.5 Identifying and quantifying the pressures from the Project ................................. 43 3.2.6 Importance of the Environmental Factors ......................................................... 44 3.2.7 Sensitivity.................................................................................................... 44 3.2.8 Severity of loss ............................................................................................. 44 3.2.9 Degree of impairment ................................................................................... 45 3.2.10 Severity of Impairment ................................................................................. 45 3.2.11 Range of impacts .......................................................................................... 46 3.2.12 Duration of impacts....................................................................................... 46 3.2.13 Significance ................................................................................................. 47 3.2.14 Comparison of environmental impacts from project alternatives ......................... 47 3.2.15 Cumulative impacts ...................................................................................... 47 3.2.16 Impacts related to climate change .................................................................. 49 3.2.17 How to handle mitigation and compensation issues ........................................... 50 3.3 Data and model results applied ...................................................................... 50 3.3.1 Maps and characteristics of the bed forms ....................................................... 51 3.3.2 Sediment transport rates ............................................................................... 51 3.3.3 Sediment spill .............................................................................................. 53 3.3.4 Changes to current field due to the project ...................................................... 54 3.4 Assessment of magnitude of the pressures ...................................................... 55 3.5 Assessment of sensitivity ............................................................................... 56 3.5.1 Sub-components: sand waves, lunate bed forms and other active bed forms ....... 56 3.5.2 Sub-component: Sea bed morphology outside of areas with prominent bed forms 57
FEHY ii E1TR0059 Vol I
3.6 Assessment criteria ....................................................................................... 57 3.7 Assessment of loss ........................................................................................ 59 3.7.1 Method of assessment ................................................................................... 59 3.8 Assessment of degree of impairment ............................................................... 60 3.8.1 Methods of assessment ................................................................................. 60 3.9 Assessment of severity .................................................................................. 63 3.9.1 Importance levels ......................................................................................... 64 3.9.2 Degree of Severity ........................................................................................ 65 3.10 Assessment of significance ............................................................................. 66
4 ASSESSMENT OF 0-ALTERNATIVE ................................................................... 67
5 SENSITIVITY ANALYSIS ................................................................................. 68 5.1 Sub-components: sand waves, lunate bed forms and other active bed forms ....... 68 5.1.1 Sensitivity to tunnel trench (tunnel alternative only) ......................................... 68 5.1.2 Sensitivity to deposition of sediment from dredging activities (tunnel and bridge) . 70 5.1.3 Sensitivity to changes in the near bed currents (bridge alternative only) ............. 73 5.2 Sub-component: sea bed morphology outside of areas with prominent bed forms . 75 5.2.1 Sensitivity to tunnel trench and access channel (tunnel alternative only) ............. 75 5.2.2 Sensitivity to permanent footprints ................................................................. 75 5.2.3 Sensitivity to temporary work harbours and storage areas (tunnel and bridge) ..... 75
6 ASSESSMENT OF IMPACTS OF MAIN TUNNEL ALTERNATIVE ............................... 77 6.1 Pressure 1: Tunnel trench .............................................................................. 78 6.1.1 Magnitude of pressure ................................................................................... 78 6.1.2 Loss and degree of impairment ....................................................................... 79 6.1.3 Impact severity of loss/impairment ................................................................. 81 6.2 Pressure 2: Reclamations and protection reef ................................................... 82 6.2.1 Magnitude of pressure ................................................................................... 82 6.2.2 Loss ............................................................................................................ 83 6.2.3 Impact severity of loss .................................................................................. 83 6.3 Pressure 3: Temporary work harbours and storage areas ................................... 85 6.3.1 Magnitude of pressure ................................................................................... 85 6.3.2 Degree of impairment ................................................................................... 85 6.3.3 Impact severity of impairment........................................................................ 85 6.4 Pressure 4: Access channel to production facility on Lolland ............................... 86 6.4.1 Magnitude of pressure ................................................................................... 86 6.4.2 Degree of impairment ................................................................................... 87 6.4.3 Impact severity of impairment........................................................................ 89 6.5 Pressure 5: Deposition of sediments from dredging activities ............................. 90 6.5.1 Magnitude of pressure ................................................................................... 90 6.5.2 Loss and degree of impairment ....................................................................... 92 6.5.3 Impact severity of loss/impairment ................................................................. 93 6.6 Aggregation of impacts on components ........................................................... 93 6.6.1 Sub-components .......................................................................................... 94 6.6.2 Total impact for specific areas ...................................................................... 100 6.6.3 Impact significance ..................................................................................... 101 6.7 Cumulative impacts .................................................................................... 102 6.8 Transboundary impacts ............................................................................... 102 6.9 Climate change .......................................................................................... 102 6.10 Mitigation and compensation measures ......................................................... 103 6.11 Decommissioning ........................................................................................ 104
7 ASSESSMENT OF IMPACTS OF MAIN BRIDGE ALTERNATIVE ............................. 105 7.1 Pressure 1: Footprint of piers, pylons and peninsulas ...................................... 105
E1TR0059 Vol I iii FEHY
7.1.1 Magnitude of pressure ................................................................................. 105 7.1.2 Loss .......................................................................................................... 106 7.1.3 Impact severity of loss ................................................................................ 107 7.2 Pressure 2: Changes in near bed currents ...................................................... 107 7.2.1 Magnitude of pressure ................................................................................. 107 7.2.2 Degree of impairment ................................................................................. 111 7.2.3 Impact severity of impairment...................................................................... 112 7.3 Pressure 3: Deposition of sediments from dredging activities ........................... 113 7.3.1 Magnitude of pressure ................................................................................. 113 7.3.2 Degree of impairment ................................................................................. 115 7.3.3 Impact severity of impairment...................................................................... 116 7.4 Pressure 4: Temporary work harbours and storage areas ................................. 117 7.4.1 Magnitude of pressure ................................................................................. 117 7.4.2 Degree of impairment ................................................................................. 117 7.4.3 Impact severity of impairment...................................................................... 117 7.5 Aggregation of impacts on components ......................................................... 118 7.5.1 Sub-components ........................................................................................ 119 7.5.2 Total impact for specific areas ...................................................................... 128 7.5.3 Impact significance ..................................................................................... 130 7.6 Cumulative impacts .................................................................................... 131 7.7 Transboundary impacts ............................................................................... 131 7.8 Climate change .......................................................................................... 131 7.9 Mitigation and compensation measures ......................................................... 132 7.10 Decommissioning ........................................................................................ 132
8 COMPARISON OF BRIDGE AND TUNNEL MAIN ALTERNATIVES .......................... 133 8.1 Comparison of tunnel and bridge alternatives with continued ferry operation...... 133 8.2 Comparison of tunnel and bridge alternatives without continued ferry operation . 136
9 CONSEQUENCES TO IMPLEMENTATION OF WFD AND MSFD ............................. 137
10 KNOWLEDGE GAPS ..................................................................................... 138
11 REFERENCES .............................................................................................. 139
Lists of figures and tables are included as the final pages

FEHY iv E1TR0059 Vol I
Note to the reader:
In this report the time for start of construction is artificially set to 1 October 2014 for the
tunnel and 1 January 2015 for the bridge alternative. In the Danish EIA (VVM) and the
German EIA (UVS/LBP) absolute year references are not used. Instead the time references
are relative to start of construction works. In the VVM the same time reference is used for
tunnel and bridge, i.e. year 0 corresponds to 2014/start of tunnel construction; year 1 cor-
responds to 2015/start of bridge construction etc. In the UVS/LBP individual time references
are used for tunnel and bridge, i.e. for tunnel construction year 1 is equivalent to 2014
(construction starts 1 October in year 1) and for bridge construction year 1 is equivalent to
2015 (construction starts 1st January).
E1TR0059 Vol I 1 FEHY
0 EXTENDED SUMMARY
0.1 Environmental theme and assessed components
The impacts on the sea bed morphology due to the construction of the Fehmarnbelt
Fixed Link is mapped and described in the present report.
This report deals with the impacts on the sea bed morphology and mainly the dy-
namic morphological elements of the sea bed. Non-dynamic elements on the sea
bed such as hard substrate are treated in (FEMA 2013a). Within the present report,
it is assessed whether the impacts from the tunnel or bridge project change the dy-
namic character of the sea bed morphology. Morphological features and landscape
related to the coastal processes in the near-shore zone, such as for instance sand
bars in the coastal profile as well as the special morphological features such as
Grüner Brink on Fehmarn and the Hyllekrog/Rødsand formations on the Danish
side, are treated in the report on coastal morphology (FEHY 2013f).
Large areas of the Fehmarnbelt are covered by morphologically active bed forms.
Two main types of bed forms are sand waves and lunate bed forms. Sand waves
are large-scale flow-transverse ridges of sand up to 4 m in height and are found at
10-20 m water depth. Lunate bed forms are up to 1 m high, 3-dimensional in their
nature and have lunate shape with the “arms” pointing in the direction of the Baltic
Sea. They consist of loose sediment (fine sand) on an otherwise hard bed and
mainly occur where the water depths are greater than 20 m. The two main types
cover mostly large-scale sea bed features but other less characteristic forms exist.
Such bed forms are identified as “other active bed forms”. The areas with promi-
nent bed forms in the Fehmarnbelt are shown in Figure 0.1. Further information on
the bed forms is available in (FEHY 2013a).
The bed forms are impacted by changes in the sediment transport capacity or the
availability of loose sea bed sediment. The bed forms are formed and maintained in
their shape and geometry by this transport of sea bed material.
Sediment transport takes place primarily during events with high near-bed current
speeds occurring typically 2-5 times/year. The bed forms migrate in the order of 1-
5 m during such events in the direction of the near-bed flow. On an annual basis,
the net migration of the bed forms, up to 10 m/year, is in the direction of the net
sediment transport towards the Baltic Sea.
The four sub-components assessed in the present report under the component ‘Sea
Bed Morphology’ are listed in Table 0.1. Only large-scale morphologically active bed
forms of the sea bed are treated.
In this report the time for start of construction is artificially set to 1 October 2014
for the tunnel and 1 January 2015 for the bridge alternative. In the Danish EIA
(VVM) and the German EIA (UVS/LBP) absolute year references are not used. In-
stead the time references are relative to start of construction works. In the VVM the
same time reference is used for tunnel and bridge, i.e. year 0 corresponds to
2014/start of tunnel construction; year 1 corresponds to 2015/start of bridge con-
struction etc. In the UVS/LBP individual time references are used for tunnel and
bridge, i.e. for tunnel construction year 1 is equivalent to 2014 (construction starts
1 October in year 1) and for bridge construction year 1 is equivalent to 2015 (con-
struction starts 1 January).
FEHY 2 E1TR0059 Vol I
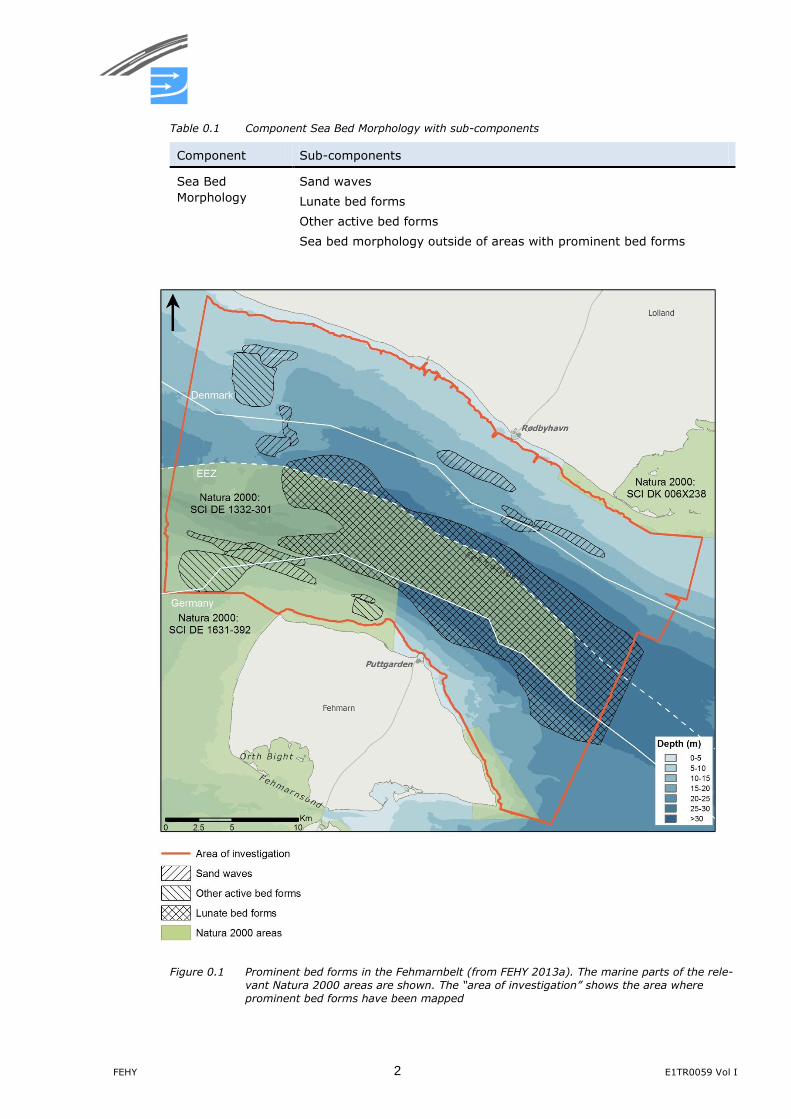
Table 0.1 Component Sea Bed Morphology with sub-components
Component Sub-components
Sea Bed
Morphology
Sand waves
Lunate bed forms
Other active bed forms
Sea bed morphology outside of areas with prominent bed forms
Figure 0.1 Prominent bed forms in the Fehmarnbelt (from FEHY 2013a). The marine parts of the rele-
vant Natura 2000 areas are shown. The “area of investigation” shows the area where
prominent bed forms have been mapped
E1TR0059 Vol I 3 FEHY
0.2 Assessment of impacts of main tunnel alternative
Impacts on the sea bed morphology from the main tunnel alternative E-ME/August
2011 were assessed. The project pressures are the following:
Removal of bed forms and sea bed by dredging activities for tunnel trench
Structures (reclamations, protection reefs, work harbours)
Access channel to production facility on Lolland
Deposition of dredging spill
The areas of impacted sea bed and bed forms (four sub-components) were quanti-
fied by comparing the detailed mapping of the bed forms with respectively a) the
size of the footprints of the trench/structures/access channel for the tunnel solu-
tion, b) calculated depositions of spilled material from (FEHY 2013d). The sensitivity
of the sea bed components to the pressures were evaluated based on knowledge on
the dynamics of bed forms from the literature and calculated rates of the natural
transport of sea bed material along the sea bed (FEHY 2013a).
The impacted areas of the sub-components aggregated from the various sources of
pressures are shown in Figure 0.2 to Figure 0.3 for loss and temporary impair-
ments, respectively. A summary of the impacted areas sub-divided on sub-parts of
the Fehmarnbelt is listed in Table 0.2.
Sea bed morphology is predicted to be impacted by pressures from the immersed
tunnel project in a total area of 1,471 ha. The impacts are composed of 356 ha of
loss of sea bed area mainly due to the reclamation and an area of 1,115 ha of im-
pairments, where the sea bed will fully recover primarily within a time scale of 30
years, see Table 0.2.
Bed forms
Two potential pressures from the tunnel are causing the impacts on the bed form
components: removal of the bed forms during dredging for construction (tunnel
trench) and deposition of dredging spill. A total of 989 ha of bed forms (5 ha of
sand waves and 984 ha of lunate bed forms – see Table 6.9) are impacted corre-
sponding to 0.4% of the sand waves and 6.7% of the lunate bed forms within an
area extending 10 km east and west of the alignment.
The impacts from both of these pressures are assessed to be of a temporary char-
acter as the sea bed will recover on a time scale in the order of 25-30 years or less.
The trench will become fully backfilled as the transport of natural sea bed material
will become trapped in the trench area. The bed forms will recover when they re-
generate in the backfilled sea bed material and migrate across the area from the
sides.
Deposited sediment spill material is trapped in the troughs of the bed forms. The fi-
ne sediment spill is expected to wash out of the bed form areas with time.
The time scales for recovery of the bed forms from both types of pressures are ex-
pected to be in the order of decades. For the lunate bed forms 15-30 years and for
the large sand waves west of the alignment on the Danish side 30-40 years in the
area where they are removed by dredging.
FEHY 4 E1TR0059 Vol I
Sea bed outside areas with prominent bed forms
The pressures from the dredging for the tunnel trench, the reclamations and struc-
tures and from the access channel have impacts on the sea bed morphology in are-
as outside the bed form areas. A total area of 482 ha is impacted of which 356 ha
are lost and 126 ha are impaired temporarily (see Table 6.9).
The sea bed is expected to recover to a natural state within 5 years after the struc-
tures for the temporary work harbour are removed/dismantled. In the area of the
tunnel trench, the time for recovery of the sea bed is predicted to vary along the
alignment between 1 and 18 years. The access channel to the production facility on
Lolland is left open after end of construction, but will fill in naturally. The time scale
for the sea bed to recover in the area of the channel is 5-30 years with the longest
infill time nearest the Lolland reclamation, where the channel is wider and deeper.
The only sea bed areas lost due to construction of the tunnel are the areas of the
permanent reclamations and protection reefs on the Lolland and Fehmarn sides.
E1TR0059 Vol I 5 FEHY
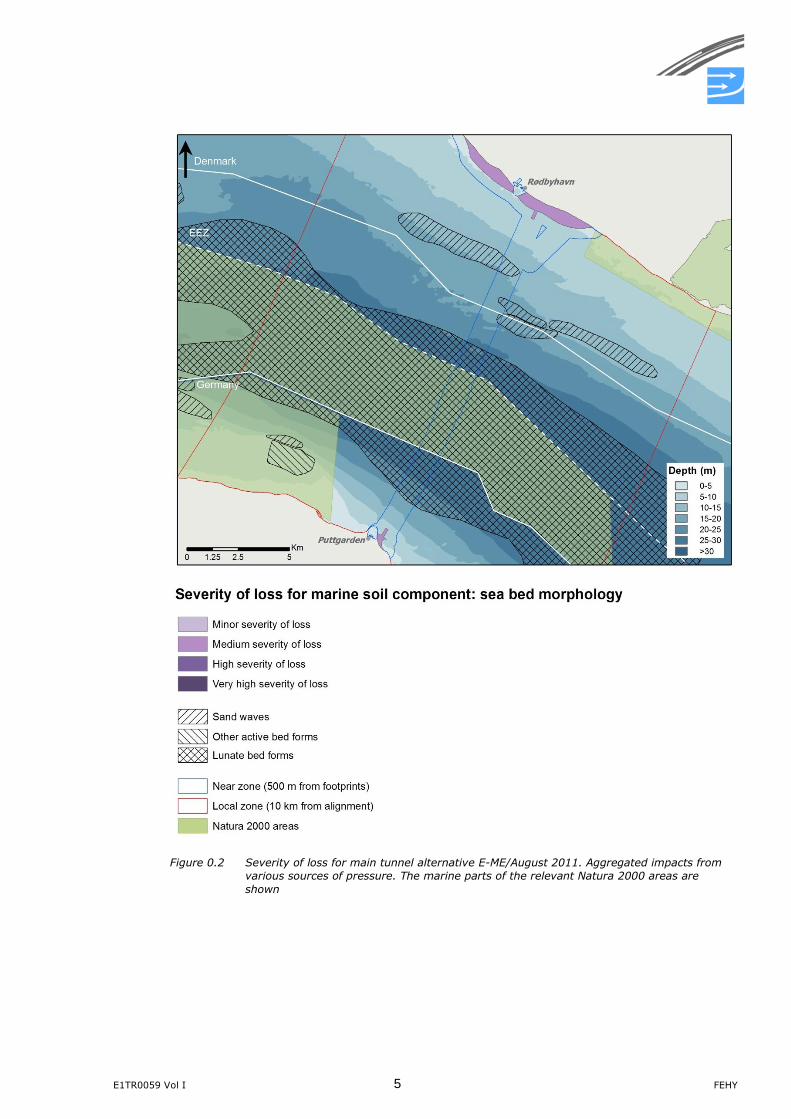
Figure 0.2 Severity of loss for main tunnel alternative E-ME/August 2011. Aggregated impacts from
various sources of pressure. The marine parts of the relevant Natura 2000 areas are
shown
FEHY 6 E1TR0059 Vol I
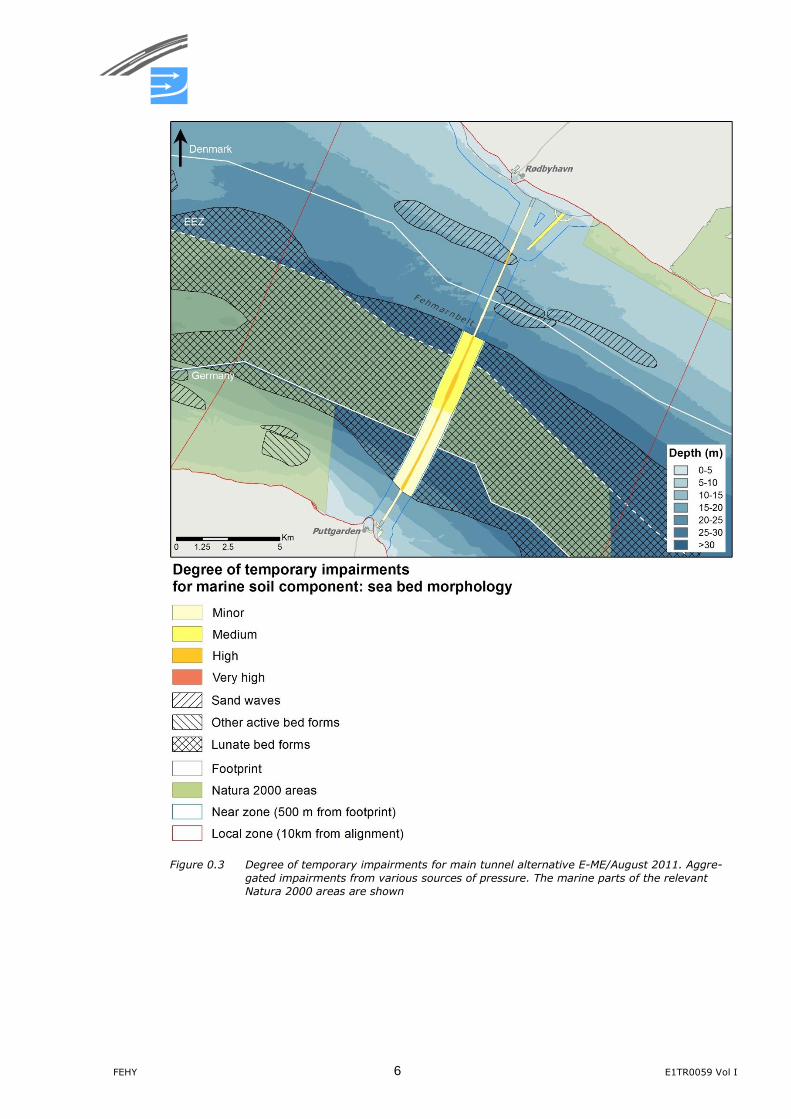
Figure 0.3 Degree of temporary impairments for main tunnel alternative E-ME/August 2011. Aggre-
gated impairments from various sources of pressure. The marine parts of the relevant
Natura 2000 areas are shown
E1TR0059 Vol I 7 FEHY
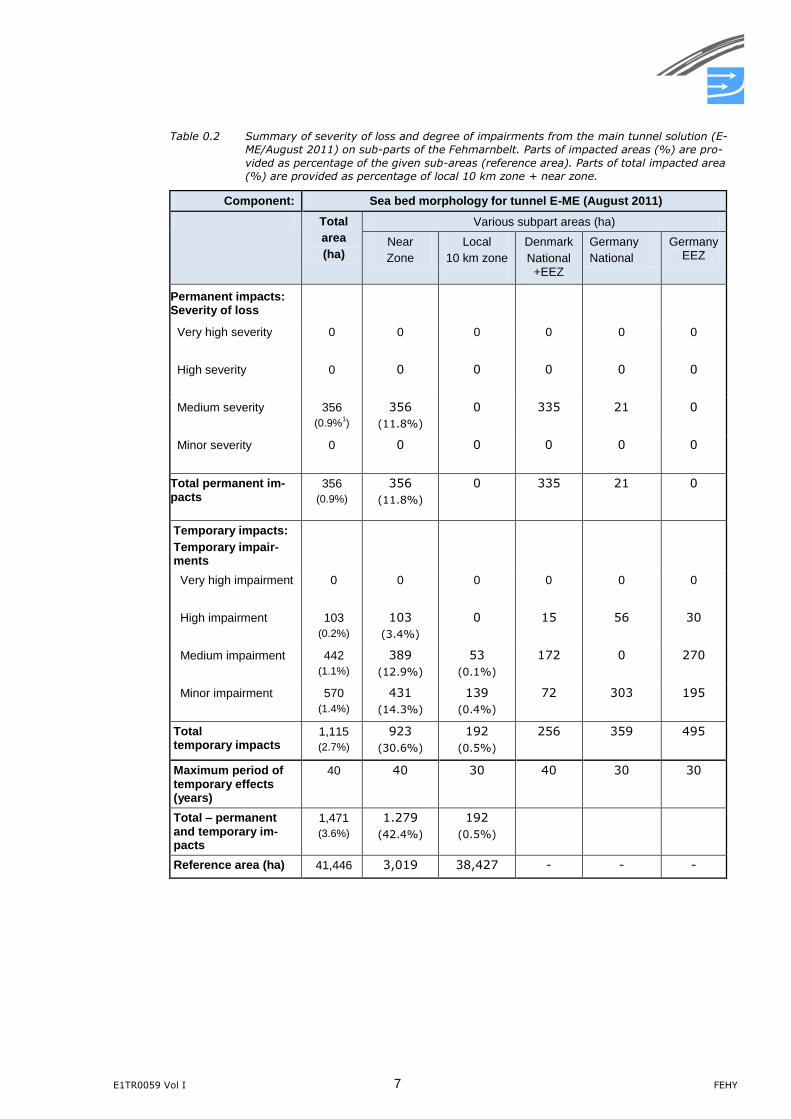
Table 0.2 Summary of severity of loss and degree of impairments from the main tunnel solution (E-
ME/August 2011) on sub-parts of the Fehmarnbelt. Parts of impacted areas (%) are pro-
vided as percentage of the given sub-areas (reference area). Parts of total impacted area
(%) are provided as percentage of local 10 km zone + near zone.
Component: Sea bed morphology for tunnel E-ME (August 2011)
Total
area
(ha)
Various subpart areas (ha)
Near
Zone
Local
10 km zone
Denmark
National +EEZ
Germany
National
Germany EEZ
Permanent impacts: Severity of loss
Very high severity 0 0 0 0 0 0
High severity 0 0 0 0 0 0
Medium severity 356
(0.9%1)
356
(11.8%)
0 335 21 0
Minor severity 0 0 0 0 0 0
Total permanent im-pacts
356
(0.9%)
356
(11.8%)
0 335 21 0
Temporary impacts:
Temporary impair-ments
Very high impairment 0 0 0 0 0 0
High impairment 103
(0.2%)
103
(3.4%)
0 15 56 30
Medium impairment 442
(1.1%)
389
(12.9%)
53
(0.1%)
172 0 270
Minor impairment 570
(1.4%)
431
(14.3%)
139
(0.4%)
72 303 195
Total temporary impacts
1,115
(2.7%)
923
(30.6%)
192
(0.5%)
256 359 495
Maximum period of temporary effects (years)
40 40 30 40 30 30
Total – permanent and temporary im-pacts
1,471
(3.6%)
1.279
(42.4%)
192
(0.5%)
Reference area (ha) 41,446 3,019 38,427 - - -
FEHY 8 E1TR0059 Vol I
0.3 Assessment of impacts of main bridge alternative
Impacts on the sea bed morphology from the main bridge alternative Variant 2 B E-
E/October 2010 were assessed. The pressures are:
Structures (piers/pylons, temporary work harbours, peninsulas incl. new beach-
es)
Changes in the near bed currents
Deposition of dredging spill
The areas of impacted sea bed and bed forms (four sub-components) were quanti-
fied by comparing the detailed mapping of the sea bed components with respective-
ly a) the size of the footprints of the structures for the bridge solution, b) calcula-
tions of changes to the near bed currents due to bridge piers and pylons from
(FEHY 2013e), c) calculated depositions of spilled material from (FEHY 2013d). The
sensitivity of the sea bed components to the pressures was evaluated based on
knowledge on the dynamics of bed forms from the literature and calculated rates of
the natural transport of sea bed material along the sea bed (FEHY 2013a).
The impacted areas of the sub-components aggregated from the various sources of
pressures are shown in Figure 0.4-Figure 0.6 for loss, permanent and temporary
impacts, respectively. The total areas, where impacts on the bed forms are predict-
ed, are summarised and divided in sub-areas in the Fehmarnbelt in Table 0.3.
A total of 4,292 ha will be lost/impaired by the main bridge solution. The area is
composed of 56 ha of loss of sea bed due to structures on the sea bed and an area
of 4,236 ha, where the sea bed will be impaired (4,216 ha permanently impaired,
20 ha is only temporarily impaired - see Table 0.3). Within the majority of the im-
paired area, the bed forms will increase in size primarily due to increase in the
near-bed currents. The bed forms will, however, remain in the area and the overall
morphology and dynamics of the bed forms will not change.
Bed forms
The impacts on the bed form components are caused by the following project pres-
sures: removal of the bed forms during dredging for construction (piers/pylons),
changes in the near bed currents and deposition of dredging spill. A total area of
4,229 ha of bed forms is impacted of which 3,989 ha are within 10 km from the
alignment and 240 ha are further away. The area is composed of 594 ha of sand
waves, 3,436 ha of lunate bed forms and 199 ha of other active bed forms (Table
7.6). 24.5% of the bed forms (3,989 ha out of 16,293 ha, Table 3.1) within 10 km
east and west of the alignment are assessed to be impacted.
Piers and pylons will cause a loss of bed forms in areas corresponding to their foot-
prints (structure dimension and scour protection around).
Changes in the near bed current field affect mainly the bed forms by permanently
changing (primarily increasing) their geometrical properties (height and length).
Locally near the piers and pylons, a variety of bed forms will occur (bed forms
higher/lower than in the surrounding area, small-scale ripples, scour holes near the
protecting stone layer around the structures) or plane bed will occur due to in-
crease in current speeds and increased turbulence levels. The impact of the sedi-
ment spill is similar to the situation for the tunnel case, but much less sediment
spill is expected for the bridge solution than for the tunnel solution. The spill is ex-
pected to wash out with time such that the bed forms return to their baseline con-
ditions.
E1TR0059 Vol I 9 FEHY
The impacted areas due to changes in the current speeds are considerably larger
than the areas impacted by dredging for the bridge piers/pylons. The impacts on
the bed forms caused by the changed currents are permanent but for the vast ma-
jority of the area, the impact on the bed forms is assessed to be of a minor degree
of impairment. The bed forms will remain in the area and the sea bed will maintain
the overall dynamics and morphology; see also the description above. Impacts from
deposition of sediment spill only affect an area close to the centre pylon temporari-
ly. The impact is classified with minor severity.
Sea bed outside areas with prominent bed forms
Structures (work harbour, peninsulas and piers/pylons) will cause potential impacts
on 63 ha of the sea bed morphology in areas outside the bed form areas. Perma-
nent structures cause a loss of natural sea bed. The sea bed in the areas of the
temporary structures is assessed to recover to a natural state in less than 5 years.
Pressures from changes in the near bed currents and dredging spill are assessed to
have only insignificant effects on the sea bed morphology outside the bed form are-
as.
FEHY 10 E1TR0059 Vol I
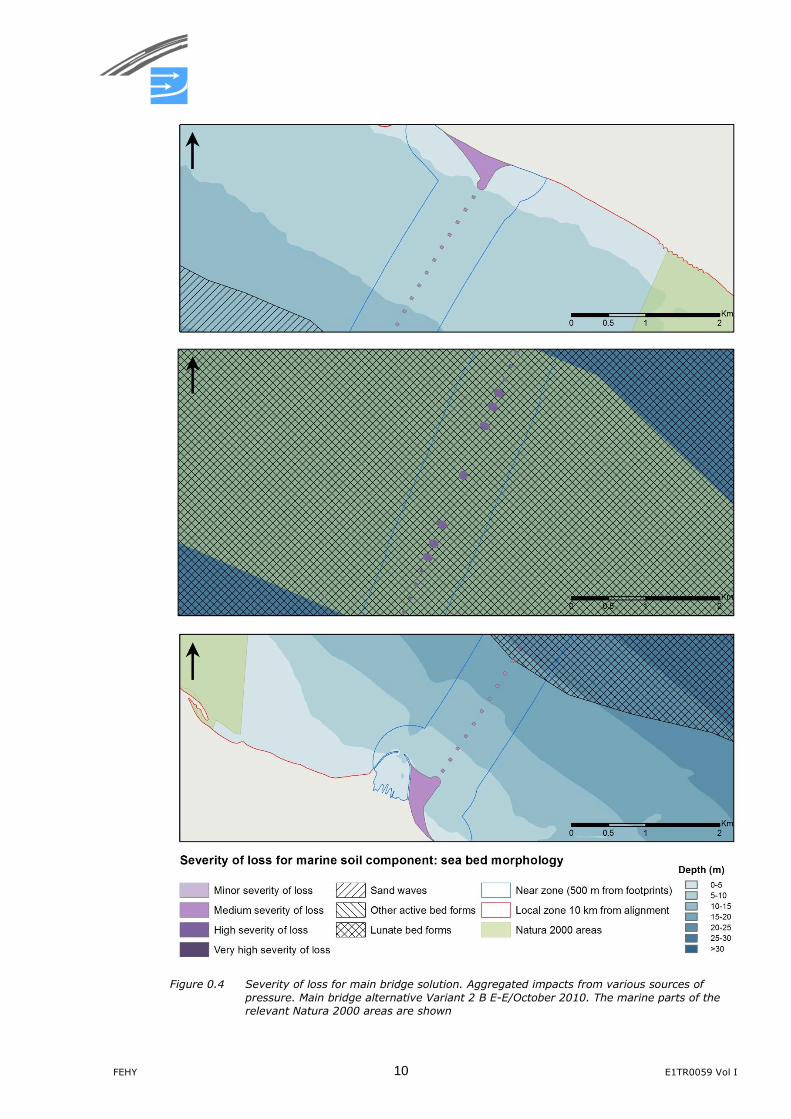
Figure 0.4 Severity of loss for main bridge solution. Aggregated impacts from various sources of
pressure. Main bridge alternative Variant 2 B E-E/October 2010. The marine parts of the
relevant Natura 2000 areas are shown
E1TR0059 Vol I 11 FEHY
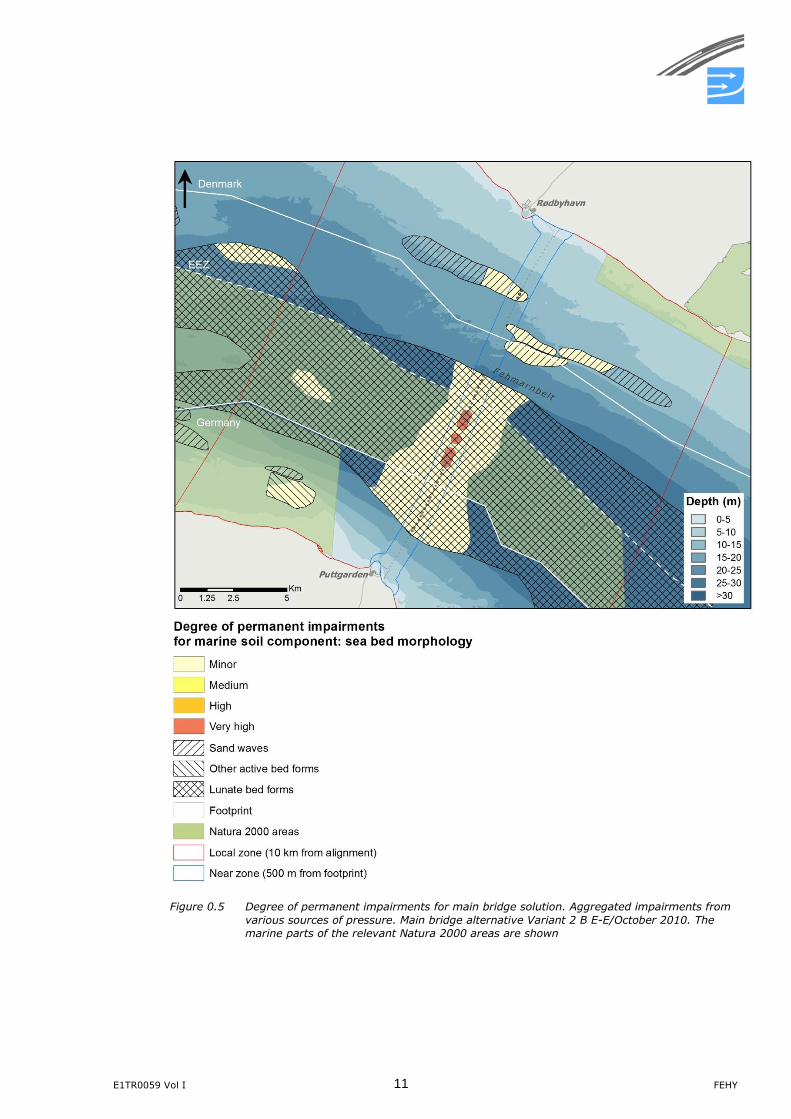
Figure 0.5 Degree of permanent impairments for main bridge solution. Aggregated impairments from
various sources of pressure. Main bridge alternative Variant 2 B E-E/October 2010. The
marine parts of the relevant Natura 2000 areas are shown
FEHY 12 E1TR0059 Vol I
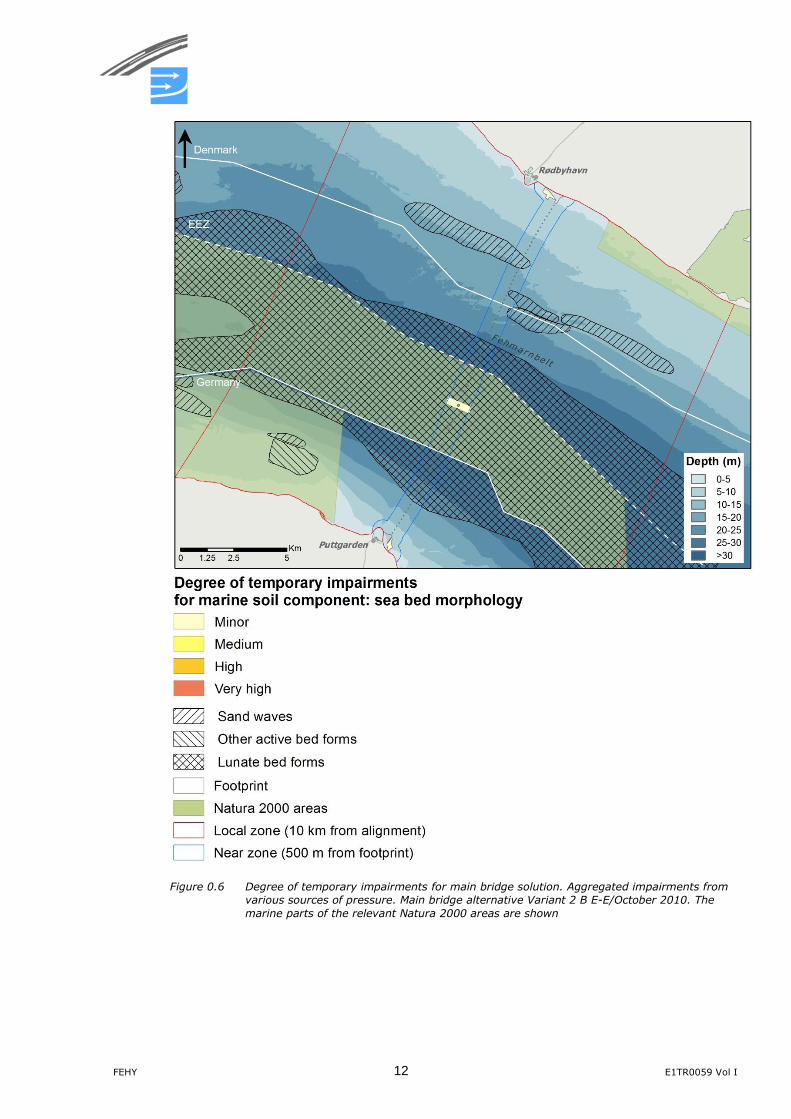
Figure 0.6 Degree of temporary impairments for main bridge solution. Aggregated impairments from
various sources of pressure. Main bridge alternative Variant 2 B E-E/October 2010. The
marine parts of the relevant Natura 2000 areas are shown
E1TR0059 Vol I 13 FEHY
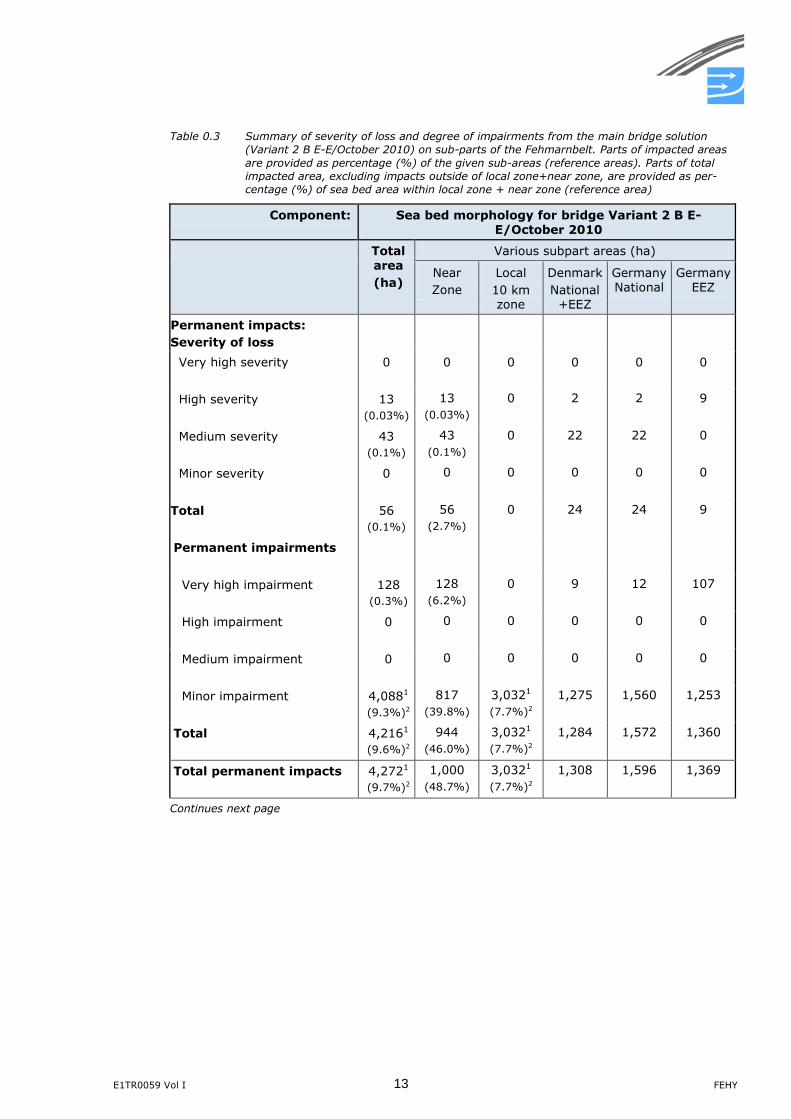
Table 0.3 Summary of severity of loss and degree of impairments from the main bridge solution
(Variant 2 B E-E/October 2010) on sub-parts of the Fehmarnbelt. Parts of impacted areas
are provided as percentage (%) of the given sub-areas (reference areas). Parts of total
impacted area, excluding impacts outside of local zone+near zone, are provided as per-
centage (%) of sea bed area within local zone + near zone (reference area)
Component: Sea bed morphology for bridge Variant 2 B E-E/October 2010
Total area
(ha)
Various subpart areas (ha)
Near
Zone
Local
10 km zone
Denmark
National +EEZ
Germany National
Germany EEZ
Permanent impacts:
Severity of loss
Very high severity 0 0 0 0 0 0
High severity 13
(0.03%)
13
(0.03%)
0
2 2 9
Medium severity 43
(0.1%)
43
(0.1%)
0
22 22 0
Minor severity 0 0 0 0 0 0
Total
56
(0.1%)
56
(2.7%)
0
24 24 9
Permanent impairments
Very high impairment 128
(0.3%)
128
(6.2%)
0 9 12 107
High impairment 0 0 0 0 0 0
Medium impairment 0 0 0 0 0 0
Minor impairment 4,0881
(9.3%)2
817
(39.8%)
3,0321
(7.7%)2
1,275 1,560 1,253
Total
4,2161
(9.6%)2
944
(46.0%)
3,0321
(7.7%)2
1,284 1,572 1,360
Total permanent impacts 4,2721
(9.7%)2
1,000
(48.7%)
3,0321
(7.7%)2
1,308 1,596 1,369
Continues next page
FEHY 14 E1TR0059 Vol I
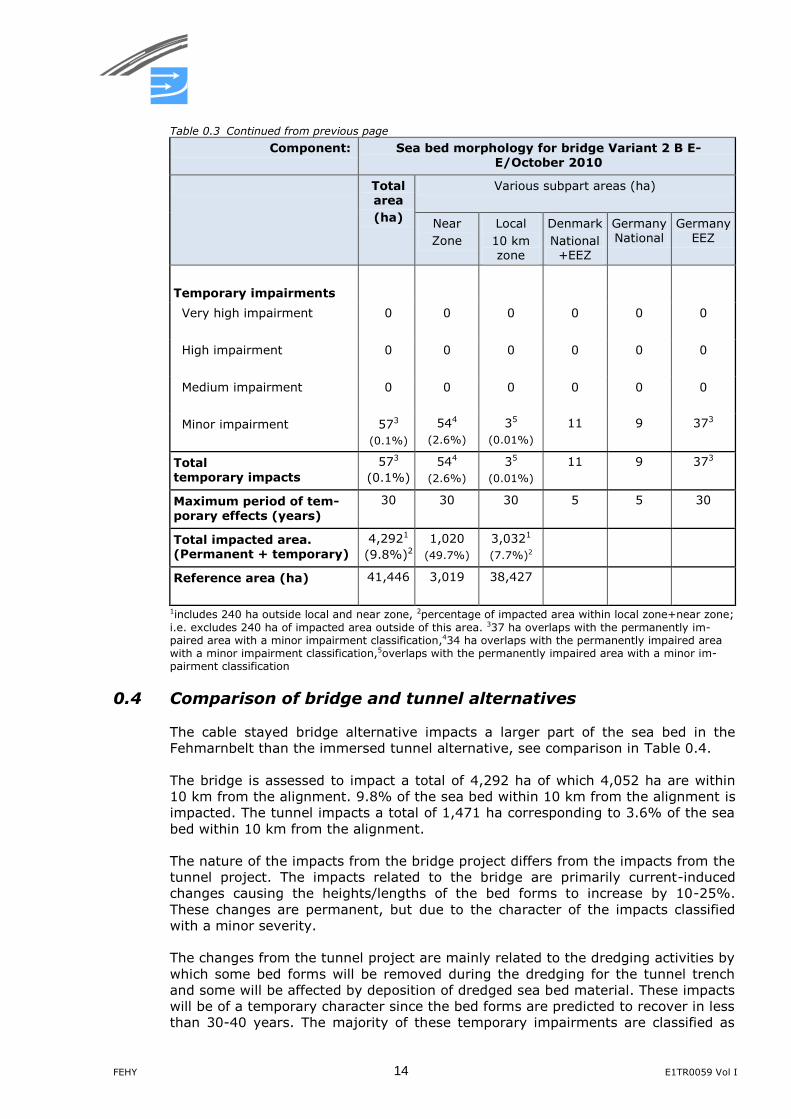
Table 0.3 Continued from previous page
Component: Sea bed morphology for bridge Variant 2 B E-E/October 2010
Total area
(ha)
Various subpart areas (ha)
Near
Zone
Local
10 km zone
Denmark
National +EEZ
Germany National
Germany EEZ
Temporary impairments
Very high impairment 0 0 0 0 0 0
High impairment 0 0 0 0 0 0
Medium impairment 0 0 0 0 0 0
Minor impairment 573
(0.1%)
544
(2.6%)
35
(0.01%)
11 9 373
Total temporary impacts
573 (0.1%)
544
(2.6%)
35
(0.01%)
11 9 373
Maximum period of tem-porary effects (years)
30 30 30 5 5 30
Total impacted area. (Permanent + temporary)
4,2921 (9.8%)2
1,020
(49.7%)
3,0321
(7.7%)2
Reference area (ha) 41,446 3,019 38,427
1includes 240 ha outside local and near zone, 2percentage of impacted area within local zone+near zone;
i.e. excludes 240 ha of impacted area outside of this area. 337 ha overlaps with the permanently im-paired area with a minor impairment classification,434 ha overlaps with the permanently impaired area with a minor impairment classification,5overlaps with the permanently impaired area with a minor im-pairment classification
0.4 Comparison of bridge and tunnel alternatives
The cable stayed bridge alternative impacts a larger part of the sea bed in the
Fehmarnbelt than the immersed tunnel alternative, see comparison in Table 0.4.
The bridge is assessed to impact a total of 4,292 ha of which 4,052 ha are within
10 km from the alignment. 9.8% of the sea bed within 10 km from the alignment is
impacted. The tunnel impacts a total of 1,471 ha corresponding to 3.6% of the sea
bed within 10 km from the alignment.
The nature of the impacts from the bridge project differs from the impacts from the
tunnel project. The impacts related to the bridge are primarily current-induced
changes causing the heights/lengths of the bed forms to increase by 10-25%.
These changes are permanent, but due to the character of the impacts classified
with a minor severity.
The changes from the tunnel project are mainly related to the dredging activities by
which some bed forms will be removed during the dredging for the tunnel trench
and some will be affected by deposition of dredged sea bed material. These impacts
will be of a temporary character since the bed forms are predicted to recover in less
than 30-40 years. The majority of these temporary impairments are classified as
E1TR0059 Vol I 15 FEHY
having a minor or medium severity. The impacts from the bridge are therefore to a
higher degree permanent, while the impacts from the tunnel are primarily tempo-
rary impacts.
The total loss of sea bed is, however, smaller for the bridge than for the tunnel.
This is primarily due to the large reclamation on the Danish side in case of the tun-
nel.
For both projects, however, only very limited areas are impaired to a high or very
high degree. For the immersed tunnel project these account for 103 ha and for the
cable stayed bridge project 128 ha are impaired with high or very high degree of
impairment. In the baseline study, the influence of the bed forms on the current
field and flow through the Fehmarnbelt was found to be insignificant (FEHY 2013a).
The above-mentioned changes to the bed forms in either project do not change this
situation.
In conclusion, the impacts from the bridge project as well as the tunnel project are
assessed as insignificant for the marine soil component sea bed morphology. The
differences in the impacted areas as well as the difference in the character of the
impacts from the projects do not lead to one or the other project being the pre-
ferred option based on the impacts on sea bed morphology. Table 0.5 summarises
the comparison of the immersed tunnel and cable stayed bridge.
FEHY 16 E1TR0059 Vol I
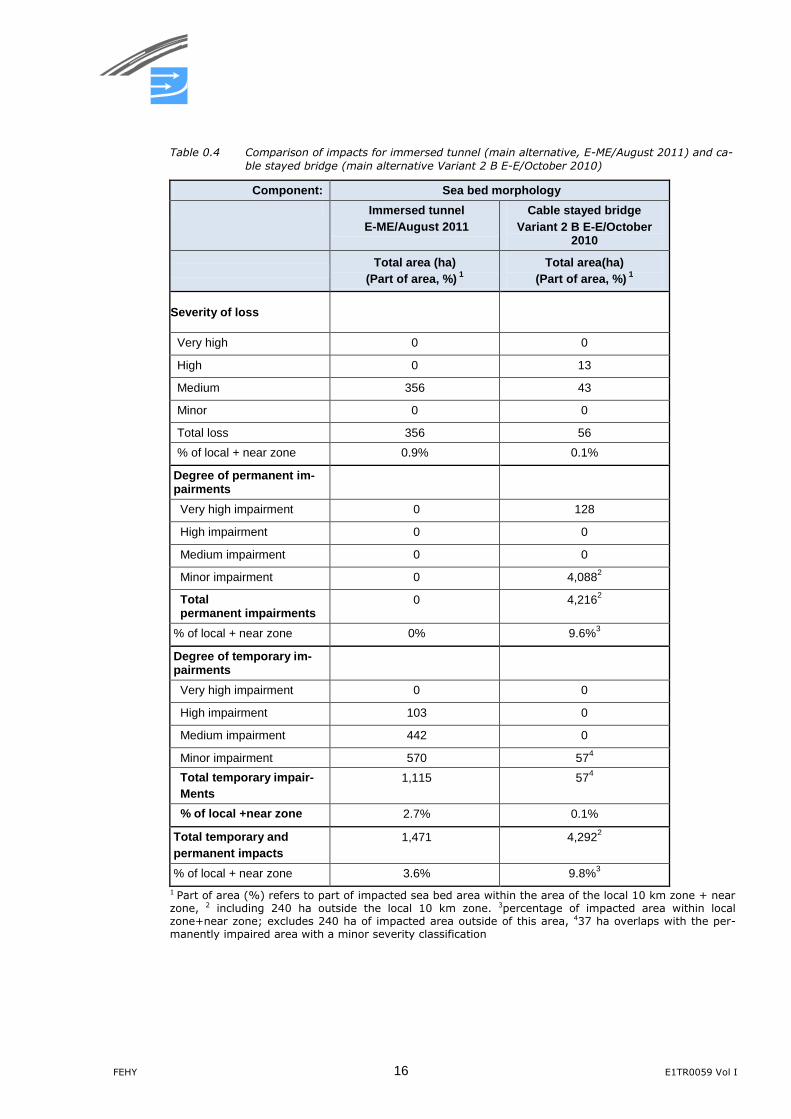
Table 0.4 Comparison of impacts for immersed tunnel (main alternative, E-ME/August 2011) and ca-
ble stayed bridge (main alternative Variant 2 B E-E/October 2010)
Component: Sea bed morphology
Immersed tunnel
E-ME/August 2011
Cable stayed bridge
Variant 2 B E-E/October 2010
Total area (ha)
(Part of area, %) 1
Total area(ha)
(Part of area, %) 1
Severity of loss
Very high 0 0
High 0 13
Medium 356 43
Minor 0 0
Total loss 356 56
% of local + near zone 0.9% 0.1%
Degree of permanent im-pairments
Very high impairment 0 128
High impairment 0 0
Medium impairment 0 0
Minor impairment 0 4,0882
Total permanent impairments
0 4,2162
% of local + near zone 0% 9.6%3
Degree of temporary im-pairments
Very high impairment 0 0
High impairment 103 0
Medium impairment 442 0
Minor impairment 570 574
Total temporary impair-
Ments
1,115 574
% of local +near zone 2.7% 0.1%
Total temporary and
permanent impacts
1,471 4,2922
% of local + near zone 3.6% 9.8%3
1 Part of area (%) refers to part of impacted sea bed area within the area of the local 10 km zone + near zone, 2 including 240 ha outside the local 10 km zone. 3percentage of impacted area within local zone+near zone; excludes 240 ha of impacted area outside of this area, 437 ha overlaps with the per-manently impaired area with a minor severity classification
E1TR0059 Vol I 17 FEHY
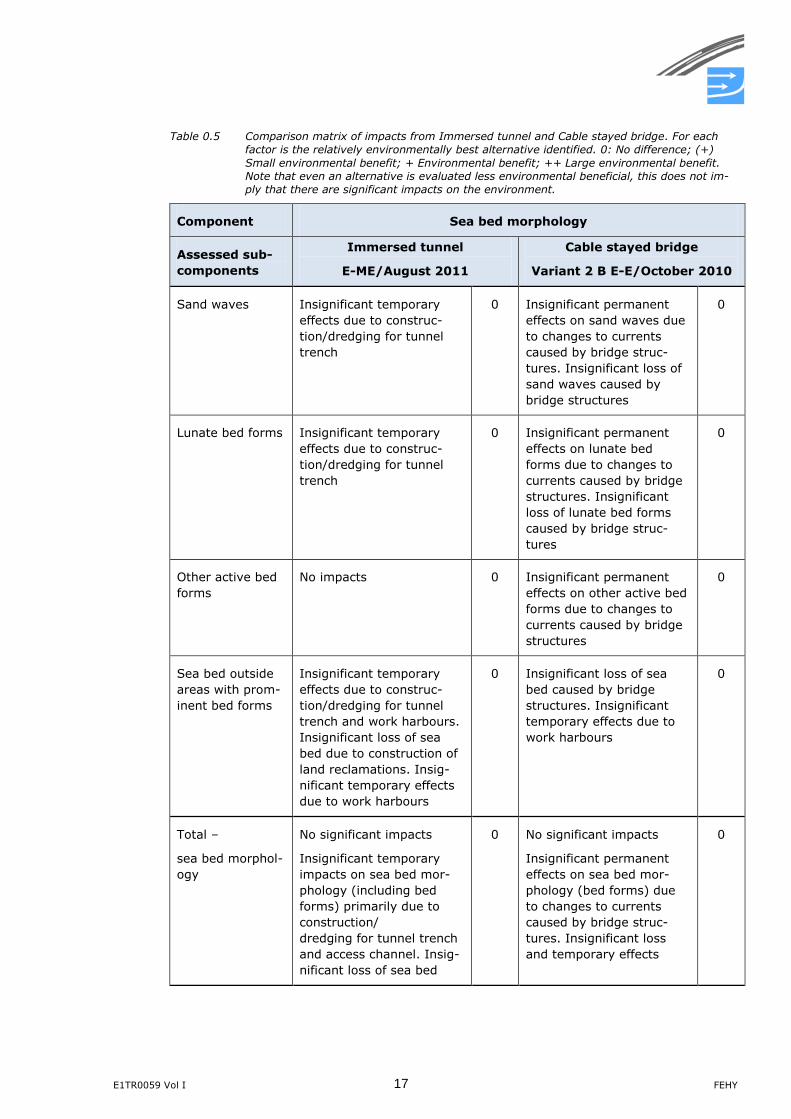
Table 0.5 Comparison matrix of impacts from Immersed tunnel and Cable stayed bridge. For each
factor is the relatively environmentally best alternative identified. 0: No difference; (+)
Small environmental benefit; + Environmental benefit; ++ Large environmental benefit.
Note that even an alternative is evaluated less environmental beneficial, this does not im-
ply that there are significant impacts on the environment.
Component Sea bed morphology
Assessed sub-
components
Immersed tunnel
E-ME/August 2011
Cable stayed bridge
Variant 2 B E-E/October 2010
Sand waves Insignificant temporary
effects due to construc-
tion/dredging for tunnel
trench
0 Insignificant permanent
effects on sand waves due
to changes to currents
caused by bridge struc-
tures. Insignificant loss of
sand waves caused by
bridge structures
0
Lunate bed forms Insignificant temporary
effects due to construc-
tion/dredging for tunnel
trench
0 Insignificant permanent
effects on lunate bed
forms due to changes to
currents caused by bridge
structures. Insignificant
loss of lunate bed forms
caused by bridge struc-
tures
0
Other active bed
forms
No impacts 0 Insignificant permanent
effects on other active bed
forms due to changes to
currents caused by bridge
structures
0
Sea bed outside
areas with prom-
inent bed forms
Insignificant temporary
effects due to construc-
tion/dredging for tunnel
trench and work harbours.
Insignificant loss of sea
bed due to construction of
land reclamations. Insig-
nificant temporary effects
due to work harbours
0 Insignificant loss of sea
bed caused by bridge
structures. Insignificant
temporary effects due to
work harbours
0
Total –
sea bed morphol-
ogy
No significant impacts
Insignificant temporary
impacts on sea bed mor-
phology (including bed
forms) primarily due to
construction/
dredging for tunnel trench
and access channel. Insig-
nificant loss of sea bed
0 No significant impacts
Insignificant permanent
effects on sea bed mor-
phology (bed forms) due
to changes to currents
caused by bridge struc-
tures. Insignificant loss
and temporary effects
0
FEHY 18 E1TR0059 Vol I
1 INTRODUCTION
1.1 Environmental theme
An infrastructure project like the Fehmarnbelt project will unavoidably have some
impact on the sea bed morphology due to the construction of large physical struc-
tures on the sea bed and dredging of sea bed material in relation to the construc-
tion.
In some areas, the sea bed morphology will be impacted by these structures, tem-
porarily or permanently. The present report maps these areas and the impacts af-
fecting them.
This report deals with the impacts on the sea bed morphology. The sea bed forms
are the result of interaction between loose sediments on the sea bed and the flow
above the sea bed. Other morphological elements, such as reefs, are usually areas
under erosion where coarser materials such as stones and other hard substrates
occupy larger parts of the sea bed. Such reefs may constitute important habitats
for benthic flora and fauna. Reefs are therefore considered a biotope in relation to
the EIA for the Fehmarnbelt Fixed Link and mapping and assessment of reefs are
hence not treated along with the dynamic sea bed morphology in this report, but as
a part of the marine biology in (FEMA 2013a).
Morphological features and landscape related to the coastal processes in the near-
shore zone, such as for instance sand bars in the coastal profile as well as the spe-
cial morphological features such as Grüner Brink on Fehmarn and the
Hyllekrog/Rødsand formations on the Danish side, are treated in the report related
to coastal morphology (FEHY 2013f).
Large areas of the Fehmarnbelt are covered by dynamic and morphologically active
bed forms. They mainly occur as larger undulations of the sea bed on the slopes of
the bottom, where the water depth typical is in the range 10-20 m, and as smaller
undulations in the deeper areas.
The bed forms were studied extensively. The primary purposes for the interest in
the bed forms in relation to the EIA for the Fehmarnbelt are:
Parts of the bed forms are part of the conservation objectives within environ-
mentally protected Natura 2000 areas
The bed forms are special morphological features and contribute as such to the
diversity of the sea bed in the Fehmarnbelt
The bed forms impose resistance on the flow field
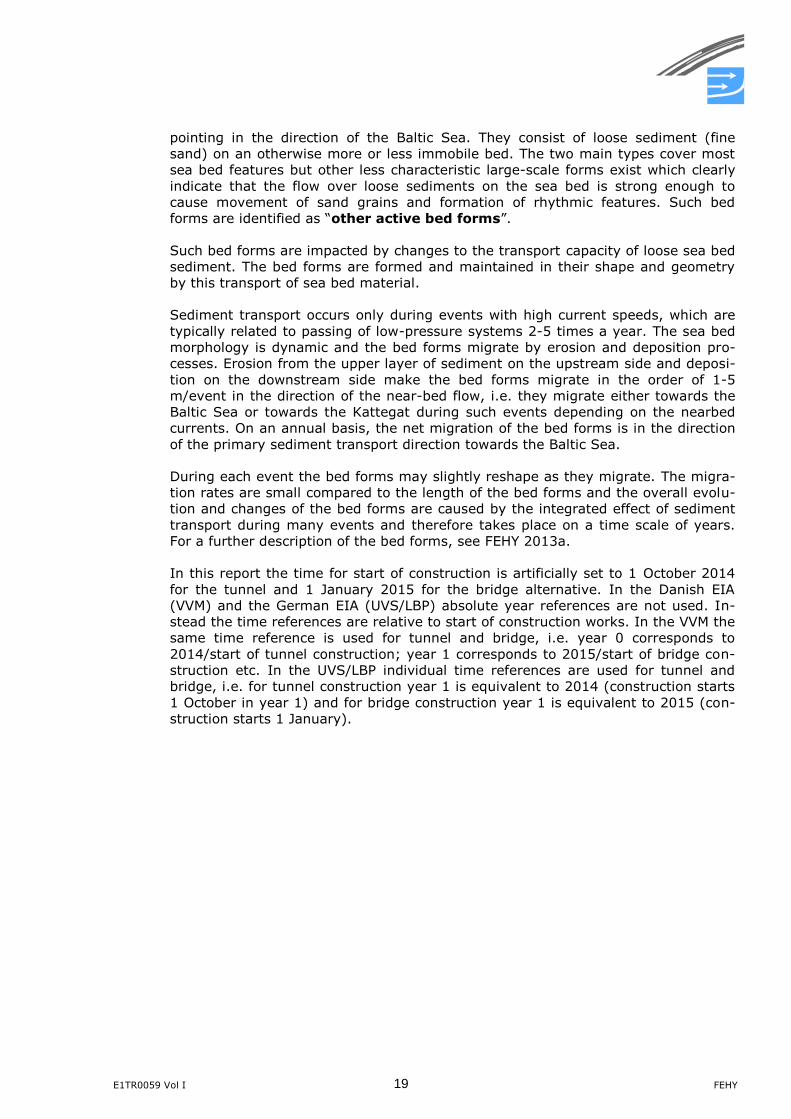
The mapping of the bed forms in the Fehmarnbelt is carried out as part of the base-
line study (FEHY 2013a), see Figure 1.1. In the baseline study it is concluded that
the effect of bed forms on the flow through the Belt is very small. The potential ef-
fect on the flow resistance due to changes to the bed forms by the link (the last
bullet above) has therefore not been further investigated.
Two main types of bed forms were found on the sea bed of the Fehmarnbelt: sand
waves and lunate bed forms. Sand waves are large-scale flow-transverse ridges
of sand, i.e. the crests of the sand waves are flow transverse, but may also be in-
clined at an angle to the main flow direction where there is a gradient in the flow.
Lunate bed forms are 3D in their nature and have lunate shape with the “arms”
E1TR0059 Vol I 19 FEHY
pointing in the direction of the Baltic Sea. They consist of loose sediment (fine
sand) on an otherwise more or less immobile bed. The two main types cover most
sea bed features but other less characteristic large-scale forms exist which clearly
indicate that the flow over loose sediments on the sea bed is strong enough to
cause movement of sand grains and formation of rhythmic features. Such bed
forms are identified as “other active bed forms”.
Such bed forms are impacted by changes to the transport capacity of loose sea bed
sediment. The bed forms are formed and maintained in their shape and geometry
by this transport of sea bed material.
Sediment transport occurs only during events with high current speeds, which are
typically related to passing of low-pressure systems 2-5 times a year. The sea bed
morphology is dynamic and the bed forms migrate by erosion and deposition pro-
cesses. Erosion from the upper layer of sediment on the upstream side and deposi-
tion on the downstream side make the bed forms migrate in the order of 1-5
m/event in the direction of the near-bed flow, i.e. they migrate either towards the
Baltic Sea or towards the Kattegat during such events depending on the nearbed
currents. On an annual basis, the net migration of the bed forms is in the direction
of the primary sediment transport direction towards the Baltic Sea.
During each event the bed forms may slightly reshape as they migrate. The migra-
tion rates are small compared to the length of the bed forms and the overall evolu-
tion and changes of the bed forms are caused by the integrated effect of sediment
transport during many events and therefore takes place on a time scale of years.
For a further description of the bed forms, see FEHY 2013a.
In this report the time for start of construction is artificially set to 1 October 2014
for the tunnel and 1 January 2015 for the bridge alternative. In the Danish EIA
(VVM) and the German EIA (UVS/LBP) absolute year references are not used. In-
stead the time references are relative to start of construction works. In the VVM the
same time reference is used for tunnel and bridge, i.e. year 0 corresponds to
2014/start of tunnel construction; year 1 corresponds to 2015/start of bridge con-
struction etc. In the UVS/LBP individual time references are used for tunnel and
bridge, i.e. for tunnel construction year 1 is equivalent to 2014 (construction starts
1 October in year 1) and for bridge construction year 1 is equivalent to 2015 (con-
struction starts 1 January).
FEHY 20 E1TR0059 Vol I
.
Figure 1.1 The bed form classification map. The marine parts of the relevant Natura 2000 areas are
shown. The area of investigation shows the area where prominent bed forms have been
mapped.
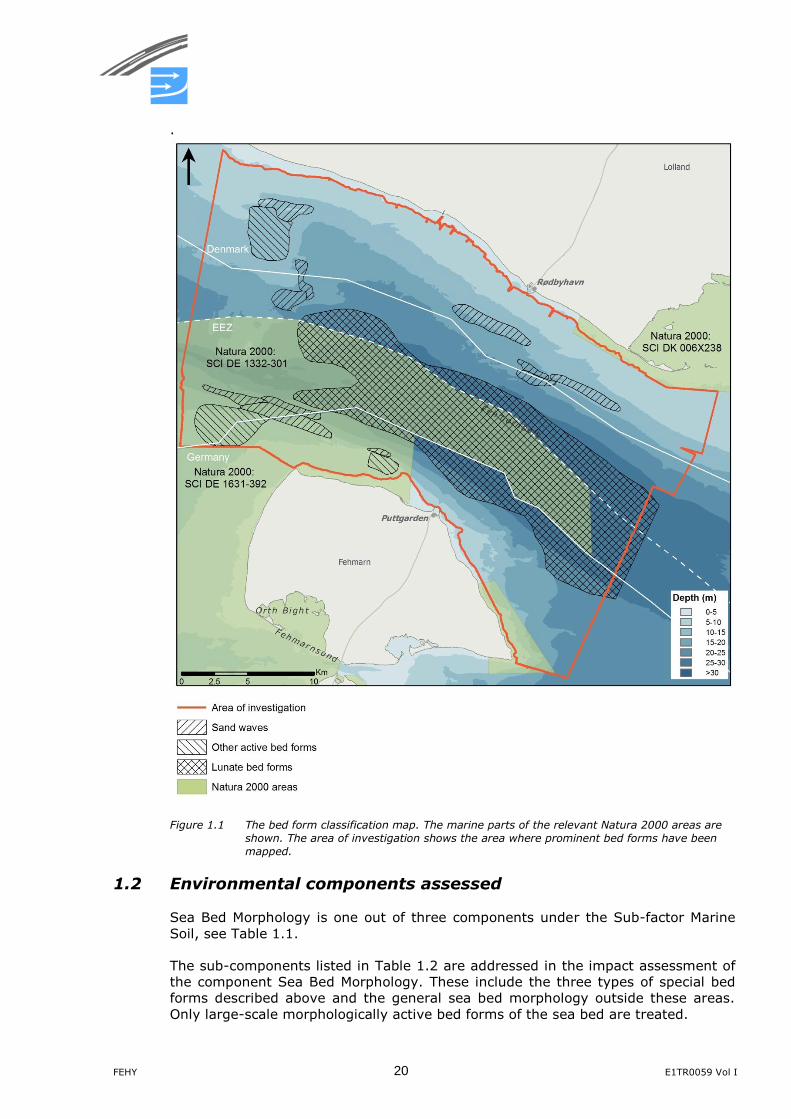
1.2 Environmental components assessed
Sea Bed Morphology is one out of three components under the Sub-factor Marine
Soil, see Table 1.1.
The sub-components listed in Table 1.2 are addressed in the impact assessment of
the component Sea Bed Morphology. These include the three types of special bed
forms described above and the general sea bed morphology outside these areas.
Only large-scale morphologically active bed forms of the sea bed are treated.
E1TR0059 Vol I 21 FEHY
Morphological features on the sea bed closer to the coast than the 6 m DVR90
depth contour are described in the impact assessment related to coastal morpholo-
gy (FEHY 2013f). This accounts for near-shore bars and special morphological fea-
tures such as the Grüner Brink formation on the Fehmarn coast.
Sea bed sediment is not assessed as a separate environmental component. Impacts
from the project will not change the composition of the sediment to a degree where
the geomorphological processes are influenced, see discussion in Section 2.2.
The influence of deposition of spill of sea bed material from the dredging activities
on the surface sea bed material is treated in (FEHY 2013d).
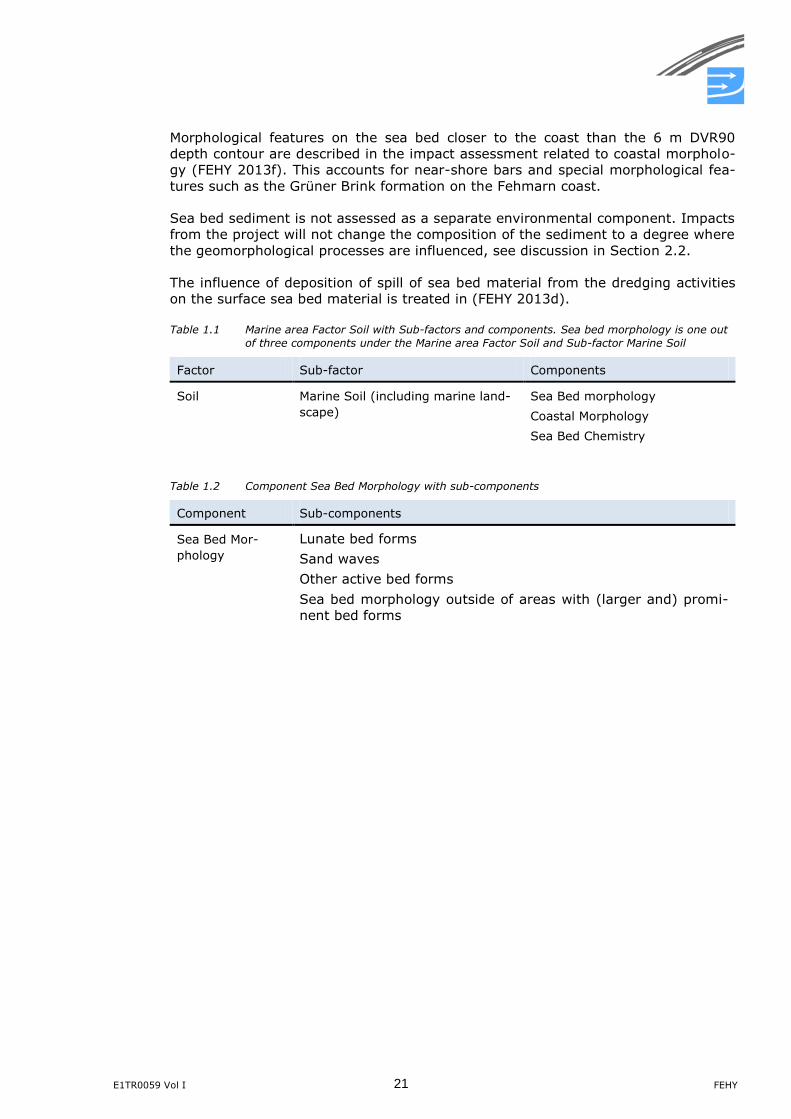
Table 1.1 Marine area Factor Soil with Sub-factors and components. Sea bed morphology is one out
of three components under the Marine area Factor Soil and Sub-factor Marine Soil
Factor Sub-factor Components
Soil Marine Soil (including marine land-
scape)
Sea Bed morphology
Coastal Morphology
Sea Bed Chemistry
Table 1.2 Component Sea Bed Morphology with sub-components
Component Sub-components
Sea Bed Mor-
phology
Lunate bed forms
Sand waves
Other active bed forms
Sea bed morphology outside of areas with (larger and) promi-
nent bed forms
FEHY 22 E1TR0059 Vol I
2 THE FEHMARNBELT FIXED LINK PROJECT
2.1 General description of the project
The Impact assessment is undertaken for two fixed link solutions:
Immersed tunnel E-ME (August 2011)
Cable Stayed Bridge Variant 2 B-EE (October 2010)
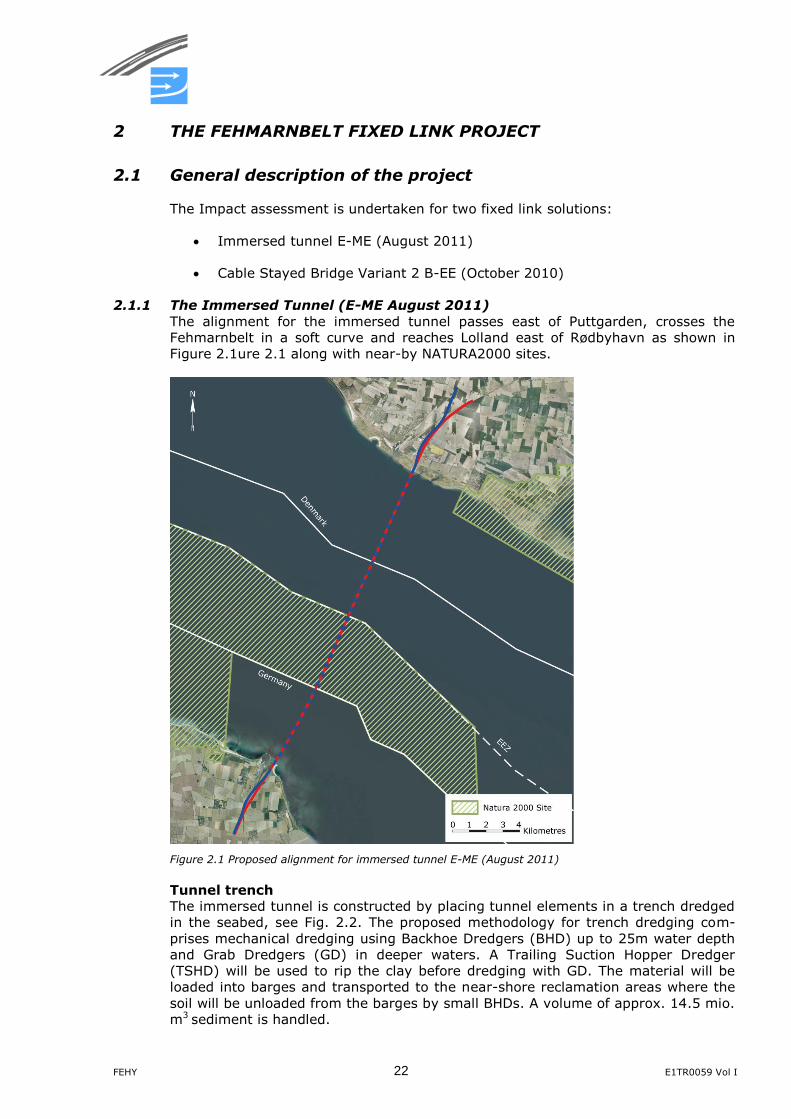
2.1.1 The Immersed Tunnel (E-ME August 2011)
The alignment for the immersed tunnel passes east of Puttgarden, crosses the
Fehmarnbelt in a soft curve and reaches Lolland east of Rødbyhavn as shown in
Figure 2.1ure 2.1 along with near-by NATURA2000 sites.
Figure 2.1 Proposed alignment for immersed tunnel E-ME (August 2011)
Tunnel trench
The immersed tunnel is constructed by placing tunnel elements in a trench dredged
in the seabed, see Fig. 2.2. The proposed methodology for trench dredging com-
prises mechanical dredging using Backhoe Dredgers (BHD) up to 25m water depth
and Grab Dredgers (GD) in deeper waters. A Trailing Suction Hopper Dredger
(TSHD) will be used to rip the clay before dredging with GD. The material will be
loaded into barges and transported to the near-shore reclamation areas where the
soil will be unloaded from the barges by small BHDs. A volume of approx. 14.5 mio.
m3 sediment is handled.
E1TR0059 Vol I 23 FEHY
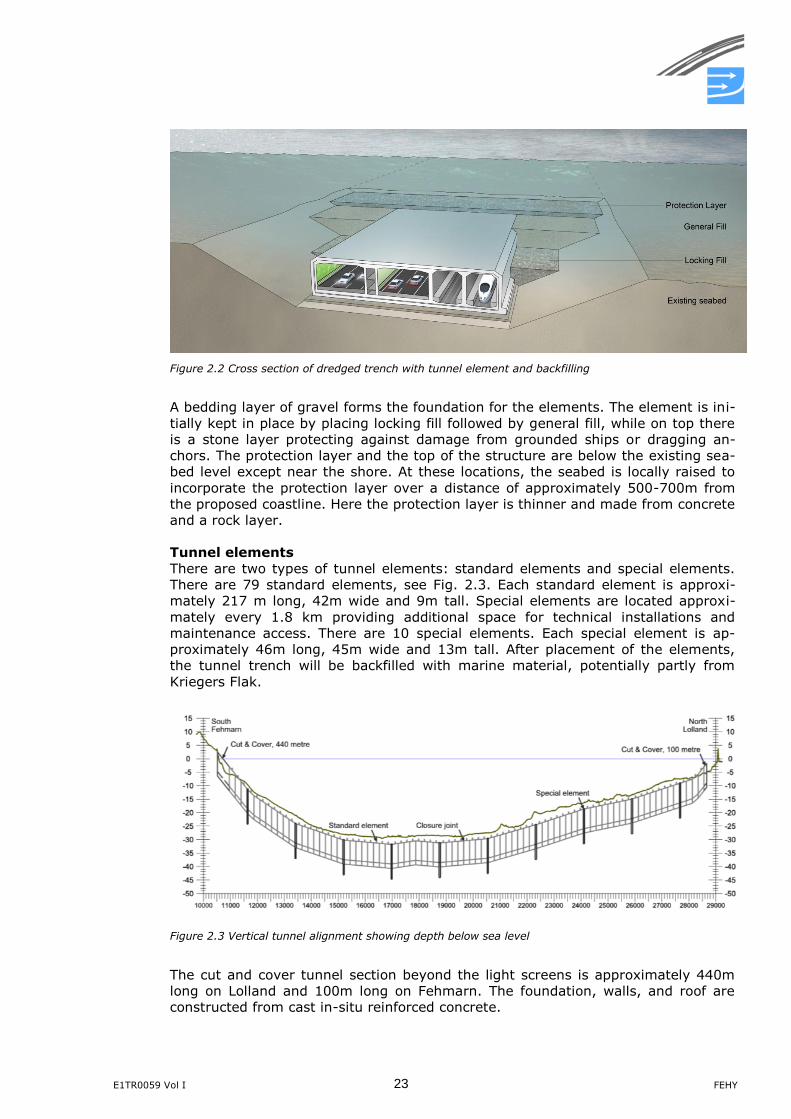
Figure 2.2 Cross section of dredged trench with tunnel element and backfilling
A bedding layer of gravel forms the foundation for the elements. The element is ini-
tially kept in place by placing locking fill followed by general fill, while on top there
is a stone layer protecting against damage from grounded ships or dragging an-
chors. The protection layer and the top of the structure are below the existing sea-
bed level except near the shore. At these locations, the seabed is locally raised to
incorporate the protection layer over a distance of approximately 500-700m from
the proposed coastline. Here the protection layer is thinner and made from concrete
and a rock layer.
Tunnel elements
There are two types of tunnel elements: standard elements and special elements.
There are 79 standard elements, see Fig. 2.3. Each standard element is approxi-
mately 217 m long, 42m wide and 9m tall. Special elements are located approxi-
mately every 1.8 km providing additional space for technical installations and
maintenance access. There are 10 special elements. Each special element is ap-
proximately 46m long, 45m wide and 13m tall. After placement of the elements,
the tunnel trench will be backfilled with marine material, potentially partly from
Kriegers Flak.
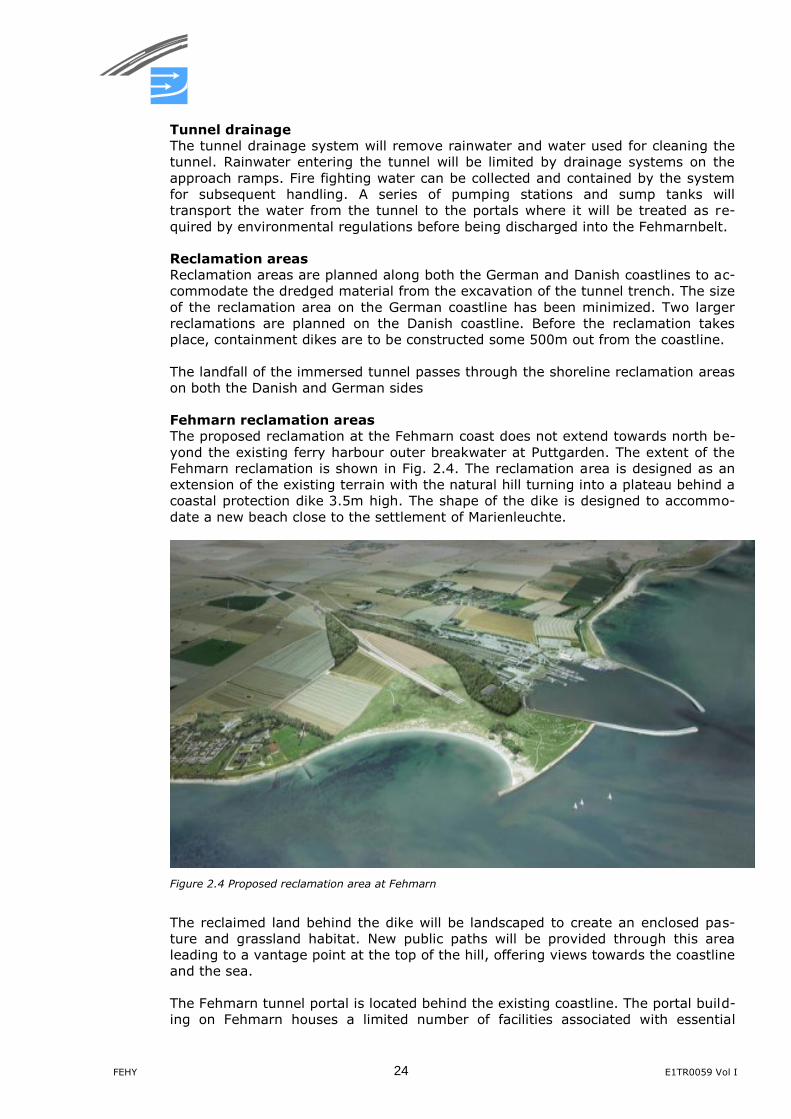
Figure 2.3 Vertical tunnel alignment showing depth below sea level
The cut and cover tunnel section beyond the light screens is approximately 440m
long on Lolland and 100m long on Fehmarn. The foundation, walls, and roof are
constructed from cast in-situ reinforced concrete.
FEHY 24 E1TR0059 Vol I
Tunnel drainage
The tunnel drainage system will remove rainwater and water used for cleaning the
tunnel. Rainwater entering the tunnel will be limited by drainage systems on the
approach ramps. Fire fighting water can be collected and contained by the system
for subsequent handling. A series of pumping stations and sump tanks will
transport the water from the tunnel to the portals where it will be treated as re-
quired by environmental regulations before being discharged into the Fehmarnbelt.
Reclamation areas
Reclamation areas are planned along both the German and Danish coastlines to ac-
commodate the dredged material from the excavation of the tunnel trench. The size
of the reclamation area on the German coastline has been minimized. Two larger
reclamations are planned on the Danish coastline. Before the reclamation takes
place, containment dikes are to be constructed some 500m out from the coastline.
The landfall of the immersed tunnel passes through the shoreline reclamation areas
on both the Danish and German sides
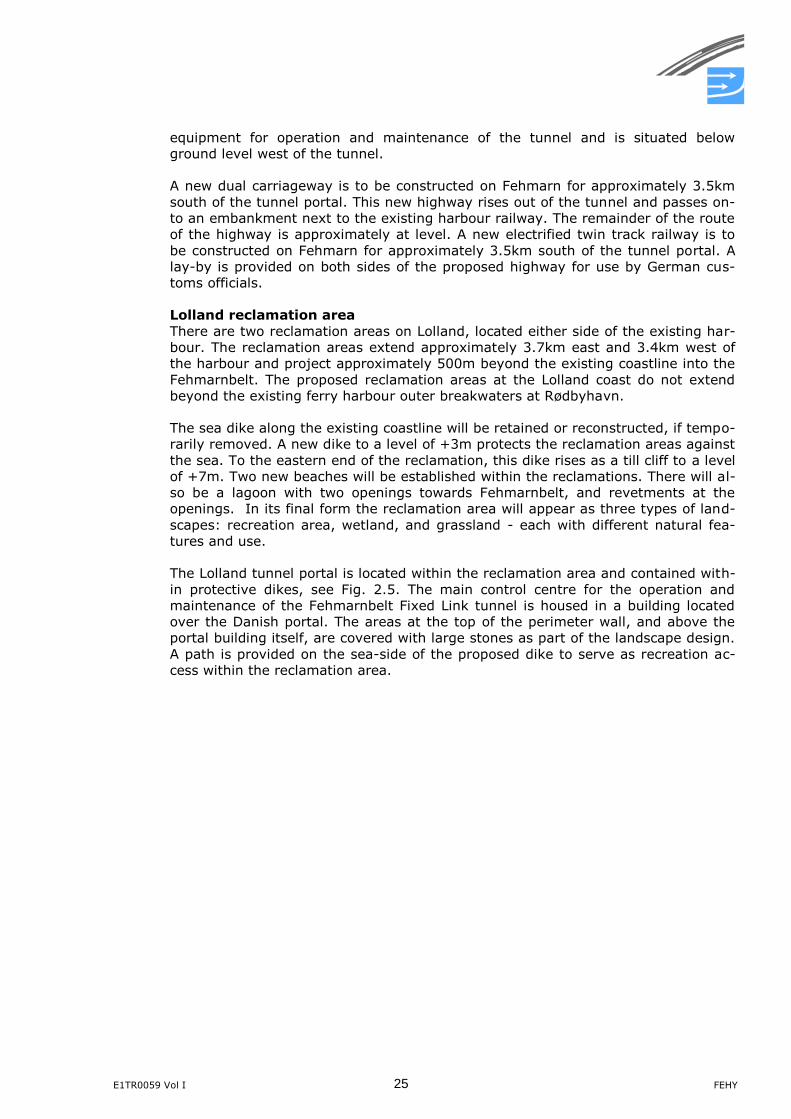
Fehmarn reclamation areas
The proposed reclamation at the Fehmarn coast does not extend towards north be-
yond the existing ferry harbour outer breakwater at Puttgarden. The extent of the
Fehmarn reclamation is shown in Fig. 2.4. The reclamation area is designed as an
extension of the existing terrain with the natural hill turning into a plateau behind a
coastal protection dike 3.5m high. The shape of the dike is designed to accommo-
date a new beach close to the settlement of Marienleuchte.
Figure 2.4 Proposed reclamation area at Fehmarn
The reclaimed land behind the dike will be landscaped to create an enclosed pas-
ture and grassland habitat. New public paths will be provided through this area
leading to a vantage point at the top of the hill, offering views towards the coastline
and the sea.
The Fehmarn tunnel portal is located behind the existing coastline. The portal build-
ing on Fehmarn houses a limited number of facilities associated with essential
E1TR0059 Vol I 25 FEHY
equipment for operation and maintenance of the tunnel and is situated below
ground level west of the tunnel.
A new dual carriageway is to be constructed on Fehmarn for approximately 3.5km
south of the tunnel portal. This new highway rises out of the tunnel and passes on-
to an embankment next to the existing harbour railway. The remainder of the route
of the highway is approximately at level. A new electrified twin track railway is to
be constructed on Fehmarn for approximately 3.5km south of the tunnel portal. A
lay-by is provided on both sides of the proposed highway for use by German cus-
toms officials.
Lolland reclamation area
There are two reclamation areas on Lolland, located either side of the existing har-
bour. The reclamation areas extend approximately 3.7km east and 3.4km west of
the harbour and project approximately 500m beyond the existing coastline into the
Fehmarnbelt. The proposed reclamation areas at the Lolland coast do not extend
beyond the existing ferry harbour outer breakwaters at Rødbyhavn.
The sea dike along the existing coastline will be retained or reconstructed, if tempo-
rarily removed. A new dike to a level of +3m protects the reclamation areas against
the sea. To the eastern end of the reclamation, this dike rises as a till cliff to a level
of +7m. Two new beaches will be established within the reclamations. There will al-
so be a lagoon with two openings towards Fehmarnbelt, and revetments at the
openings. In its final form the reclamation area will appear as three types of land-
scapes: recreation area, wetland, and grassland - each with different natural fea-
tures and use.
The Lolland tunnel portal is located within the reclamation area and contained with-
in protective dikes, see Fig. 2.5. The main control centre for the operation and
maintenance of the Fehmarnbelt Fixed Link tunnel is housed in a building located
over the Danish portal. The areas at the top of the perimeter wall, and above the
portal building itself, are covered with large stones as part of the landscape design.
A path is provided on the sea-side of the proposed dike to serve as recreation ac-
cess within the reclamation area.
FEHY 26 E1TR0059 Vol I
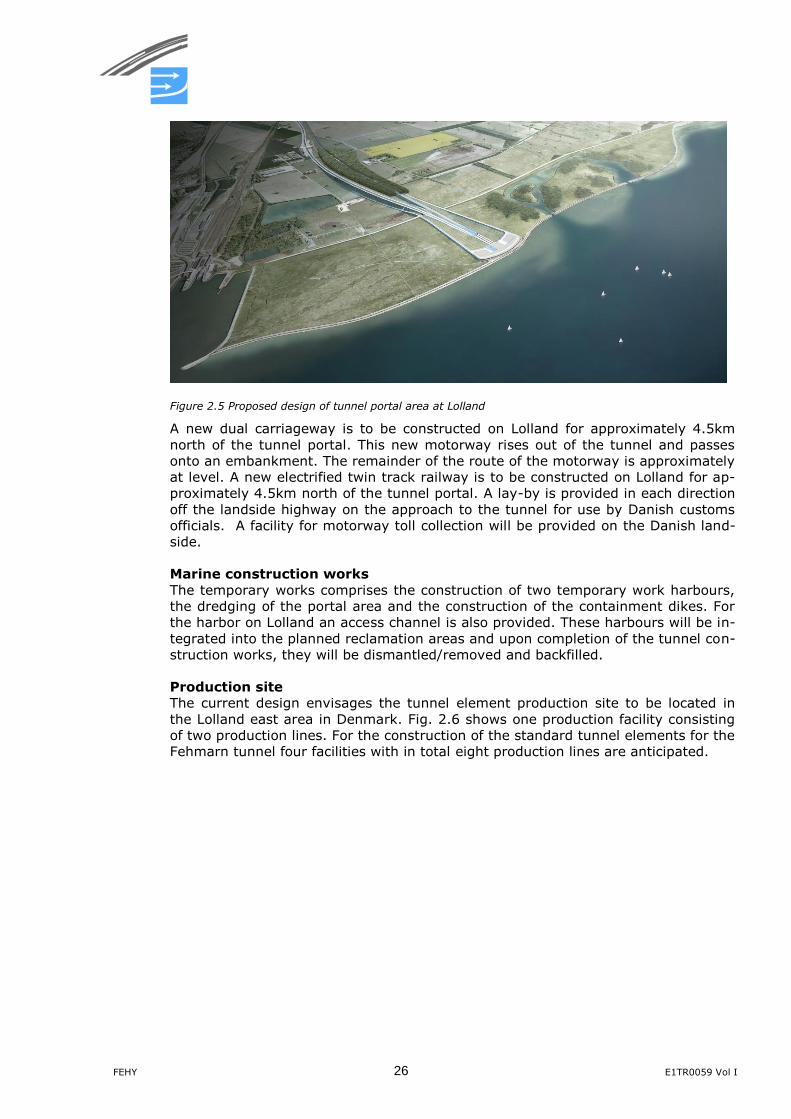
Figure 2.5 Proposed design of tunnel portal area at Lolland
A new dual carriageway is to be constructed on Lolland for approximately 4.5km
north of the tunnel portal. This new motorway rises out of the tunnel and passes
onto an embankment. The remainder of the route of the motorway is approximately
at level. A new electrified twin track railway is to be constructed on Lolland for ap-
proximately 4.5km north of the tunnel portal. A lay-by is provided in each direction
off the landside highway on the approach to the tunnel for use by Danish customs
officials. A facility for motorway toll collection will be provided on the Danish land-
side.
Marine construction works
The temporary works comprises the construction of two temporary work harbours,
the dredging of the portal area and the construction of the containment dikes. For
the harbor on Lolland an access channel is also provided. These harbours will be in-
tegrated into the planned reclamation areas and upon completion of the tunnel con-
struction works, they will be dismantled/removed and backfilled.
Production site
The current design envisages the tunnel element production site to be located in
the Lolland east area in Denmark. Fig. 2.6 shows one production facility consisting
of two production lines. For the construction of the standard tunnel elements for the
Fehmarn tunnel four facilities with in total eight production lines are anticipated.
E1TR0059 Vol I 27 FEHY
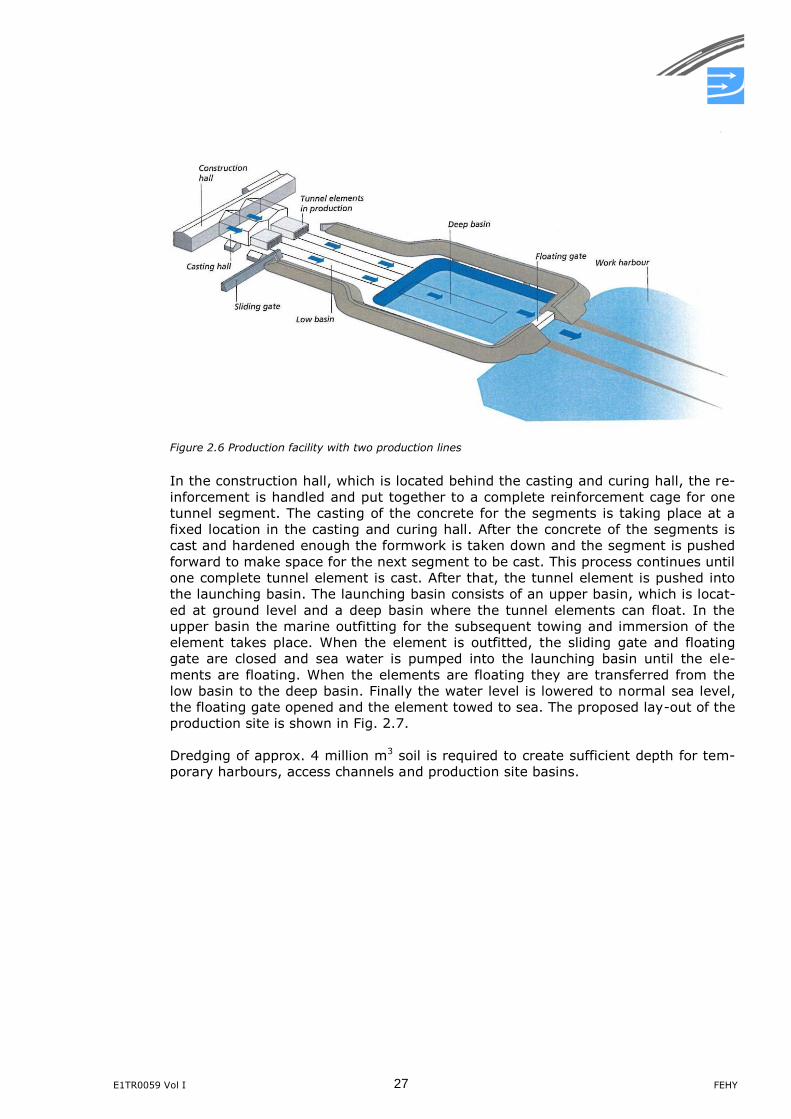
Figure 2.6 Production facility with two production lines
In the construction hall, which is located behind the casting and curing hall, the re-
inforcement is handled and put together to a complete reinforcement cage for one
tunnel segment. The casting of the concrete for the segments is taking place at a
fixed location in the casting and curing hall. After the concrete of the segments is
cast and hardened enough the formwork is taken down and the segment is pushed
forward to make space for the next segment to be cast. This process continues until
one complete tunnel element is cast. After that, the tunnel element is pushed into
the launching basin. The launching basin consists of an upper basin, which is locat-
ed at ground level and a deep basin where the tunnel elements can float. In the
upper basin the marine outfitting for the subsequent towing and immersion of the
element takes place. When the element is outfitted, the sliding gate and floating
gate are closed and sea water is pumped into the launching basin until the ele-
ments are floating. When the elements are floating they are transferred from the
low basin to the deep basin. Finally the water level is lowered to normal sea level,
the floating gate opened and the element towed to sea. The proposed lay-out of the
production site is shown in Fig. 2.7.
Dredging of approx. 4 million m3 soil is required to create sufficient depth for tem-
porary harbours, access channels and production site basins.
FEHY 28 E1TR0059 Vol I
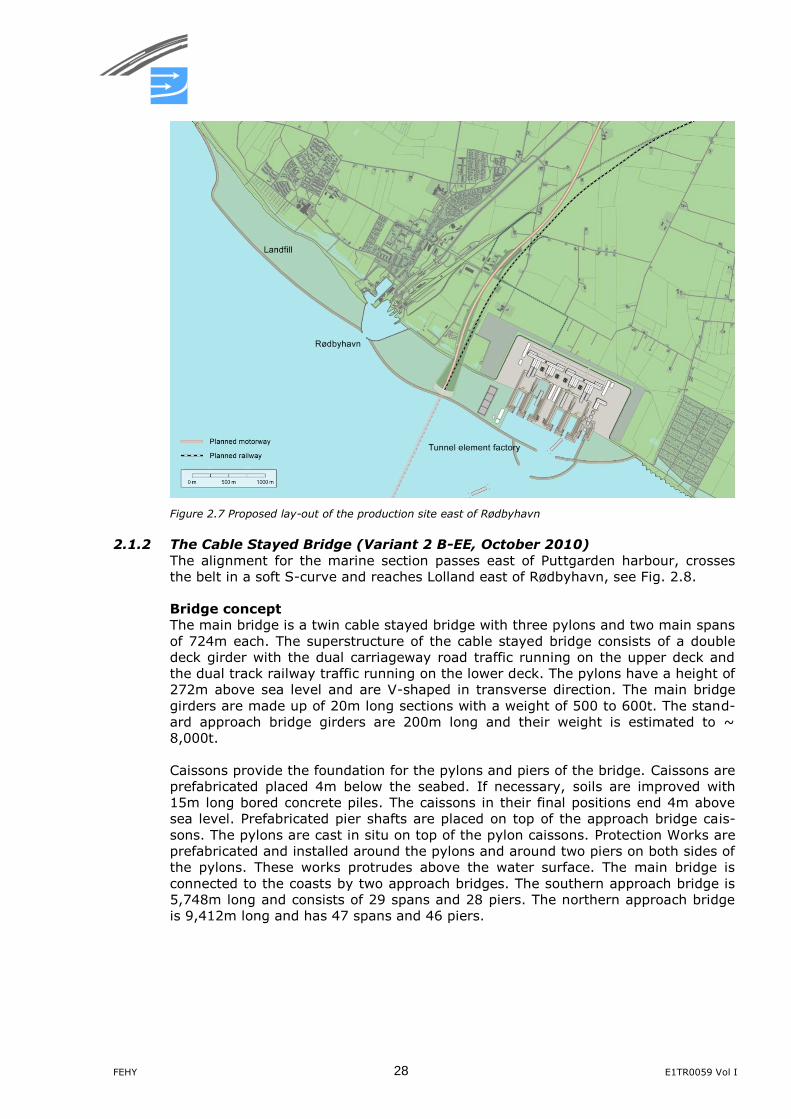
Figure 2.7 Proposed lay-out of the production site east of Rødbyhavn
2.1.2 The Cable Stayed Bridge (Variant 2 B-EE, October 2010)
The alignment for the marine section passes east of Puttgarden harbour, crosses
the belt in a soft S-curve and reaches Lolland east of Rødbyhavn, see Fig. 2.8.
Bridge concept
The main bridge is a twin cable stayed bridge with three pylons and two main spans
of 724m each. The superstructure of the cable stayed bridge consists of a double
deck girder with the dual carriageway road traffic running on the upper deck and
the dual track railway traffic running on the lower deck. The pylons have a height of
272m above sea level and are V-shaped in transverse direction. The main bridge
girders are made up of 20m long sections with a weight of 500 to 600t. The stand-
ard approach bridge girders are 200m long and their weight is estimated to ~
8,000t.
Caissons provide the foundation for the pylons and piers of the bridge. Caissons are
prefabricated placed 4m below the seabed. If necessary, soils are improved with
15m long bored concrete piles. The caissons in their final positions end 4m above
sea level. Prefabricated pier shafts are placed on top of the approach bridge cais-
sons. The pylons are cast in situ on top of the pylon caissons. Protection Works are
prefabricated and installed around the pylons and around two piers on both sides of
the pylons. These works protrudes above the water surface. The main bridge is
connected to the coasts by two approach bridges. The southern approach bridge is
5,748m long and consists of 29 spans and 28 piers. The northern approach bridge
is 9,412m long and has 47 spans and 46 piers.
E1TR0059 Vol I 29 FEHY
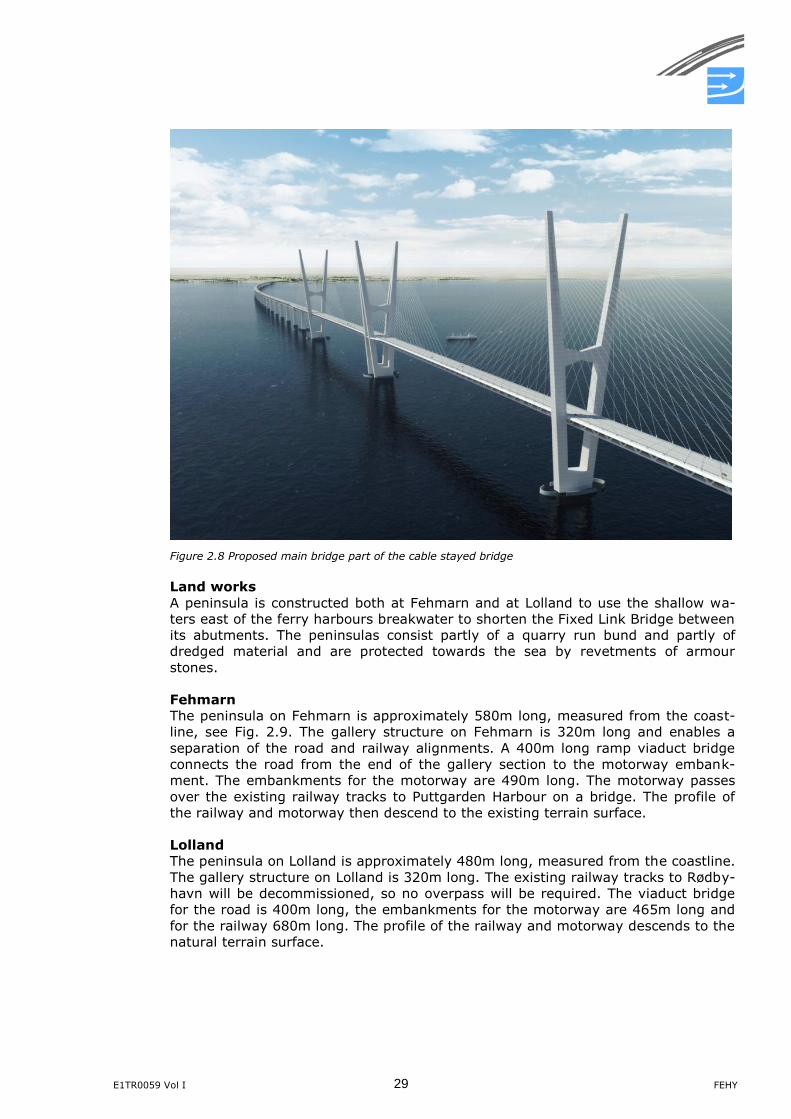
Figure 2.8 Proposed main bridge part of the cable stayed bridge
Land works
A peninsula is constructed both at Fehmarn and at Lolland to use the shallow wa-
ters east of the ferry harbours breakwater to shorten the Fixed Link Bridge between
its abutments. The peninsulas consist partly of a quarry run bund and partly of
dredged material and are protected towards the sea by revetments of armour
stones.
Fehmarn
The peninsula on Fehmarn is approximately 580m long, measured from the coast-
line, see Fig. 2.9. The gallery structure on Fehmarn is 320m long and enables a
separation of the road and railway alignments. A 400m long ramp viaduct bridge
connects the road from the end of the gallery section to the motorway embank-
ment. The embankments for the motorway are 490m long. The motorway passes
over the existing railway tracks to Puttgarden Harbour on a bridge. The profile of
the railway and motorway then descend to the existing terrain surface.
Lolland
The peninsula on Lolland is approximately 480m long, measured from the coastline.
The gallery structure on Lolland is 320m long. The existing railway tracks to Rødby-
havn will be decommissioned, so no overpass will be required. The viaduct bridge
for the road is 400m long, the embankments for the motorway are 465m long and
for the railway 680m long. The profile of the railway and motorway descends to the
natural terrain surface.
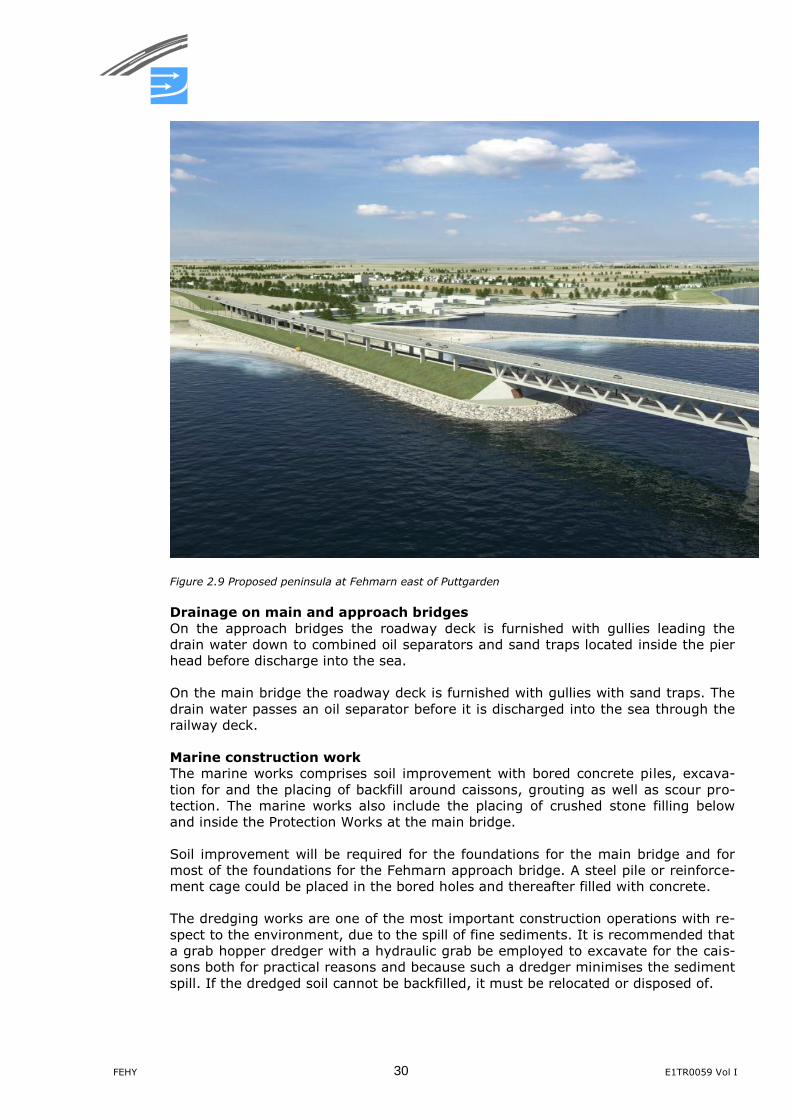
FEHY 30 E1TR0059 Vol I
Figure 2.9 Proposed peninsula at Fehmarn east of Puttgarden
Drainage on main and approach bridges
On the approach bridges the roadway deck is furnished with gullies leading the
drain water down to combined oil separators and sand traps located inside the pier
head before discharge into the sea.
On the main bridge the roadway deck is furnished with gullies with sand traps. The
drain water passes an oil separator before it is discharged into the sea through the
railway deck.
Marine construction work
The marine works comprises soil improvement with bored concrete piles, excava-
tion for and the placing of backfill around caissons, grouting as well as scour pro-
tection. The marine works also include the placing of crushed stone filling below
and inside the Protection Works at the main bridge.
Soil improvement will be required for the foundations for the main bridge and for
most of the foundations for the Fehmarn approach bridge. A steel pile or reinforce-
ment cage could be placed in the bored holes and thereafter filled with concrete.
The dredging works are one of the most important construction operations with re-
spect to the environment, due to the spill of fine sediments. It is recommended that
a grab hopper dredger with a hydraulic grab be employed to excavate for the cais-
sons both for practical reasons and because such a dredger minimises the sediment
spill. If the dredged soil cannot be backfilled, it must be relocated or disposed of.
E1TR0059 Vol I 31 FEHY
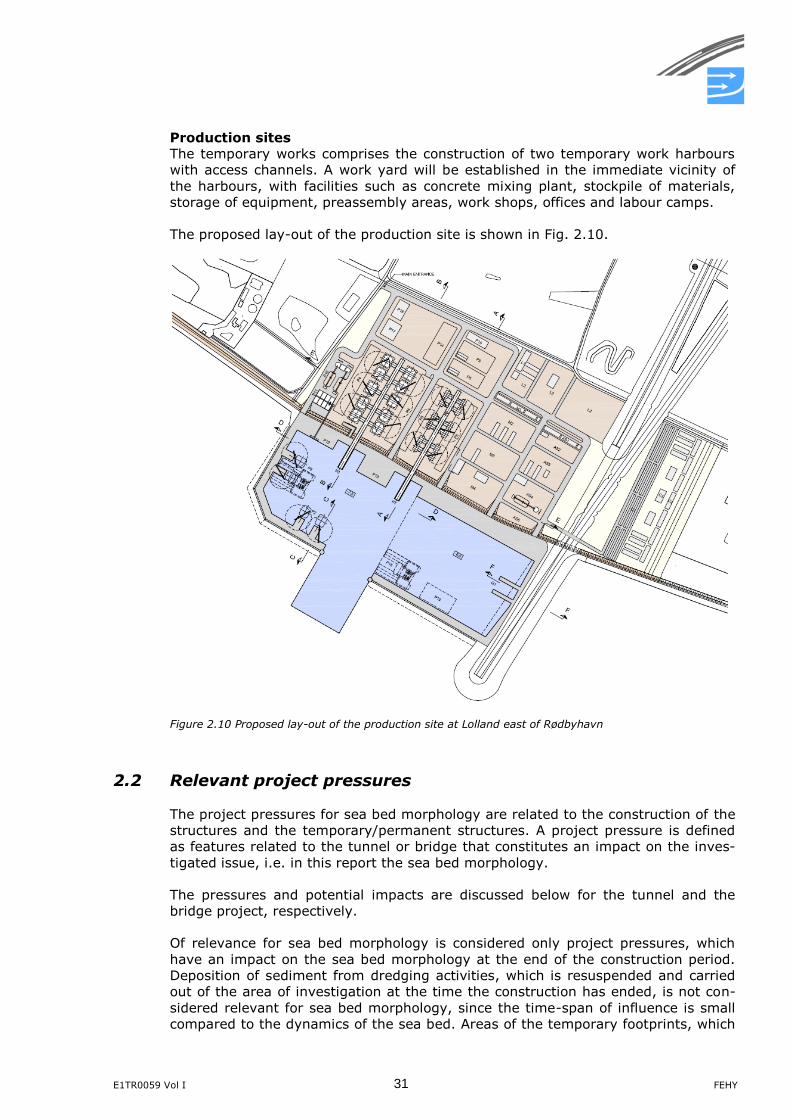
Production sites
The temporary works comprises the construction of two temporary work harbours
with access channels. A work yard will be established in the immediate vicinity of
the harbours, with facilities such as concrete mixing plant, stockpile of materials,
storage of equipment, preassembly areas, work shops, offices and labour camps.
The proposed lay-out of the production site is shown in Fig. 2.10.
Figure 2.10 Proposed lay-out of the production site at Lolland east of Rødbyhavn
2.2 Relevant project pressures
The project pressures for sea bed morphology are related to the construction of the
structures and the temporary/permanent structures. A project pressure is defined
as features related to the tunnel or bridge that constitutes an impact on the inves-
tigated issue, i.e. in this report the sea bed morphology.
The pressures and potential impacts are discussed below for the tunnel and the
bridge project, respectively.
Of relevance for sea bed morphology is considered only project pressures, which
have an impact on the sea bed morphology at the end of the construction period.
Deposition of sediment from dredging activities, which is resuspended and carried
out of the area of investigation at the time the construction has ended, is not con-
sidered relevant for sea bed morphology, since the time-span of influence is small
compared to the dynamics of the sea bed. Areas of the temporary footprints, which
FEHY 32 E1TR0059 Vol I
will be integrated into the permanent structures at the end of the construction peri-
od, are also not assessed separately during the construction period.
2.2.1 Project pressures for the main tunnel alternative
The pressures from the immersed tunnel E-ME/August 2011 are partly related to
the actual removal/disturbance of the natural sea bed and partly to the sediment
deposition caused by the dredging operations for structures, the tunnel trench and
the work harbours. The pressures and the associated potential impacts are summa-
rised in Table 2.1.
The impacts caused by the structures are related to the occupancy of sea bed area
by the structures (pressure 2-3) and/or to the disturbance of the sea bed caused by
dredging for the structures (pressure 1 and 4). The actual sizes of the disturbed ar-
eas are indicators for the magnitude of the pressure they impose on the sea bed.
The depositions of sediment spill in the areas of sea bed forms can reduce the
heights of the bed forms or add to the volumes of such bed forms. The deposition
depths are a measure for the impact on the bed forms.
Deposition of sea bed material from dredging activities is assessed to have no im-
pact on the sea bed morphology outside areas with prominent bed forms. Results
from the spill simulations in (FEHY 2013d), show that most of the fine sediments
are resuspended from the sea bed in the Fehmarnbelt before the end of construc-
tion and carried to areas with a calmer hydrographic environment where deposition
is possible. The added volume of loose sea bed material from the dredging activities
is too small for prominent bed forms to generate from this material. Sea bed mate-
rial from the dredging operations will therefore increase the natural sediment
transport in these areas (until it is eventually washed away from the area and dis-
tributed over a large area with time); a change in the state of the sea bed mor-
phology of these areas is not expected due to this and to temporarily slight change
in sediment composition and sediment transport. In the areas with prominent bed
forms, the sea bed is more dynamic and some influence of the deposited sea bed
material cannot be excluded prior to assessment.
Only insignificant changes to the current field from the tunnel solution are expected
(FEHY 2013e). The minor changes that may occur are mainly near the reclamations
and scour protection around these on the coast and will not affect the sea bed mor-
phology.
E1TR0059 Vol I 33 FEHY
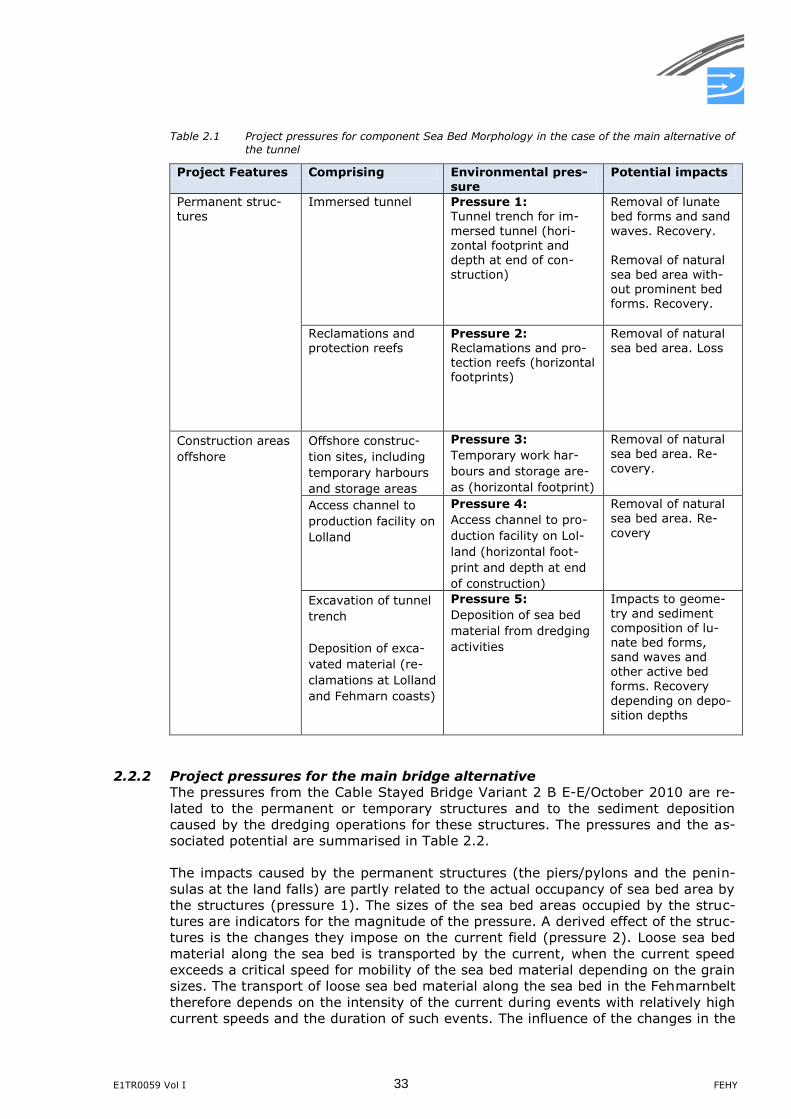
Table 2.1 Project pressures for component Sea Bed Morphology in the case of the main alternative of
the tunnel
Project Features Comprising Environmental pres-sure
Potential impacts
Permanent struc-tures
Immersed tunnel
Pressure 1: Tunnel trench for im-
mersed tunnel (hori-zontal footprint and depth at end of con-struction)
Removal of lunate bed forms and sand
waves. Recovery. Removal of natural sea bed area with-out prominent bed forms. Recovery.
Reclamations and protection reefs
Pressure 2: Reclamations and pro-tection reefs (horizontal footprints)
Removal of natural sea bed area. Loss
Construction areas
offshore
Offshore construc-
tion sites, including
temporary harbours
and storage areas
Pressure 3:
Temporary work har-
bours and storage are-
as (horizontal footprint)
Removal of natural sea bed area. Re-covery.
Access channel to
production facility on
Lolland
Pressure 4:
Access channel to pro-
duction facility on Lol-
land (horizontal foot-
print and depth at end
of construction)
Removal of natural sea bed area. Re-
covery
Excavation of tunnel
trench
Deposition of exca-
vated material (re-
clamations at Lolland
and Fehmarn coasts)
Pressure 5:
Deposition of sea bed
material from dredging
activities
Impacts to geome-try and sediment composition of lu-nate bed forms, sand waves and other active bed forms. Recovery
depending on depo-sition depths
2.2.2 Project pressures for the main bridge alternative
The pressures from the Cable Stayed Bridge Variant 2 B E-E/October 2010 are re-
lated to the permanent or temporary structures and to the sediment deposition
caused by the dredging operations for these structures. The pressures and the as-
sociated potential are summarised in Table 2.2.
The impacts caused by the permanent structures (the piers/pylons and the penin-
sulas at the land falls) are partly related to the actual occupancy of sea bed area by
the structures (pressure 1). The sizes of the sea bed areas occupied by the struc-
tures are indicators for the magnitude of the pressure. A derived effect of the struc-
tures is the changes they impose on the current field (pressure 2). Loose sea bed
material along the sea bed is transported by the current, when the current speed
exceeds a critical speed for mobility of the sea bed material depending on the grain
sizes. The transport of loose sea bed material along the sea bed in the Fehmarnbelt
therefore depends on the intensity of the current during events with relatively high
current speeds and the duration of such events. The influence of the changes in the
FEHY 34 E1TR0059 Vol I
current is assessed by the changes in the near-bed current speeds, as these deter-
mine the mobility of sea bed material, which determine the sea bed morphology.
The depositions of sediment spill (pressure 3) in the areas of sea bed forms can re-
duce the heights of the bed forms or add to the volumes of such bed forms. The
deposition depths are a measure for the impact on the bed forms. Outside areas
with bed forms, the thicknesses of deposited sediment due to spill are so small that
changes to sea bed morphology can be excluded, see discussion above.
The impacts caused by the temporary structures (the work harbours and storage
areas, pressure 4) are the disturbance of the natural sea bed. As in the case of
pressure 1, the actual size of the disturbed sea bed area is an indicator for the
magnitude of the pressure.
Deposition of sea bed material from dredging activities is assessed to have no im-
pact on the sea bed morphology outside areas with prominent bed forms, refer to
discussion above.
E1TR0059 Vol I 35 FEHY
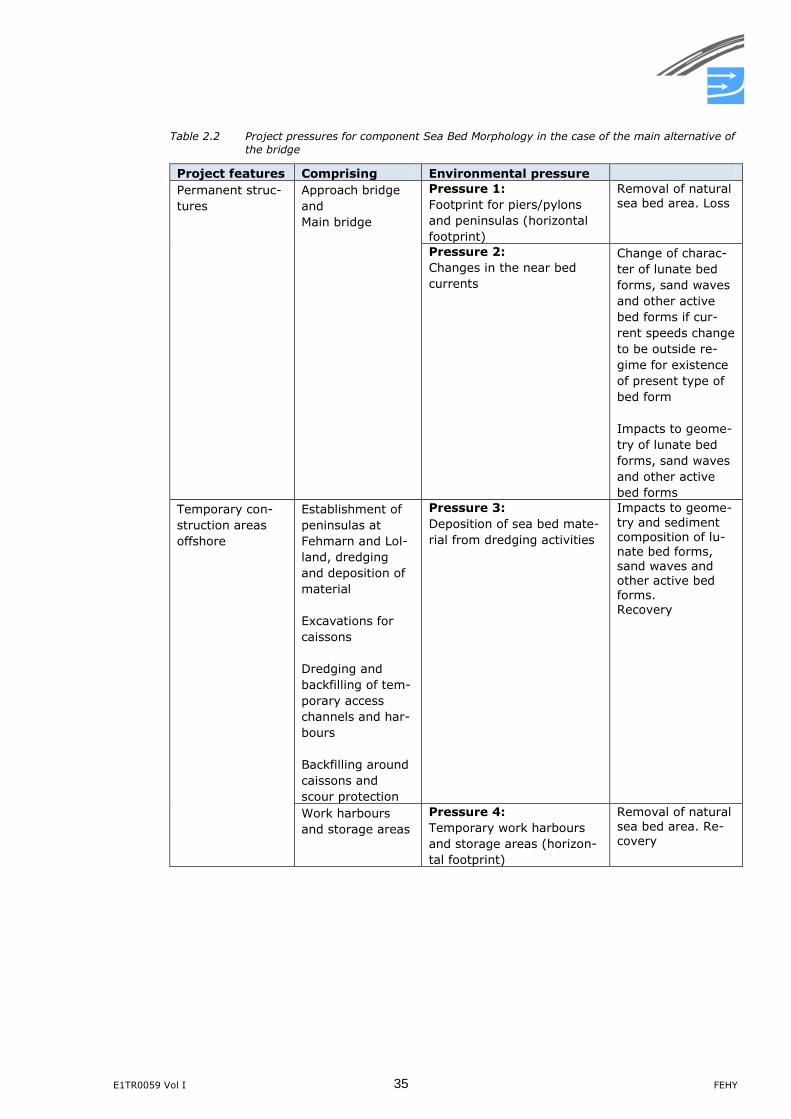
Table 2.2 Project pressures for component Sea Bed Morphology in the case of the main alternative of
the bridge
Project features Comprising Environmental pressure
Permanent struc-
tures
Approach bridge
and
Main bridge
Pressure 1:
Footprint for piers/pylons
and peninsulas (horizontal
footprint)
Removal of natural sea bed area. Loss
Pressure 2:
Changes in the near bed
currents
Change of charac-
ter of lunate bed
forms, sand waves
and other active
bed forms if cur-
rent speeds change
to be outside re-
gime for existence
of present type of
bed form
Impacts to geome-
try of lunate bed
forms, sand waves
and other active
bed forms
Temporary con-
struction areas
offshore
Establishment of
peninsulas at
Fehmarn and Lol-
land, dredging
and deposition of
material
Excavations for
caissons
Dredging and
backfilling of tem-
porary access
channels and har-
bours
Backfilling around
caissons and
scour protection
Pressure 3:
Deposition of sea bed mate-
rial from dredging activities
Impacts to geome-
try and sediment composition of lu-
nate bed forms, sand waves and other active bed forms. Recovery
Work harbours
and storage areas
Pressure 4:
Temporary work harbours
and storage areas (horizon-
tal footprint)
Removal of natural sea bed area. Re-covery
FEHY 36 E1TR0059 Vol I
3 DATA AND METHODS
3.1 Area of investigation
3.1.1 Bathymetry
The investigated area in the baseline study and the impact assessment cover the
area in the Fehmarnbelt shown in Figure 1.1.
The bathymetry of the Fehmarnbelt is also shown in Figure 3.1. Since the final re-
treat of glaciers from the South-Western Baltic area, the Fehmarnbelt has been
characterised by highly variable sedimentary processes and environments (Novak
and Björck 2002).
The Fehmarnbelt is part of a shallow transition area between the North Sea and the
Baltic Sea, connecting the southern part of the Great Belt and the Kiel Bight to the
west with the Mecklenburg Bight in the east.
3.1.2 Surface sediments
Figure 3.2 shows a substrate map of the Fehmarnbelt. According to this it is seen
that the surface sediments on the sea bed on the Danish side (>-15 m) consist of
sand and coarser sediments. The bed on the German side (>-15 m) also mainly
consists of sand in the area west of Puttgarden and mainly of coarser sediment
south-east of Puttgarden. In general, the sediment is finer on the German side than
on the Danish side. At depths below -20 m the bed consists of sandy mud or thin
sandy mud.
The current is the dominant mechanism in transporting material along the sea bed
in the deeper part of the Fehmarnbelt. Waves act to increase the mobility of sedi-
ment in shallower areas and very near the coast also to drive a coastal current.
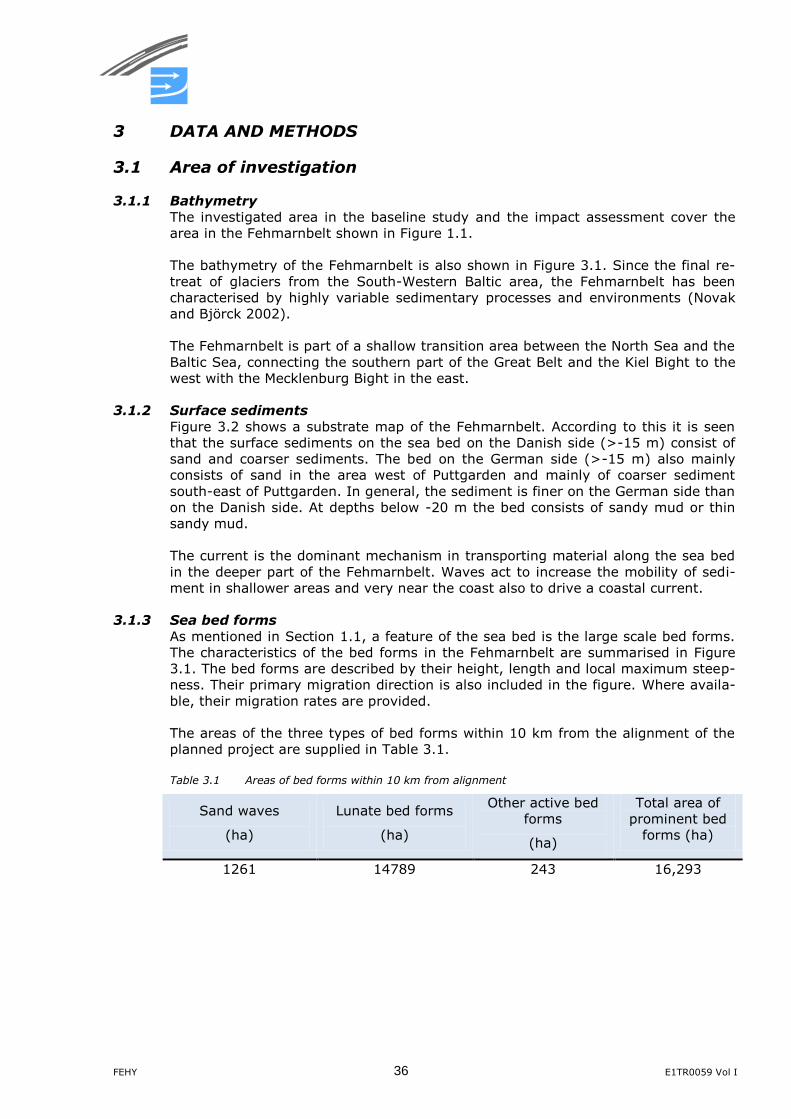
3.1.3 Sea bed forms
As mentioned in Section 1.1, a feature of the sea bed is the large scale bed forms.
The characteristics of the bed forms in the Fehmarnbelt are summarised in Figure
3.1. The bed forms are described by their height, length and local maximum steep-
ness. Their primary migration direction is also included in the figure. Where availa-
ble, their migration rates are provided.
The areas of the three types of bed forms within 10 km from the alignment of the
planned project are supplied in Table 3.1.
Table 3.1 Areas of bed forms within 10 km from alignment
Sand waves
(ha)
Lunate bed forms
(ha)
Other active bed
forms
(ha)
Total area of
prominent bed
forms (ha)
1261 14789 243 16,293
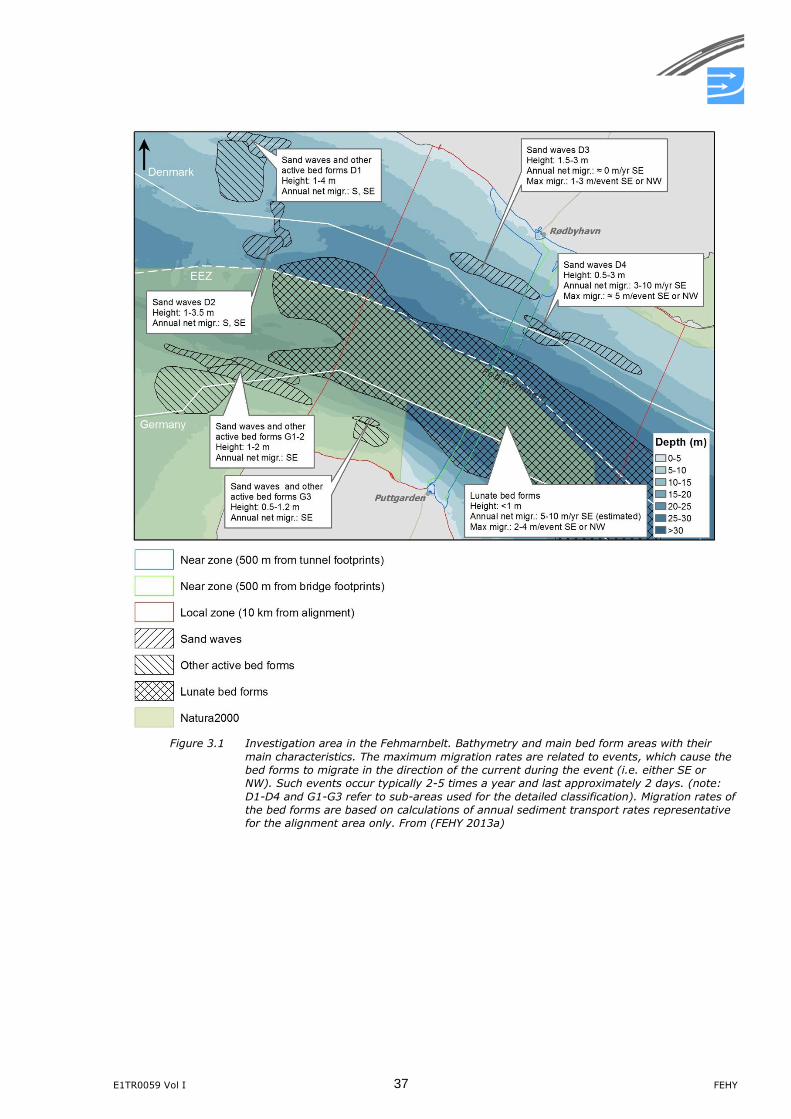
E1TR0059 Vol I 37 FEHY
Figure 3.1 Investigation area in the Fehmarnbelt. Bathymetry and main bed form areas with their
main characteristics. The maximum migration rates are related to events, which cause the
bed forms to migrate in the direction of the current during the event (i.e. either SE or
NW). Such events occur typically 2-5 times a year and last approximately 2 days. (note:
D1-D4 and G1-G3 refer to sub-areas used for the detailed classification). Migration rates of
the bed forms are based on calculations of annual sediment transport rates representative
for the alignment area only. From (FEHY 2013a)
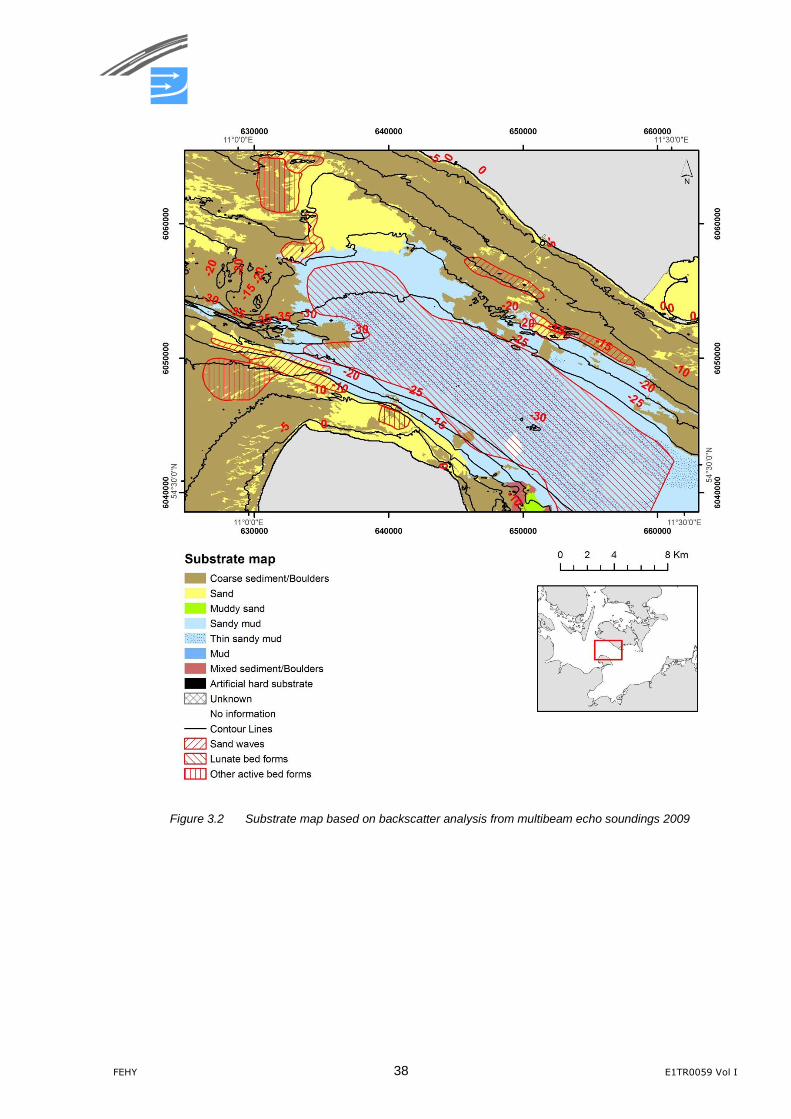
FEHY 38 E1TR0059 Vol I
Figure 3.2 Substrate map based on backscatter analysis from multibeam echo soundings 2009
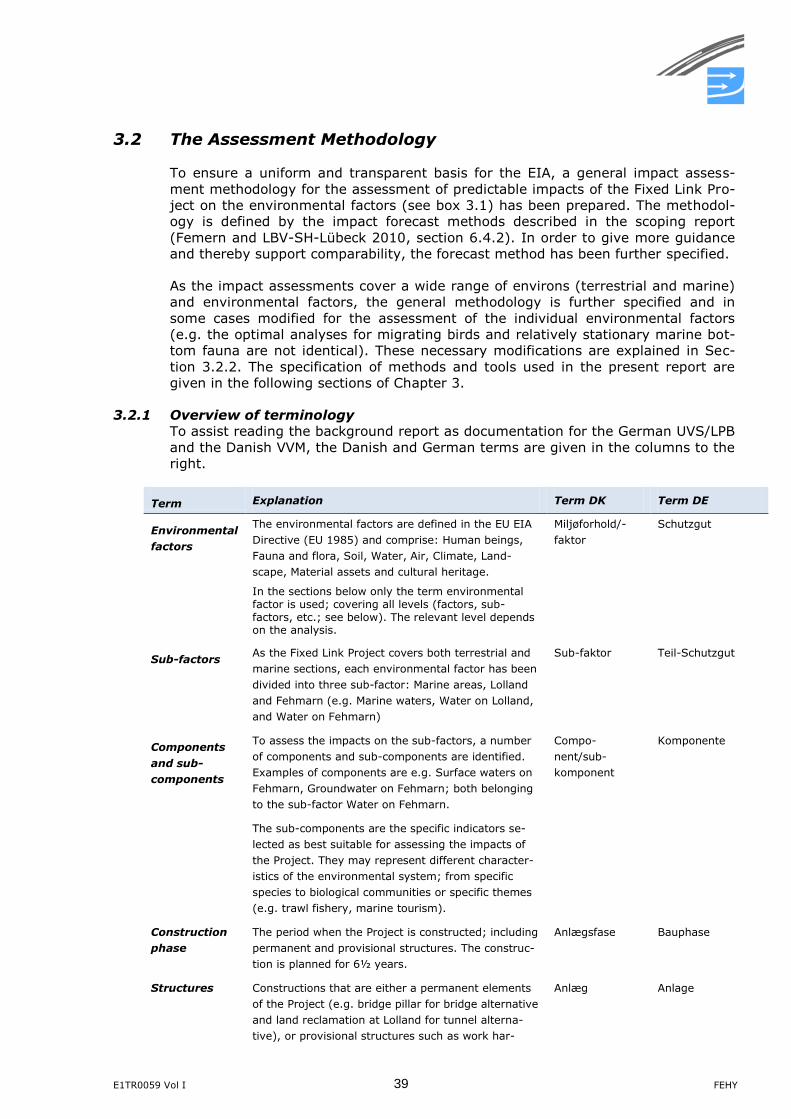
E1TR0059 Vol I 39 FEHY
3.2 The Assessment Methodology
To ensure a uniform and transparent basis for the EIA, a general impact assess-
ment methodology for the assessment of predictable impacts of the Fixed Link Pro-
ject on the environmental factors (see box 3.1) has been prepared. The methodol-
ogy is defined by the impact forecast methods described in the scoping report
(Femern and LBV-SH-Lübeck 2010, section 6.4.2). In order to give more guidance
and thereby support comparability, the forecast method has been further specified.
As the impact assessments cover a wide range of environs (terrestrial and marine)
and environmental factors, the general methodology is further specified and in
some cases modified for the assessment of the individual environmental factors
(e.g. the optimal analyses for migrating birds and relatively stationary marine bot-
tom fauna are not identical). These necessary modifications are explained in Sec-
tion 3.2.2. The specification of methods and tools used in the present report are
given in the following sections of Chapter 3.
3.2.1 Overview of terminology
To assist reading the background report as documentation for the German UVS/LPB
and the Danish VVM, the Danish and German terms are given in the columns to the
right.
Term Explanation Term DK Term DE
Environmental
factors
The environmental factors are defined in the EU EIA
Directive (EU 1985) and comprise: Human beings,
Fauna and flora, Soil, Water, Air, Climate, Land-
scape, Material assets and cultural heritage.
In the sections below only the term environmental factor is used; covering all levels (factors, sub-factors, etc.; see below). The relevant level depends on the analysis.
Miljøforhold/-
faktor
Schutzgut
Sub-factors As the Fixed Link Project covers both terrestrial and
marine sections, each environmental factor has been
divided into three sub-factor: Marine areas, Lolland
and Fehmarn (e.g. Marine waters, Water on Lolland,
and Water on Fehmarn)
Sub-faktor Teil-Schutzgut
Components
and sub-
components
To assess the impacts on the sub-factors, a number
of components and sub-components are identified.
Examples of components are e.g. Surface waters on
Fehmarn, Groundwater on Fehmarn; both belonging
to the sub-factor Water on Fehmarn.
The sub-components are the specific indicators se-
lected as best suitable for assessing the impacts of
the Project. They may represent different character-
istics of the environmental system; from specific
species to biological communities or specific themes
(e.g. trawl fishery, marine tourism).
Compo-
nent/sub-
komponent
Komponente
Construction
phase
The period when the Project is constructed; including
permanent and provisional structures. The construc-
tion is planned for 6½ years.
Anlægsfase Bauphase
Structures Constructions that are either a permanent elements
of the Project (e.g. bridge pillar for bridge alternative
and land reclamation at Lolland for tunnel alterna-
tive), or provisional structures such as work har-
Anlæg Anlage
FEHY 40 E1TR0059 Vol I
Term Explanation Term DK Term DE
bours and the tunnel trench.
Operation
phase
The period from end of construction phase until de-
commissioning.
Driftsfase Betriebsphase
Permanent Pressure and impacts lasting for the life time of the
Project (until decommissioning).
Permanent Permanent
Provisional
(temporary)
Pressure and impacts predicted to be recovered
within the life time of the project. The recovery time
is assessed as precise as possible and is in addition
related to Project phases.
Midlertidig Temporär
Pressures
A pressure is understood as all influences deriving from the Fixed Link Project; both influences deriving from Project activities and influences originating
from interactions between the environmental factors. The type of the pressure describes its relation to construction, structures or operation.
Belastning Wirkfaktoren
Magnitude of
pressure
The magnitude of pressure is described by the inten-sity, duration and range of the pressure. Different methods may be used to arrive at the magnitude; dependent on the type of pressure and the environ-mental factor to be assessed.
Belastnings-størrelse
Wirkintensität
Footprint The footprint of the Project comprises the areas oc-
cupied by structures. It comprises two types of foot-
print; the permanent footprint deriving from perma-
nent confiscation of areas to structures, land
reclamation etc., and provisional footprint which are
areas recovered after decommissioning of provisional
structures. The recovery may be due to natural pro-
cesses or Project aided re-establishment of the area.
Arealinddragelse Flächeninan-
spruchnahme
Assessment
criteria and
Grading
Assessment criteria are applied to grade the compo-nents of the assessment schemes.
Grading is done according to a four grade scale: very high, high, medium, minor or a two grade scale: special, general. In some cases grading is not doa-ble. Grading of magnitude of pressure and sensitivity is method dependent. Grading of importance and impairment is as far as possible done for all factors.
Vurderings-kriterier og graduering
Bewertungs-
kriterien und Ein-
stufung
Importance The importance is defined as the functional values to the natural environment and the landscape.
Betydning Bedeutung
Sensitivity The sensitivity describes the environmental factors capability to resist a pressure. Dependent on the subject assessed, the description of the sensitivity may involve intolerance, recovery and importance.
Følsomhed/ Sårbarhed
Empfindlichkeit
Impacts The impacts of the Project are the effects on the en-
vironmental factors. Impacts are divided into Loss
and Impairment.
Virkninger Auswirkung
Loss Loss of environmental factors is caused by perma-
nent and provisional loss of area due to the footprint
of the Project; meaning that loss may be permanent
or provisional. The degree of loss is described by the
intensity, the duration and if feasible, the range.
Tab af areal Flächenverlust
Severity of
loss
Severity of loss expresses the consequences of occu-pation of land (seabed). It is analysed by combining magnitude of the Project’s footprint with importance of the environmental factor lost due to the footprint.
Omfang af tab Schwere der Aus-wirkungen bei Flä-chenverlust
E1TR0059 Vol I 41 FEHY
Term Explanation Term DK Term DE
Impairment An impairment is a change in the function of an envi-
ronmental factor.
Forringelse Funktionsbe-
einträchtigung
Degree of im-
pairment
The degree of impairments is assessed by combining magnitude of pressure and sensitivity. Different methods may be used to arrive at the degree. The
degree of impairment is described by the intensity, the duration and if feasible, the range.
Omfang/grad af forringelser
Schwere der Funk-tionsbe-einträchtigung
Severity of
impairment
Severity of impairment expresses the consequences of the Project taking the importance of the environ-mental factor into consideration; i.e. by combining the degree impairment with importance. Virkningens
væsentlighed
Erheblichkeit
Significance The significance is the concluding evaluation of the
impacts from the Project on the environmental fac-tors and the ecosystem. It is an expert judgment based on the results of all analyses.
It should be noted that in the sections below only the term environmental factor is
used; covering all levels of the receptors of the pressures of the Project (factors,
sub-factors, component, sub-components). The relevant level depends on the anal-
ysis and will be explained in the following methodology sections (section 3.2.3 and
onwards).
3.2.2 The Impact Assessment Scheme
The overall goal of the assessment is to arrive at the severity of impact where im-
pact is divided into two parts; loss and impairment (see explanation above). As
stated in the scoping report, the path to arrive at the severity is different for loss
and impairments. For assessment of the severity of loss the footprint of the project
(the areas occupied) and the importance of the environmental factors are taken in-
to consideration. On the other hand, the assessment of severity of impairment
comprises two steps; first the degree of impairment considering the magnitude of
pressure and the sensitivity. Subsequently the severity is assessed by combining
the degree of impairment and the importance of the environmental factor. The as-
sessment schemes are shown in Figure 3.3 - Figure 3.5. More details on the con-
cepts and steps of the schemes are given below. As mentioned above, modification
are required for some environmental factors and the exact assessment process and
the tools applied vary dependent on both the type of pressure and the environmen-
tal factor analysed. As far as possible the impacts are assessed quantitatively; ac-
companied by a qualitative argumentation.
3.2.3 Assessment Tools
For the impact assessment the assessment matrices described in the scoping report
have been key tools. Two sets of matrices are defined; one for the assessment of
loss and one for assessment of impairment.
The matrices applied for assessments of severity of loss and degree of impairment
are given in the scoping report (Table 6.4 and Table 6.5) and are shown below in
Table 3.2 and Table 3.3, respectively.
FEHY 42 E1TR0059 Vol I
Table 3.2 The matrix used for assessment of the severity of loss. The magnitude of pressure = the
footprint of the Project is always considered to be very high.
Magnitude of the predicted pressure (footprint)
Importance of the environmental factors
Very high High Medium Minor
Very High Very High High Medium Minor
The approach and thus the tools applied for assessment of the degree of impair-
ment varies with the environmental factor and the pressure. For each assessment
the most optimal state-of-the-art tools have been applied, involving e.g. determin-
istic and statistical models as well as GIS based analyses. In cases where direct
analysis of causal-relationship is not feasible, the matrix based approach has been
applied using one of the matrices in Table 3.3 (Table 6.5 of the scoping report)
combining the grades of magnitude of pressure and grades of sensitivity. This
method gives a direct grading of the degree of impairment. Using other tools to ar-
rive at the degree of impairment, the results are subsequently graded using the
impairment criteria. The specific tools applied are described in the following sec-
tions of Chapter 3.
Table 3.3 The matrices used for the matrix based assessment of the degree of impairment with two
and four grade scaling, respectively
Magnitude of the predicted pressure
Sensitivity of the environmental factors
Very high High Medium Minor
Very high General loss of function, must be substantiated for specific instances
High Very High High High Medium
Medium High High Medium Low
Low Medium Medium Low Low
Magnitude of the predicted pressure
Sensitivity of the environmental factors
Special General
Very high General loss of function, must be substantiated for specific instances
High Very High High
Medium High Medium
Low Medium Low
To reach severity of impairment one additional matrix has been prepared, as this
was not included in the scoping report. This matrix is shown in Table 3.4.
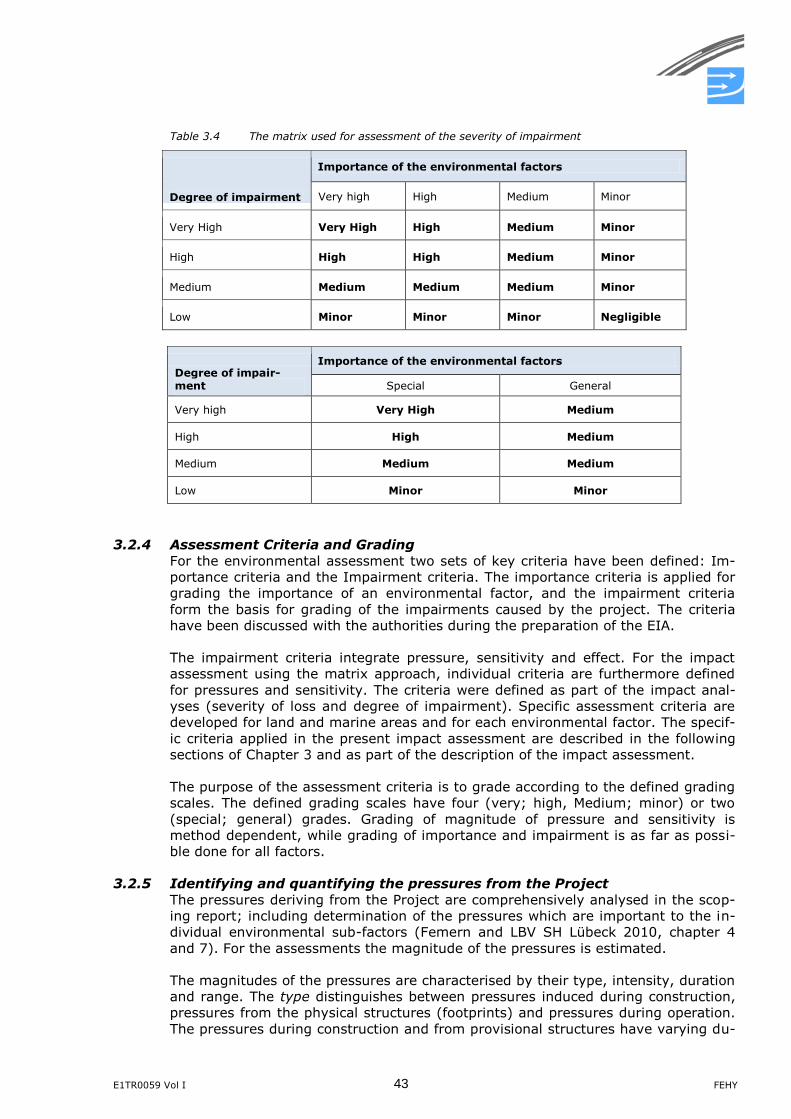
E1TR0059 Vol I 43 FEHY
Table 3.4 The matrix used for assessment of the severity of impairment
Degree of impairment
Importance of the environmental factors
Very high High Medium Minor
Very High Very High High Medium Minor
High High High Medium Minor
Medium Medium Medium Medium Minor
Low Minor Minor Minor Negligible
Degree of impair-ment
Importance of the environmental factors
Special General
Very high Very High Medium
High High Medium
Medium Medium Medium
Low Minor Minor
3.2.4 Assessment Criteria and Grading
For the environmental assessment two sets of key criteria have been defined: Im-
portance criteria and the Impairment criteria. The importance criteria is applied for
grading the importance of an environmental factor, and the impairment criteria
form the basis for grading of the impairments caused by the project. The criteria
have been discussed with the authorities during the preparation of the EIA.
The impairment criteria integrate pressure, sensitivity and effect. For the impact
assessment using the matrix approach, individual criteria are furthermore defined
for pressures and sensitivity. The criteria were defined as part of the impact anal-
yses (severity of loss and degree of impairment). Specific assessment criteria are
developed for land and marine areas and for each environmental factor. The specif-
ic criteria applied in the present impact assessment are described in the following
sections of Chapter 3 and as part of the description of the impact assessment.
The purpose of the assessment criteria is to grade according to the defined grading
scales. The defined grading scales have four (very; high, Medium; minor) or two
(special; general) grades. Grading of magnitude of pressure and sensitivity is
method dependent, while grading of importance and impairment is as far as possi-
ble done for all factors.
3.2.5 Identifying and quantifying the pressures from the Project
The pressures deriving from the Project are comprehensively analysed in the scop-
ing report; including determination of the pressures which are important to the in-
dividual environmental sub-factors (Femern and LBV SH Lübeck 2010, chapter 4
and 7). For the assessments the magnitude of the pressures is estimated.
The magnitudes of the pressures are characterised by their type, intensity, duration
and range. The type distinguishes between pressures induced during construction,
pressures from the physical structures (footprints) and pressures during operation.
The pressures during construction and from provisional structures have varying du-
FEHY 44 E1TR0059 Vol I
ration while pressures from staying physical structure (e.g. bridge piers) and from
the operation phase are permanent. Distinctions are also made between direct and
indirect pressures where direct pressures are those imposed directly by the Project
activities on the environmental factors while the indirect pressures are the conse-
quences of those impacts on other environmental factors and thus express the in-
teractions between the environmental factors.
The intensity evaluates the force of the pressure and is as far as possible estimated
quantitatively. The duration determines the time span of the pressure. It is stated
as relevant for the given pressure and environmental factor. Some pressures (like
footprint) are permanent and do not have a finite duration. Some pressures occur
in events of different duration. The range of the pressure defines the spatial extent.
Outside of the range, the pressure is regarded as non-existing or negligible.
The magnitude of pressure is described by pressure indicators. The indicators are
based on the modes of action on the environmental factor in order to achieve most
optimal descriptions of pressure for the individual factors; e.g. mm deposited sedi-
ment within a certain period. As far as possible the magnitude is worked out quan-
titatively. The method of quantification depends on the pressure (spill from dredg-
ing, noise, vibration, etc.) and on the environmental factor to be assessed (calling
for different aggregations of intensity, duration and range).
3.2.6 Importance of the Environmental Factors
The importance of the environmental factor is assessed for each environmental
sub-factor. Some sub-factors are assessed as one unity, but in most cases the im-
portance assessment has been broken down into components and/or sub-
components to conduct a proper environmental impact assessment. Considerations
about standing stocks and spatial distribution are important for some sub-factors
such as birds and are in these cases incorporate in the assessment.
The assessment is based on importance criteria defined by the functional value of
the environmental sub-factor and the legal status given by EU directives, national
laws, etc. the criteria applied for the environmental sub-factor(s) treated in the
present report are given in a later section.
The importance criteria are grading the importance into two or four grades (see
section 3.2.4). The two grade scale is used when the four grade scale is not appli-
cable. In a few cases such as climate, grading does not make sense. As far as pos-
sible the spatial distribution of the importance classes is shown on maps.
3.2.7 Sensitivity
The optimal way to describe the sensitivity to a certain pressure varies between the
environmental factors. To assess the sensitivity more issues may be taken into con-
sideration such as the intolerance to the pressure and the capability to recover after
impairment or a provisional loss. When deterministic models are used to assess the
impairments, the sensitivity is an integrated functionality of the model.
3.2.8 Severity of loss
Severity of loss is assessed by combining information on magnitude of footprint, i.e.
the areas occupied by the Project with the importance of the environmental factor
(Figure 3.3. Loss of area is always considered to be a very high magnitude of pres-
sure and therefore the grading of the severity of loss is determined by the im-
portance (see Table 3.2).
The loss is estimated as hectares of lost area. As far as possible the spatial distribu-
tion of the importance classes is shown on maps.

E1TR0059 Vol I 45 FEHY
Figure 3.3 The assessment scheme for severity of loss
3.2.9 Degree of impairment
The degree of impairment is assessed based on the magnitude of pressure (involv-
ing intensity, duration and range) and the sensitivity of the given environmental
factor (Figure 3.4). In worst case, the impairment may be so intensive that the
function of the environmental factor is lost. It is then considered as loss like loss
due to structures, etc.
Figure 3.4 The assessment scheme for degree of impairment
As far as possible the degree is worked out quantitatively. As mentioned earlier the
method of quantification depends on the environmental factor and the pressure to
be assessed, and of the state-of-the-art tools available for the assessment.
No matter how the analyses of the impairment are conducted, the goal is to grade
the degree of impairment using one of the defined grading scales (two or four
grades). Deviations occur when it is not possible to grade the degree of impair-
ment. The spatial distribution of the different grades of the degree of impairment is
shown on maps.
3.2.10 Severity of Impairment
Severity of impairment is assessed from the grading’s of degree of impairment and
of importance of the environmental factor (Figure 3.5) using the matrix in Table
3.4.
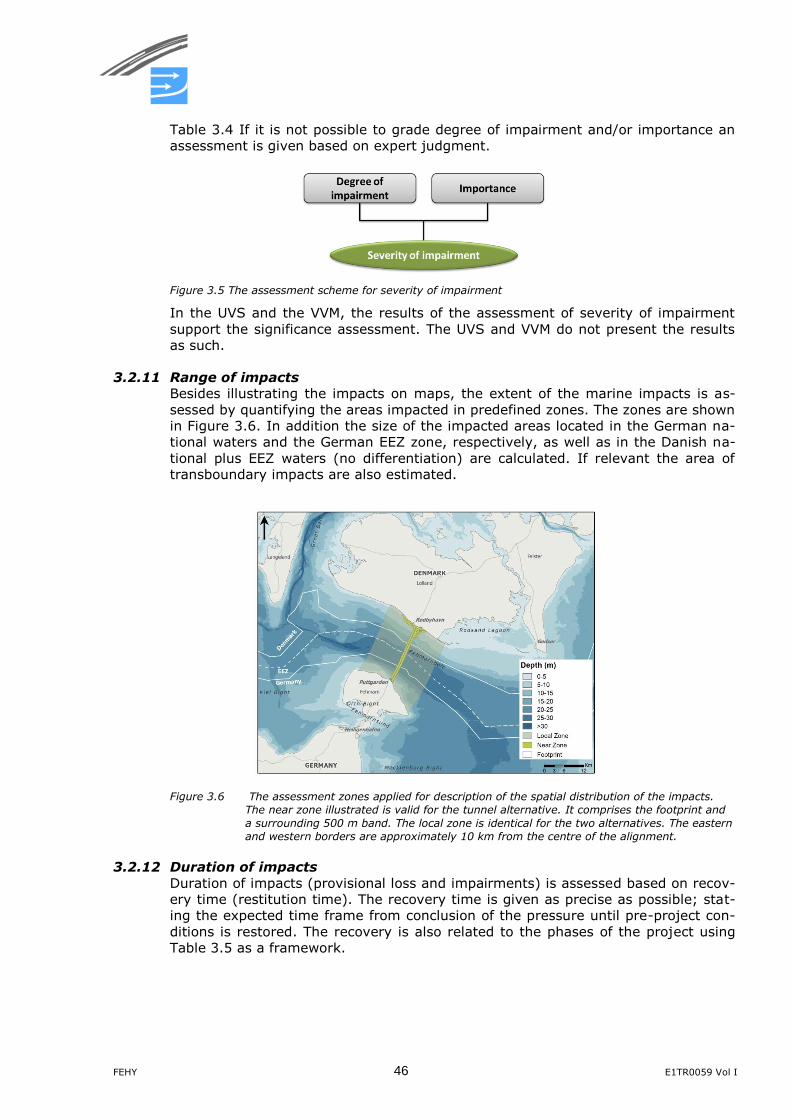
FEHY 46 E1TR0059 Vol I
Table 3.4 If it is not possible to grade degree of impairment and/or importance an
assessment is given based on expert judgment.
Figure 3.5 The assessment scheme for severity of impairment
In the UVS and the VVM, the results of the assessment of severity of impairment
support the significance assessment. The UVS and VVM do not present the results
as such.
3.2.11 Range of impacts
Besides illustrating the impacts on maps, the extent of the marine impacts is as-
sessed by quantifying the areas impacted in predefined zones. The zones are shown
in Figure 3.6. In addition the size of the impacted areas located in the German na-
tional waters and the German EEZ zone, respectively, as well as in the Danish na-
tional plus EEZ waters (no differentiation) are calculated. If relevant the area of
transboundary impacts are also estimated.
Figure 3.6 The assessment zones applied for description of the spatial distribution of the impacts.
The near zone illustrated is valid for the tunnel alternative. It comprises the footprint and
a surrounding 500 m band. The local zone is identical for the two alternatives. The eastern
and western borders are approximately 10 km from the centre of the alignment.
3.2.12 Duration of impacts
Duration of impacts (provisional loss and impairments) is assessed based on recov-
ery time (restitution time). The recovery time is given as precise as possible; stat-
ing the expected time frame from conclusion of the pressure until pre-project con-
ditions is restored. The recovery is also related to the phases of the project using
Table 3.5 as a framework.
E1TR0059 Vol I 47 FEHY
Table 3.5 Framework applied to relate recovery of environmental factors to the consecutive phases
of the Project
Impact recovered
within:
In wording
Construction
phase+
recovered within 2 year after end of construction
Operation phase A recovered within 10 years after end of construction
Operation phase B recovered within 24 years after end of construction
Operation phase C recovery takes longer or is permanent
It should be noted that in the background reports, the construction phase has been
indicated by exact years (very late 2014-2020 (tunnel) and early 2014-2020
(bridge). As the results are generic and not dependent on the periodization of the
construction phase, the years are in the VVM and the UVS indicated as calendar
year 0, year 1, etc. This means that the construction of the tunnel starts in Year 0
(only some initial activities) and the bridge construction commence in year 1.
3.2.13 Significance
The impact assessment is finalised with an overall assessment stating the signifi-
cance of the predicted impacts. This assessment of significance is based on expert
judgement. The reasoning for the conclusion on the significance is explained. As-
pects such as degree and severity of impairment/severity of loss, recovery time and
the importance of the environmental factor are taken into consideration.
3.2.14 Comparison of environmental impacts from project alternatives
Femern A/S will prepare a final recommendation of the project alternative, which
from a technical, financial and environmental point of view can meet the goal of a
Fehmarnbelt Fixed Link from Denmark to Germany. As an important input to the
background for this recommendation, the consortia have been requested to com-
pare the two alternatives, immersed tunnel and cable-stayed bridge, with the aim
to identify the alternative having the least environmental impacts on the environ-
ment. The bored tunnel alternative is discussed in a separate report. In order to
make the comparison as uniform as possible the ranking is done using a ranking
system comprising the ranks: 0 meaning that it is not possible to rank the alterna-
tives, + meaning that the alternative compared to the other alternative has a mi-
nor environmental advantage and ++ meaning that the alternative has a noticeable
advantage. The ranking is made for the environmental factor or sub-factor included
in the individual report (e.g. for the marine area: hydrography, benthic fauna,
birds, etc.). To support the overall assessment similar analyses are sometimes
made for individual pressures or components/subcomponents. It should be noticed
that the ranking addresses only the differences/similarities between the two alter-
natives and not the degree of impacts.
3.2.15 Cumulative impacts
The aim of the assessment of cumulative impacts is to evaluate the extent of the
environmental impact of the project in terms of intensity and geographic extent
compared with the other projects in the area and the vulnerability of the area. The
assessment of the cumulative conditions does not only take into account existing
conditions, but also land use and activities associated with existing utilized and un-
utilized permits or approved plans for projects in the pipe.
When more projects within the same region affect the same environmental condi-
tions at the same time, they are defined to have cumulative impacts. A project is
relevant to include, if the project meets one or more of the following requirements:
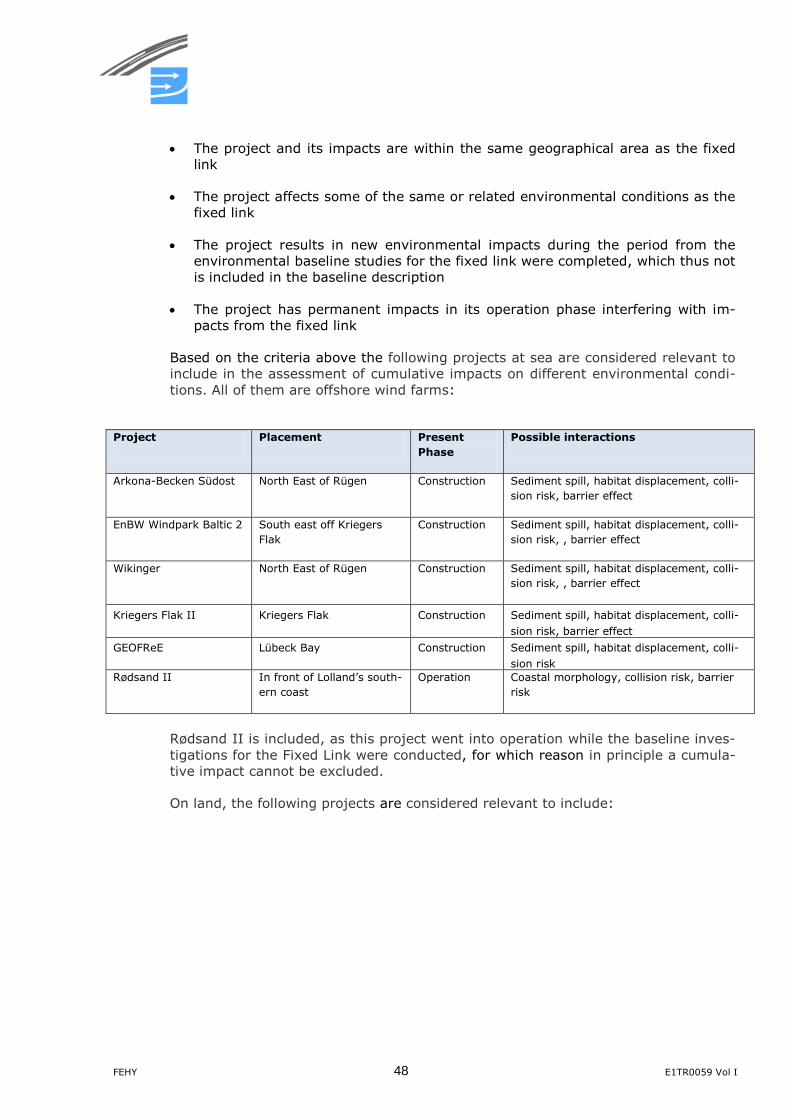
FEHY 48 E1TR0059 Vol I
The project and its impacts are within the same geographical area as the fixed
link
The project affects some of the same or related environmental conditions as the
fixed link
The project results in new environmental impacts during the period from the
environmental baseline studies for the fixed link were completed, which thus not
is included in the baseline description
The project has permanent impacts in its operation phase interfering with im-
pacts from the fixed link
Based on the criteria above the following projects at sea are considered relevant to
include in the assessment of cumulative impacts on different environmental condi-
tions. All of them are offshore wind farms:
Project Placement Present
Phase
Possible interactions
Arkona-Becken Südost North East of Rügen Construction Sediment spill, habitat displacement, colli-
sion risk, barrier effect
EnBW Windpark Baltic 2 South east off Kriegers
Flak
Construction Sediment spill, habitat displacement, colli-
sion risk, , barrier effect
Wikinger North East of Rügen Construction Sediment spill, habitat displacement, colli-
sion risk, , barrier effect
Kriegers Flak II Kriegers Flak Construction Sediment spill, habitat displacement, colli-
sion risk, barrier effect
GEOFReE Lübeck Bay Construction Sediment spill, habitat displacement, colli-
sion risk
Rødsand II In front of Lolland’s south-
ern coast
Operation Coastal morphology, collision risk, barrier
risk
Rødsand II is included, as this project went into operation while the baseline inves-
tigations for the Fixed Link were conducted, for which reason in principle a cumula-
tive impact cannot be excluded.
On land, the following projects are considered relevant to include:
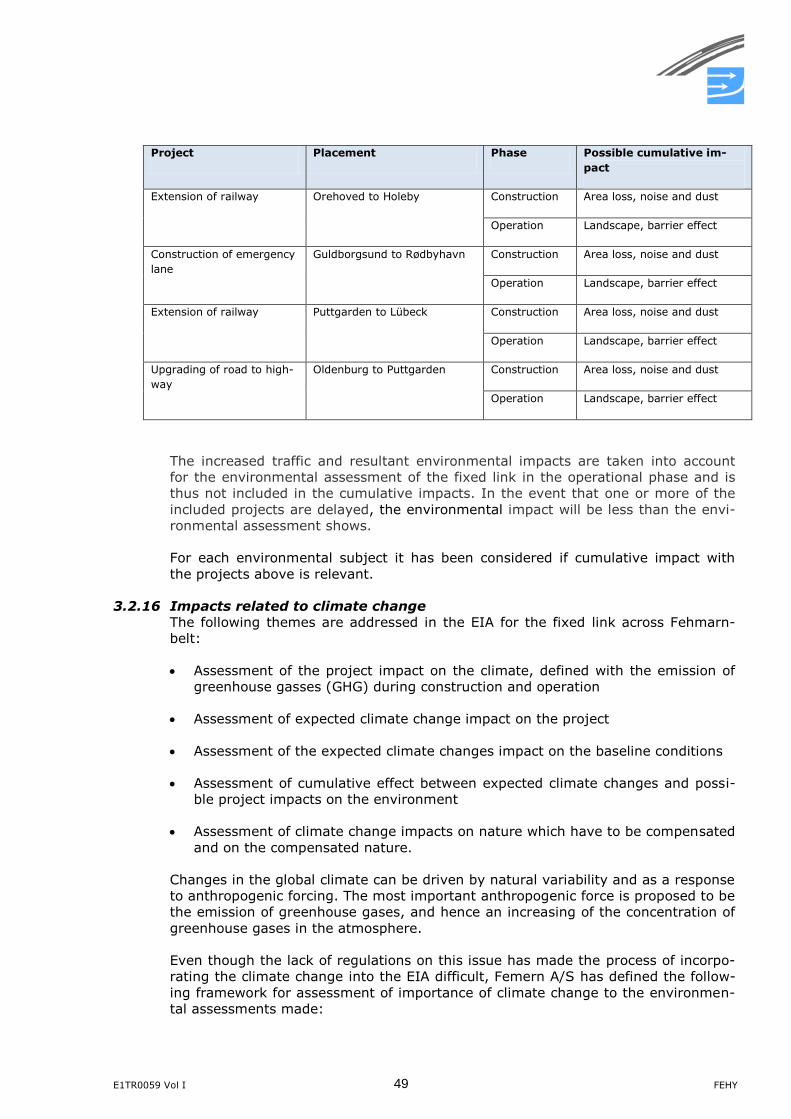
E1TR0059 Vol I 49 FEHY
Project Placement Phase Possible cumulative im-
pact
Extension of railway Orehoved to Holeby Construction Area loss, noise and dust
Operation Landscape, barrier effect
Construction of emergency
lane
Guldborgsund to Rødbyhavn Construction Area loss, noise and dust
Operation Landscape, barrier effect
Extension of railway Puttgarden to Lübeck Construction Area loss, noise and dust
Operation Landscape, barrier effect
Upgrading of road to high-
way
Oldenburg to Puttgarden Construction Area loss, noise and dust
Operation Landscape, barrier effect
The increased traffic and resultant environmental impacts are taken into account
for the environmental assessment of the fixed link in the operational phase and is
thus not included in the cumulative impacts. In the event that one or more of the
included projects are delayed, the environmental impact will be less than the envi-
ronmental assessment shows.
For each environmental subject it has been considered if cumulative impact with
the projects above is relevant.
3.2.16 Impacts related to climate change
The following themes are addressed in the EIA for the fixed link across Fehmarn-
belt:
Assessment of the project impact on the climate, defined with the emission of
greenhouse gasses (GHG) during construction and operation
Assessment of expected climate change impact on the project
Assessment of the expected climate changes impact on the baseline conditions
Assessment of cumulative effect between expected climate changes and possi-
ble project impacts on the environment
Assessment of climate change impacts on nature which have to be compensated
and on the compensated nature.
Changes in the global climate can be driven by natural variability and as a response
to anthropogenic forcing. The most important anthropogenic force is proposed to be
the emission of greenhouse gases, and hence an increasing of the concentration of
greenhouse gases in the atmosphere.
Even though the lack of regulations on this issue has made the process of incorpo-
rating the climate change into the EIA difficult, Femern A/S has defined the follow-
ing framework for assessment of importance of climate change to the environmen-
tal assessments made:
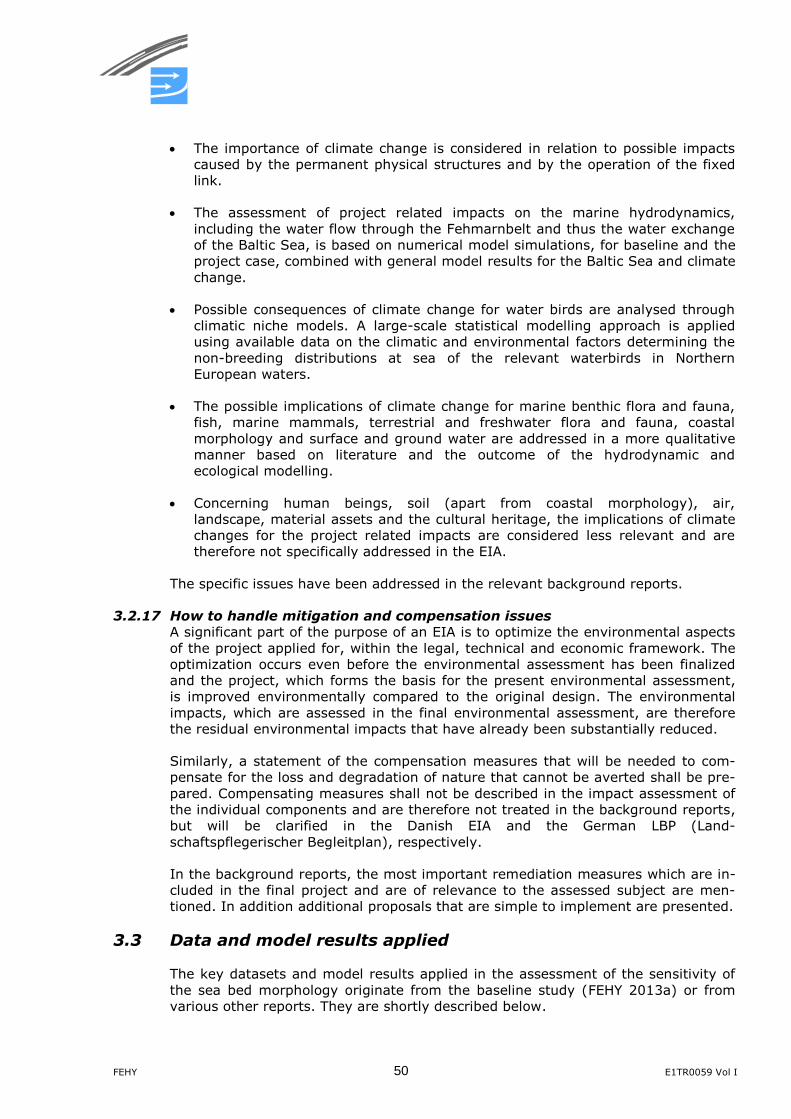
FEHY 50 E1TR0059 Vol I
The importance of climate change is considered in relation to possible impacts
caused by the permanent physical structures and by the operation of the fixed
link.
The assessment of project related impacts on the marine hydrodynamics,
including the water flow through the Fehmarnbelt and thus the water exchange
of the Baltic Sea, is based on numerical model simulations, for baseline and the
project case, combined with general model results for the Baltic Sea and climate
change.
Possible consequences of climate change for water birds are analysed through
climatic niche models. A large-scale statistical modelling approach is applied
using available data on the climatic and environmental factors determining the
non-breeding distributions at sea of the relevant waterbirds in Northern
European waters.
The possible implications of climate change for marine benthic flora and fauna,
fish, marine mammals, terrestrial and freshwater flora and fauna, coastal
morphology and surface and ground water are addressed in a more qualitative
manner based on literature and the outcome of the hydrodynamic and
ecological modelling.
Concerning human beings, soil (apart from coastal morphology), air,
landscape, material assets and the cultural heritage, the implications of climate
changes for the project related impacts are considered less relevant and are
therefore not specifically addressed in the EIA.
The specific issues have been addressed in the relevant background reports.
3.2.17 How to handle mitigation and compensation issues
A significant part of the purpose of an EIA is to optimize the environmental aspects
of the project applied for, within the legal, technical and economic framework. The
optimization occurs even before the environmental assessment has been finalized
and the project, which forms the basis for the present environmental assessment,
is improved environmentally compared to the original design. The environmental
impacts, which are assessed in the final environmental assessment, are therefore
the residual environmental impacts that have already been substantially reduced.
Similarly, a statement of the compensation measures that will be needed to com-
pensate for the loss and degradation of nature that cannot be averted shall be pre-
pared. Compensating measures shall not be described in the impact assessment of
the individual components and are therefore not treated in the background reports,
but will be clarified in the Danish EIA and the German LBP (Land-
schaftspflegerischer Begleitplan), respectively.
In the background reports, the most important remediation measures which are in-
cluded in the final project and are of relevance to the assessed subject are men-
tioned. In addition additional proposals that are simple to implement are presented.
3.3 Data and model results applied
The key datasets and model results applied in the assessment of the sensitivity of
the sea bed morphology originate from the baseline study (FEHY 2013a) or from
various other reports. They are shortly described below.
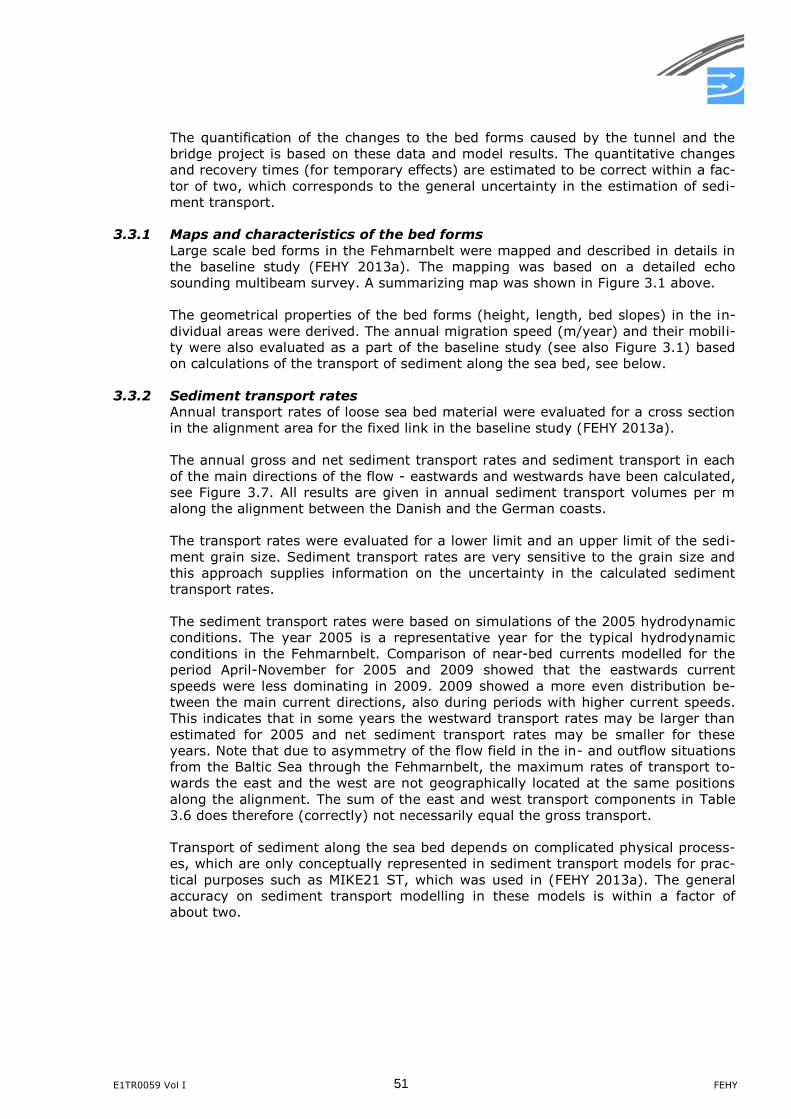
E1TR0059 Vol I 51 FEHY
The quantification of the changes to the bed forms caused by the tunnel and the
bridge project is based on these data and model results. The quantitative changes
and recovery times (for temporary effects) are estimated to be correct within a fac-
tor of two, which corresponds to the general uncertainty in the estimation of sedi-
ment transport.
3.3.1 Maps and characteristics of the bed forms
Large scale bed forms in the Fehmarnbelt were mapped and described in details in
the baseline study (FEHY 2013a). The mapping was based on a detailed echo
sounding multibeam survey. A summarizing map was shown in Figure 3.1 above.
The geometrical properties of the bed forms (height, length, bed slopes) in the in-
dividual areas were derived. The annual migration speed (m/year) and their mobili-
ty were also evaluated as a part of the baseline study (see also Figure 3.1) based
on calculations of the transport of sediment along the sea bed, see below.
3.3.2 Sediment transport rates
Annual transport rates of loose sea bed material were evaluated for a cross section
in the alignment area for the fixed link in the baseline study (FEHY 2013a).
The annual gross and net sediment transport rates and sediment transport in each
of the main directions of the flow - eastwards and westwards have been calculated,
see Figure 3.7. All results are given in annual sediment transport volumes per m
along the alignment between the Danish and the German coasts.
The transport rates were evaluated for a lower limit and an upper limit of the sedi-
ment grain size. Sediment transport rates are very sensitive to the grain size and
this approach supplies information on the uncertainty in the calculated sediment
transport rates.
The sediment transport rates were based on simulations of the 2005 hydrodynamic
conditions. The year 2005 is a representative year for the typical hydrodynamic
conditions in the Fehmarnbelt. Comparison of near-bed currents modelled for the
period April-November for 2005 and 2009 showed that the eastwards current
speeds were less dominating in 2009. 2009 showed a more even distribution be-
tween the main current directions, also during periods with higher current speeds.
This indicates that in some years the westward transport rates may be larger than
estimated for 2005 and net sediment transport rates may be smaller for these
years. Note that due to asymmetry of the flow field in the in- and outflow situations
from the Baltic Sea through the Fehmarnbelt, the maximum rates of transport to-
wards the east and the west are not geographically located at the same positions
along the alignment. The sum of the east and west transport components in Table
3.6 does therefore (correctly) not necessarily equal the gross transport.
Transport of sediment along the sea bed depends on complicated physical process-
es, which are only conceptually represented in sediment transport models for prac-
tical purposes such as MIKE21 ST, which was used in (FEHY 2013a). The general
accuracy on sediment transport modelling in these models is within a factor of
about two.
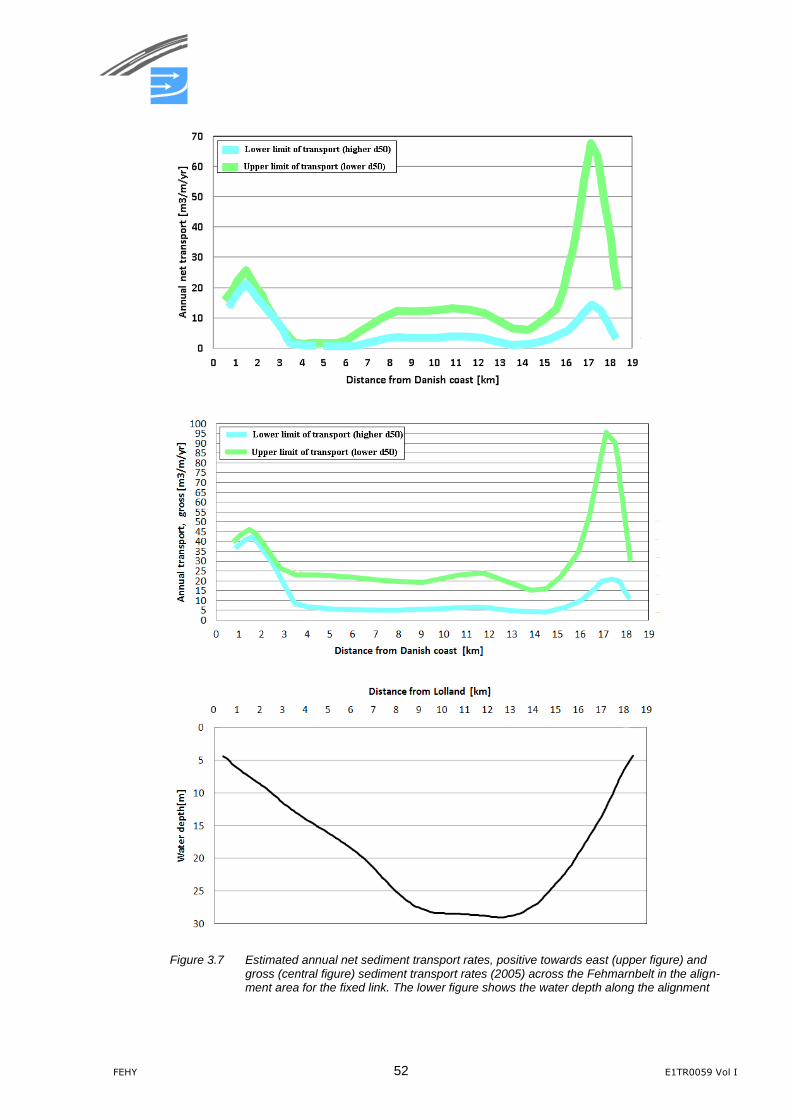
FEHY 52 E1TR0059 Vol I
Figure 3.7 Estimated annual net sediment transport rates, positive towards east (upper figure) and gross (central figure) sediment transport rates (2005) across the Fehmarnbelt in the align-ment area for the fixed link. The lower figure shows the water depth along the alignment
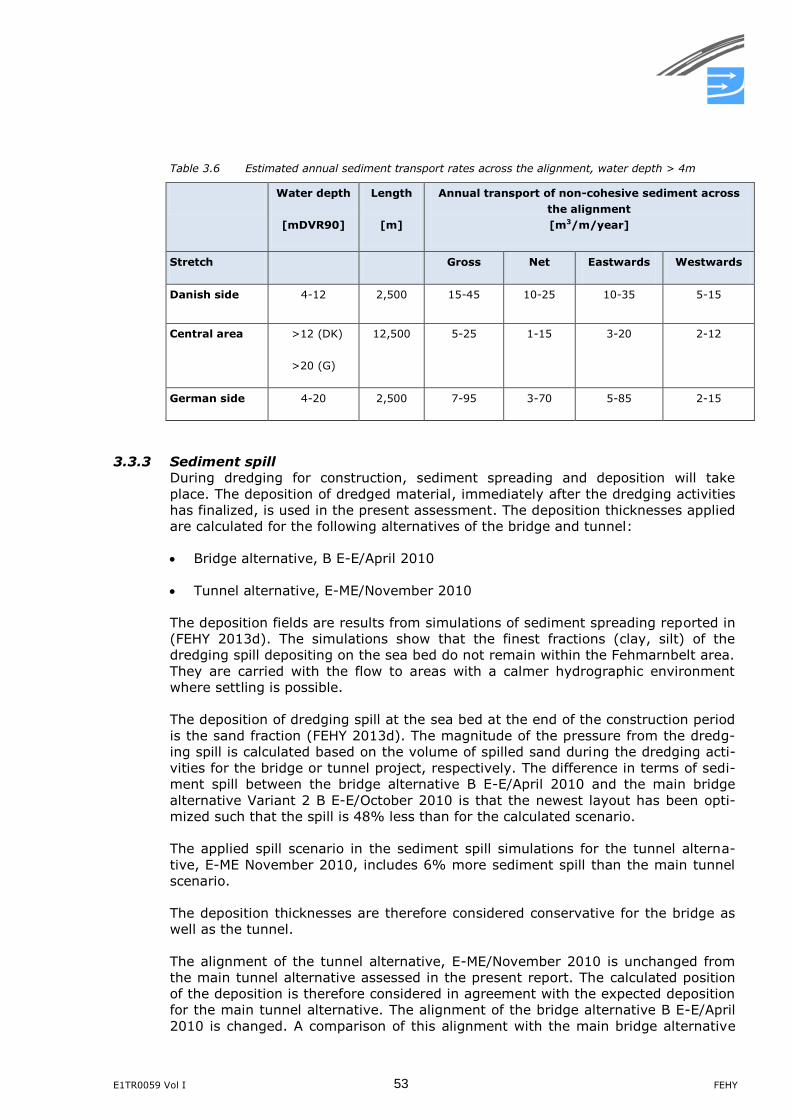
E1TR0059 Vol I 53 FEHY
Table 3.6 Estimated annual sediment transport rates across the alignment, water depth > 4m
Water depth
[mDVR90]
Length
[m]
Annual transport of non-cohesive sediment across
the alignment
[m3/m/year]
Stretch Gross Net Eastwards Westwards
Danish side 4-12 2,500 15-45 10-25 10-35 5-15
Central area >12 (DK)
>20 (G)
12,500 5-25 1-15 3-20 2-12
German side 4-20 2,500 7-95 3-70 5-85 2-15
3.3.3 Sediment spill
During dredging for construction, sediment spreading and deposition will take
place. The deposition of dredged material, immediately after the dredging activities
has finalized, is used in the present assessment. The deposition thicknesses applied
are calculated for the following alternatives of the bridge and tunnel:
Bridge alternative, B E-E/April 2010
Tunnel alternative, E-ME/November 2010
The deposition fields are results from simulations of sediment spreading reported in
(FEHY 2013d). The simulations show that the finest fractions (clay, silt) of the
dredging spill depositing on the sea bed do not remain within the Fehmarnbelt area.
They are carried with the flow to areas with a calmer hydrographic environment
where settling is possible.
The deposition of dredging spill at the sea bed at the end of the construction period
is the sand fraction (FEHY 2013d). The magnitude of the pressure from the dredg-
ing spill is calculated based on the volume of spilled sand during the dredging acti-
vities for the bridge or tunnel project, respectively. The difference in terms of sedi-
ment spill between the bridge alternative B E-E/April 2010 and the main bridge
alternative Variant 2 B E-E/October 2010 is that the newest layout has been opti-
mized such that the spill is 48% less than for the calculated scenario.
The applied spill scenario in the sediment spill simulations for the tunnel alterna-
tive, E-ME November 2010, includes 6% more sediment spill than the main tunnel
scenario.
The deposition thicknesses are therefore considered conservative for the bridge as
well as the tunnel.
The alignment of the tunnel alternative, E-ME/November 2010 is unchanged from
the main tunnel alternative assessed in the present report. The calculated position
of the deposition is therefore considered in agreement with the expected deposition
for the main tunnel alternative. The alignment of the bridge alternative B E-E/April
2010 is changed. A comparison of this alignment with the main bridge alternative
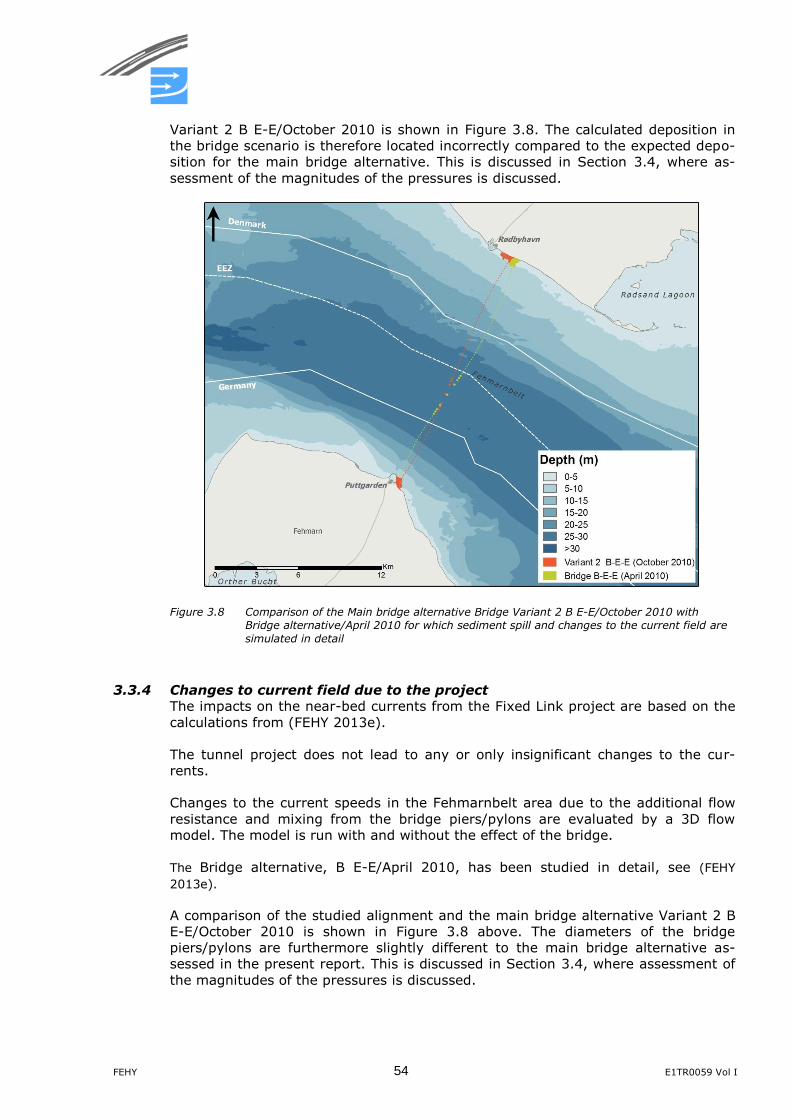
FEHY 54 E1TR0059 Vol I
Variant 2 B E-E/October 2010 is shown in Figure 3.8. The calculated deposition in
the bridge scenario is therefore located incorrectly compared to the expected depo-
sition for the main bridge alternative. This is discussed in Section 3.4, where as-
sessment of the magnitudes of the pressures is discussed.
Figure 3.8 Comparison of the Main bridge alternative Bridge Variant 2 B E-E/October 2010 with
Bridge alternative/April 2010 for which sediment spill and changes to the current field are
simulated in detail
3.3.4 Changes to current field due to the project
The impacts on the near-bed currents from the Fixed Link project are based on the
calculations from (FEHY 2013e).
The tunnel project does not lead to any or only insignificant changes to the cur-
rents.
Changes to the current speeds in the Fehmarnbelt area due to the additional flow
resistance and mixing from the bridge piers/pylons are evaluated by a 3D flow
model. The model is run with and without the effect of the bridge.
The Bridge alternative, B E-E/April 2010, has been studied in detail, see (FEHY
2013e).
A comparison of the studied alignment and the main bridge alternative Variant 2 B
E-E/October 2010 is shown in Figure 3.8 above. The diameters of the bridge
piers/pylons are furthermore slightly different to the main bridge alternative as-
sessed in the present report. This is discussed in Section 3.4, where assessment of
the magnitudes of the pressures is discussed.
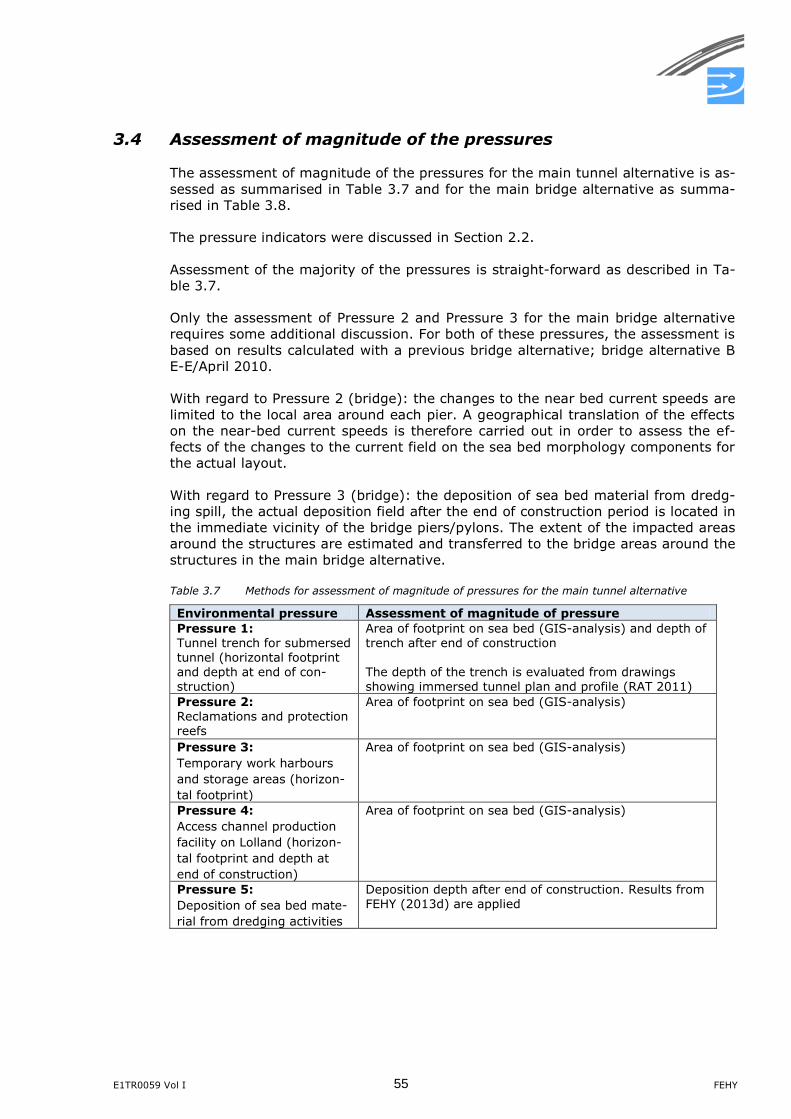
E1TR0059 Vol I 55 FEHY
3.4 Assessment of magnitude of the pressures
The assessment of magnitude of the pressures for the main tunnel alternative is as-
sessed as summarised in Table 3.7 and for the main bridge alternative as summa-
rised in Table 3.8.
The pressure indicators were discussed in Section 2.2.
Assessment of the majority of the pressures is straight-forward as described in Ta-
ble 3.7.
Only the assessment of Pressure 2 and Pressure 3 for the main bridge alternative
requires some additional discussion. For both of these pressures, the assessment is
based on results calculated with a previous bridge alternative; bridge alternative B
E-E/April 2010.
With regard to Pressure 2 (bridge): the changes to the near bed current speeds are
limited to the local area around each pier. A geographical translation of the effects
on the near-bed current speeds is therefore carried out in order to assess the ef-
fects of the changes to the current field on the sea bed morphology components for
the actual layout.
With regard to Pressure 3 (bridge): the deposition of sea bed material from dredg-
ing spill, the actual deposition field after the end of construction period is located in
the immediate vicinity of the bridge piers/pylons. The extent of the impacted areas
around the structures are estimated and transferred to the bridge areas around the
structures in the main bridge alternative.
Table 3.7 Methods for assessment of magnitude of pressures for the main tunnel alternative
Environmental pressure Assessment of magnitude of pressure
Pressure 1: Tunnel trench for submersed tunnel (horizontal footprint and depth at end of con-struction)
Area of footprint on sea bed (GIS-analysis) and depth of trench after end of construction The depth of the trench is evaluated from drawings showing immersed tunnel plan and profile (RAT 2011)
Pressure 2: Reclamations and protection reefs
Area of footprint on sea bed (GIS-analysis)
Pressure 3:
Temporary work harbours
and storage areas (horizon-
tal footprint)
Area of footprint on sea bed (GIS-analysis)
Pressure 4:
Access channel production
facility on Lolland (horizon-
tal footprint and depth at
end of construction)
Area of footprint on sea bed (GIS-analysis)
Pressure 5:
Deposition of sea bed mate-
rial from dredging activities
Deposition depth after end of construction. Results from FEHY (2013d) are applied
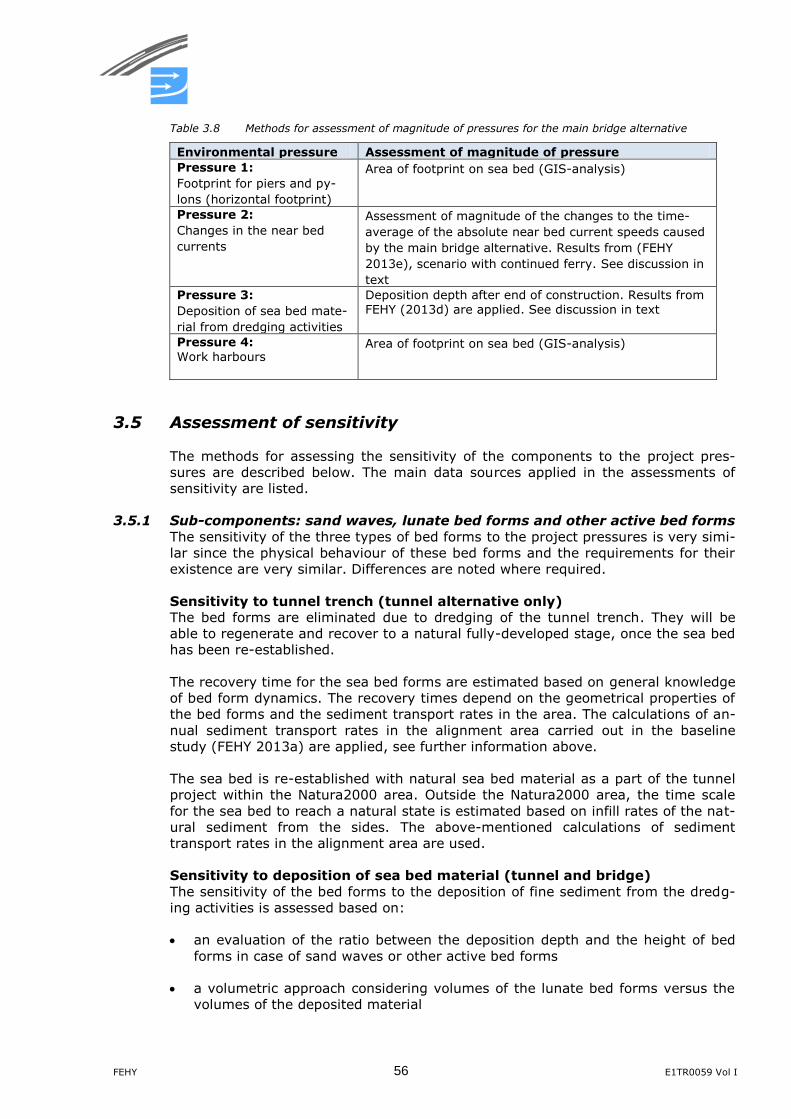
FEHY 56 E1TR0059 Vol I
Table 3.8 Methods for assessment of magnitude of pressures for the main bridge alternative
Environmental pressure Assessment of magnitude of pressure
Pressure 1:
Footprint for piers and py-
lons (horizontal footprint)
Area of footprint on sea bed (GIS-analysis)
Pressure 2:
Changes in the near bed
currents
Assessment of magnitude of the changes to the time-
average of the absolute near bed current speeds caused
by the main bridge alternative. Results from (FEHY
2013e), scenario with continued ferry. See discussion in
text
Pressure 3:
Deposition of sea bed mate-
rial from dredging activities
Deposition depth after end of construction. Results from FEHY (2013d) are applied. See discussion in text
Pressure 4:
Work harbours
Area of footprint on sea bed (GIS-analysis)
3.5 Assessment of sensitivity
The methods for assessing the sensitivity of the components to the project pres-
sures are described below. The main data sources applied in the assessments of
sensitivity are listed.
3.5.1 Sub-components: sand waves, lunate bed forms and other active bed forms
The sensitivity of the three types of bed forms to the project pressures is very simi-
lar since the physical behaviour of these bed forms and the requirements for their
existence are very similar. Differences are noted where required.
Sensitivity to tunnel trench (tunnel alternative only)
The bed forms are eliminated due to dredging of the tunnel trench. They will be
able to regenerate and recover to a natural fully-developed stage, once the sea bed
has been re-established.
The recovery time for the sea bed forms are estimated based on general knowledge
of bed form dynamics. The recovery times depend on the geometrical properties of
the bed forms and the sediment transport rates in the area. The calculations of an-
nual sediment transport rates in the alignment area carried out in the baseline
study (FEHY 2013a) are applied, see further information above.
The sea bed is re-established with natural sea bed material as a part of the tunnel
project within the Natura2000 area. Outside the Natura2000 area, the time scale
for the sea bed to reach a natural state is estimated based on infill rates of the nat-
ural sediment from the sides. The above-mentioned calculations of sediment
transport rates in the alignment area are used.
Sensitivity to deposition of sea bed material (tunnel and bridge)
The sensitivity of the bed forms to the deposition of fine sediment from the dredg-
ing activities is assessed based on:
an evaluation of the ratio between the deposition depth and the height of bed
forms in case of sand waves or other active bed forms
a volumetric approach considering volumes of the lunate bed forms versus the
volumes of the deposited material
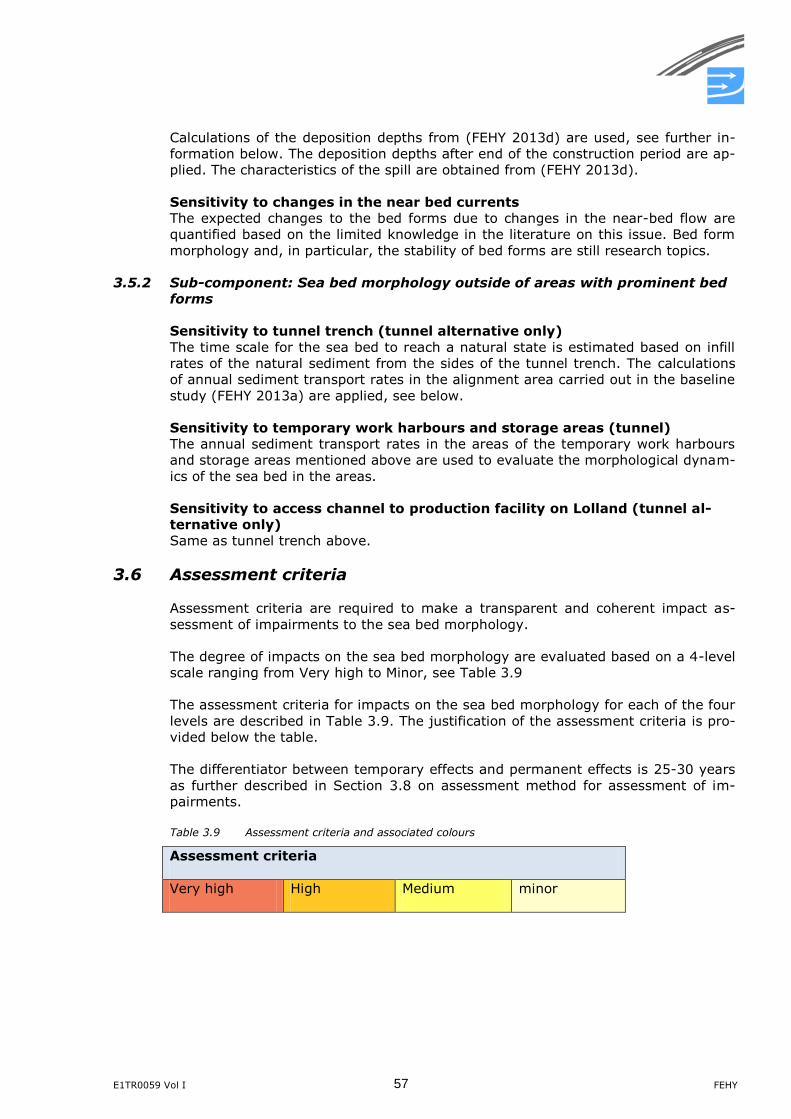
E1TR0059 Vol I 57 FEHY
Calculations of the deposition depths from (FEHY 2013d) are used, see further in-
formation below. The deposition depths after end of the construction period are ap-
plied. The characteristics of the spill are obtained from (FEHY 2013d).
Sensitivity to changes in the near bed currents
The expected changes to the bed forms due to changes in the near-bed flow are
quantified based on the limited knowledge in the literature on this issue. Bed form
morphology and, in particular, the stability of bed forms are still research topics.
3.5.2 Sub-component: Sea bed morphology outside of areas with prominent bed
forms
Sensitivity to tunnel trench (tunnel alternative only)
The time scale for the sea bed to reach a natural state is estimated based on infill
rates of the natural sediment from the sides of the tunnel trench. The calculations
of annual sediment transport rates in the alignment area carried out in the baseline
study (FEHY 2013a) are applied, see below.
Sensitivity to temporary work harbours and storage areas (tunnel)
The annual sediment transport rates in the areas of the temporary work harbours
and storage areas mentioned above are used to evaluate the morphological dynam-
ics of the sea bed in the areas.
Sensitivity to access channel to production facility on Lolland (tunnel al-
ternative only)
Same as tunnel trench above.
3.6 Assessment criteria
Assessment criteria are required to make a transparent and coherent impact as-
sessment of impairments to the sea bed morphology.
The degree of impacts on the sea bed morphology are evaluated based on a 4-level
scale ranging from Very high to Minor, see Table 3.9
The assessment criteria for impacts on the sea bed morphology for each of the four
levels are described in Table 3.9. The justification of the assessment criteria is pro-
vided below the table.
The differentiator between temporary effects and permanent effects is 25-30 years
as further described in Section 3.8 on assessment method for assessment of im-
pairments.
Table 3.9 Assessment criteria and associated colours
Assessment criteria
Very high High Medium minor
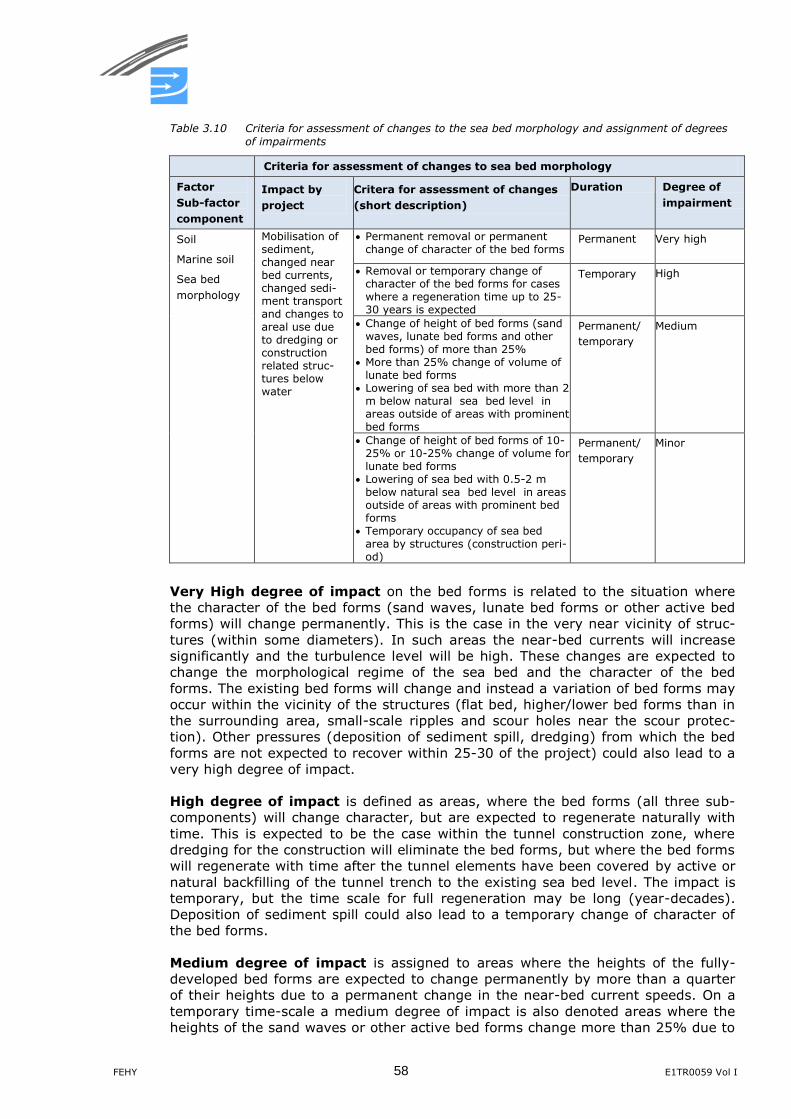
FEHY 58 E1TR0059 Vol I
Table 3.10 Criteria for assessment of changes to the sea bed morphology and assignment of degrees
of impairments
Criteria for assessment of changes to sea bed morphology
Factor
Sub-factor
component
Impact by
project
Critera for assessment of changes
(short description)
Duration Degree of
impairment
Soil
Marine soil
Sea bed
morphology
Mobilisation of sediment, changed near bed currents, changed sedi-ment transport and changes to areal use due to dredging or construction related struc-tures below water
Permanent removal or permanent change of character of the bed forms
Permanent
Very high
Removal or temporary change of character of the bed forms for cases where a regeneration time up to 25-30 years is expected
Temporary
High
Change of height of bed forms (sand waves, lunate bed forms and other bed forms) of more than 25%
More than 25% change of volume of lunate bed forms
Lowering of sea bed with more than 2 m below natural sea bed level in areas outside of areas with prominent bed forms
Permanent/
temporary
Medium
Change of height of bed forms of 10-25% or 10-25% change of volume for lunate bed forms
Lowering of sea bed with 0.5-2 m below natural sea bed level in areas outside of areas with prominent bed forms
Temporary occupancy of sea bed area by structures (construction peri-od)
Permanent/
temporary
Minor
Very High degree of impact on the bed forms is related to the situation where
the character of the bed forms (sand waves, lunate bed forms or other active bed
forms) will change permanently. This is the case in the very near vicinity of struc-
tures (within some diameters). In such areas the near-bed currents will increase
significantly and the turbulence level will be high. These changes are expected to
change the morphological regime of the sea bed and the character of the bed
forms. The existing bed forms will change and instead a variation of bed forms may
occur within the vicinity of the structures (flat bed, higher/lower bed forms than in
the surrounding area, small-scale ripples and scour holes near the scour protec-
tion). Other pressures (deposition of sediment spill, dredging) from which the bed
forms are not expected to recover within 25-30 of the project) could also lead to a
very high degree of impact.
High degree of impact is defined as areas, where the bed forms (all three sub-
components) will change character, but are expected to regenerate naturally with
time. This is expected to be the case within the tunnel construction zone, where
dredging for the construction will eliminate the bed forms, but where the bed forms
will regenerate with time after the tunnel elements have been covered by active or
natural backfilling of the tunnel trench to the existing sea bed level. The impact is
temporary, but the time scale for full regeneration may be long (year-decades).
Deposition of sediment spill could also lead to a temporary change of character of
the bed forms.
Medium degree of impact is assigned to areas where the heights of the fully-
developed bed forms are expected to change permanently by more than a quarter
of their heights due to a permanent change in the near-bed current speeds. On a
temporary time-scale a medium degree of impact is also denoted areas where the
heights of the sand waves or other active bed forms change more than 25% due to
E1TR0059 Vol I 59 FEHY
deposition of sediment from dredging activities. For lunate bed forms the medium
class impact is the situation, where the volume of the lunate bed forms temporarily
changes by more than 25% due to deposition of spill. The bed forms will remain in
the area and keep their overall dynamics and characteristic as bed forms. However,
a 25% change of the heights is expected to be large enough to be visible if meas-
urements are carried out after a number of years.
Sea bed outside of areas with prominent bed forms is classified with a medium de-
gree of impact in case of lowering of the sea bed to a depth of more than 2 m be-
low the natural sea bed level. An abrupt drop of 2 m in the sea bed level, such as in
the case of dredging for the access channel to the production facility at Lolland, will
have a measurable influence on the current speeds near the bed. Furthermore a
hole/trench in the sea bed of more than 2 m will act as a sediment trap for the nat-
ural transport of sand along the sea bed.
Areas where the height of the bed forms changes by 10-25% (permanently or tem-
porarily) are classified as Minor impact areas. Such changes do not change the
characteristics of the bed forms and will probably not be measurable due to the
natural variability. A permanent change is related to a change in the hydrographic
regime, but the sand waves may also experience a temporary change in the height
due to deposition of the dredging spoil. Areas of the lunate bed forms, which expe-
rience more than a 10% temporary change in volume due to dredging spills, are al-
so classified as Minor impact. Sea bed outside of areas with prominent bed forms is
classified a minor degree of impact, where the natural sea bed level is lowered by
0.5-2 m, such as in the area of the tunnel trench or parts of the access channel to
the production facility at Lolland. This will remove the mobile layer of sediment in
most places and create a hole which will capture all sediments moving towards the
hole/trench.
Areas, where the bed form heights or volumes are expected to change by 10% or
less, are considered to maintain characteristics comparable to the natural variation.
A 10% change in the bed form height/volume is within the order of magnitude
which can be expected for the natural variations from year to year.
Lowering of the sea bed level with less than 0.5 m is considered negligible for the
sea bed morphology in areas without bed forms.
3.7 Assessment of loss
Loss does for all sub-components under Sea Bed Morphology take place only where
the projects’ permanent footprints occupy parts of the sea bed. No other pres-
sures cause loss of the sub-components under Sea Bed Morphology. Temporary
(construction related) footprints are evaluated as impairments.
3.7.1 Method of assessment
The magnitude of loss is evaluated as an area of the given sub-components. The
areas are found by combining maps of magnitudes of footprints with maps of sea
bed sub-components from FEHY (2013a) in GIS analysis.
The assessment of loss of the individual sub-components within the component Sea
Bed Morphology is summarised in Table 3.11.
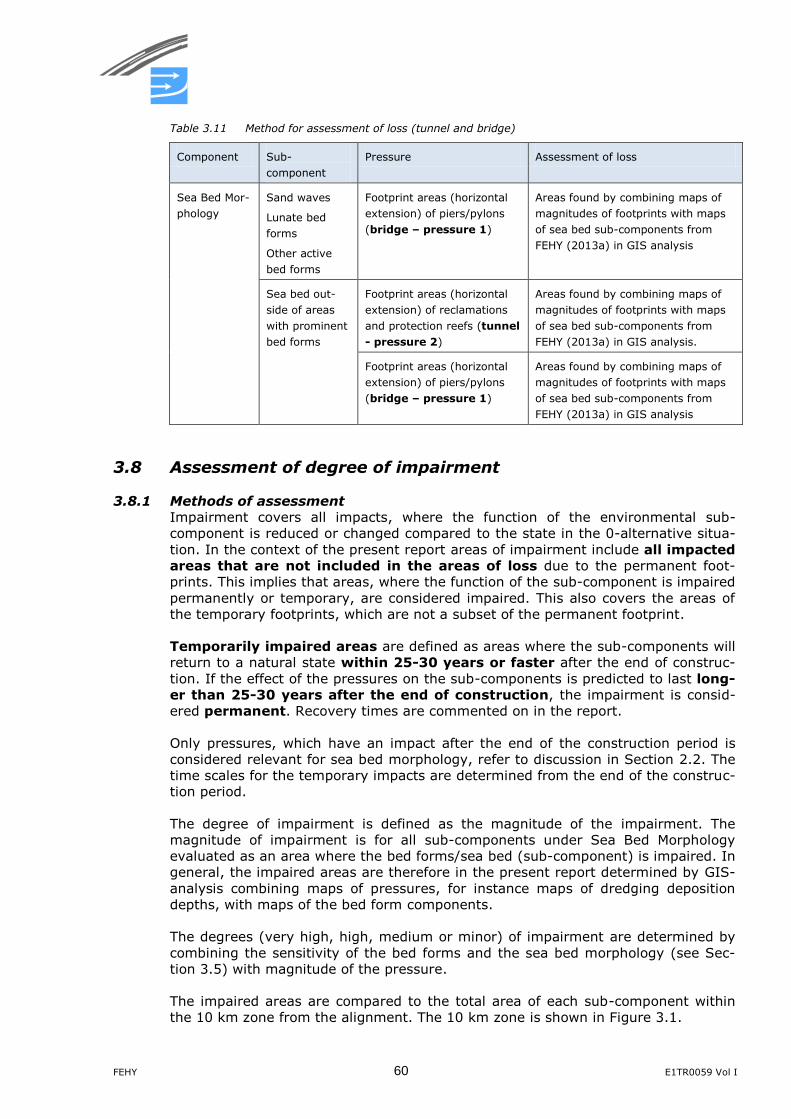
FEHY 60 E1TR0059 Vol I
Table 3.11 Method for assessment of loss (tunnel and bridge)
Component Sub-
component
Pressure Assessment of loss
Sea Bed Mor-
phology
Sand waves
Lunate bed
forms
Other active
bed forms
Footprint areas (horizontal
extension) of piers/pylons
(bridge – pressure 1)
Areas found by combining maps of
magnitudes of footprints with maps
of sea bed sub-components from
FEHY (2013a) in GIS analysis
Sea bed out-
side of areas
with prominent
bed forms
Footprint areas (horizontal
extension) of reclamations
and protection reefs (tunnel
- pressure 2)
Areas found by combining maps of
magnitudes of footprints with maps
of sea bed sub-components from
FEHY (2013a) in GIS analysis.
Footprint areas (horizontal
extension) of piers/pylons
(bridge – pressure 1)
Areas found by combining maps of
magnitudes of footprints with maps
of sea bed sub-components from
FEHY (2013a) in GIS analysis
3.8 Assessment of degree of impairment
3.8.1 Methods of assessment
Impairment covers all impacts, where the function of the environmental sub-
component is reduced or changed compared to the state in the 0-alternative situa-
tion. In the context of the present report areas of impairment include all impacted
areas that are not included in the areas of loss due to the permanent foot-
prints. This implies that areas, where the function of the sub-component is impaired
permanently or temporary, are considered impaired. This also covers the areas of
the temporary footprints, which are not a subset of the permanent footprint.
Temporarily impaired areas are defined as areas where the sub-components will
return to a natural state within 25-30 years or faster after the end of construc-
tion. If the effect of the pressures on the sub-components is predicted to last long-
er than 25-30 years after the end of construction, the impairment is consid-
ered permanent. Recovery times are commented on in the report.
Only pressures, which have an impact after the end of the construction period is
considered relevant for sea bed morphology, refer to discussion in Section 2.2. The
time scales for the temporary impacts are determined from the end of the construc-
tion period.
The degree of impairment is defined as the magnitude of the impairment. The
magnitude of impairment is for all sub-components under Sea Bed Morphology
evaluated as an area where the bed forms/sea bed (sub-component) is impaired. In
general, the impaired areas are therefore in the present report determined by GIS-
analysis combining maps of pressures, for instance maps of dredging deposition
depths, with maps of the bed form components.
The degrees (very high, high, medium or minor) of impairment are determined by
combining the sensitivity of the bed forms and the sea bed morphology (see Sec-
tion 3.5) with magnitude of the pressure.
The impaired areas are compared to the total area of each sub-component within
the 10 km zone from the alignment. The 10 km zone is shown in Figure 3.1.

E1TR0059 Vol I 61 FEHY
The methodologies for assessment of the degrees of impairment are listed for pres-
sures relevant for impairment in Table 3.12 for the main tunnel alternative and in
Table 3.13 for the main bridge alternative.
The data and model results described in Section 3.3 are applied.
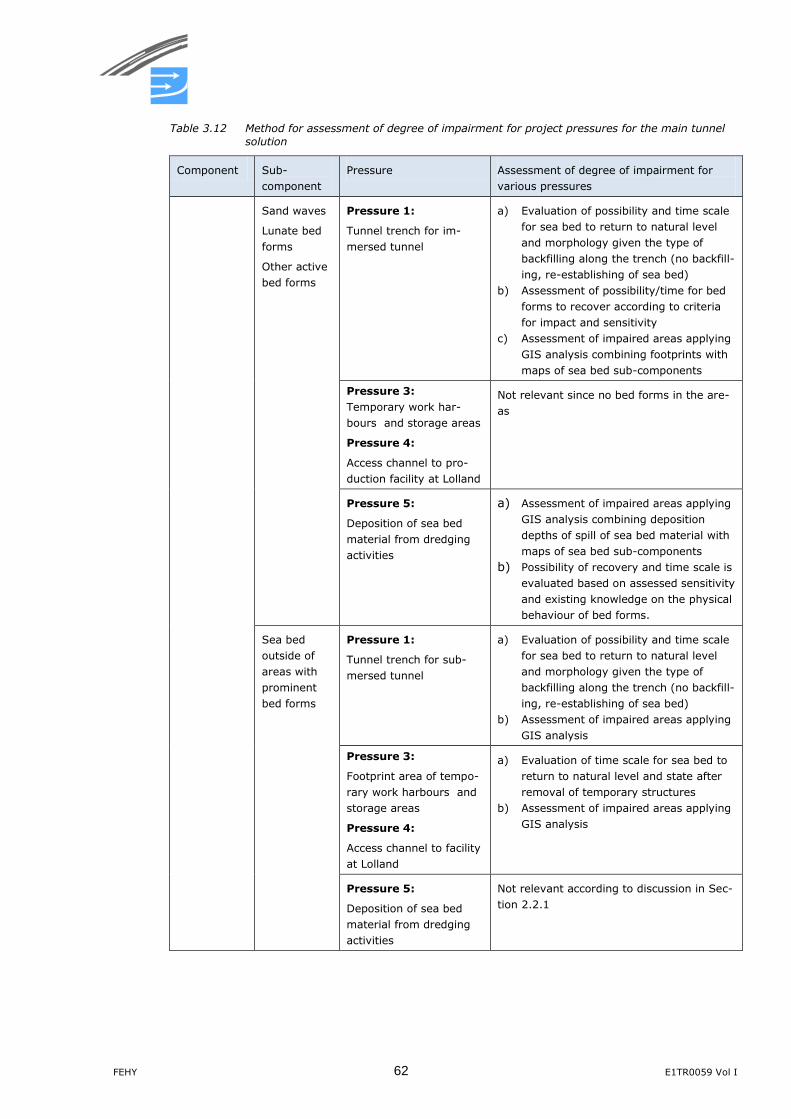
FEHY 62 E1TR0059 Vol I
Table 3.12 Method for assessment of degree of impairment for project pressures for the main tunnel
solution
Component Sub-
component
Pressure Assessment of degree of impairment for
various pressures
Sand waves
Lunate bed
forms
Other active
bed forms
Pressure 1:
Tunnel trench for im-
mersed tunnel
a) Evaluation of possibility and time scale
for sea bed to return to natural level
and morphology given the type of
backfilling along the trench (no backfill-
ing, re-establishing of sea bed)
b) Assessment of possibility/time for bed
forms to recover according to criteria
for impact and sensitivity
c) Assessment of impaired areas applying
GIS analysis combining footprints with
maps of sea bed sub-components
Pressure 3:
Temporary work har-
bours and storage areas
Pressure 4:
Access channel to pro-
duction facility at Lolland
Not relevant since no bed forms in the are-
as
Pressure 5:
Deposition of sea bed
material from dredging
activities
a) Assessment of impaired areas applying
GIS analysis combining deposition
depths of spill of sea bed material with
maps of sea bed sub-components
b) Possibility of recovery and time scale is
evaluated based on assessed sensitivity
and existing knowledge on the physical
behaviour of bed forms.
Sea bed
outside of
areas with
prominent
bed forms
Pressure 1:
Tunnel trench for sub-
mersed tunnel
a) Evaluation of possibility and time scale
for sea bed to return to natural level
and morphology given the type of
backfilling along the trench (no backfill-
ing, re-establishing of sea bed)
b) Assessment of impaired areas applying
GIS analysis
Pressure 3:
Footprint area of tempo-
rary work harbours and
storage areas
Pressure 4:
Access channel to facility
at Lolland
a) Evaluation of time scale for sea bed to
return to natural level and state after
removal of temporary structures
b) Assessment of impaired areas applying
GIS analysis
Pressure 5:
Deposition of sea bed
material from dredging
activities
Not relevant according to discussion in Sec-
tion 2.2.1
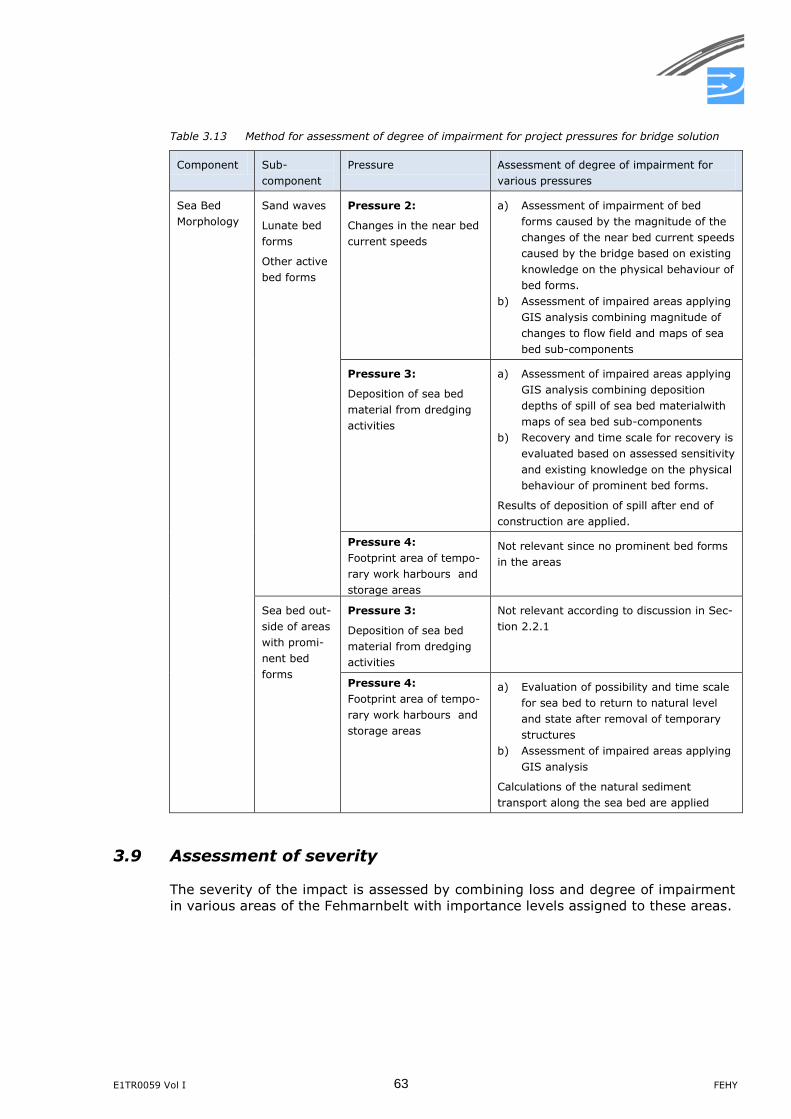
E1TR0059 Vol I 63 FEHY
Table 3.13 Method for assessment of degree of impairment for project pressures for bridge solution
Component Sub-
component
Pressure Assessment of degree of impairment for
various pressures
Sea Bed
Morphology
Sand waves
Lunate bed
forms
Other active
bed forms
Pressure 2:
Changes in the near bed
current speeds
a) Assessment of impairment of bed
forms caused by the magnitude of the
changes of the near bed current speeds
caused by the bridge based on existing
knowledge on the physical behaviour of
bed forms.
b) Assessment of impaired areas applying
GIS analysis combining magnitude of
changes to flow field and maps of sea
bed sub-components
Pressure 3:
Deposition of sea bed
material from dredging
activities
a) Assessment of impaired areas applying
GIS analysis combining deposition
depths of spill of sea bed materialwith
maps of sea bed sub-components
b) Recovery and time scale for recovery is
evaluated based on assessed sensitivity
and existing knowledge on the physical
behaviour of prominent bed forms.
Results of deposition of spill after end of
construction are applied.
Pressure 4:
Footprint area of tempo-
rary work harbours and
storage areas
Not relevant since no prominent bed forms
in the areas
Sea bed out-
side of areas
with promi-
nent bed
forms
Pressure 3:
Deposition of sea bed
material from dredging
activities
Not relevant according to discussion in Sec-
tion 2.2.1
Pressure 4:
Footprint area of tempo-
rary work harbours and
storage areas
a) Evaluation of possibility and time scale
for sea bed to return to natural level
and state after removal of temporary
structures
b) Assessment of impaired areas applying
GIS analysis
Calculations of the natural sediment
transport along the sea bed are applied
3.9 Assessment of severity
The severity of the impact is assessed by combining loss and degree of impairment
in various areas of the Fehmarnbelt with importance levels assigned to these areas.
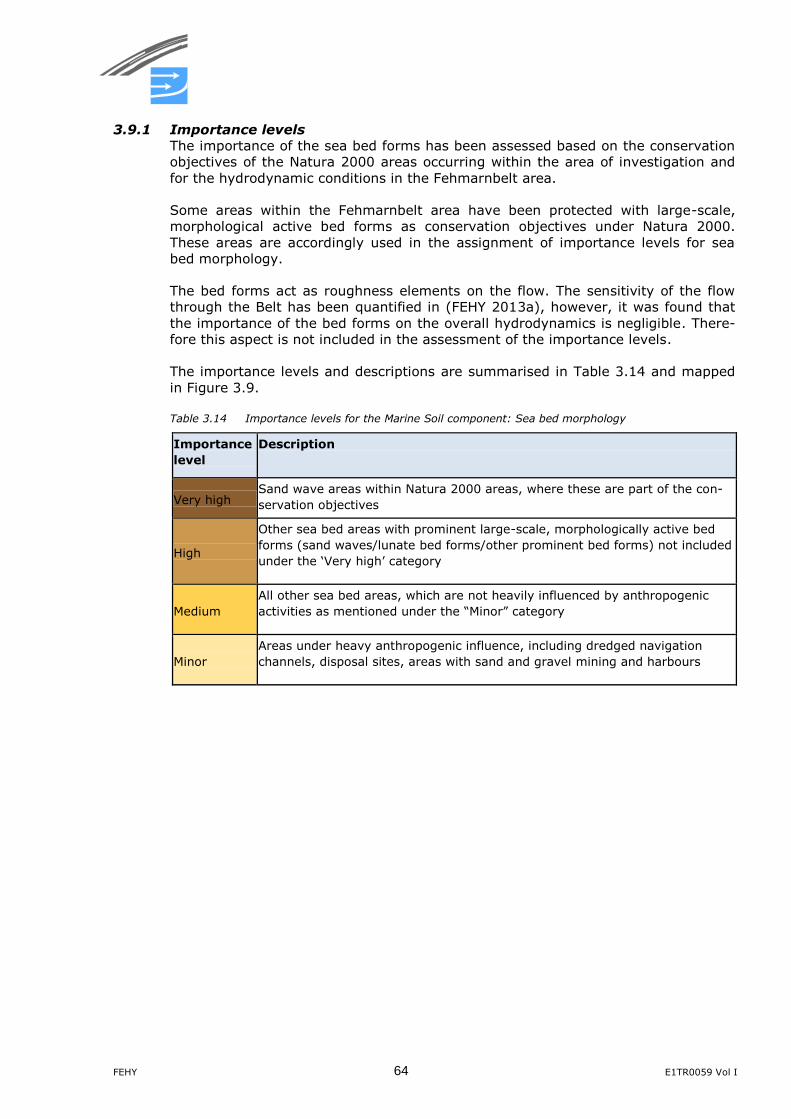
FEHY 64 E1TR0059 Vol I
3.9.1 Importance levels
The importance of the sea bed forms has been assessed based on the conservation
objectives of the Natura 2000 areas occurring within the area of investigation and
for the hydrodynamic conditions in the Fehmarnbelt area.
Some areas within the Fehmarnbelt area have been protected with large-scale,
morphological active bed forms as conservation objectives under Natura 2000.
These areas are accordingly used in the assignment of importance levels for sea
bed morphology.
The bed forms act as roughness elements on the flow. The sensitivity of the flow
through the Belt has been quantified in (FEHY 2013a), however, it was found that
the importance of the bed forms on the overall hydrodynamics is negligible. There-
fore this aspect is not included in the assessment of the importance levels.
The importance levels and descriptions are summarised in Table 3.14 and mapped
in Figure 3.9.
Table 3.14 Importance levels for the Marine Soil component: Sea bed morphology
Importance
level
Description
Very high Sand wave areas within Natura 2000 areas, where these are part of the con-
servation objectives
High
Other sea bed areas with prominent large-scale, morphologically active bed
forms (sand waves/lunate bed forms/other prominent bed forms) not included
under the ‘Very high’ category
Medium
All other sea bed areas, which are not heavily influenced by anthropogenic
activities as mentioned under the “Minor” category
Minor
Areas under heavy anthropogenic influence, including dredged navigation
channels, disposal sites, areas with sand and gravel mining and harbours
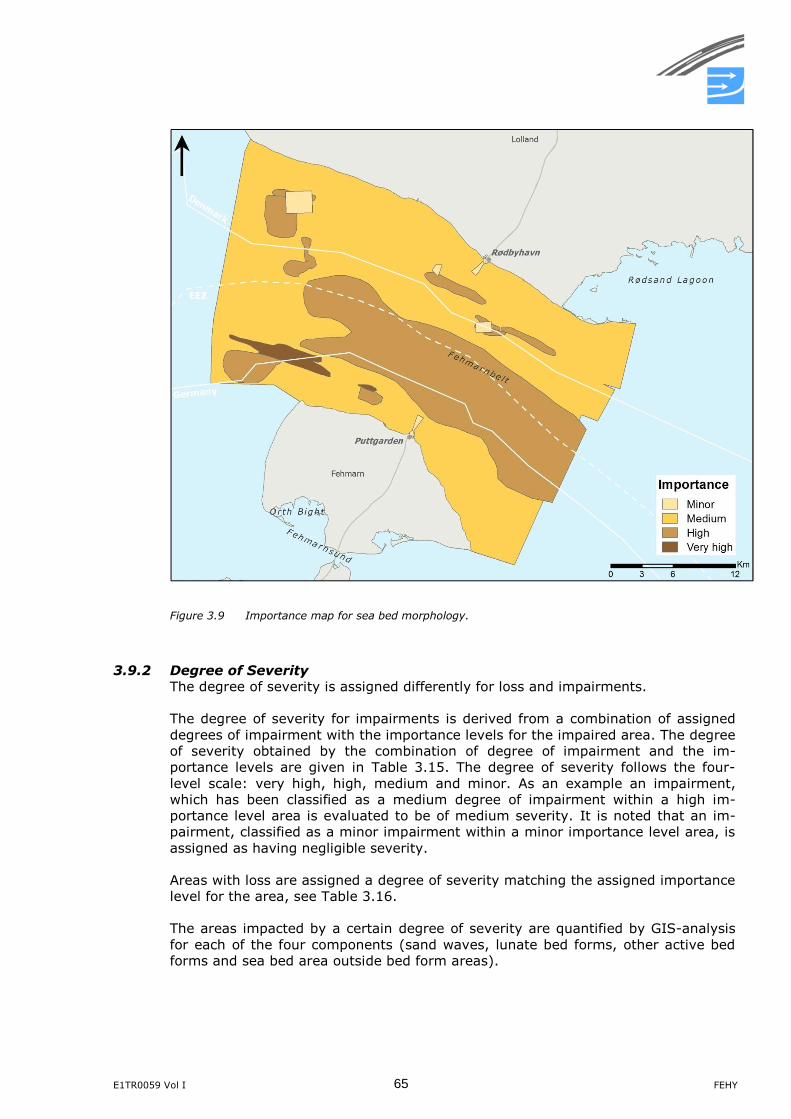
E1TR0059 Vol I 65 FEHY
Figure 3.9 Importance map for sea bed morphology.
3.9.2 Degree of Severity
The degree of severity is assigned differently for loss and impairments.
The degree of severity for impairments is derived from a combination of assigned
degrees of impairment with the importance levels for the impaired area. The degree
of severity obtained by the combination of degree of impairment and the im-
portance levels are given in Table 3.15. The degree of severity follows the four-
level scale: very high, high, medium and minor. As an example an impairment,
which has been classified as a medium degree of impairment within a high im-
portance level area is evaluated to be of medium severity. It is noted that an im-
pairment, classified as a minor impairment within a minor importance level area, is
assigned as having negligible severity.
Areas with loss are assigned a degree of severity matching the assigned importance
level for the area, see Table 3.16.
The areas impacted by a certain degree of severity are quantified by GIS-analysis
for each of the four components (sand waves, lunate bed forms, other active bed
forms and sea bed area outside bed form areas).
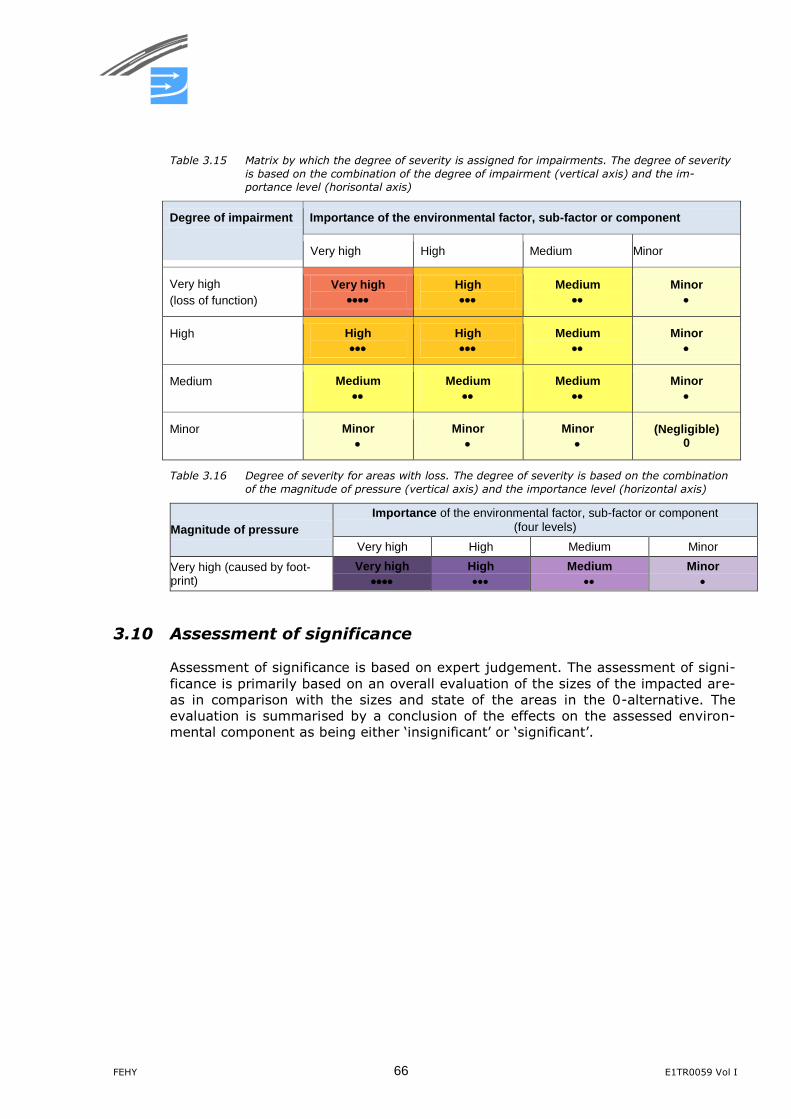
FEHY 66 E1TR0059 Vol I
Table 3.15 Matrix by which the degree of severity is assigned for impairments. The degree of severity
is based on the combination of the degree of impairment (vertical axis) and the im-
portance level (horisontal axis)
Degree of impairment Importance of the environmental factor, sub-factor or component
Very high High Medium Minor
Very high
(loss of function)
Very high
High
Medium
Minor
High High
High
Medium
Minor
Medium Medium
Medium
Medium
Minor
Minor Minor
Minor
Minor
(Negligible) 0
Table 3.16 Degree of severity for areas with loss. The degree of severity is based on the combination
of the magnitude of pressure (vertical axis) and the importance level (horizontal axis)
Magnitude of pressure
Importance of the environmental factor, sub-factor or component
(four levels)
Very high High Medium Minor
Very high (caused by foot-print)
Very high
High
Medium
Minor
3.10 Assessment of significance
Assessment of significance is based on expert judgement. The assessment of signi-
ficance is primarily based on an overall evaluation of the sizes of the impacted are-
as in comparison with the sizes and state of the areas in the 0-alternative. The
evaluation is summarised by a conclusion of the effects on the assessed environ-
mental component as being either ‘insignificant’ or ‘significant’.

E1TR0059 Vol I 67 FEHY
4 ASSESSMENT OF 0-ALTERNATIVE
All impacts on sea bed morphology are compared to the existing conditions
(2009/2010).
Given the present knowledge on the sea bed morphology of the Fehmarnbelt, it is a
reasonable assumption that the conditions in 2025 without the fixed link project will
remain unchanged compared to the situation in 2009/2010.
FEHY 68 E1TR0059 Vol I
5 SENSITIVITY ANALYSIS
The sensitivity of the sea bed morphology to pressures from the project is connect-
ed to how morphologically dynamic the sea bed is. The physical response to the
project pressures is described in this section. The sensitivity is quantified wherever
possible and recovery mechanisms and time scales for recovery are discussed for
the relevant sub-components.
A highly dynamic sea bed is able to recover faster to temporary pressures than a
weakly dynamic bed. The morphodynamics are strongly related to the natural
transport of sea bed material along the sea bed. Annual rates of the transport of
sea bed material in the alignment area were calculated in (FEHY 2013a) and sum-
marised in Section 3.3.2 above.
5.1 Sub-components: sand waves, lunate bed forms and other ac-tive bed forms
The sensitivity to the project pressures of the three types of bed forms are very
similar since the physical behaviour of these bed forms and the requirements for
their existence are very similar. Differences are noted where required.
Analysis of the bed form dynamics and response to the project pressures are based
on the following references: Deigaard and Fredsøe (1992); Fredsøe (1974);
Fredsøe (1982); Niemann (2003); Niemann, Fredsøe, Jacobsen (2011).
5.1.1 Sensitivity to tunnel trench (tunnel alternative only)
The sea bed forms are eliminated in the area of the footprint of the trench when
dredging for the tunnel trench. They are expected to recover with time as described
below. The bed forms are therefore considered to be temporarily impaired.
After the scour protection above the tunnel elements have been put in place, a
shallow trench of about 0.7 m depth with the scour protection (rocks) in the bottom
will remain at the sea bed at the end of construction.
Silt, sand, gravel being transported along the sea bed will be trapped in the trench
and re-establish the sea bed naturally. The majority of the sediment infill will de-
posit on the slopes and narrow the tunnel trench. After some time the trench will
become a week depression in the sea bed until it has recovered to a natural sea
bed level.
Above a stone protection, the turbulence is more violent than above a plane sandy
bed and settling of sediment will therefore be somewhat reduced. As the sediment
is transported primarily as bed load (rolling and jumping along the bed rather than
in the water column), the impact from the protection layer is expected to be small.
It is assumed that all sediment is trapped in the trench, see Figure 5.2. The esti-
mated time scales for the trench to fill in are estimated and presented in Section
6.1 for various sections of the trench.
The bed forms will partly re-generate during the process of the trench infill and de-
velop fully after the trench is completely filled in. The lunate bed forms are the re-
sult of the interaction between the loose sea bed material and the near-bed cur-
rents. The lunate shape is the result of a scarcity of loose sea bed material on a
more or less immobile sea bed (FEHY 2013a). The sea bed above the tunnel trench
is expected to have a more loose character than the existing sea bed during the
time when the trench fills in and some years after this. The increased volume of
loose material may cause the lunate bed forms to modify their shape such that the
E1TR0059 Vol I 69 FEHY
character of the bed forms may eventually change to become sand waves. With
time, the bed forms are expected to obtain their natural shape and size.
Recovery times for bed forms
The recovery times for the bed forms are difficult to predict. The time scale for a
full regeneration of the bed forms is related to a) the mobility of the sediment and
b) the size (“volume and height”) of the bed forms. In general, small bed forms will
form and regenerate faster than large bed forms and the bed forms will regenerate
faster where the sea bed mobility is high. The bed forms are expected to develop
and migrate primarily during events with high current speeds. A gross migration
distance comparable to a 1-2 times the length of the bed forms is expected before
recovery takes place when developing from a plane bed (Niemann 2003).
Fully developed lunate bed forms in the alignment area in the Fehmarnbelt are
estimated to migrate 2-4 m/event occurring 2-5 times per year (FEHY 2013a), see
concept of bed form migration in Figure 5.1. The migration distance is therefore 10-
15 m/year. With a length of the bed forms of 100-150 m, the recovery time is
therefore estimated to be in the order of 15-20 years after the sea bed level
has re-established to plane bed.
The sand waves near the alignment are estimated to migrate about 1-5 m/event
occurring 2-5 times per year (FEHY 2013a). The migration distance is therefore
about 10-15 m/year in average. The lengths of the sand waves in area D3 west of
the alignment (see Figure 3.1) are 200-400 m. In area D4, just east of the align-
ment, the sand waves have a length of 50-100 m. The larger sand waves to the
west of the alignment are predicted to recover in about 30-40 years from a re-
established plane bed, while the recovery times for the smaller sand waves to
the east of the alignment are about 10-15 years. A slow regeneration of the
sand waves just east of the alignment after sand mining which eliminated parts of
the sand waves in this area, supports this (refer to discussion in FEHY 2013a).
The bed forms require a thickness of sea bed material comparable to their own
height. Lunate bed forms are therefore expected to fully recover since the thick-
ness of sea bed material, 0.7 m above the protection layer is about the same as the
height of the lunate bed forms. The sand waves are higher - 0.5-3 m near the
alignment - than the lunate bed forms. They are expected to recover and migrate
across the protected tunnel. The only expected long-term change for the sand
waves will be, that due to stochastic variations in the trough level, the protection
layer will be exposed occasionally assuming the upper limit of the protection layer
is placed 0.7 m below the present mean sea bed level. The deposition near the tun-
nel trench of sediment from dredging activities, which have not been resuspended
at the end of construction period, may contribute to a faster recovery of bed forms.
Recovery times for the sea bed and bed forms are estimated based on the sediment
transport capacity for various sections along the trench in Section 6.1.
Due to the long re-generation time of the bed forms, the impacts are classified
as a high degree of impairment according to assessment criteria in Section 3.6.
The time scales for full recovery of the sea bed are evaluated in Section 6.1.
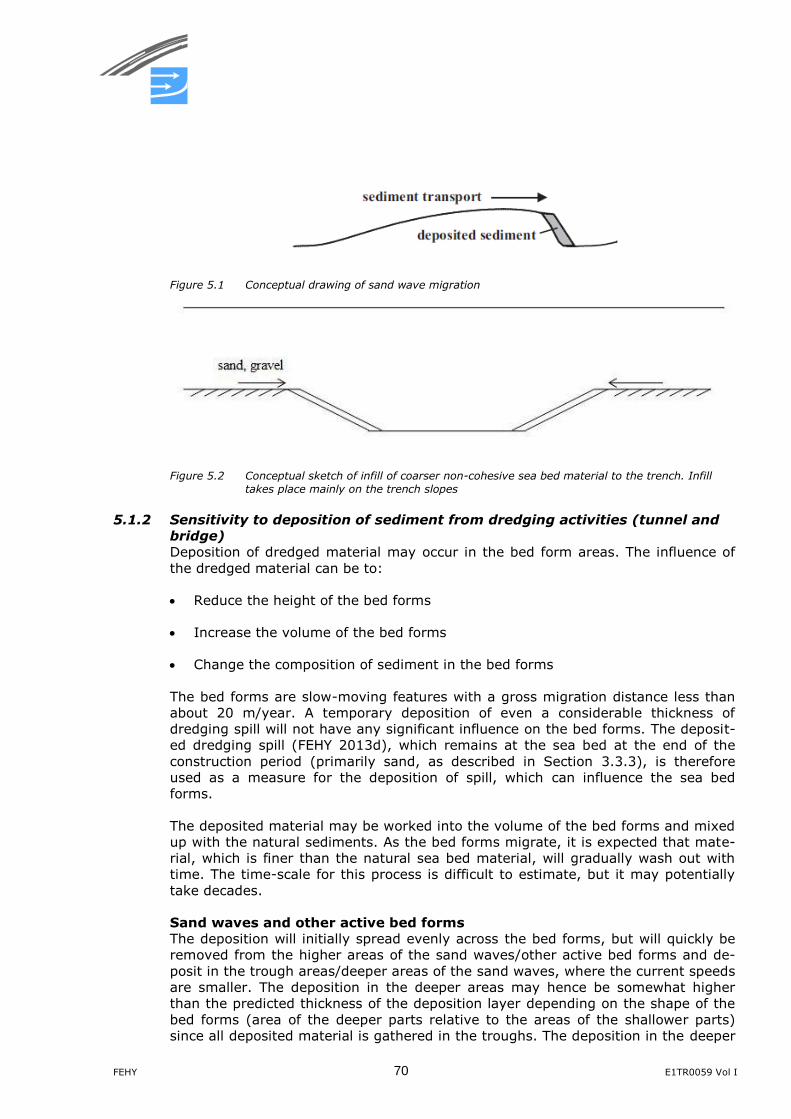
FEHY 70 E1TR0059 Vol I
Figure 5.1 Conceptual drawing of sand wave migration
Figure 5.2 Conceptual sketch of infill of coarser non-cohesive sea bed material to the trench. Infill
takes place mainly on the trench slopes
5.1.2 Sensitivity to deposition of sediment from dredging activities (tunnel and
bridge)
Deposition of dredged material may occur in the bed form areas. The influence of
the dredged material can be to:
Reduce the height of the bed forms
Increase the volume of the bed forms
Change the composition of sediment in the bed forms
The bed forms are slow-moving features with a gross migration distance less than
about 20 m/year. A temporary deposition of even a considerable thickness of
dredging spill will not have any significant influence on the bed forms. The deposit-
ed dredging spill (FEHY 2013d), which remains at the sea bed at the end of the
construction period (primarily sand, as described in Section 3.3.3), is therefore
used as a measure for the deposition of spill, which can influence the sea bed
forms.
The deposited material may be worked into the volume of the bed forms and mixed
up with the natural sediments. As the bed forms migrate, it is expected that mate-
rial, which is finer than the natural sea bed material, will gradually wash out with
time. The time-scale for this process is difficult to estimate, but it may potentially
take decades.
Sand waves and other active bed forms
The deposition will initially spread evenly across the bed forms, but will quickly be
removed from the higher areas of the sand waves/other active bed forms and de-
posit in the trough areas/deeper areas of the sand waves, where the current speeds
are smaller. The deposition in the deeper areas may hence be somewhat higher
than the predicted thickness of the deposition layer depending on the shape of the
bed forms (area of the deeper parts relative to the areas of the shallower parts)
since all deposited material is gathered in the troughs. The deposition in the deeper
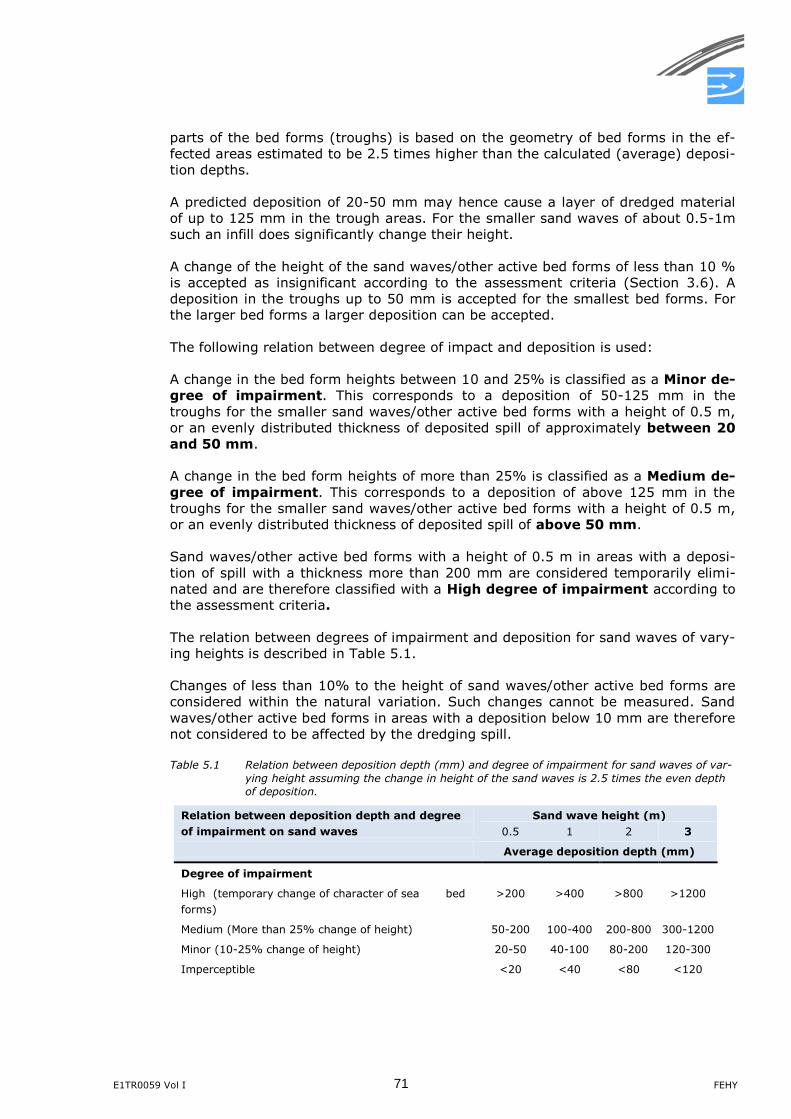
E1TR0059 Vol I 71 FEHY
parts of the bed forms (troughs) is based on the geometry of bed forms in the ef-
fected areas estimated to be 2.5 times higher than the calculated (average) deposi-
tion depths.
A predicted deposition of 20-50 mm may hence cause a layer of dredged material
of up to 125 mm in the trough areas. For the smaller sand waves of about 0.5-1m
such an infill does significantly change their height.
A change of the height of the sand waves/other active bed forms of less than 10 %
is accepted as insignificant according to the assessment criteria (Section 3.6). A
deposition in the troughs up to 50 mm is accepted for the smallest bed forms. For
the larger bed forms a larger deposition can be accepted.
The following relation between degree of impact and deposition is used:
A change in the bed form heights between 10 and 25% is classified as a Minor de-
gree of impairment. This corresponds to a deposition of 50-125 mm in the
troughs for the smaller sand waves/other active bed forms with a height of 0.5 m,
or an evenly distributed thickness of deposited spill of approximately between 20
and 50 mm.
A change in the bed form heights of more than 25% is classified as a Medium de-
gree of impairment. This corresponds to a deposition of above 125 mm in the
troughs for the smaller sand waves/other active bed forms with a height of 0.5 m,
or an evenly distributed thickness of deposited spill of above 50 mm.
Sand waves/other active bed forms with a height of 0.5 m in areas with a deposi-
tion of spill with a thickness more than 200 mm are considered temporarily elimi-
nated and are therefore classified with a High degree of impairment according to
the assessment criteria.
The relation between degrees of impairment and deposition for sand waves of vary-
ing heights is described in Table 5.1.
Changes of less than 10% to the height of sand waves/other active bed forms are
considered within the natural variation. Such changes cannot be measured. Sand
waves/other active bed forms in areas with a deposition below 10 mm are therefore
not considered to be affected by the dredging spill.
Table 5.1 Relation between deposition depth (mm) and degree of impairment for sand waves of var-
ying height assuming the change in height of the sand waves is 2.5 times the even depth
of deposition.
Relation between deposition depth and degree
of impairment on sand waves
Sand wave height (m)
0.5 1 2 3
Average deposition depth (mm)
Degree of impairment
High (temporary change of character of sea bed
forms)
>200 >400 >800 >1200
Medium (More than 25% change of height) 50-200 100-400 200-800 300-1200
Minor (10-25% change of height) 20-50 40-100 80-200 120-300
Imperceptible <20 <40 <80 <120
FEHY 72 E1TR0059 Vol I
Lunate bed forms
A deposition in the areas of the lunate bed forms adds to the limited volume of the
available loose bed material in the area, which forms the lunate bed forms. Al-
though the deposition will initially spread evenly across the area, it is expected to
accumulate around the lunate bed forms. It will most likely deposit in the lee areas
and contribute to the formations of bed forms in the area.
A volumetric approach considering volumes of the lunate bed forms versus the vol-
umes of the deposited material is applied in estimating to which degree the bed
forms will be affected.
A single lunate bed form is estimated to consist of approximately 1000 m3 of sand.
With a number of 10-50 bed forms per 1 km2, each bed form takes up an area in
the order of 35,000 m2 on average. An evenly distributed deposition of 10 mm (to
take an example) will hence add a volume of 350 m3 of loose material to the aver-
age lunate bed form, corresponding to about one third of the present volume.
A cut off level of 5 mm is chosen for when the effect on lunate bed forms is consid-
ered significant. This corresponds to an added volume of 10-20%.
Areas of lunate bed forms with a deposition depth of dredging spill between 5-10
mm is classified as minor degree of impairment, corresponding to the assess-
ment criteria in Section 3.6 of increased volume of the lunate bed forms of about
10-25%.
Areas with a deposition depth above 10-200 mm are classified as medium
degree of impairment, corresponding to an increased volume of the lunate bed
forms higher than 25%.
Lunate bed forms in areas with a deposition of spill with a thickness of more than
200 mm are considered temporarily eliminated and are therefore classified with a
high degree of impairment according to the assessment criteria.
Not all of the finest material (mud) is expected to add to the lunate bed forms, but
will probably frequently be eroded and deposited from the area with the varying
flow conditions. The lee effects on the current field around the lunate bed forms are
less pronounced than the trough area in the sand wave field. The added volume of
loose material may cause the lunate bed forms to modify their shape. Where large
volumes are added near the alignment, the character of the bed forms may even-
tually change to become sand waves. Where smaller volumes of material are add-
ed, the lunate bed forms may become higher due to a potential increase in sedi-
ment transport along the sea bed as the material becomes finer.
Table 5.2 Relation between deposition depth (mm) and degree of impairment for lunate bed forms
Relation between deposition depth and degree
of impairment on lunate bed forms
Lunate bed forms
Average deposition depth (mm)
Degree of impairment
High (temporary change of character of bed forms) >200
Medium (> 25% change of volume) 10-200
Minor (10-25% change of volume) 5-10
Imperceptible (< 10 % change of volume) <5
E1TR0059 Vol I 73 FEHY
5.1.3 Sensitivity to changes in the near bed currents (bridge alternative only)
The impact on the bed forms from a modified flow field is related to the sediment
transport. Increases or decreases in the near-bed current speeds, when these ex-
ceed the critical current speeds for movement of sediment, will inevitably change
the sediment transport rates and therefore the bed forms. In the Fehmarnbelt area,
the current speeds near the bed are often below or close to the critical current
speed for sediment mobility. With grain sizes of about 0.1-0.2 mm, sediment
transport initiates around 0.2 m/s at 3 m water depth. Sediment transport occurs
therefore mainly during peaks in the current speeds and small changes in the cur-
rent speed will be relatively important for the sediment transport rates. At these
current speeds, the sediment transport rates increase or decrease with the change
in the current speed to a power of 3-10. As an example, a 2.5% increase in the
near-bed current velocity is hence expected to increase the sediment transport rate
by 10-30%, depending on the current speed and sediment grain size. An impact of
a change in the sediment transport rate is expected to:
a) change the migration rate of the bed forms and
b) change the geometry of the bed forms
The change in the migration rate for the bed forms is proportional to the change in
the sediment transport rate.
A 15% increase in the sediment transport will hence increase the migration rate by
about 15%.
The change in the geometry is dependent on how much the sediment transport
changes. A large increase in the sediment transport rate may even cause the bed
forms to disappear. For smaller changes to the transport rates, a growth or a decay
of the bed forms is expected. An estimate on the growth or decay of the bed forms
following a change in the transport capacity is connected with significant uncertain-
ty. The estimates are based on a theory developed by (Fredsøe 1982 and Deigaard
and Fredsøe 1992) for dunes in a unidirectional and steady current (such as river
flow):
( )
H is the bed form height, D is the water depth, ’ is the non-dimensional skin fric-
tion (called the Shields parameter) and c is the critical skin friction for sediment
mobility (0.045). The equation is illustrated in Figure 5.3. The relationship be-
tween the bed form height and the skin friction implies that the smaller bed forms
will experience a relatively higher impact than the higher bed forms for the same
relative change in the current speed. A 2.5% change in the current velocity is ex-
pected to cause a 3.5-13% change in the height of the bed forms.
The following relation between degree of impact in Section 3.6 and change in near
bed current speeds is used based on the above:
A change in the current speed of 2.5-10% is expected to cause changes to the
bed form heights of 10-25%. Such a change in the height of the bed forms, in the
order of 10%, is classified as a minor degree of impairment according to the cri-
teria in Section 3.6. Within areas of the bed forms there is a natural variation of the
height. The change of 25% of the height is related to the larger bed forms in such
an area as these are the fully developed bed forms. Smaller bed forms may experi-
ence a larger change until they too reach the fully-developed stage.
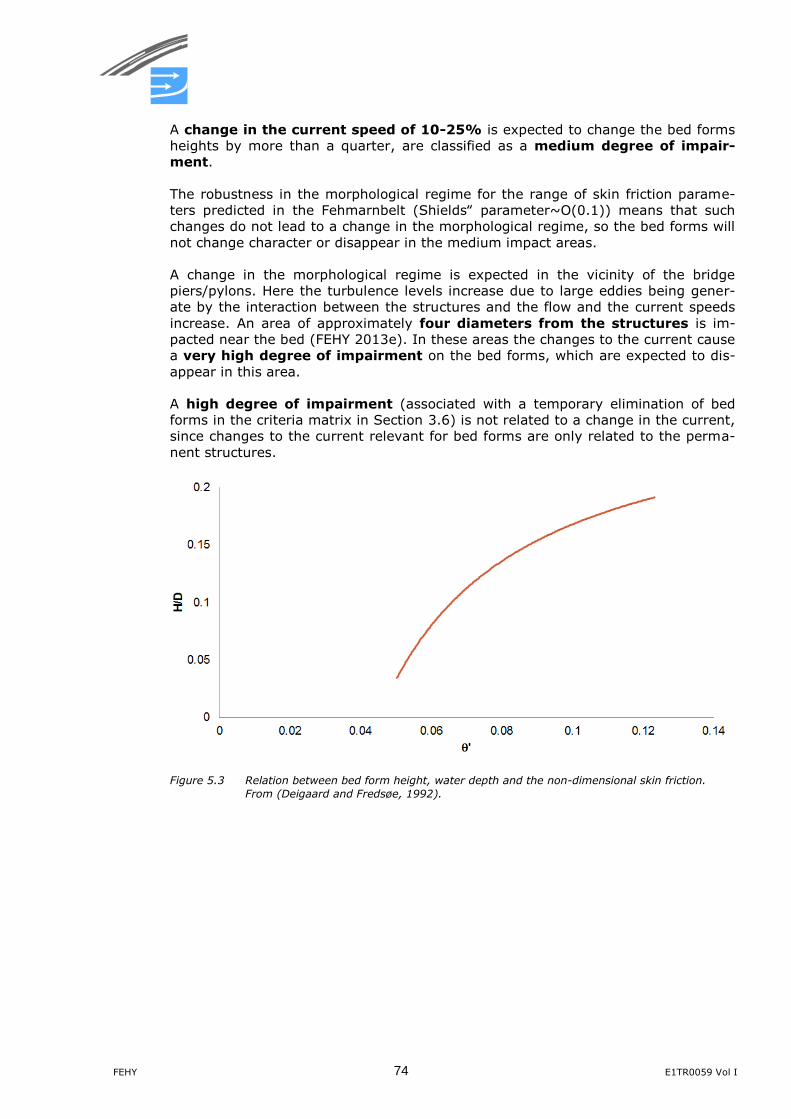
FEHY 74 E1TR0059 Vol I
A change in the current speed of 10-25% is expected to change the bed forms
heights by more than a quarter, are classified as a medium degree of impair-
ment.
The robustness in the morphological regime for the range of skin friction parame-
ters predicted in the Fehmarnbelt (Shields‟ parameter~O(0.1)) means that such
changes do not lead to a change in the morphological regime, so the bed forms will
not change character or disappear in the medium impact areas.
A change in the morphological regime is expected in the vicinity of the bridge
piers/pylons. Here the turbulence levels increase due to large eddies being gener-
ate by the interaction between the structures and the flow and the current speeds
increase. An area of approximately four diameters from the structures is im-
pacted near the bed (FEHY 2013e). In these areas the changes to the current cause
a very high degree of impairment on the bed forms, which are expected to dis-
appear in this area.
A high degree of impairment (associated with a temporary elimination of bed
forms in the criteria matrix in Section 3.6) is not related to a change in the current,
since changes to the current relevant for bed forms are only related to the perma-
nent structures.
Figure 5.3 Relation between bed form height, water depth and the non-dimensional skin friction.
From (Deigaard and Fredsøe, 1992).
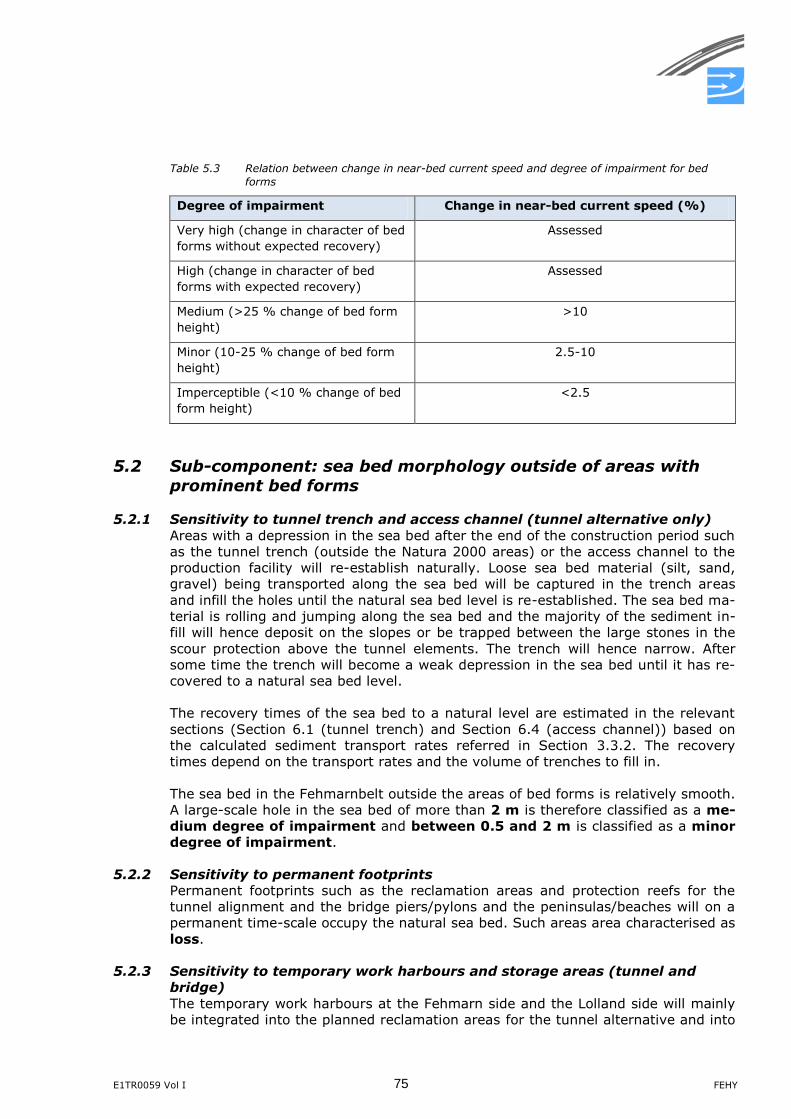
E1TR0059 Vol I 75 FEHY
Table 5.3 Relation between change in near-bed current speed and degree of impairment for bed
forms
Degree of impairment Change in near-bed current speed (%)
Very high (change in character of bed
forms without expected recovery)
Assessed
High (change in character of bed
forms with expected recovery)
Assessed
Medium (>25 % change of bed form
height)
>10
Minor (10-25 % change of bed form
height)
2.5-10
Imperceptible (<10 % change of bed
form height)
<2.5
5.2 Sub-component: sea bed morphology outside of areas with
prominent bed forms
5.2.1 Sensitivity to tunnel trench and access channel (tunnel alternative only)
Areas with a depression in the sea bed after the end of the construction period such
as the tunnel trench (outside the Natura 2000 areas) or the access channel to the
production facility will re-establish naturally. Loose sea bed material (silt, sand,
gravel) being transported along the sea bed will be captured in the trench areas
and infill the holes until the natural sea bed level is re-established. The sea bed ma-
terial is rolling and jumping along the sea bed and the majority of the sediment in-
fill will hence deposit on the slopes or be trapped between the large stones in the
scour protection above the tunnel elements. The trench will hence narrow. After
some time the trench will become a weak depression in the sea bed until it has re-
covered to a natural sea bed level.
The recovery times of the sea bed to a natural level are estimated in the relevant
sections (Section 6.1 (tunnel trench) and Section 6.4 (access channel)) based on
the calculated sediment transport rates referred in Section 3.3.2. The recovery
times depend on the transport rates and the volume of trenches to fill in.
The sea bed in the Fehmarnbelt outside the areas of bed forms is relatively smooth.
A large-scale hole in the sea bed of more than 2 m is therefore classified as a me-
dium degree of impairment and between 0.5 and 2 m is classified as a minor
degree of impairment.
5.2.2 Sensitivity to permanent footprints
Permanent footprints such as the reclamation areas and protection reefs for the
tunnel alignment and the bridge piers/pylons and the peninsulas/beaches will on a
permanent time-scale occupy the natural sea bed. Such areas area characterised as
loss.
5.2.3 Sensitivity to temporary work harbours and storage areas (tunnel and
bridge)
The temporary work harbours at the Fehmarn side and the Lolland side will mainly
be integrated into the planned reclamation areas for the tunnel alternative and into
FEHY 76 E1TR0059 Vol I
the peninsulas/beaches for the bridge alternative. Within these areas the natural
sea bed will be lost as part of the permanent footprints described above.
The following information is available about the dismantling/removal process:
Tunnel alternative
Two work harbours are planned: one on the German side at Puttgarden and one on
the Danish side at Rødbyhavn. Both these harbours will be integrated into the
planned reclamation areas. Upon completion of the tunnel construction works, they
will be dismantled/removed and backfilled (Femern A/S 2011).
Bridge alternative
The harbours and work yards are temporary. After completion of the construction,
quay walls, breakwaters, buildings and pavements will be removed (Femern A/S
2011).
It is assumed that the sea bed in the areas of the work harbours and storage areas,
which are outside the permanent footprints (primarily where harbour breakwaters
are removed), are re-established upon completion of the tunnel or bridge construc-
tion works, respectively, and dismantling/removal of structures. Backfilling (only in-
formed for the tunnel) with sea bed material with a composition comparable to the
natural sea bed material and to the natural depths is assumed.
The sea bed will recover to the natural state within a few years (<5 years). The
natural sediment transport processes in the areas (FEHY 2013a) will smooth out
and recover the sea bed to its natural morphology. For sea bed morphology the
time scale of impact is small and the impact is therefore classified as a minor de-
gree of impairment.
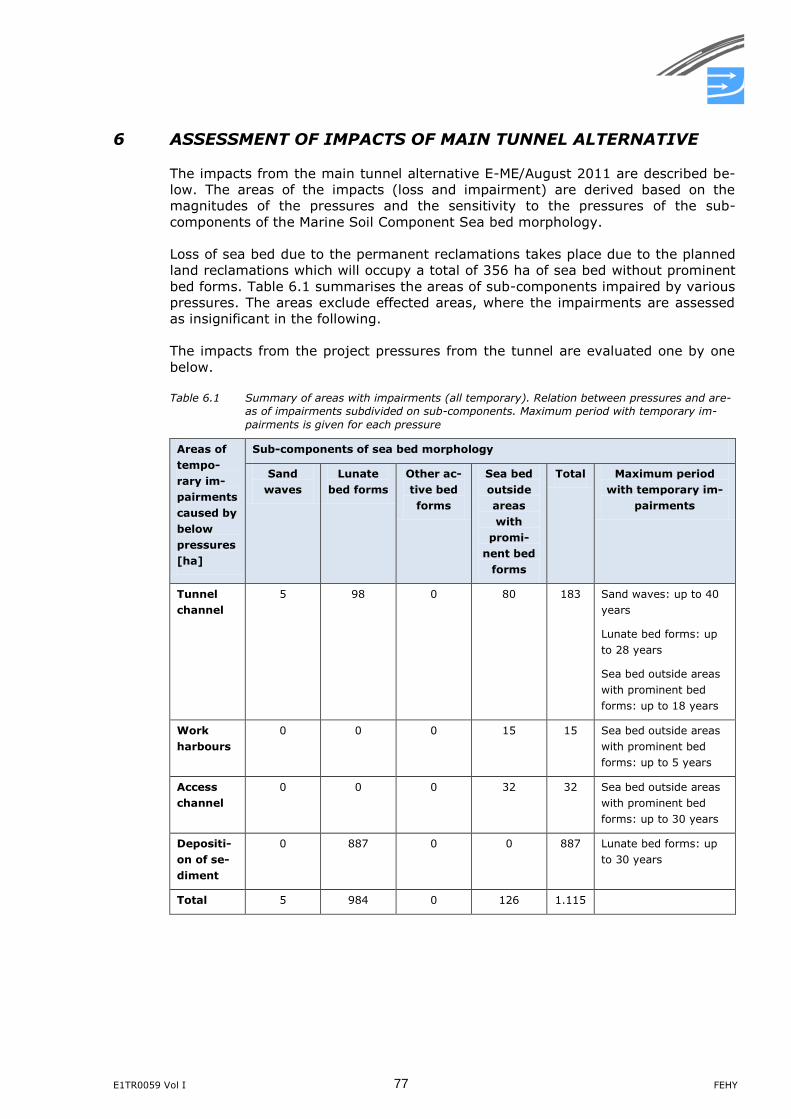
E1TR0059 Vol I 77 FEHY
6 ASSESSMENT OF IMPACTS OF MAIN TUNNEL ALTERNATIVE
The impacts from the main tunnel alternative E-ME/August 2011 are described be-
low. The areas of the impacts (loss and impairment) are derived based on the
magnitudes of the pressures and the sensitivity to the pressures of the sub-
components of the Marine Soil Component Sea bed morphology.
Loss of sea bed due to the permanent reclamations takes place due to the planned
land reclamations which will occupy a total of 356 ha of sea bed without prominent
bed forms. Table 6.1 summarises the areas of sub-components impaired by various
pressures. The areas exclude effected areas, where the impairments are assessed
as insignificant in the following.
The impacts from the project pressures from the tunnel are evaluated one by one
below.
Table 6.1 Summary of areas with impairments (all temporary). Relation between pressures and are-
as of impairments subdivided on sub-components. Maximum period with temporary im-
pairments is given for each pressure
Areas of
tempo-
rary im-
pairments
caused by
below
pressures
[ha]
Sub-components of sea bed morphology
Sand
waves
Lunate
bed forms
Other ac-
tive bed
forms
Sea bed
outside
areas
with
promi-
nent bed
forms
Total Maximum period
with temporary im-
pairments
Tunnel
channel
5 98 0 80 183 Sand waves: up to 40
years
Lunate bed forms: up
to 28 years
Sea bed outside areas
with prominent bed
forms: up to 18 years
Work
harbours
0 0 0 15 15 Sea bed outside areas
with prominent bed
forms: up to 5 years
Access
channel
0 0 0 32 32 Sea bed outside areas
with prominent bed
forms: up to 30 years
Depositi-
on of se-
diment
0 887 0 0 887 Lunate bed forms: up
to 30 years
Total 5 984 0 126 1.115
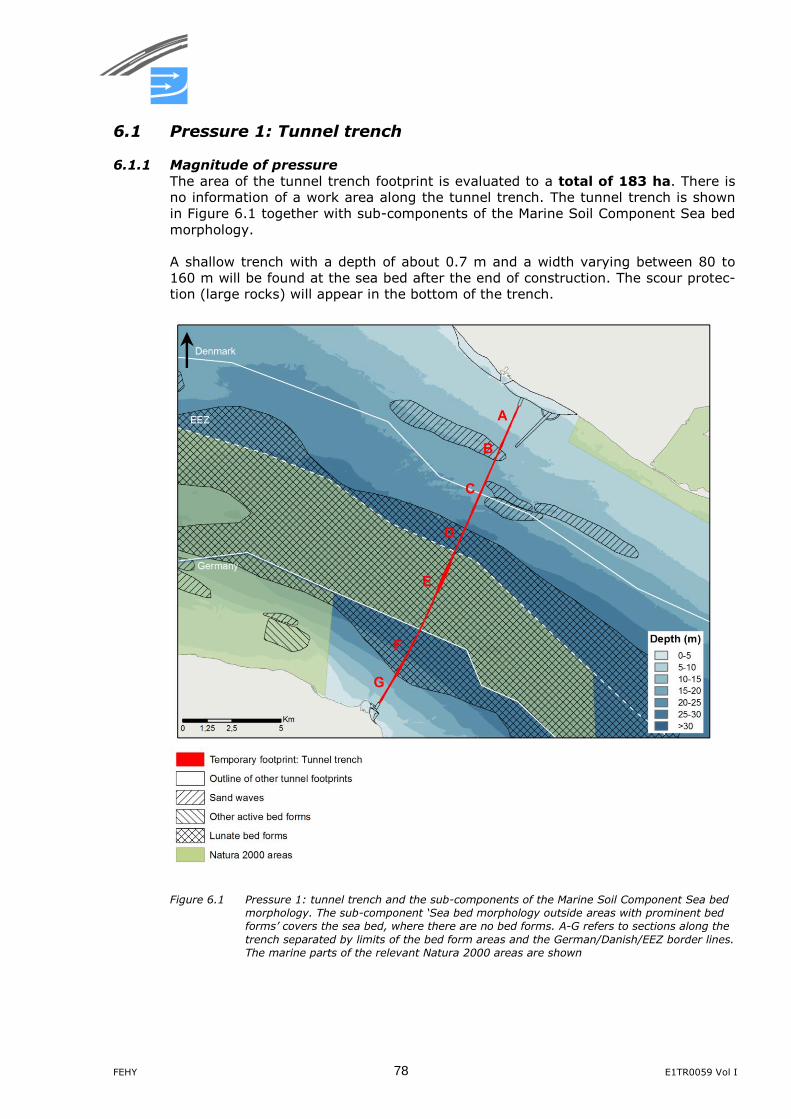
FEHY 78 E1TR0059 Vol I
6.1 Pressure 1: Tunnel trench
6.1.1 Magnitude of pressure
The area of the tunnel trench footprint is evaluated to a total of 183 ha. There is
no information of a work area along the tunnel trench. The tunnel trench is shown
in Figure 6.1 together with sub-components of the Marine Soil Component Sea bed
morphology.
A shallow trench with a depth of about 0.7 m and a width varying between 80 to
160 m will be found at the sea bed after the end of construction. The scour protec-
tion (large rocks) will appear in the bottom of the trench.
Figure 6.1 Pressure 1: tunnel trench and the sub-components of the Marine Soil Component Sea bed
morphology. The sub-component ‘Sea bed morphology outside areas with prominent bed
forms’ covers the sea bed, where there are no bed forms. A-G refers to sections along the
trench separated by limits of the bed form areas and the German/Danish/EEZ border lines.
The marine parts of the relevant Natura 2000 areas are shown
E1TR0059 Vol I 79 FEHY
6.1.2 Loss and degree of impairment
The impacts from the tunnel trench are of a temporary character as the sea bed
sub-components are expected to fully recover along all parts of the trench.
Degree of impairment
A total area of 183 ha is impaired by the tunnel trench.
The tunnel trench cuts through the tip of the area with large sand waves west of
the alignment in the Danish territory and through the area of lunate bed forms in
the German as well as the Danish territory.
The impaired areas caused by the tunnel trench for each of the sub-components
are supplied in Table 6.3 in the following Section 6.1.3. The areas are given as a to-
tal area (in ha) and as parts of the relevant sub-component within an area extend-
ing 10 ha east and west of the alignment, see Figure 6.2 (local zone + near zone).
A total of 98 ha of lunate bed forms are impaired by the tunnel trench of which 56
are within the Natura 2000 area. 5 ha of sand wave area are impaired, and 80 ha of
sea bed outside the areas of bed forms are impaired.
The sea bed is expected to fully recover to its natural state in the area of the lunate
bed forms, but the bed forms may temporarily have a character more similar to
sand waves as described in Section 5.1.1. The protection layer will be exposed oc-
casionally in Section B, where the tunnel trench cuts through the sand wave area
with the large sand waves west of the alignment.
Recovery times
The processes for recovery of the sub-components were described above in Chapter
5 on sensitivity. The recovery times of the sub-components depend on the infill
times of the trench and time for recovery of the bed forms.
The estimates of the recovery time of the tunnel trench to a natural state are there-
fore carried out in two steps. Step 1 is a calculation of the time it takes for the ar-
ea of trench to return to a natural sea bed level. Step 2 is an estimation of the
time it takes for the bed forms to recover into a fully-developed stage. These time
estimates were discussed in Section 5.1.1 for different areas of bed forms near the
alignment. For the sub-component ‘Sea bed outside of areas with prominent bed
forms’ Step 1 is sufficient.
Step 1 is calculated as the time it takes for the natural sediment transport along
the sea bed to backfill the trench. All sediment moving along the sea bed is ex-
pected to infill the trench as described in Chapter 5.
The trench/hole will on a time scale of a few years turn into a depression in the sea
bed. The estimated time scales for the trench to backfill into a natural sea bed level
are estimated and supplied in Table 6.2 for various sections of the trench. The sec-
tions of the trench are selected based on the presence of bed forms and whether it
is within/outside Natura 2000.
The time scales are estimated based on the calculations of annual gross sediment
transport rates in the alignment area (Figure 3.7) and the depth of the trench. A
depth of 0.7 m is used for the entire stretch. The backfilling rates in Table 6.2 are
given as annual reductions in the width of the trench for the individual sections
along the trench. It is assumed that the sediment is distributed evenly on the slope
FEHY 80 E1TR0059 Vol I
of the bed, see Figure 5.2. The backfilling rates in volumes per metre of the trench
are also supplied in the table.
The backfilling rates are very sensitive to the grain sizes of the sea bed material. As
the sea bed material is found to vary in a patchy manner in the tunnel alignment
area, the transport rates may vary considerably within short stretches. Further-
more, calculated sediment transport rates are in general evaluated with an accura-
cy of about a factor of two as mentioned in Section 3.3.2. These are the reason for
the large span given in the infill rates and the recovery times.
In areas with prominent bed forms (sand waves or lunate bed forms, Sections B, D
and F) these will regenerate in the deposited material and by bed forms from the
sides migrating across the trench as further described in Section 5.1.1.
The recovery times for the bed forms were evaluated in Section 5.1.1. Lunate bed
forms in the alignment area were estimated to recover in 15-20 years from a plane
bed and the impacted sand waves west of the alignment area were estimated to re-
cover in 30-40 years from a plane bed.
The bed forms will re-establish along with the natural backfilling of the trench. The
total time for recovery of the sea bed forms in the area is therefore less than the
sum of a complete backfill of the trench and the time for recovery of the bed forms
from a plane bed. If the backfilling time of the trench is less than the recovery
times of the bed forms, it can be assumed that the sea bed with the bed forms re-
generates in about the same time as bed forms from a plane bed. In the case,
where the trench may take longer to regenerate than the recovery time for the bed
forms (Section E and F, only), the sea bed with the bed forms can be assumed to
be recovered once the trench has filled in. The time estimates are provided in Table
6.2.
Degree of impairment
The degree of impairment caused by the tunnel trench is found by applying the as-
sessment criteria described in Section 3.6.
The degree of impairment is high for all areas of the lunate bed forms. They are
predicted to recover in less than about 20-28 years after the end of construction,
which means they are considered temporarily eliminated.
The impaired area with sand waves in the Danish territory is also classified as im-
paired to a high degree. The sand waves are predicted to recover within 30-40
years as described above.
For the sea bed outside of the bed form areas, the impact is classified as “minor”
due to the lowering of the sea bed level by about 0.7 m.
The degrees of impairment are indicated in Table 6.2 for individual sections of the
trench.
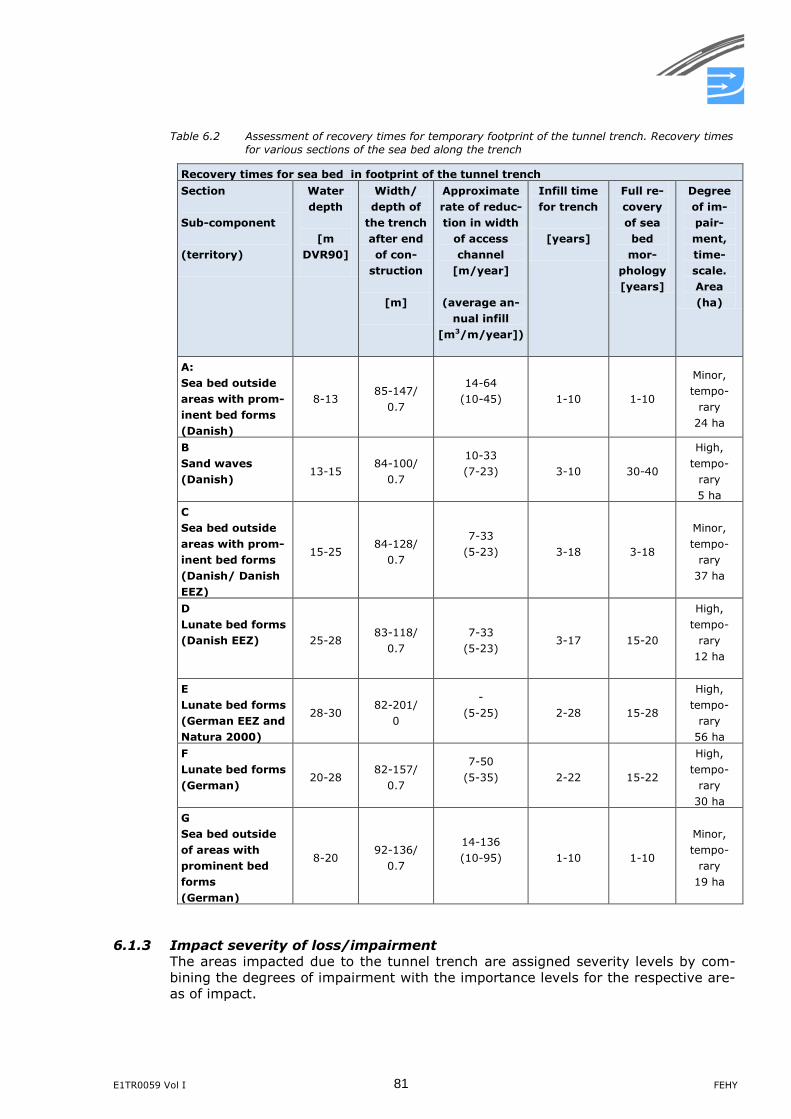
E1TR0059 Vol I 81 FEHY
Table 6.2 Assessment of recovery times for temporary footprint of the tunnel trench. Recovery times
for various sections of the sea bed along the trench
Recovery times for sea bed in footprint of the tunnel trench
Section
Sub-component
(territory)
Water
depth
[m
DVR90]
Width/
depth of
the trench
after end
of con-
struction
[m]
Approximate
rate of reduc-
tion in width
of access
channel
[m/year]
(average an-
nual infill
[m3/m/year])
Infill time
for trench
[years]
Full re-
covery
of sea
bed
mor-
phology
[years]
Degree
of im-
pair-
ment,
time-
scale.
Area
(ha)
A:
Sea bed outside
areas with prom-
inent bed forms
(Danish)
8-13 85-147/
0.7
14-64
(10-45) 1-10 1-10
Minor,
tempo-
rary
24 ha
B
Sand waves
(Danish) 13-15
84-100/
0.7
10-33
(7-23) 3-10 30-40
High,
tempo-
rary
5 ha
C
Sea bed outside
areas with prom-
inent bed forms
(Danish/ Danish
EEZ)
15-25 84-128/
0.7
7-33
(5-23) 3-18 3-18
Minor,
tempo-
rary
37 ha
D
Lunate bed forms
(Danish EEZ) 25-28 83-118/
0.7
7-33
(5-23) 3-17 15-20
High,
tempo-
rary
12 ha
E
Lunate bed forms
(German EEZ and
Natura 2000)
28-30 82-201/
0
-
(5-25) 2-28 15-28
High,
tempo-
rary
56 ha
F
Lunate bed forms
(German) 20-28
82-157/
0.7
7-50
(5-35) 2-22 15-22
High,
tempo-
rary
30 ha
G
Sea bed outside
of areas with
prominent bed
forms
(German)
8-20 92-136/
0.7
14-136
(10-95) 1-10 1-10
Minor,
tempo-
rary
19 ha
6.1.3 Impact severity of loss/impairment
The areas impacted due to the tunnel trench are assigned severity levels by com-
bining the degrees of impairment with the importance levels for the respective are-
as of impact.
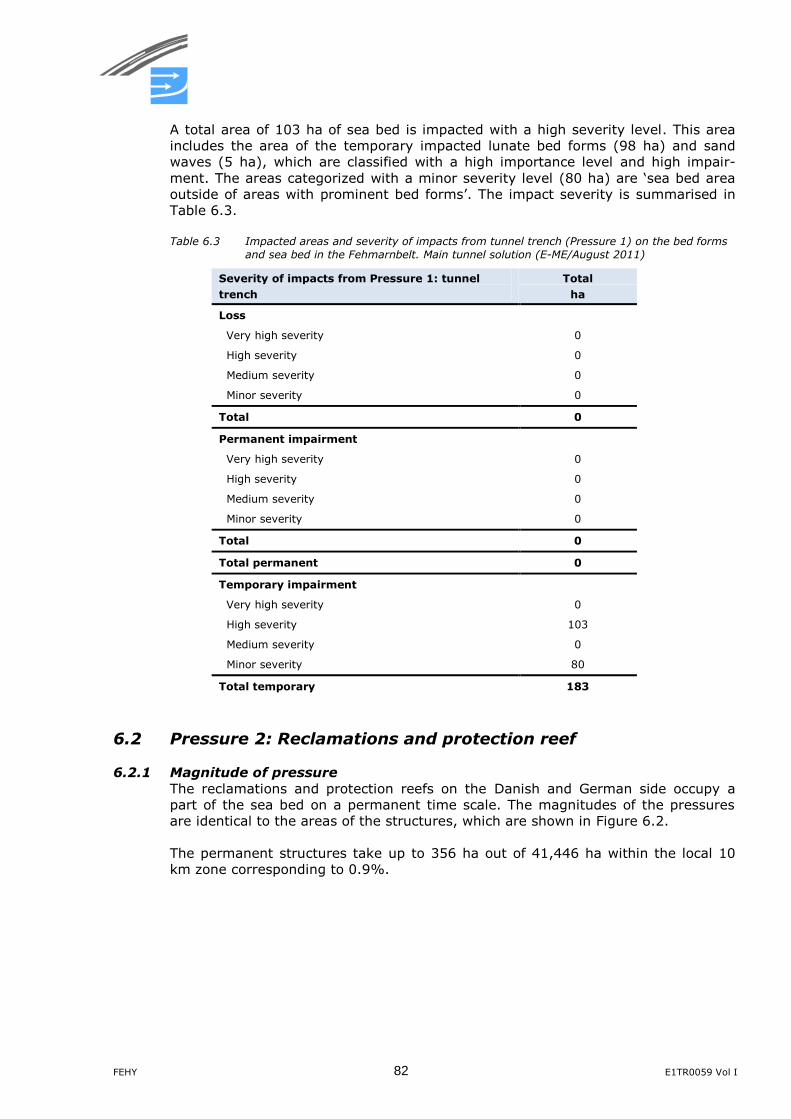
FEHY 82 E1TR0059 Vol I
A total area of 103 ha of sea bed is impacted with a high severity level. This area
includes the area of the temporary impacted lunate bed forms (98 ha) and sand
waves (5 ha), which are classified with a high importance level and high impair-
ment. The areas categorized with a minor severity level (80 ha) are ‘sea bed area
outside of areas with prominent bed forms’. The impact severity is summarised in
Table 6.3.
Table 6.3 Impacted areas and severity of impacts from tunnel trench (Pressure 1) on the bed forms
and sea bed in the Fehmarnbelt. Main tunnel solution (E-ME/August 2011)
Severity of impacts from Pressure 1: tunnel
trench
Total
ha
Loss
Very high severity 0
High severity 0
Medium severity 0
Minor severity 0
Total 0
Permanent impairment
Very high severity 0
High severity 0
Medium severity 0
Minor severity 0
Total 0
Total permanent 0
Temporary impairment
Very high severity 0
High severity 103
Medium severity 0
Minor severity 80
Total temporary 183
6.2 Pressure 2: Reclamations and protection reef
6.2.1 Magnitude of pressure
The reclamations and protection reefs on the Danish and German side occupy a
part of the sea bed on a permanent time scale. The magnitudes of the pressures
are identical to the areas of the structures, which are shown in Figure 6.2.
The permanent structures take up to 356 ha out of 41,446 ha within the local 10
km zone corresponding to 0.9%.
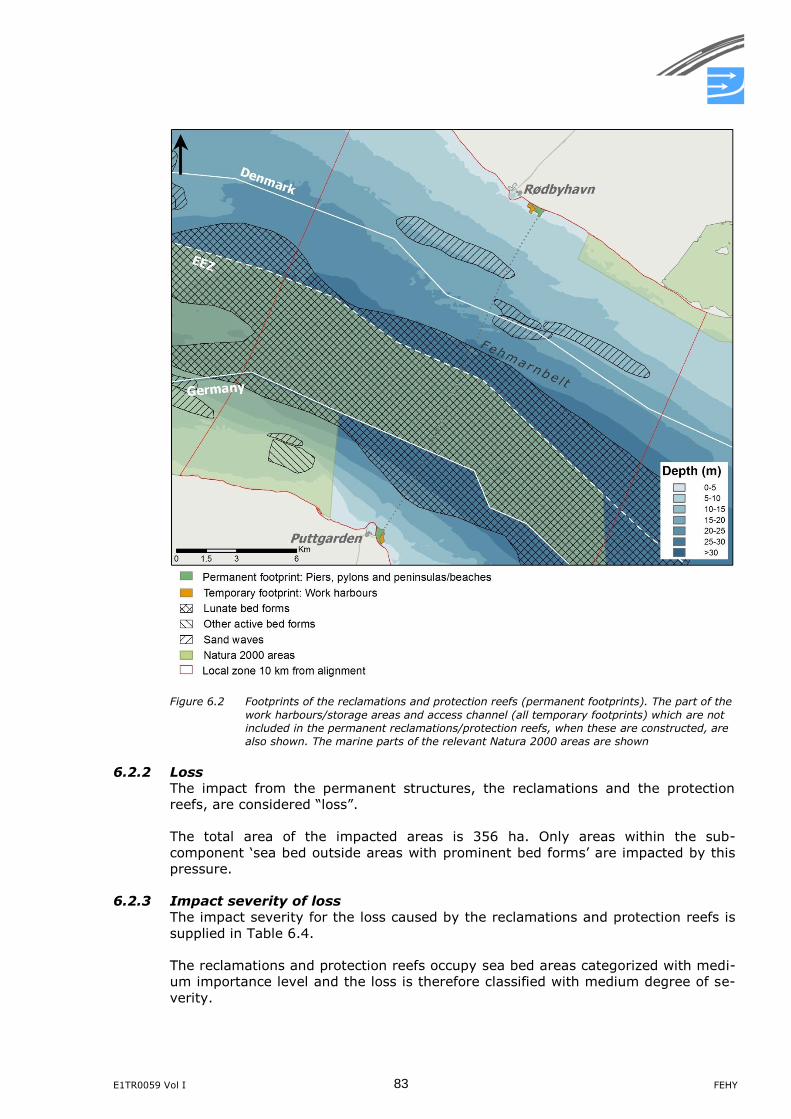
E1TR0059 Vol I 83 FEHY
Figure 6.2 Footprints of the reclamations and protection reefs (permanent footprints). The part of the
work harbours/storage areas and access channel (all temporary footprints) which are not
included in the permanent reclamations/protection reefs, when these are constructed, are
also shown. The marine parts of the relevant Natura 2000 areas are shown
6.2.2 Loss
The impact from the permanent structures, the reclamations and the protection
reefs, are considered “loss”.
The total area of the impacted areas is 356 ha. Only areas within the sub-
component ‘sea bed outside areas with prominent bed forms’ are impacted by this
pressure.
6.2.3 Impact severity of loss
The impact severity for the loss caused by the reclamations and protection reefs is
supplied in Table 6.4.
The reclamations and protection reefs occupy sea bed areas categorized with medi-
um importance level and the loss is therefore classified with medium degree of se-
verity.
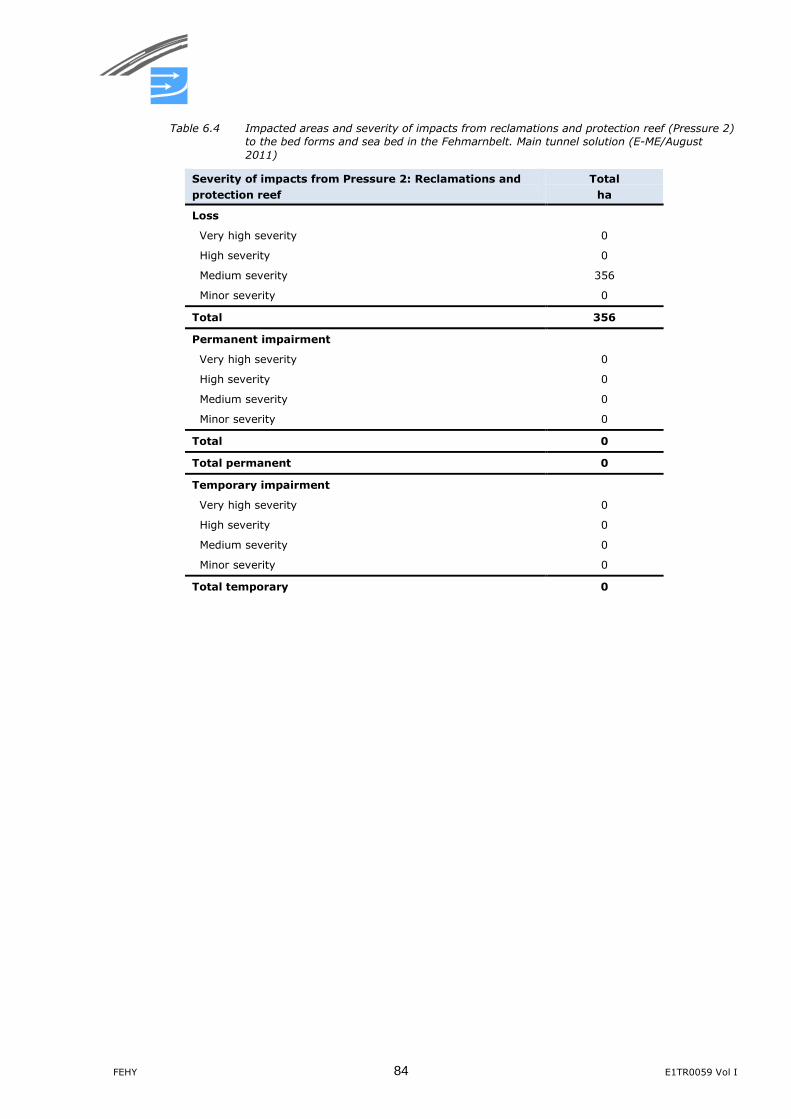
FEHY 84 E1TR0059 Vol I
Table 6.4 Impacted areas and severity of impacts from reclamations and protection reef (Pressure 2)
to the bed forms and sea bed in the Fehmarnbelt. Main tunnel solution (E-ME/August
2011)
Severity of impacts from Pressure 2: Reclamations and
protection reef
Total
ha
Loss
Very high severity 0
High severity 0
Medium severity 356
Minor severity 0
Total 356
Permanent impairment
Very high severity 0
High severity 0
Medium severity 0
Minor severity 0
Total 0
Total permanent 0
Temporary impairment
Very high severity 0
High severity 0
Medium severity 0
Minor severity 0
Total temporary 0
E1TR0059 Vol I 85 FEHY
6.3 Pressure 3: Temporary work harbours and storage areas
6.3.1 Magnitude of pressure
The magnitude of the pressures from the temporary work harbours and storage ar-
eas are identical to the area they cover, a total of 15 ha. Only the area of the work
harbours and storage areas, which are not integrated into the permanent structures
are assessed, refer to discussion in Section 2.2 on relevant project pressures.
These areas were shown in Figure 6.2 in the previous section.
These areas include primarily breakwaters protecting the work harbours on the
German as well as the Danish side during construction and on the German side also
a small part of the storage area east of the harbour, a total of approximately 7.3 ha
at the German side and 7.2 ha at the Danish side.
6.3.2 Degree of impairment
The areas of the breakwaters and storage areas are expected to recover after the
structures are dismantled and the sea bed re-established by active backfilling. The
impact is therefore considered temporary impairment of the sea bed. It is expected
that the sea bed morphology will recover to a natural state within a time scale of
about 5 years, refer to the discussion on sensitivity in Section 5.2.3.
The degree of impairment for these areas is classified as minor according to the as-
sessment criteria in Section 3.6.
6.3.3 Impact severity of impairment
The impaired areas (15 ha) are all classified with a minor degree of severity, see
Table 6.5, as a combination of the minor degree of impairment and the medium
importance level sea bed areas off Puttgarden and Rødbyhavn.
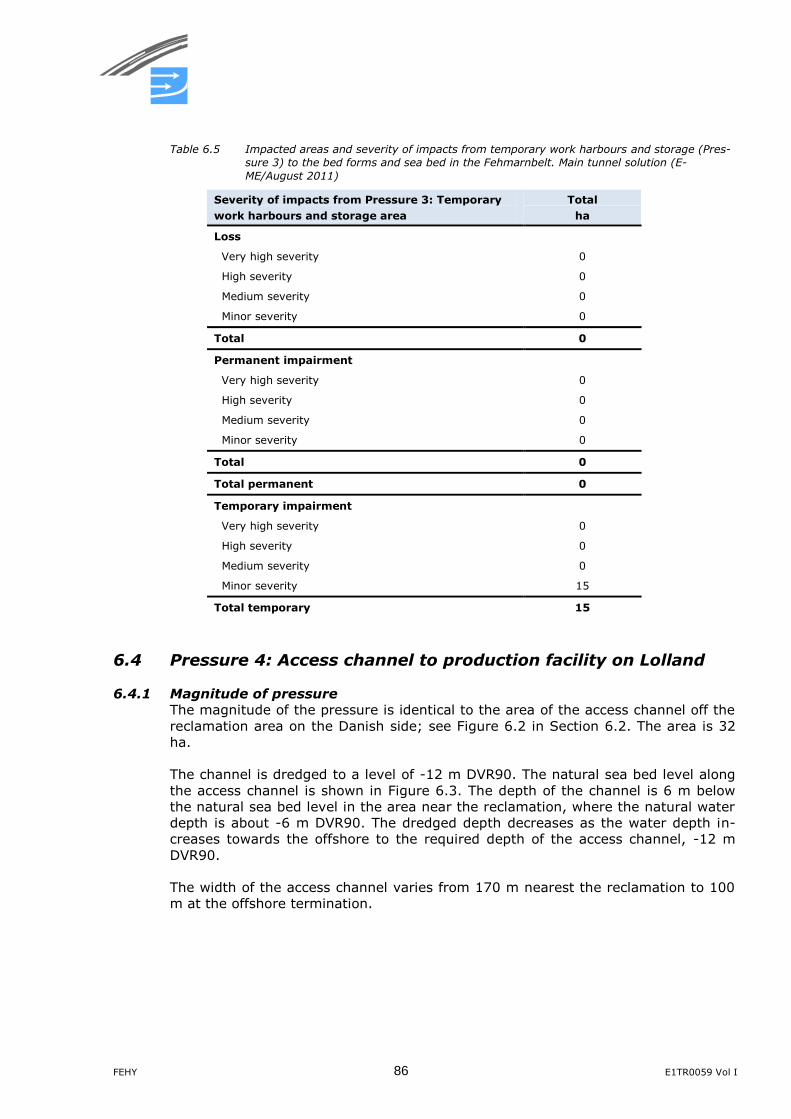
FEHY 86 E1TR0059 Vol I
Table 6.5 Impacted areas and severity of impacts from temporary work harbours and storage (Pres-
sure 3) to the bed forms and sea bed in the Fehmarnbelt. Main tunnel solution (E-
ME/August 2011)
Severity of impacts from Pressure 3: Temporary
work harbours and storage area
Total
ha
Loss
Very high severity 0
High severity 0
Medium severity 0
Minor severity 0
Total 0
Permanent impairment
Very high severity 0
High severity 0
Medium severity 0
Minor severity 0
Total 0
Total permanent 0
Temporary impairment
Very high severity 0
High severity 0
Medium severity 0
Minor severity 15
Total temporary 15
6.4 Pressure 4: Access channel to production facility on Lolland
6.4.1 Magnitude of pressure
The magnitude of the pressure is identical to the area of the access channel off the
reclamation area on the Danish side; see Figure 6.2 in Section 6.2. The area is 32
ha.
The channel is dredged to a level of -12 m DVR90. The natural sea bed level along
the access channel is shown in Figure 6.3. The depth of the channel is 6 m below
the natural sea bed level in the area near the reclamation, where the natural water
depth is about -6 m DVR90. The dredged depth decreases as the water depth in-
creases towards the offshore to the required depth of the access channel, -12 m
DVR90.
The width of the access channel varies from 170 m nearest the reclamation to 100
m at the offshore termination.
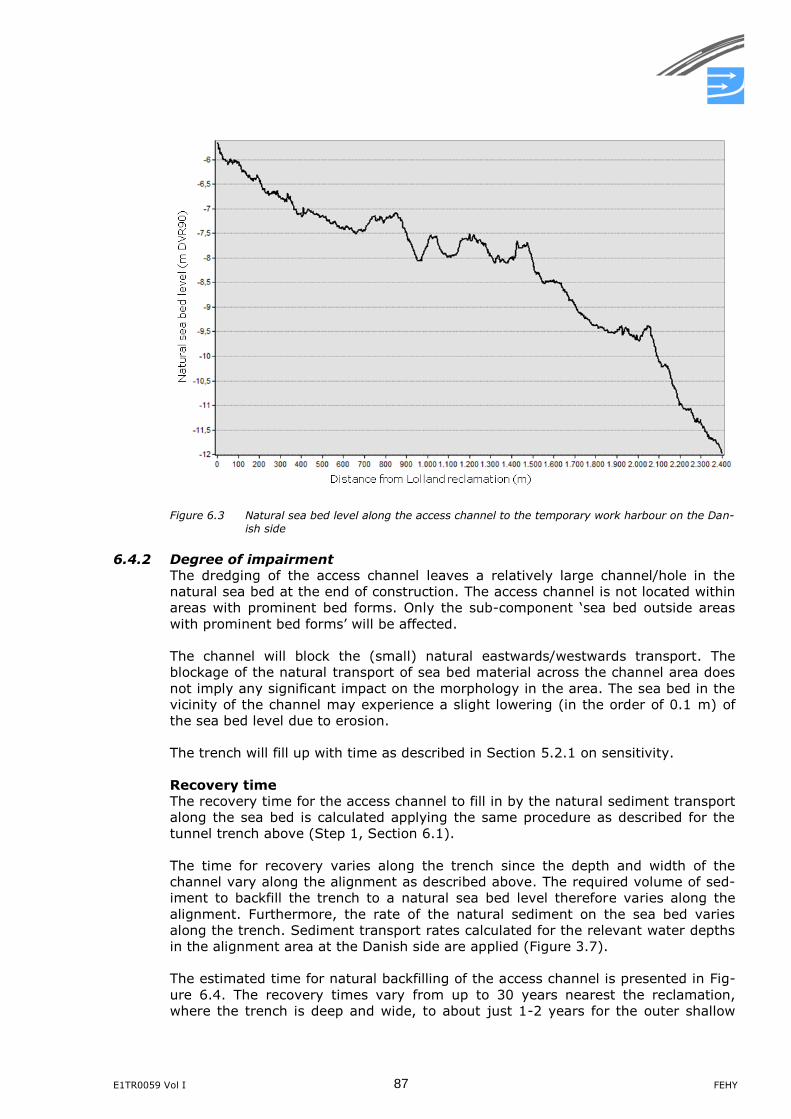
E1TR0059 Vol I 87 FEHY
Figure 6.3 Natural sea bed level along the access channel to the temporary work harbour on the Dan-
ish side
6.4.2 Degree of impairment
The dredging of the access channel leaves a relatively large channel/hole in the
natural sea bed at the end of construction. The access channel is not located within
areas with prominent bed forms. Only the sub-component ‘sea bed outside areas
with prominent bed forms’ will be affected.
The channel will block the (small) natural eastwards/westwards transport. The
blockage of the natural transport of sea bed material across the channel area does
not imply any significant impact on the morphology in the area. The sea bed in the
vicinity of the channel may experience a slight lowering (in the order of 0.1 m) of
the sea bed level due to erosion.
The trench will fill up with time as described in Section 5.2.1 on sensitivity.
Recovery time
The recovery time for the access channel to fill in by the natural sediment transport
along the sea bed is calculated applying the same procedure as described for the
tunnel trench above (Step 1, Section 6.1).
The time for recovery varies along the trench since the depth and width of the
channel vary along the alignment as described above. The required volume of sed-
iment to backfill the trench to a natural sea bed level therefore varies along the
alignment. Furthermore, the rate of the natural sediment on the sea bed varies
along the trench. Sediment transport rates calculated for the relevant water depths
in the alignment area at the Danish side are applied (Figure 3.7).
The estimated time for natural backfilling of the access channel is presented in Fig-
ure 6.4. The recovery times vary from up to 30 years nearest the reclamation,
where the trench is deep and wide, to about just 1-2 years for the outer shallow
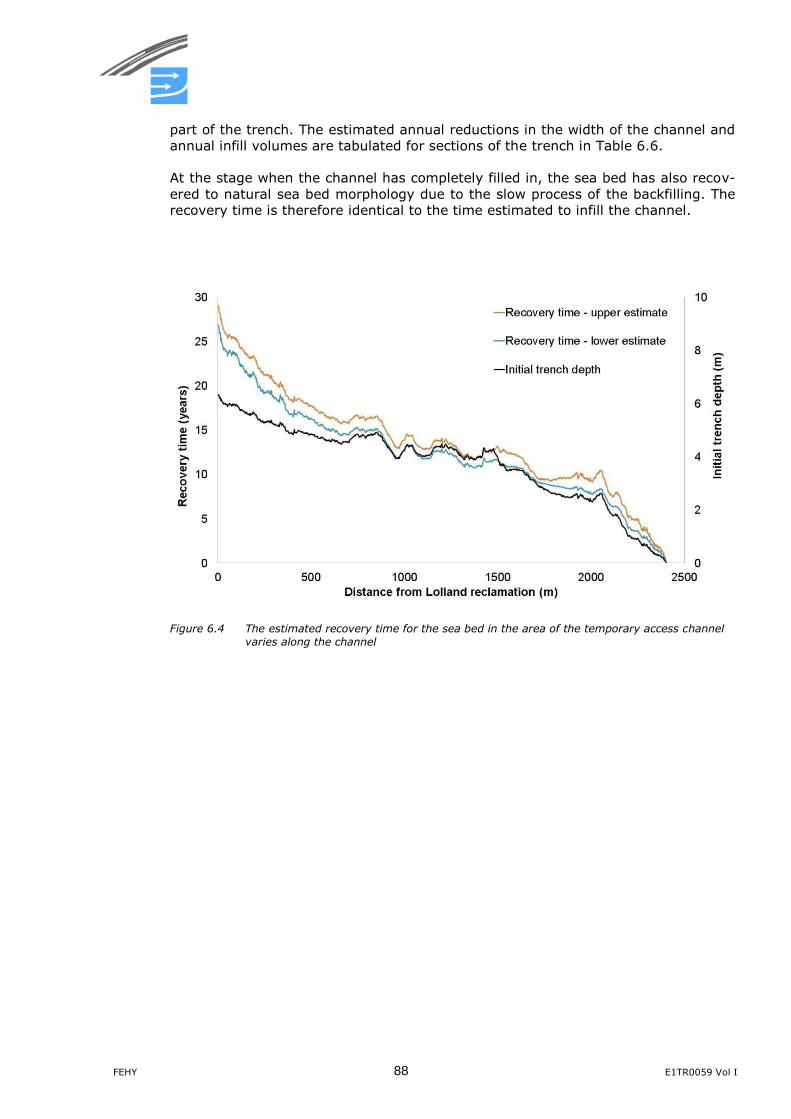
FEHY 88 E1TR0059 Vol I
part of the trench. The estimated annual reductions in the width of the channel and
annual infill volumes are tabulated for sections of the trench in Table 6.6.
At the stage when the channel has completely filled in, the sea bed has also recov-
ered to natural sea bed morphology due to the slow process of the backfilling. The
recovery time is therefore identical to the time estimated to infill the channel.
Figure 6.4 The estimated recovery time for the sea bed in the area of the temporary access channel
varies along the channel
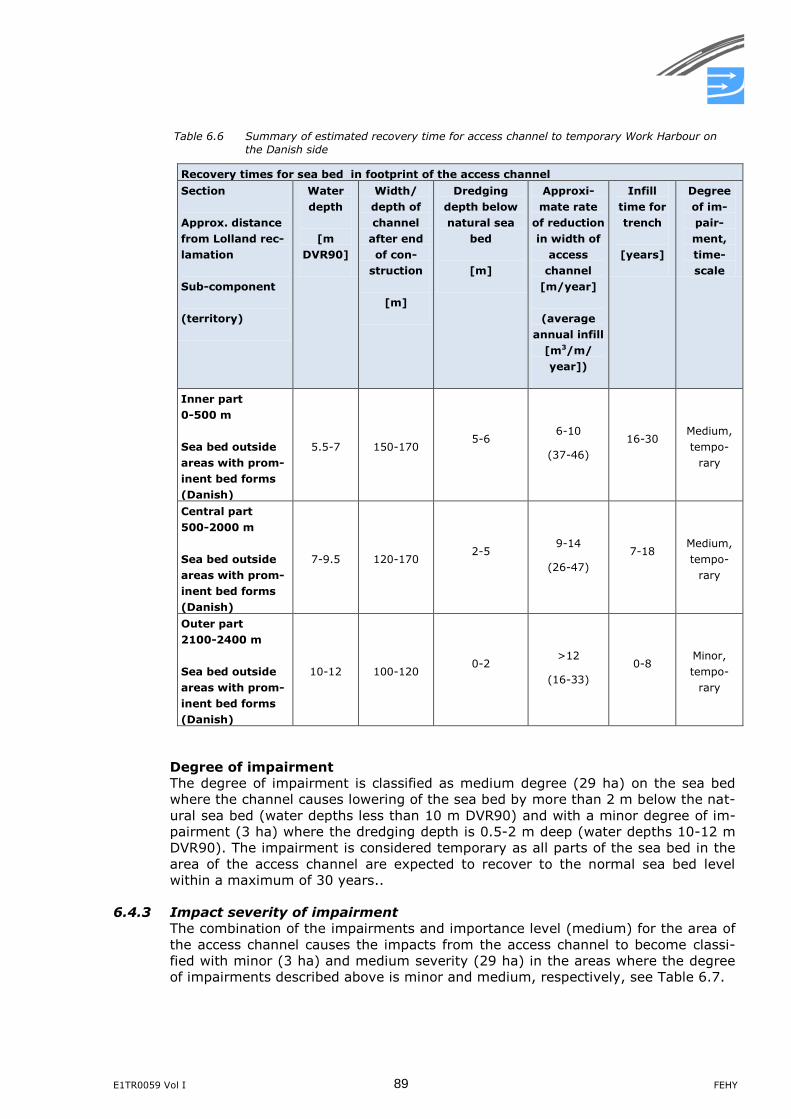
E1TR0059 Vol I 89 FEHY
Table 6.6 Summary of estimated recovery time for access channel to temporary Work Harbour on
the Danish side
Recovery times for sea bed in footprint of the access channel
Section
Approx. distance
from Lolland rec-
lamation
Sub-component
(territory)
Water
depth
[m
DVR90]
Width/
depth of
channel
after end
of con-
struction
[m]
Dredging
depth below
natural sea
bed
[m]
Approxi-
mate rate
of reduction
in width of
access
channel
[m/year]
(average
annual infill
[m3/m/
year])
Infill
time for
trench
[years]
Degree
of im-
pair-
ment,
time-
scale
Inner part
0-500 m
Sea bed outside
areas with prom-
inent bed forms
(Danish)
5.5-7 150-170 5-6
6-10
(37-46)
16-30 Medium,
tempo-
rary
Central part
500-2000 m
Sea bed outside
areas with prom-
inent bed forms
(Danish)
7-9.5 120-170 2-5
9-14
(26-47)
7-18 Medium,
tempo-
rary
Outer part
2100-2400 m
Sea bed outside
areas with prom-
inent bed forms
(Danish)
10-12 100-120 0-2
>12
(16-33)
0-8 Minor,
tempo-
rary
Degree of impairment
The degree of impairment is classified as medium degree (29 ha) on the sea bed
where the channel causes lowering of the sea bed by more than 2 m below the nat-
ural sea bed (water depths less than 10 m DVR90) and with a minor degree of im-
pairment (3 ha) where the dredging depth is 0.5-2 m deep (water depths 10-12 m
DVR90). The impairment is considered temporary as all parts of the sea bed in the
area of the access channel are expected to recover to the normal sea bed level
within a maximum of 30 years..
6.4.3 Impact severity of impairment
The combination of the impairments and importance level (medium) for the area of
the access channel causes the impacts from the access channel to become classi-
fied with minor (3 ha) and medium severity (29 ha) in the areas where the degree
of impairments described above is minor and medium, respectively, see Table 6.7.
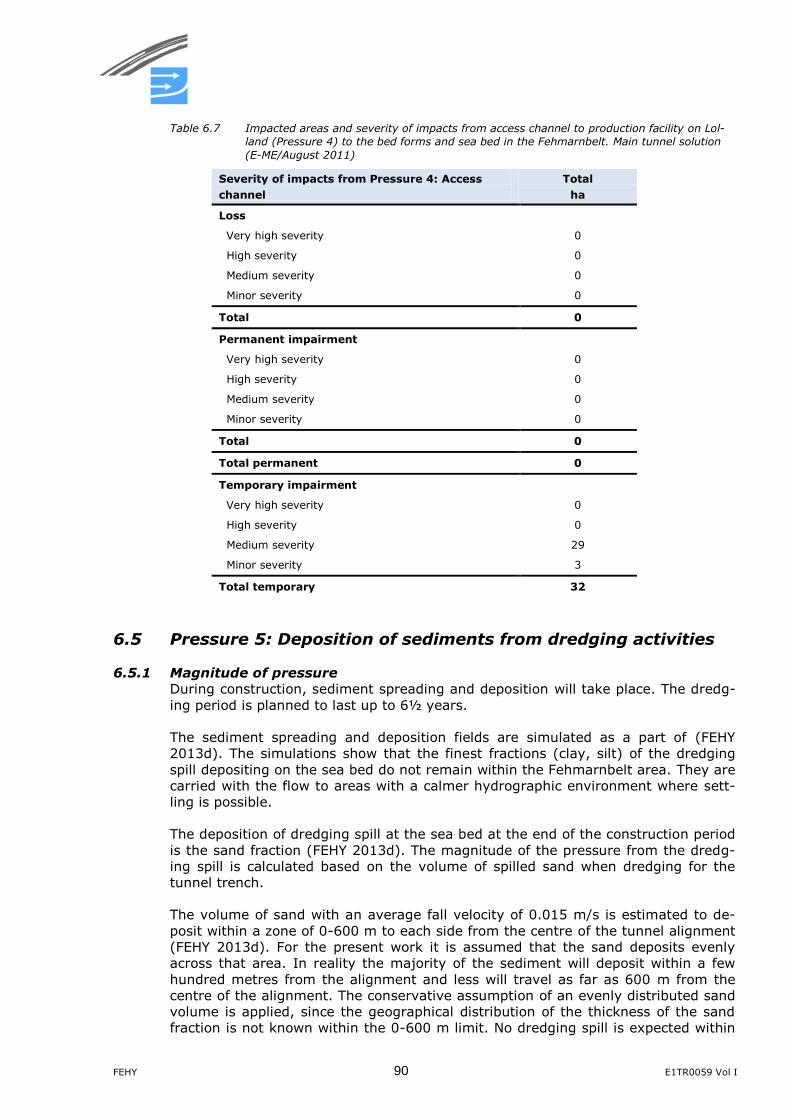
FEHY 90 E1TR0059 Vol I
Table 6.7 Impacted areas and severity of impacts from access channel to production facility on Lol-
land (Pressure 4) to the bed forms and sea bed in the Fehmarnbelt. Main tunnel solution
(E-ME/August 2011)
Severity of impacts from Pressure 4: Access
channel
Total
ha
Loss
Very high severity 0
High severity 0
Medium severity 0
Minor severity 0
Total 0
Permanent impairment
Very high severity 0
High severity 0
Medium severity 0
Minor severity 0
Total 0
Total permanent 0
Temporary impairment
Very high severity 0
High severity 0
Medium severity 29
Minor severity 3
Total temporary 32
6.5 Pressure 5: Deposition of sediments from dredging activities
6.5.1 Magnitude of pressure
During construction, sediment spreading and deposition will take place. The dredg-
ing period is planned to last up to 6½ years.
The sediment spreading and deposition fields are simulated as a part of (FEHY
2013d). The simulations show that the finest fractions (clay, silt) of the dredging
spill depositing on the sea bed do not remain within the Fehmarnbelt area. They are
carried with the flow to areas with a calmer hydrographic environment where sett-
ling is possible.
The deposition of dredging spill at the sea bed at the end of the construction period
is the sand fraction (FEHY 2013d). The magnitude of the pressure from the dredg-
ing spill is calculated based on the volume of spilled sand when dredging for the
tunnel trench.
The volume of sand with an average fall velocity of 0.015 m/s is estimated to de-
posit within a zone of 0-600 m to each side from the centre of the tunnel alignment
(FEHY 2013d). For the present work it is assumed that the sand deposits evenly
across that area. In reality the majority of the sediment will deposit within a few
hundred metres from the alignment and less will travel as far as 600 m from the
centre of the alignment. The conservative assumption of an evenly distributed sand
volume is applied, since the geographical distribution of the thickness of the sand
fraction is not known within the 0-600 m limit. No dredging spill is expected within
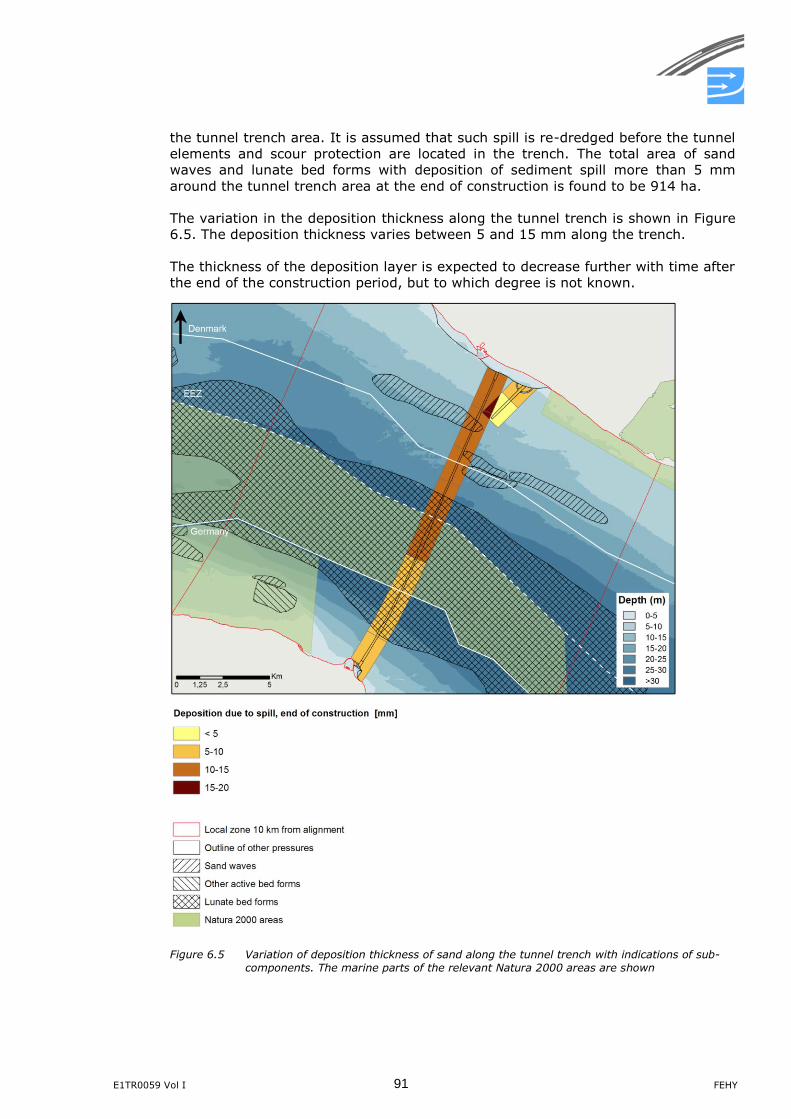
E1TR0059 Vol I 91 FEHY
the tunnel trench area. It is assumed that such spill is re-dredged before the tunnel
elements and scour protection are located in the trench. The total area of sand
waves and lunate bed forms with deposition of sediment spill more than 5 mm
around the tunnel trench area at the end of construction is found to be 914 ha.
The variation in the deposition thickness along the tunnel trench is shown in Figure
6.5. The deposition thickness varies between 5 and 15 mm along the trench.
The thickness of the deposition layer is expected to decrease further with time after
the end of the construction period, but to which degree is not known.
Figure 6.5 Variation of deposition thickness of sand along the tunnel trench with indications of sub-
components. The marine parts of the relevant Natura 2000 areas are shown
FEHY 92 E1TR0059 Vol I
6.5.2 Loss and degree of impairment
The sediment spill is predicted to deposit in the deeper areas of the sand waves and
accumulate around the lunate bed forms. The geometrical properties of the bed
forms will therefore change. For the sub-component ‘Sea bed outside areas with
prominent bed forms’ the deposition is considered to have a negligible effect on the
sea bed morphology as described in Section 2.2.
The impact from the sediment spill is characterised as temporary impairment ac-
cording to the assessment criteria. The bed forms are expected to adjust to their
natural geometrical properties with time.
The deposition volumes are not large enough to cause a temporary elimination of
the bed forms by completely covering them in spill.
Degree of impairment
The relevant sub-component is marked for sections of the trench alignment in Fig-
ure 6.5 together with the deposition thicknesses along the trench.
Sediment will deposit within areas of both of the two sand wave fields near the
alignment in the Danish territory. The sand wave field west of the alignment has
bed forms of a typical height of 1.5-3 m. The calculated deposition in this area is
around 13 mm. With a gathering of the deposited sediment spill in the deeper areas
to a thickness of about 33 mm (see discussion in the chapter on sensitivity, Section
5.1.2) the expected reduction in the height of the sand waves is about 0.5-1%. The
impacts from the dredging deposition to these sand waves are therefore well below
10% of the heights of the bed forms and therefore negligible according to the as-
sessment criteria.
The smaller sand waves to the east of the alignment are typically 0.5-1 m. The
deposition in this area is about 15 mm. After redistribution of the sediment to the
deeper areas, the deposition will reduce the height of the sand waves by 38 mm or
about 8%. The impacts to the height of the sand waves are also less than 10%.
The deposition within the lunate bed forms of 5-10 mm is predicted to add 10-25%
to the volumes of the lunate bed forms (473 ha), and more than 25% where the
deposition is above 10 mm (414 ha). The bed forms are therefore expected to grow
in size. With the predicted rate of deposition, the lunate shape of the bed forms is
expected to remain the dominant shape of the bed forms in the area.
Recovery times
The bed forms are expected to return to their baseline geometrical properties with
time.
Some of the deposited sediment will probably wash out of the bed forms with time.
Some sediment spill will become integrated into bed forms as they migrate, where-
by they will also recover to their natural equilibrium geometrical shape and proper-
ties.
The recovery time for the lunate bed forms is difficult to predict, but it is expected
that the time scale is similar or possibly even slightly larger than re-generation of
the lunate forms from a plane bed (refer to Section 5.1). The effect is expected to
be negligible within 30 years.
Degree of impairment
The degree of impairment is determined based on the assessment criteria in Sec-
tion 3.6.
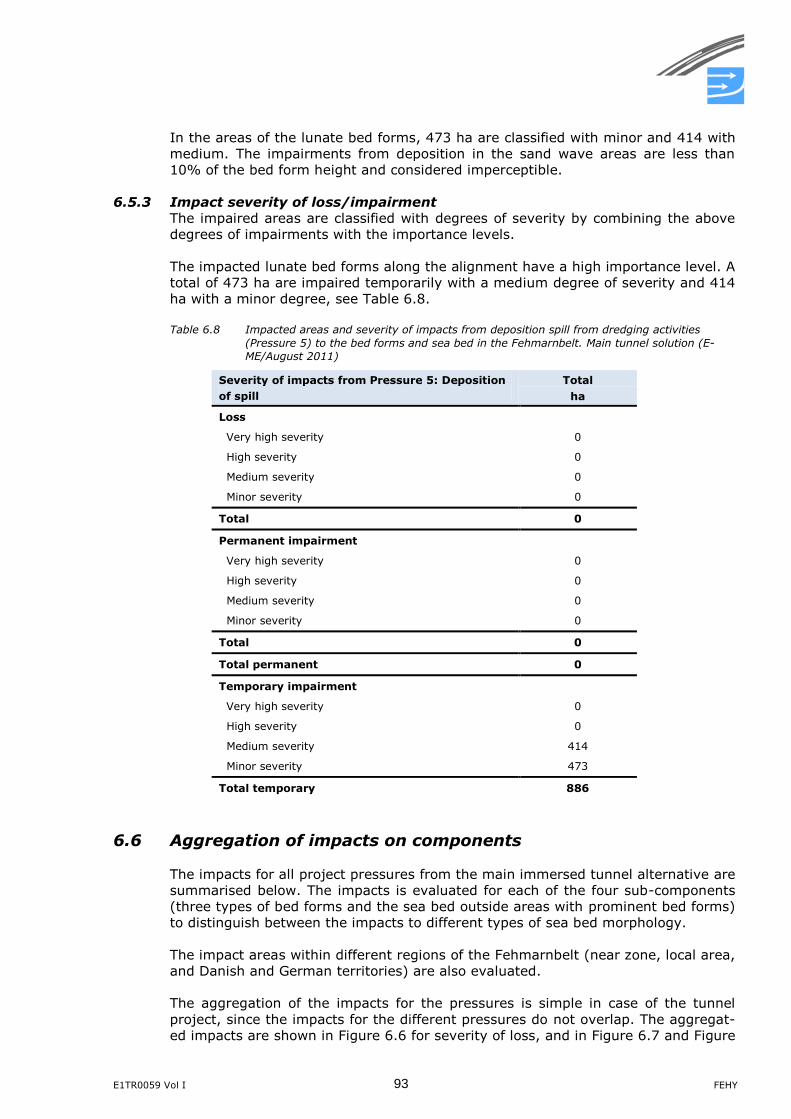
E1TR0059 Vol I 93 FEHY
In the areas of the lunate bed forms, 473 ha are classified with minor and 414 with
medium. The impairments from deposition in the sand wave areas are less than
10% of the bed form height and considered imperceptible.
6.5.3 Impact severity of loss/impairment
The impaired areas are classified with degrees of severity by combining the above
degrees of impairments with the importance levels.
The impacted lunate bed forms along the alignment have a high importance level. A
total of 473 ha are impaired temporarily with a medium degree of severity and 414
ha with a minor degree, see Table 6.8.
Table 6.8 Impacted areas and severity of impacts from deposition spill from dredging activities
(Pressure 5) to the bed forms and sea bed in the Fehmarnbelt. Main tunnel solution (E-
ME/August 2011)
Severity of impacts from Pressure 5: Deposition
of spill
Total
ha
Loss
Very high severity 0
High severity 0
Medium severity 0
Minor severity 0
Total 0
Permanent impairment
Very high severity 0
High severity 0
Medium severity 0
Minor severity 0
Total 0
Total permanent 0
Temporary impairment
Very high severity 0
High severity 0
Medium severity 414
Minor severity 473
Total temporary 886
6.6 Aggregation of impacts on components
The impacts for all project pressures from the main immersed tunnel alternative are
summarised below. The impacts is evaluated for each of the four sub-components
(three types of bed forms and the sea bed outside areas with prominent bed forms)
to distinguish between the impacts to different types of sea bed morphology.
The impact areas within different regions of the Fehmarnbelt (near zone, local area,
and Danish and German territories) are also evaluated.
The aggregation of the impacts for the pressures is simple in case of the tunnel
project, since the impacts for the different pressures do not overlap. The aggregat-
ed impacts are shown in Figure 6.6 for severity of loss, and in Figure 6.7 and Figure
FEHY 94 E1TR0059 Vol I
6.8 for degree of temporary impairments and severity of temporary impairments,
respectively.
6.6.1 Sub-components
Tables providing the impacted areas of the individual sub-components are given be-
low. The impacts are divided into the four impact levels for severity of loss and for
degree of impairments in Table 6.9. Impairments are further divided on the four
impact severity levels in Table 6.10.
It is noted that in all cases the assigned degree of severity of impairments is identi-
cal to the degree of impairments.
The impacts are given in areas (ha) and in parts (%) of the areas of the given sub-
component within 10 km from the alignment (local area + near zone). The total
impacted area (ha) is also provided (in ha) and as part of the total sea bed area
(%) within 10 km from the alignment.
Sand waves
The total area of sand waves within the area within 10 km from the alignment is
1,261 ha. In total 5 ha of these are impaired by the tunnel project. This corre-
sponds to 0.4% of the sand waves.
The impairment of the 5 ha of sand waves is caused by the elimination of the bed
forms during the process of dredging for the tunnel trench. The sand waves will re-
cover, but the large size of the sand waves in the impacted area (sand wave field
west of the tunnel trench in Danish territory) causes a re-generation time of esti-
mated 30-40 years.
None of the sand waves are within Natura 2000.
Lunate bed forms
A total of 984 ha of lunate bed forms are impacted by the main tunnel alternative B
E-E August/2011. This corresponds to 6.7% of the total area of lunate bed forms
within 10 km from the alignment.
The impacts to the lunate bed forms are all of a temporary character. The lunate
bed forms are predicted to recover to their natural condition with time. The lunate
bed forms in the trench alignment (corresponding to the 98 ha impaired with a high
degree of impairment), which are eliminated by the dredging for the trench, will re-
generate above the tunnel trench to a fully developed stage within 15-28 years.
The remaining area of the impaired lunate bed forms is caused by deposition of
dredging spill. This pressure accounts for the temporary impairments classified as
minor (473 ha) and medium (414 ha) degree depending on the deposition thick-
ness in the area. The lunate bed forms are predicted to increase in size in this area
as the deposition spill will gather around the bed forms and become integrated as a
part of the bed forms. Within 30 years, the bed form area is predicted to return to a
stage, where the bed forms have their natural geometrical properties.
Within Natura 2000, 56 ha of lunate bed forms are impaired temporarily to a high
degree, 267 ha to a medium degree and 195 ha to a minor degree.
In summary, the majority (90%) of the impacted lunate bed forms will remain in
the area, with a minor-medium change of geometrical properties which will gradu-
ally return to natural conditions. The remaining part of the bed forms is temporarily
eliminated but will re-generate within 30 years or less.
E1TR0059 Vol I 95 FEHY
Other active bed forms
No areas with ‘other active bed forms’ are impacted.
Sea bed outside of areas with prominent bed forms
482 ha outside of areas with prominent bed forms corresponding to 1.9% of the ar-
ea without such morphological features are impacted by the tunnel project. The im-
pacts are primarily a loss of sea bed (356 ha) where the new reclamations and pro-
tection reefs (primarily on the Danish side) are planned.
The remaining 126 ha are temporarily impacted by temporary structures (work
harbours/storage areas) or dredging activities (tunnel trench, access channel to
Lolland). The natural sea bed morphology will recover in these areas after the end
of construction.
It is noted that the loss of beach area for recreational purposes and impacts related
to the near-shore sea bed morphology (morphological elements in water depths
less than 6 m DVR90) are treated separately in (FEHY 2013f). Only the loss of sea
bed in the footprint area is included in this report.
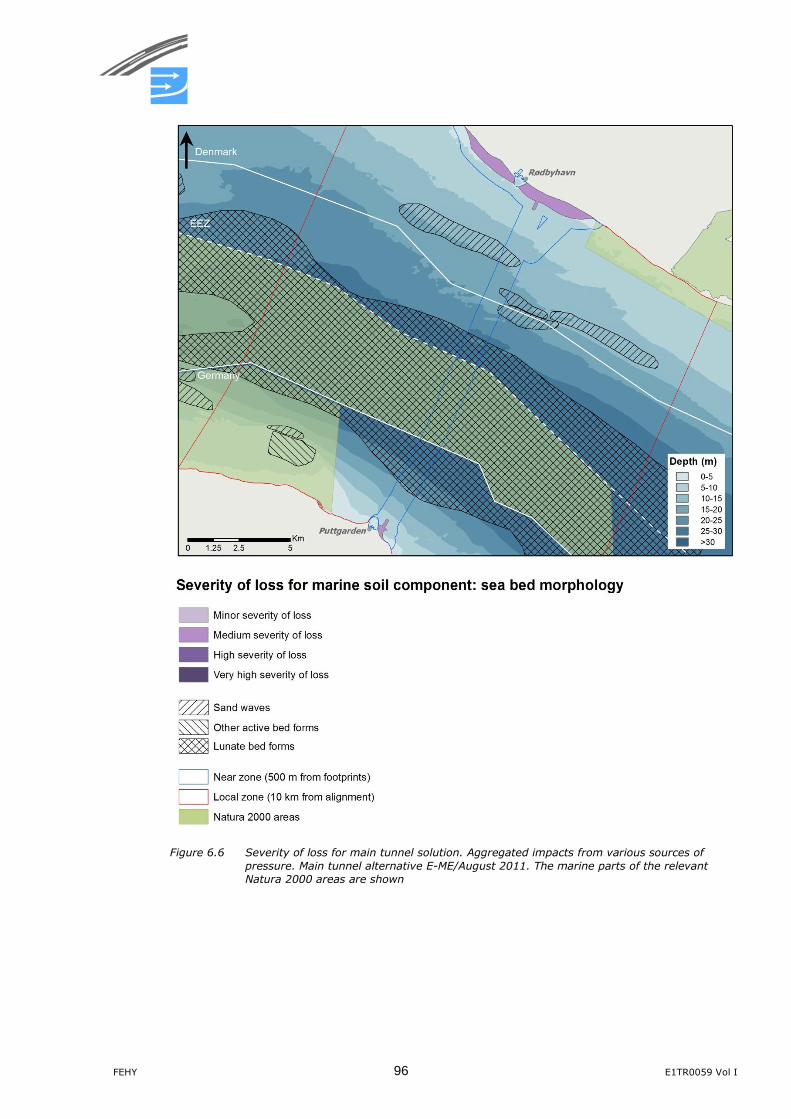
FEHY 96 E1TR0059 Vol I
Figure 6.6 Severity of loss for main tunnel solution. Aggregated impacts from various sources of
pressure. Main tunnel alternative E-ME/August 2011. The marine parts of the relevant
Natura 2000 areas are shown
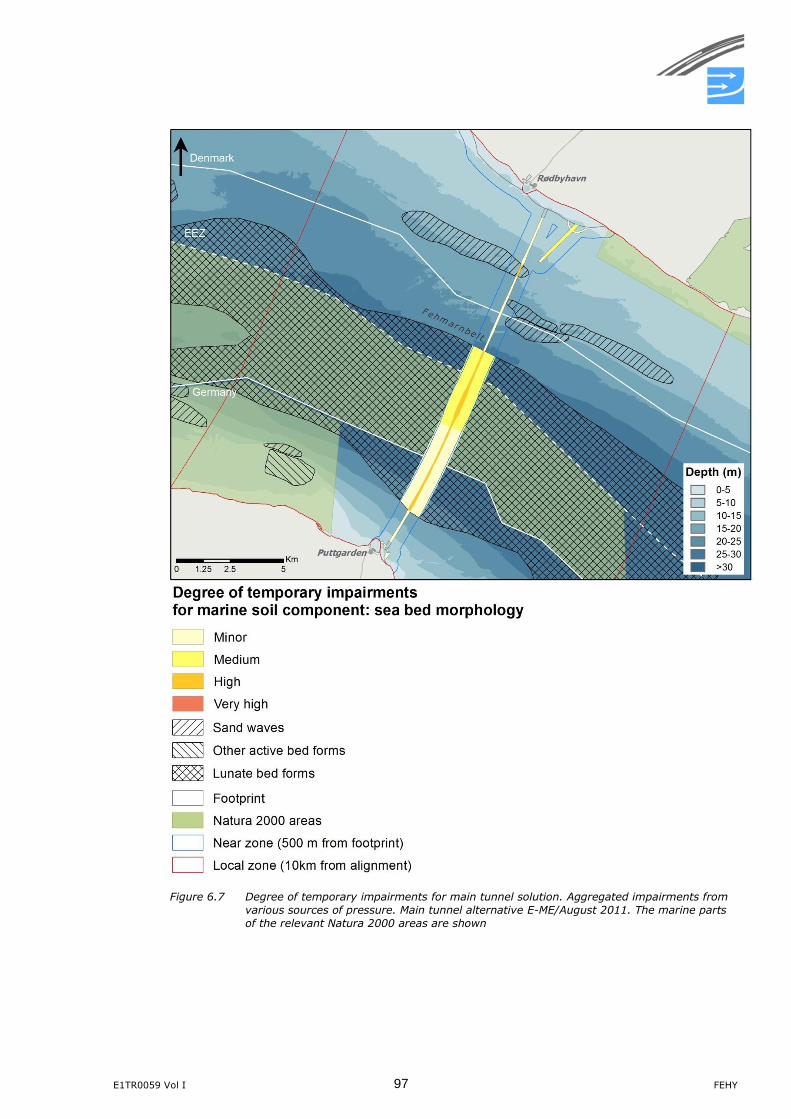
E1TR0059 Vol I 97 FEHY
Figure 6.7 Degree of temporary impairments for main tunnel solution. Aggregated impairments from
various sources of pressure. Main tunnel alternative E-ME/August 2011. The marine parts
of the relevant Natura 2000 areas are shown
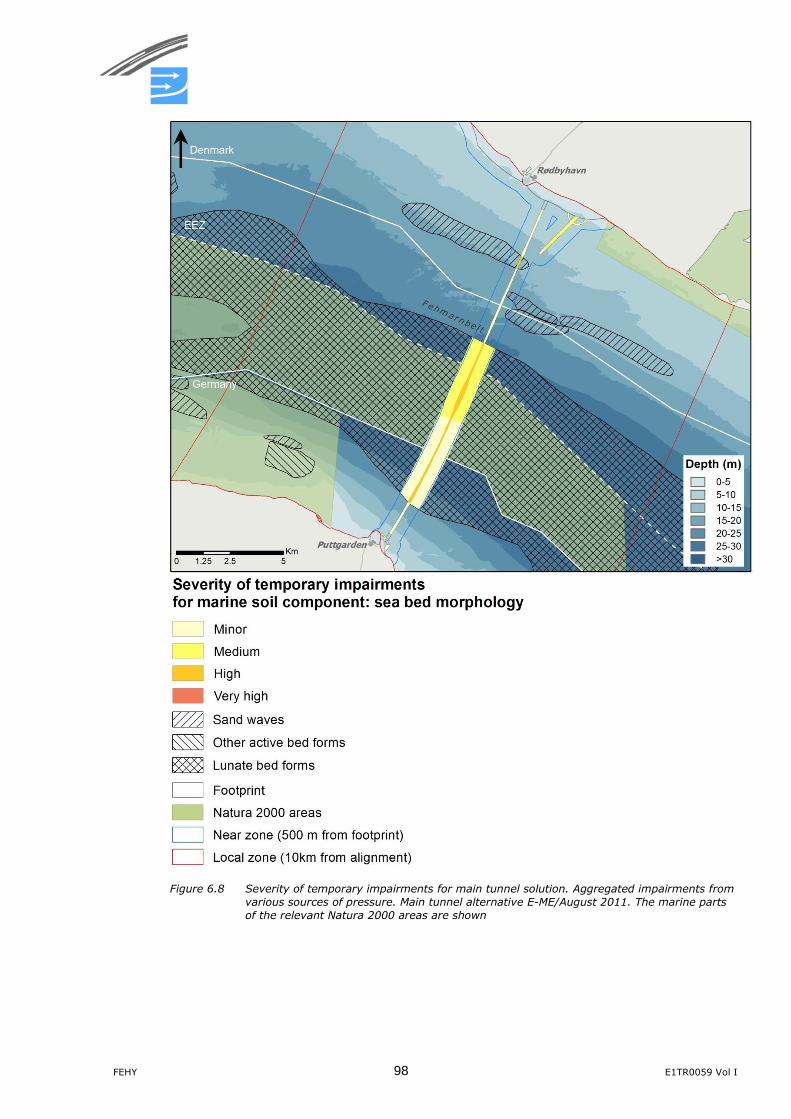
FEHY 98 E1TR0059 Vol I
Figure 6.8 Severity of temporary impairments for main tunnel solution. Aggregated impairments from
various sources of pressure. Main tunnel alternative E-ME/August 2011. The marine parts
of the relevant Natura 2000 areas are shown
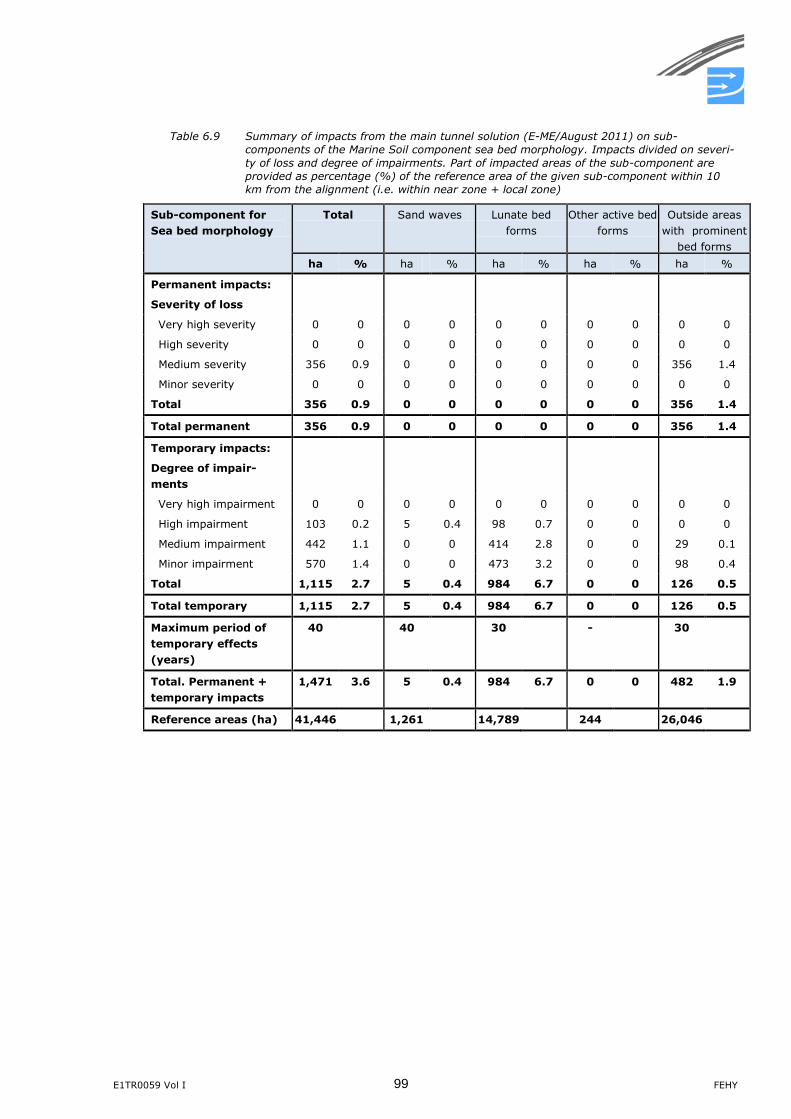
E1TR0059 Vol I 99 FEHY
Table 6.9 Summary of impacts from the main tunnel solution (E-ME/August 2011) on sub-
components of the Marine Soil component sea bed morphology. Impacts divided on severi-
ty of loss and degree of impairments. Part of impacted areas of the sub-component are
provided as percentage (%) of the reference area of the given sub-component within 10
km from the alignment (i.e. within near zone + local zone)
Sub-component for
Sea bed morphology
Total Sand waves Lunate bed
forms
Other active bed
forms
Outside areas
with prominent
bed forms
ha % ha % ha % ha % ha %
Permanent impacts:
Severity of loss
Very high severity 0 0 0 0 0 0 0 0 0 0
High severity 0 0 0 0 0 0 0 0 0 0
Medium severity 356 0.9 0 0 0 0 0 0 356 1.4
Minor severity 0 0 0 0 0 0 0 0 0 0
Total 356 0.9 0 0 0 0 0 0 356 1.4
Total permanent 356 0.9 0 0 0 0 0 0 356 1.4
Temporary impacts:
Degree of impair-
ments
Very high impairment 0 0 0 0 0 0 0 0 0 0
High impairment 103 0.2 5 0.4 98 0.7 0 0 0 0
Medium impairment 442 1.1 0 0 414 2.8 0 0 29 0.1
Minor impairment 570 1.4 0 0 473 3.2 0 0 98 0.4
Total 1,115 2.7 5 0.4 984 6.7 0 0 126 0.5
Total temporary 1,115 2.7 5 0.4 984 6.7 0 0 126 0.5
Maximum period of
temporary effects
(years)
40 40 30 - 30
Total. Permanent +
temporary impacts
1,471 3.6 5 0.4 984 6.7 0 0 482 1.9
Reference areas (ha) 41,446 1,261 14,789 244 26,046
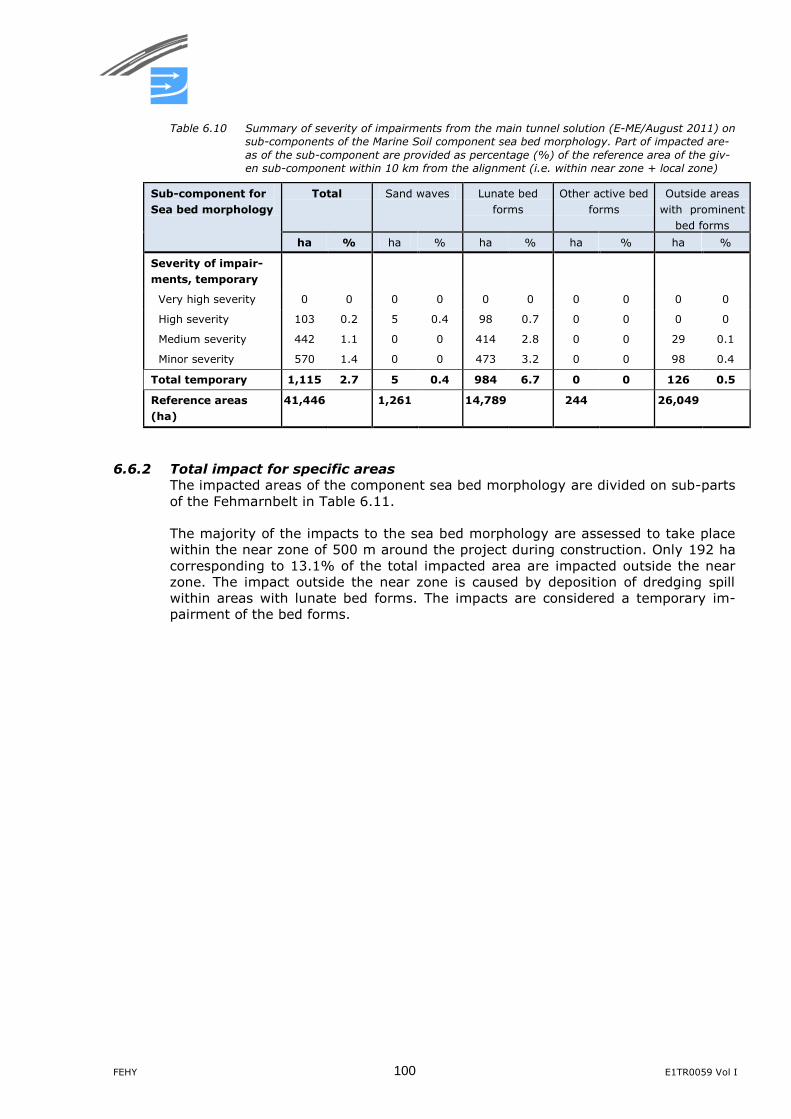
FEHY 100 E1TR0059 Vol I
Table 6.10 Summary of severity of impairments from the main tunnel solution (E-ME/August 2011) on
sub-components of the Marine Soil component sea bed morphology. Part of impacted are-
as of the sub-component are provided as percentage (%) of the reference area of the giv-
en sub-component within 10 km from the alignment (i.e. within near zone + local zone)
Sub-component for
Sea bed morphology
Total Sand waves Lunate bed
forms
Other active bed
forms
Outside areas
with prominent
bed forms
ha % ha % ha % ha % ha %
Severity of impair-
ments, temporary
Very high severity 0 0 0 0 0 0 0 0 0 0
High severity 103 0.2 5 0.4 98 0.7 0 0 0 0
Medium severity 442 1.1 0 0 414 2.8 0 0 29 0.1
Minor severity 570 1.4 0 0 473 3.2 0 0 98 0.4
Total temporary 1,115 2.7 5 0.4 984 6.7 0 0 126 0.5
Reference areas
(ha)
41,446 1,261 14,789 244 26,049
6.6.2 Total impact for specific areas
The impacted areas of the component sea bed morphology are divided on sub-parts
of the Fehmarnbelt in Table 6.11.
The majority of the impacts to the sea bed morphology are assessed to take place
within the near zone of 500 m around the project during construction. Only 192 ha
corresponding to 13.1% of the total impacted area are impacted outside the near
zone. The impact outside the near zone is caused by deposition of dredging spill
within areas with lunate bed forms. The impacts are considered a temporary im-
pairment of the bed forms.
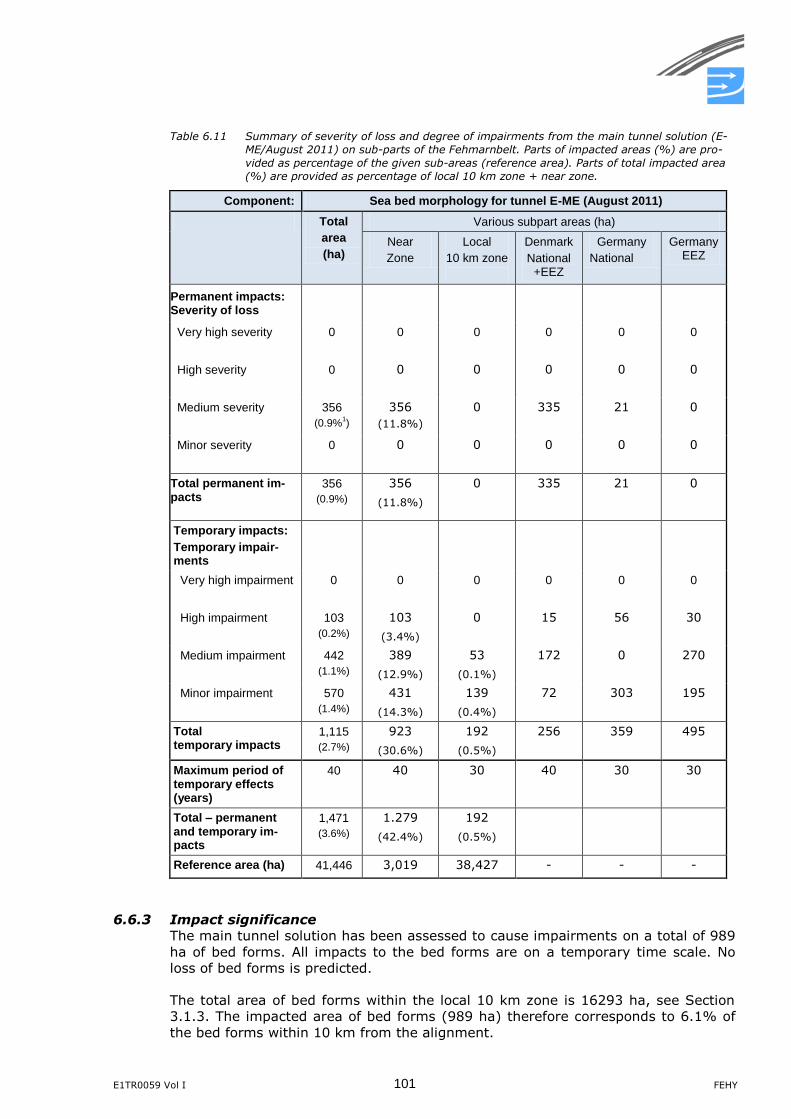
E1TR0059 Vol I 101 FEHY
Table 6.11 Summary of severity of loss and degree of impairments from the main tunnel solution (E-
ME/August 2011) on sub-parts of the Fehmarnbelt. Parts of impacted areas (%) are pro-
vided as percentage of the given sub-areas (reference area). Parts of total impacted area
(%) are provided as percentage of local 10 km zone + near zone.
Component: Sea bed morphology for tunnel E-ME (August 2011)
Total
area
(ha)
Various subpart areas (ha)
Near
Zone
Local
10 km zone
Denmark
National +EEZ
Germany
National
Germany EEZ
Permanent impacts: Severity of loss
Very high severity 0 0 0 0 0 0
High severity 0 0 0 0 0 0
Medium severity 356
(0.9%1)
356
(11.8%)
0 335 21 0
Minor severity 0 0 0 0 0 0
Total permanent im-pacts
356
(0.9%)
356
(11.8%)
0 335 21 0
Temporary impacts:
Temporary impair-ments
Very high impairment 0 0 0 0 0 0
High impairment 103
(0.2%)
103
(3.4%)
0 15 56 30
Medium impairment 442
(1.1%)
389
(12.9%)
53
(0.1%)
172 0 270
Minor impairment 570
(1.4%)
431
(14.3%)
139
(0.4%)
72 303 195
Total temporary impacts
1,115
(2.7%)
923
(30.6%)
192
(0.5%)
256 359 495
Maximum period of temporary effects (years)
40 40 30 40 30 30
Total – permanent and temporary im-pacts
1,471
(3.6%)
1.279
(42.4%)
192
(0.5%)
Reference area (ha) 41,446 3,019 38,427 - - -
6.6.3 Impact significance
The main tunnel solution has been assessed to cause impairments on a total of 989
ha of bed forms. All impacts to the bed forms are on a temporary time scale. No
loss of bed forms is predicted.
The total area of bed forms within the local 10 km zone is 16293 ha, see Section
3.1.3. The impacted area of bed forms (989 ha) therefore corresponds to 6.1% of
the bed forms within 10 km from the alignment.
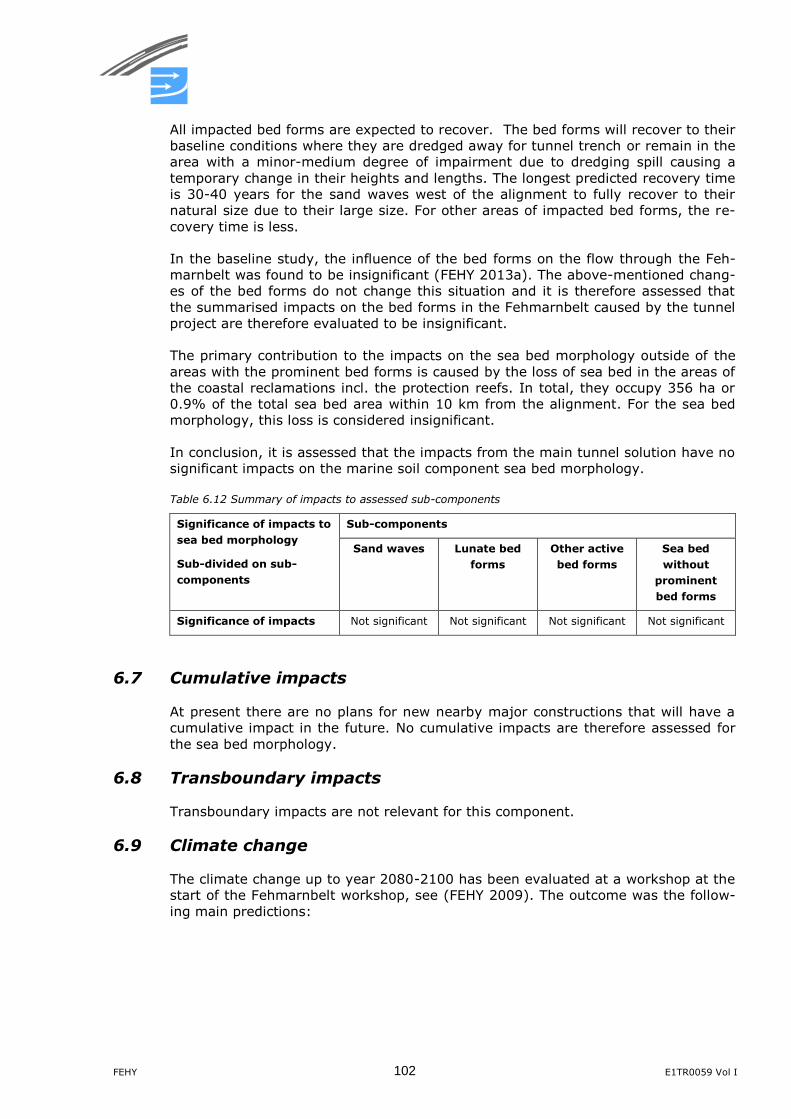
FEHY 102 E1TR0059 Vol I
All impacted bed forms are expected to recover. The bed forms will recover to their
baseline conditions where they are dredged away for tunnel trench or remain in the
area with a minor-medium degree of impairment due to dredging spill causing a
temporary change in their heights and lengths. The longest predicted recovery time
is 30-40 years for the sand waves west of the alignment to fully recover to their
natural size due to their large size. For other areas of impacted bed forms, the re-
covery time is less.
In the baseline study, the influence of the bed forms on the flow through the Feh-
marnbelt was found to be insignificant (FEHY 2013a). The above-mentioned chang-
es of the bed forms do not change this situation and it is therefore assessed that
the summarised impacts on the bed forms in the Fehmarnbelt caused by the tunnel
project are therefore evaluated to be insignificant.
The primary contribution to the impacts on the sea bed morphology outside of the
areas with the prominent bed forms is caused by the loss of sea bed in the areas of
the coastal reclamations incl. the protection reefs. In total, they occupy 356 ha or
0.9% of the total sea bed area within 10 km from the alignment. For the sea bed
morphology, this loss is considered insignificant.
In conclusion, it is assessed that the impacts from the main tunnel solution have no
significant impacts on the marine soil component sea bed morphology.
Table 6.12 Summary of impacts to assessed sub-components
Significance of impacts to
sea bed morphology
Sub-divided on sub-
components
Sub-components
Sand waves Lunate bed
forms
Other active
bed forms
Sea bed
without
prominent
bed forms
Significance of impacts Not significant Not significant Not significant Not significant
6.7 Cumulative impacts
At present there are no plans for new nearby major constructions that will have a
cumulative impact in the future. No cumulative impacts are therefore assessed for
the sea bed morphology.
6.8 Transboundary impacts
Transboundary impacts are not relevant for this component.
6.9 Climate change
The climate change up to year 2080-2100 has been evaluated at a workshop at the
start of the Fehmarnbelt workshop, see (FEHY 2009). The outcome was the follow-
ing main predictions:
E1TR0059 Vol I 103 FEHY
Air temperature will increase up to 4˚C in the area
The extreme wind speed (50 year return period) may increase by 3 m/s or
10%. For more typical wind speeds there are no indications of significant
changes
The ocean water level may rise up to 1 m, which will propagate into the Feh-
marnbelt and the Baltic Sea
The impact of the immersed tunnel in such a new climate setting is evaluated as
being similar to the estimated impacts for the present climate setting.
6.10 Mitigation and compensation measures
It is assumed that the sea bed areas are re-established in the areas of the tempo-
rary work harbours/storage areas, which are not integrated into the permanent rec-
lamations although this is not explicitly stated in the technical description (see Sec-
tion 5.2).
Possible mitigation measures to be considered in the final design are 1) active
backfilling of the tunnel trench above the scour protection, and 2) active backfilling
of the access channel to the Lolland production facility.
Backfilling of the tunnel trench would prevent the sea bed from having a shallow
(0.7 m) trench (i78 ha in the Danish territory and 56 ha (D-EEZ) + 49 ha (D) in the
German territory) with hard substrate (scour protection) in the bottom of the
trench appearing after the end of the construction period. Backfilling would re-
establish the sea bed to a plane bed where natural flora and fauna could possibly
re-establish. In the areas of the lunate bed forms the re-generation of the bed
forms would initiate across the entire backfilled trench immediately. Recovery of
the bed forms to their fully-developed stage in the entire width of the trench area,
however, is for the lunate bed forms in the Natura 2000 area predicted to be on the
same time-scale with (15-22 years) and without (15-28 years) the active backfill-
ing.
Similarly, backfilling of the access channel would prevent the sea bed from having a
trench of up to 6 m below natural sea bed level remaining after the end of con-
struction.
The mitigation measures are tabulated in Table 6.13. However, none of the above
possible mitigation measures relate to significant impacts from the project, and
they are therefore only included as technical options.
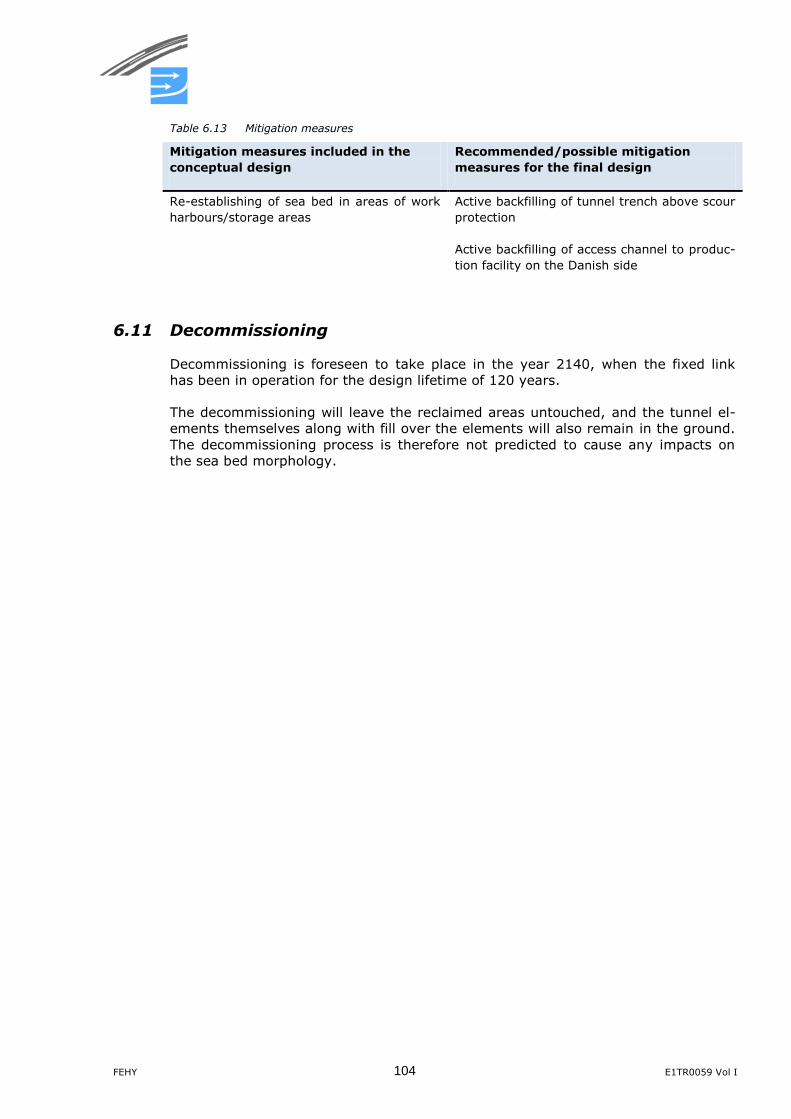
FEHY 104 E1TR0059 Vol I
Table 6.13 Mitigation measures
Mitigation measures included in the
conceptual design
Recommended/possible mitigation
measures for the final design
Re-establishing of sea bed in areas of work
harbours/storage areas
Active backfilling of tunnel trench above scour
protection
Active backfilling of access channel to produc-
tion facility on the Danish side
6.11 Decommissioning
Decommissioning is foreseen to take place in the year 2140, when the fixed link
has been in operation for the design lifetime of 120 years.
The decommissioning will leave the reclaimed areas untouched, and the tunnel el-
ements themselves along with fill over the elements will also remain in the ground.
The decommissioning process is therefore not predicted to cause any impacts on
the sea bed morphology.
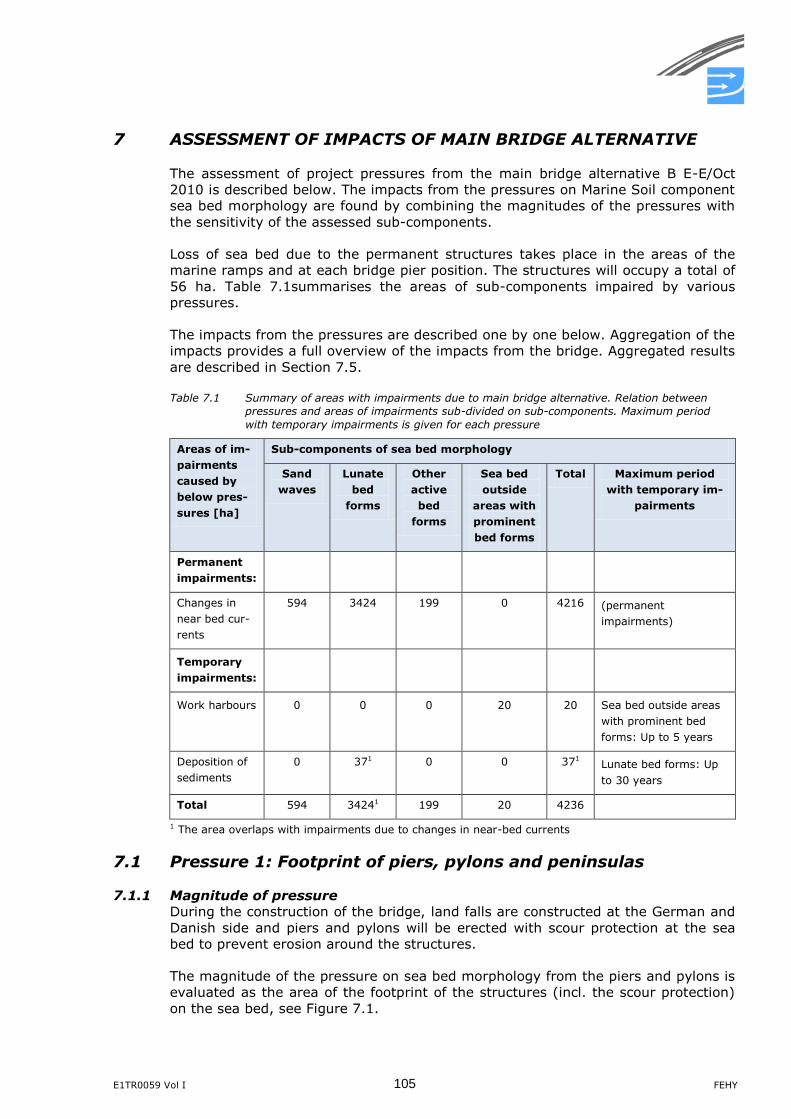
E1TR0059 Vol I 105 FEHY
7 ASSESSMENT OF IMPACTS OF MAIN BRIDGE ALTERNATIVE
The assessment of project pressures from the main bridge alternative B E-E/Oct
2010 is described below. The impacts from the pressures on Marine Soil component
sea bed morphology are found by combining the magnitudes of the pressures with
the sensitivity of the assessed sub-components.
Loss of sea bed due to the permanent structures takes place in the areas of the
marine ramps and at each bridge pier position. The structures will occupy a total of
56 ha. Table 7.1summarises the areas of sub-components impaired by various
pressures.
The impacts from the pressures are described one by one below. Aggregation of the
impacts provides a full overview of the impacts from the bridge. Aggregated results
are described in Section 7.5.
Table 7.1 Summary of areas with impairments due to main bridge alternative. Relation between
pressures and areas of impairments sub-divided on sub-components. Maximum period
with temporary impairments is given for each pressure
Areas of im-
pairments
caused by
below pres-
sures [ha]
Sub-components of sea bed morphology
Sand
waves
Lunate
bed
forms
Other
active
bed
forms
Sea bed
outside
areas with
prominent
bed forms
Total Maximum period
with temporary im-
pairments
Permanent
impairments:
Changes in
near bed cur-
rents
594 3424 199 0 4216 (permanent
impairments)
Temporary
impairments:
Work harbours 0 0 0 20 20 Sea bed outside areas
with prominent bed
forms: Up to 5 years
Deposition of
sediments
0 371 0 0 371 Lunate bed forms: Up
to 30 years
Total 594 34241 199 20 4236
1 The area overlaps with impairments due to changes in near-bed currents
7.1 Pressure 1: Footprint of piers, pylons and peninsulas
7.1.1 Magnitude of pressure
During the construction of the bridge, land falls are constructed at the German and
Danish side and piers and pylons will be erected with scour protection at the sea
bed to prevent erosion around the structures.
The magnitude of the pressure on sea bed morphology from the piers and pylons is
evaluated as the area of the footprint of the structures (incl. the scour protection)
on the sea bed, see Figure 7.1.
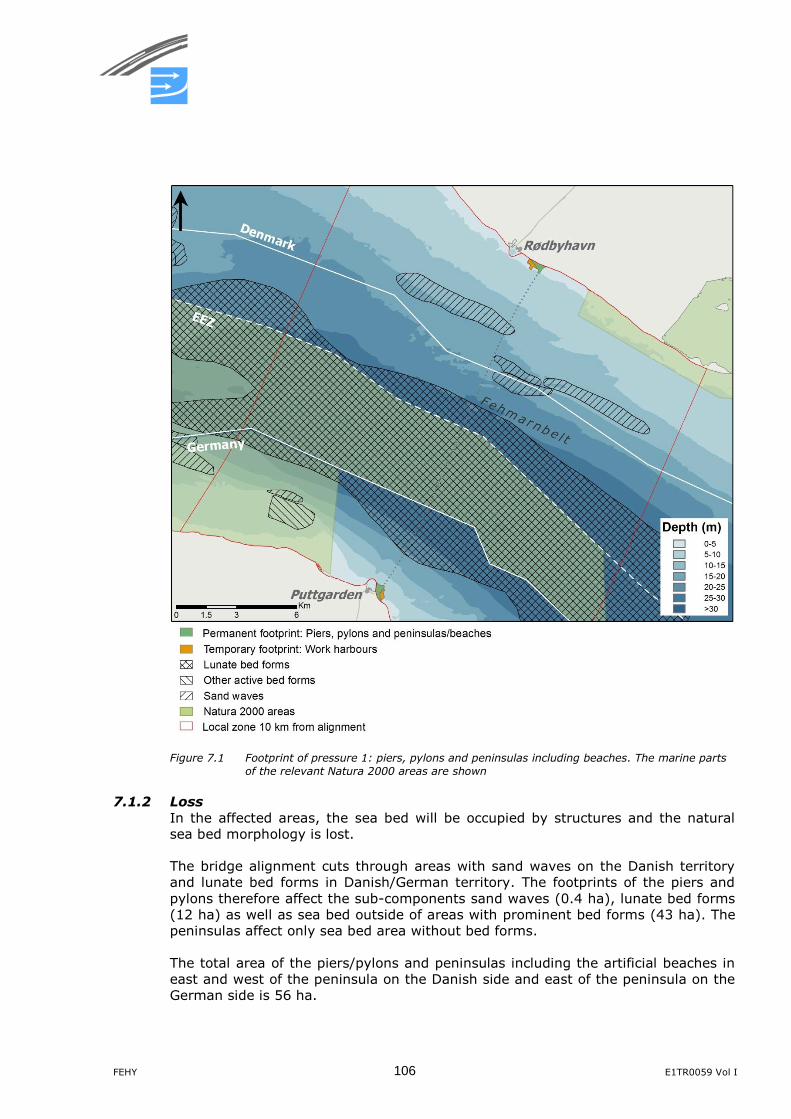
FEHY 106 E1TR0059 Vol I
Figure 7.1 Footprint of pressure 1: piers, pylons and peninsulas including beaches. The marine parts
of the relevant Natura 2000 areas are shown
7.1.2 Loss
In the affected areas, the sea bed will be occupied by structures and the natural
sea bed morphology is lost.
The bridge alignment cuts through areas with sand waves on the Danish territory
and lunate bed forms in Danish/German territory. The footprints of the piers and
pylons therefore affect the sub-components sand waves (0.4 ha), lunate bed forms
(12 ha) as well as sea bed outside of areas with prominent bed forms (43 ha). The
peninsulas affect only sea bed area without bed forms.
The total area of the piers/pylons and peninsulas including the artificial beaches in
east and west of the peninsula on the Danish side and east of the peninsula on the
German side is 56 ha.
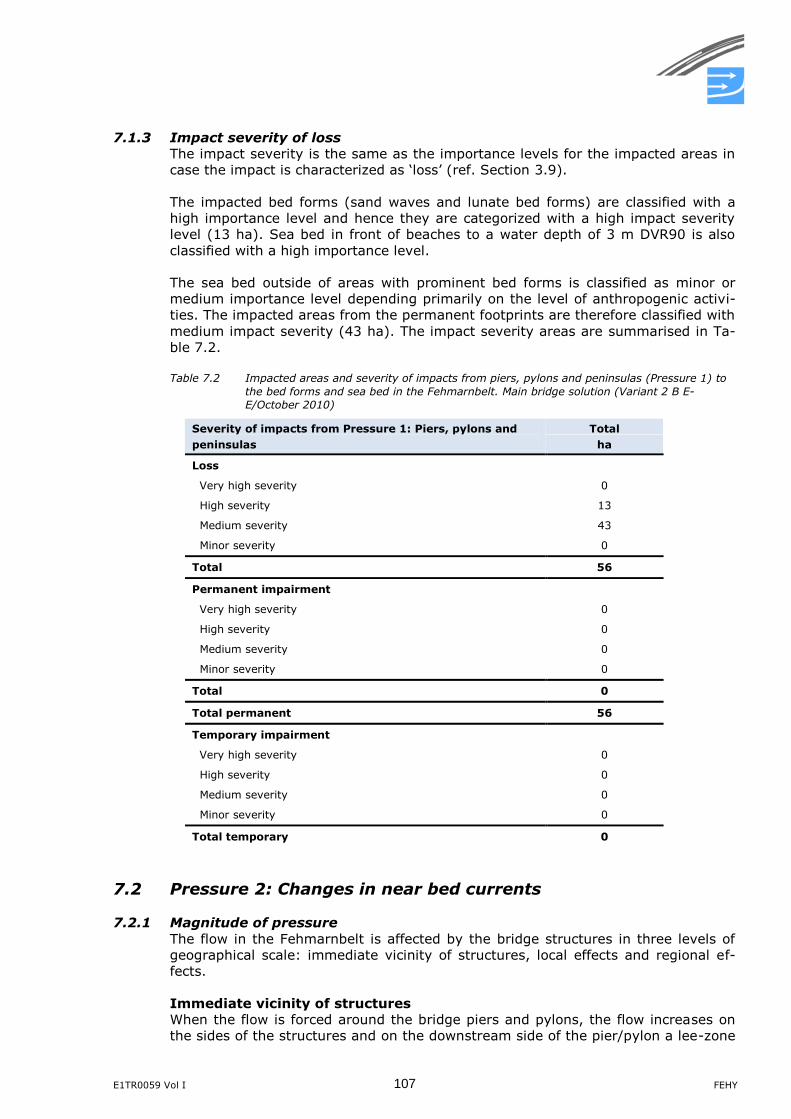
E1TR0059 Vol I 107 FEHY
7.1.3 Impact severity of loss
The impact severity is the same as the importance levels for the impacted areas in
case the impact is characterized as ‘loss’ (ref. Section 3.9).
The impacted bed forms (sand waves and lunate bed forms) are classified with a
high importance level and hence they are categorized with a high impact severity
level (13 ha). Sea bed in front of beaches to a water depth of 3 m DVR90 is also
classified with a high importance level.
The sea bed outside of areas with prominent bed forms is classified as minor or
medium importance level depending primarily on the level of anthropogenic activi-
ties. The impacted areas from the permanent footprints are therefore classified with
medium impact severity (43 ha). The impact severity areas are summarised in Ta-
ble 7.2.
Table 7.2 Impacted areas and severity of impacts from piers, pylons and peninsulas (Pressure 1) to
the bed forms and sea bed in the Fehmarnbelt. Main bridge solution (Variant 2 B E-
E/October 2010)
Severity of impacts from Pressure 1: Piers, pylons and
peninsulas
Total
ha
Loss
Very high severity 0
High severity 13
Medium severity 43
Minor severity 0
Total 56
Permanent impairment
Very high severity 0
High severity 0
Medium severity 0
Minor severity 0
Total 0
Total permanent 56
Temporary impairment
Very high severity 0
High severity 0
Medium severity 0
Minor severity 0
Total temporary 0
7.2 Pressure 2: Changes in near bed currents
7.2.1 Magnitude of pressure
The flow in the Fehmarnbelt is affected by the bridge structures in three levels of
geographical scale: immediate vicinity of structures, local effects and regional ef-
fects.
Immediate vicinity of structures
When the flow is forced around the bridge piers and pylons, the flow increases on
the sides of the structures and on the downstream side of the pier/pylon a lee-zone
FEHY 108 E1TR0059 Vol I
is created. Local eddies or vortices are created near the bed and in the lee-zone
behind the structures, recirculation and dynamic eddies may generate. Near-bed
current speeds may change by more than 25% within four diameters from the
piers/pylons. The total area within which such an increase will take place is 166 ha;
of these are 128 ha within areas with bed forms. In such a flow regime the bed
forms are expected to change character and a variation of bed forms (bed forms
higher/lower than in the surrounding area, small-scale ripples, scour holes near the
protecting stone layer around the structures or flat bed) may occur. The magnitude
from the changes to the near-bed flow to the sea bed morphology is assessed as
the area within four diameters from the piers/pylons (excluding the scour protec-
tion).
Local effects
Local effects to the flow are changes to the current field due to the increased re-
sistance and the increased mixing of the water column the structures impose on the
flow. The effects to the flow impact the bed forms by changing the sediment
transport which has a direct influence on the height of the bed forms.
The changes to the near-bed current speeds are evaluated from a comparison of
flow simulations with and without the bridge included in the numerical model car-
ried out as a part of (FEHY 2013e). The simulations are carried out for the bridge
solution B E-E/April 2010, which is slightly different from the main alternative as-
sessed in this report, Variant 2 B E-E/October 2010. Results from the April 2010
alignment are translated geographically to the October 2010 alignment as described
below to evaluate the magnitude of the pressure to the sea bed morphology from
changes to the currents caused by the main alternative. The alignments of the two
bridges are compared in Figure 3.8 in Section 3.3. The limited differences between
the two bridges with regard to the hydrodynamic flow blocking are assessed in
(FEHY 2013e). For the present work, the applied results are considered to imply
slightly conservative hydrodynamic effects.
The relative changes to the annual mean near-bed current speeds (time-average of
the absolute current speeds) due to the bridge structures (April 2010) are illustrat-
ed with shaded colours in Figure 7.2. The figure illustrates the relative changes be-
tween modelled near-bed flow fields for the baseline situation (ferry included) and
the situation with the bridge structures and the ferry included in the simulations.
The flow fields have been evaluated for the year 2005. The areas influenced by the
2005 simulations and the magnitudes of influence are assumed to be representative
for average conditions.
The changes of the near-bed current speeds are located primarily along the align-
ment of the bridge alignment in the simulations (April 2010). The blocking effect
from the piers and pylons imposes a blocking effect on the flow through the Feh-
marnbelt. The total discharge through the Belt therefore slightly reduces; see below
in the section related to “Regional effects”. The piers and pylons cause a general in-
crease in the currents in the gaps between the piers and pylons and an increase in
the mixing of the water column. On a larger scale differences in the resistance be-
tween different sections of the bridge (caused by difference in the bridge piers or
by differences in the current velocities and directions along the alignment) may also
cause the flow to diverge to areas with smaller resistance.
The water column in the Fehmarnbelt is typically stratified since the salty and dense
water originating from the North Sea and Kattegat is overlaid by the less dense and
less salty water from the Baltic Sea. Flow directions may be in opposing flow direc-
tions in the upper and lower parts of the water column. The increased mixing of the
water column due to the bridge structures causes a weaker stratification and in-
creased momentum exchange between the upper and lower parts of the water col-
E1TR0059 Vol I 109 FEHY
umn. During events with strong currents, where most of the sediment transport oc-
curs, the flow is typically orientated in the same flow direction across the water col-
umn. The mixing of the water column due to the bridge piers and pylons increases
the relatively lower current speeds near the bed, since water with high momentum
(higher current speeds) will be mixed downwards.
Changes to the near current speeds of more than 2.5% are considered to impose a
significant change to the bed form heights, refer to discussion in the sensitivity
analysis in Section 5.1.3. The magnitude of the pressure from the changes to the
near-bed flow is therefore established from the magnitude of the current changes in
Figure 7.2 in areas of the Fehmarnbelt, where this limit is exceeded.
The impact areas along the alignment, where the changes to the current speeds
exceed 2.5% are translated geographically in three sections, northern/central/
southern section, to the new bridge alignment with the distance between the
alignments for these three sections. The hatched area in red is the impact area for
the main bridge alternative. The areas where the changes to the near-bed current
speeds exceed the 2.5% limit for impact on bed forms outside the bridge alignment
are not translated geographically. The area, where changes to near-bed currents
from the main bridge Variant 2 B E-E/October 2010 are assessed to have an order
of magnitude which can lead to changes to bed forms (according to the assessment
criteria in Table 3.10) are shown inFigure 7.3.
Regional effects
The regional effects relate to the overall water exchange between the Baltic Sea
and the North Sea. These effects are described in (FEHY 2013g). A reduction in the
order of about 0.5% reduced water exchange is estimated due to the overall block-
ing effect of the bridge piers and pylons as described above.
The reduction in the water exchange is an integrated value representing the time-
averaged changes in the current speeds across the full water depth. There are no
implications on the bed forms due to this effect.
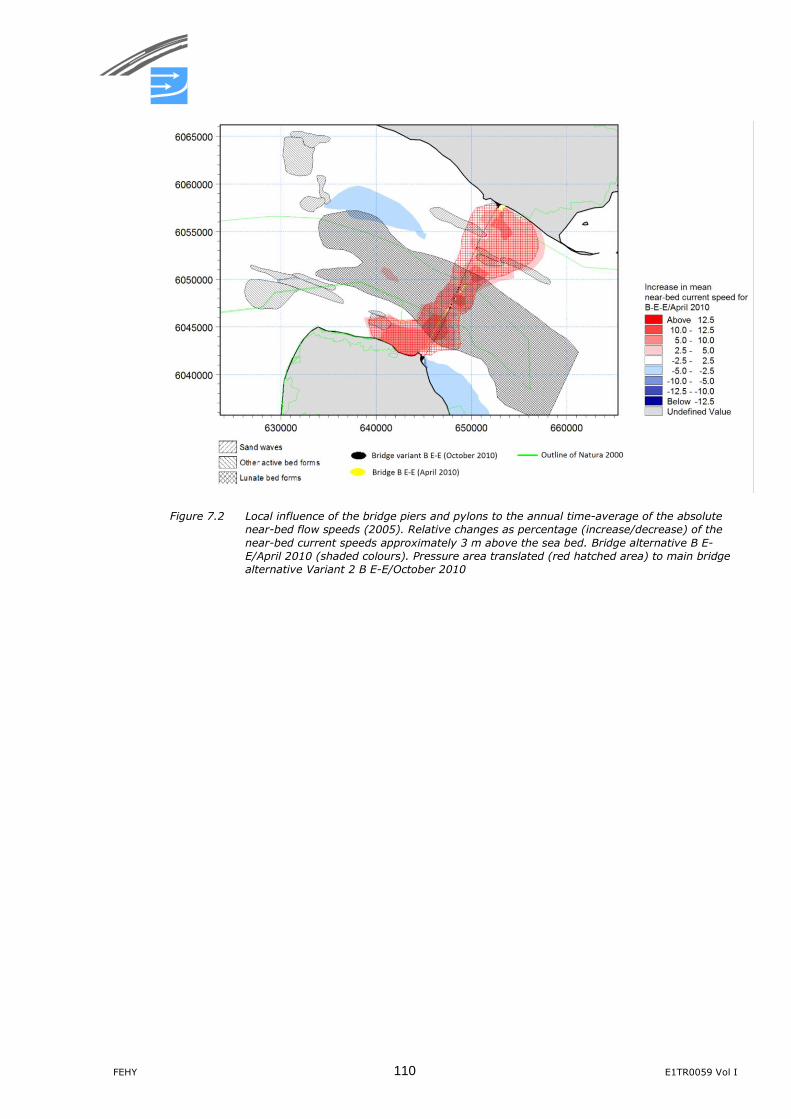
FEHY 110 E1TR0059 Vol I
Figure 7.2 Local influence of the bridge piers and pylons to the annual time-average of the absolute
near-bed flow speeds (2005). Relative changes as percentage (increase/decrease) of the
near-bed current speeds approximately 3 m above the sea bed. Bridge alternative B E-
E/April 2010 (shaded colours). Pressure area translated (red hatched area) to main bridge
alternative Variant 2 B E-E/October 2010
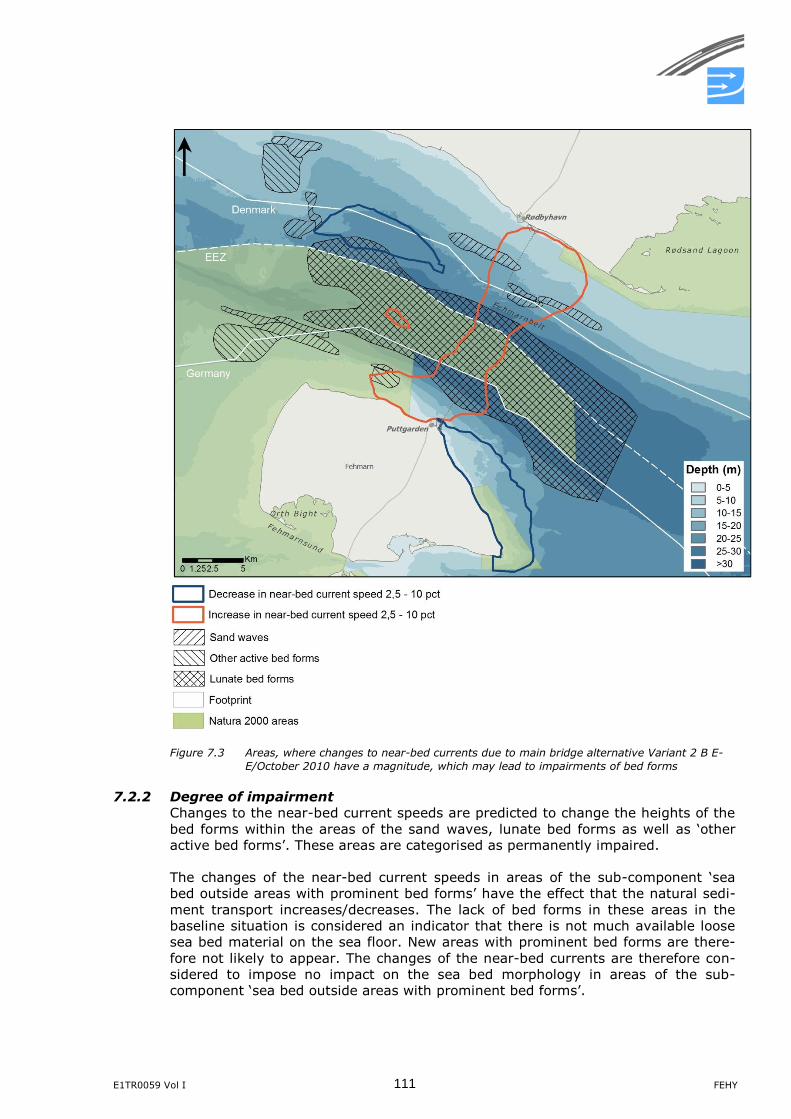
E1TR0059 Vol I 111 FEHY
Figure 7.3 Areas, where changes to near-bed currents due to main bridge alternative Variant 2 B E-
E/October 2010 have a magnitude, which may lead to impairments of bed forms
7.2.2 Degree of impairment
Changes to the near-bed current speeds are predicted to change the heights of the
bed forms within the areas of the sand waves, lunate bed forms as well as ‘other
active bed forms’. These areas are categorised as permanently impaired.
The changes of the near-bed current speeds in areas of the sub-component ‘sea
bed outside areas with prominent bed forms’ have the effect that the natural sedi-
ment transport increases/decreases. The lack of bed forms in these areas in the
baseline situation is considered an indicator that there is not much available loose
sea bed material on the sea floor. New areas with prominent bed forms are there-
fore not likely to appear. The changes of the near-bed currents are therefore con-
sidered to impose no impact on the sea bed morphology in areas of the sub-
component ‘sea bed outside areas with prominent bed forms’.
FEHY 112 E1TR0059 Vol I
Within an area of four diameters from the piers/pylons, changes to the flow are so
severe (>25%) that a change in the morphological regime is predicted. Bed forms
are expected to change character and a variation of bed forms (bed forms high-
er/lower than in the surrounding area, small-scale ripples, scour holes near the pro-
tecting stone layer around the structures or flat bed) may occur in these areas for
the new flow conditions with the bridge. The impairment on the sea bed morpholo-
gy can hence be characterised as loss and is classified with a ‘very high’ degree of
impairment. The areas within four diameters of the bridge piers/pylons include 3 ha
within the area of the sand waves west of the alignment on the Danish side and
125 ha within the lunate bed forms in Danish/German territory.
Within the areas, where the near-bed current speeds increase or decrease by 2.5-
10%, see Figure 7.2, the bed form heights are predicted to respectively increase or
decrease by 10-25%. For the large sand waves (west of the alignment, Danish
side) this corresponds to up to 0.75 m, for the small sand waves up to 0.25m (east
of the alignment, Danish side and 5 km west of the alignment, German side) and
for the lunate bed forms up to about 0.15 m.
The impacts in these areas are therefore classified as permanent with a minor de-
gree of impairment according to the assessment criteria in Section 3.6. These areas
constitute a total of 4088 ha (591 ha of sand waves; 3,299 ha of lunate bed forms;
199 ha of other active bed forms).
The bed form heights will not change abruptly to new flow conditions. An adjust-
ment period is expected. The time for adaptation is difficult to predict. The bed
forms change as they migrate and a migration distance in the order of the length of
the sand waves can be expected (probably less than required for a full development
of sand waves from a plane bed, refer to discussion in Section 5.1.1). For the
smaller sand waves east of the alignment in the Danish territory and the sand wave
field 5 km west of the alignment within German Natura 2000 area, this means in
the order of 5-10 years. For the larger sand waves west of the alignment an adap-
tation period of 15-20 years is expected and for the lunate bed forms about 10-20
years.
The lowering of the general level of the sea bed is estimated by the following over-
all sediment budget for the local area of the bridge alignment with the bridge struc-
tures in place. The increase in the near-bed current speeds in the order of 5%
causes an increase of about 20-60% of the sediment transport within the area
where the near-bed current speeds increase (Figure 7.2). The annual net outflow of
sea bed material from this confined area is therefore approximately 20-60% of the
annual sediment transport in the situation of the 0-alternative. The annual net
transport in the alignment area was found to about 5-25 m3/m/year towards south-
east, i.e. the loss of sea bed material is in the order of 2-10 m3/m/year.
A loss of sea bed material in the order of 2-10 m3/m/year causes a lowering of the
sea bed along the bridge alignment within the area where the near-bed currents
are increased. The lowering will initiate in the western part of this area and spread
towards the east. The width of the area is in the order of 2 km. The rate of lowering
the sea bed is therefore about 1-5 mm/year. The increased water depth following a
lowering of the sea bed results in reduced current speeds and the lowering of the
sea bed hence stabilises. Such a new equilibrium situation will take place on a time
scale larger than the lifetime of the project.
7.2.3 Impact severity of impairment
The sand waves in the Danish territory and the lunate bed forms are classified with
a high importance level, except for the sand waves (133 ha) within the sand mining
area in the Danish territory. The sand waves within the German Natura 2000 area
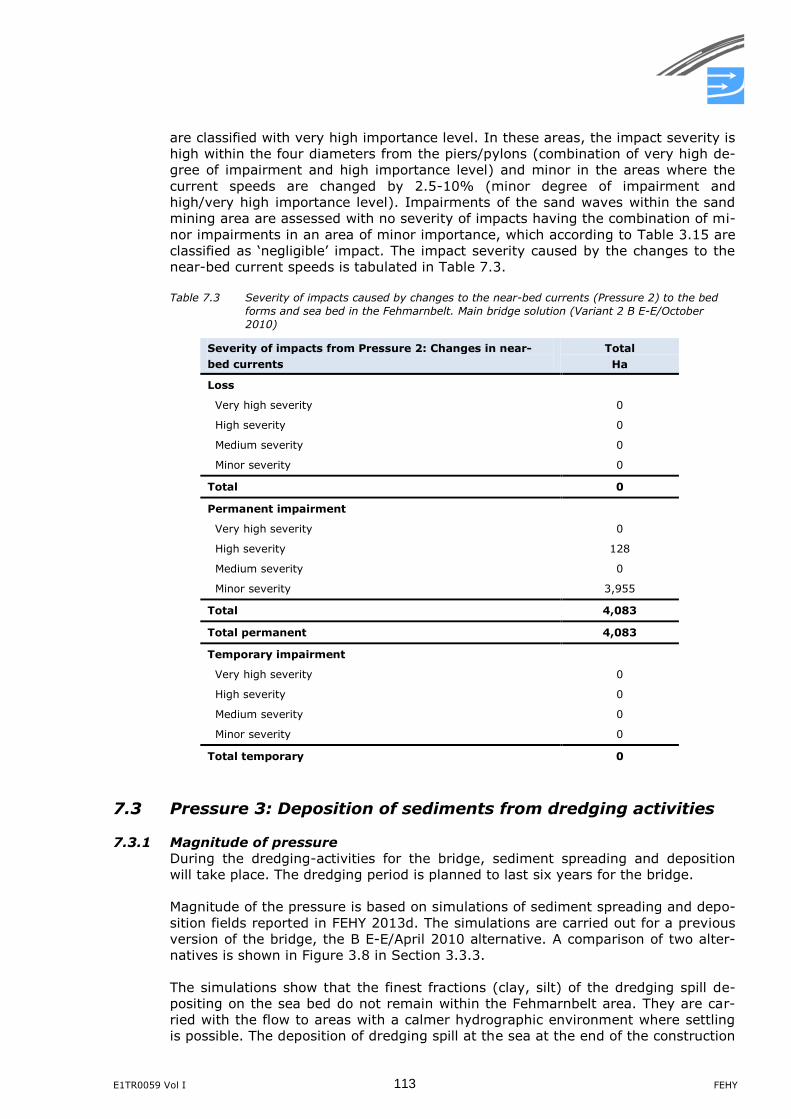
E1TR0059 Vol I 113 FEHY
are classified with very high importance level. In these areas, the impact severity is
high within the four diameters from the piers/pylons (combination of very high de-
gree of impairment and high importance level) and minor in the areas where the
current speeds are changed by 2.5-10% (minor degree of impairment and
high/very high importance level). Impairments of the sand waves within the sand
mining area are assessed with no severity of impacts having the combination of mi-
nor impairments in an area of minor importance, which according to Table 3.15 are
classified as ‘negligible’ impact. The impact severity caused by the changes to the
near-bed current speeds is tabulated in Table 7.3.
Table 7.3 Severity of impacts caused by changes to the near-bed currents (Pressure 2) to the bed
forms and sea bed in the Fehmarnbelt. Main bridge solution (Variant 2 B E-E/October
2010)
Severity of impacts from Pressure 2: Changes in near-
bed currents
Total
Ha
Loss
Very high severity 0
High severity 0
Medium severity 0
Minor severity 0
Total 0
Permanent impairment
Very high severity 0
High severity 128
Medium severity 0
Minor severity 3,955
Total 4,083
Total permanent 4,083
Temporary impairment
Very high severity 0
High severity 0
Medium severity 0
Minor severity 0
Total temporary 0
7.3 Pressure 3: Deposition of sediments from dredging activities
7.3.1 Magnitude of pressure
During the dredging-activities for the bridge, sediment spreading and deposition
will take place. The dredging period is planned to last six years for the bridge.
Magnitude of the pressure is based on simulations of sediment spreading and depo-
sition fields reported in FEHY 2013d. The simulations are carried out for a previous
version of the bridge, the B E-E/April 2010 alternative. A comparison of two alter-
natives is shown in Figure 3.8 in Section 3.3.3.
The simulations show that the finest fractions (clay, silt) of the dredging spill de-
positing on the sea bed do not remain within the Fehmarnbelt area. They are car-
ried with the flow to areas with a calmer hydrographic environment where settling
is possible. The deposition of dredging spill at the sea at the end of the construction
FEHY 114 E1TR0059 Vol I
period is the sand fraction (FEHY 2013d). Only the sediment which remains in the
area at that time is considered important for sea bed morphology, refer to discus-
sion in Section 2.2.
Due to the relatively high settling velocity of sand grains (relative to finer fractions
such as clay/silt), the sand fraction drops out of the water column and deposits
very near the points of dredging, i.e. in the immediate vicinity of the piers and py-
lons.
Since the simulations are carried out for a slightly different alignment of the bridge
(April 2010), the results for the deposition around the main bridge alternative as-
sessed in this report are found by:
1. Estimating the thickness of the deposition around the bridge piers/pylons in
bridge alternative B E-E/April 2010
2. Translating the estimated deposition thicknesses around the piers/pylons in the
previous bridge alternative to the bridge piers/pylons in the main alternative,
which are located in the vicinity of the piers/pylons in the previous alternative
Step 2 ensures that the deposition around the piers in the main alternative corre-
sponds to the sand content in the dredged sea bed material at the locations of the
piers/pylons in the assessed alternative.
The deposition from the dredging spill is calculated based on the volume of spilled
sand around the individual piers/pylons in the previous alternative when dredging
for the structures and scour protection. The sand with an average fall velocity of
0.015 m/s is estimated to travel no further than 600 m from the point of dredging
in the flow directions (FEHY 2013d). For the present work it is assumed that the
sand deposits evenly within an area of +/- 600 m perpendicular to the alignment of
the approach bridges and evenly within a diameter of 600 m from the centre of the
pylons. In reality much of the sediment will deposit within a few hundred metres
from the structures and less will travel as far as 600 m. The conservative assump-
tion of an evenly distributed sand volume is applied, since the geographical distri-
bution of the thickness of the sand fraction is not known within the 0-600 m limit.
The estimated variation in the deposition thickness along the bridge alignment cal-
culated with the above methodology is shown in Figure 6.5. The deposition thick-
ness is less than 5 mm along the approach bridges and 10 mm around the centre
pylon.
The thickness of the deposition layer is expected to decrease further with time after
the end of the construction period, but to which degree is not known.
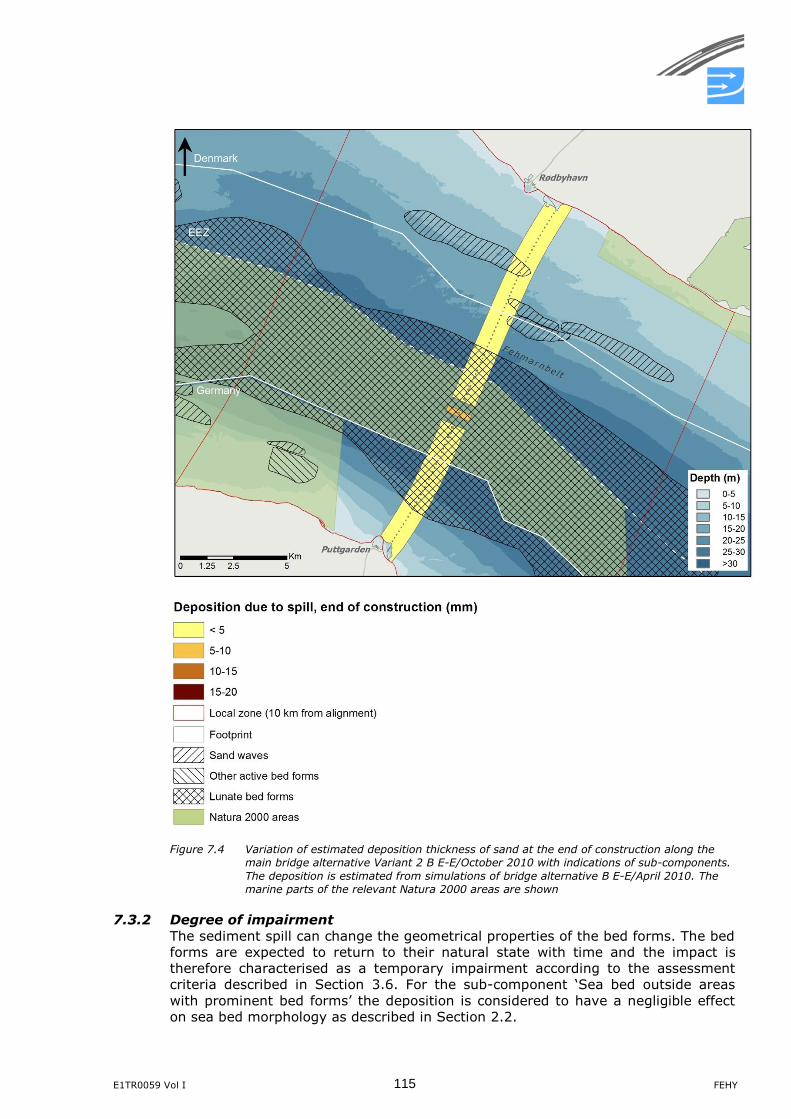
E1TR0059 Vol I 115 FEHY
Figure 7.4 Variation of estimated deposition thickness of sand at the end of construction along the
main bridge alternative Variant 2 B E-E/October 2010 with indications of sub-components.
The deposition is estimated from simulations of bridge alternative B E-E/April 2010. The
marine parts of the relevant Natura 2000 areas are shown
7.3.2 Degree of impairment
The sediment spill can change the geometrical properties of the bed forms. The bed
forms are expected to return to their natural state with time and the impact is
therefore characterised as a temporary impairment according to the assessment
criteria described in Section 3.6. For the sub-component ‘Sea bed outside areas
with prominent bed forms’ the deposition is considered to have a negligible effect
on sea bed morphology as described in Section 2.2.
FEHY 116 E1TR0059 Vol I
Degree of impairment
Sediment will deposit within both of the two sand wave fields near the alignment in
the Danish territory, see Figure 7.4. East of the bridge alignment the typical sand
wave heights are between 0.5 and 1 m. The calculated evenly distributed deposi-
tion in this area is around 3 mm. The deposited material gather in the deeper areas
of the sand wave field and the heights of the sand waves are reduced by about 2.5
times the thickness of the deposition corresponding to 7.5 mm, refer to discussion
in Section 5.1.2. This corresponds to a height reduction of 1.5% of the bed forms,
which is well below the 10% limit for a significant impact on the sand waves ac-
cording to the assessment criteria in Section 3.6.
The sand waves west of the bridge alignment are larger, 1.5-3 m, and the deposi-
tion is of a similar size as in the sand wave field with the smaller bed forms east of
the alignment. The deposition does therefore also not impact these bed forms to a
significant degree.
The deposition within the lunate bed forms is less than 5 mm along the majority of
the alignment, and hence below the critical thickness of deposition of sediment spill
within the lunate bed forms (refer to discussion on sensitivity in Section 5.1.2).
Around the centre pylon, the deposition of around 10 mm is predicted to add 10-
25% to the volumes of the lunate bed forms in a relatively small area (37 ha). The
bed forms are therefore expected to grow in size. With the predicted rate of deposi-
tion, the lunate shape of the bed forms is expected to remain the dominant shape
of the bed forms in the area.
Recovery times
The bed forms are expected to return to their baseline geometrical properties with
time.
Some of the deposited sediment will probably wash out of the bed forms with time.
Some sediment spill will become integrated into bed as they migrate, whereby they
will also recover to their natural equilibrium geometrical shape and properties.
The recovery time for the lunate bed forms is difficult to predict, but it is expected
that the time scale is similar or possibly even slightly larger than re-generation of
the lunate forms from a plane bed (refer to Section 5.1). The effect is expected to
be negligible within 30 years.
Degree of impairment
The degree of impairment is determined based on the assessment criteria in Sec-
tion 3.6.
In the areas of the lunate bed forms, 37 ha are classified with a minor degree of
temporary impairment. The impairments from deposition in the sand wave areas
are less than 10% of the bed form height and considered imperceptible.
7.3.3 Impact severity of impairment
The impaired areas are classified with degrees of severity by combining the above
degrees of impairments with the importance levels.
The impacted lunate bed forms along the alignment have a high importance level.
The impacted area of 37 ha is impaired temporarily with a minor degree of severity,
see Table 7.4.
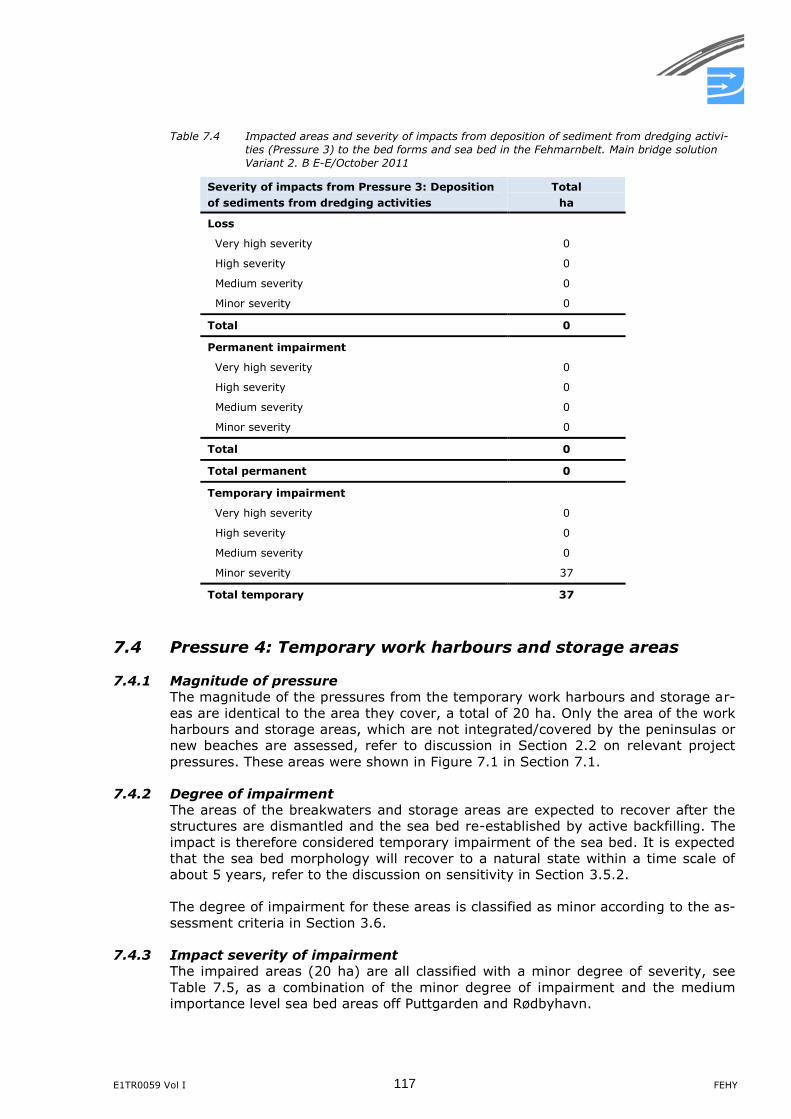
E1TR0059 Vol I 117 FEHY
Table 7.4 Impacted areas and severity of impacts from deposition of sediment from dredging activi-
ties (Pressure 3) to the bed forms and sea bed in the Fehmarnbelt. Main bridge solution
Variant 2. B E-E/October 2011
Severity of impacts from Pressure 3: Deposition
of sediments from dredging activities
Total
ha
Loss
Very high severity 0
High severity 0
Medium severity 0
Minor severity 0
Total 0
Permanent impairment
Very high severity 0
High severity 0
Medium severity 0
Minor severity 0
Total 0
Total permanent 0
Temporary impairment
Very high severity 0
High severity 0
Medium severity 0
Minor severity 37
Total temporary 37
7.4 Pressure 4: Temporary work harbours and storage areas
7.4.1 Magnitude of pressure
The magnitude of the pressures from the temporary work harbours and storage ar-
eas are identical to the area they cover, a total of 20 ha. Only the area of the work
harbours and storage areas, which are not integrated/covered by the peninsulas or
new beaches are assessed, refer to discussion in Section 2.2 on relevant project
pressures. These areas were shown in Figure 7.1 in Section 7.1.
7.4.2 Degree of impairment
The areas of the breakwaters and storage areas are expected to recover after the
structures are dismantled and the sea bed re-established by active backfilling. The
impact is therefore considered temporary impairment of the sea bed. It is expected
that the sea bed morphology will recover to a natural state within a time scale of
about 5 years, refer to the discussion on sensitivity in Section 3.5.2.
The degree of impairment for these areas is classified as minor according to the as-
sessment criteria in Section 3.6.
7.4.3 Impact severity of impairment
The impaired areas (20 ha) are all classified with a minor degree of severity, see
Table 7.5, as a combination of the minor degree of impairment and the medium
importance level sea bed areas off Puttgarden and Rødbyhavn.
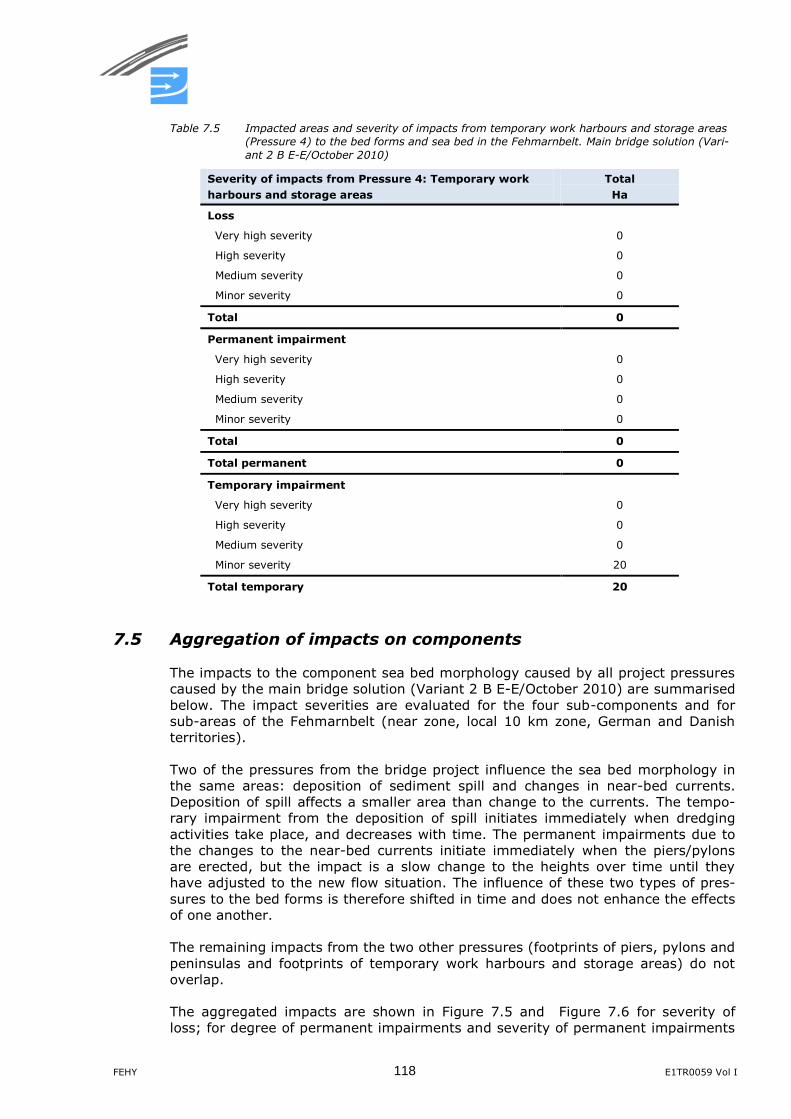
FEHY 118 E1TR0059 Vol I
Table 7.5 Impacted areas and severity of impacts from temporary work harbours and storage areas
(Pressure 4) to the bed forms and sea bed in the Fehmarnbelt. Main bridge solution (Vari-
ant 2 B E-E/October 2010)
Severity of impacts from Pressure 4: Temporary work
harbours and storage areas
Total
Ha
Loss
Very high severity 0
High severity 0
Medium severity 0
Minor severity 0
Total 0
Permanent impairment
Very high severity 0
High severity 0
Medium severity 0
Minor severity 0
Total 0
Total permanent 0
Temporary impairment
Very high severity 0
High severity 0
Medium severity 0
Minor severity 20
Total temporary 20
7.5 Aggregation of impacts on components
The impacts to the component sea bed morphology caused by all project pressures
caused by the main bridge solution (Variant 2 B E-E/October 2010) are summarised
below. The impact severities are evaluated for the four sub-components and for
sub-areas of the Fehmarnbelt (near zone, local 10 km zone, German and Danish
territories).
Two of the pressures from the bridge project influence the sea bed morphology in
the same areas: deposition of sediment spill and changes in near-bed currents.
Deposition of spill affects a smaller area than change to the currents. The tempo-
rary impairment from the deposition of spill initiates immediately when dredging
activities take place, and decreases with time. The permanent impairments due to
the changes to the near-bed currents initiate immediately when the piers/pylons
are erected, but the impact is a slow change to the heights over time until they
have adjusted to the new flow situation. The influence of these two types of pres-
sures to the bed forms is therefore shifted in time and does not enhance the effects
of one another.
The remaining impacts from the two other pressures (footprints of piers, pylons and
peninsulas and footprints of temporary work harbours and storage areas) do not
overlap.
The aggregated impacts are shown in Figure 7.5 and Figure 7.6 for severity of
loss; for degree of permanent impairments and severity of permanent impairments
E1TR0059 Vol I 119 FEHY
in Figure 7.7 and Figure 7.8; and in Figure 7.9and Figure 7.10 for degree of tempo-
rary impairments and severity of temporary impairments , respectively.
7.5.1 Sub-components
The impacts on the four sub-components, sand waves, lunate bed forms, other ac-
tive bed forms and ‘sea bed outside of areas with prominent bed forms’ are sum-
marised below.
The impacts are divided into the four impact levels for severity of loss and for de-
gree of impairments in Table 7.6. Impairments are further divided on the four im-
pact severity levels in Table 7.7.
The impacts are given in areas (ha) and in parts (%) of the areas of the given sub-
component within 10 km from the alignment (local zone + near zone). The total
impacted area (ha) is also provided (in ha) and as part of the total area (%) within
10 km from the alignment.
Sand waves
In total 594 ha of sand waves are impacted out of the total area of sand waves of
1261 ha within 10 km from the alignment. This corresponds to 47.1% of the sand
waves.
The impacts are partly loss due to structures (0.4 ha) and partly permanent im-
pairment (594 ha). Of the permanently impaired sand waves, 3 ha are impaired to
a very high degree, where the sand waves as such are considered ‘lost’, i.e. the sea
bed forms are considered to significantly change character.
The small areas of such a ‘loss’ of sand waves are all within Danish territory. The
loss is caused by piers/pylons occupying the sea bed and the drastic change in the
flow field in the immediate vicinity of the structures.
The remaining areas of impaired sand waves (within Danish as well as German ter-
ritory) are expected to have increasing heights of the bed forms by 10-25% due to
increasing near-bed current speeds caused by the piers/pylons. The heights are ex-
pected to increase over approximately 5-10 years and reach a new permanent
state. Parts of the impacted sand waves (133 ha) are within the areas, where sand
mining has been carried out (Danish territory), and these bed forms are assessed
with no severity of impacts according to the assessment methodology, see Figure
7.8.
The sand wave fields within the German Natura 2000 area are not affected by the
bridge project.
In summary, the majority of the impacted sand waves will remain in the area with
a slight modification to their heights.
Lunate bed forms
3,436 ha of the lunate bed forms in the central part of the Fehmarnbelt is predicted
to be impacted by the main bridge solution. 21.6% of the lunate bed forms within
10 km from the alignment are impacted and 240 ha further away.
The majority of the impacts (96.0% of the impact area for lunate bed forms) to
these bed forms are of a permanent character with a minor degree of impairmentl
caused by the predicted changes to the near-bed current speeds due to the
piers/pylons. The lunate bed forms are expected to maintain their geometry, but
increase in size corresponding to about 10-25% of their heights.
FEHY 120 E1TR0059 Vol I
In the alignment area, deposition of sediment spill increases the volumes of the lu-
nate bed forms. The impairment from the sediment spill (37 ha) is expected to be
of temporary character with a slow recovery of the geometry of the bed forms to a
natural state within approximately 30 years.
There will be a small loss of 137 ha of lunate bed forms due to erection of
piers/pylons and strong changes to the currents in the vicinity in the footprints and
the immediate vicinity of the piers/pylons. This corresponds to 0.9% of the lunate
bed forms within 10 km from the alignment.
Within Natura 2000, 116 ha of lunate bed forms are permanently eliminated (due
to piers/pylons and flow changes in the immediate vicinity of these), 1,253 ha are
impaired permanently to minor degree of impairment and 37 ha are impaired tem-
porarily to a minor degree of impairment. The latter 37 ha overlaps with the per-
manently impaired area assigned a minor degree of impairment.
Other active bed forms
The sub-component characterised by ‘other active bed forms’ are impacted in the
area located about 5 km west of the alignment in German territory within Natura
2000. These bed forms are predicted to have increased heights by 10-25% or 0.05-
0.25 m. The impacts cover 199 ha.
The ‘other active bed forms’ in this area are similar to the sand waves, but less
regular in their rhythmic pattern and heights than the sand waves. The impacts are
not expected to change this.
Sea bed outside of areas with prominent bed forms
63 ha outside of areas with prominent bed forms corresponding to 0.2% of the area
without such morphological features are impacted by the main bridge project.
These impacts are all related to the footprints of the piers/pylons and peninsulas of
the work harbours/storage areas.
The majority of the impacts are loss of natural sea bed (43 ha) where the peninsu-
las with beaches will be build.
The remaining 20 ha are temporarily impacted by the areas of the work har-
bours/storage areas, where these are not integrated into the peninsulas/beaches.
The natural sea bed morphology will recover in these areas after the end of con-
struction.
The impacts to these areas do not constitute any significant influence to the sea
bed morphology.
It is noted that the loss of beach area for recreational purposes and impacts related
to the near-shore sea bed morphology (morphological elements in water depths
less than 6 m DVR90) are treated separately in (FEHY 2013f). Only the loss of sea
bed in the footprint area is included in this report.
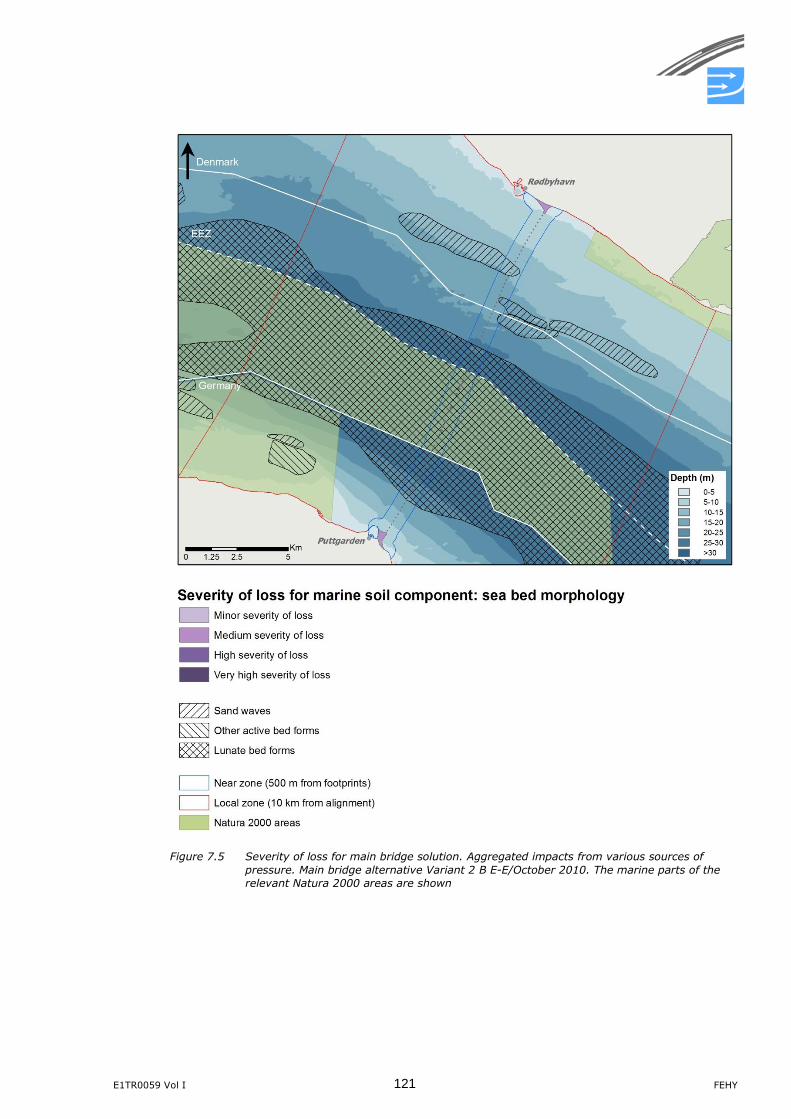
E1TR0059 Vol I 121 FEHY
Figure 7.5 Severity of loss for main bridge solution. Aggregated impacts from various sources of
pressure. Main bridge alternative Variant 2 B E-E/October 2010. The marine parts of the
relevant Natura 2000 areas are shown
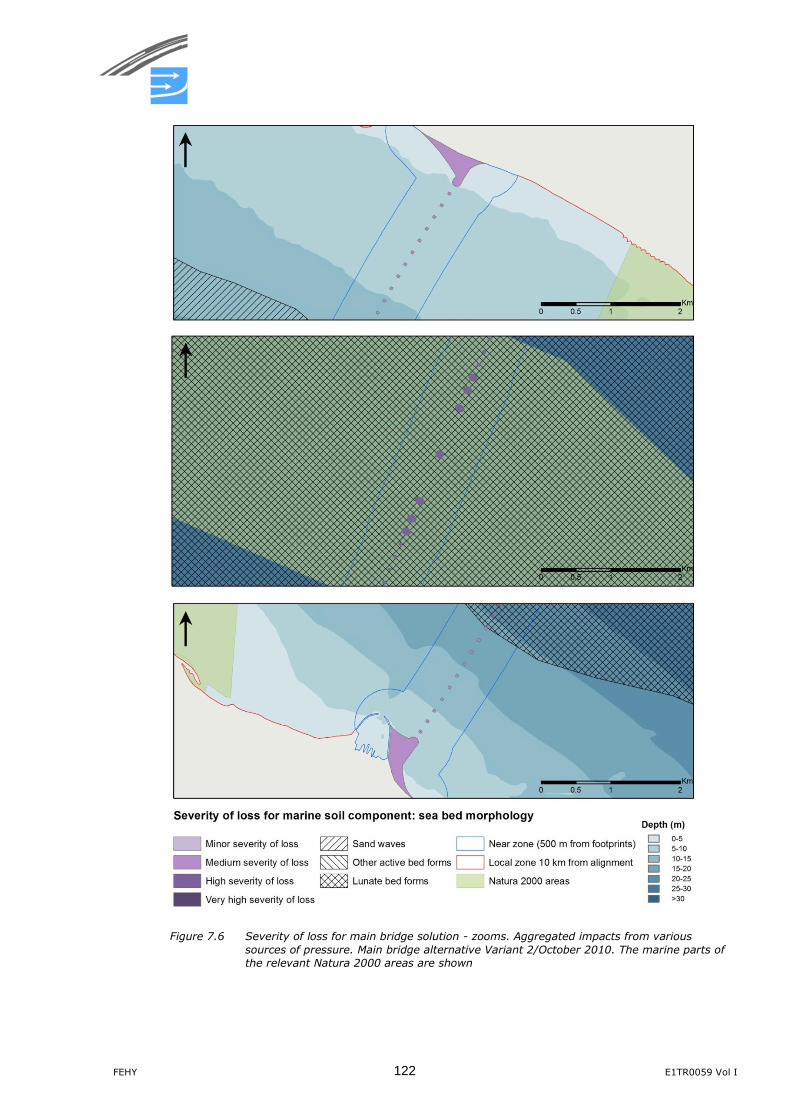
FEHY 122 E1TR0059 Vol I
Figure 7.6 Severity of loss for main bridge solution - zooms. Aggregated impacts from various
sources of pressure. Main bridge alternative Variant 2/October 2010. The marine parts of
the relevant Natura 2000 areas are shown
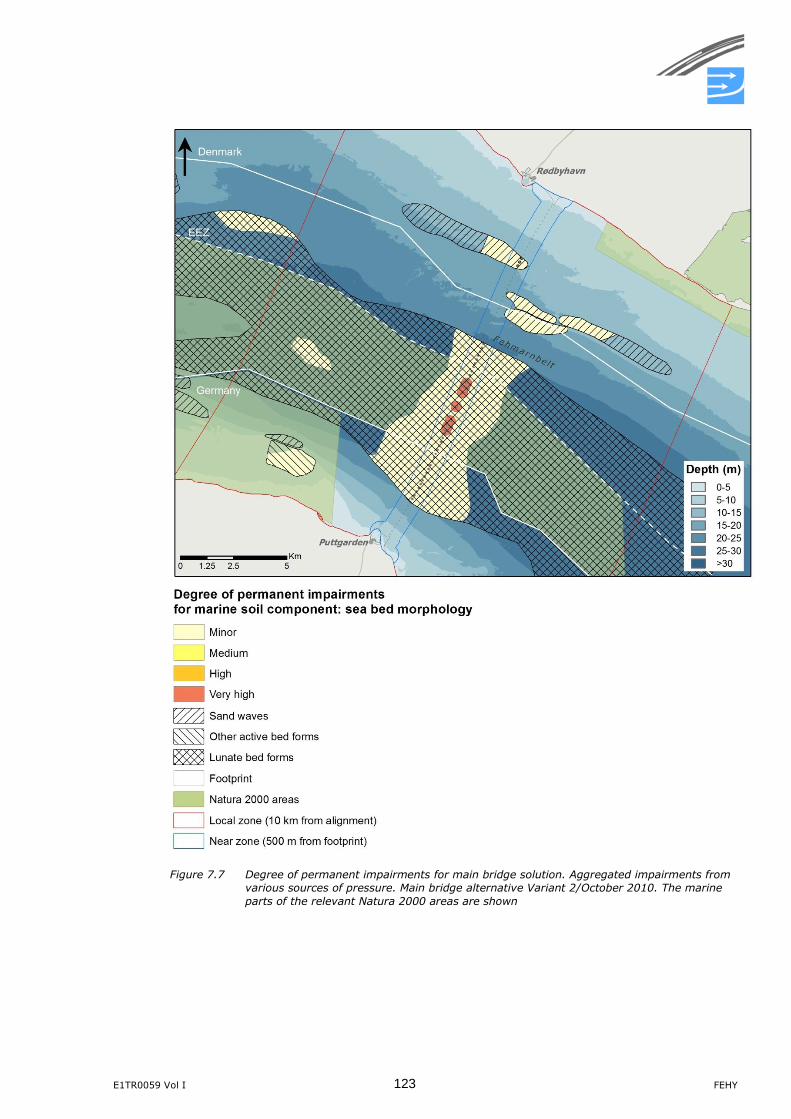
E1TR0059 Vol I 123 FEHY
Figure 7.7 Degree of permanent impairments for main bridge solution. Aggregated impairments from
various sources of pressure. Main bridge alternative Variant 2/October 2010. The marine
parts of the relevant Natura 2000 areas are shown
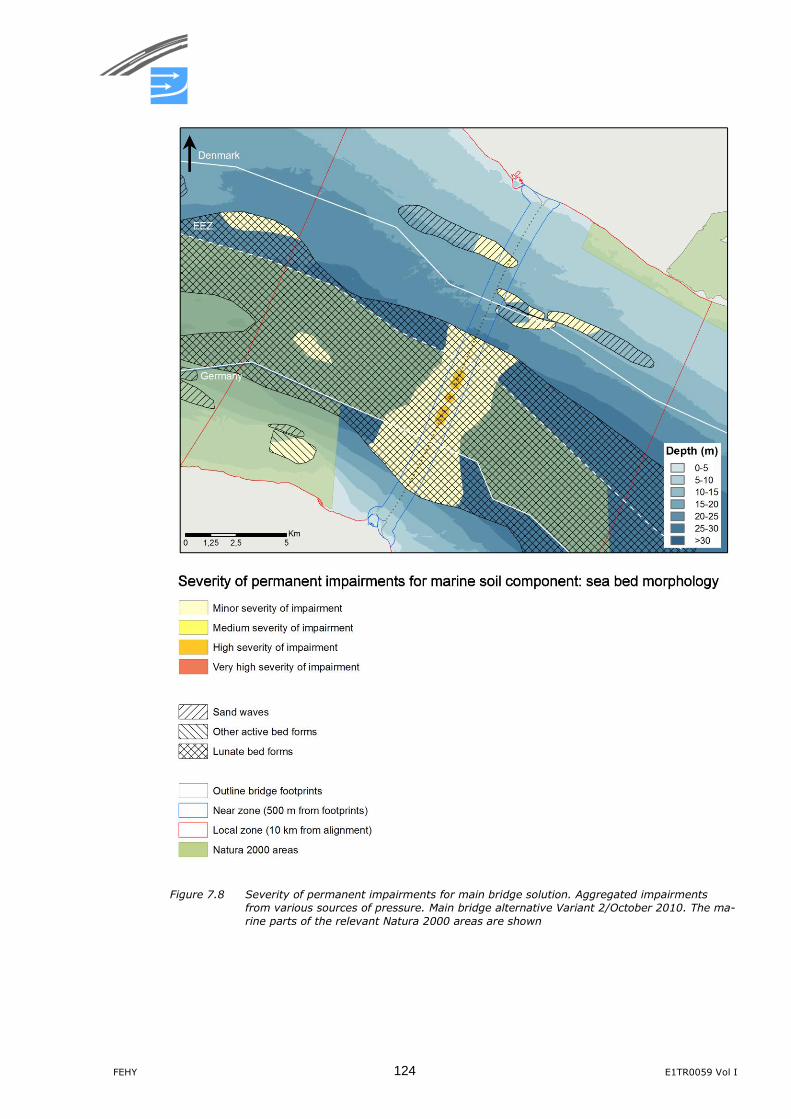
FEHY 124 E1TR0059 Vol I
Figure 7.8 Severity of permanent impairments for main bridge solution. Aggregated impairments
from various sources of pressure. Main bridge alternative Variant 2/October 2010. The ma-
rine parts of the relevant Natura 2000 areas are shown
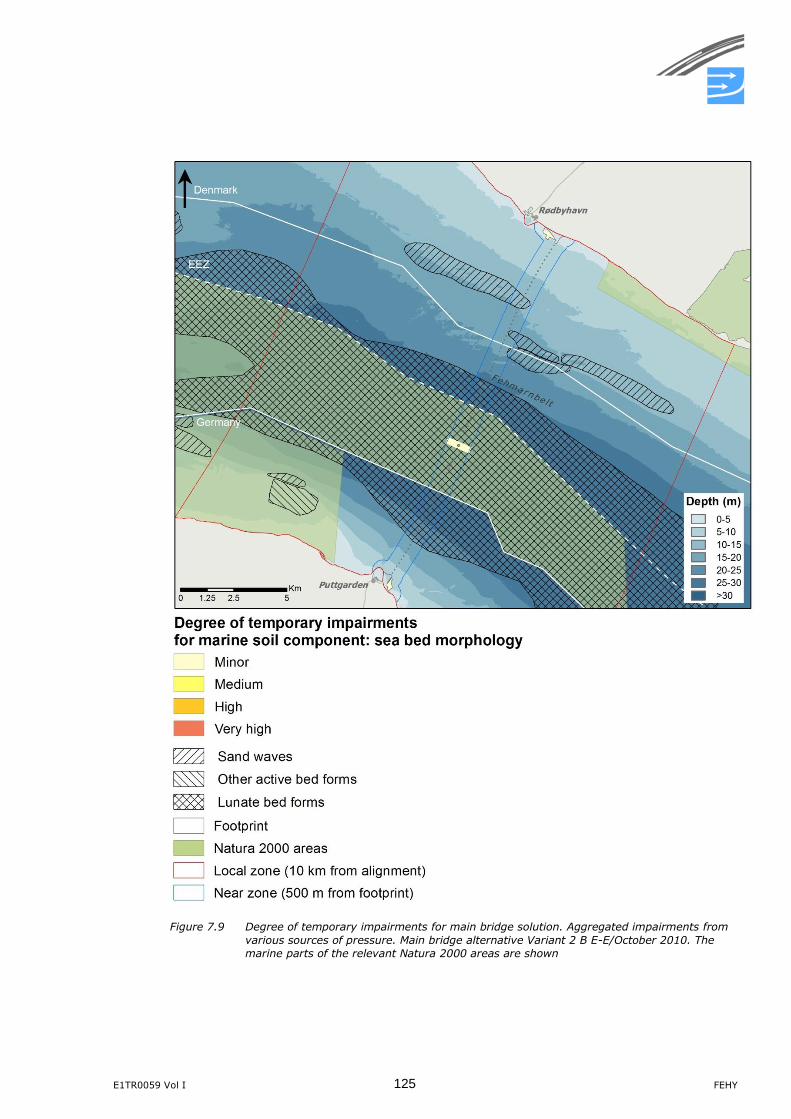
E1TR0059 Vol I 125 FEHY
Figure 7.9 Degree of temporary impairments for main bridge solution. Aggregated impairments from
various sources of pressure. Main bridge alternative Variant 2 B E-E/October 2010. The
marine parts of the relevant Natura 2000 areas are shown
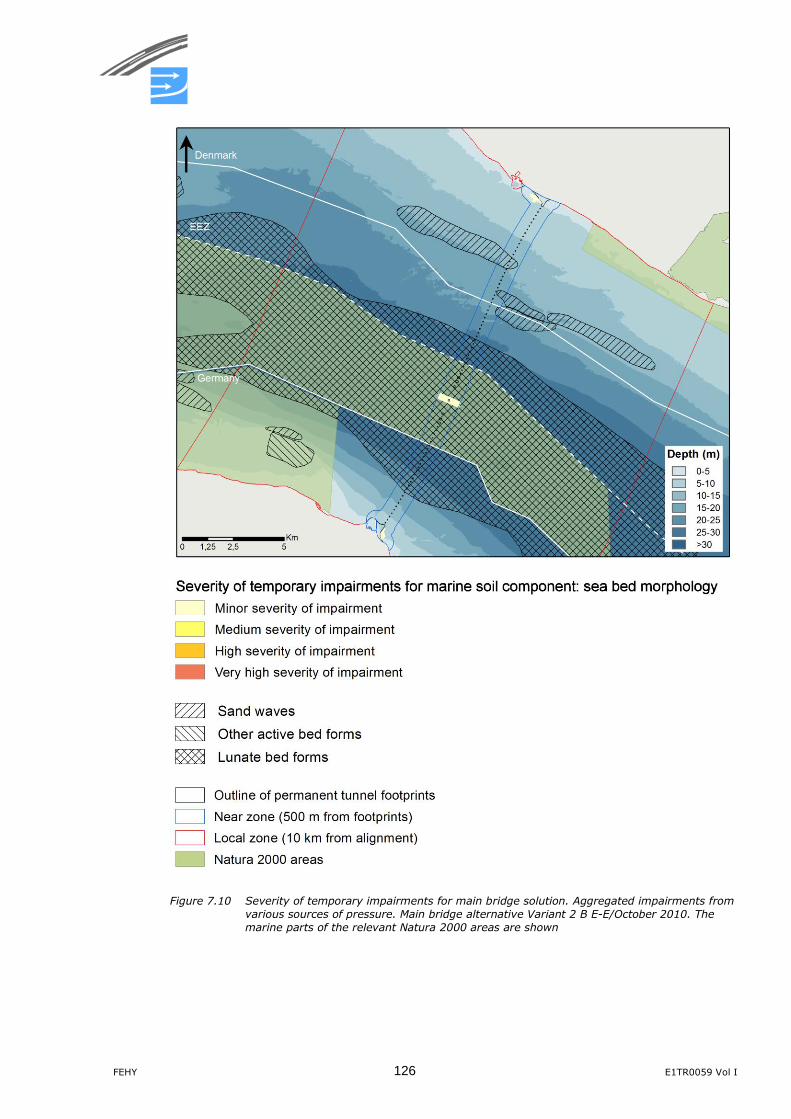
FEHY 126 E1TR0059 Vol I
Figure 7.10 Severity of temporary impairments for main bridge solution. Aggregated impairments from
various sources of pressure. Main bridge alternative Variant 2 B E-E/October 2010. The
marine parts of the relevant Natura 2000 areas are shown
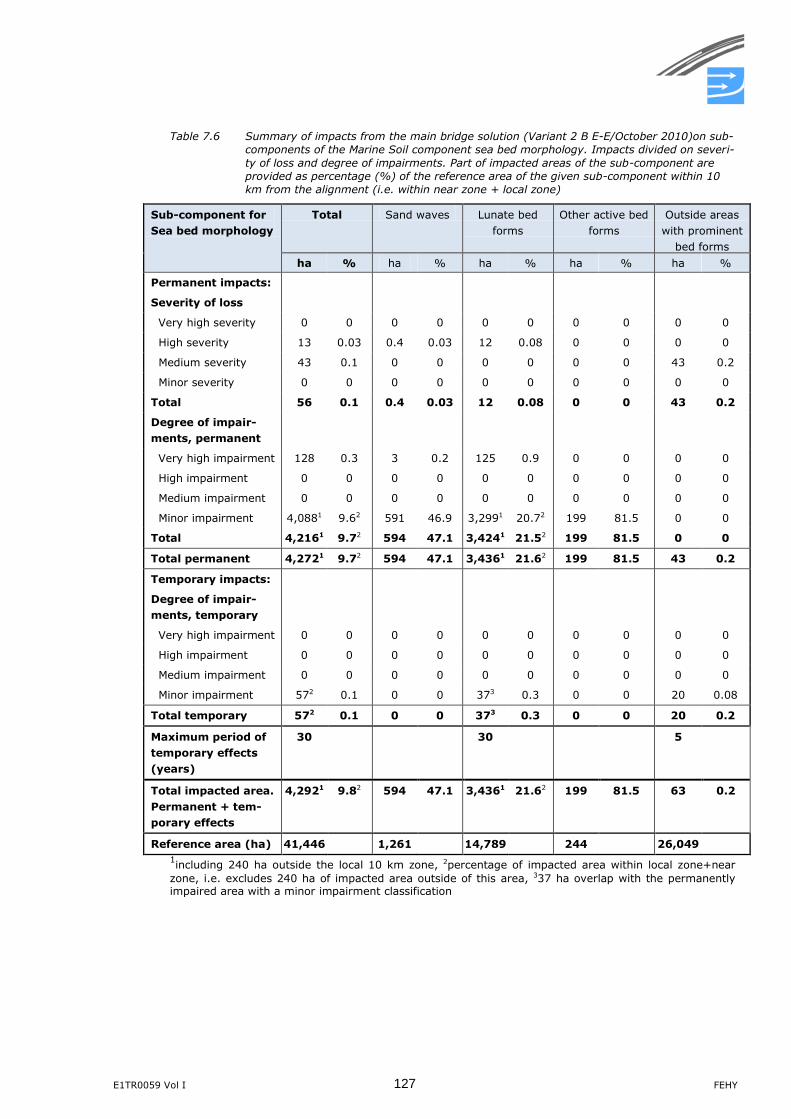
E1TR0059 Vol I 127 FEHY
Table 7.6 Summary of impacts from the main bridge solution (Variant 2 B E-E/October 2010)on sub-
components of the Marine Soil component sea bed morphology. Impacts divided on severi-
ty of loss and degree of impairments. Part of impacted areas of the sub-component are
provided as percentage (%) of the reference area of the given sub-component within 10
km from the alignment (i.e. within near zone + local zone)
Sub-component for
Sea bed morphology
Total Sand waves Lunate bed
forms
Other active bed
forms
Outside areas
with prominent
bed forms
ha % ha % ha % ha % ha %
Permanent impacts:
Severity of loss
Very high severity 0 0 0 0 0 0 0 0 0 0
High severity 13 0.03 0.4 0.03 12 0.08 0 0 0 0
Medium severity 43 0.1 0 0 0 0 0 0 43 0.2
Minor severity 0 0 0 0 0 0 0 0 0 0
Total 56 0.1 0.4 0.03 12 0.08 0 0 43 0.2
Degree of impair-
ments, permanent
Very high impairment 128 0.3 3 0.2 125 0.9 0 0 0 0
High impairment 0 0 0 0 0 0 0 0 0 0
Medium impairment 0 0 0 0 0 0 0 0 0 0
Minor impairment 4,0881 9.62 591 46.9 3,2991 20.72 199 81.5 0 0
Total 4,2161 9.72 594 47.1 3,4241 21.52 199 81.5 0 0
Total permanent 4,2721 9.72 594 47.1 3,4361 21.62 199 81.5 43 0.2
Temporary impacts:
Degree of impair-
ments, temporary
Very high impairment 0 0 0 0 0 0 0 0 0 0
High impairment 0 0 0 0 0 0 0 0 0 0
Medium impairment 0 0 0 0 0 0 0 0 0 0
Minor impairment 572 0.1 0 0 373 0.3 0 0 20 0.08
Total temporary 572 0.1 0 0 373 0.3 0 0 20 0.2
Maximum period of
temporary effects
(years)
30 30 5
Total impacted area.
Permanent + tem-
porary effects
4,2921 9.82 594 47.1 3,4361 21.62 199 81.5 63 0.2
Reference area (ha) 41,446 1,261 14,789 244 26,049
1including 240 ha outside the local 10 km zone, 2percentage of impacted area within local zone+near
zone, i.e. excludes 240 ha of impacted area outside of this area, 337 ha overlap with the permanently impaired area with a minor impairment classification
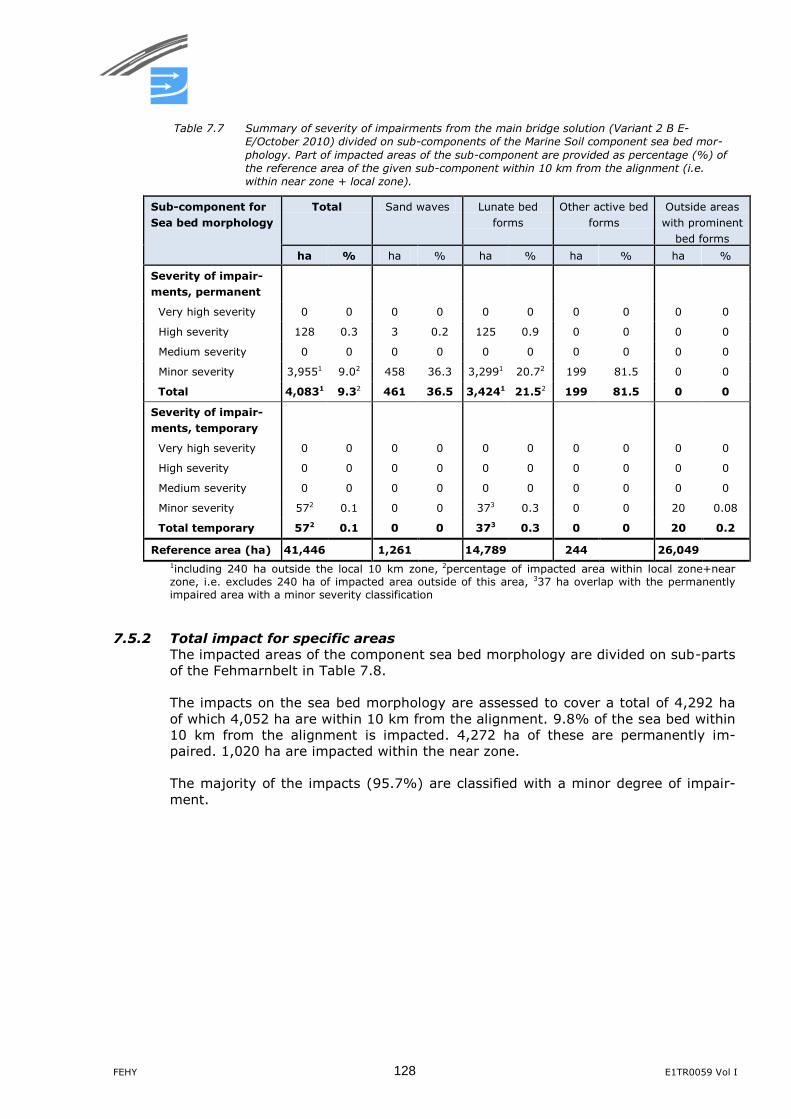
FEHY 128 E1TR0059 Vol I
Table 7.7 Summary of severity of impairments from the main bridge solution (Variant 2 B E-
E/October 2010) divided on sub-components of the Marine Soil component sea bed mor-
phology. Part of impacted areas of the sub-component are provided as percentage (%) of
the reference area of the given sub-component within 10 km from the alignment (i.e.
within near zone + local zone).
Sub-component for
Sea bed morphology
Total Sand waves Lunate bed
forms
Other active bed
forms
Outside areas
with prominent
bed forms
ha % ha % ha % ha % ha %
Severity of impair-
ments, permanent
Very high severity 0 0 0 0 0 0 0 0 0 0
High severity 128 0.3 3 0.2 125 0.9 0 0 0 0
Medium severity 0 0 0 0 0 0 0 0 0 0
Minor severity 3,9551 9.02 458 36.3 3,2991 20.72 199 81.5 0 0
Total 4,0831 9.32 461 36.5 3,4241 21.52 199 81.5 0 0
Severity of impair-
ments, temporary
Very high severity 0 0 0 0 0 0 0 0 0 0
High severity 0 0 0 0 0 0 0 0 0 0
Medium severity 0 0 0 0 0 0 0 0 0 0
Minor severity 572 0.1 0 0 373 0.3 0 0 20 0.08
Total temporary 572 0.1 0 0 373 0.3 0 0 20 0.2
Reference area (ha) 41,446 1,261 14,789 244 26,049
1including 240 ha outside the local 10 km zone, 2percentage of impacted area within local zone+near zone, i.e. excludes 240 ha of impacted area outside of this area, 337 ha overlap with the permanently impaired area with a minor severity classification
7.5.2 Total impact for specific areas
The impacted areas of the component sea bed morphology are divided on sub-parts
of the Fehmarnbelt in Table 7.8.
The impacts on the sea bed morphology are assessed to cover a total of 4,292 ha
of which 4,052 ha are within 10 km from the alignment. 9.8% of the sea bed within
10 km from the alignment is impacted. 4,272 ha of these are permanently im-
paired. 1,020 ha are impacted within the near zone.
The majority of the impacts (95.7%) are classified with a minor degree of impair-
ment.
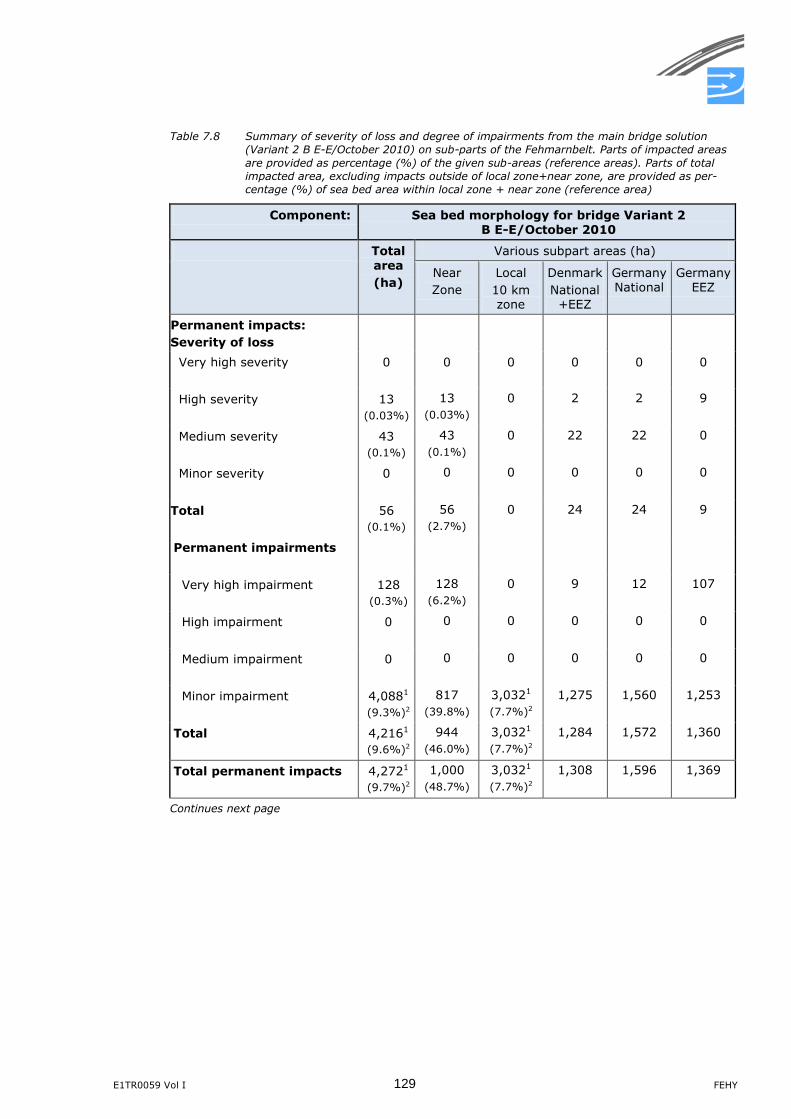
E1TR0059 Vol I 129 FEHY
Table 7.8 Summary of severity of loss and degree of impairments from the main bridge solution
(Variant 2 B E-E/October 2010) on sub-parts of the Fehmarnbelt. Parts of impacted areas
are provided as percentage (%) of the given sub-areas (reference areas). Parts of total
impacted area, excluding impacts outside of local zone+near zone, are provided as per-
centage (%) of sea bed area within local zone + near zone (reference area)
Component: Sea bed morphology for bridge Variant 2 B E-E/October 2010
Total area
(ha)
Various subpart areas (ha)
Near
Zone
Local
10 km zone
Denmark
National +EEZ
Germany National
Germany EEZ
Permanent impacts:
Severity of loss
Very high severity 0 0 0 0 0 0
High severity 13
(0.03%)
13
(0.03%)
0
2 2 9
Medium severity 43
(0.1%)
43
(0.1%)
0
22 22 0
Minor severity 0 0 0 0 0 0
Total
56
(0.1%)
56
(2.7%)
0
24 24 9
Permanent impairments
Very high impairment 128
(0.3%)
128
(6.2%)
0 9 12 107
High impairment 0 0 0 0 0 0
Medium impairment 0 0 0 0 0 0
Minor impairment 4,0881
(9.3%)2
817
(39.8%)
3,0321
(7.7%)2
1,275 1,560 1,253
Total
4,2161
(9.6%)2
944
(46.0%)
3,0321
(7.7%)2
1,284 1,572 1,360
Total permanent impacts 4,2721
(9.7%)2
1,000
(48.7%)
3,0321
(7.7%)2
1,308 1,596 1,369
Continues next page
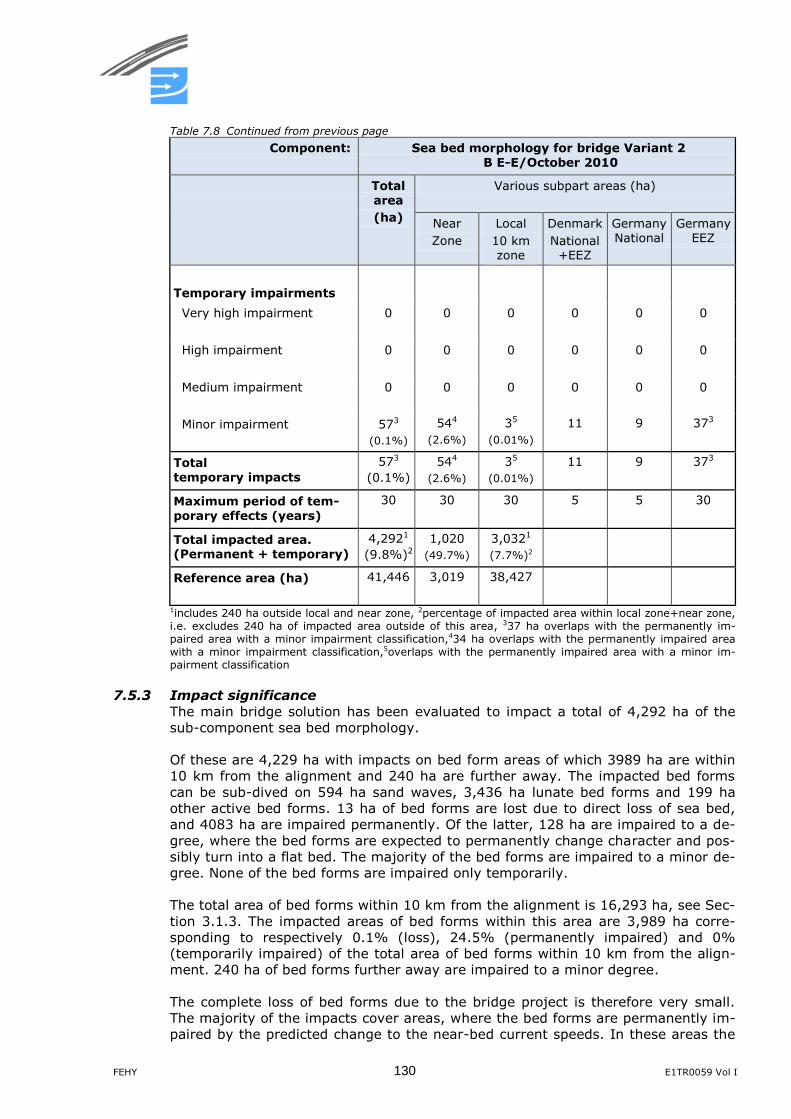
FEHY 130 E1TR0059 Vol I
Table 7.8 Continued from previous page
Component: Sea bed morphology for bridge Variant 2 B E-E/October 2010
Total area
(ha)
Various subpart areas (ha)
Near
Zone
Local
10 km zone
Denmark
National +EEZ
Germany National
Germany EEZ
Temporary impairments
Very high impairment 0 0 0 0 0 0
High impairment 0 0 0 0 0 0
Medium impairment 0 0 0 0 0 0
Minor impairment 573
(0.1%)
544
(2.6%)
35
(0.01%)
11 9 373
Total temporary impacts
573 (0.1%)
544
(2.6%)
35
(0.01%)
11 9 373
Maximum period of tem-porary effects (years)
30 30 30 5 5 30
Total impacted area. (Permanent + temporary)
4,2921 (9.8%)2
1,020
(49.7%)
3,0321
(7.7%)2
Reference area (ha) 41,446 3,019 38,427
1includes 240 ha outside local and near zone, 2percentage of impacted area within local zone+near zone, i.e. excludes 240 ha of impacted area outside of this area, 337 ha overlaps with the permanently im-paired area with a minor impairment classification,434 ha overlaps with the permanently impaired area with a minor impairment classification,5overlaps with the permanently impaired area with a minor im-pairment classification
7.5.3 Impact significance
The main bridge solution has been evaluated to impact a total of 4,292 ha of the
sub-component sea bed morphology.
Of these are 4,229 ha with impacts on bed form areas of which 3989 ha are within
10 km from the alignment and 240 ha are further away. The impacted bed forms
can be sub-dived on 594 ha sand waves, 3,436 ha lunate bed forms and 199 ha
other active bed forms. 13 ha of bed forms are lost due to direct loss of sea bed,
and 4083 ha are impaired permanently. Of the latter, 128 ha are impaired to a de-
gree, where the bed forms are expected to permanently change character and pos-
sibly turn into a flat bed. The majority of the bed forms are impaired to a minor de-
gree. None of the bed forms are impaired only temporarily.
The total area of bed forms within 10 km from the alignment is 16,293 ha, see Sec-
tion 3.1.3. The impacted areas of bed forms within this area are 3,989 ha corre-
sponding to respectively 0.1% (loss), 24.5% (permanently impaired) and 0%
(temporarily impaired) of the total area of bed forms within 10 km from the align-
ment. 240 ha of bed forms further away are impaired to a minor degree.
The complete loss of bed forms due to the bridge project is therefore very small.
The majority of the impacts cover areas, where the bed forms are permanently im-
paired by the predicted change to the near-bed current speeds. In these areas the
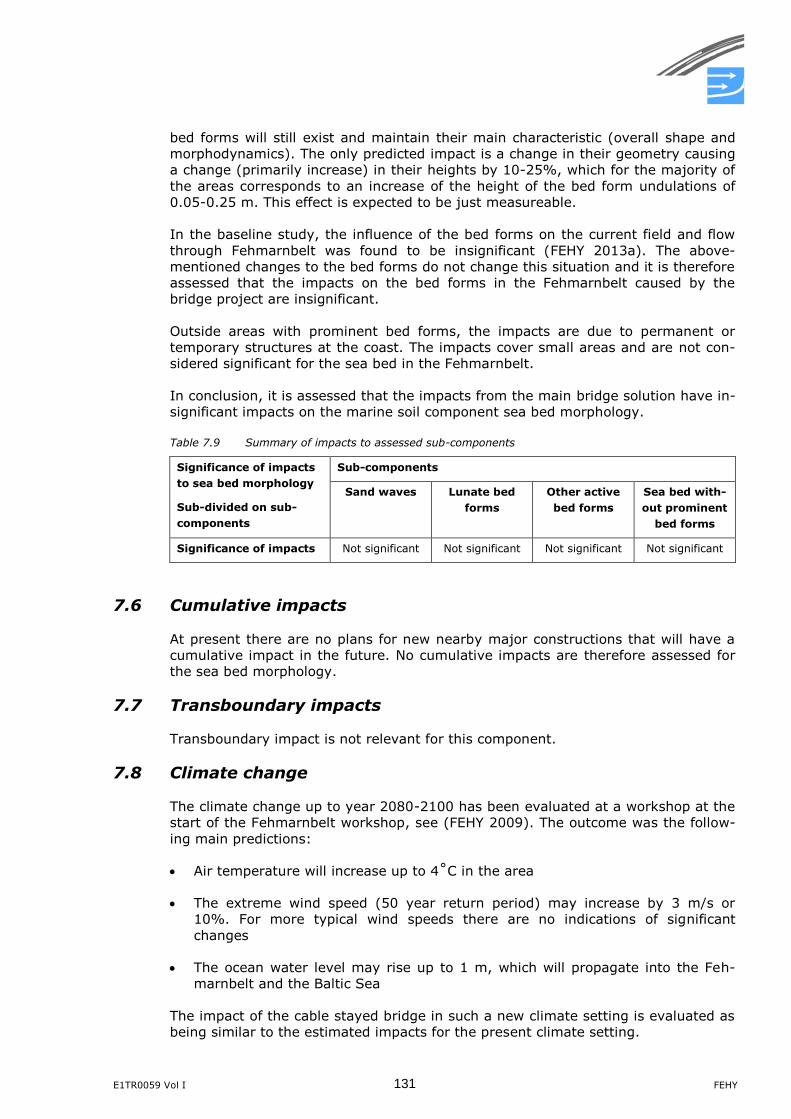
E1TR0059 Vol I 131 FEHY
bed forms will still exist and maintain their main characteristic (overall shape and
morphodynamics). The only predicted impact is a change in their geometry causing
a change (primarily increase) in their heights by 10-25%, which for the majority of
the areas corresponds to an increase of the height of the bed form undulations of
0.05-0.25 m. This effect is expected to be just measureable.
In the baseline study, the influence of the bed forms on the current field and flow
through Fehmarnbelt was found to be insignificant (FEHY 2013a). The above-
mentioned changes to the bed forms do not change this situation and it is therefore
assessed that the impacts on the bed forms in the Fehmarnbelt caused by the
bridge project are insignificant.
Outside areas with prominent bed forms, the impacts are due to permanent or
temporary structures at the coast. The impacts cover small areas and are not con-
sidered significant for the sea bed in the Fehmarnbelt.
In conclusion, it is assessed that the impacts from the main bridge solution have in-
significant impacts on the marine soil component sea bed morphology.
Table 7.9 Summary of impacts to assessed sub-components
Significance of impacts
to sea bed morphology
Sub-divided on sub-
components
Sub-components
Sand waves Lunate bed
forms
Other active
bed forms
Sea bed with-
out prominent
bed forms
Significance of impacts Not significant Not significant Not significant Not significant
7.6 Cumulative impacts
At present there are no plans for new nearby major constructions that will have a
cumulative impact in the future. No cumulative impacts are therefore assessed for
the sea bed morphology.
7.7 Transboundary impacts
Transboundary impact is not relevant for this component.
7.8 Climate change
The climate change up to year 2080-2100 has been evaluated at a workshop at the
start of the Fehmarnbelt workshop, see (FEHY 2009). The outcome was the follow-
ing main predictions:
Air temperature will increase up to 4˚C in the area
The extreme wind speed (50 year return period) may increase by 3 m/s or
10%. For more typical wind speeds there are no indications of significant
changes
The ocean water level may rise up to 1 m, which will propagate into the Feh-
marnbelt and the Baltic Sea
The impact of the cable stayed bridge in such a new climate setting is evaluated as
being similar to the estimated impacts for the present climate setting.
FEHY 132 E1TR0059 Vol I
7.9 Mitigation and compensation measures
No mitigation and compensation measures are suggested. The majority of the im-
pacts from the bridge are due to changes to the near-bed flow from the bridge
piers. Further optimization of the piers with the purpose of reducing these impacts
(of minor degree of impairment) to the bed forms are considered to be too costly
and not recommendable.
7.10 Decommissioning
Decommissioning is foreseen to take place in the year 2140, when the fixed link
has been in operation for the design lifetime of 120 years.
During decommissioning, the marine ramps will be removed. It is expected that the
sea bed will be re-established. The sea bed morphology will in the areas of the ma-
rine ramps recover to a natural state in less than 5 years.
Piers and pylons will be removed. This includes the caissons, backfill material
around the caissons and scour protection material, which extend to a depth of
about 4-5 m below the sea bed. It is expected that the dismantling will leave holes
in the sea bed, which will not be backfilled as a part of the decommissioning pro-
cess.
Natural backfilling of such holes will take place, when the natural sediment
transport along the sea bed is trapped in the holes. The sea bed will recover to a
natural state. The recovery time depends on the natural transport of sediment on
the sea bed and the geometry of the holes (depth, width). Typical widths of the
piers/pylons including the scour protection are in the order of 40 m and 90 m, re-
spectively. Typical gross sediment transport rates (refer to Section 3.3.2) are in the
order of 20 m3/m. Recovery times for the sea bed are estimated to be in the order
of 10 years for the holes following the removal of the piers and 22 years for the
holes following the removal of the pylons.
E1TR0059 Vol I 133 FEHY
8 COMPARISON OF BRIDGE AND TUNNEL MAIN ALTERNATIVES
8.1 Comparison of tunnel and bridge alternatives with continued ferry operation
The cable stayed bridge alternative impacts a larger part of the sea bed in the
Fehmarnbelt than the immersed tunnel alternative, see comparison in Table 8.1.
The bridge is assessed to impact a total of 4,292 ha of which 4,052 ha are within
10 km from the alignment. 9.8% of the sea bed within 10 km from the alignment is
impacted. The tunnel impacts a total of 1,471 ha corresponding to 3.6% of the sea
bed within 10 km from the alignment.
The nature of the impacts from the bridge project differs from the impacts from the
tunnel project. The impacts related to the bridge are primarily current-induced
changes causing the heights/lengths of the bed forms to increase by 10-25%.
These changes are permanent, but due to the character of the impacts classified
with a minor degree of impairment.
The changes from the tunnel project are mainly related to the dredging activities by
which some bed forms will be removed during the dredging for the tunnel trench
and some will be affected by deposition of dredged sea bed material. These impacts
will be of a temporary character since the bed forms are predicted to recover in less
than 30-40 years. The majority of these temporary impairments are classified as
having a minor or medium degree of impairment. The impacts from the bridge are
therefore to a higher degree permanent, while the impacts from the tunnel are pri-
marily temporary impacts.
The total loss of sea bed is, however, smaller for the bridge than for the tunnel.
This is primarily due to the large reclamation on the Danish side in case of the tun-
nel.
For both projects, however, only very limited areas are impaired to a high or very
high degree. For the immersed tunnel project these accounts for 103 ha and for the
cable stayed bridge project 128 ha are impaired with high or very high degree of
impairment. In the baseline study, the influence of the bed forms on the current
field and flow through the Fehmarnbelt was found to be insignificant (FEHY 2013a).
The above-mentioned changes to the bed forms in either project do not change this
situation.
In conclusion, the impacts from the bridge project as well as the tunnel project are
assessed as insignificant for the marine soil component sea bed morphology. The
differences in the impacted areas as well as the difference in the character of the
impacts from the projects do not lead to one or the other project being the pre-
ferred option based on the impacts on sea bed morphology. Table 8.2summarises
the comparison of the immersed tunnel and cable stayed bridge.
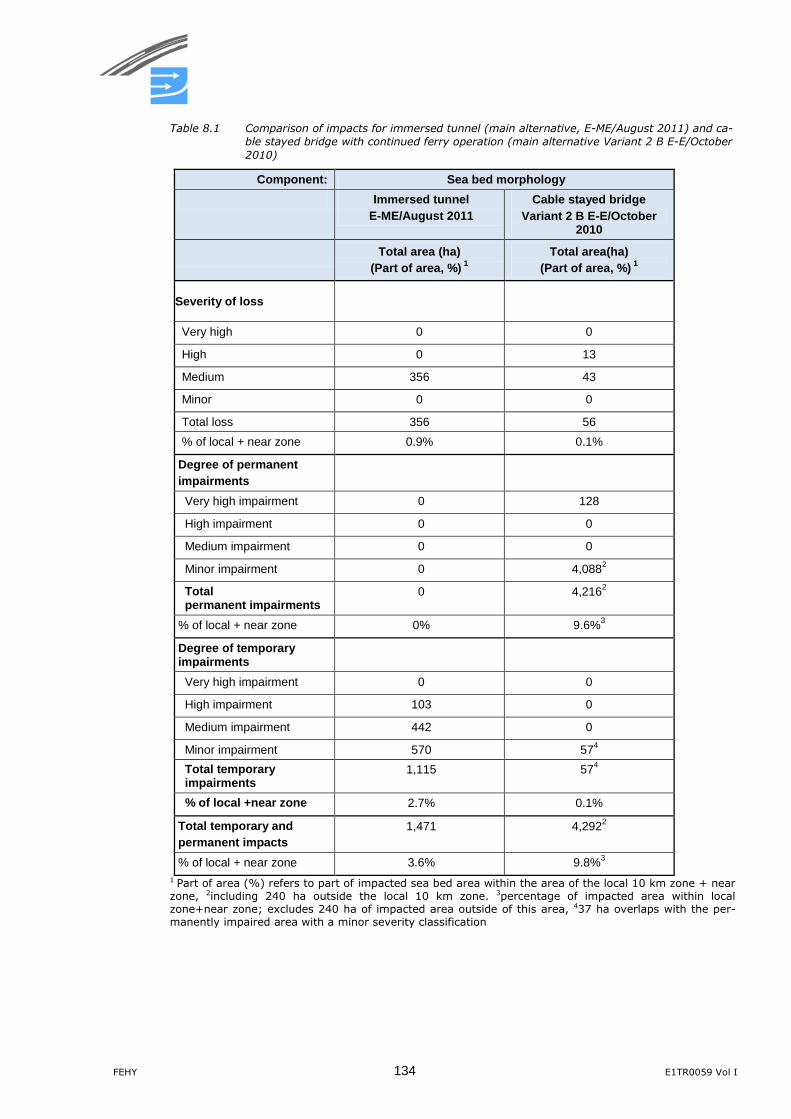
FEHY 134 E1TR0059 Vol I
Table 8.1 Comparison of impacts for immersed tunnel (main alternative, E-ME/August 2011) and ca-
ble stayed bridge with continued ferry operation (main alternative Variant 2 B E-E/October
2010)
Component: Sea bed morphology
Immersed tunnel
E-ME/August 2011
Cable stayed bridge
Variant 2 B E-E/October 2010
Total area (ha)
(Part of area, %) 1
Total area(ha)
(Part of area, %) 1
Severity of loss
Very high 0 0
High 0 13
Medium 356 43
Minor 0 0
Total loss 356 56
% of local + near zone 0.9% 0.1%
Degree of permanent
impairments
Very high impairment 0 128
High impairment 0 0
Medium impairment 0 0
Minor impairment 0 4,0882
Total permanent impairments
0 4,2162
% of local + near zone 0% 9.6%3
Degree of temporary impairments
Very high impairment 0 0
High impairment 103 0
Medium impairment 442 0
Minor impairment 570 574
Total temporary impairments
1,115 574
% of local +near zone 2.7% 0.1%
Total temporary and
permanent impacts
1,471 4,2922
% of local + near zone 3.6% 9.8%3
1 Part of area (%) refers to part of impacted sea bed area within the area of the local 10 km zone + near zone, 2including 240 ha outside the local 10 km zone. 3percentage of impacted area within local zone+near zone; excludes 240 ha of impacted area outside of this area, 437 ha overlaps with the per-manently impaired area with a minor severity classification
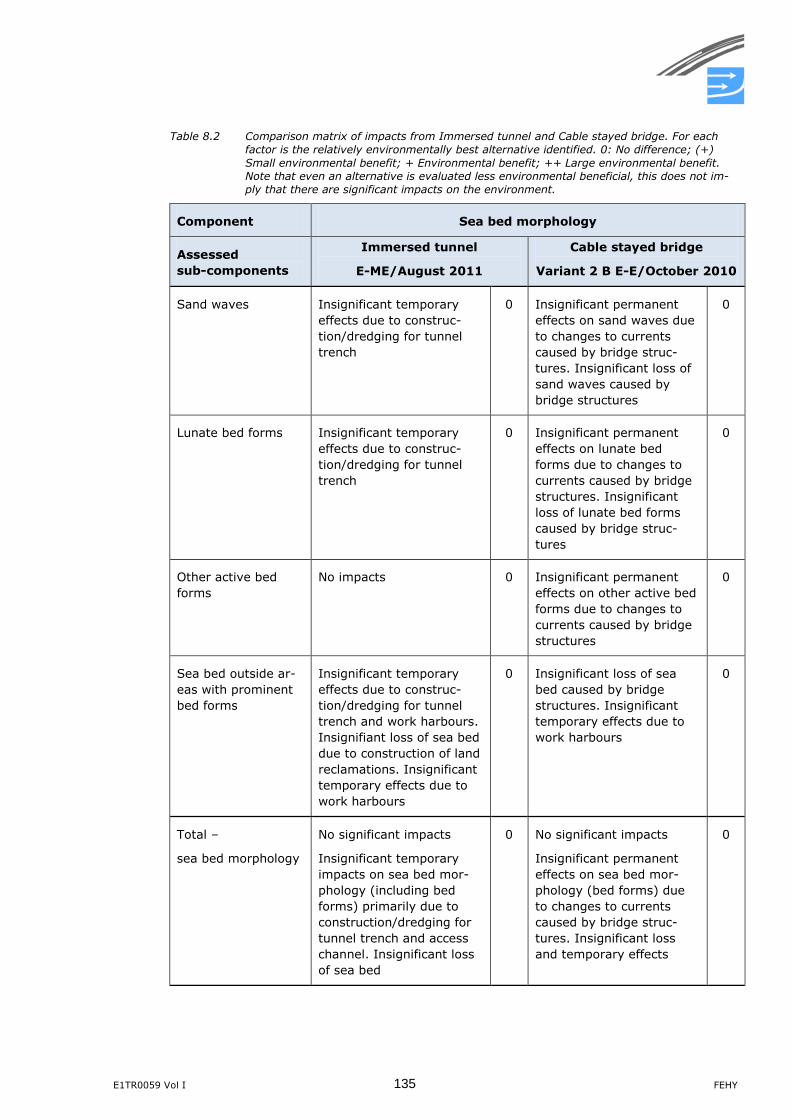
E1TR0059 Vol I 135 FEHY
Table 8.2 Comparison matrix of impacts from Immersed tunnel and Cable stayed bridge. For each
factor is the relatively environmentally best alternative identified. 0: No difference; (+)
Small environmental benefit; + Environmental benefit; ++ Large environmental benefit.
Note that even an alternative is evaluated less environmental beneficial, this does not im-
ply that there are significant impacts on the environment.
Component Sea bed morphology
Assessed
sub-components
Immersed tunnel
E-ME/August 2011
Cable stayed bridge
Variant 2 B E-E/October 2010
Sand waves Insignificant temporary
effects due to construc-
tion/dredging for tunnel
trench
0 Insignificant permanent
effects on sand waves due
to changes to currents
caused by bridge struc-
tures. Insignificant loss of
sand waves caused by
bridge structures
0
Lunate bed forms Insignificant temporary
effects due to construc-
tion/dredging for tunnel
trench
0 Insignificant permanent
effects on lunate bed
forms due to changes to
currents caused by bridge
structures. Insignificant
loss of lunate bed forms
caused by bridge struc-
tures
0
Other active bed
forms
No impacts 0 Insignificant permanent
effects on other active bed
forms due to changes to
currents caused by bridge
structures
0
Sea bed outside ar-
eas with prominent
bed forms
Insignificant temporary
effects due to construc-
tion/dredging for tunnel
trench and work harbours.
Insignifiant loss of sea bed
due to construction of land
reclamations. Insignificant
temporary effects due to
work harbours
0 Insignificant loss of sea
bed caused by bridge
structures. Insignificant
temporary effects due to
work harbours
0
Total –
sea bed morphology
No significant impacts
Insignificant temporary
impacts on sea bed mor-
phology (including bed
forms) primarily due to
construction/dredging for
tunnel trench and access
channel. Insignificant loss
of sea bed
0 No significant impacts
Insignificant permanent
effects on sea bed mor-
phology (bed forms) due
to changes to currents
caused by bridge struc-
tures. Insignificant loss
and temporary effects
0
FEHY 136 E1TR0059 Vol I
8.2 Comparison of tunnel and bridge alternatives without contin-ued ferry operation
The comparison of the tunnel and bridge alternative without the continued ferry op-
eration is not carried out for sea bed morphology.
The ferry operation is not expected to have any significant impacts on the near-bed
currents in the bed form areas. The assessment carried out for the situation with
continued ferry operation is therefore expected to cover the situation without con-
tinued ferry operation.
E1TR0059 Vol I 137 FEHY
9 CONSEQUENCES TO IMPLEMENTATION OF WFD AND MSFD
Neither the impacts from the tunnel project nor the impacts from the bridge project
on the sea bed morphology are assessed to influence the possibilities of fulfilling
the criteria for good environmental status for descriptor 6 in the MSFD.
The consequences to implementation of WFD are not considered relevant for sea
bed morphology.
FEHY 138 E1TR0059 Vol I
10 KNOWLEDGE GAPS
The assessment of the sea bed morphology is based on a very a detailed mapping
of the bed forms and detailed modelling of currents, waves, sediment transport and
sediment spreading.
Bed forms and the response of bed forms to variations in their environment are still
research topics. The responses to the pressures from the bridge and tunnel align-
ment are, however, considered to be generally well understood in a qualitative
manner.
The assessment of sea bed morphology is assessed having a medium degree of un-
certainty.
E1TR0059 Vol I 139 FEHY
11 REFERENCES
Deigaard, R. and Fredsøe, J. (1992). Mechanics of Coastal Sediment Transport .
Advanced Series on Ocean Engineering – Volume 3. World Scientic
DHI. MIKE 21 and MIKE3 Flow Model FM. Hydrodynamic Module. Short description.
http://www.mikebydhi.com/~/media/Microsite_MIKEbyDHI/Publications/PDF/
MIKE213_FM_HD_Short_Description.ashx
Feasibility Study (2006). Fixed Link across the Fehmarnbelt and the Environment.
Environmental Consultation Report, 2006, Ministry of Transport and Energy,
Denmark. ISBN 87-90917-25-1
FEHY (2009). Fehmarnbelt Fixed Link. Climate Change and the Fehmarnbelt Fixed
Link. Report on the Workshop on Climate Scenarios. 13 and 14 May 2009‟.
Report E1TR0020 Final. September 2009
FEHY (2013a). Fehmarnbelt Fixed Link EIA. Marine Soil. Volume I. Sea bed Morphol-
ogy of the Fehmarnbelt Area – Baseline. Report No. E1TR0056.
FEHY (2013b). Fehmarnbelt Fixed Link EIA. Marine Water- Baseline. Hydrography of
the Fehmarnbelt Area. Report No. E1TR0057 Volume II.
FEHY (2013c). Fehmarnbelt Fixed Link EIA. Marine Water – Baseline. Suspended
Sediment. Report No. EITR0057 Volume III.
FEHY (2013d). Fehmarnbelt Fixed Link EIA. Marine Soil – Impact Assessment. Sea
bed Spill. Report No. E1TR0059 Volume II.
FEHY (2013e). Fehmarnbelt Fixed Link EIA. Marine Water- Impact Assessment. Hy-
drography of the Fehmarnbelt Area. Report No. E1TR0058 Volume II.
FEHY (2013f). Fehmarnbelt Fixed Link EIA. Marine Soil – Impact Assessment.
Coastal Morphology. Report No. E1TR0059 Volume III.
FEHY (2013g). Fehmarnbelt Fixed Link EIA. Marine Water- Impact Assessment. Hy-
drography, Water Quality and Plankton of the Baltic Sea. Report No.
E1TR0058 Volume I.
FEMA (2013a). Fehmarnbelt Fixed Link EIA. Fauna and Flora. Plankton and Benthic
Biology - Impact Assessment. Benthic Flora in the Fehmarnbelt Area – Impact
Assessment. Report No. E2TR0021 Volume I.
Femern A/S (2011). Consolidated Technical Report
Femern and LBV-SH-Lübeck (2010). Proposal for environmental investigation pro-
gramme for the fixed link across Fehmarnbelt (coast-coast). EIA Scoping Re-
port.
Femern Sund og Bælt, Miljøkriterier, Marts 2011
Fredsøe, J (1974). The development of oblique dunes, part 3 and part 4, Prog.Rep.
33 and 34, ISVA, DTU
Fredsøe, J. (1982). “Shape and Dimensions of Stationary Dunes in Rivers.” Journal
of the Hydraulics Division, ASCE 108(8): 932-947
FEHY 140 E1TR0059 Vol I
Niemann, S.L, Fredsøe, J. and Jacobsen, N.G. (2011). Sand Dunes in Steady Flow
at Low Froude Numbers: Dune Height Evolution and Flow Resistance. Journal
of Hydraulic Engineering, 137: 5-14
Niemann, S. L. (2003). Modelling of sand dunes in steady and tidal flow, Phd-
thesis, Coastal and River Engineering Section, Technical University of Den-
mark
http://www.skk.mek.dtu.dk/upload/institutter/mek/skk/pdf/phd_afhandlin-
ger/2003/sanne%20niemann-phd.pdf
Novak and Björk (2002). Late Pleistocene Holocene fluvial faces and depositional
processes in the Fehmarnbelt between Germany and Denmark, revealed by
high-resolution seismic and litofacies analysis. Sedimentology 49, 451-465
RAT (2011): Data for Impact Assessment by consultants. Technical drawings of
Immersed Tunnel: RAT-T-P-X00-1050-2 to RAT-T-P-X00-1057-2. RAT-T-P-
M10-0001-2
Tjerry, Søren and Fredsøe, Jørgen (2005). Calculation of dune morphology, Journal
of Geophysical Research, vol. 110, F04013
E1TR0059 Vol I i FEHY
Table of figures
Figure 0.1 Prominent bed forms in the Fehmarnbelt (from FEHY 2013a). The marine parts
of the relevant Natura 2000 areas are shown. The “area of investigation” shows
the area where prominent bed forms have been mapped .............................. 2
Figure 0.2 Severity of loss for main tunnel alternative E-ME/August 2011. Aggregated
impacts from various sources of pressure. The marine parts of the relevant
Natura 2000 areas are shown .................................................................... 5
Figure 0.3 Degree of temporary impairments for main tunnel alternative E-ME/August
2011. Aggregated impairments from various sources of pressure. The marine
parts of the relevant Natura 2000 areas are shown ...................................... 6
Figure 0.4 Severity of loss for main bridge solution. Aggregated impacts from various
sources of pressure. Main bridge alternative Variant 2 B E-E/October 2010. The
marine parts of the relevant Natura 2000 areas are shown ......................... 10
Figure 0.5 Degree of permanent impairments for main bridge solution. Aggregated
impairments from various sources of pressure. Main bridge alternative Variant
2 B E-E/October 2010. The marine parts of the relevant Natura 2000 areas are
shown .................................................................................................. 11
Figure 0.6 Degree of temporary impairments for main bridge solution. Aggregated
impairments from various sources of pressure. Main bridge alternative Variant
2 B E-E/October 2010. The marine parts of the relevant Natura 2000 areas are
shown .................................................................................................. 12
Figure 1.1 The bed form classification map. The marine parts of the relevant Natura 2000
areas are shown. The area of investigation shows the area where prominent
bed forms have been mapped. ................................................................ 20
Figure 2.1 Proposed alignment for immersed tunnel E-ME (August 2011) ..................... 22
Figure 2.2 Cross section of dredged trench with tunnel element and backfilling ............. 23
Figure 2.3 Vertical tunnel alignment showing depth below sea level ............................ 23
Figure 2.4 Proposed reclamation area at Fehmarn ..................................................... 24
Figure 2.5 Proposed design of tunnel portal area at Lolland ........................................ 26
Figure 2.6 Production facility with two production lines .............................................. 27
Figure 2.7 Proposed lay-out of the production site east of Rødbyhavn .......................... 28
Figure 2.8 Proposed main bridge part of the cable stayed bridge ................................. 29
Figure 2.9 Proposed peninsula at Fehmarn east of Puttgarden .................................... 30
Figure 2.10 Proposed lay-out of the production site at Lolland east of Rødbyhavn ........... 31
Figure 3.1 Investigation area in the Fehmarnbelt. Bathymetry and main bed form areas
with their main characteristics. The maximum migration rates are related to
events, which cause the bed forms to migrate in the direction of the current
during the event (i.e. either SE or NW). Such events occur typically 2-5 times a
year and last approximately 2 days. (note: D1-D4 and G1-G3 refer to sub-
areas used for the detailed classification). Migration rates of the bed forms are
based on calculations of annual sediment transport rates representative for the
alignment area only. From (FEHY 2013a) .................................................. 37
Figure 3.2 Substrate map based on backscatter analysis from multibeam echo soundings
2009 .................................................................................................... 38
Figure 3.3 The assessment scheme for severity of loss ................................................. 45
Figure 3.4 The assessment scheme for degree of impairment ........................................ 45
Figure 3.5 The assessment scheme for severity of impairment ...................................... 46
FEHY ii E1TR0059 Vol I
Figure 3.6 The assessment zones applied for description of the spatial distribution of the
impacts. The near zone illustrated is valid for the tunnel alternative. It
comprises the footprint and a surrounding 500 m band. The local zone is
identical for the two alternatives. The eastern and western borders are
approximately 10 km from the centre of the alignment. .............................. 46
Figure 3.7 Estimated annual net sediment transport rates, positive towards east (upper
figure) and gross (central figure) sediment transport rates (2005) across the
Fehmarnbelt in the alignment area for the fixed link. The lower figure shows
the water depth along the alignment ........................................................ 52
Figure 3.8 Comparison of the Main bridge alternative Bridge Variant 2 B E-E/October 2010
with Bridge alternative/April 2010 for which sediment spill and changes to the
current field are simulated in detail .......................................................... 54
Figure 3.9 Importance map for sea bed morphology. ................................................. 65
Figure 5.1 Conceptual drawing of sand wave migration .............................................. 70
Figure 5.2 Conceptual sketch of infill of coarser non-cohesive sea bed material to the
trench. Infill takes place mainly on the trench slopes .................................. 70
Figure 5.3 Relation between bed form height, water depth and the non-dimensional skin
friction. From (Deigaard and Fredsøe, 1992). ............................................ 74
Figure 6.1 Pressure 1: tunnel trench and the sub-components of the Marine Soil
Component Sea bed morphology. The sub-component ‘Sea bed morphology
outside areas with prominent bed forms’ covers the sea bed, where there are
no bed forms. A-G refers to sections along the trench separated by limits of the
bed form areas and the German/Danish/EEZ border lines. The marine parts of
the relevant Natura 2000 areas are shown ................................................ 78
Figure 6.2 Footprints of the reclamations and protection reefs (permanent footprints). The
part of the work harbours/storage areas and access channel (all temporary
footprints) which are not included in the permanent reclamations/protection
reefs, when these are constructed, are also shown. The marine parts of the
relevant Natura 2000 areas are shown ..................................................... 83
Figure 6.3 Natural sea bed level along the access channel to the temporary work harbour
on the Danish side ................................................................................. 87
Figure 6.4 The estimated recovery time for the sea bed in the area of the temporary
access channel varies along the channel ................................................... 88
Figure 6.5 Variation of deposition thickness of sand along the tunnel trench with
indications of sub-components. The marine parts of the relevant Natura 2000
areas are shown .................................................................................... 91
Figure 6.6 Severity of loss for main tunnel solution. Aggregated impacts from various
sources of pressure. Main tunnel alternative E-ME/August 2011. The marine
parts of the relevant Natura 2000 areas are shown .................................... 96
Figure 6.7 Degree of temporary impairments for main tunnel solution. Aggregated
impairments from various sources of pressure. Main tunnel alternative E-
ME/August 2011. The marine parts of the relevant Natura 2000 areas are
shown .................................................................................................. 97
Figure 6.8 Severity of temporary impairments for main tunnel solution. Aggregated
impairments from various sources of pressure. Main tunnel alternative E-
ME/August 2011. The marine parts of the relevant Natura 2000 areas are
shown .................................................................................................. 98
Figure 7.1 Footprint of pressure 1: piers, pylons and peninsulas including beaches. The
marine parts of the relevant Natura 2000 areas are shown ........................ 106
Figure 7.2 Local influence of the bridge piers and pylons to the annual time-average of the
absolute near-bed flow speeds (2005). Relative changes as percentage
E1TR0059 Vol I iii FEHY
(increase/decrease) of the near-bed current speeds approximately 3 m above
the sea bed. Bridge alternative B E-E/April 2010 (shaded colours). Pressure
area translated (red hatched area) to main bridge alternative Variant 2 B E-
E/October 2010 .................................................................................... 110
Figure 7.3 Areas, where changes to near-bed currents due to main bridge alternative
Variant 2 B E-E/October 2010 have a magnitude, which may lead to
impairments of bed forms ...................................................................... 111
Figure 7.4 Variation of estimated deposition thickness of sand at the end of construction
along the main bridge alternative Variant 2 B E-E/October 2010 with indications
of sub-components. The deposition is estimated from simulations of bridge
alternative B E-E/April 2010. The marine parts of the relevant Natura 2000
areas are shown ................................................................................... 115
Figure 7.5 Severity of loss for main bridge solution. Aggregated impacts from various
sources of pressure. Main bridge alternative Variant 2 B E-E/October 2010. The
marine parts of the relevant Natura 2000 areas are shown ........................ 121
Figure 7.6 Severity of loss for main bridge solution - zooms. Aggregated impacts from
various sources of pressure. Main bridge alternative Variant 2/October 2010.
The marine parts of the relevant Natura 2000 areas are shown .................. 122
Figure 7.7 Degree of permanent impairments for main bridge solution. Aggregated
impairments from various sources of pressure. Main bridge alternative Variant
2/October 2010. The marine parts of the relevant Natura 2000 areas are shown
.......................................................................................................... 123
Figure 7.8 Severity of permanent impairments for main bridge solution. Aggregated
impairments from various sources of pressure. Main bridge alternative Variant
2/October 2010. The marine parts of the relevant Natura 2000 areas are shown
.......................................................................................................... 124
Figure 7.9 Degree of temporary impairments for main bridge solution. Aggregated
impairments from various sources of pressure. Main bridge alternative Variant
2 B E-E/October 2010. The marine parts of the relevant Natura 2000 areas are
shown ................................................................................................. 125
Figure 7.10 Severity of temporary impairments for main bridge solution. Aggregated
impairments from various sources of pressure. Main bridge alternative Variant
2 B E-E/October 2010. The marine parts of the relevant Natura 2000 areas are
shown ................................................................................................. 126
List of tables
Table 0.1 Component Sea Bed Morphology with sub-components ................................ 2
Table 0.2 Summary of severity of loss and degree of impairments from the main tunnel
solution (E-ME/August 2011) on sub-parts of the Fehmarnbelt. Parts of
impacted areas (%) are provided as percentage of the given sub-areas
(reference area). Parts of total impacted area (%) are provided as percentage
of local 10 km zone + near zone. ............................................................... 7
Table 0.3 Summary of severity of loss and degree of impairments from the main bridge
solution (Variant 2 B E-E/October 2010) on sub-parts of the Fehmarnbelt. Parts
of impacted areas are provided as percentage (%) of the given sub-areas
(reference areas). Parts of total impacted area, excluding impacts outside of
local zone+near zone, are provided as percentage (%) of sea bed area within
local zone + near zone (reference area) ................................................... 13
FEHY iv E1TR0059 Vol I
Table 0.4 Comparison of impacts for immersed tunnel (main alternative, E-ME/August
2011) and cable stayed bridge (main alternative Variant 2 B E-E/October 2010)
........................................................................................................... 16
Table 0.5 Comparison matrix of impacts from Immersed tunnel and Cable stayed bridge.
For each factor is the relatively environmentally best alternative identified. 0:
No difference; (+) Small environmental benefit; + Environmental benefit; ++
Large environmental benefit. Note that even an alternative is evaluated less
environmental beneficial, this does not imply that there are significant impacts
on the environment. ............................................................................... 17
Table 1.1 Marine area Factor Soil with Sub-factors and components. Sea bed morphology
is one out of three components under the Marine area Factor Soil and Sub-
factor Marine Soil ................................................................................... 21
Table 1.2 Component Sea Bed Morphology with sub-components .............................. 21
Table 2.1 Project pressures for component Sea Bed Morphology in the case of the main
alternative of the tunnel ......................................................................... 33
Table 2.2 Project pressures for component Sea Bed Morphology in the case of the main
alternative of the bridge ......................................................................... 35
Table 3.1 Areas of bed forms within 10 km from alignment ....................................... 36
Table 3.2 The matrix used for assessment of the severity of loss. The magnitude of
pressure = the footprint of the Project is always considered to be very high. . 42
Table 3.3 The matrices used for the matrix based assessment of the degree of
impairment with two and four grade scaling, respectively ........................... 42
Table 3.4 The matrix used for assessment of the severity of impairment ................... 43
Table 3.5 Framework applied to relate recovery of environmental factors to the
consecutive phases of the Project ............................................................ 47
Table 3.6 Estimated annual sediment transport rates across the alignment, water depth >
4m ....................................................................................................... 53
Table 3.7 Methods for assessment of magnitude of pressures for the main tunnel
alternative ............................................................................................ 55
Table 3.8 Methods for assessment of magnitude of pressures for the main bridge
alternative ............................................................................................ 56
Table 3.9 Assessment criteria and associated colours ............................................... 57
Table 3.10 Criteria for assessment of changes to the sea bed morphology and assignment
of degrees of impairments ...................................................................... 58
Table 3.11 Method for assessment of loss (tunnel and bridge) ..................................... 60
Table 3.12 Method for assessment of degree of impairment for project pressures for the
main tunnel solution ............................................................................... 62
Table 3.13 Method for assessment of degree of impairment for project pressures for bridge
solution ................................................................................................ 63
Table 3.14 Importance levels for the Marine Soil component: Sea bed morphology ........ 64
Table 3.15 Matrix by which the degree of severity is assigned for impairments. The degree
of severity is based on the combination of the degree of impairment (vertical
axis) and the importance level (horisontal axis) ......................................... 66
Table 3.16 Degree of severity for areas with loss. The degree of severity is based on the
combination of the magnitude of pressure (vertical axis) and the importance
level (horizontal axis) ............................................................................. 66
Table 5.1 Relation between deposition depth (mm) and degree of impairment for sand
waves of varying height assuming the change in height of the sand waves is
2.5 times the even depth of deposition. .................................................... 71
E1TR0059 Vol I v FEHY
Table 5.2 Relation between deposition depth (mm) and degree of impairment for lunate
bed forms ............................................................................................. 72
Table 5.3 Relation between change in near-bed current speed and degree of impairment
for bed forms ........................................................................................ 75
Table 6.1 Summary of areas with impairments (all temporary). Relation between
pressures and areas of impairments subdivided on sub-components. Maximum
period with temporary impairments is given for each pressure..................... 77
Table 6.2 Assessment of recovery times for temporary footprint of the tunnel trench.
Recovery times for various sections of the sea bed along the trench ............. 81
Table 6.3 Impacted areas and severity of impacts from tunnel trench (Pressure 1) on the
bed forms and sea bed in the Fehmarnbelt. Main tunnel solution (E-ME/August
2011) ................................................................................................... 82
Table 6.4 Impacted areas and severity of impacts from reclamations and protection reef
(Pressure 2) to the bed forms and sea bed in the Fehmarnbelt. Main tunnel
solution (E-ME/August 2011) ................................................................... 84
Table 6.5 Impacted areas and severity of impacts from temporary work harbours and
storage (Pressure 3) to the bed forms and sea bed in the Fehmarnbelt. Main
tunnel solution (E-ME/August 2011) ......................................................... 86
Table 6.6 Summary of estimated recovery time for access channel to temporary Work
Harbour on the Danish side ..................................................................... 89
Table 6.7 Impacted areas and severity of impacts from access channel to production
facility on Lolland (Pressure 4) to the bed forms and sea bed in the
Fehmarnbelt. Main tunnel solution (E-ME/August 2011) .............................. 90
Table 6.8 Impacted areas and severity of impacts from deposition spill from dredging
activities (Pressure 5) to the bed forms and sea bed in the Fehmarnbelt. Main
tunnel solution (E-ME/August 2011) ......................................................... 93
Table 6.9 Summary of impacts from the main tunnel solution (E-ME/August 2011) on
sub-components of the Marine Soil component sea bed morphology. Impacts
divided on severity of loss and degree of impairments. Part of impacted areas
of the sub-component are provided as percentage (%) of the reference area of
the given sub-component within 10 km from the alignment (i.e. within near
zone + local zone) ................................................................................. 99
Table 6.10 Summary of severity of impairments from the main tunnel solution (E-
ME/August 2011) on sub-components of the Marine Soil component sea bed
morphology. Part of impacted areas of the sub-component are provided as
percentage (%) of the reference area of the given sub-component within 10 km
from the alignment (i.e. within near zone + local zone) ............................. 100
Table 6.11 Summary of severity of loss and degree of impairments from the main tunnel
solution (E-ME/August 2011) on sub-parts of the Fehmarnbelt. Parts of
impacted areas (%) are provided as percentage of the given sub-areas
(reference area). Parts of total impacted area (%) are provided as percentage
of local 10 km zone + near zone. ............................................................ 101
Table 6.12 Summary of impacts to assessed sub-components ...................................... 102
Table 6.13 Mitigation measures .............................................................................. 104
Table 7.1 Summary of areas with impairments due to main bridge alternative. Relation
between pressures and areas of impairments sub-divided on sub-components.
Maximum period with temporary impairments is given for each pressure ..... 105
Table 7.2 Impacted areas and severity of impacts from piers, pylons and peninsulas
(Pressure 1) to the bed forms and sea bed in the Fehmarnbelt. Main bridge
solution (Variant 2 B E-E/October 2010) .................................................. 107
FEHY vi E1TR0059 Vol I
Table 7.3 Severity of impacts caused by changes to the near-bed currents (Pressure 2) to
the bed forms and sea bed in the Fehmarnbelt. Main bridge solution (Variant 2
B E-E/October 2010) ............................................................................. 113
Table 7.4 Impacted areas and severity of impacts from deposition of sediment from
dredging activities (Pressure 3) to the bed forms and sea bed in the
Fehmarnbelt. Main bridge solution Variant 2. B E-E/October 2011 ............... 117
Table 7.5 Impacted areas and severity of impacts from temporary work harbours and
storage areas (Pressure 4) to the bed forms and sea bed in the Fehmarnbelt.
Main bridge solution (Variant 2 B E-E/October 2010) ................................. 118
Table 7.6 Summary of impacts from the main bridge solution (Variant 2 B E-E/October
2010)on sub-components of the Marine Soil component sea bed morphology.
Impacts divided on severity of loss and degree of impairments. Part of
impacted areas of the sub-component are provided as percentage (%) of the
reference area of the given sub-component within 10 km from the alignment
(i.e. within near zone + local zone) ......................................................... 127
Table 7.7 Summary of severity of impairments from the main bridge solution (Variant 2 B
E-E/October 2010) divided on sub-components of the Marine Soil component
sea bed morphology. Part of impacted areas of the sub-component are
provided as percentage (%) of the reference area of the given sub-component
within 10 km from the alignment (i.e. within near zone + local zone). ......... 128
Table 7.8 Summary of severity of loss and degree of impairments from the main bridge
solution (Variant 2 B E-E/October 2010) on sub-parts of the Fehmarnbelt. Parts
of impacted areas are provided as percentage (%) of the given sub-areas
(reference areas). Parts of total impacted area, excluding impacts outside of
local zone+near zone, are provided as percentage (%) of sea bed area within
local zone + near zone (reference area) .................................................. 129
Table 7.9 Summary of impacts to assessed sub-components .................................... 131
Table 8.1 Comparison of impacts for immersed tunnel (main alternative, E-ME/August
2011) and cable stayed bridge with continued ferry operation (main alternative
Variant 2 B E-E/October 2010) ............................................................... 134
Table 8.2 Comparison matrix of impacts from Immersed tunnel and Cable stayed bridge.
For each factor is the relatively environmentally best alternative identified. 0:
No difference; (+) Small environmental benefit; + Environmental benefit; ++
Large environmental benefit. Note that even an alternative is evaluated less
environmental beneficial, this does not imply that there are significant impacts
on the environment. .............................................................................. 135