Embed Size (px)
Citation preview
0
Diversity Management in MIMO-OFDM Systems
Felip Riera-Palou and Guillem FemeniasMobile Communications Group
University of the Balearic IslandsSpain
1. Introduction
Over the last decade, a large degree of consensus has been reached within the researchcommunity regarding the physical layer design that should underpin state-of-the-art andfuture wireless systems (e.g., IEEE 802.11a/g/n, IEEE 802.16e/m, 3GPP-LTE, LTE-Advanced).In particular, it has been found that the combination of multicarrier transmission andmultiple-input multiple-output (MIMO) antenna technology leads to systems with highspectral efficiency while remaining very robust against the hostile wireless channelenvironment.The vast majority of contemporary wireless systems combat the severe frequency selectivityof the radio channel using orthogonal frequency diversity multiplexing (OFDM) or some of itsvariants. The theoretical principles of OFDM can be traced back to (Weinstein & Ebert, 1971),however, implementation difficulties delayed the widespread use of this technique well untilthe late 80s (Cimini Jr., 1985). It is well-known that the combination of OFDM transmissionwith channel coding and interleaving results in significant improvements from an error ratepoint of view thanks to the exploitation of the channel frequency diversity (Haykin, 2001, Ch.6). Further combination with spatial processing using one of the available MIMO techniquesgives rise to a powerful architecture, MIMO-OFDM, able to exploit the various diversitydegrees of freedom the wireless channel has to offer (Stuber et al., 2004).
1.1 Advanced multicarrier techniques
A significant improvement over conventional OFDM was the introduction of multicarriercode division multiplex (MC-CDM) by Kaiser (2002). In MC-CDM, rather than transmittinga single symbol on each subcarrier, as in conventional OFDM, symbols are code-divisionmultiplexed by means of orthogonal spreading codes and simultaneously transmitted ontothe available subcarriers. Since each symbol travels on more than one subcarrier, thusexploiting frequency diversity, MC-CDM offers improved resilience against subcarrier fading.This technique resembles very much the principle behind multicarrier code-division multipleaccess (MC-CDMA) where each user is assigned a specific spreading code to share a group ofsubcarriers with other users (Yee et al., 1993).A more flexible approach to exploit the frequency diversity of the channel is achieved bymeans of group-orthogonal code-division multiplex (GO-CDM) (Riera-Palou et al., 2008). Theidea behind GO-CDM, rooted in a multiple user access scheme proposed in (Cai et al., 2004),is to split suitably interleaved symbols from a given user into orthogonal groups, apply aspreading matrix on a per-subgroup basis and finally map each group to an orthogonal set of
5
www.intechopen.com
2 Will-be-set-by-IN-TECH
subcarriers. The subcarriers assigned to a group of symbols are typically chosen as separateas possible within the available bandwidth in order to maximise the frequency diversity gain.Note that a GO-CDM setup can be seen as many independent MC-CDM systems of lowerdimension operating in parallel. This reduced dimension allows the use of optimum receiversfor each group based on maximum likelihood (ML) detection at a reasonable computationalcost. In (Riera-Palou et al., 2008), results are given for group dimensioning and spreading codeselection. In particular, it is shown that the choice of the group size should take into accountthe operating channel environment because an exceedingly large group size surely leads to awaste of computational resources, and even to a performance degradation if the channel is notfrequency-selective enough. Given the large variation of possible scenarios and equipmentconfigurations in a modern wireless setup, a conservative approach of designing the systemto perform satisfactorily in the most demanding type of scenario may lead to a significantwaste of computational power, an specially scarce resource in battery operated devices. Infact, large constellation sizes (e.g., 16-QAM, 64-QAM) may difficult the application of GOtechniques as the complexity of ML detection can become very high even when using efficientimplementations such as the sphere decoder (Fincke & Pohst, 1985). In order to minimise theeffects of a mismatch between the operating channel and the GO-CDM architecture, groupsize adaptation in the context of GO-CDM has been proposed in (Riera-Palou & Femenias,2009), where it is shown that important complexity reductions can be achieved by dynamicallyadapting the group size in connection with the sensed frequency diversity of the environment.
1.2 Multiple antennae schemes
Multiple-antenna technology (i.e., MIMO) is the other main enabler towards high speedrobust wireless networks. Whereas the use of multiple antennae at the receiver has beenlong applied as an effective measure to combat fading (see, e.g. (Simon & Alouini, 2005)and references therein), it is the application of multiple antenna at the transmitter side whatrevolutionised the wireless community. In particular, the linear increase in capacity achievedwhen jointly increasing the number of antennas at transmission and reception, theoreticallyforecasted in (Telatar, 1999), has spurred research efforts to effectively realize it in practicalschemes. Among these practical schemes, three of them have achieved notable importancein the standardisation of modern wireless communications systems, namely, spatial divisionmultiplexing (SDM), space-time block coding (STBC) and cyclic delay diversity (CDD). Whilein SDM (Foschini, 1996), independent data streams are sent from the different antennasin order to increase the transmission rate, in STBC (Alamouti, 1998; Tarokh et al., 1999)the multiple transmission elements are used to implement a space-time code targeting theimprovement of the error rate performance with respect to that achieved with single-antennatransmission. In CDD (Wittneben, 1993) a single data stream is sent from all transmitterantennae with a different cyclic delay applied to each replica, effectively resulting as if theoriginal stream was transmitted over a channel with increased frequency diversity.
1.3 Chapter objectives
The combination of GO-CDM and MIMO processing, termed MIMO-GO-CDM, results in apowerful and versatile physical layer able to exploit the channel variability in space andfrequency. Nevertheless, the different MIMO processing schemes coupled with differentdegrees of frequency multiplexing (i.e., different group sizes) gives rise to a vast amountof combinations each offering a different operating point in the performance/complexityplane. Choosing an adequate number of Tx/Rx antennas, a specific MIMO scheme and the
96 Recent Advances in Wireless Communications and Networks
www.intechopen.com

Diversity Management in MIMO-OFDM Systems 3
subcarrier grouping dimensions can be a daunting task further complicated when Tx and/orRx antennas are correlated. To this end, it is desirable to have at hand closed-form analyticalexpressions predicting the performance of the different MIMO-GO-CDM configurations inorder to avoid the need of (costly) numerical simulations.This chapter has two main goals. The first goal is to present a unified BER analysis of theMIMO-GO-CDM architecture. In order to get an insight of the best possible performancethis system can offer, attention is restricted to the case when ML detection is employedat the receiver. The analysis is general enough to incorporate the effects of channelfrequency selectivity, Tx/Rx antenna correlations and the three most common different formsof spatial processing (SDM, STBC and CDD) in combination with GO-CDM frequentialdiversity. The analytical results are then used to explore the benefits of GO-CDM underdifferent spatial configurations identifying the most attractive group dimensioning froma performance/complexity perspective. Based on the previous analysis, the second goalof this chapter is to devise effective reconfiguration strategies that can automatically anddynamically fix some of the parameters of the system, more in particular the group size ofthe GO-CDM component, in response to the instantaneous channel environment with theobjective of optimising some pre-defined performance criteria (e.g., error rate, complexity,delay).The rest of this chapter is organized as follows. Section 2 introduces the system model of ageneric MIMO-GO-CDM system, paying special attention to the steps required to implementthe frequency spreading and the MIMO processing. In Section 3 a unified BER analysisis presented for the case of ML detection. In light of this analysis, Section 4 exploresreconfiguration strategies aiming at the optimisation of several critical parameters of theMIMO-GO-CDM architecture. Numerical results are presented in Section 6 to validate theintroduced analytical and reconfiguration procedures. Finally, the main conclusions of thiswork are recapped in Section 7.Notational remark: Vectors and matrices are denoted by bold lower and upper case letters,respectively. The superscripts ∗, T and H are used to denote conjugate, transpose and complextranspose (Hermitian), respectively, of the corresponding variable. The operation vec(A)lines up the columns forming matrix A into a column vector. The symbols ⊗ and ⊙ denotethe Kronecker and element-by-element products of two matrices, respectively. Symbols Ik
and 1k×l denote the k-dimensional identity matrix and an all-ones k × l matrix, respectively.The symbol D(x) is used to represent a (block) diagonal matrix having x at its main (block)diagonal. The determinant of a square matrix A is represented by |A| whereas ‖x‖2 = xxH .Expression ⌈a⌉ is used to denote the nearest upper integer of a. Finally, the Alamouti
transform of a K × 2 matrix X = [x1 x2] is defined as A (X) �[
−x∗2 x∗
1
]
.
2. MIMO GO-CDM system model
We consider a MIMO multicarrier system with Nc data subcarriers, equipped with NT and NR
transmit and receive antennas, respectively, and configured to transmit Ns (≤ NT) spatial datastreams. Following the group-orthogonal design principles, the available subcarriers are splitinto Ng = Nc/Q groups of Q subcarriers each. In the following subsections the transmitter,channel model and reception equation are described in detail.
2.1 Transmitter
As depicted in Fig. 1, incoming bits are split into Ns spatial streams, which are then processedseparately. Bits on the zth stream are mapped onto a sequence sz of symbols drawn from an
97Diversity Management in MIMO-OFDM Systems
www.intechopen.com

4 Will-be-set-by-IN-TECH
Sp
ati
als
tre
am
pa
rse
r
Inp
ut
bit
s
STBC
Symbol
mapping
Segment
S/PGrouping Spreading
GO-CDM
Symbol
mapping
Segment
S/PGrouping Spreading
GO-CDM
An
ten
na
ma
pp
ing
CDD IFFT CP
CDD IFFT CP
Fig. 1. Transmitter architecture for MIMO GO-CDM.
M-ary complex constellation (e.g. BPSK, M-QAM) with average normalized unit energy. The
resulting Ns streams of modulated symbols {sz}Ns
z=1 are then fed to the GO-CDM stage, whichcomprises three steps:
1. Segmentation of the incoming symbol stream in blocks of length Nc (i.e., eventual OFDMsymbols), and serial to parallel conversion (S/P) resulting, over the kth OFDM symbolperiod, in sz(k).
2. Arrangement of the symbols in the block into groups{
szg(k)
}Ng
g=1, where sz
g(k) =[
szg,1(k) . . . sz
g,Q(k)]T
represents an individual group.
3. Group spreading through a linear combination
szg(k) =
1√NT
Cszg(k), (1)
where C is a Q × Q orthonormal matrix, typically chosen to be a rotated Walsh-Hadamardmatrix (Riera-Palou et al., 2008).
Before the usual OFDM modulation steps on each antenna (IFFT, guard interval appendingand up-conversion), the grouped and spread symbols are processed in accordance with theMIMO transmission scheme in use as follows:
SDM (Ns = NT) : In this case the blocks labeled in Fig. 1 as STBC and CDD are not used,and the spread symbols are directly supplied to the antenna mapping stage, which simplyconnects the incoming zth data stream to the ith transmit branch (1 ≤ i ≤ NT), that is,
sig(k) = si
g(k) = szg(k). (2)
STBC (Ns = 1, NT = 2) : Two consecutive blocks of spread symbols, s1g(k) and s1
g(k + 1), areAlamouti-encoded on a per-subcarrier basis over two OFDM symbol periods,
s1g(k) = s1
g(k), s1g(k + 1) = −
(
s1g(k + 1)
)∗,
s2g(k) = s1
g(k + 1), s2g(k + 1) =
(
s1g(k)
)∗.
(3)
98 Recent Advances in Wireless Communications and Networks
www.intechopen.com

Diversity Management in MIMO-OFDM Systems 5
In the antenna mapping stage, STBC-encoded streams are connected to two transmitbranches, one for each symbol of the STBC code, that is,
sig(k) = si
g(k). (4)
CDD (Ns = 1) : In a pure CDD scheme, the same data stream is sent through NT antennaswith each replica being subject to a different cyclic delay Δi, typically chosen as Δi =Δi−1 + Nc/NT with Δ1 = 0 (Bauch & Malik, 2006), resulting in transmitted symbols
sig,q(k) = s1
g,q(k) exp(
−j2πdqΔi/Nc)
, (5)
where dq denotes the subcarrier index.
Hybrid schemes The analytical framework developed in this chapter can also be appliedto hybrid systems combining SDM, STBC and/or CDD. Nevertheless, for brevity ofpresentation, the analysis to be developed next focuses on scenarios where only one ofthe mechanisms is used.
2.2 Channel model
The channel linking an arbitrary pair of Tx and Rx antennas is assumed to be time-varyingand frequency-selective with an scenario-dependent power delay profile
S(τ) =P−1
∑l=0
φlδ(τ − τl), (6)
where P denotes the number of independent paths of the channel and φl and τl denote thepower and delay of the l-th path. It is assumed that the power delay profile is the same for
all pairs of Tx and Rx antennas and that it has been normalized to unity (i.e., ∑P−1l=0 φl = 1). A
single realization of the channel impulse response between Tx antenna i and receive antennaj at time instant t will then have the form
hij(t; τ) =P−1
∑l=0
hijl (t)δ(τ − τl), (7)
where it will hold that E{
| hijl (t) |2
}
= φl . The corresponding frequency response can be
expressed as
hij(t; f ) =P−1
∑l=0
hijl (t) exp(−j2π f τl), (8)
which when evaluated at the Nc OFDM subcarriers yields
hij(t) =[
hij(t; f0) . . . hij(t; fNc−1)]T
. (9)
In order to simplify the notation, assuming that the channel is static over the duration of ablock (i.e., an OFDM symbol), the frequency response between Tx-antenna i and Rx-antennaj over the Nc subcarriers during the kth OFDM symbol can be expressed as
hij(k) =[
hij0 (k) . . . h
ijNc−1(k)
]T. (10)
99Diversity Management in MIMO-OFDM Systems
www.intechopen.com

6 Will-be-set-by-IN-TECH
Sp
ati
als
tre
am
de
pa
rse
r
Est
ima
ted
bit
s
ML group
detectionFFTCP
FFTCP
Su
bca
rrie
rg
rou
pin
g
Segment
P/S
Symbol
De-map
ML group
detection
Segment
P/S
Symbol
De-map
ST
BC
pre
-pro
cess
ing
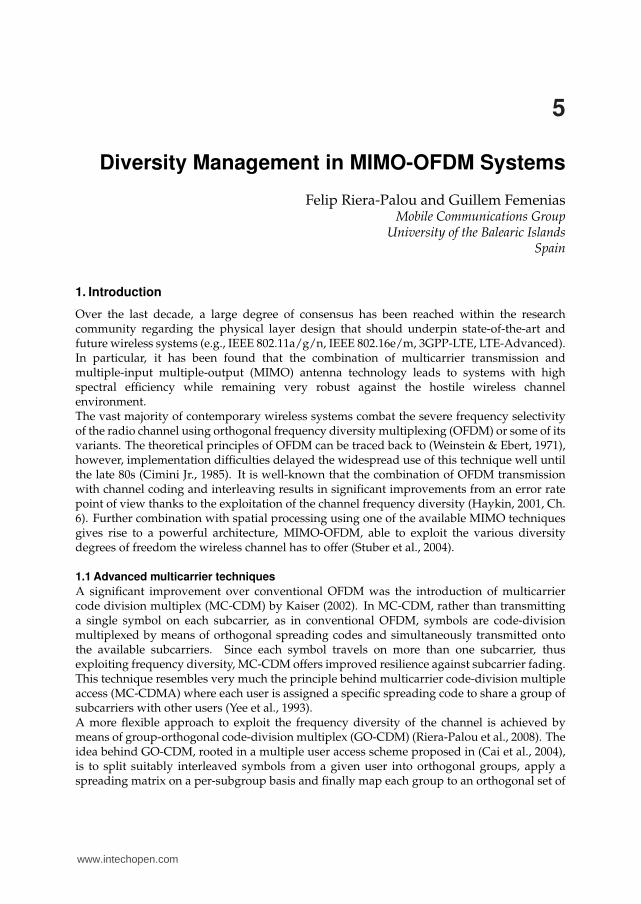
Fig. 2. Receiver architecture for MIMO-GO-CDM.
Since the subsequent analysis is mostly conducted on per-group basis, the channel frequencyresponse for the gth group is denoted by
hijg (k) =
[
hijg,1(k) . . . h
ijg,Q(k)
]T, (11)
with correlation matrix given by
Rhg= E
{
‖hijg (k)‖2
}
= E
{
hijg (k)
(
hijg (k)
)H}
, (12)
which is assumed to be constant over time, common for all pairs of Tx and Rx antennasand, provided that group subcarriers are chosen equispaced across the available bandwidth,common to all groups.Now, considering the spatial correlation introduced by the transmit and receive antennaarrays, the spatially correlated channel frequency response for an arbitrary subcarrier q ingroup g can be expressed as (van Zelst & Hammerschmidt, 2002)
Hg,q(k) = R1/2RX Hg,q(k)
(
R1/2TX
)T, (13)
where RRX and RTX are, respectively, NR × NR and NT × NT matrices denoting the receiveand transmit correlation, and
Hg,q(k) =
⎛
⎜
⎜
⎝
h11g,q(k) . . . h1NT
g,q (k)...
...
hNR1g,q (k) . . . hNR NT
g,q (k)
⎞
⎟
⎟
⎠
. (14)
2.3 Receiver
As shown in Fig. 2, the reception process begins by removing the cyclic prefix and performingan FFT to recover the symbols in the frequency domain. After S/P conversion, and assumingideal synchronization at the receiver side, the received samples for group g at the output ofthe FFT processing stage can be expressed in accordance with the MIMO transmission schemein use as follows:
100 Recent Advances in Wireless Communications and Networks
www.intechopen.com

Diversity Management in MIMO-OFDM Systems 7
SDM and CDD: In these cases,
rg(k) = vec([
rg,1(k) . . . rg,Q(k)])
= Hg(k)sg(k) + υg(k), (15)
where the NRQ × NTQ matrix
Hg(k) = D([
Hg,1(k) . . .Hg,Q(k)])
, (16)
represents the spatially and frequency correlated channel matrix affecting all symbolstransmitted in group g, the NsQ-long vector of transmitted (spread) symbols is formedas
sg(k) = vec
(
[
s1g(k) . . . sNT
g (k)]T)
, (17)
and finally, υg(k) is an NRQ × 1 vector representing the receiver noise, with eachcomponent being drawn from a circularly symmetric zero-mean white Gaussiandistribution with variance σ2
υ .
STBC: As stated in (3), STBC encoding period η = k/2, with k = 0, 2, 4, . . ., spawnstwo consecutive OFDM symbol periods, namely, the kth and (k + 1)th symbol periods.Assuming that the channel coherence time is large enough to safely consider that Hg(k +1) = Hg(k), then,
rg(k) = Hg(k)sg(k) + υg(k),
rg(k + 1) = Hg(k)sg(k + 1) + υg(k + 1),(18)
and, therefore, we can define an equivalent received vector in STBC encoding period η as
rg(η) �
[
rg(k)r∗g(k + 1)
]
=
[
Hg(k)
HAg (k)
]
sg(η) +
[
υg(k)υ∗
g(k + 1)
]
� Hg(η)sg(η) + υg(η), (19)
whereH
Ag (k) � D
([
A(
Hg,1(k))
. . .A(
Hg,Q(k))])
(20)
and
sg(η) � vec
(
[
s1g(k) s
1g(k + 1)
]T)
. (21)
In order to facilitate the unified performance analysis of the different MIMO strategies, it ismore convenient to express the reception equation in terms of the original symbols rather thanthe spread ones. Thus, defining
sg(k) =1√NT
vec
(
[
s1g(k) . . . sNs
g (k)]T)
SDM
sg(η) =1√2
vec
(
[
s1g(k) s
1g(k + 1)
]T)
STBC
sg(k) =1√NT
s1g(k) CDD
(22)
it is straightforward to check that the symbols to be supplied to the IFFT processing step aregiven by,
sg(k) = (C ⊗ INs) sg(k) SDM
sg(k) = sg(η) = (C ⊗ I2) sg(η) STBC
sg(k) = EΔg (C ⊗ 1NT×1) sg(k) CDD
101Diversity Management in MIMO-OFDM Systems
www.intechopen.com

8 Will-be-set-by-IN-TECH
with EΔg � D
([
EΔ1g . . .EΔQ
g
])
, where EΔqg = D
([
e−j2πdqΔ1/Nc . . . e−j2πdqΔNT/Nc
])
(Bauch &
Malik, 2006). Furthermore, since processing takes place either on an OFDM symbol basis forSDM and CDD systems or on an STBC encoding period basis for STBC schemes, the indexesk and/or η can be dropped from this point onwards, allowing the reception equation to beexpressed in general form as
rg = Agsg + νg
where
Ag =
⎧
⎪
⎪
⎨
⎪
⎪
⎩
Hg (C ⊗ INs) SDM
Hg (C ⊗ I2) STBC
HgEΔg (C ⊗ 1NT×1) CDD
and
νg =
{
υg for SDM/CDD
υg for STBC. (23)
It should be noted that, regardless of the MIMO scheme and group dimension in use, thesystem matrix Ag has been normalised such that the SNR can be defined as Es/N0 = 1/(2σ2
υ ).Upon reception, all symbols in a group (for all streams in SDM and for both encoded OFDMsymbols in STBC) are jointly estimated using an ML detection process. That is, the vector ofestimated symbols in a group can be expressed as
sg = arg minsg
‖Ag sg − rg‖2. (24)
This procedure amounts to evaluate all the possible transmitted vectors and choosing theclosest one (in a least-squares sense) to the received vector. Nevertheless, sphere detection(Fincke & Pohst, 1985) can be used for efficiently performing the exhaustive search requiredto implement the ML estimation.
3. Unified bit error rate analysis
3.1 BER analysis based on pairwise error probability
Using the well-known union bound (Simon et al., 1995), which is very tight for highsignal-to-noise ratios, the bit error probability can be upper bounded as
Pb ≤ 1
Ng NQ MNQ log2 M
Ng
∑g=1
MNQ
∑u=1
MNQ
∑w=1w =u
P(
sg,u → sg,w)
Nb(sg,u, sg,w), (25)
where,
NQ =
⎧
⎪
⎪
⎨
⎪
⎪
⎩
Q Ns for SDM
2Q for STBC
Q for CDD
. (26)
The expression P(
sg,u → sg,w)
, usually called the pairwise error probability (PEP), representsthe probability of erroneously detecting the vector sg,w when sg,u was transmitted and
102 Recent Advances in Wireless Communications and Networks
www.intechopen.com

Diversity Management in MIMO-OFDM Systems 9
Nb(sg,u, sg,w) is equal to the number of differing bits between vectors sg,u and sg,w. Toproceed further, the PEP conditioned on Ag can be shown to be (Craig, 1991)
P(
sg,u → sg,w|Ag)
=1
2erfc
⎛
⎝
√
‖Ag(sg,u − sg,w)‖2
4σ2υ
⎞
⎠
=1
π
∫ π/2
0exp
(
−‖Ag(sg,u − sg,w)‖2
4σ2υ sin2 φ
)
dφ.
(27)
Now, defining the random variable d2g,uw � ‖Ag(sg,u − sg,w)‖2, the unconditional PEP can be
expressed as
P(
sg,u → sg,w)
=1
π
∫ π/2
0
∫ +∞
−∞e−x/4σ2
v sin2 φ pd2g,uw
(x) dx dφ
=1
π
∫ π/2
0Md2
g,uw
(
− 1
4σ2υ sin2 φ
)
dφ,
(28)
where px(·) and Mx(·) denote the probability density function (pdf) and moment generatingfunction (MGF) of a random variable x, respectively.Let us now define the error vector eg,uw = sg,u − sg,w. Using this definition, it can be shownthat
d2g,uw � ‖Ageg,uw‖2 = H
Hg T H
g,uwTg,uwHg, (29)
whereHg � vec
[
vec(
Hg,1
)
. . . vec(
Hg,Q
)]
, (30)
and Tg,uw can be expressed as
Tg,uw =
{ [ (
1Q×1 ⊗Sg,uw)
⊙ IQ,NT
]
⊗ INRSDM/CDD
[(
11×Q ⊗STg,uw
)
⊙ ITQ,2
]
⊗ I2NRSTBC
(31)
with
Sg,uw =
{
eTg,uw
(
CT ⊗ INT
)
SDM/STBC
eTg,uw
(
CT ⊗ 11×NT
)
ETΔ CDD
(32)
and In,m � In ⊗ 11×m. The expression of d2g,uw reveals that it is a quadratic form in complex
variables Hg, with MGF given by
Md2g,uw
(s) =∣
∣IN − sGg,uw
∣
∣
−1, (33)
where N is equal to QNR for the SDM and CDD schemes, and equal to 4QNR for the STBCstrategy. Furthermore,
Gg,uw = Tg,uwRgTHg,uw, (34)
withRg = Rhg
⊗RTX ⊗RRX . (35)
103Diversity Management in MIMO-OFDM Systems
www.intechopen.com
10 Will-be-set-by-IN-TECH
Now, let λg,uw = {λg,uw,1, . . . , λg,uw,Dg,uw} denote the set of Dg,uw distinct positive eigenvalues
of Gg,uw with corresponding multiplicities αg,uw ={
αg,uw,1, . . . , αg,uw,Dg,uw
}
. Using the
results in (Femenias, 2004), the MGF of d2g,uw can also be expressed as
Md2g,uw
(s) =Dg,uw
∏d=1
1
(1 − sλg,uw,d)αg,uw,d
=Dg,uw
∑d=1
αg,uw,d
∑p=1
κg,uw,d,p
(1 − sλg,uw,d)p (36)
where, using (Amari & Misra, 1997, Theorem 1), it can be shown that
κg,uw,d,p =λ
p−αg,uw,d
g,uw,d
(αg,uw,d − p)!
∂αg,uw,d−p
∂sαg,uw,d−p
⎡
⎢
⎢
⎣
Dg,uw
∏d′=1d′ =d
1
(1 − sλg,uw,d′ )αg,uw,d′
⎤
⎥
⎥
⎦
∣
∣
∣
∣
∣
∣
∣
∣
s= 1λg,uw,d
= λp−αg,uw,d
g,uw,d ∑Φ
Dg,uw
∏d′=1d′ =d
λnd′g,uw,d′ (
αg,uw,d′+nd′−1nd′
)(
1 − λg,uw,d′λg,uw,d
)αg,uw,d′+nd′
(37)
with Φ being the set of nonnegative integers{
n1, . . . , nd−1, nd+1, . . . , nDg,uw
}
such that
∑d′ =d nd′ = αg,uw,d − p, which allows (28) to be written as
P(
sg,u → sg,w)
=1
π
Dg,uw
∑d=1
αg,uw,d
∑p=1
κg,uw,d,p
∫ π/2
0
⎛
⎝
sin2φ
sin2φ +λg,uw,d
4σ2v
⎞
⎠
p
dφ
=Dg,uw
∑d=1
αg,uw,d
∑p=1
κg,uw,d,p
⎛
⎝
1 − Ω(
λg,uw,d
4σ2v
)
2
⎞
⎠
pp−1
∑g=0
(
p − 1 + g
g
)
⎛
⎝
1 + Ω(
λg,uw,d
4σ2v
)
2
⎞
⎠
g
,
(38)
with Ω(c) =√
c/(1 + c). By substituting (38) into (25), a closed-form BER upper bound for anarbitrary power delay profile is obtained. It is later shown that this bound is tight, accuratelymatching the simulation results.
3.2 BER analysis based on PEP classes
Since there are many pairs (sg,u, sg,w) giving exactly the same PEP, it is possible to definea pairwise error class C(Dg,c,λg,c,αg,c) as the set of all pairs (sg,u, sg,w) characterized bya common matrix Gg,uw = Gg,c with Dg,c distinct eigenvalues λg,c = {λg,c,1, . . . , λg,c,Dg,c
}with corresponding multiplicities αg,c = {αg,c,1, . . . , αg,c,Dg,c
} and therefore, a common PEP
denoted by P(Dg,c,λg,c,αg,c). A more insightful BER expression can then be obtained byusing the PEP class notation, avoiding in this way the exhaustive computation of all thePEPs. Instead, the BER upper-bound can be found by computing the PEP for each class andweighing it using the number of elements in the class and the number of erroneous bits thisclass may induce. The BER upper bound can then be rewritten as
Pb ≤ 1
Ng NQ MNQ log2 M
×Ng
∑g=1
∑∀C(Dg,c ,λg,c ,αg,c)
NQ log2 M
∑N=1
N W(Dg,c,λg,c,αg,c,N )P(Dg,c,λg,c,αg,c),
(39)
104 Recent Advances in Wireless Communications and Networks
www.intechopen.com
Diversity Management in MIMO-OFDM Systems 11
where W(Dg,c,λg,c,αg,c,N ) corresponds to the number of elements in the classC(Dg,c,λg,c,αg,c) inducing N erroneous bits.
3.3 Asymptotic performance
Now, in order to gain further insight on the parameters affecting the BER performance, let usfocus on the asymptotic case of large SNR. When Es/N0 → ∞, the argument of the MGF in(28) also tends to infinity, and it can easily be shown that when s → ∞ the MGF in (36) can beapproximated by
Md2g,uw
(s) ≃ 1(
∏Dg,uw
d=1 λαg,uw,d
g,uw,d
)
(−s)∑Dd,uwd=1 αg,uw,d
, (40)
allowing the asymptotic PEP of the different classes to be expressed as
Pasym(
Dg,c,λg,c,αg,c)
=1
π
∫ π/2
0
(4σ2υ sin2 φ)Dg,c
∏Dg,c
d=1 λαg,c,d
g,c,d
dφ =(2Dg,c)!
2Dg,c!2(Es/N0)
−Dg,c
∏Dmin
d=1 λαg,c,d
g,c,d
, (41)
where Dg,c = ∑Dg,c
d=1 αg,c,d is the rank of the matrix-defining class Gg,c. From (41) it is clear thatthe probability of error will be mainly determined by the groups and classes whose matrices
Gg,c = Gming,c � Tmin
g,c Rming
(
Tming,c
)H(42)
have the smallest common rank, denoted by
Dmin = rank(Gming,c ) = rank
(
Tming,c Rmin
g
(
Tming,c
)H)
, (43)
allowing the asymptotic BER to be written as
Pb ≤Ng
∑g=1
∑∀C(Dmin,λg,c ,αg,c)
NQ log2 M
∑N=1
N (2Dmin)!
2(Dmin!)2
W(Dmin,λg,c,αg,c,N ) (Es/N0)−Dmin
Ng NQ MNQ log2 M ∏Dmin
d=1 λαg,c,d
g,c,d
. (44)
In light of (44), the asymptotic BER minimisation is achieved by maximising the minimumgroup/class rank Dmin and the eigenvalue product of all the groups/classes with rank Dmin.In the following, only the maximization of Dmin (i.e., maximisation of the diversity order)is pursued since the maximization of the product of eigenvalues is far more difficult as itinvolves the simultaneous optimization of all the eigenvalue products in the groups/classeswith rank Dmin.
On the rank of Tming,c : As stated in (Cai et al., 2004; Riera-Palou et al., 2008), choosing the
subcarriers for a group equispaced across the whole bandwidth minimizes subcarriercorrelation allowing the optimization of the system performance if an adequate family ofspreading codes is properly selected. To this end, rotated spreading transforms have beenproposed for multicarrier systems in (Bury et al., 2003) where it is shown that the oftenused Walsh-Hadamard codes lead to poor diversity gains when employed to perform thefrequency spreading. This can be explained by the fact that for certain symbol blocks theenergy is concentrated on one single subcarrier and, thus,
rank(
Tming,c
)
=
{
NR SDMNT NR STBC/CDD.
(45)
105Diversity Management in MIMO-OFDM Systems
www.intechopen.com

12 Will-be-set-by-IN-TECH
A deep fade on this subcarrier dramatically raises the probability of error in the detectionprocess, regardless of the state of all other subcarriers, limiting in this way the achievablediversity order (asymptotic BER slope). A similar effect can be observed when usingother spreading sequences such as those based on the discrete Fourier transform (DFT).As pointed out in (Bury et al., 2003), a spreading that has the potential to maximize thediversity order can be found by applying a rotation to the columns of the conventionalspreading matrix Cconv as C = CconvD(θ), where θ = [θ1 . . . θQ] with each θq denotingthe chip-specific rotation, which in the proposed scheme is given by
θq = exp
(
j2π(q − 1)
Q Θ
)
,
with Θ being constellation dependent and selected so as to make 2π/Θ the minimumangle producing a rotation of the transmit symbol alphabet onto itself (e.g., Θ = 2 forBPSK, Θ = 4 for MQAM). This indicates that while using conventional Walsh-Hadamardspreading no frequency diversity gain will be achieved, the rotated spreading has thepotential (depending on the channel correlation matrix Rg) to attain a frequency diversitygain proportional to the number of subcarriers per group, common to all groups andclasses. That is, when using optimally rotated spreading codes,
rank(
Tming,c
)
=
{
Q NR SDMQ NT NR STBC/CDD.
(46)
On the rank of Rming : The correlation matrix Rmin
g can be expressed in general form as
Rming = R
minhg
⊗RTX ⊗RRX , (47)
and consequently (Petersen & Pedersen, 2008),
rank(
Rming
)
= rank(
Rminhg
)
rank (RTX) rank (RRX) . (48)
Except for pathological setups exhibiting full spatial correlation between pairs of transmitor receive antennas (scenario not considered in this analysis), RTX and RRX are full rankmatrices with rank (RTX) = NT and rank (RRX) = NR, and therefore,
rank(
Rming
)
= NT NRrank(
Rminhg
)
. (49)
Therefore, the maximum attainable frequency diversity order can be directly related to
Rminhg
and is given by the number of independent paths in the channel delay profile. If
error performance is to be optimized, enough subcarriers per group need to be allocated
to ensure that rank(
Rminhg
)
= P. In fact, defining the sampled channel order L as the
channel delay spread in terms of chip (sampling) periods, it is shown in Cai et al. (2004)
that the maximum rank of Rminhg
is attained by setting the number of subcarriers per group
to Q = L + 1. While this is a valuable design rule in channels with short delay spread, inmost practical scenarios where L can be in the order of tens or even hundreds of samples,the theoretical number of subcarriers required to achieve full diversity would make the useof ML detection difficult even when using efficient search strategies (i.e., sphere decoding).
106 Recent Advances in Wireless Communications and Networks
www.intechopen.com

Diversity Management in MIMO-OFDM Systems 13
Moreover, very often maximum diversity would only be attained at unreasonably largeEs/N0 levels.
In order to determine the number of subcarriers worth using in a given environment (i.e.,a particular channel power delay profile), it is useful to use as reference the characteristicsof the ideal case where all subcarriers in the group are fully uncorrelated (frequencydomain iid channel). It is straightforward to see that, in this case, the frequency correlation
matrix is given by Rminhg
= IQ, with rank(
Rminhg
)
= Q, and furthermore, it has only
one non-zero eigenvalue λhg ,1 = 1 with multiplicity αhg ,1 = Q. Therefore, for any givenMIMO configuration and a fixed number of subcarriers, the frequency domain iid channelresults in the maximum frequency diversity order (Q) and will also lead to the minimumprobability of error.
Since, for most realistic scenarios, setting the group size to guarantee full diversity (Q =L + 1) is unfeasible, we need to be able to measure what each additional subcarrier iscontributing in terms of frequency diversity gain. Ideally, each additional subcarrier
should bring along an extra diversity order, that is, an increase in rank(
Rminhg
)
by one
as it is indeed the case for uncorrelated channels. For correlated channels, however, thisis often not the case and therefore to choose the group size it is useful to have some formof measure. A widely used tool in principal component analysis (Johnson & Wichern,2002) to assess the practical dimensionality of a correlation matrix is the cumulative sum
of eigenvalues (CSE) that, for the correlation matrix Rminhg
with eigenvalues{
λhg ,q
}Q
q=1, is
defined as
Ψ(n) =∑
nq=1 λhg ,q
∑Qq=1 λhg ,q
. (50)
For the frequency domain iid channel, Ψ(n) is always a discrete linearly increasing functionof n, and it can serve as a reference against which to measure the contribution of eachsubcarrier in arbitrary realistic channels.
As an example, suppose we are trying to determine the appropriate group size for modelsB and E from the propagation studies conducted in the definition of IEEE 802.11n (Erceg,2003). Both models have been measured across a total bandwidth of 20 MHz with a channelsampling chip period of 10 ns. On one hand Model B is made of 11 paths and it has anrms-delay spread of 15 ns and very low frequency selectivity. On the other hand ModelE corresponds to a channel with 38 paths (split in 4 clusters) with an rms-delay spread of100 ns, resulting in large frequency selectivity. While Model B is representative of typicaloffice indoor environments, Model E corresponds to large outdoor spaces such as airportsor sport halls.
Figure 3 depicts the CSE for channel profiles B, E and the iid model, for different numberof subcarriers (Q = 2, 4, 8 or 16) chosen equispaced across a bandwidth of 20 MHz. Itcan be inferred from the top left plot that when only two subcarriers are used per group(Q = 2), Models B and E behave qualitatively in a similar manner to the iid model andeach of the subcarriers contributes in a significant way towards the achievement of themaximum diversity. When increasing the number of subcarriers (e.g., Q = 4, 8, 16), this nolonger holds, notice how the CSE values for Model B quickly saturate and get farther apartfrom those of the iid channel, indicating that the additional subcarriers do not contributesubstantially in increasing the frequency diversity order. For the case of Model E, a similar
107Diversity Management in MIMO-OFDM Systems
www.intechopen.com
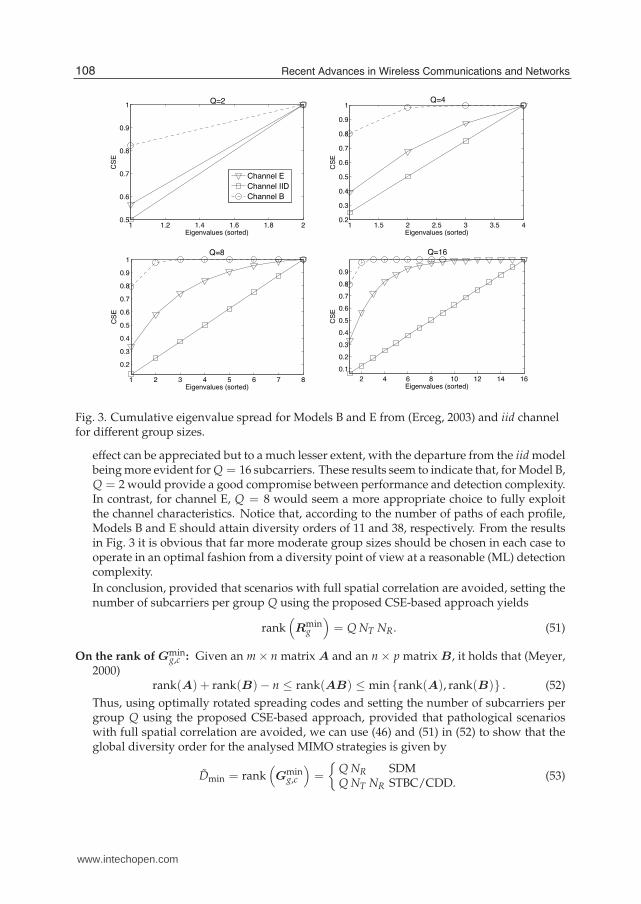
Fig. 3. Cumulative eigenvalue spread for Models B and E from (Erceg, 2003) and iid channelfor different group sizes.
effect can be appreciated but to a much lesser extent, with the departure from the iid modelbeing more evident for Q = 16 subcarriers. These results seem to indicate that, for Model B,Q = 2 would provide a good compromise between performance and detection complexity.In contrast, for channel E, Q = 8 would seem a more appropriate choice to fully exploitthe channel characteristics. Notice that, according to the number of paths of each profile,Models B and E should attain diversity orders of 11 and 38, respectively. From the resultsin Fig. 3 it is obvious that far more moderate group sizes should be chosen in each case tooperate in an optimal fashion from a diversity point of view at a reasonable (ML) detectioncomplexity.
In conclusion, provided that scenarios with full spatial correlation are avoided, setting thenumber of subcarriers per group Q using the proposed CSE-based approach yields
rank(
Rming
)
= Q NT NR. (51)
On the rank of Gming,c : Given an m × n matrix A and an n × p matrix B, it holds that (Meyer,
2000)rank(A) + rank(B)− n ≤ rank(AB) ≤ min {rank(A), rank(B)} . (52)
Thus, using optimally rotated spreading codes and setting the number of subcarriers pergroup Q using the proposed CSE-based approach, provided that pathological scenarioswith full spatial correlation are avoided, we can use (46) and (51) in (52) to show that theglobal diversity order for the analysed MIMO strategies is given by
Dmin = rank(
Gming,c
)
=
{
Q NR SDMQ NT NR STBC/CDD.
(53)
108 Recent Advances in Wireless Communications and Networks
www.intechopen.com

Fig. 4. Communication architecture for a MIMO-GO-CDM with group-size adaptation.
4. Reconfiguration strategies
It is clear from (44) and (53) that the (instantaneous) rank of the group frequency channel
correlation matrix Rminhg
determines the asymptotic diversity of a MIMO-GO-CDM system,
and therefore, it can form the basis for a group size adaptation mechanism. Strictly speaking,
the maximum possible rank of Rminhg
is given by the number of independent paths in the
channel profile. However, as shown in Subsection 3.3, very often the practical rank is farbelow this number as maximum diversity is only achieved at unrealistically low error rates.The adaptive group dimensioning scheme proposed next exploits this rank dependence todynamically set the group size as a function of the channel response between all pairsof transmit and receive antennas. Figure 4 illustrates the architecture of the adaptiveMIMO-GO-CDM system, where it can be appreciated that, in light of the acquired channelstate information (CSI) and system constraints (complexity, QoS), the receiver determines themost appropriate group size to use and communicates this decision to the transmitter usinga feedback channel. Note, as shown in Fig. 4, that CSI nd SNR information can also be usedto determine the most appropriate modulation and coding scheme in conjunction with theGO-CDM dimensioning and MIMO mode selection. However this topic is beyond the scopeof this chapter and in this work only fixed modulation and uncoded transmission modes areconsidered.In order to perform the adaptive dimensioning of the GO-CDM component, the receiver
requires an estimate Rminhg
of the group frequency channel correlation matrix. An accurate
estimate of the full correlation matrix Rminhg
could be computed by means of time averaging
over the frequency domain, however, in indoor/WLANs scenarios where channels tend tovary very slowly, this approach would require of many OFDM symbols to get an adequateestimate. Fortunately, only the group channel correlation matrix is required, thus simplifyingthe correlation estimation. Exploiting the grouping structure of GO-CDM-MIMO-OFDMand assuming the channel frequency response is a wide-sense stationary (WSS) process, it
is possible to derive an accurate estimate Rminhg
from the instantaneous CSI, provided the
subcarriers in a given group have been chosen equispaced across the available bandwidth.
Wirelesschannel
109Diversity Management in MIMO-OFDM Systems
www.intechopen.com

16 Will-be-set-by-IN-TECH
It is assumed that the group size to be determined is chosen from a finite set of possiblevalues Q =
{
Q1, . . . , Qmax}
whose maximum, Qmax, is limited by the maximum detectioncomplexity the receiver can support. Suppose that at block symbol k the receiver acquiresknowledge of the channel to form the frequency response hij(k) over all Nc subcarriers.Now, using the maximum group size available, Qmax, it is possible to form the frequency
responses for all Nming = Nc/Qmax groups,
{
hij1 (k), . . . , h
ijNmin
g(k)
}
. Taking into account the
WSS property it should hold that
E{
hijg,q(k)h
ijg,v(k)
}
= E{
hi′ j′m,q(k)h
i′ j′m,v(k)
}
, (54)
for all pairs of transmit and receive antennas (i, j) and (i′, j′) and any q, v ∈ {1, . . . , Qmax}, asthe correlation among any two subcarriers should only depend on their separation, not theirabsolute position or the transmit/receive antenna pair. A group channel correlation matrixestimate from a single frequency response can now be formed averaging across transmit andreceive antennas, and groups,
Rminhg
=1
NT NR Nming
NT
∑i=1
NR
∑j=1
Nming
∑g=1
hijg (k)(h
ijg (k))
H . (55)
Using basic properties regarding the rank of a matrix, it is easy to prove that rank(
Rminhg
)
≤min
(
Nming , Qmax
)
, therefore, Nming = Qmax maximises the range of possible group sizes using
a single CSI shot. Let us denote the non-increasingly ordered positive eigenvalues of Rminhg
by Λhg={
λhg ,q
}Q
q=1where, owing to the deterministic character of R
minhg
, they can all be
assumed to be different and with order one, and consequently, Q represents the true rank of
Rminhg
. For the purpose of adaptation, and based on the CSE criterion, a more flexible definition
of rank is given as
Qǫ = min
⎧
⎨
⎩
n : Ψ(n) =∑
nq=1 λhg ,q
∑Qq=1 λhg ,q
≥ 1 − ǫ
⎫
⎬
, (56)
where n ∈ {1, . . . , Q} and ǫ is a small non-negative value used to set a threshold on thenormalised CSE. Notice that Qǫ → Q as ǫ → 0.Since the group size Q represents the dimensions of an orthonormal spreading matrix C,restrictions apply on the range of values it can take. For instance, in the case of (rotated)Walsh-Hadamard matrices, Q is constrained to be a power of two. The mapping of Qǫ to anallowed group dimension, jointly with the setting of ǫ, permits the implementation of differentreconfiguration strategies, e.g.,
Maximise performance : Q = arg minQ∈Q
{Q ≥ Qǫ} (57a)
Minimise complexity : Q = arg minQ∈Q
{|Q − Qǫ|}. (57b)
It is difficult to assess the feedback involved in this adaptive diversity mechanism as itdepends on the dynamics of the underlying channel. The suggested strategy to implement
110 Recent Advances in Wireless Communications and Networks
www.intechopen.com
Diversity Management in MIMO-OFDM Systems 17
1 2 3 4 5 6 7 810
0
101
102
103
104
105
106
Group size (Q)
Expecte
d n
um
ber
of
opera
tions (
Ωg,
ΩT)
Ns=1, group
Ns=1, total
Ns=2, group
Ns=2, total
Ns=4, group
Ns=4, total
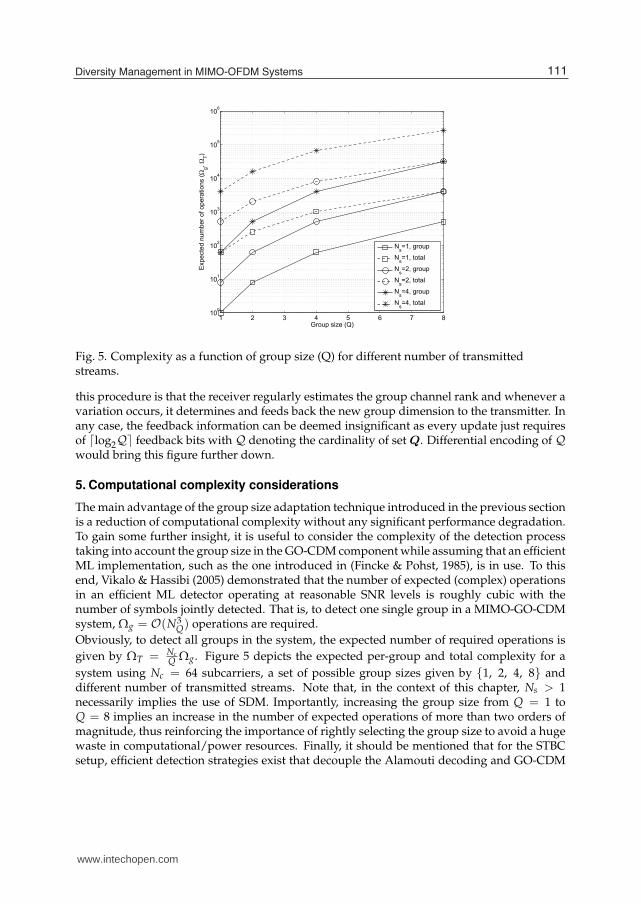
Fig. 5. Complexity as a function of group size (Q) for different number of transmittedstreams.
this procedure is that the receiver regularly estimates the group channel rank and whenever avariation occurs, it determines and feeds back the new group dimension to the transmitter. Inany case, the feedback information can be deemed insignificant as every update just requiresof ⌈log2Q⌉ feedback bits with Q denoting the cardinality of set Q. Differential encoding of Qwould bring this figure further down.
5. Computational complexity considerations
The main advantage of the group size adaptation technique introduced in the previous sectionis a reduction of computational complexity without any significant performance degradation.To gain some further insight, it is useful to consider the complexity of the detection processtaking into account the group size in the GO-CDM component while assuming that an efficientML implementation, such as the one introduced in (Fincke & Pohst, 1985), is in use. To thisend, Vikalo & Hassibi (2005) demonstrated that the number of expected (complex) operationsin an efficient ML detector operating at reasonable SNR levels is roughly cubic with thenumber of symbols jointly detected. That is, to detect one single group in a MIMO-GO-CDMsystem, Ωg = O(N3
Q) operations are required.
Obviously, to detect all groups in the system, the expected number of required operations is
given by ΩT = NcQ Ωg. Figure 5 depicts the expected per-group and total complexity for a
system using Nc = 64 subcarriers, a set of possible group sizes given by {1, 2, 4, 8} anddifferent number of transmitted streams. Note that, in the context of this chapter, Ns > 1necessarily implies the use of SDM. Importantly, increasing the group size from Q = 1 toQ = 8 implies an increase in the number of expected operations of more than two orders ofmagnitude, thus reinforcing the importance of rightly selecting the group size to avoid a hugewaste in computational/power resources. Finally, it should be mentioned that for the STBCsetup, efficient detection strategies exist that decouple the Alamouti decoding and GO-CDM
111Diversity Management in MIMO-OFDM Systems
www.intechopen.com

18 Will-be-set-by-IN-TECH
0 5 10 15 20
10−6
10−4
10−2
100
Eb/N
0 (dB)
BE
R
Spatial Division Multiplex
0 5 10 15 20
10−6
10−4
10−2
100
Cyclic Delay Diversity
Eb/N
0 (dB)
BE
R
0 5 10 15 20
10−6
10−4
10−2
100
Space−Time Block Coding
Eb/N
0 (dB)
BE
R
Q=1
Q=2
Q=4
Q=8
Fig. 6. Analytical (lines) and simulated (markers) BER for GO-CDM configured to operate inSDM (left), CDD (centre) and STBC (right) for different group sizes in Channel Profile E.
detection resulting in a simplified receiver architecture that is still optimum (Riera-Palou &Femenias, 2008).
6. Numerical results
In this section, numerical results are presented with the objective of validating the analyticalderivations introduced in previous sections and also to highlight the benefits of the adaptiveMIMO-GO-CDM architecture. The system considered employs Nc = 64 subcarriers withina B = 20 MHz bandwidth. These parameters are representative of modern WLAN systemssuch as IEEE 802.11n (IEEE, 2009). The GO-CDM technique has been applied by spreadingthe symbols forming a group with a rotated Walsh-Hadamard matrix of appropriate size. Theset of considered group sizes is given by Q = {1, 2, 4, 8}. This set covers the whole rangeof practical diversity orders for WLAN scenarios while remaining computationally feasible atreception. Note that a system with Q = 1 effectively disables the GO-CDM component. Formost of the results shown next, Channel Profile E from (Erceg, 2003) has been used. Perfectchannel knowledge is assumed at the receiver. Regarding the MIMO aspects, the system isconfigured with two transmit and two receive antennas (NT = NR = 2). As in (van Zelst &Hammerschmidt, 2002), the correlation coefficient between Tx (Rx) antennas is defined by asingle coefficient ρTx (ρRx). Note that in order to make a fair comparison among the differentspatial configurations, different modulation alphabets are used. For SDM, two streams aretransmitted using BPSK whereas for STBC and CDD, a single stream is sent using QPSKmodulation, ensuring that the three configurations achieve the same spectral efficiency.Figure 6 presents results for SDM, CDD and STBC when transmit and receive correlationare set to ρTx = 0.25 and ρRx = 0.75, respectively. The first point to highlight from thethree subfigures is the excellent agreement between simulated and analytical results for theusually relevant range of BERs (10−3 − 10−7). It can also be observed the various degrees ofinfluence exerted by the GO-CDM component depending on the particular spatial processingmechanism in use. For example, at a Pb = 10−4, it can be observed that in SDM and CDD,the maximum group size considered (Q = 8) brings along SNR reductions greater than 10dB when compared to the setup without GO-CDM (Q = 1). In contrast, in combinationwith STBC, the maximum gain offered by GO-CDM is just above 5 dB. The overall superiorperformance of STBC can be explained by the fact that it exploits transmit and receive
112 Recent Advances in Wireless Communications and Networks
www.intechopen.com

Diversity Management in MIMO-OFDM Systems 19
0 0.2 0.4 0.6 0.8 110
−4
10−3
10−2
10−1
100
ρrx
or ρtx
BE
R
Spatial division multiplexing
0 0.2 0.4 0.6 0.8 110
−4
10−3
10−2
10−1
100
ρrx
or ρtx
BE
R
Cyclic delay diversity
0 0.2 0.4 0.6 0.8 110
−4
10−3
10−2
10−1
100
ρrx
or ρtx
BE
R
Space−time block coding
Analytical, ρrx
=0
Analytical, ρtx
=0
Simulation, ρrx
=0
Simulation, ρtx
=0
Fig. 7. Analytical (lines) and simulated (markers) BER for GO-CDM configured to operate inSDM (left), CDD (centre) and STBC (right) for different transmit/antenna correlation values.
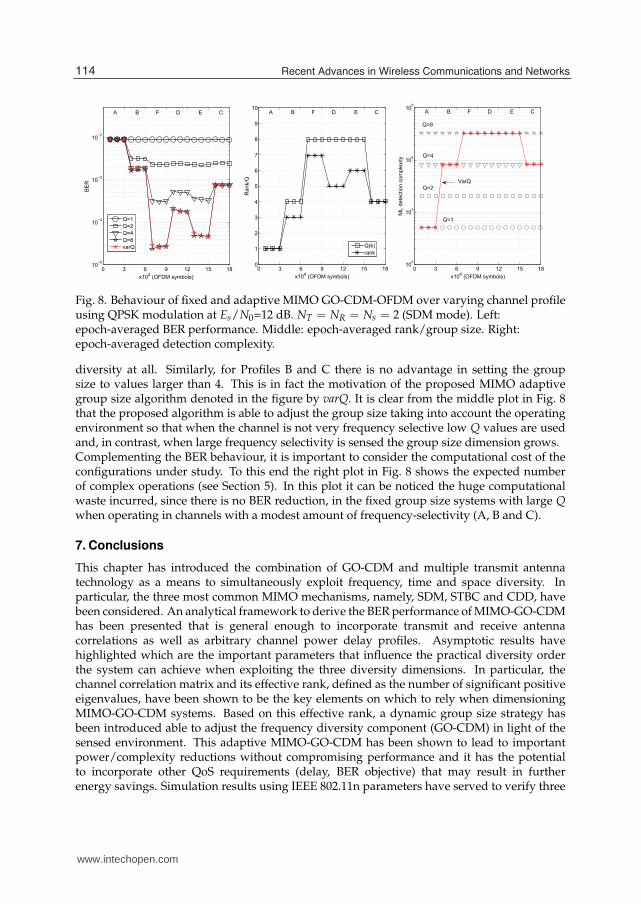
diversity whereas in SDM there is no transmit diversity and in CDD, this is only exploitedwhen combined with GO-CDM and/or channel coding.Next, the effects of antenna correlation at either side of the communication link have beenassessed for each of the MIMO processing schemes. To this end, the MIMO-GO-CDM systemhas been configured with Q = 2 and the SNR fixed to Es/N0 = 10 dB. The antenna correlationat one side was set to 0 when varying the antenna correlation at the other end between 0 and0.99. As seen in Fig. 7, a good agreement between analytical and numerical results can beappreciated. The small discrepancy between theory and simulation is mainly due to the useof the union bound, which always overestimates the true error rate. In any case, the theoreticalexpressions are able to predict the performance degradation due to an increased antennacorrelation. Note that, in CDD and SDM, for low to moderate values (0.0 − 0.7), correlation ateither end results in a similar BER degradation, however, for large values (> 0.7), correlationat the transmitter is significantly more deleterious than at the receiver. For the STBC scenario,analysis and simulation demonstrate that it does not matter which communication end suffersfrom antenna correlation as it leads to exactly the same results. This is because all symbols aretransmitted and received through all antennas (Tx and Rx) and therefore equally affected bythe correlation at both ends.Finally, the performance of the proposed group adaptive mechanism has been assessed bysimulation. The SNR has been fixed to Es/N0 = 12 dB and a time varying channel profilehas been generated. This profile is composed of epochs of 10,000 OFDM symbols each. Withinan epoch, an independent channel realisation for each OFDM symbol is drawn (quasi-staticblock fading) from the same channel profile. For visualisation clarity, the generating channelprofile is kept constant for three consecutive epochs and then it changes to a different one. Allchannel profiles (A-F) from IEEE 802.11n (Erceg, 2003) have been considered. Results showncorrespond to an SDM configuration.The left plot in Fig. 8 shows the BER evolution for fixed and adaptive group size systems as theenvironment switches among the different channel profiles. The upper-case letter on the topof each plot identifies the particular channel profile for a given epoch. Each marker representsthe averaged BER of 10,000 OFDM symbols. Focusing on the fixed group configurations it iseasy to observe that a large group size does not always bring along a reduction in BER. Forexample, for Profile A (frequency-flat channel) there is no benefit in pursuing extra frequency
113Diversity Management in MIMO-OFDM Systems
www.intechopen.com
20 Will-be-set-by-IN-TECH
0 3 6 9 12 15 1810
−5
10−4
10−3
10−2
x104 (OFDM symbols)
BE
R
0 3 6 9 12 15 1810
2
103
104
105
x104 (OFDM symbols)
ML d
ete
ction c
om
ple
xity
0 3 6 9 12 15 180
1
2
3
4
5
6
7
8
9
10
x104 (OFDM symbols)
Rank/Q
Q=1
Q=2
Q=4
Q=8
varQ Q(k)
rank
A B F D E C A B F D E C A B F D E C
Q=8
Q=4
Q=2
Q=1
VarQ
Fig. 8. Behaviour of fixed and adaptive MIMO GO-CDM-OFDM over varying channel profileusing QPSK modulation at Es/N0=12 dB. NT = NR = Ns = 2 (SDM mode). Left:epoch-averaged BER performance. Middle: epoch-averaged rank/group size. Right:epoch-averaged detection complexity.
diversity at all. Similarly, for Profiles B and C there is no advantage in setting the groupsize to values larger than 4. This is in fact the motivation of the proposed MIMO adaptivegroup size algorithm denoted in the figure by varQ. It is clear from the middle plot in Fig. 8that the proposed algorithm is able to adjust the group size taking into account the operatingenvironment so that when the channel is not very frequency selective low Q values are usedand, in contrast, when large frequency selectivity is sensed the group size dimension grows.Complementing the BER behaviour, it is important to consider the computational cost of theconfigurations under study. To this end the right plot in Fig. 8 shows the expected numberof complex operations (see Section 5). In this plot it can be noticed the huge computationalwaste incurred, since there is no BER reduction, in the fixed group size systems with large Qwhen operating in channels with a modest amount of frequency-selectivity (A, B and C).
7. Conclusions
This chapter has introduced the combination of GO-CDM and multiple transmit antennatechnology as a means to simultaneously exploit frequency, time and space diversity. Inparticular, the three most common MIMO mechanisms, namely, SDM, STBC and CDD, havebeen considered. An analytical framework to derive the BER performance of MIMO-GO-CDMhas been presented that is general enough to incorporate transmit and receive antennacorrelations as well as arbitrary channel power delay profiles. Asymptotic results havehighlighted which are the important parameters that influence the practical diversity orderthe system can achieve when exploiting the three diversity dimensions. In particular, thechannel correlation matrix and its effective rank, defined as the number of significant positiveeigenvalues, have been shown to be the key elements on which to rely when dimensioningMIMO-GO-CDM systems. Based on this effective rank, a dynamic group size strategy hasbeen introduced able to adjust the frequency diversity component (GO-CDM) in light of thesensed environment. This adaptive MIMO-GO-CDM has been shown to lead to importantpower/complexity reductions without compromising performance and it has the potentialto incorporate other QoS requirements (delay, BER objective) that may result in furtherenergy savings. Simulation results using IEEE 802.11n parameters have served to verify three
114 Recent Advances in Wireless Communications and Networks
www.intechopen.com

Diversity Management in MIMO-OFDM Systems 21
facts. Firstly, MIMO-GO-CDM is a versatile architecture to exploit the different degrees offreedom the environment has to offer. Secondly, the presented analytical framework is able toaccurately model the BER behaviour of the various MIMO-GO-CDM configurations. Lastly,the adaptive group size strategy is able to recognize the operating environment and adapt thesystem appropriately.
8. Acknowledgments
This work has been supported in part by MEC and FEDER under projects MARIMBA(TEC2005-00997/TCM) and COSMOS (TEC2008-02422), and a Ramón y Cajal fellowship(co-financed by the European Social Fund), and by Govern de les Illes Balears through projectXISPES (PROGECIB-23A).
9. References
Alamouti, A. (1998). A simple transmit diversity technique for wireless communications, IEEEJSAC 16: 1451–1458.
Amari, S. & Misra, R. (1997). Closed-form expressions for distribution of sum of exponentialrandom variables, IEEE Trans. Reliability 46(4): 519–522.
Bauch, G. & Malik, J. (2006). Cyclic delay diversity with bit-interleaved coded modulationin orthogonal frequency division multiple access, IEEE Trans. Wireless Commun.8: 2092–2100.
Bury, A., Egle, J. & Lindner, J. (2003). Diversity comparison of spreading transforms formulticarrier spread spectrum transmission, IEEE Trans. Commun. 51(5): 774–781.
Cai, X., Zhou, S. & Giannakis, G. (2004). Group-orthogonal multicarrier CDMA, IEEE Trans.Commun. 52(1): 90–99.
Cimini Jr., L. (1985). Analysis and simulation of a digital mobile channel using orthogonalfrequency division multiplexing, IEEE Transactions on Communications 33(7): 665–675.
Craig, J. W. (1991). A new, simple and exact result for calculating the probability of errorfor two-dimensional signal constellations, IEEE MILCOM’91 Conf. Rec., Boston, MA,pp. 25.5.1–25.5.5.
Erceg, V. (2003). Indoor MIMO WLAN Channel Models. doc.: IEEE 802.11-03/871r0, Draftproposal.
Femenias, G. (2004). BER performance of linear STBC from orthogonal designs over MIMOcorrelated Nakagami-m fading channels, IEEE Trans. Veh. Technol. 53(2): 307–317.
Fincke, U. & Pohst, M. (1985). Improved methods for calculating vectors of short length in alattice, including a complexity analysis, Math. Comput. 44: 463–471.
Foschini, G. (1996). Layered space-time architecture for wireless communication in afading environment when using multi-element antennas, Bell Labs Technical Journal1(2): 41–59.
Haykin, S. (2001). Communication Systems, 4th edn, Wiley.IEEE (2009). Part 11: Wireless LAN Medium Access Control (MAC) and Physical Layer
(PHY) Specifications Amendment 5: Enhancements for Higher Throughput, IEEEStd 802.11n-2009 .
Johnson, R. & Wichern, D. (2002). Applied Multivariate Statistical Analysis, fifth edn, PrenticeHall.
Kaiser, S. (2002). OFDM code-division multiplexing in fading channels, IEEE Trans. Commun.50: 1266–1273.
115Diversity Management in MIMO-OFDM Systems
www.intechopen.com

22 Will-be-set-by-IN-TECH
Meyer, C. (2000). Matrix analysis and applied linear algebra, Society for Industrial and AppliedMathematics (SIAM).
Petersen, K. B. & Pedersen, M. S. (2008). The matrix cookbook. Version 20081110.URL: http://www2.imm.dtu.dk/pubdb/p.php?3274
Riera-Palou, F. & Femenias, G. (2008). Improving STBC performance in IEEE 802.11nusing group-orthogonal frequency diversity, Proc. IEEE Wireless Communications andNetworking Conference, Las Vegas (US), pp. 1–6.
Riera-Palou, F. & Femenias, G. (2009). OFDM with adaptive frequency diversity, IEEE SignalProcessing Letters 16(10): 837 – 840.
Riera-Palou, F., Femenias, G. & Ramis, J. (2008). On the design of uplink anddownlink group-orthogonal multicarrier wireless systems, IEEE Trans. Commun.56(10): 1656–1665.
Simon, M. & Alouini, M. (2005). Digital communication over fading channels, Wiley-IEEE Press.Simon, M., Hinedi, S. & Lindsey, W. (1995). Digital communication techniques: signal design and
detection, Prentice Hall PTR.Stuber, G., Barry, J., Mclaughlin, S., Li, Y., Ingram, M. & Pratt, T. (2004). Broadband
MIMO-OFDM wireless communications, Proceedings of the IEEE 92(2): 271–294.Tarokh, V., Jafarkhani, H. & Calderbank, A. (1999). Space-time block codes from orthogonal
designs, IEEE Transactions on Information Theory 45(5): 1456–1467.Telatar, E. (1999). Capacity of Multi-antenna Gaussian Channels, European Transactions on
Telecommunications 10(6): 585–595.van Zelst, A. & Hammerschmidt, J. (2002). A single coefficient spatial correlation model
for multiple-input multiple-output (mimo) radio channels, Proc. Proc. URSI XXVIIthGeneral Assembly, Maastricht (the Netherlands), pp. 1–4.
Vikalo, H. & Hassibi, B. (2005). On the sphere-decoding algorithm ii. generalizations,second-order statistics, and applications to communications, Signal Processing, IEEETransactions on 53(8): 2819 – 2834.
Weinstein, S. & Ebert, P. (1971). Data transmission by frequency-division multiplexing usingthe discrete Fourier transform, IEEE Trans. Commun. Tech. 19: 628–634.
Wittneben, S. (1993). A new bandwidth efficient transmit antenna modulation diversityscheme for linear digital modulation, Proc. IEEE Int. Conf. on Commun., Geneva(Switzerland), pp. 1630–1634.
Yee, N., Linnartz, J.-P. & Fettweis, G. (1993). Multi-carrier CDMA in indoor wireless radionetworks, Proc. IEEE Int. Symp. on Pers., Indoor and Mob. Rad. Comm., Yokohama(Japan), pp. 109–113.
116 Recent Advances in Wireless Communications and Networks
www.intechopen.com
Recent Advances in Wireless Communications and NetworksEdited by Prof. Jia-Chin Lin
ISBN 978-953-307-274-6Hard cover, 454 pagesPublisher InTechPublished online 23, August, 2011Published in print edition August, 2011
InTech EuropeUniversity Campus STeP Ri Slavka Krautzeka 83/A 51000 Rijeka, Croatia Phone: +385 (51) 770 447 Fax: +385 (51) 686 166www.intechopen.com
InTech ChinaUnit 405, Office Block, Hotel Equatorial Shanghai No.65, Yan An Road (West), Shanghai, 200040, China
Phone: +86-21-62489820 Fax: +86-21-62489821
This book focuses on the current hottest issues from the lowest layers to the upper layers of wirelesscommunication networks and provides “real-time†research progress on these issues. The authors havemade every effort to systematically organize the information on these topics to make it easily accessible toreaders of any level. This book also maintains the balance between current research results and theirtheoretical support. In this book, a variety of novel techniques in wireless communications and networks areinvestigated. The authors attempt to present these topics in detail. Insightful and reader-friendly descriptionsare presented to nourish readers of any level, from practicing and knowledgeable communication engineers tobeginning or professional researchers. All interested readers can easily find noteworthy materials in muchgreater detail than in previous publications and in the references cited in these chapters.
How to referenceIn order to correctly reference this scholarly work, feel free to copy and paste the following:
Felip Riera-Palou and Guillem Femenias (2011). Diversity Management in MIMO-OFDM Systems, RecentAdvances in Wireless Communications and Networks, Prof. Jia-Chin Lin (Ed.), ISBN: 978-953-307-274-6,InTech, Available from: http://www.intechopen.com/books/recent-advances-in-wireless-communications-and-networks/diversity-management-in-mimo-ofdm-systems

© 2011 The Author(s). Licensee IntechOpen. This chapter is distributedunder the terms of the Creative Commons Attribution-NonCommercial-ShareAlike-3.0 License, which permits use, distribution and reproduction fornon-commercial purposes, provided the original is properly cited andderivative works building on this content are distributed under the samelicense.

![Hard Decision-Based PWM for MIMO-OFDM Radar · 2. MIMO-OFDM Radar Signal Model-Based PWM 2.1. MIMO-OFDM Radar Systems Structure In [1], OFDM technique has the advantage of combating](https://img.dokumen.tips/doc/110x75/5e6a685a5002aa073940e3bf/hard-decision-based-pwm-for-mimo-ofdm-radar-2-mimo-ofdm-radar-signal-model-based.jpg)