Embed Size (px)
Citation preview
Dr. A. LAXMAIAH, MBBS, DPH, MPH, Ph.D, MBA, PG Certificate in
Applied Nutrition
Scientist ‘F’ & Head, Division of Community studies
National Institute of Nutrition, ICMR
E-mail: [email protected]
Changes in dietary intakes, nutrition and health status, evidence from NNMB surveys from 1975-
79 to 2012
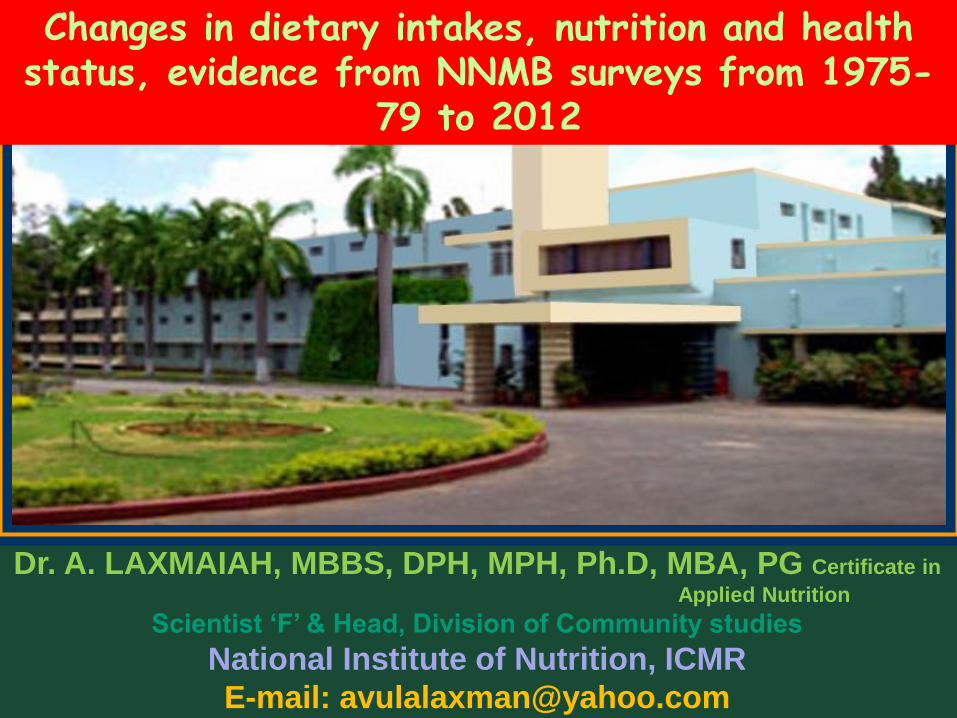
1. Protein Energy Malnutrition (PEM) Clinical forms
- Marasmus
- Kwashiorkor
- Marasmic-kwashiorkor
Sub-clinical forms
- Underweight
- Stunting
- Wasting
3. Micronutrient Deficiency Disorders (MNDs) - Iron deficiency anaemia (IDA)
- Vitamin A deficiency diseases (VAD)
- Iodine Deficiency Disorders (IDD)
3. Diet related chronic diseases - Overweight and obesity,
- Type 2 diabetes
- Insulin Resistance
- Hypertension,
- Other cardiovascular diseases, etc.
Nutritional Challenges in India
(Triple burden of Disease)
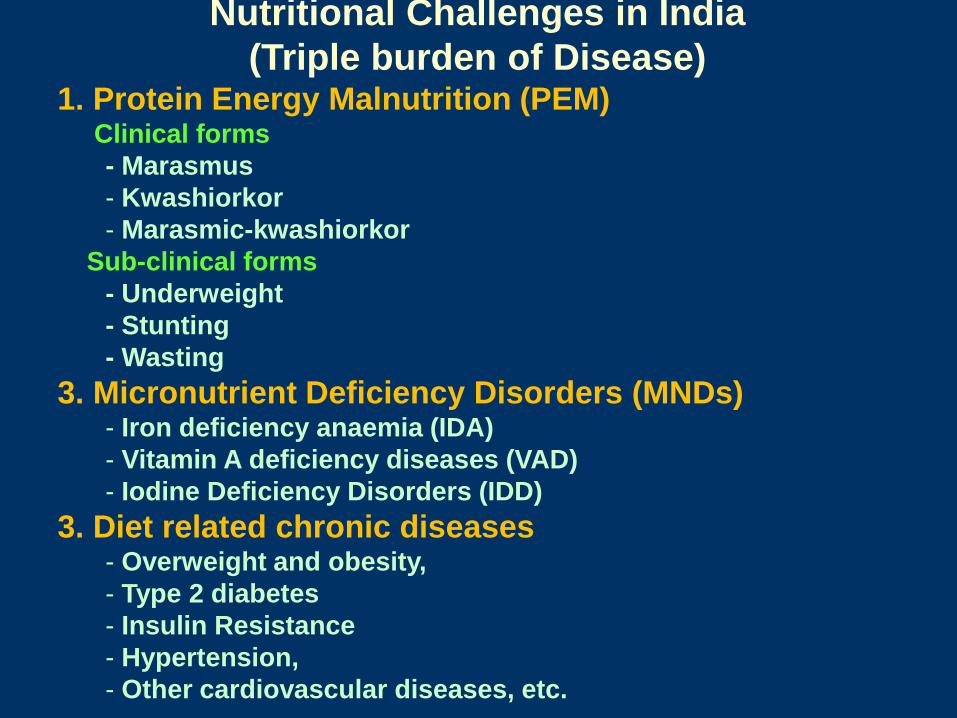
There are 854 million people in the world (about 14% of
the world population), who are chronically or acutely
undernourished.
Child undernutrition in Asia tops even sub-Saharan
Africa, 30% of children under five in Asia are
underweight, while in Sub-Saharan Africa, it was 28%.
India, Bangladesh and Pakistan together account for
half the World’s underweight children.
In addition, hidden hunger from micronutrient
deficiencies affects more than 2 billion people
worldwide.
Undernutrition and overweight/obesity are twin problems
in low and middle income countries – leading to double
burden of disease.
potential.
Magnitude of the problem (Contd.)
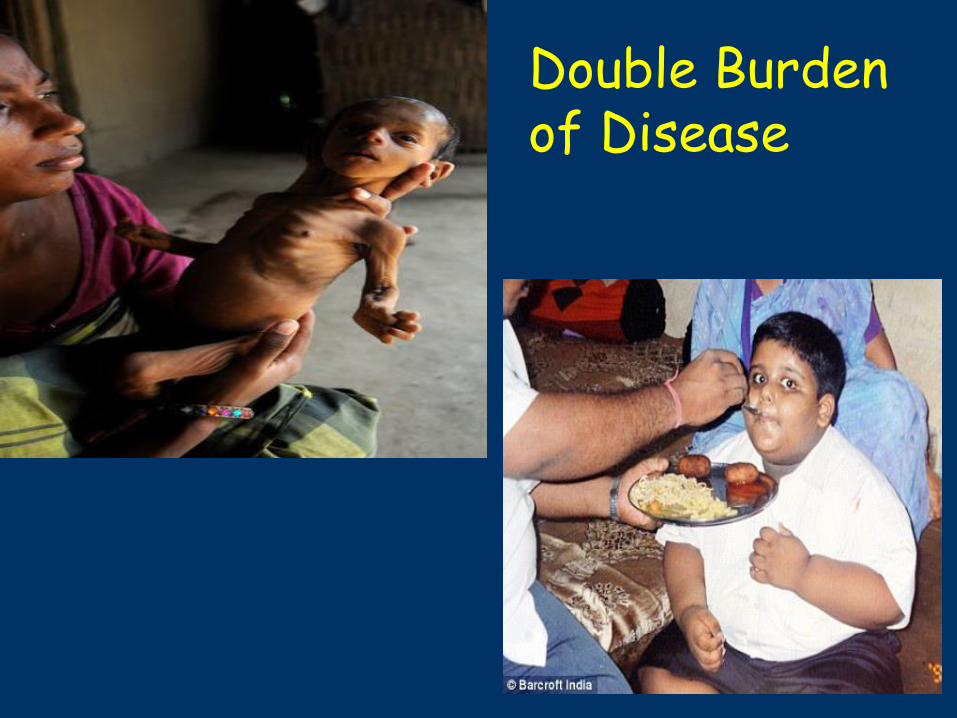
Double Burden of Disease
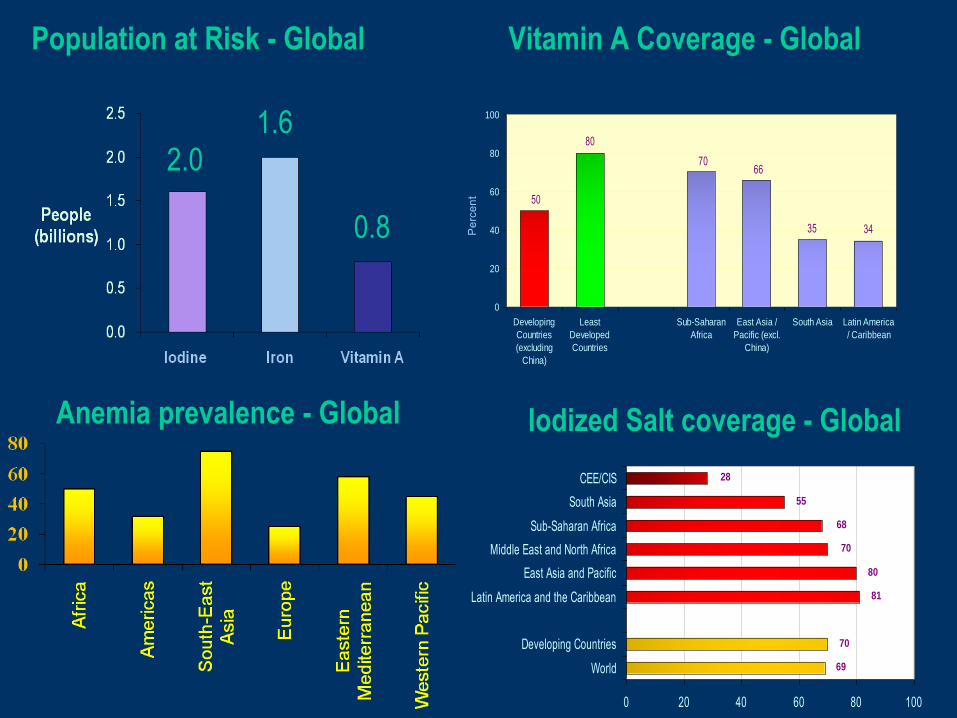
1.6 2.0
0.8
Population at Risk - Global
7066
35 34
80
50
0
20
40
60
80
100
Developing
Countries
(excluding
China)
Least
Developed
Countries
Sub-Saharan
Africa
East Asia /
Pacific (excl.
China)
South Asia Latin America
/ Caribbean
Pe
rce
nt
69
70
28
55
68
70
80
81
0 20 40 60 80 100
World
Developing Countries
Latin America and the Caribbean
East Asia and Pacific
Middle East and North Africa
Sub-Saharan Africa
South Asia
CEE/CIS
Vitamin A Coverage - Global
Anemia prevalence - Global Iodized Salt coverage - Global
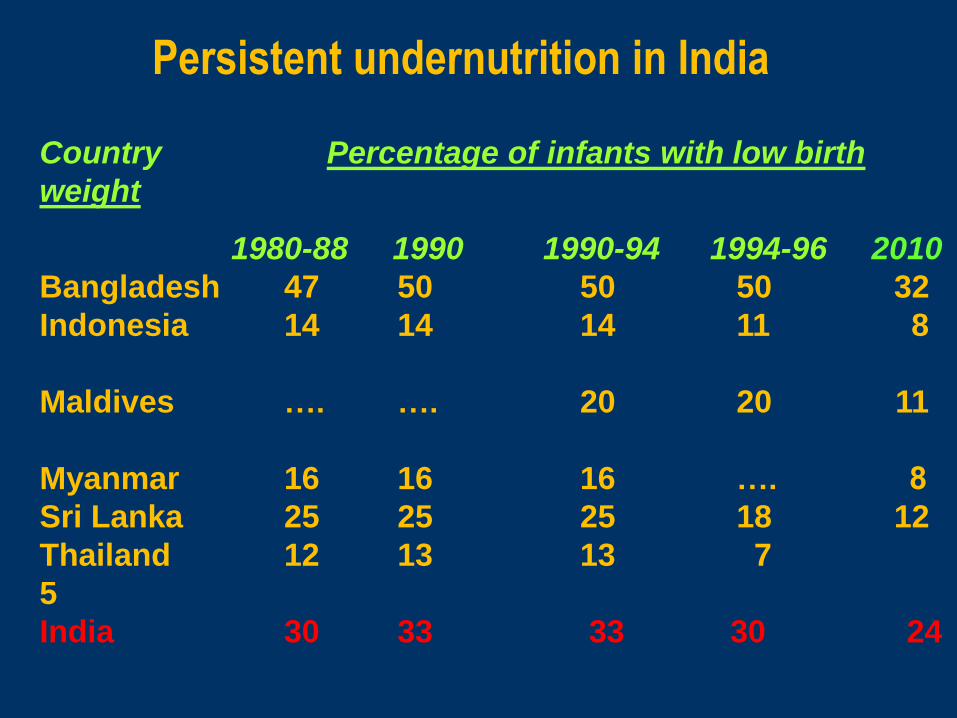
Persistent undernutrition in India
Country Percentage of infants with low birth
weight
1980-88 1990 1990-94 1994-96 2010
Bangladesh 47 50 50 50 32
Indonesia 14 14 14 11 8
Maldives …. …. 20 20 11
Myanmar 16 16 16 …. 8
Sri Lanka 25 25 25 18 12
Thailand 12 13 13 7
5
India 30 33 33 30 24
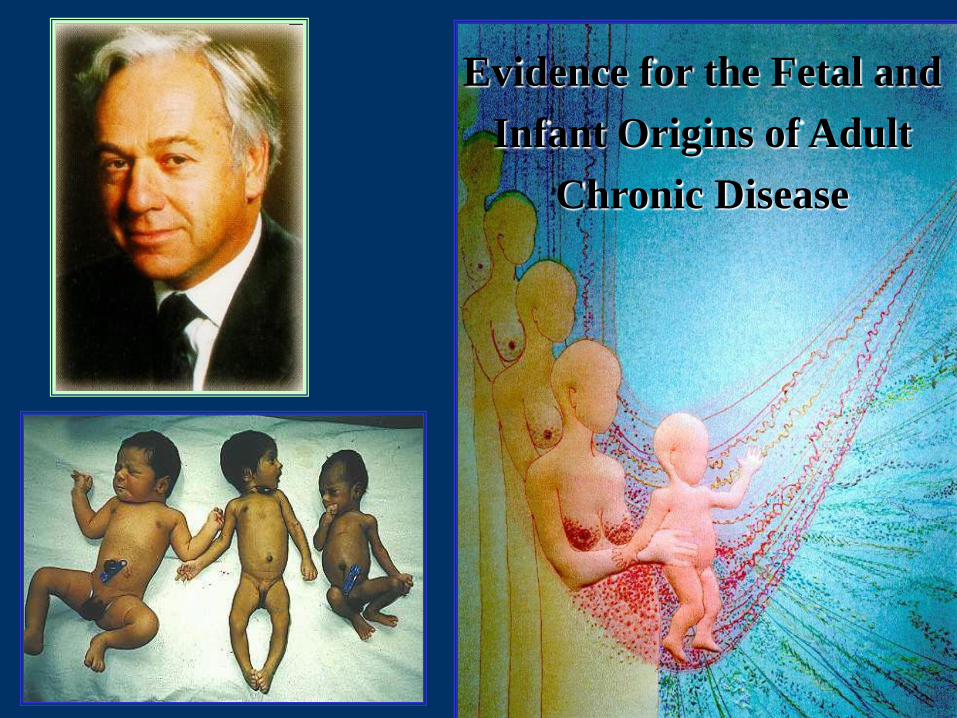
Evidence for the Fetal and
Infant Origins of Adult
Chronic Disease
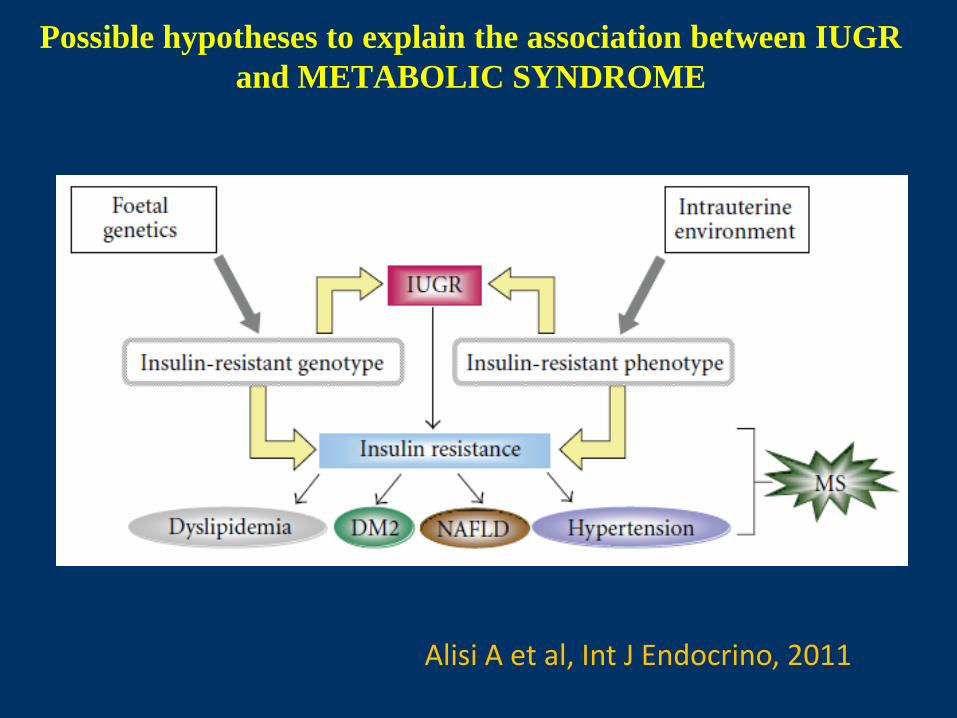
Possible hypotheses to explain the association between IUGR
and METABOLIC SYNDROME
Alisi A et al, Int J Endocrino, 2011
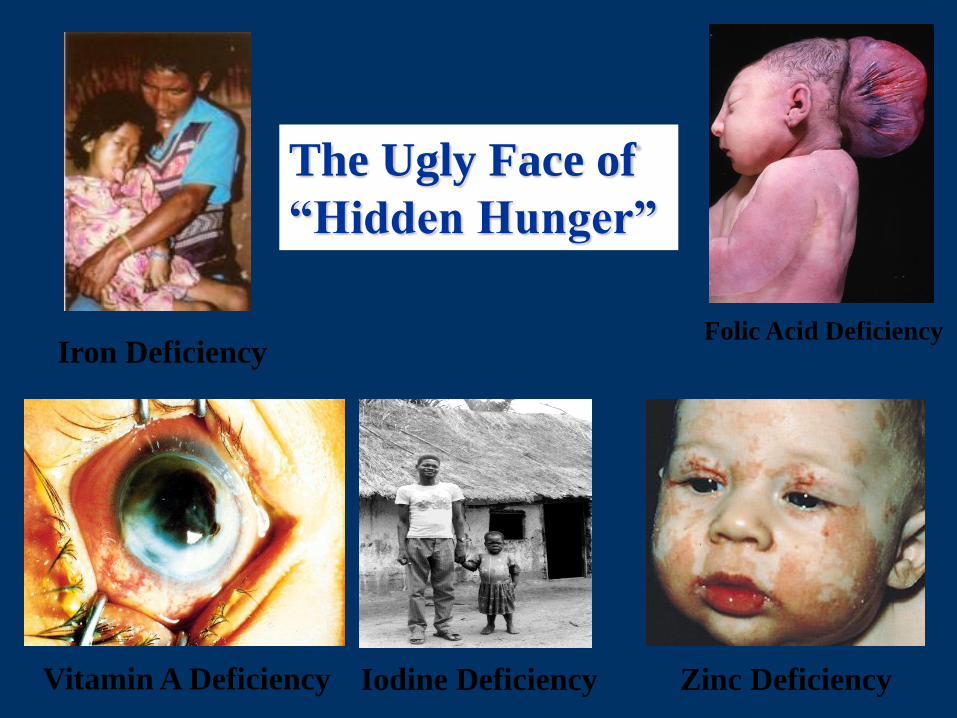
The Ugly Face of
“Hidden Hunger”
Zinc Deficiency Vitamin A Deficiency Iodine Deficiency
Iron Deficiency Folic Acid Deficiency

Micronutrients (vitamins and minerals) are
essential for many functions and health
Normal
Growth
Healthy aging
Healthy Babies
Strengthening
immune system
Good Health
Good
Performance
Normal
Brain Growth
that are only needed in
small amounts,
but are essential for …
They cannot be produced by the body and have to come
from the diet
13 vitamins and 14 minerals

Nutrition is the centre for over all development of
the country
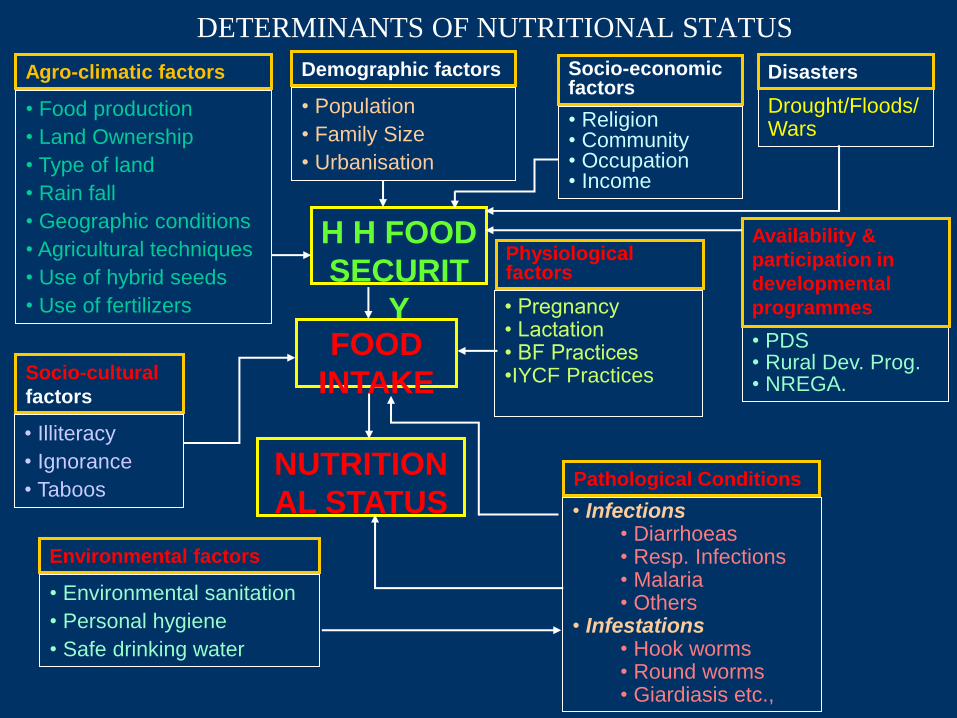
DETERMINANTS OF NUTRITIONAL STATUS
• Food production
• Land Ownership
• Type of land
• Rain fall
• Geographic conditions
• Agricultural techniques
• Use of hybrid seeds
• Use of fertilizers
• Population
• Family Size
• Urbanisation
• Religion • Community • Occupation • Income
Drought/Floods/ Wars
• Illiteracy
• Ignorance
• Taboos
• PDS • Rural Dev. Prog. • NREGA.
• Infections • Diarrhoeas • Resp. Infections • Malaria • Others
• Infestations • Hook worms • Round worms • Giardiasis etc.,
• Environmental sanitation
• Personal hygiene
• Safe drinking water
H H FOOD
SECURIT
Y FOOD
INTAKE
NUTRITION
AL STATUS
Agro-climatic factors Demographic factors Socio-economic factors
Disasters
Availability &
participation in
developmental
programmes
Socio-cultural
factors
Environmental factors
Pathological Conditions
Physiological factors
• Pregnancy • Lactation • BF Practices •IYCF Practices
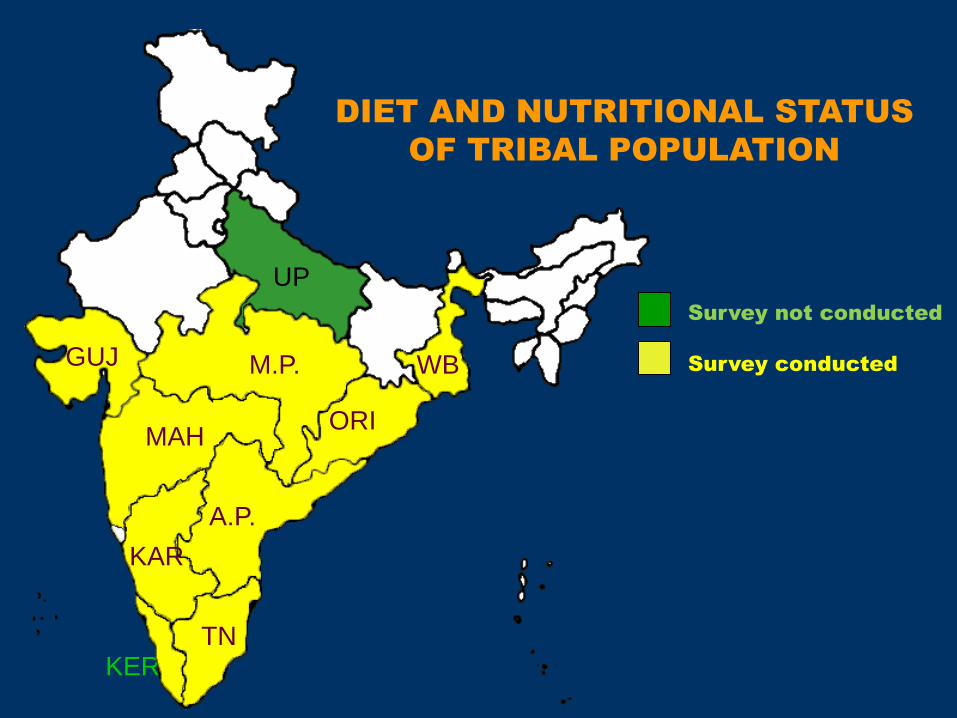
KER
DIET AND NUTRITIONAL STATUS
OF TRIBAL POPULATION
Survey not conducted
Survey conducted
UP
WB
TN
A.P.
KAR
MAH ORI
GUJ M.P.
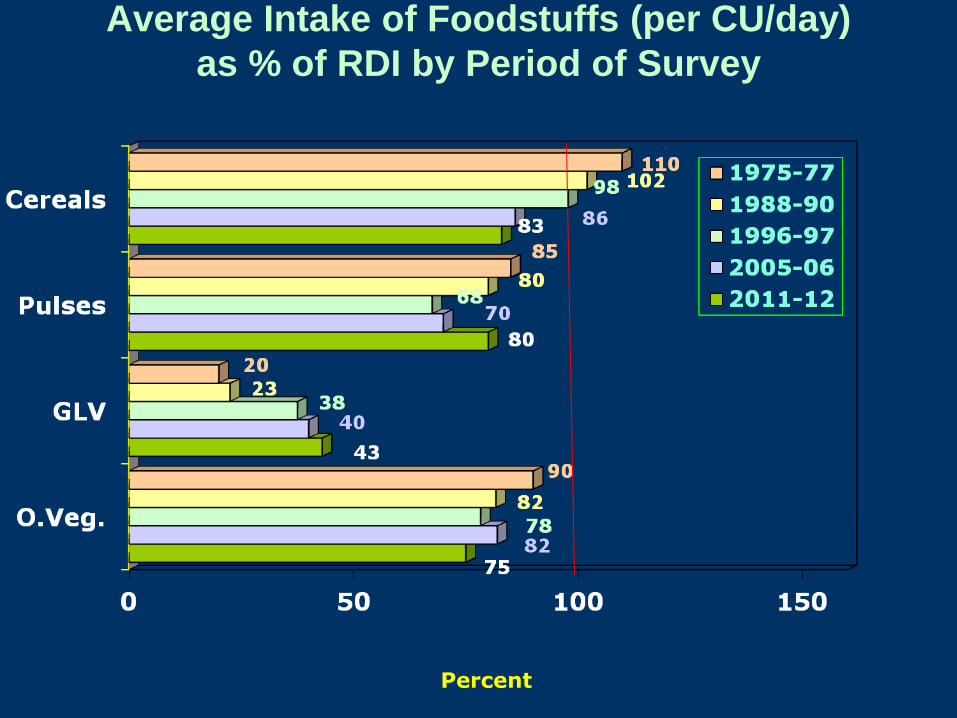
Average Intake of Foodstuffs (per CU/day)
as % of RDI by Period of Survey
Percent
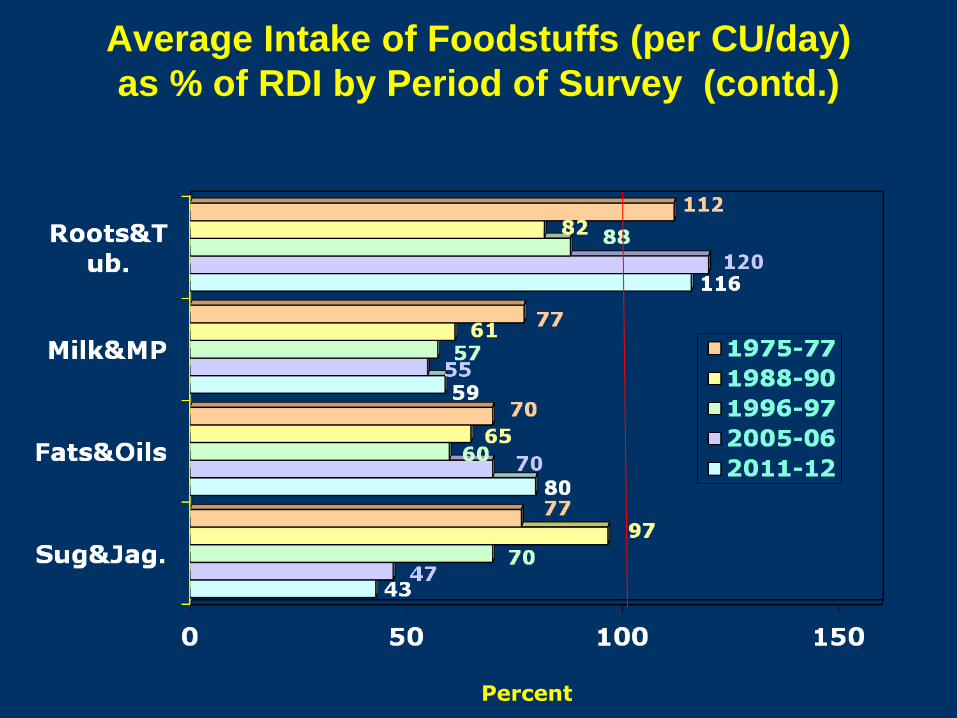
Average Intake of Foodstuffs (per CU/day)
as % of RDI by Period of Survey (contd.)
Percent
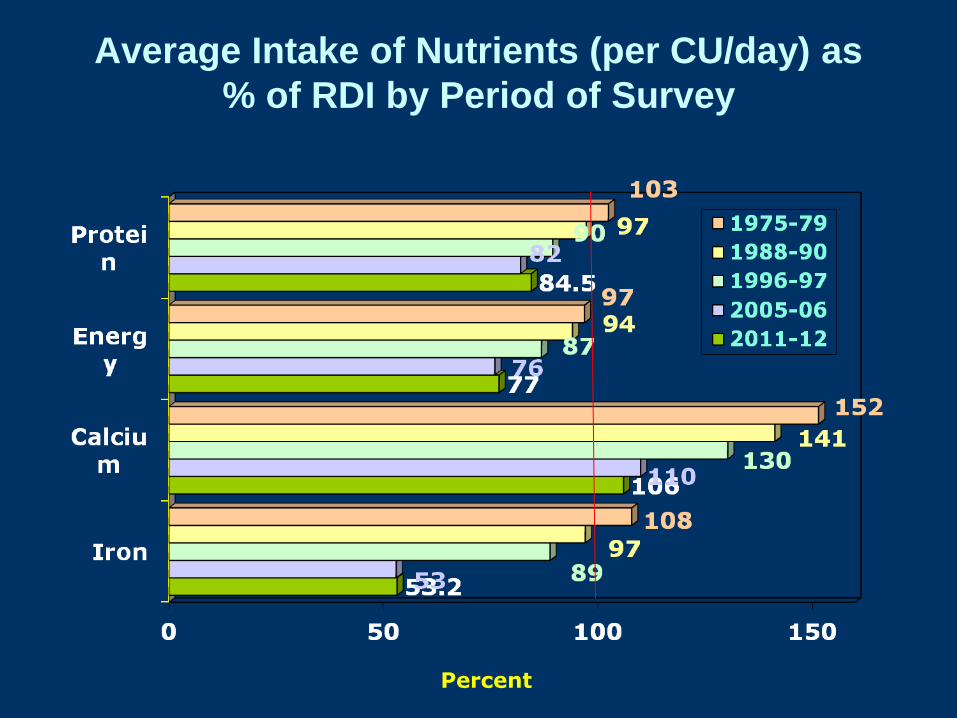
Average Intake of Nutrients (per CU/day) as
% of RDI by Period of Survey
Percent
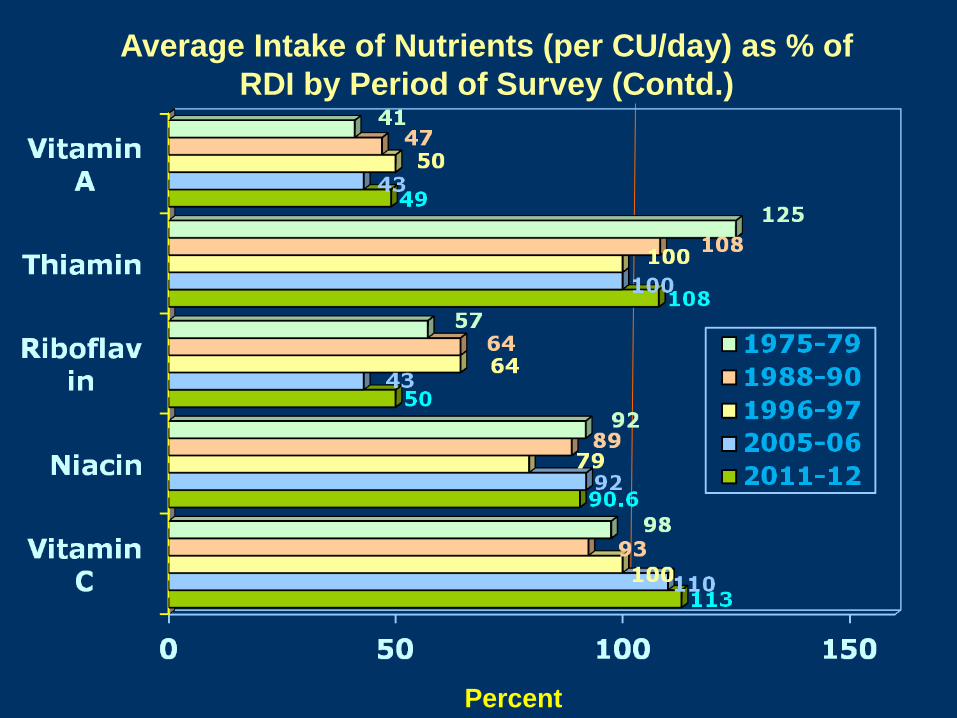
Percent
Average Intake of Nutrients (per CU/day) as % of
RDI by Period of Survey (Contd.)
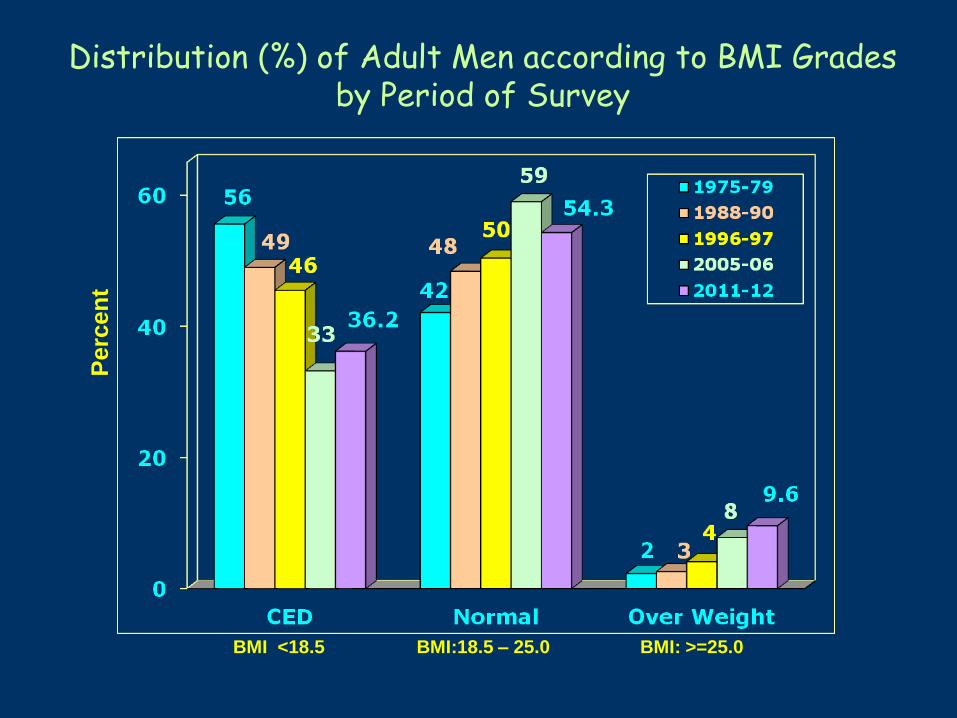
Distribution (%) of Adult Men according to BMI Grades by Period of Survey P
erc
en
t
BMI <18.5 BMI:18.5 – 25.0 BMI: >=25.0
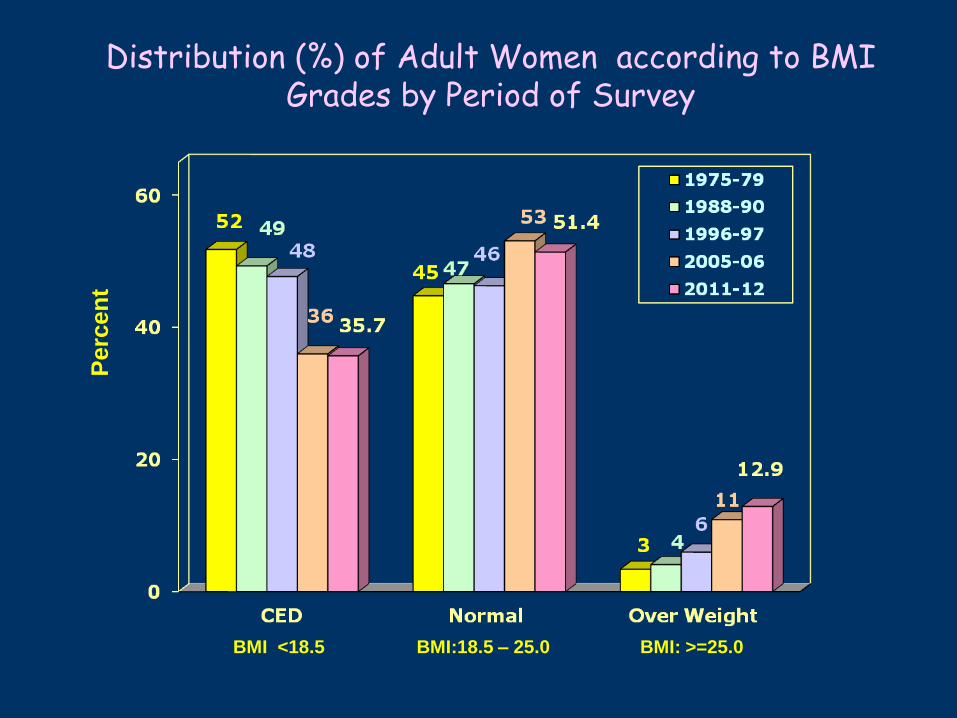
Distribution (%) of Adult Women according to BMI Grades by Period of Survey
Perc
en
t
BMI <18.5 BMI:18.5 – 25.0 BMI: >=25.0
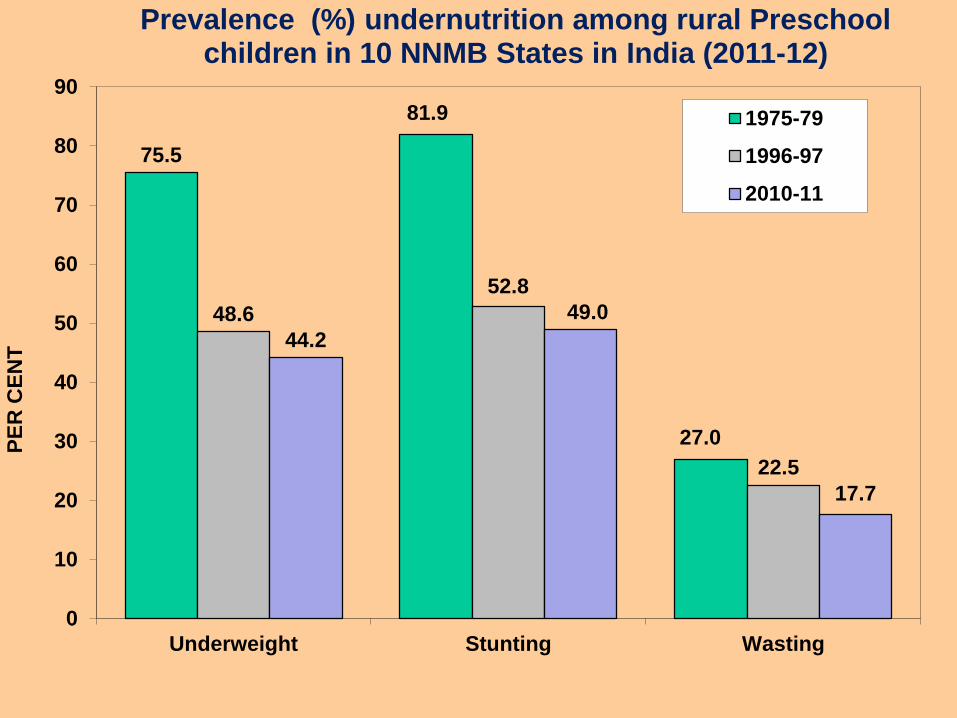
75.5
81.9
27.0
48.6
52.8
22.5
44.2
49.0
17.7
0
10
20
30
40
50
60
70
80
90
Underweight Stunting Wasting
PE
R C
EN
T
Prevalence (%) undernutrition among rural Preschool children in 10 NNMB States in India (2011-12)
1975-79
1996-97
2010-11

Percentage of Under weight Children by State (<6
years)

Prevalence of Undernutrition among <5 years
children according to Weight for Age
Faulty BF Faulty
Complemen
tary feeding

INFANT AND YOUNG CHILD FEEDING PRACTICES
(Low levels of IYCF Practices)
22
29
23
48
4046
54
62
56
0
20
40
60
80
100
Early Initiation
of BF
Exclusive BF
Upto 6 months
Compl. Feeding
among 6- 9 months
Children
Rural Urban Pooled
Low coverage for National nutrition programmes by the target
beneficiaries
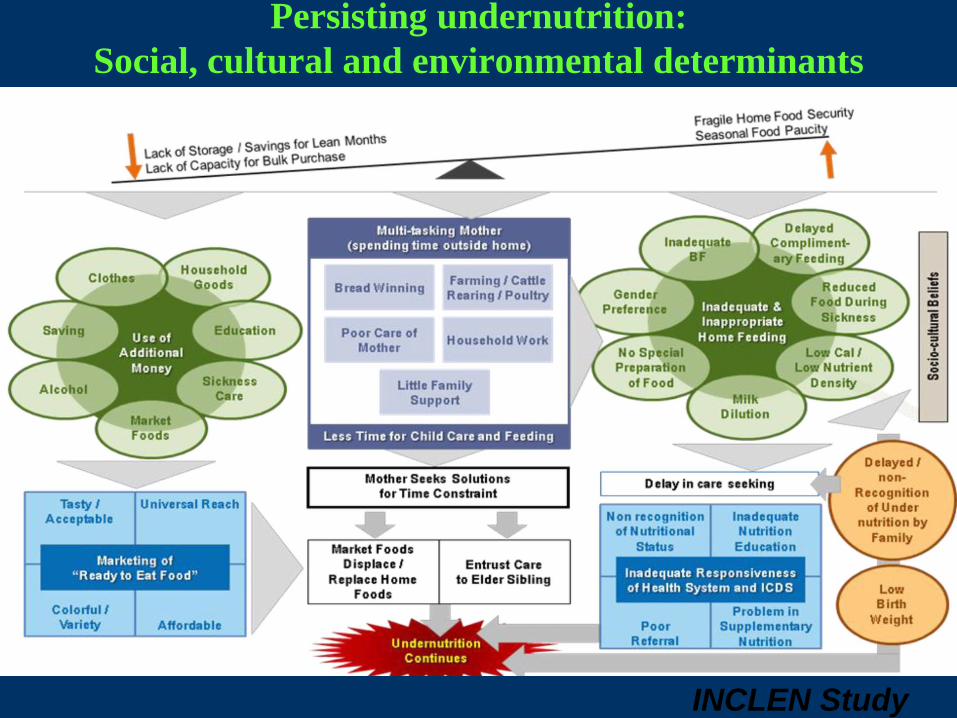
INCLEN Study
2009-11
Persisting undernutrition:
Social, cultural and environmental determinants
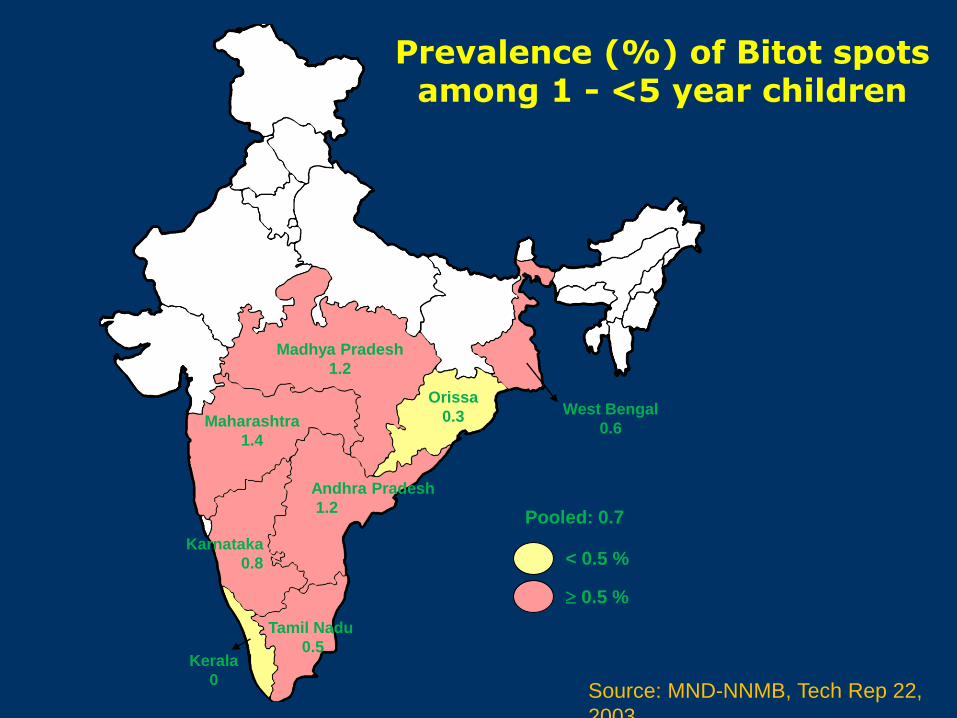
Pooled: 0.7
< 0.5 %
0.5 %
Kerala
0
Tamil Nadu
0.5
Karnataka
0.8
Andhra Pradesh
1.2
Maharashtra
1.4
Madhya Pradesh
1.2
Orissa
0.3 West Bengal
0.6
Prevalence (%) of Bitot spots among 1 - <5 year children
Source: MND-NNMB, Tech Rep 22,
2003
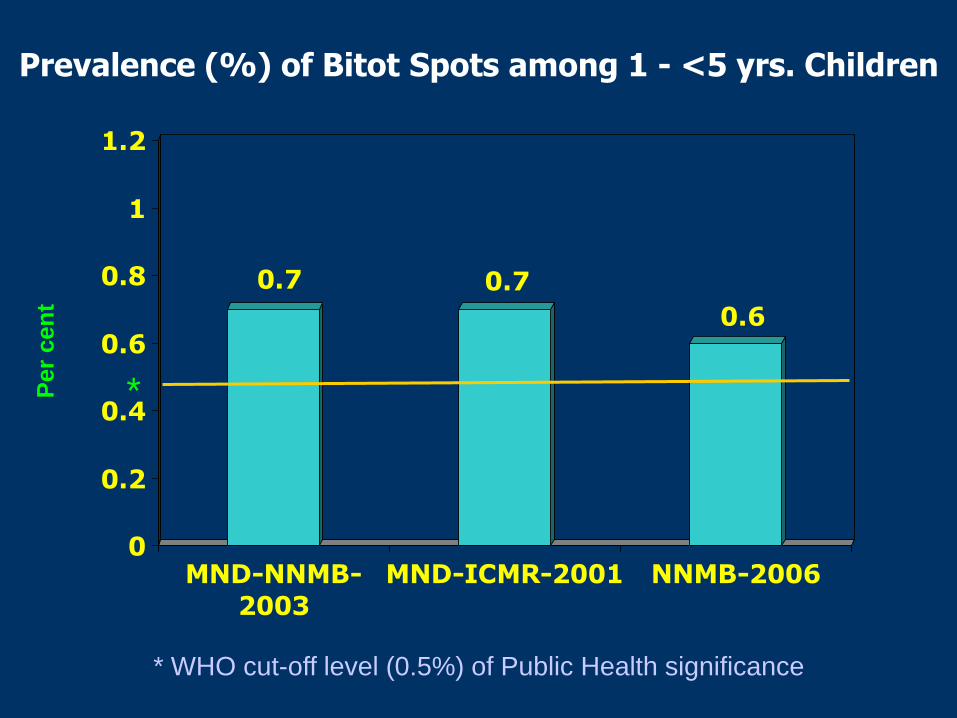
0.7 0.7
0.6
0
0.2
0.4
0.6
0.8
1
1.2
MND-NNMB-
2003
MND-ICMR-2001 NNMB-2006
Prevalence (%) of Bitot Spots among 1 - <5 yrs. Children
* WHO cut-off level (0.5%) of Public Health significance
* Per
cen
t
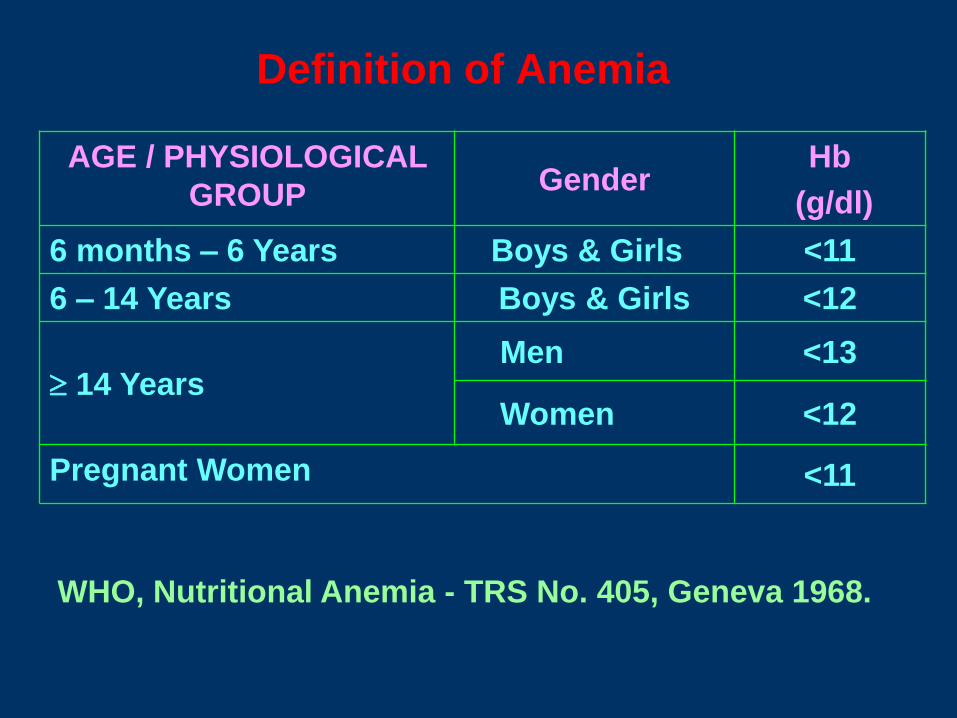
AGE / PHYSIOLOGICAL
GROUP Gender
Hb
(g/dl)
6 months – 6 Years Boys & Girls <11
6 – 14 Years Boys & Girls <12
14 Years Men <13
Women <12
Pregnant Women <11
WHO, Nutritional Anemia - TRS No. 405, Geneva 1968.
Definition of Anemia
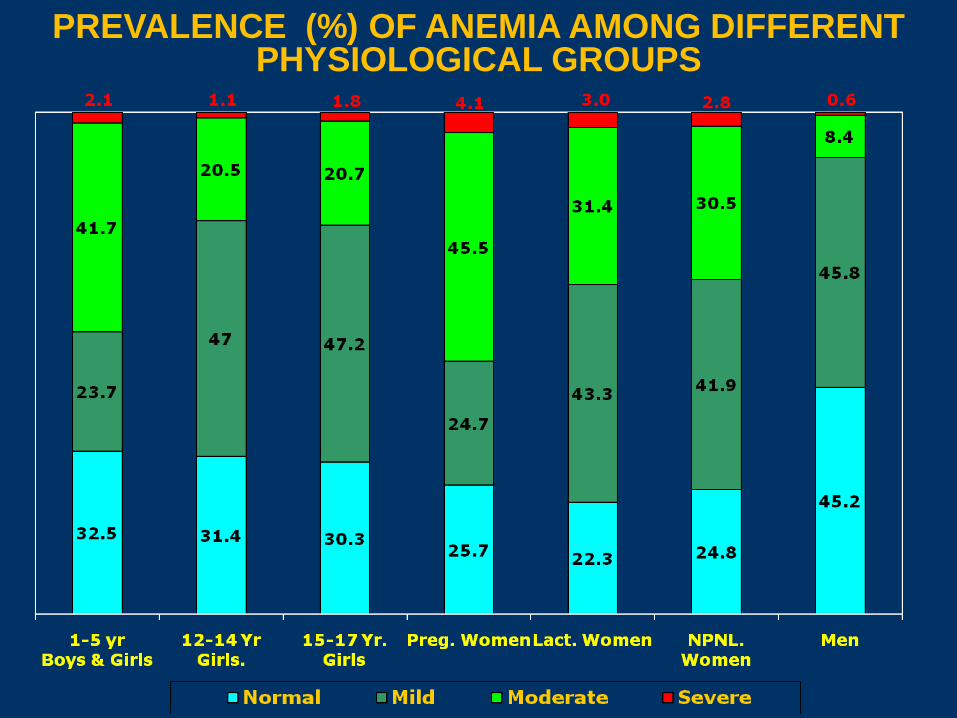
PREVALENCE (%) OF ANEMIA AMONG DIFFERENT PHYSIOLOGICAL GROUPS
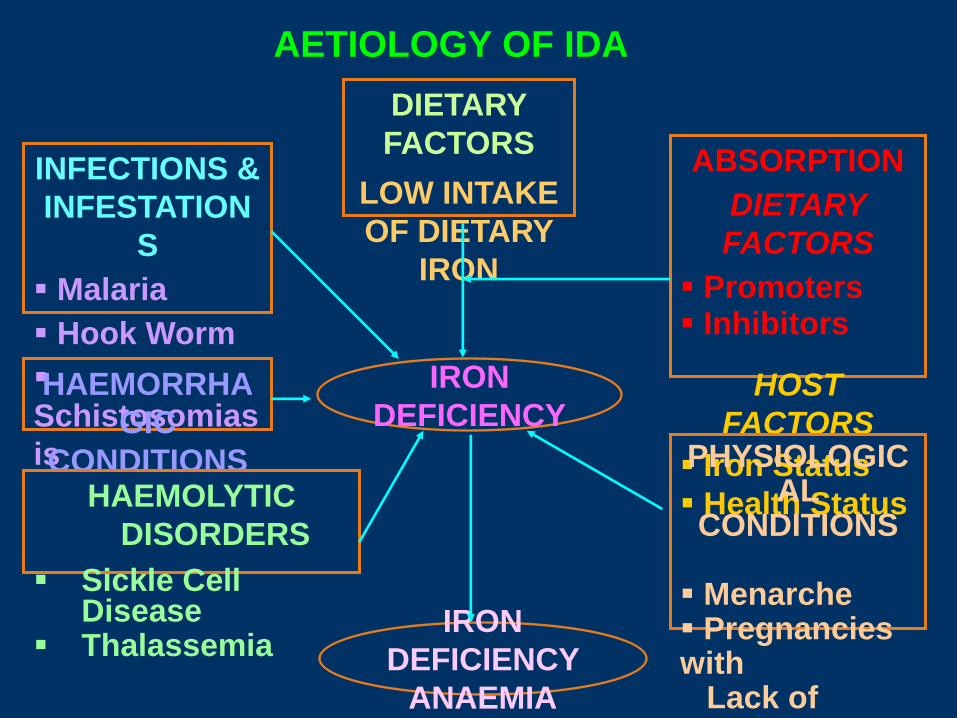
IRON
DEFICIENCY
DIETARY
FACTORS
LOW INTAKE
OF DIETARY
IRON
INFECTIONS &
INFESTATION
S
Malaria
Hook Worm
Schistosomias
is
HAEMORRHA
GIC
CONDITIONS
ABSORPTION
DIETARY
FACTORS
Promoters Inhibitors
HOST
FACTORS
Iron Status
Health Status HAEMOLYTIC
DISORDERS
Sickle Cell Disease
Thalassemia
AETIOLOGY OF IDA
IRON
DEFICIENCY
ANAEMIA
PHYSIOLOGICAL
CONDITIONS Menarche Pregnancies with Lack of adequate interval
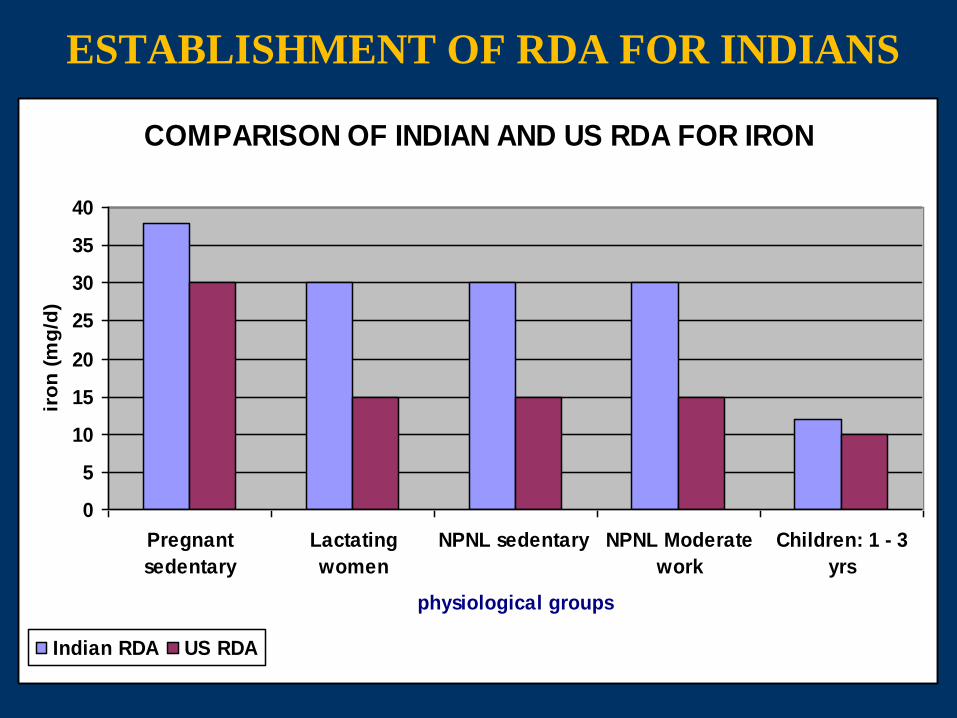
ESTABLISHMENT OF RDA FOR INDIANS
COMPARISON OF INDIAN AND US RDA FOR IRON
0
5
10
15
20
25
30
35
40
Pregnant
sedentary
Lactating
women
NPNL sedentary NPNL Moderate
work
Children: 1 - 3
yrs
physiological groups
iro
n (
mg
/d)
Indian RDA US RDA

ESTABLISHMENT OF RDA FOR INDIANS
COMPARISON OF INDIAN AND US RDA FOR FOLIC ACID
0
50
100
150
200
250
300
350
400
450
Pregnant
sedentary
Lactating
women
NPNL
sedentary
NPNL Moderate
work
Children: 1 - 3
yrs
Physiological groups
Fo
lic a
cid
(m
cg
/d)
Indian RDA US RDA
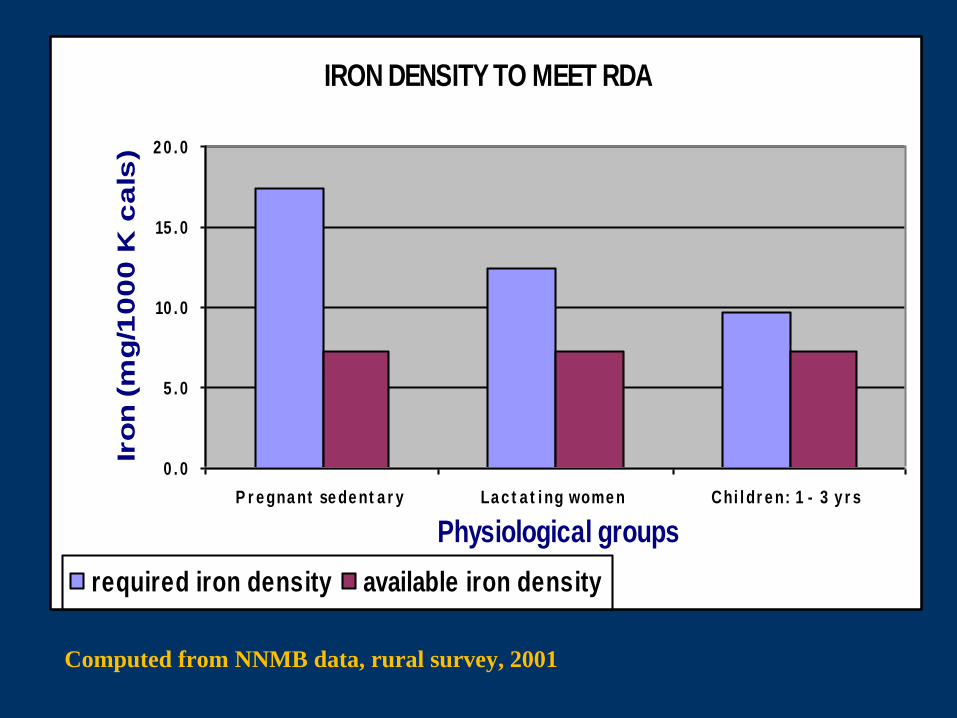
Computed from NNMB data, rural survey, 2001
IRON DENSITY TO MEET RDA
0 . 0
5 . 0
10 . 0
15 . 0
2 0 . 0
P r e gna nt se de nt a r y La c t a t i ng wome n Chi l dr e n: 1 - 3 y r s
Physiological groups
Iro
n (
mg
/10
00
K c
als
)
required iron density available iron density

Computed from NNMB data, rural survey, 2001
OVERNUTRITION:
DIET RELATED
NCDs
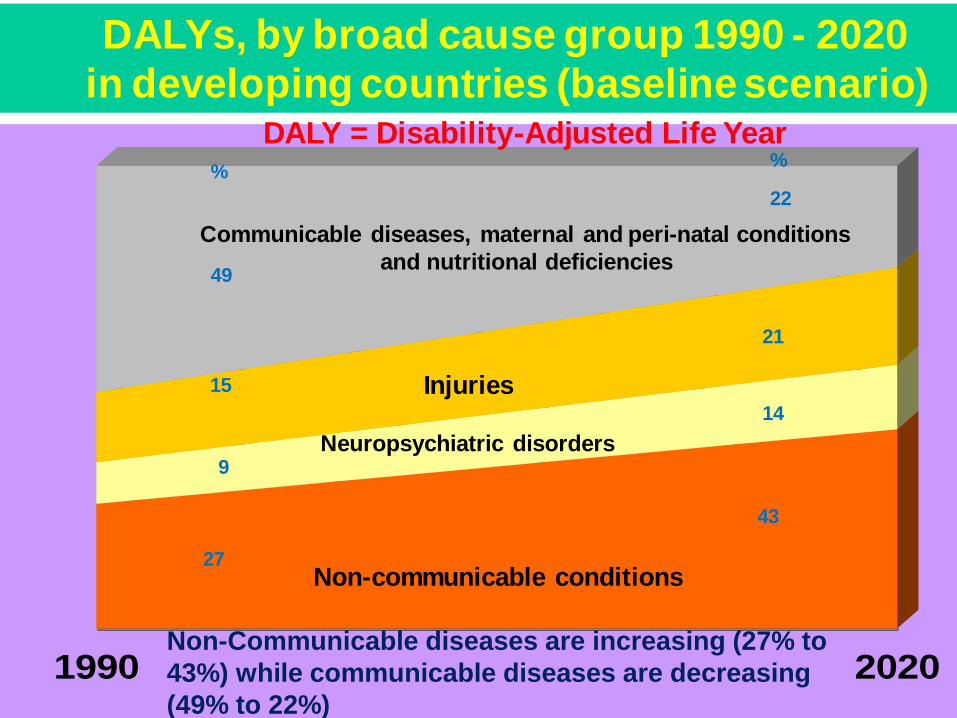
Source: WHO, Evidence, Information and Policy, 2000
1990 2020
DALY = Disability-Adjusted Life Year
Communicable diseases, maternal and peri-natal conditions
and nutritional deficiencies
Non-communicable conditions
Neuropsychiatric disorders
Injuries
43
14
22
21
49
27
15
9
%%
DALYs, by broad cause group 1990 - 2020
in developing countries (baseline scenario)
Non-Communicable diseases are increasing (27% to
43%) while communicable diseases are decreasing
(49% to 22%)
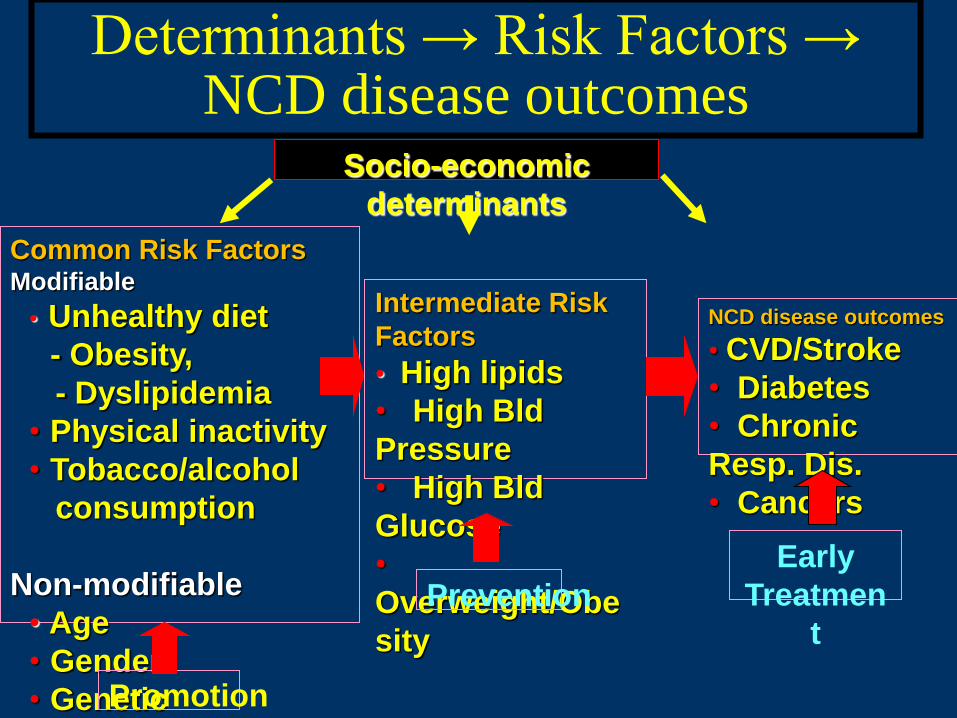
Common Risk Factors Modifiable
• Unhealthy diet
- Obesity,
- Dyslipidemia
• Physical inactivity
• Tobacco/alcohol
consumption
Non-modifiable
• Age
• Gender
• Genetic
Intermediate Risk
Factors
• High lipids
• High Bld
Pressure
• High Bld
Glucose
•
Overweight/Obe
sity
NCD disease outcomes
• CVD/Stroke
• Diabetes
• Chronic
Resp. Dis.
• Cancers
Promotion
Prevention
Early
Treatmen
t
Socio-economic
determinants
Determinants → Risk Factors → NCD disease outcomes

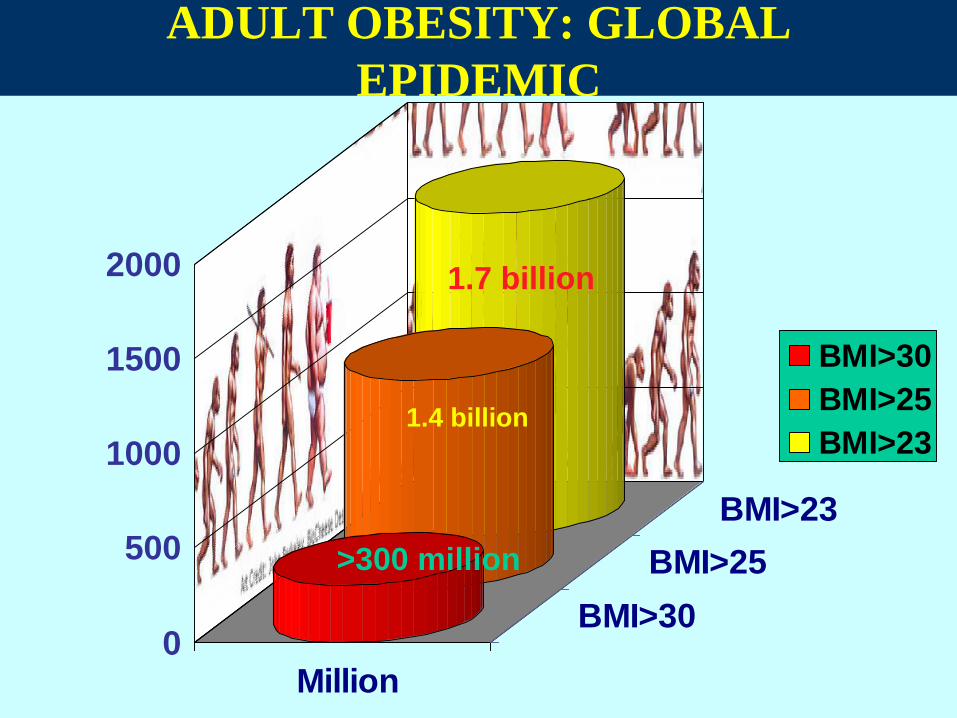
ADULT OBESITY: GLOBAL
EPIDEMIC
0
500
1000
1500
2000
Million
BMI>30
BMI>25
BMI>23
BMI>30
BMI>25
BMI>23
1.7 billion
1.4 billion
>300 million
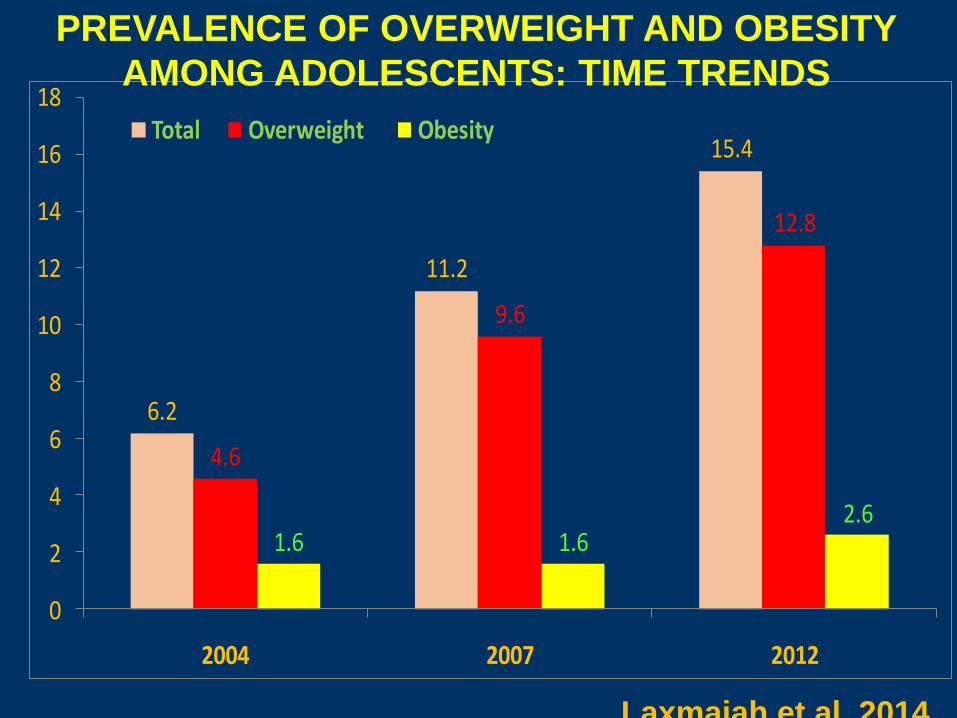
6.2
11.2
15.4
4.6
9.6
12.8
1.6 1.62.6
0
2
4
6
8
10
12
14
16
18
2004 2007 2012
Total Overweight Obesity
PREVALENCE OF OVERWEIGHT AND OBESITY
AMONG ADOLESCENTS: TIME TRENDS
Laxmaiah et al 2014
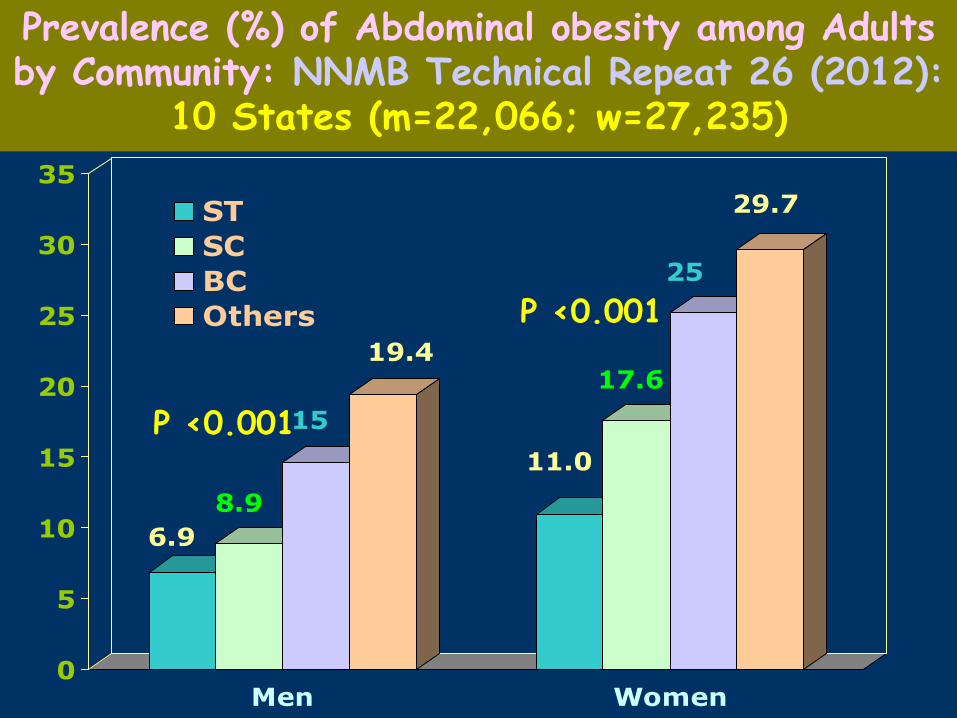
6.9
8.9
15
19.4
11.0
17.6
25
29.7
0
5
10
15
20
25
30
35
Men Women
ST
SC
BC
Others
Prevalence (%) of Abdominal obesity among Adults by Community: NNMB Technical Repeat 26 (2012):
10 States (m=22,066; w=27,235)
P <0.001
P <0.001
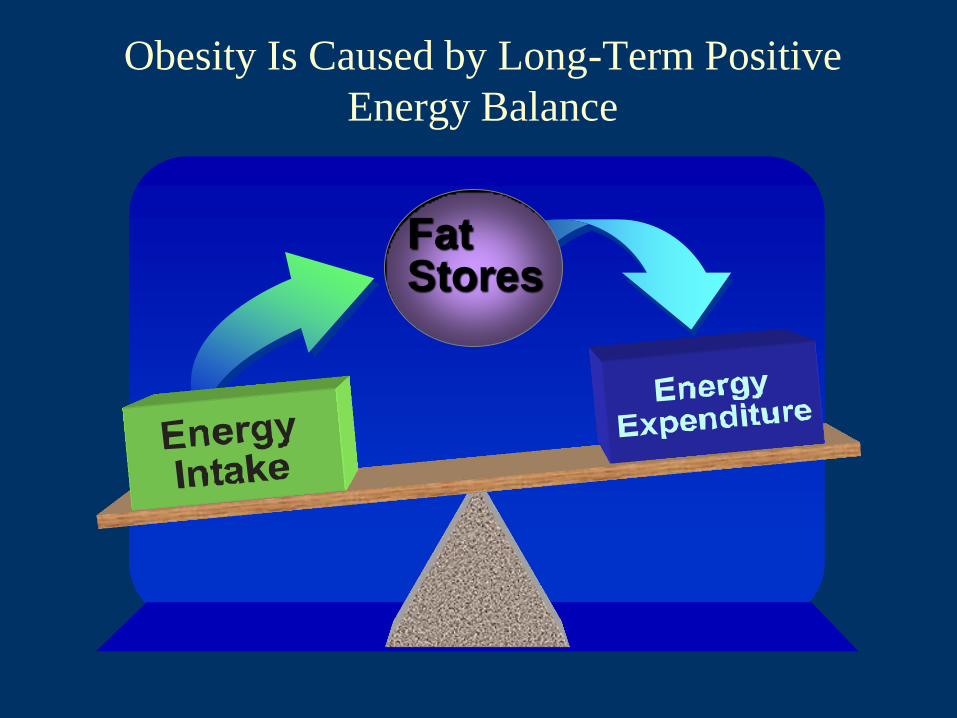
Obesity Is Caused by Long-Term Positive
Energy Balance
Fat Stores
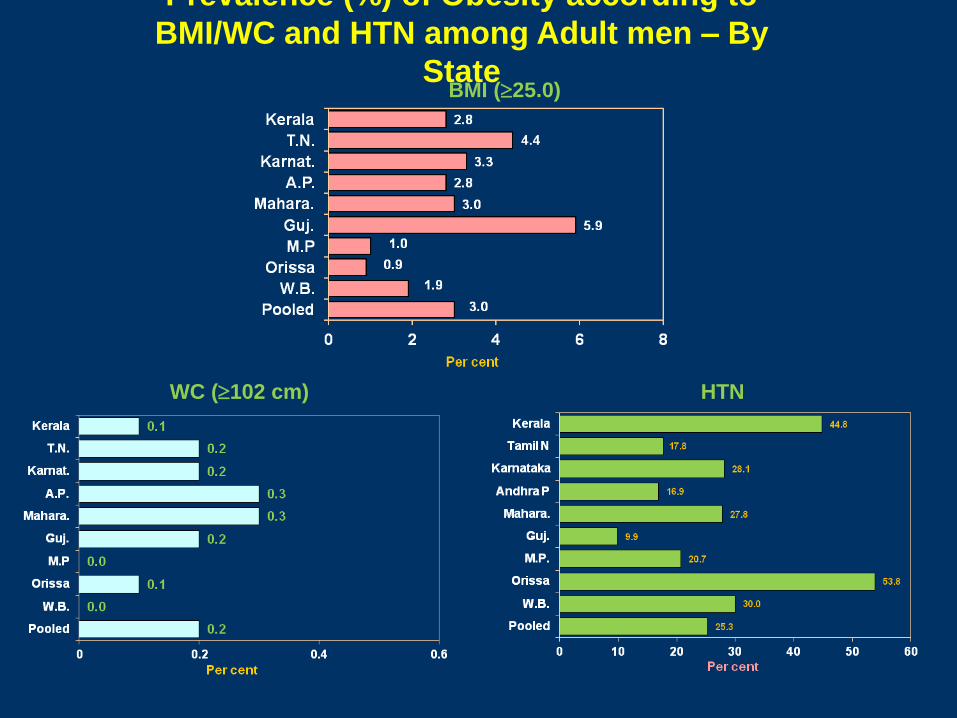
Prevalence (%) of Obesity according to
BMI/WC and HTN among Adult men – By
State BMI (25.0)
WC (102 cm) HTN

Prevalence (%) of Obesity according to BMI/WC and
HTN among Adult women – By State BMI (25.0)
WC (88 cm) HTN
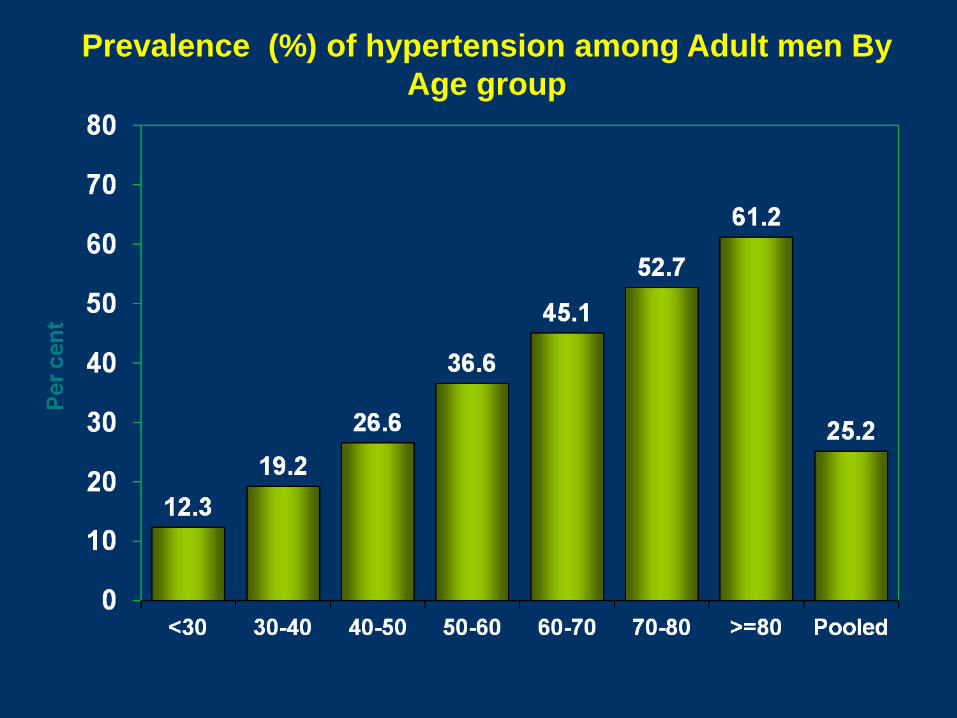
Prevalence (%) of hypertension among Adult men By
Age group
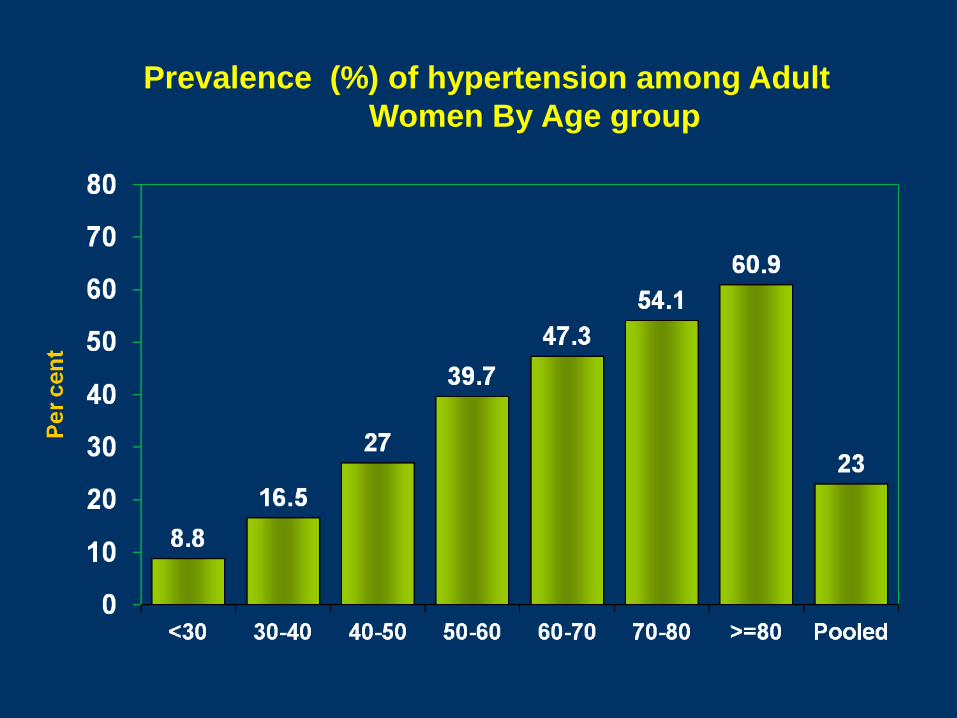
Prevalence (%) of hypertension among Adult
Women By Age group
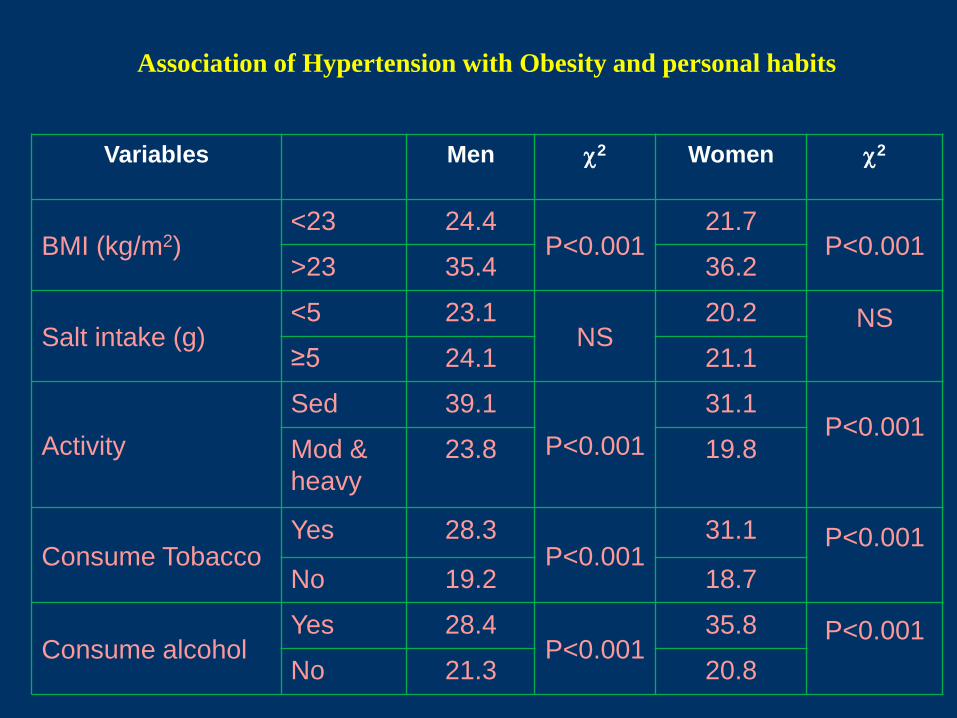
Association of Hypertension with Obesity and personal habits
Variables Men 2 Women 2
BMI (kg/m2) <23 24.4
P<0.001 21.7
P<0.001 >23 35.4 36.2
Salt intake (g) <5 23.1
NS 20.2 NS
≥5 24.1 21.1
Activity
Sed 39.1
P<0.001
31.1 P<0.001
Mod &
heavy
23.8 19.8
Consume Tobacco Yes 28.3
P<0.001 31.1 P<0.001
No 19.2 18.7
Consume alcohol Yes 28.4
P<0.001 35.8 P<0.001
No 21.3 20.8
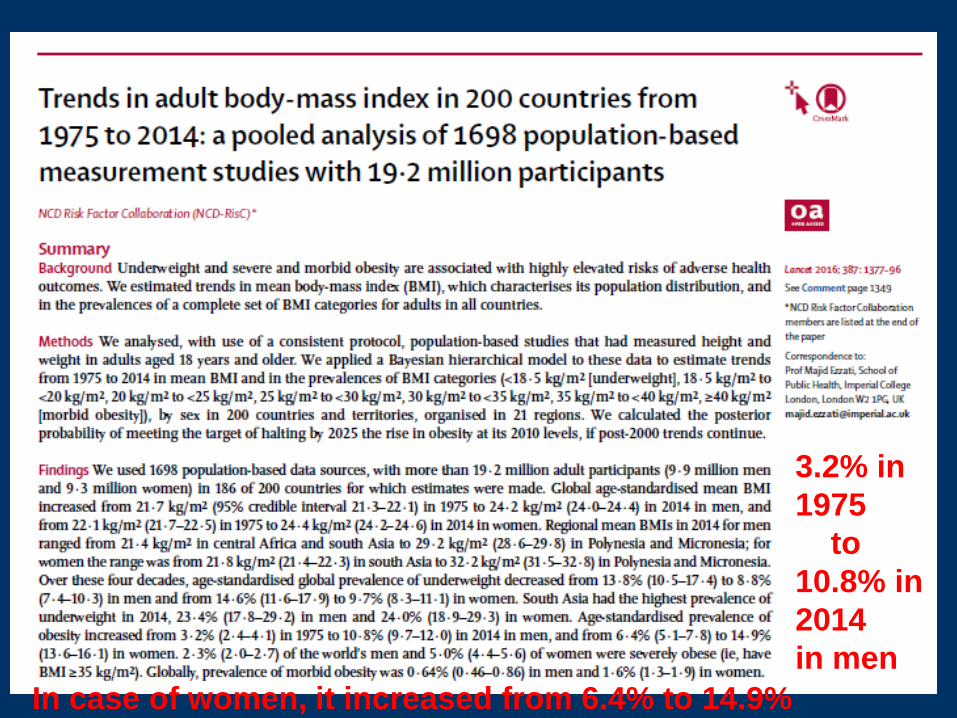
3.2% in
1975
to
10.8% in
2014
in men
In case of women, it increased from 6.4% to 14.9%

Diabetes
Stroke
Heart Disease / Hypertension
Gall Bladder Disease
Osteoarthritis
Sleep Apnoea
Cancers
- Breast/Colon
Consequences of 0verweight/obesity
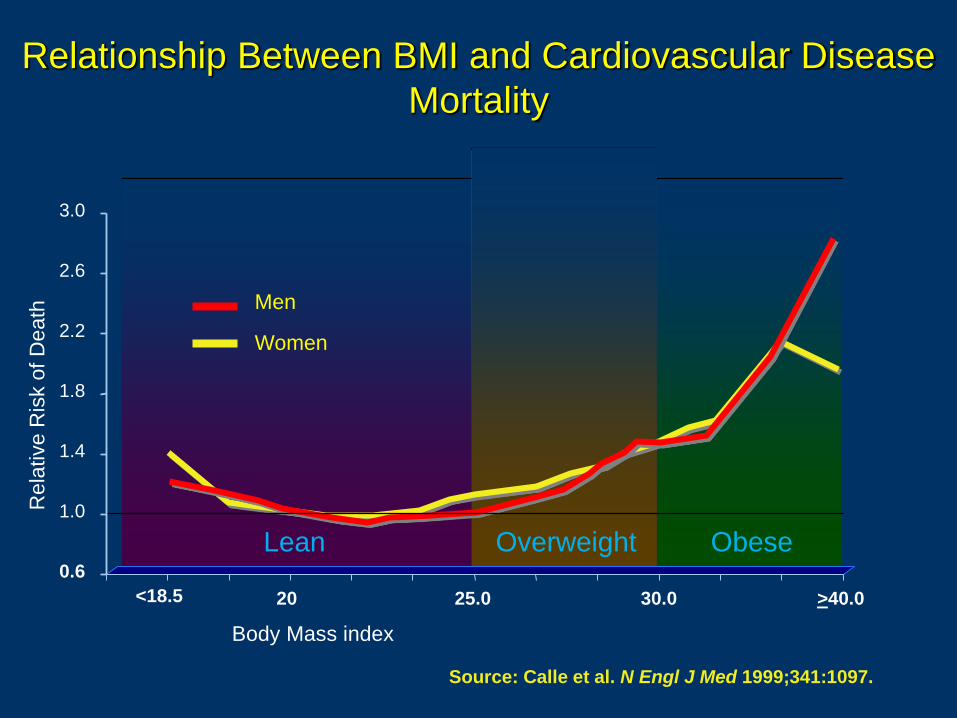
Rela
tive R
isk o
f D
eath
Body Mass index
<18.5
Men
Women
20 25.0 30.0 >40.0
Lean Overweight Obese 0.6
1.0
1.4
1.8
2.2
2.6
3.0
Relationship Between BMI and Cardiovascular Disease
Mortality
Source: Calle et al. N Engl J Med 1999;341:1097.
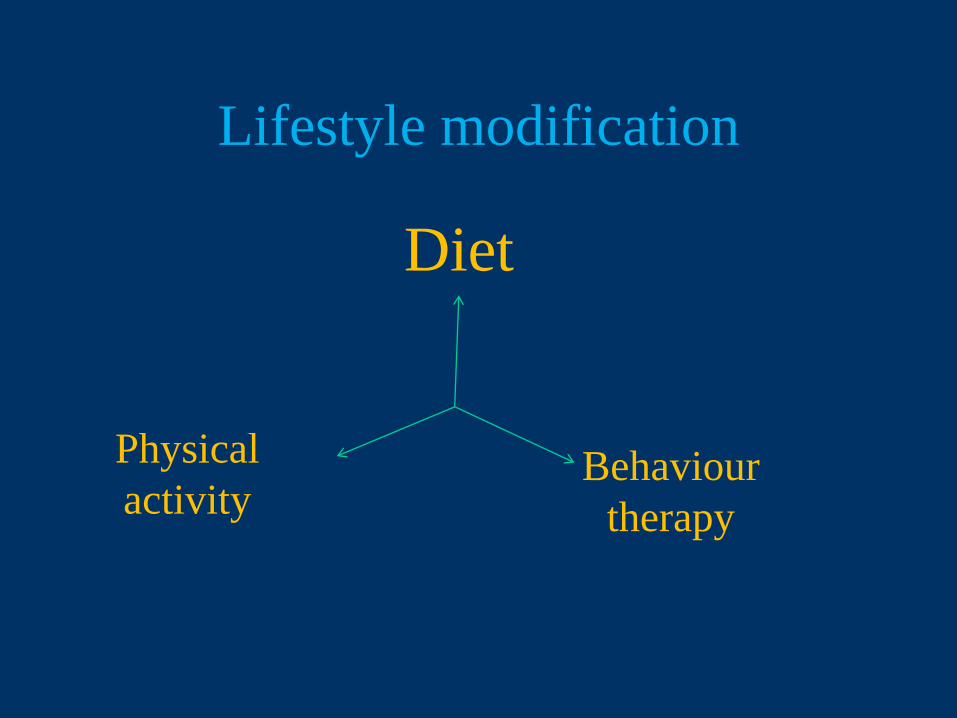
Lifestyle modification
Diet
Physical
activity Behaviour
therapy
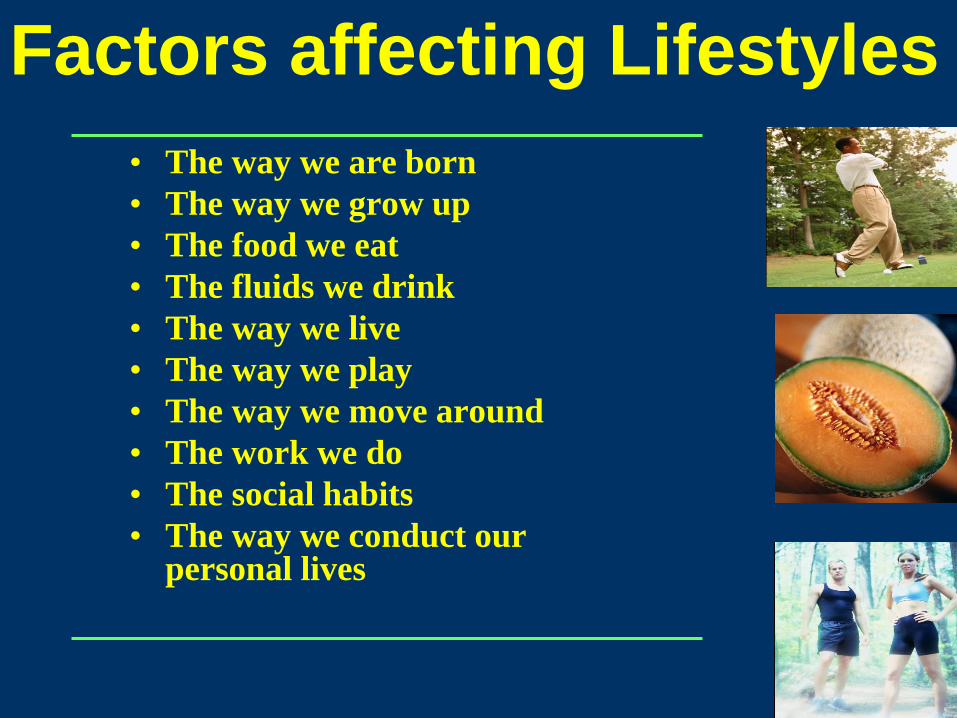
• The way we are born
• The way we grow up
• The food we eat
• The fluids we drink
• The way we live
• The way we play
• The way we move around
• The work we do
• The social habits
• The way we conduct our personal lives
Factors affecting Lifestyles

0
50
100
150
200
250
300
GUJ MAH KARN AP POOLED FOR9 STATES
268
228 221
44
107
200
132
75
16
52
153
79
61
14
36
1996-97 2004-06 2011-12
TIME TRENDS IN THE CONSUMPTION OF MILLETS (g/CU/day)
AMONG RURAL POPULATION
gm
s
There was a significant reduction observed in consumption of
millets among rural and tribal population in India , while it was
increased in urban population over a period of two decades–
NNMB Surveys
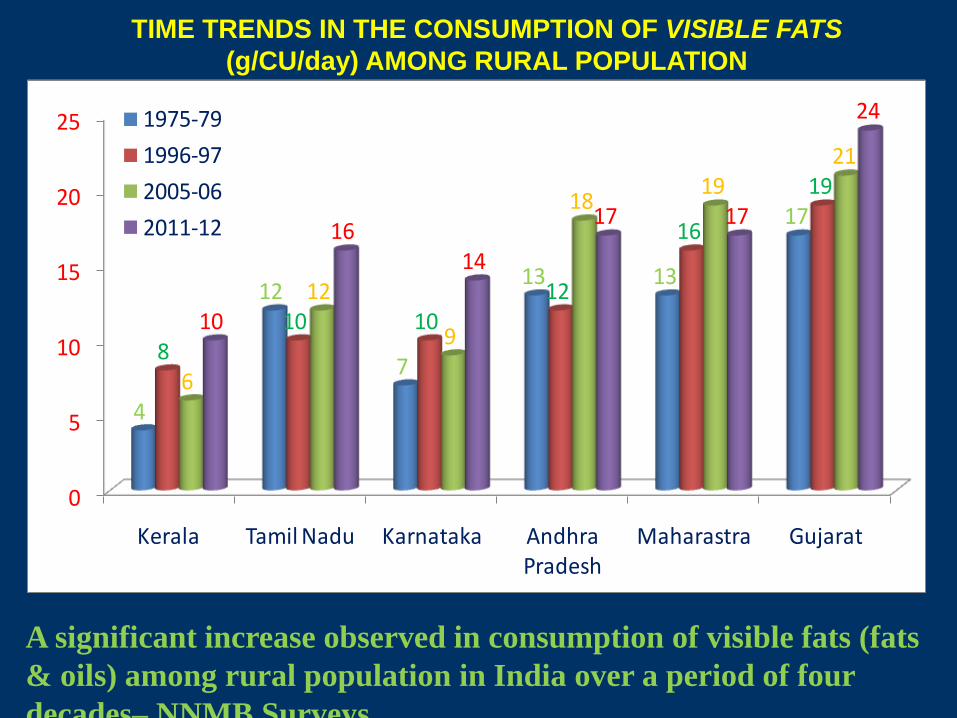
0
5
10
15
20
25
Kerala Tamil Nadu Karnataka Andhra Pradesh
Maharastra Gujarat
4
12
7
13 13
17
810 10
12
16
19
6
12
9
1819
21
10
1614
17 17
241975-79
1996-97
2005-06
2011-12
TIME TRENDS IN THE CONSUMPTION OF VISIBLE FATS
(g/CU/day) AMONG RURAL POPULATION
A significant increase observed in consumption of visible fats (fats
& oils) among rural population in India over a period of four
decades– NNMB Surveys

TEMPTATIONS TOWARDS UNHEALTHY FOODS
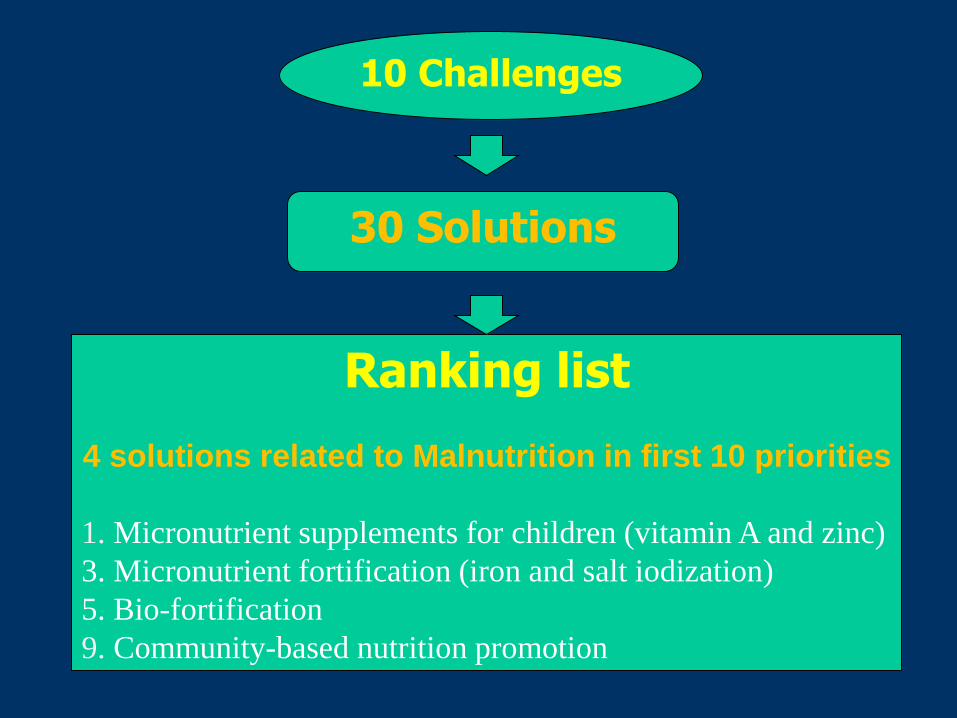
10 Challenges
30 Solutions
Ranking list
4 solutions related to Malnutrition in first 10 priorities
1. Micronutrient supplements for children (vitamin A and zinc)
3. Micronutrient fortification (iron and salt iodization)
5. Bio-fortification
9. Community-based nutrition promotion
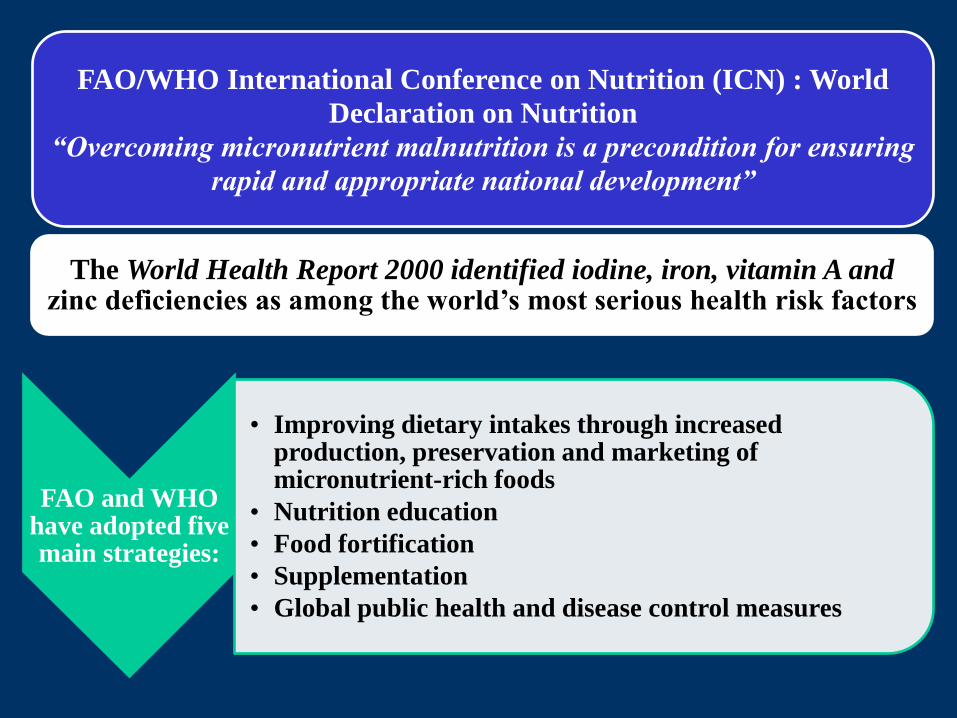
FAO and WHO have adopted five main strategies:
• Improving dietary intakes through increased production, preservation and marketing of micronutrient-rich foods
• Nutrition education
• Food fortification
• Supplementation
• Global public health and disease control measures
FAO/WHO International Conference on Nutrition (ICN) : World
Declaration on Nutrition
“Overcoming micronutrient malnutrition is a precondition for ensuring
rapid and appropriate national development”
The World Health Report 2000 identified iodine, iron, vitamin A and zinc deficiencies as among the world’s most serious health risk factors

FUNCTIONAL FOODS
VITAMINS
MINERALS
ANTIOXIDANTS
PHYTONUTRIENTS
HORMONES
N-3 FATTY ACIDS
FIBER
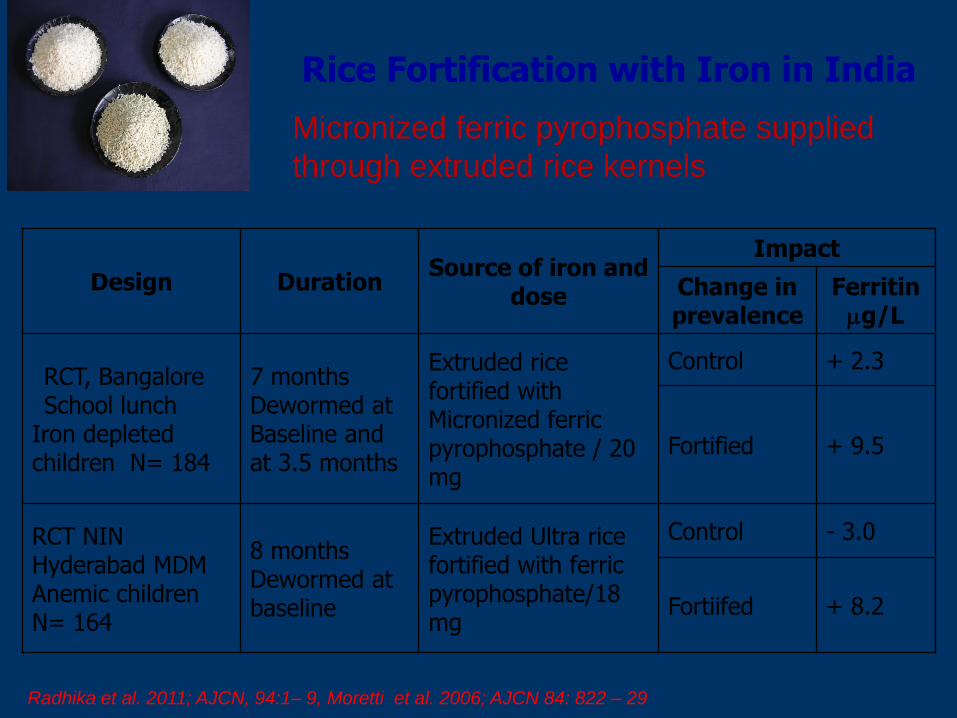
Rice Fortification with Iron in India
Design Duration Source of iron and
dose
Impact
Change in prevalence
Ferritin g/L
RCT, Bangalore School lunch
Iron depleted children N= 184
7 months Dewormed at Baseline and at 3.5 months
Extruded rice fortified with Micronized ferric pyrophosphate / 20 mg
Control + 2.3
Fortified + 9.5
RCT NIN Hyderabad MDM Anemic children N= 164
8 months Dewormed at baseline
Extruded Ultra rice fortified with ferric pyrophosphate/18 mg
Control - 3.0
Fortiifed + 8.2
Radhika et al. 2011; AJCN, 94:1– 9, Moretti et al. 2006; AJCN 84: 822 – 29
Micronized ferric pyrophosphate supplied
through extruded rice kernels
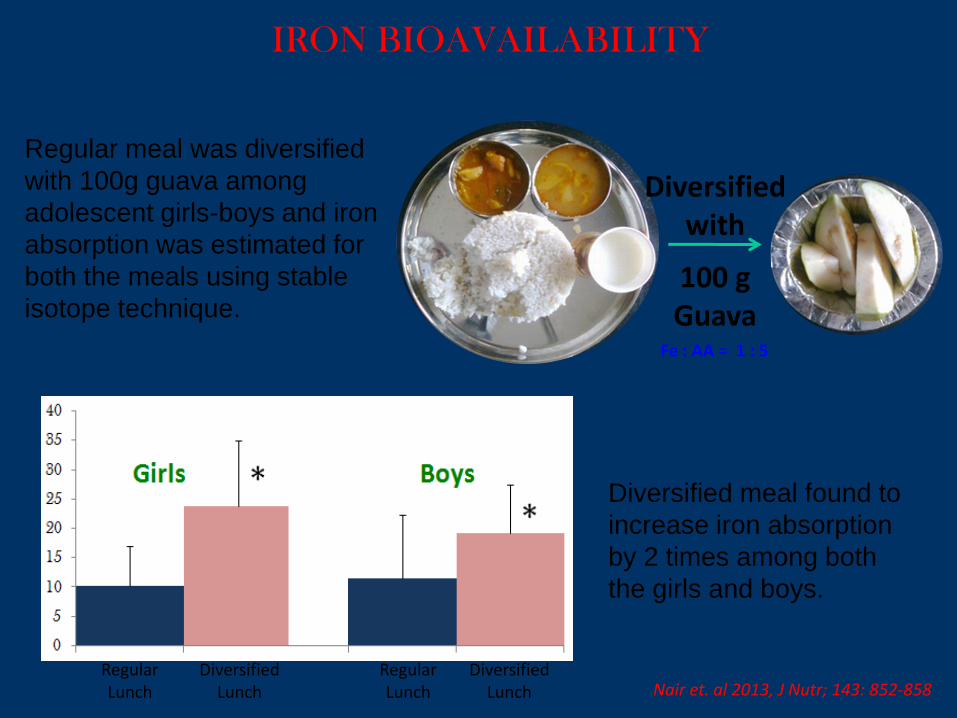
IRON BIOAVAILABILITY
Regular Lunch
Regular Lunch
Diversified Lunch
Diversified Lunch Nair et. al 2013, J Nutr; 143: 852-858
Diversified with
100 g Guava
Fe : AA = 1 : 5
Regular meal was diversified
with 100g guava among
adolescent girls-boys and iron
absorption was estimated for
both the meals using stable
isotope technique.
Diversified meal found to
increase iron absorption
by 2 times among both
the girls and boys.
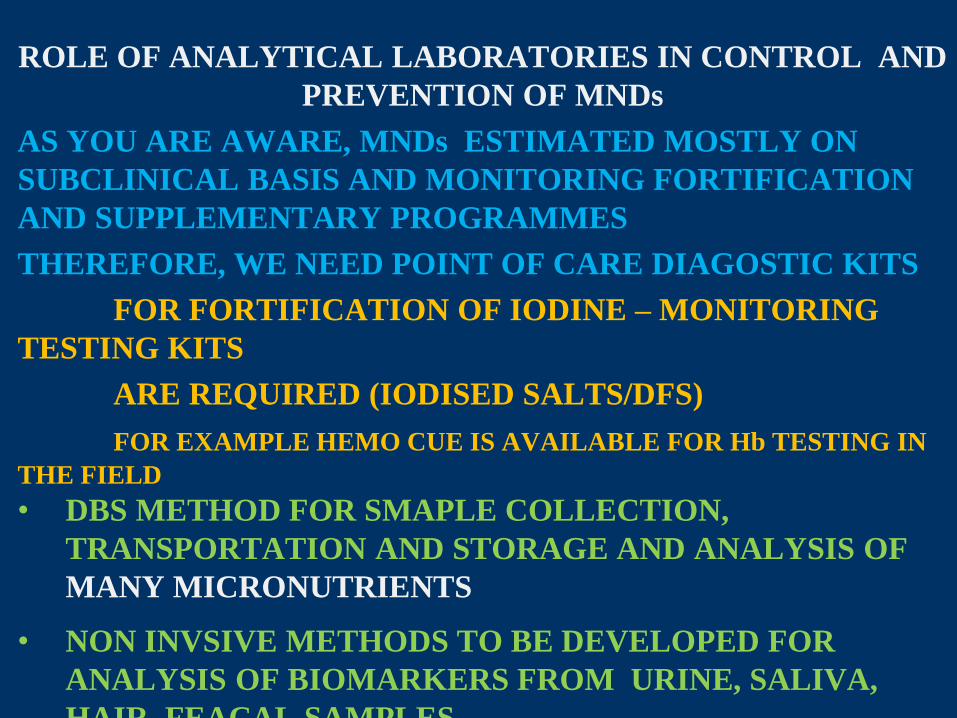
ROLE OF ANALYTICAL LABORATORIES IN CONTROL AND
PREVENTION OF MNDs
AS YOU ARE AWARE, MNDs ESTIMATED MOSTLY ON
SUBCLINICAL BASIS AND MONITORING FORTIFICATION
AND SUPPLEMENTARY PROGRAMMES
THEREFORE, WE NEED POINT OF CARE DIAGOSTIC KITS
FOR FORTIFICATION OF IODINE – MONITORING
TESTING KITS
ARE REQUIRED (IODISED SALTS/DFS)
FOR EXAMPLE HEMO CUE IS AVAILABLE FOR Hb TESTING IN
THE FIELD
• DBS METHOD FOR SMAPLE COLLECTION,
TRANSPORTATION AND STORAGE AND ANALYSIS OF
MANY MICRONUTRIENTS
• NON INVSIVE METHODS TO BE DEVELOPED FOR
ANALYSIS OF BIOMARKERS FROM URINE, SALIVA,
HAIR, FEACAL SAMPLES
• 24 HOUR URINARY IDOINE/SODIUM EXCRETION
METHODS ARE AVAILABLE.
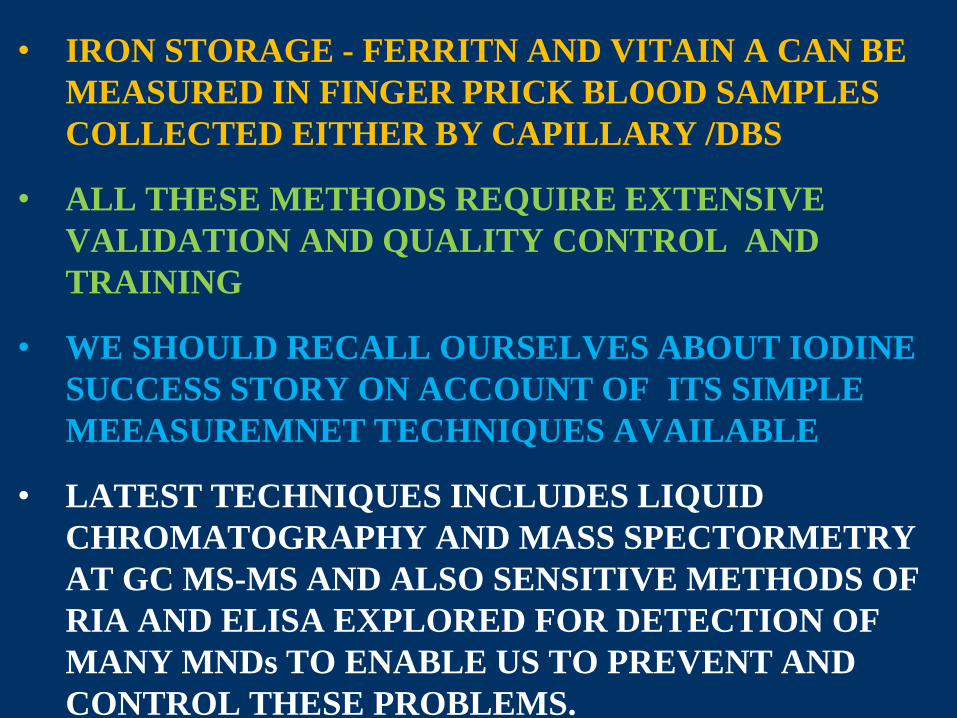
• IRON STORAGE - FERRITN AND VITAIN A CAN BE
MEASURED IN FINGER PRICK BLOOD SAMPLES
COLLECTED EITHER BY CAPILLARY /DBS
• ALL THESE METHODS REQUIRE EXTENSIVE
VALIDATION AND QUALITY CONTROL AND
TRAINING
• WE SHOULD RECALL OURSELVES ABOUT IODINE
SUCCESS STORY ON ACCOUNT OF ITS SIMPLE
MEEASUREMNET TECHNIQUES AVAILABLE
• LATEST TECHNIQUES INCLUDES LIQUID
CHROMATOGRAPHY AND MASS SPECTORMETRY
AT GC MS-MS AND ALSO SENSITIVE METHODS OF
RIA AND ELISA EXPLORED FOR DETECTION OF
MANY MNDs TO ENABLE US TO PREVENT AND
CONTROL THESE PROBLEMS.
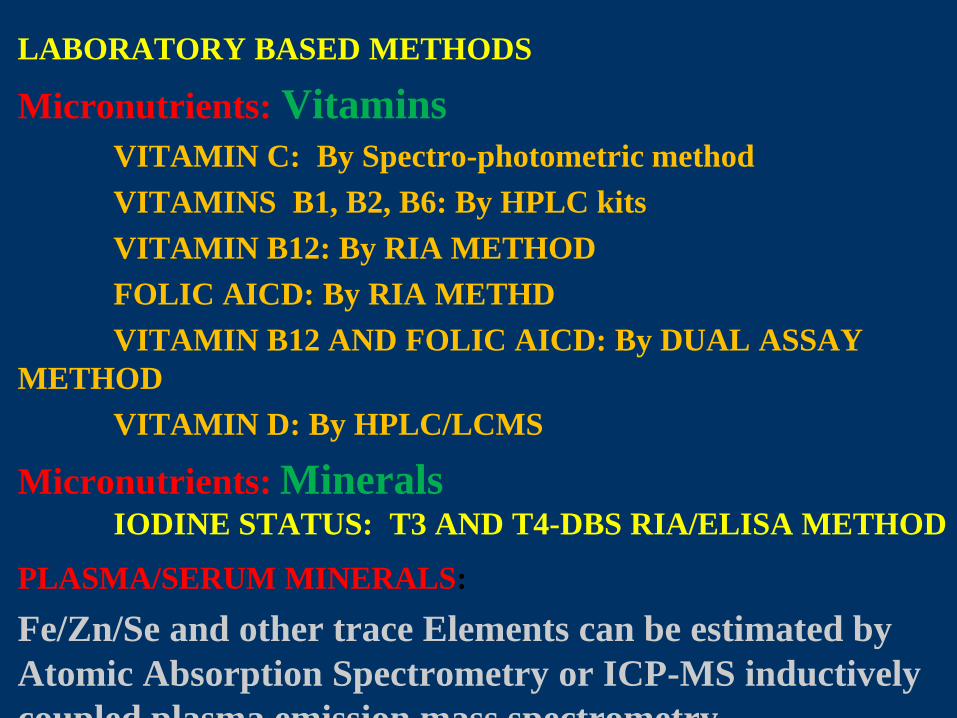
LABORATORY BASED METHODS
Micronutrients: Vitamins
VITAMIN C: By Spectro-photometric method
VITAMINS B1, B2, B6: By HPLC kits
VITAMIN B12: By RIA METHOD
FOLIC AICD: By RIA METHD
VITAMIN B12 AND FOLIC AICD: By DUAL ASSAY
METHOD
VITAMIN D: By HPLC/LCMS
Micronutrients: Minerals IODINE STATUS: T3 AND T4-DBS RIA/ELISA METHOD
PLASMA/SERUM MINERALS:
Fe/Zn/Se and other trace Elements can be estimated by
Atomic Absorption Spectrometry or ICP-MS inductively
coupled plasma emission mass spectrometry.
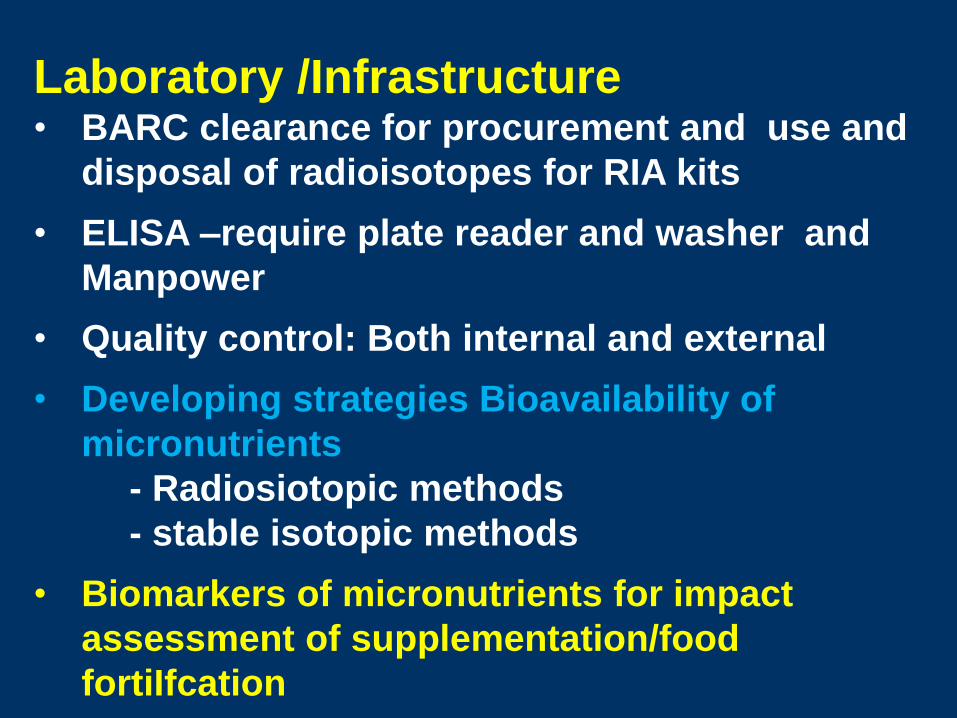
Laboratory /Infrastructure • BARC clearance for procurement and use and
disposal of radioisotopes for RIA kits
• ELISA –require plate reader and washer and
Manpower
• Quality control: Both internal and external
• Developing strategies Bioavailability of
micronutrients
- Radiosiotopic methods
- stable isotopic methods
• Biomarkers of micronutrients for impact
assessment of supplementation/food
fortiIfcation
• Difference between end line and baseline
biomarkers such as Hb, ferritin.
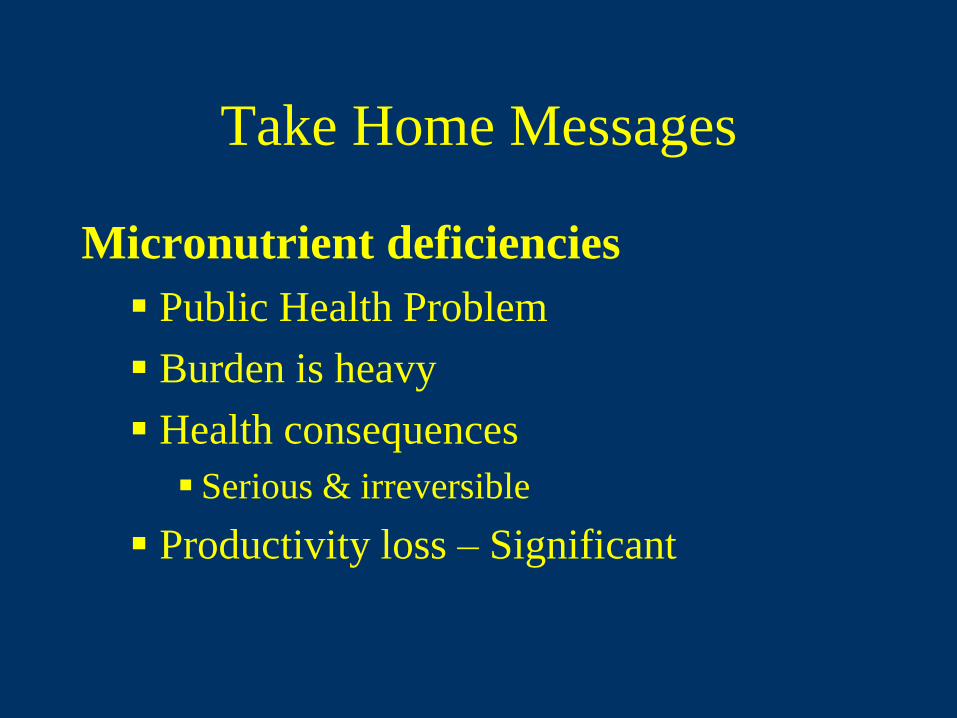
Take Home Messages
Micronutrient deficiencies
Public Health Problem
Burden is heavy
Health consequences
Serious & irreversible
Productivity loss – Significant

• Evidence-based strategies are available to control
multiple micronutrient deficiencies.
• For achieving micronutrient security, optimum mix
of supplementation, dietary diversification,
fortification, bio-fortification, and health services
should be defined depending on local context.
• Ensure consumption of fortified food in adequate amounts by target population
• Multi-stakeholders strategies -Government and food industry, laboratory/diagnostics partnership could eliminate the MND problem in India.
Conclusions