Embed Size (px)
Citation preview

ISIJ International, Vol. 35 (1 995). No, 11, pp. 1415-1421
Assessmentof the Mobilities ot Cr. Fe and Ni in bcc Cr-Fe-NiAlloYS
Bj6rn JONSSONDepartment of Materials Science and Engineering. Division of Physical Metallurgy. Royal Institute of Technology. S-1 OO44Stockholm, Sweden.E-mail: [email protected]
(Received on March2. l995, accepted in final form on May26. 1995)
Experimental data on the diffusional mobilities of Cr, Fe and Ni in bcc Cr-Fe-Ni alloys are assessed bymeansof a modelwhich takes the effect of a ferromagnetic transition in multicomponent alloys into account.Comparisonbetween experimental data and calculations are madeand a satisfactory agreement is found,Aset of parameters describing the variations of the mobilities with temperature and composition are given.
KEYWORDS:Cr; Fe; Ni; diffusion coefficients; mobilities; assessment.
1. Introduction
The diffusivities of Cr, Fe and Ni determines therates of manyimportant phenomenasuch as, diffusional
creep, and phase transformations in a wide range oftechnologically important materials, e.g. stainless steels.
Consequently, it is important to accurately know thetransport properties in this type of materials, if onewant to be able to analyse/predict their transformationbehaviours.
Recently, a software package for simulation of dif-
fusional phasetransformations in multicomponent alloyscalled Dictral) was developed. Dictra relies on the so-called local equilibrium hypothesis. In order to simulatediffusional phase transformations adopting local equi-librium you need: l) thermodynamic data and 2) dif-
fusional data. Thermodynamicdata for manyalloy sys-tems are today readily available from the SGTE2)solu-tion database of the Thermo-Calc databank system.3)
Unfortunately, in general, diffusional data has not beensystematically assessed yet, especially not for multi-
componentalloy systems. This work is part of an effort
to remedythis situation.
In most phases, the temperature dependencyof theexperimental diffusion data maybe properly accountedfor by an ordinary Arrhenius behaviour. However, there
are exceptions. For instance, it has been known for-
a long time that ferromagnetic ordering mayhave asignificant influence on the value of the diffusion coef-ficient. This topic wasrecently addressed by Jdnsson4'5).
a model, which will be adopted here, waspresented.
2. Modelling of Diffusivities
Onemay recognize different types of expermjentaldata concerning diffusion, e.g, tracer diffusion data andchemical diffusion data. Tracer diffusion data are more
easily analysed than the chemical diffusion data. This is
becausethere is a very simple relation betweenthe tracerdiffusion coefficient D~for an element Band its atomicmobility coefficient MBif one neglects correlation fac-
tors. Assuminga mono-vacancymechanism,the follow-ing relations holds6)
D~=RTMB.... ..........(1)
The small fraction of thermal vacancies on the sub-stitutional sublattice is not explicitly present, but their
contribution is included in the mobility coefficient. Ris
the gas constant and T is the temperature.The chemical diffusivity is given by a morecomplex
relation, where the concentration of one element hasbeenchosen to be dependenton the others. Thechemical
or reduced diffusivity is expressed as6)
:=1 - llDkj ~(8Lk xk)xM
api ap
axj ax .(2)
wheren, kandj are the dependent, the diffusing and thegradient element, respectively. 8ik is the Kronecker delta,i.e. ~ik = I if i=k and 6ik =Ootherwise. xk is the ordinarymole fraction of element k. It is the derivatives of theordinary chemical potential eklilaxj that makechemicaldiffusion data less attractive than the tracer diffusiondata, becausein order to makeuse of the former wealso
need to have access to the thermodynamicproperties ofthe alloy under consideration while the latter can beanalysed without such knowledge. As a consequence,the MBdetermined from chemical diffusion data dependscritically on the accuracy of the thermodynamicdescrip-tion used. In this work, wehaveemployeda tool capableof assessing MBfrom different types of experimentaldata. It is called Parrot7) and it has recently been im-plemented into the Dictra software4'8). a diffusivity is
typically calculated from Eq, (1) or (2) and is sub-
141 5 C 1995 ISIJ

ISIJ International, Vol. 35 (1995) No. 11
sequently comparedto the experimental value. The dif-
ference between calculated and experimental values areused in a least square type of method which auto-matically finds the optimal set of model parameters.
3. Modelling of the Atomic Mobility
Recently, Jbnsson8) modified AnderssonandAgren's6)
model for the temperature, pressure and compositiondependencyof the atomic mobility in a multicomponentsolution phase. Fromabsolute-reaction rate theory argu-ments the mobility coefficient for an element BMBWasdivided into a frequency factor M~and an activationenthalpy QB, i,e.
RQ~~~~~; RIT~gQMB=M~exp ... ....
...(3)
where ~gQis a factor taking into account the effect ofthe ferromagnetic transition.5) ~gQis a function of thealloy composition. The frequency factor is given by
M~=exp(6,B). ......
..........(4)
Both OBand QBWill in general dependupon the com-position, the temperature, and the pressure. In the spirit
of the Calphadapproach,9) the composition dependencyis represented with a linear combination of the values ateach endpoint of the composition space and a Redlich-Kister expansion, viz.
m~. ' ~~xixJ ~rc~j(x, x )cB= xic~ +i j>i r=0
+~~~ s s ij'k (s=i,j,k) ..,...(5)~l j k vijk c~x'x xi j>ik>j
where cB represents a composition dependentproperty,i.e. (9B or QB, and the parameters v,~jk are given by
vijk =x.+(1 -xi-xj~xk)/3.......
..........(6)
Each individual c parameter on the R.H.S of Eq. (5)
maybe expressed as a polynomial in temperature andpressure, if necessary. Limiting the binary interactions
to secondorder (m= 1), weget, for our ternary CrFe-Nisystem:
cB=xcrc~• +xF*c~e+xNiep~i
+xcrxFe[oc~r.Fe + (xcr ~xFe) I c~r.Fe]
+xcrxN,[occ. Ni + (xc.~xN,) c '']
. B' .I CB'Nl
+XFeXNi[o c~e,Ni + (xFe ~xN~)I c~e,Ni]
+xc,xFexNi[xc c.c~r.Fe,Ni +xF.Fec~r,Fe,Ni Ni c. Fe N~+xNi cB' ' J.(7)
4. Experimental Data
Experimental data on diffusion coefficients are quiteplentiful for the binary Cr-Fe system. Whereas, for thebinary systems Cr-Ni and Fe-Ni data are very sparse,and so are data for ternary diffusion in the O~Fe-Nisystem. Thedifferent pieces of experimental informationused in the present assessmentare briefly listed in TablesI~5. Thepredominant experimental technique for deter-
mining tracer diffusion coefficients used by the different
Table 1.
Reference
lO)
l l)
l2)
l3)
l4)
l5)
16)
17)
Table 2.
Experimental Cr self diffusion data.
Temperature range('C)
95(~1 250
l OO0-1250
1080-1 320
l 058-1 393
l 200-1 600
1200-1 550
l OO0-1900
l 100-1 820
Experimental Fe tracer diffusion data in Cr.
Reference
Table 3.
Reference
l6)
Table 4.
Reference
20)
Table 5.
Reference
18)
l9)
21)
22)
23)
24)
25)
26)
27)
28)
29)
3O)
31)
32)
33)
34)
35)
36)
18)
l9)
Temperature range('C)
9831413980-1 230
Experimental diffusion data in binary CrFe al-
loys.
Measuredquantity
D~*
Compositionmasso/.
20 Ni
Temperature
range ('C)
l 16()-1 400
Experimental diffusion data in binary Fe-Ni al-
loys.
Measuredquantity
D*Fc
Compositionmasso/*
[1.62, 2, 14] Ni
Temperature
range ('C)
747-820
Experimental diffusion data in binary Cr-Fe al-
loys.
Measuredquantity
* *Dcr' DFO*DFC
FcDcrCr
D*CrFcDcrCrFeDcrCr
*DFOFeDCrCr
* n*Dcr' UFeD*FeD*Pc
* *DFe' DCr*Dcr
FcDcrCr
D*Pe*DFe
DFeCrCr
DFeCrCr
Composition
mass"/o
17 Cr[2(~90] Cr[0-30] Cr[2-19] Cr[0-25] Cr
[1850] Cr[6.8-8.9] Cr
[0-22] Cr[3.C~14.6] Cr[3.0-7.8] Cr[0-1 1.8] Cr
[27, 51, 85] Cr[20-lOO] Cr[30-lOO] Cr[920] Cr
[21-8l] Cr[1220] Cr[ll~28] Cr
Temperature
range ('C)
861-1 422980-1 230675-1 485797l 402642-869
180
650-820823, 1415-1 440
65(~82065082066(~890
950-1 275
1250757-8259571250
l 200-1 300800=1OOO
authors, is the so-called residual activity method ofGruzin: Onedeposits a thin layer containing a radioac-tive tracer element on the samplesurface. After diffusion
anneals, one removes layers of material, parallel with
C1995 ISIJ 141 6

ISIJ International, Vol. 35 (1995), No. 11
Table 6. Experimental diffusion data in binary Cr-FeNialloys.
-9
T/ [K]
2200 1800 1600 1400
Reference
1200Measured Composition Temperaturequantity range ('C)masso/*
37)
38)
39)
40)
D* [14,1, 20.l] Cr IOOOl300NiDP* F* Variousc*c*, DNiNi 1100DF* P* 29Cr+4Nic*c*, DNiNi I 13(~1 300
* 25.3Cr +4.6Ni 60(~1 OOODc*
the surface. After removing each layer, onemeasurestheresidual activity that is emitted from the sample surface.
Using this procedure, one obtains activity (concentra-tion) vs. distance profiles which are subsequently usedfor fitting an exponential solution of the diffusion equa-tion in order to establish a diffusion coefficient value.Chemical diffusion data are in general determined bythe so-called BoltzmannMatanoanalysis: Concentra-tion profiles are measuredfrom diffusion couples. Theseprofiles are subsequently fit to the equations of theBoltzmann-Matanoanalysis in order to obtain diffusioncoefficient data. For more information on experimentaltechpiques see somegeneral text book on diffusion, e.g.Ref. 41).
5. Assessmentand Results
Someof the parameters describing the mobilities hasalready been assessed by J6nsson,s) That is the param-eters for the mobilities in Fe. Wewill adopt his valuesin this work. As was pointed out by J6nsson: due toinferior sectioning techniques old experimental data of-
ten showinfiuence of grain boundary diffusion for tem-peratures below roughly I OOOK. Wewill keep this in
mind during the assessmentand accept larger deviationsbetween the experimental data and the calculations at10w temperatures. It should also be kept in mind thatoften during the assessmentprocedure one finds out thatdifferent pieces of experimental data are not mutuallyconsistent. Thus, one has to accept that one cannot atthe sametime fit all sets of data.
Acomplication with the Calphadmethodused for as-sessing the mobility data, is that one may need pa-rameters also for hypothetical states. In this case, thatis the mobilities in bcc Ni. In general, for such a case,one would like to try to extrapolate data from Ni-richbcc alloys. Unfortunately, the stability region of bcc doesnot extend very far towards Ni. Moreover, data are verysparse awayfrom the Cr-Fe binary side. Consequently,
we are forced to makesome assumption about themobilities in bcc Ni. It was assumedthat they are the
sameas those in paramagnetic Fe. Dueto lack of datasomefurther assumption weremade: l) Thebinary inter-actions in Fe-Ni wereassumedequal for all three species.2) Thebinary interactions in CrNi were assumedequalfor all three species. 3) The mobilities of Fe and Niin Cr were assumedequal and furthermore, in the spirit
of the findings of Fridberg et al.,42) we assumedtheactivation energy to be the sameas that for Cr selfdiffusion.
In the usual wayof the Calphadtechnique, Iower order
~~ -12co
c\lE
- -15*,,~O~O)O -18
-21
~A Askill&Tomlin 1965~] Paxton&Gondolf1959~ Hagel 1962
~~~+~
Askill i971v Mundyet al. 1976+ Ivanov 1962x Gruzin et al. 1959o Bogdanov1960
X +~
. ~~
Fig, l
40 45 50 55 60 65 70 75 80 85 90104 /T •
[K]
Tracer diffusion of Cr in Cr. Symbolsare experimentaldata due to various authors. Solid line is from ourassessment.
systems are, if data is sufficient, assessed separately andthe parameters thus determined are later kept fixed whenadvancing to higher order systems. Consequently, theassessment was divided into several different steps: l)
the self-diffusion coefficient of Cr was determined. Theparameters for this unary system was thereafter con-sidered fixed. 2) the mobilities in the binary Cr-Fe, Cr-Ni and FeNi systems were assessed separately and weresubsequently kept fixed. 3) the rest of the data, i.e. datafor the ternary CrFe-Ni, was used to assess the re-maining interaction parameters. Additionally, due to thefact that the present modelling allows for quite a fewmodel parameters, and that the available experimentaldata is not sufficient to determine them all with a highdegree of confidence, it wasquite arbitrarily decided to
use interaction parameters for the Q's only. It can bementioned that using the interactions for the (9's worksas well. However, data is not sufficient for using themboth at the sametime. All resulting parameters are givenin the appendix. A11 thermodynamic data were takenfrom the SGTEsolution database.2)
If nothing else is stated solid lines are our calcula-tions and symbols are expcrimental data due to variousauthors. A fit between calculations and experimentswithin a factor of 2will be considered as reasonable.
Cr Self Diffusion ~
There is quite a large amount of data on Cr selfdiffusion. The scatter of the data is very large below1600K, up to about 3orders of magnitude, see Fig. l.
Except for temperatures very close to the melting pointof Cr, the two most recent investigations showreason-able agreement over the whole temperature range ex-amined. Most of these data points are for single crystalsamples (filled symbols) in order to avoid effects of grainboundary diffusion, which appears to have affccted theresults of most of the other investigations. For this rea-son, it was decided to trust only the data of Askilll6)
and Mundyet al.17) in the present assessment. The cal-
culations and the selected experimental data are in fair
agreement.
141 7 C 1995 ISIJ

ISIJ International, Vol. 35 (1995), No. 11
-121800 1600
T/ [K]
1400 1200 11oo
-14
(,)
c\] -16E_,,
a) 18LL-aa)~~ 20
~1[1]~
Cll AA
~Shinyaev 1965~] Wolfe&Paxton1964
[1]
-225 6 7 8 109
104 /T •[K]
Fig. 2. Fe tracer diffusion in 'pure' Cr. Symbols are experi-
mental data due to Wolfe and Paxtonl8) (squares) andShinyayev*9) (triangles). sohd hne is from our assess-
ment.
Diffusion in Cr-Fe AlloysDiffusion in the Fe-Cr system has been the topic of
manyreports, Not surprisingly, most investigators hasbeen interested in diffusion in Fe-rich alloys, for various
reasons. Fortunately, somehave examinedalso Cr-basealloys, so that the entire composition range has been
spanned.Not manydata concerns D~* in pure Cr, see Fig. 2,
wherewecompareour calculations with the experimentaldata of Wolfe and Paxton,18) and Shinyayev. 19) Wenotethat both sets of data indicate a lower activation energythan that assumedin this assessment, i.e. the sameasthat for Cr self diffusion. The experimental activationenergies are more in accordance with those for Cr self
diffusion as derived from data from the sameperiod oftime, i.e. the early 1960's, see Fig, I .
As was discussedin the previous section, this is probably due to grain
boundary diffusion effects.
Dueto the large amountof experimental data pointsfor the Fe-Cr system, and the limited space available forthis paper, explicit comparison betweenexperiments andcalculations are only madefor a sample of experimentaldata, see Figs. 3-8. In Fig. 3, we compare calculatedD~~c, data with experiments from Braun and Feller-
Kniepmeier23) (notice the technique of shifting the dif-
ferent curves with the amount S in order to makeit
possible to plot several curves in the samediagram).
Wenotice non-linear curves due to the effect of the
ferromagnetic transition. The fit to these data are good.In Fig. 4, we trace the composition dependencyof theD~~c* at somedifferent temperatures. Wetypically find
a reasonable fit to the experiments at high temperatures,at lower ones there is often a larger descrepancy, as for
the Heumannand B6hmer26)823'C-data shown. Theirdata does not even extrapolate to the accepted value at
the pure Fe side. Onemaysuspect that their data areinfluenced by grain boundary diffusion. In connectionto this figure, it can be mentioned that the Curie tem-perature is 770'C at the pure iron side and that it haslowered to about 680'C when it hits the bcc/(bcc+(T)
C 1995 ISIJ
-8
(D _10+
(/) -12c\I
E_
~ 14~~6C~
_16~5~
o-18
1200 11ooT/ [K]
1000 950 900 850
OoloCr
5010Cr
1OoloCr
15"loCr
20010Cr
25010Cr
S=0
S=5S=4S=3s=2S=1
Fig.
8.0 8.5 9.0 9.5 10.0 10.5 11.0 11.5 12.0
104 /T .[K]
3. Chemical diffusion coefficient in six different FehCralldys. Symbols are experimental data due to Braunand Feller-Kniepmeier.23) Solid lines are from ourassessment.
- I0.5
(D ~11.0
+~ -1 1.5
(1)
c\1 ~12.0E- -12.5\ o**
LLO__o-1 3.0
o)o -13.5
-1 4.0
o~~(~)o
4400c
41 5'C
1180'C
230c
o Sulayev et al. 1970ACarter 1974[~l Heumann&Bbhmer1960
S=0
S:: -0.5
S=0
S=2
1418
Fig. 4.
O OI O2 O3 O4 O5 0.6
Xcr
Chemical diffusion coefficient in Fe-Cr alloys at dif-
ferent temperatures. Symbols are experimental datadue to Carter24) (triangles). Heumannand B6hmer26)(squares), and Sulayev el al.35) (circles). Solid lines arefrom our assessment.
phase boundary at about 28wto/o Cr. In Figs. 5-6, wetrace the composition and temperature dependencyofD~., respectively. The fit to most data is quite reason-able. In the sameway, Figs. 7-8, showD~*. Also thesecalculations showa reasonable agreement with the ex-periments. ~
Diffusion in Cr-Ni AlloysThe only pieces of experimental information on dif-
fusion in the C~Ni system are the D~, data reportedby Askill,16) see Fig. 9. Unfortunately, only the filled
symbols are from single phase specimens. The fit to thedata is satisfactory.
Diffusion in Fe-Ni A110ysD~. data by Okada,20) see Fig. 10, are the only experi-
mental data on diffusion in the Fe-Ni alloys. The fit tothe data is satisfactory.
Diffusion in Cr-Fe-Ni AlloysIt has not been possible to satisfactorily account for
ISIJ Intemational, Vol. 35 (1 995), No. 11
-1 1-12
~=~ -13u)
c\1~14
E- -15~.aLLa'
_1 6~-17
-18
-1 9
l!~ 1250'C[ll 1145'C
I060'CVV960'C
A l!~
vvv v
v
0.6 1.OO 0.2 0.4 0.8
Xcr
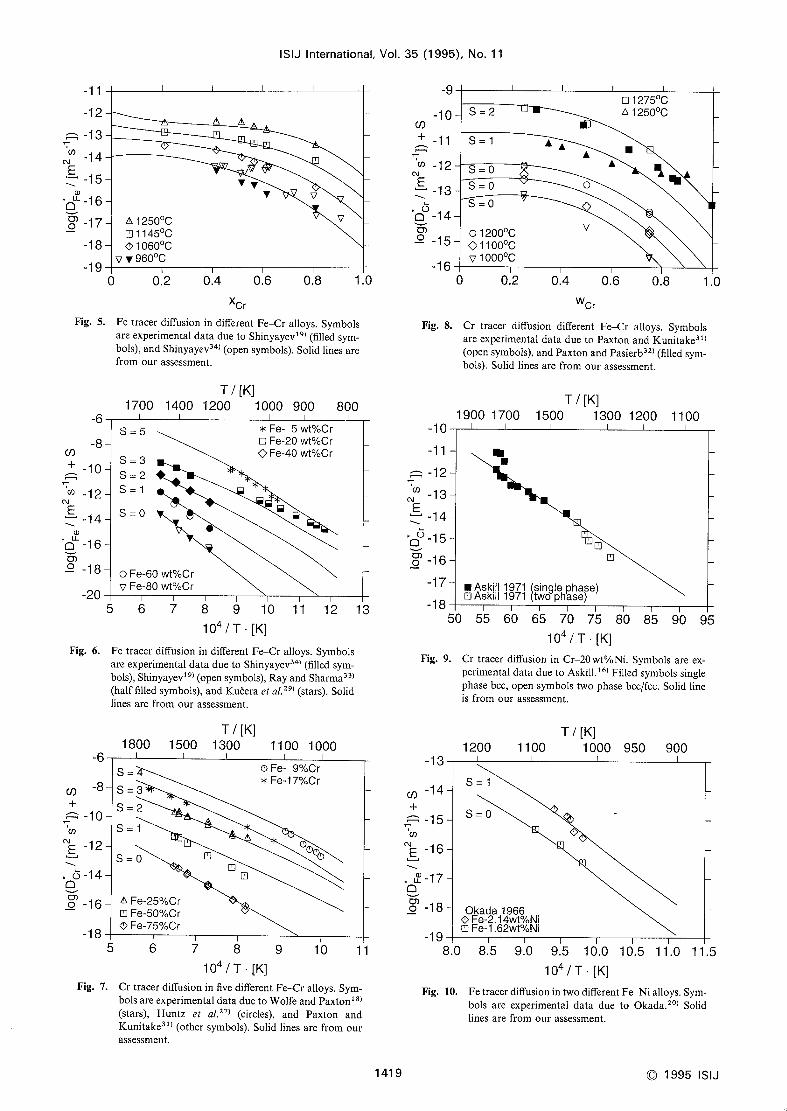
Fe tracer diffusion in different Fe-Cr alloys. Symbolsare experimental data due to Shinyayevl9) (filled sym-bols), and Shinyayev34) (open symbols). Solid lines arefrom our assessment.
T/ [K]
1700 1400 1200 1000 900 800
-9
-1 O(/)
+ -11
u) -12c\l
13*~C:) -14~a)~2 _15
-16
S=2ll:]
[] 12750C~12500C
S=1 AAA
S=0S=0S=0
Fig. 5.
o 1200'C~11oo'Cv Iooo'c
O
v
JL
I
~l
-6
-8(D+ _10
a) _12c\'
E:
- -14
~+a -16a)o- -18
-20
Fig. 8.
S=5 )1 Fe- 5wt'/oCr[i Fe-20 wtoloCr~>Fe-40 wto/oCr
-10
-1 1
~ -12c~J(1) _13
14*~5iO ~15o)o -16
-17
-18
o 0.2 0.4 0.6 0.8 1.O
Wcr
Cr tracer diffusion different Fe-Cr alloys. Symbolsare experimental data due to Paxton and Kunitake31)(open symbols), and Paxton and Pasierb32) (filled sym-bols). Solid lines are from our assessment.
s=3S=2S=1
S=0
OFe-60 wt"/aCr
v Fe-80 wtoloCr
e
lii
Fig. 6.
5 6 7 8 9 10 11 12 13
104 /T •[K]
Fe tracer diffusion in different Fe-Cr alloys. Symbolsare experimental data due to Shinyayev34) (filled sym-bols), Shinyayevl9) (open symbols), Rayand Sharma33)(half filled symbols), and Ku6eraet a/.29) (stars). Solidlines are from our assessment.
T/ [K]
1800 1500 1300 1100 1000
T/ [K]
1900 1700 1500 1300 1200 1100
ll
-6
[ll
I Askill 1971 (single phase)~! Askiil 1971 (two phase)
Cll
50
Fig. 9.
-13
55 60 65 70 75 80 85 90 95104 /T •
[K]
Cr tracer diffusion in Cr-20wto/,Ni. Symbolsare ex-perimental data due to Askill. 16) Filled symbols single
phase bcc, opensymbols two phase bcc/fcc. Solid lineis from our assessment.
CD~8
- -10~a)
c\~
E -12
, ~-14O_o)o -16
-18
T/ [K]
1200 1100 1000 950 900
S=S=3S=2S=i
S=0
AFe-25010Cr[1] Fe-50010Cr
Fe-75010Cr
[1]
Cl]
[1]
OFe- 9010Cr
* Fe-1 7010Cr
oo(~~
5 6 7 8 10 119104 /T •
[K]
Cr tracer diffusion in five different FeCralloys. Sym-bols are experimental data due to Wolfe and Paxtonl8)(stars), Huntz et al.27) (circles), and Paxton andKunitake31) (other symbols). Solid lines are from ourassessment,
C/) ~14
+~::~ -15u)
c\i it~~ -Iv
~-17*O~;iO -18
-1 9
S=1
S=0
Okada1966~ Fe*2. 14wt'/•Ni~l Fe-1 .62wt'/.Ni
Fig. 7.
~~
8.0
Fig. lO.
85 90 95 100 10.5 11.0 11.5
104 /T •[K]
Fe tracer diffusion in two different Fe-Ni alloys. Sym-bols are experimental data due to Okada.20) Solidlines are from our assessment.
141 9 C 1995 ISIJ

ISIJ International, Vol. 35 (1995), No. 11
-101650 1550 1450
T/ [K]
1350 1250 1200
C/) ~11
~,) -12c\l\E_
13
O~O)o -14
-15
Fe-29Wto/oCr-4WtoloNi
[~] D~eNi
DFecrcr
S=1
S=0
6,0 6.4 6.8 7.2 7.6 8.0 8.4104 /T •
[K]
Chemical diffusion coefficient of Cr and Ni in an Fe-29wto/oCr~Vwto/oNi alloy. Symbolsare experimentaldata due to Malik el al.39) Solid lines are from ourassessment.
Ni
1OO
90
80
~~ 70\s:c;e)~
60 1473Ke,
~: *~*,h*~5~~
40~~~
30
20
1O K6 eK4
OE~]~ K8
Y+0c
Fig. Il.
-121400 1200
T/ [K]
1000 900
e o;K9
800
Feo
Fig. 13.
-14
(,)
c\] -16E~'Oo* -1 8~a)~2 -20
-22
CD
[ll Fe-25.3wto/oCr-4.6wto/aNi
C~l
7 8 9 10 11 12 13 14
104 /T •[K]
Fig, n. Cr tracer diffusion in an Fe-25.3wt'/.Cr~1:.6wt"/,Nianoy. Symbols are experimental data due to Smithand Hales.'o) Solid nne is from our assessment.
D~i data reported by Hancockand Leak37) (not shownin plot). The difference between the assessmentand theexperiments is very large, about two orders of magni-tude. The D~~c, and DF' data of Malik et al.39) areNiNiwell reproduced by the present assessment, see Fig. 11,
whereas the D~* data of Smith and Hales40) are not asnicely represented, see Fig. 12.
6. Test of SomePredictions: AnApplication
In Fig. 13 wehave markedwith squares the composi-tions at which experimental diffusion data are availableoutside the binary Cr-Fe side. Wenotice that large areasof the bcc (oc) phase field has not been investigated.
In order to independently test the quality of theassessmentwork on an application, Engstr6m43) madeand annealed three different diffusion couples K4-K6,KI~K8, and K8-K9 (alloys markedwith solid circles)
at 1200'C. Simulations madewith DICTRAusing ourassessed data are comparedwith Engstrdm's measured
70
60
~ 50o(,~40CL
J::_a) 30'(a)
~ 20
10
O
20 40 60 80 1OOWeight Percent Cr Cr
Calculated isothermal section in the CrFe-Ni sys-tem at 1473K. Squares mark alloy compositionswhere diffusion data are available due to variousauthors. Solid circles mark the alloy compositionsof Engstr6m's diffusion couples.
oeo Crc]l~ Ni
o
o
C 1995 ISIJ
e
o
1420
-2.0 -1.5 -1.0 -0.5 0.0 0.5 1.0 1.5 2.0
Distance / [mm]Fig. 14. Comparison between predicted and experimental
composition profiles in diffusion couple K4-K6(filled
symbols), KI~K8 (half filled symbols), and K8-K9(open symbols). Annealed at 1200'C for 21 h. Ex-periments are due to Engstr6m.43)
composition profiles in Fig. 14. The predicted profiles
are in reasonable agreementwith the experiments, evenfor couple K8-K9which alloys are quite far awayfromcompositions where experimental diffusion data areavailable.
7. Summary
Thediffusional mobilities of Cr, Fe and Ni in bcc Cr-Fe-Ni alloys has been assessed by meansof a Calphadtype of method. Using a modelwhich takes the effect ofthe ferromagnetic transition into account, most experi-mental data could be successfully accounted for with afairly reasonable accuracy.
Although there are manyexperimental data in this
system, most data are from Fe-rich alloys leaving large
areas of the ternary in the dark. Thus, more ternarydiffusion data are welcome. However, as tested above,

ISIJ International, Vol. 35 (1 995), No. 11
the present assessmentpossesses a reasonable predictive
power.
Acknowledgement
This work has been sponsored by TFR(SwedishResearch Council for Engineering Sciences).
l)
2)
3)
4)
5)
6)
7)
8)
9)
10)
1l)
l2)
13)
l4)
l5)
16)
l7)
18)
l9)
20)
21)
22)
23)
24)
25)
26)
27)
28)
29)
3O)
31)
32)
33)
34)
35)
REFERENCESJ.-O. Andersson, L. Hdglund, B. J6nsson and J. Agren:
Fundamentalsand Applications of Ternary Diffusion, ed. by G.R. Purdy, PergamonPress, NewYork, (1990), 153.
SGTE(Scientific GroupeThermodataEurope) solution databaseof Jan. 1994. Editor: B. Sundman,Division of ComputationalThermodynamics. Royal Institute of Technology, S- 10044Stockholm, Sweden,E-mail: [email protected]. Sundman.B. Janssonand J.-O. Andersson: Calphad, 9(1985),
l53.
B. J6nsson: Z. Metallkd., 85 (1994), 498.B. J6nsson: Z. Meta!!kd., 83 (1992), 349.J.-O. Andersson and J. Agren: J. Appl. Phys., 72 (1992), 1350.B. Jansson: Internal Report, Trita-Mac-234 (1984). Division ofPhysical Metallurgy, Royal Institute of Technology, S-10044Stockholm, Sweden.B. J6nsson: Z. Metallkd., 85 (1994), 502.L. Kaufmanand H. Bernstein: ComputerCalculation of PhaseDiagrams, Refractory Materials, Vol. 4, AcademicPress, London,(1970).
H. W. Paxton and E. G. Gondolf: Arch. Eisenbtiltenwes., 30(1959), 55.
P. L. Gruzin, L. V. Pavlinov and A. D. Tyutyunnik: Izv. Akad.NaukSSSR,5(1959), 155. Quoted in Ref, 15).
N. A. Bogdanov: Russian Metallurgy and Fuels, 3(1960), 95.
L. I. Ivanov, M. P. Mateeva, V. A. Morozov and D. A.Prokoshkin: Russian Metallurgy and Fuels, 2(1962), 63.
W. C. Hagel: Trans. Metall. Soc. AIME, 224 (1962), 430.J. Askill and D. H. Tomlin: Philos. Mag., 11 (1965), 467.J. Askill: Phys. Status. Solidi. A, 8(1971), 587.J. N. Mundy, C. W. Tse and W. D. McFall: Phys. Rev. B, 13(1976), 2349.
R. A. Wolfe and H. W. Paxton: Trans. Metall. Soc. AIME, 230(1964), 1426.
A. Y. Shinyayev: Trans. Phys. Met. Metallogr. corresponding toFiz. Met. Metalloved., 20 (1965), 875.
T. Okada: Radioisotopes, 15 (1966), 169.
P. J. Alberry and C. W. Haworth: Met. Sci., 8(1974), 407,A. W. Bowenand G. M. Leak: Metall. T,'ans., I (1970), 2767.R. Braun and M. Feller-Kniepmeier: Phys. Status. Solidi., 90(1985), 553.
G. F. Carter: J. Less-CommonMet., 37 (1974), 189.
F. Chaix andA. M.Huntz: Mem.Sci. Rev. Metall., 71 (1974), I15.
T. Heumannand H. B6hmer: Arch. Eisenbtittenwes., 31 (1960),749.
A. M. Huntz, P. Guiraldenq, M. Aucouturier and P. Lacombe:Mem.Sci. Rev. Metall., 66 (1969), 85.
A. M. Huntz: Mem.Sci. Rev. Metal/., 70 (1973), 81.
J. Ku~era, B. Million, J. Rfizi6kov~, V. Foldyna andA. Jakobov~:Acta Metal/., 22 (1974), 135.
L. I. Ivanov and N. P. Ivanchev: Izvestiya Akademii Nauk,Otdelenie Tekhnicheskikh Nauk. August 1958, pp. 15. Quoted in
Ref. 31). Unfortunately, the valid temperature range was notgiven.
H. W. Paxton and T. Kunitake: Trans. Metal/. Soc. AIME, 218(1960), 1003.
H. W, Paxton and E. J. Pasierb: Trans. Metal!. Soc. AIME, 218(1960), 794.
S. P. Rayand B, D. Sharma: Acta Meta!1., 16 (1968), 981.
A. Y. Shinyayev: Izv. Akad. Nauk SSSR, Metallurgiya iMetalloved, (1957), 299.I. E. Sulayev. A. N. Kurasov, N. A. KarpovandA. V. Rabinovich:Russ. Metal!., (1 970), No. 4, 150 and lzv. Akad. NaukSSSR,Met.,
36)
37)
38)
39)
40)
41)
42)
43)
(1970), No. 4, 209.P. I. Williams andR. G. Faulkner: J. Mater. Sci., 22 (1 987), 3537.G. F. Hancockand G. M. Leak: Met. Sci. J., I (1967), 33.
M. Kajihara andM. Kikuchi: Acta meta!1. Mater., 41 (1993), 2045.T. M. Malik. D. Bergner and H.-J. Eckstein: NeueHtitte, 30(1985), 441.
A. F. Smith and R. Hales: Met. Sci., 10 (1976), 418.J. Philibert: AtomMovements,Monographiesde Physique, LesEditions de Physique 1991, Les Ulis CedexA. France.J. Fridberg, L.-E. T6rndahl and M. Hillert: Jernkontorets Ann.,153 (1969), 263.
A. Engstr6m: Private communication, augusti 1994.
Appendix
R= 8.3 1451Jmol- I K- I.
given in SI units.
Mobility of CrOCr
CroFe
CroNi
CrOIC]~Cr,Fe
I~rcr
1H Cr,PeOCrOH Cr,Ni(~Cr
l l(:)1:y~f Cr,NiCr
OI~]IC!H Fe,NiCr
I~'nH Fe,NiCr
= - 35.6/R
= In(8.5 • 10~5)
= In(8.5 • lO~ 5)
= - 116/R
= +37.5/R
=0=0=0=0
crn~ cr,Fe,Ni_O~'cr ~pen~cr,Fe,Ni_O~' cr ~Nin~cr,Fe,Ni_O'c7cr ~
Mobility of FeCre)FeFeOFeNi(9Fe
On~Cr,FeC!Fe
1IC]~ Cr,FeC' pe
OIC]~Cr,Ni'~fFe
1167HCr*NiFe
Ot~'nHFe,NiFe
l ICIFe,NiUHFe
= - 17.21R
= In(4.6 • 10~ 5)
= In (4.6 • IO~ 5)
= - 1171R
= +348/R
=0=0=0=0
crn~cr'Fe'Ni_OI~yFe ~Fen~cr'Fe,Ni_O':y Fe ~Nin~cr'Fe'Ni_Olc' Fe ~
Mobility of Ni6) Cr
NioFe
Ni6,Ni
NiOn~Cr,Fe
':7Ni
l n~Cr,Fec,Ni
O~]~Cr,Ni,~rNi
1n~Cr,Nic,Ni
On~Fe,Ni,orNi
l n~Fe,Nic,Ni
= - 17.21R
= In(1.8 • lO- s)
= In(1 .8 • 10~s)
= + lO/R
=0=0=0=0=0
Crn~Cr,Fe,Ni_Ot~,Ni -PenHCr,Fe,Ni_Ot:yNi -Nin~Cr,Pe,Ni_Olc,Ni -
A11 parameter
CrQCrPeQCrNiQCr
OnCr,Fe'~Cr
l nCr,Fe~~Cr
OnCr,Ni!:~ Cr
1nCr,Ni~iCr
OnFe,Ni~Cr
l nFe,Ni~Cr
values are
= +407OOO
= +218OOO
= +218OOO
= - 361 OOO
= -2 820
= - 350OOO
=0= - 150OOO
=0cr(]cr,Fe,Ni
=O~crFencr,Fe,Ni = +2400OOO!:~ crNincr,Fe,Ni
::; O'4cr
CrQFeFeQFeNiQFe
O(]Cr,Fe':~ Fe
l nCr,Fe~iFe
OnCr,Ni~i Fe
l nCr,Ni~~Fe
OnFe,Nik~Fe
1nFe,Ni~i Fe
= +407OOO
= +218OOO
= +218OOO
= - 267OOO
= +416000
= - 350OOO
=0= - 150OOO
=0crncr,Fe,Ni =O~~FeFencr,Fe,Ni = +1400OOO~FeNincr,Fe,Ni
=O'~ Fe
CrQNiFeQNiNiQNi
OnCr,Fe!~~Ni
l nCr,Fe'4Ni
OnCr,Ni~5i Ni
l nCr,Ni~iNi
OnFe,Ni~iNi
1nFe,Ni~iNi
= +407OOO
= +204OOO
= +204OOO
= +88 OOO
= -O= - 350OOO
=0= - 150OOO
=0crncr,Pe,N'
_l O,4Ni -Fencr,Fe,Ni_ +500OOO~CNi -Nincr,Fe,Ni_O~~Ni -
1421 C 1995 ISIJ