Embed Size (px)
Citation preview

Food Sci. Technol. Res., 15 (4), 439–448, 2009
Technical paper
Effects of Rice Flour Properties on Specific Loaf Volume of One-loaf Bread Made from
Rice Flour with Wheat Vital Gluten
Etsuko araki*, Tatsuya M. ikeda, Kanae aShida, Kanenori takata, Mikiko Yanaka and Shuichi iida
National Agricultural Research Center for Western Region, 6-12-1 Nishifukatsu, Fukuyama, Hiroshima 721-8514, Japan
Received August 29, 2008; Accepted March 27, 2009
Using various rice flours prepared by different milling methods, the relationship between rice flour properties and specific loaf volumes of one-loaf bread made from rice flour with wheat vital gluten were studied. Damaged starch content of rice flour varied from 1.0% to 22.1%. A significant negative correla-tion was verified between damaged starch content and specific loaf volume of one-loaf bread. Rice flour with low damaged starch content mainly consisted of compound starch granules, aggregated polyhedral single starch granules and smooth surface cells surrounded by the cell wall. The structures of starch gran-ules and cells were maintained in rice flour with low damaged starch content. Rice flour with high dam-aged starch content consisted of only fine irregular particles without the apparent rice starch structure, or contained fractured large and small cells with rough surface. Although there was not significant cor-relation between specific loaf volume and median particle size, rice flours which were successful at mak-ing bread with high specific loaf volume commonly showed a peak centered around 60 µm with a smaller amount of larger size particles in the particle distribution profile. Thus, the flour particle size distribution appears to affect the specific loaf volume of one-loaf bread. Both the damaged starch content and the profile of particle size distribution were important for high specific loaf volume of one-loaf bread. Less damage to starch and cell structures while lowering the particle size during milling process is critical in obtaining better flour for rice one-loaf bread making.
Keywords: one-loaf bread, rice flour, wheat gluten, damaged starch content, specific loaf volume, polyhedral single starch
granule, compound starch granule, smooth surface cell
*To whom correspondence should be addressed.
E-mail: [email protected]
IntroductionThe consumption of rice (Oryza sativa L.) in Japan has
been gradually decreasing (Ministry of Agriculture, Forestry
and Fisheries, 2007). Application of rice flour for bread
making is one approach to increase rice consumption. Since
bread making from rice flour is difficult due to the absence
of gluten proteins, rice flour is blended with wheat flour or
wheat vital gluten (Takano et al., 1986a, 1986b; Yamauchi et
al., 2004).
Joshinko and Joyoko are rice flours used for making
Japanese sweets. They are traditionally prepared using a roll
mill with soaked rice grains. Bread making using Joshinko
was found to be unsuitable due to its low loaf volume (Takano
et al., 1986a, 1986b), while that using Joyoko, a finer flour
than Joshinko, has not yet been reported. New methods of
rice milling have been developed to improve the loaf volume
of rice bread (Arisaka et al., 1992a; Egawa et al., 1995). In
this new milling method, a jet mill is used to grind wet rice
grains macerated with cell wall-degrading enzymes like pec-
tinase. The volume of bread made from rice flour with gluten
prepared by this new milling method was higher than made
from Joshinko (Egawa et al., 1995; Yamauchi et al., 2004).
This rice flour has particles that are finer than Joshinko and
consists of large amounts of compound starch granules and
single starch granules and a small amount of cell fragments
without apparent damage (Egawa et al., 1995). Although a
few reports have compared various rice flour properties re-
lated to rice flour bread made with wheat gluten (Egawa et
al., 1995, Yamauchi et al., 2004), critical rice flour properties
for improving loaf volume of one-loaf bread made from rice
flour with wheat gluten have not been clarified.
In this study, rice one-loaf bread with wheat gluten was
prepared using various rice flours obtained from different
milling methods to examine the relationship between specific
loaf volumes of one-loaf bread and flour properties such as
moisture content, amylose content, damaged starch content,
particle size distribution and surface structure of rice flour
particle.
Materials and MethodsRice flour Sixteen different rice flours (Table 1) and
wheat flour for bread making (Nisshin Seifun Group, Japan)
were used in this study. Rice flour no. 1, which was prepared
by a jet mill from polished rice grains macerated with pec-
tinase, was provided by Niigata Flour Milling Co. (Japan),
and rice flour no. 2 was prepared from polished grains of
rice variety Koshihikari using a jet mill (Nishimura Machine
Works Co., Japan) at the Food Research Center, Niigata
Agricultural Research Institute, following the same method
as that for no. 1. Rice flour no. 3 was provided by Katayama
Milling Co. (Japan) and was prepared by a jet mill under wet
conditions. Rice flour nos. 4 and 5, prepared by a jet mill un-
der dry conditions, were provided by Namisato Co. (Japan).
Rice flour no. 6 prepared from polished grains of rice variety
Koshihikari using a pin mill under dry conditions was pro-
vided by Hohden Industries Co. (Japan). Rice flour nos. 7-12
(Joshinko) were purchased from Shinozaki Kazuo Syohten
Co., Hinomoto King Co., Hinokuni Foods Co., Hitachiya-
honpo, Inoue Syohten Co. and Maehara Seifun Co. (Japan),
respectively. Rice flour nos. 13 and 14 (Joyoko), were
purchased from Natural Kitchen and Watashino-daidokoro
(Japan), respectively. Production of Joshinko and Joyoko
generally involves a roll mill to grind grains soaked with
water, but the milling processes for nos. 7-14 were not avail-
able. For rice flour no. 15, a jet mill (IDS, Nippon Pneumatic
Mfg. Co., Japan) was used to grind grains of rice variety
Nihonmasari after hammer milling under dry conditions at
the National Food Research Institute. Rice flour no. 16 was
provided by Kyoritsu Foods Co. (Japan); its milling process
was not available. Flour nos. 1, 3, 4, 5 and 16 were sold as
rice flour for bread making. Each single lot of flours was pur-
chased from Oct. 2006 to Feb. 2007 and used as the sample
flours.
Pre-treatment Milling method
1 Pectinase Jet milling (wet) 10.7 ab 1.9 a 33.0 b 14.0 a 3.6 g
2 Pectinase Jet milling (wet) 10.3 ab 1.0 a 48.8 d 15.5 b 3.5 fg
3 Soaking Jet milling (wet) 9.0 a 7.0 cd 38.3 c 17.2 de 2.9 cde
4 - Jet milling (dry) 12.3 ab 3.6 b 47.7 d 17.6 e 3.3 efg
5 - Jet milling (dry) 10.0 ab 13.4 h 57.1 e 19.1 f 2.6 abc
6 - Pin milling (dry) 13.0 b 10.1 fg 66.6 f 16.2 bcd 2.9 cde
7 † Soaking Roll milling (wet) 12.7 b 7.1 cd 39.9 c 15.9 bc 3.1 def
8 † Soaking Roll milling (wet) 11.7 ab 7.7 de 115.9 j 17.2 de 2.9 cde
9 † Soaking Roll milling (wet) 12.3 ab 8.2 de 79.0 h 20.1 fg 2.8 cd
10 † Soaking Roll milling (wet) 12.0 ab 9.2 ef 74.1 g 16.9 cde 2.9 cde
11 † Soaking Roll milling (wet) 10.7 ab 10.6 fg 103.7 i 17.5 e 3.0 cde
12 † Soaking Roll milling (wet) 11.7 ab 17.8 j 45.9 d 13.6 a 2.2 a
13 †† Soaking Roll milling (wet) 10.7 ab 10.9 g 36.8 bc 16.5 bcde 2.8 cd
14 †† Soaking Roll milling (wet) 11.7 ab 15.3 i 37.9 c 17.0 cde 2.7 bcd
15 -Hammer milling (dry)
Jet milling (dry)9.0 a 22.1 k 5.6 a 17.4 e 2.3 ab
16 n/a n/a 11.7 ab 5.6 c 47.2 d 21.0 g 3.5 fg
Specific loafvolume
Flourno.
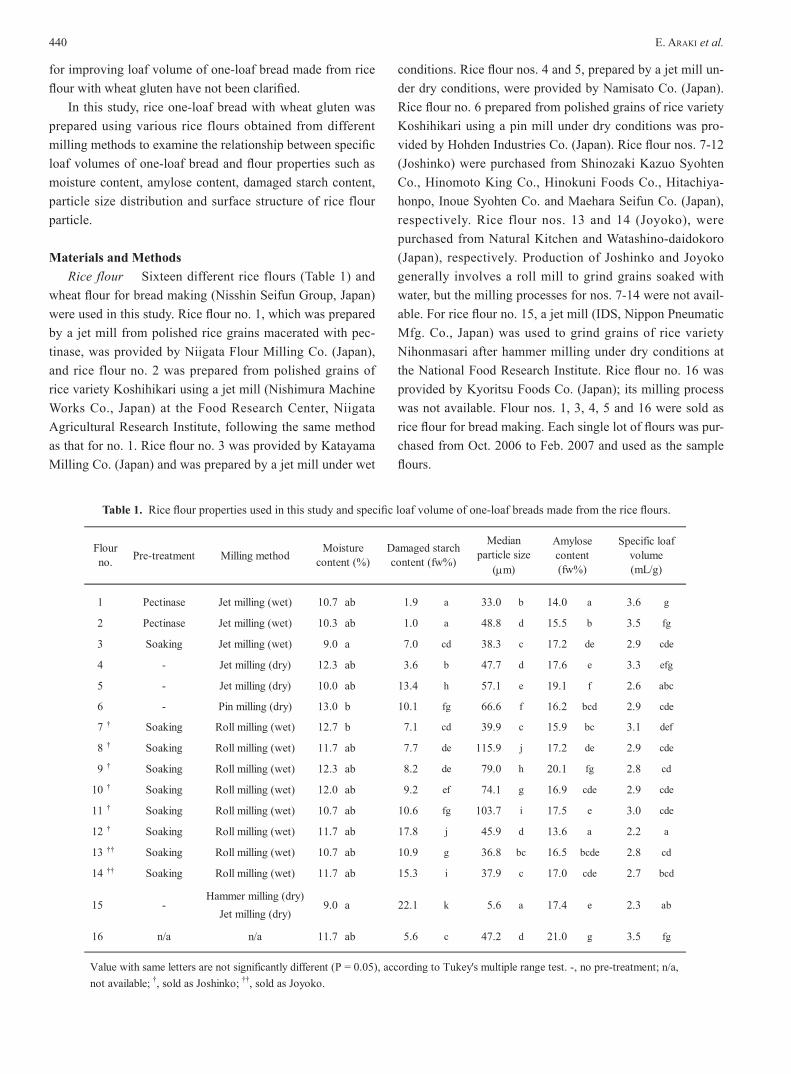
Value with same letters are not significantly different (P = 0.05), according to Tukey's multiple range test. -, no pre-treatment; n/a,
not available; †, sold as Joshinko; ††, sold as Joyoko.
Moisturecontent (%)
Damaged starchcontent (fw%)
Medianparticle size
(µm)
Amylosecontent(fw%) (mL/g)
Table 1. Rice flour properties used in this study and specific loaf volume of one-loaf breads made from the rice flours.
e. araki et al.440

Flour properties The damaged starch content was mea-
sured according to the method of the American Association
of Cereal Chemists (AACC method 76-31, 1992) using a
starch damage assay kit (Megazyme International Ireland,
Ireland). The flour particle size distribution and median par-
ticle size were measured using a particle size analyzer with
laser diffraction (Heros & Rodos, Sympatec, Germany).
Amylose content was measured according to the method of
Juliano et al. (1981). The moisture content was calculated as
a measure of weight loss after drying at 135℃ for 1 h. All
measurements were repeated three times for each sample.
Bread making for rice one-loaf bread with wheat gluten
The bread making for rice one-loaf bread was performed ac-
cording to the no-time method (Yamauchi et al., 2004) using
80 g (as is basis) rice flour, 20 g wheat vital gluten (Nippon
Flour Mills Co., Japan), 5 g sugar, 2 g salt, 10 g shortening,
1.5 g dry yeast (Nippon Flour Mills Co.), and 80 mL distilled
water. The dough was mixed using a Swanson-Working pin-
type test bake mixer (National Manufacturing Co., USA) for
an optimal time measured by mixograph (National Manufac-
turing Co.). The dough was rounded and allowed to stand for
20 min at 27℃ under 85% humidity, before molding using a
roll molding machine SMMR 2501 (Aicohsha Manufactur-
ing Co., Japan). It was fermented for 50 min in fermentation
cabinets at 40℃ under 85% humidity and baked for 25 min
at 200℃. One-loaf bread was weighted 1 h after baking.
The loaf volume of the bread was measured by a rapeseed
replacement method. Specific loaf volume was calculated as
volume per weight (mL/g). Bread making was repeated three
times for each sample.
Flour particle structure analysis The surface structure
of rice flour particles and grains were analyzed using a scan-
ning electron microscope (SEM) S-3400N (Hitachi High-
Technologies Co., Japan) without coating at an accelerating
voltage of 8-10 kV under low vacuum condition of 70-80 Pa
at -25℃.
Statistical analysis Tukey’s multiple range tests were
used for statistical analysis.
Results and DiscussionMoisture content The moisture content significantly dif-
fered among rice flours, ranging from 9.0% to 13.0% (Table
1). As the desired moisture content of wheat flour is main-
tained at 14% or less (Atwell, 2001), the moisture contents
of these rice flours appeared to be sufficient. Although the
drying methods were unknown for the samples, all rice flours
used in this study appeared to be adequately dried.
Amylose content Amylose content differed significantly
among rice flours ranging from 13.6% (no. 12) to 21.0%
(no. 16) (Table 1). Flour nos. 2 and 6 prepared from rice
variety Koshihikari had similar amylose contents of 15.5%
and 16.2%, respectively. Flour no. 15 prepared from rice va-
riety Nihonmasari had amylose content of 17.4%. These ge-
netic variations in amylose content found in this study were
smaller than that for known variations among non-waxy rice
varieties ranging from 8% to 30% (Nakagahra et al., 1986).
Damaged starch content The damaged starch content
differed significantly among rice flours (Table 1). Flour no. 2
showed the lowest damaged starch content (1.0%), followed
by flour no. 1 (1.9%), both of which were milled using a jet
mill under wet conditions after pectinase treatment. Our data
confirmed the effectiveness of this jet mill method in reduc-
ing damaged starch content. Flour no. 15 showed the highest
content of damaged starch (22.1%) among the flours. This
flour was produced using a jet mill after hammer milling un-
der dry conditions. Since the damaged starch content of flour
no. 15 by hammer milling already reached 7.7%, the high
damaged starch content of no. 15 might have been caused
by pre-milling with a hammer mill, in addition to jet milling
under dry conditions. Nishita et al. (1982) and Arisaka et al.
(1992b) reported that damaged starch content was affected
by the type of milling devices and the differences in the mill-
ing conditions such as dry or wet milling. When a jet mill
was used, the damaged starch content of rice flour prepared
under wet conditions was lower compared to that of flour
prepared under dry conditions (Arisaka et al., 1992b).
The differences in the damaged starch content were sig-
nificant among the six Joshinko samples (flour nos. 7-12),
ranging from 7.1% (no. 7) to 17.8% (no. 12) (Table 1). The
damaged starch content of two Joyoko samples (flour no. 13
and 14) was also significantly different. Although Joshinko
and Joyoko are traditionally prepared using a roll mill with
soaked rice grains, Joshinko and Joyoko samples used in this
study might have been prepared by different milling devices
and milling conditions, resulting in the different damaged
starch contents. The damaged starch content of flour no. 6
prepared by a pin mill was 10.1%. Flour no. 16 showed low-
er damaged starch content (5.6%) than that of Joshinko and
Joyoko samples; however, its milling method was unknown.
Damaged starch content of bread wheat flour was about 8%,
a level similar to that of rice flour nos. 8 and 9.
Median particle size and particle size distribution The
median flour particle sizes were significantly different among
rice flours, ranging from 5.6 μm (no. 15) to 115.9 μm (no.
8) (Table 1). The distribution profiles of flours were classi-
fied into four patterns containing: one peak (nos. 15 and 16),
two peaks (no. 1), three peaks (no. 3) and one peak and one
Rice Flour Properties on Loaf Volume 441

e. araki et al.
0
50
100
150
200
1 10 100 1000Particle size (µm)
C) Rice flour no. 1
Den
sity
dist
ribu
tion
(%)
0
50
100
150
200
1 10 100 1000
Particle size (µm)
E) Rice flour no. 2
Den
sity
dist
ribu
tion
(%)
0
50
100
150
200
1 10 100 1000Particle size (µm)
F) Rice flour no. 4
Den
sity
dist
ribu
tion
(%)
0
50
100
150
200
1 10 100 1000
Particle size (µm)
D) Rice flour no. 3D
ensi
tydi
stri
butio
n(%
)
0
50
100
150
200
1 10 100 1000
Particle size (µm)
A) Rice flour no. 15
Den
sity
dist
ribu
tion
(%)
0
50
100
150
200
1 10 100 1000
Particle size (µm)
B) Rice flour no. 16
Den
sity
dist
ribu
tion
(%)
0
50
100
150
200
1 10 100 1000Particle size (µm)
G) Rice flour no. 5
Den
sity
dist
ribu
tion
(%)
0
50
100
150
200
1 10 100 1000Particle size (µm)
H) Rice flour no. 6
Den
sity
dist
ribu
tion
(%)
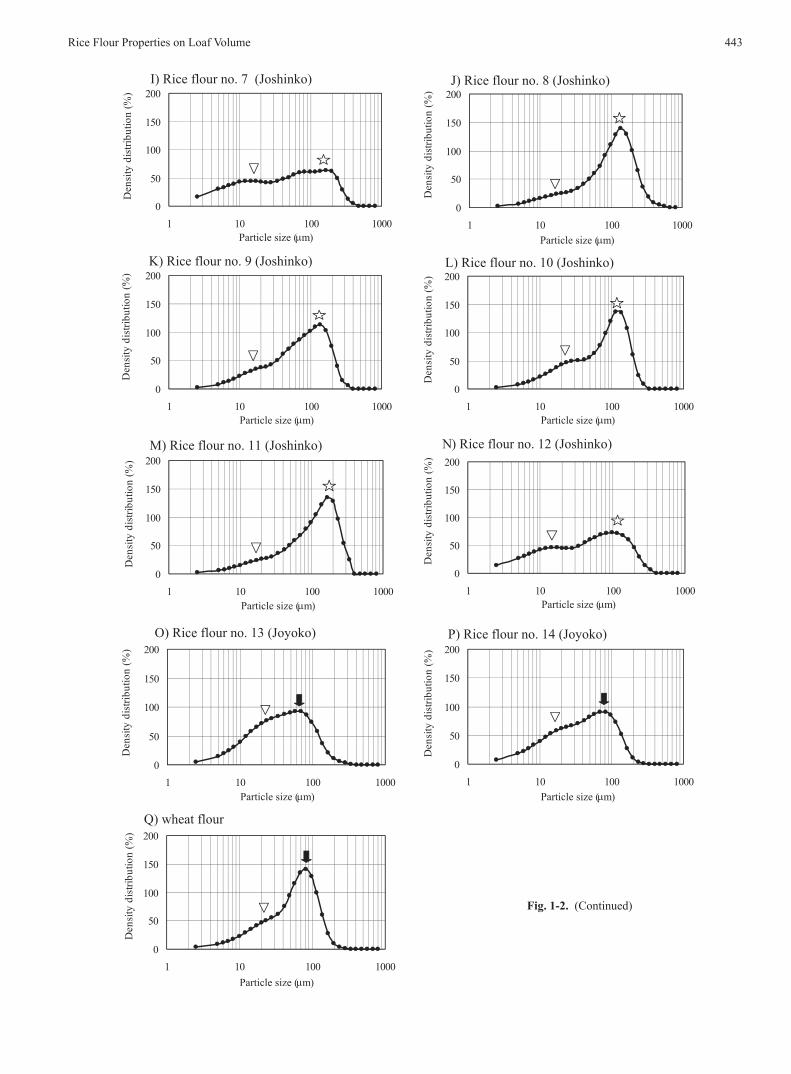
Fig. 1-1. Particle size distribution profiles of rice flours. Density distribution (%) indicates particle quantity per μm in each clas-sification of particle size. , a peak centered around 8 μm; , a peak around 60 μm; , a peak centered around 70-80 μm; , a peak centered around 20 μm; , a peak centered around 150 μm; , a peak around 100 μm; , a shoulder centered around 20 μm.
shoulder (nos. 2, 4-14) (Fig. 1).
For the distribution profiles with one peak, the distribu-
tion profile of no. 15, which was prepared by a jet mill after
hammer milling under dry conditions, had one peak centered
around 8 μm (Fig. 1A), while that of no. 16 had one peak
centered around 60 μm (Fig. 1B).
The distribution profile of no. 1 containing two peaks
centered around 20 μm and 60 μm, was milled using a jet
mill under wet conditions after pectinase treatment (Fig.
1C). Three peaks centered around 20 μm, 60 μm and 150
μm were found in the distribution profile of no. 3, which was
prepared by a jet mill under wet conditions (Fig. 1D).
442
Rice Flour Properties on Loaf Volume
0
50
100
150
200
1 10 100 1000Particle size (µm)
P) Rice flour no. 14 (Joyoko)
Den
sity
dist
ribu
tion
(%)
0
50
100
150
200
1 10 100 1000Particle size (µm)
O) Rice flour no. 13 (Joyoko)
Den
sity
dist
ribu
tion
(%)
0
50
100
150
200
1 10 100 1000Particle size (µm)
M) Rice flour no. 11 (Joshinko)
Den
sity
dist
ribu
tion
(%)
0
50
100
150
200
1 10 100 1000Particle size (µm)
L) Rice flour no. 10 (Joshinko)
Den
sity
dist
ribu
tion
(%)
0
50
100
150
200
1 10 100 1000Particle size (µm)
N) Rice flour no. 12 (Joshinko)D
ensi
tydi
stri
butio
n(%
)
0
50
100
150
200
1 10 100 1000Particle size (µm)
I) Rice flour no. 7 (Joshinko)
Den
sity
dist
ribu
tion
(%)
0
50
100
150
200
1 10 100 1000Particle size (µm)
J) Rice flour no. 8 (Joshinko)
Den
sity
dist
ribu
tion
(%)
0
50
100
150
200
1 10 100 1000Particle size (µm)
K) Rice flour no. 9 (Joshinko)
Den
sity
dist
ribu
tion
(%)
0
50
100
150
200
1 10 100 1000
Particle size (µm)
Q) wheat flour
Den
sity
dist
ribu
tion
(%)
Fig. 1-2. (Continued)
443
For the distribution profiles with one peak and one
shoulder, the particle size of the peak was different while a
shoulder around 20 μm was common. Flour no. 2, which was
milled using a jet mill under wet conditions after pectinase
treatment, and no. 4, which was milled using a jet mill un-
der dry conditions, had a peak centered around 60 μm and a
shoulder around 20 μm (Fig. 1E and F). Flour no. 5 prepared
by a jet mill under dry conditions, and no. 6 prepared by a
pin mill under dry conditions, had a peak centered around
100 μm and a shoulder around 20 μm (Fig. 1G and H). The
ratio of the 20-μm shoulder peak to the 100-μm peak in no. 5
was higher than that in no. 6. The 6 Joshinko samples (flour
nos. 7-12) showed a peak around 150 μm and a shoulder
around 20 μm (Fig. 1I-N); however, the ratios of the 20-μm
shoulder peak to the 150-μm peak were different among
them. Flour nos. 7 and 12 with small median particle sizes
showed a high ratio between the 20-μm shoulder peak to
150-μm peak (Fig. 1I and N), while flour nos. 8 and 11 with
large median particle sizes showed a low ratio (Fig. 1J and
M).
Among Joyoko samples, the distribution profiles of nos.
13 and 14 showed a peak of 70-80 μm and a shoulder peak
around 20 μm with a relatively higher ratio to the 70-80-μm
peak (Fig. 1O and P). Joyoko have finer particles than
Joshinko (Saitoh, 1979), and Joyoko samples nos. 13 (36.8
μm) and 14 (37.9 μm) showed smaller median particle sizes
than Joshinko samples, except for flour no. 7 (Table 1). The
distribution profiles of Joyoko samples used in this study (Fig.
1O and P) were clearly different from that of Joshinko and
other flours.
As reported previously (Arisaka et al., 1992b; Nishita et
al., 1982), milling methods, including milling devices and
milling conditions, affect particle size distribution and me-
dian particle size. Rice flour nos. 1 and 2, which were milled
using the same type of jet mill under wet conditions after
pectinase treatment, showed different distribution profiles
(Fig. 1C and E). Rice flour nos. 5 and 6 had the same distri-
bution profiles but different milling methods (Fig. 1G and H).
Therefore, rice flour properties can not be easily predicted
based on milling methods.
The profiles of particle size distribution of flour nos. 2,
12 and 16 were different, but their median particle sizes were
similar (Fig. 1E, N, B and Table 1), indicating that the me-
dian particle size did not directly reflect on the differences in
the particle size distribution profile. Among Joshinko sam-
ples, rice flour nos. 7 and 12, which showed the same high
ratio of the 20-μm shoulder peak to 150-μm peak in the dis-
tribution profiles, had different damaged starch contents (Fig.
1I, N and Table 1), while rice nos. 8 and 11 showed the same
low ratio, but different damaged starch contents (Fig. 1J, M
and Table 1). Thus, the shoulder to peak ratio in the distribu-
tion profiles was not related to the damaged starch content in
Joshinko samples.
For bread wheat flour, its particle size distribution
e. araki et al.
1
24
3
515
7118 10
9
12
13 146
16
1.6
2.0
2.4
2.8
3.2
3.6
4.0
0 5 10 15 20 25Damaged starch content (%)
0.0
Spec
ific
loaf
vol
ume
(ml/g
)
1.60.0
r = −0.92 **
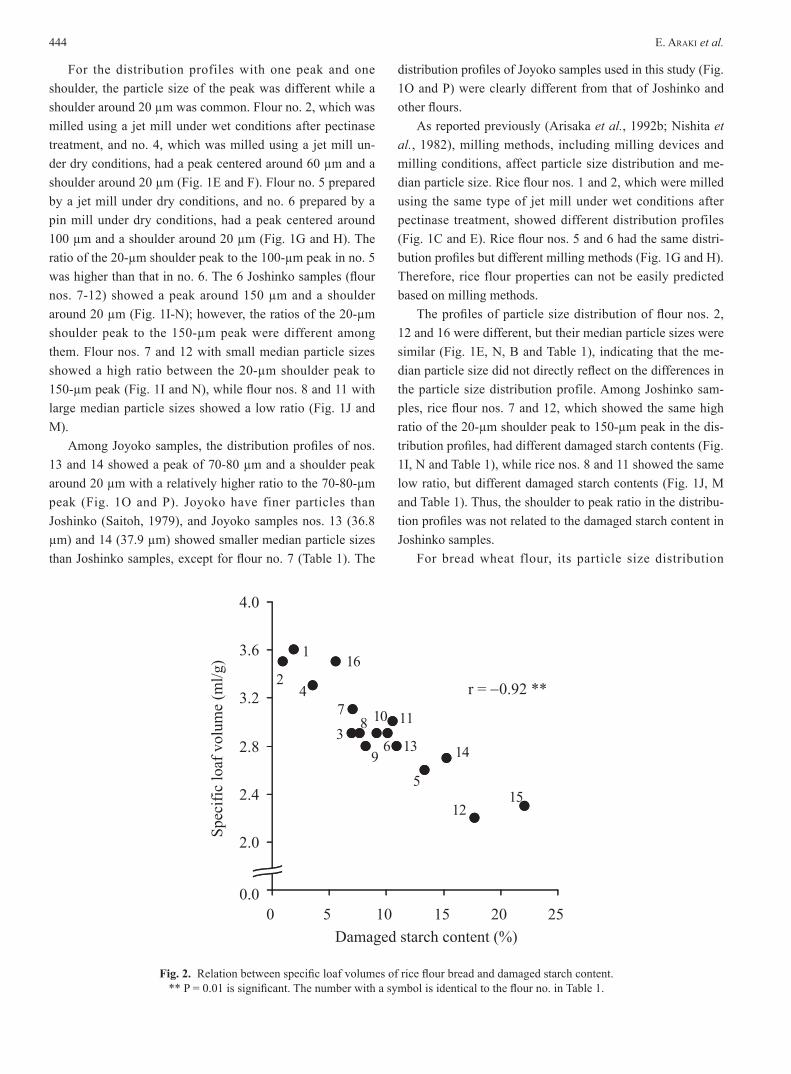
Fig. 2. Relation between specific loaf volumes of rice flour bread and damaged starch content.** P = 0.01 is significant. The number with a symbol is identical to the flour no. in Table 1.
444
showed a peak centered around 80 μm and a shoulder around
20 μm (Fig. 1Q). However, no rice flour used in this study
had the same distribution profile as that of wheat flour.
Relations between specific loaf volumes and flour prop-
erties The specific loaf volumes of one-loaf breads made
from different rice flours are shown in Table 1. The specific
loaf volumes varied significantly from 2.2 to 3.6. The bread
made from flour no. 1 showed the largest specific loaf vol-
ume (3.6), followed by flour nos. 2, 16 and 4 (3.5, 3.5 and 3.3,
respectively).
The relationship between the specific loaf volume and
damaged starch content is shown in Fig. 2. A highly signifi-
cant negative correlation was confirmed between the specific
loaf volume and the damaged starch content (r = -0.92, P
< 0.01), indicating that a lower damaged starch content in-
creases specific loaf volume. The damaged starch granules
had high water absorption than that of intact starch granules
(Takano et al., 1986a, 1986b; Arisaka et al., 1992b). There-
fore, 80 mL of water might be insufficient for formation of
dough using rice flour with more damaged starch. Thus, the
specific loaf volume might decrease in bread made from flour
with more damaged starch. In this study, the dough formed
from rice flour with a higher damaged starch content had a
tendency to be harder than that from rice flour with a lower
damaged starch content suggesting that increased water ab-
sorption by damaged starch affects specific loaf volume.
The moisture content of rice flours differed significantly
(Table 1), but showed no significant correlation with specific
loaf volume (r = 0.17). The range of variation of the moisture
content in this study is not expected to affect on the specific
loaf volume.
Takano et al. (1986b) reported that rice flour containing
10-20% damaged starch content is suitable for wheat/rice
(80:20) composite flour bread. In their case, damaged starch
was useful to produce maltose, which was used as an energy
source for yeast during fermentation, by amylase activity
derived from wheat flour. Amylase activity of rice flour was
less than that of wheat flour (Lorenz and Saunders, 1978;
Takano et al., 1980). Since rice flour bread in this study did
not contain wheat flour, damaged starch may not be used to
produce maltose.
Although a significant correlation was not found between
specific loaf volume and median particle size (r = 0.08), a
peak centered around 60 μm in the particle size distribution
profile was found for flour nos. 1, 2, 4, and 16, all of which
were able to make bread with a high specific loaf volume (Fig.
1C, E, F and B). Takano et al. (1986b) also reported that
wheat/rice (80:20) composite flour bread, which was made
from rice flour with a high content of large size particles,
showed smaller specific loaf volume than that made from
flour with low content. For flour nos. 1, 2, 4, and 16, the ratio
of particles larger than 100 μm was relatively smaller than
other flours (Fig. 1C, E, F and B), suggesting that flour with
a peak centered around 60 μm and few large size particles
is associated with high specific loaf volume. Therefore, the
particle size distribution profile is also an important factor
affecting the specific loaf volume.
There was no significant correlation between specific loaf
volume and amylose content (r = 0.06). However, the effects
of amylose content were not confirmed in this study, because
of the small variation in amylose content of flours.
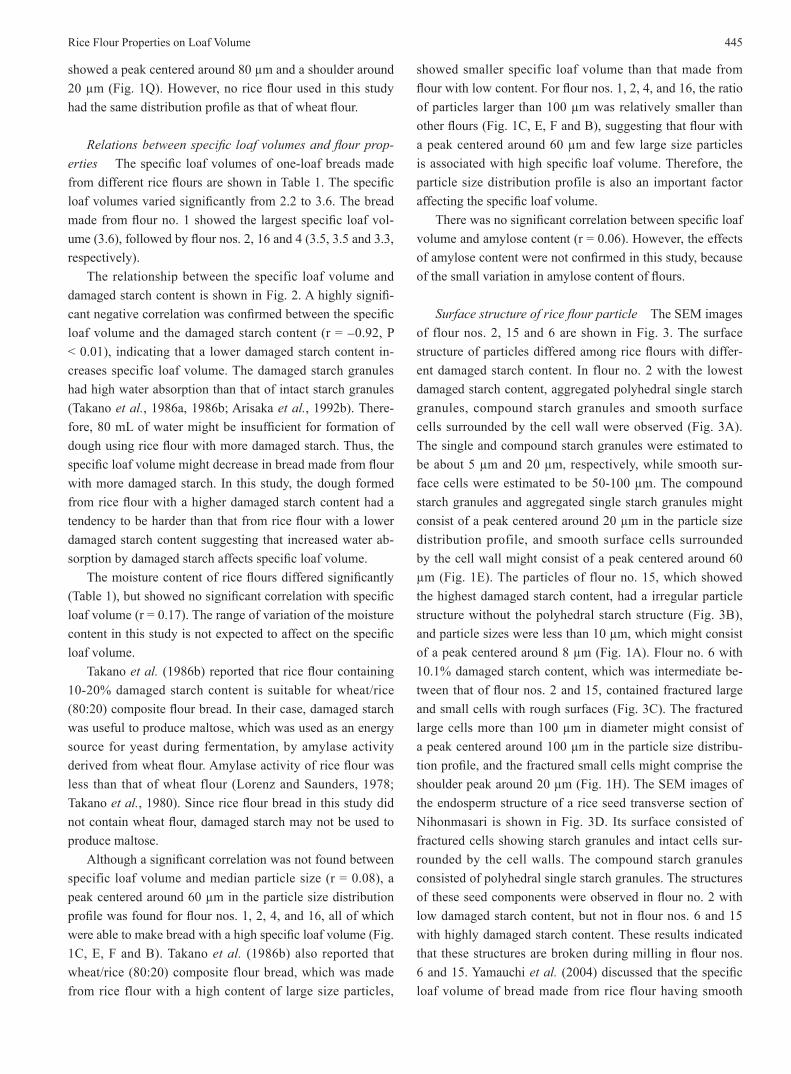
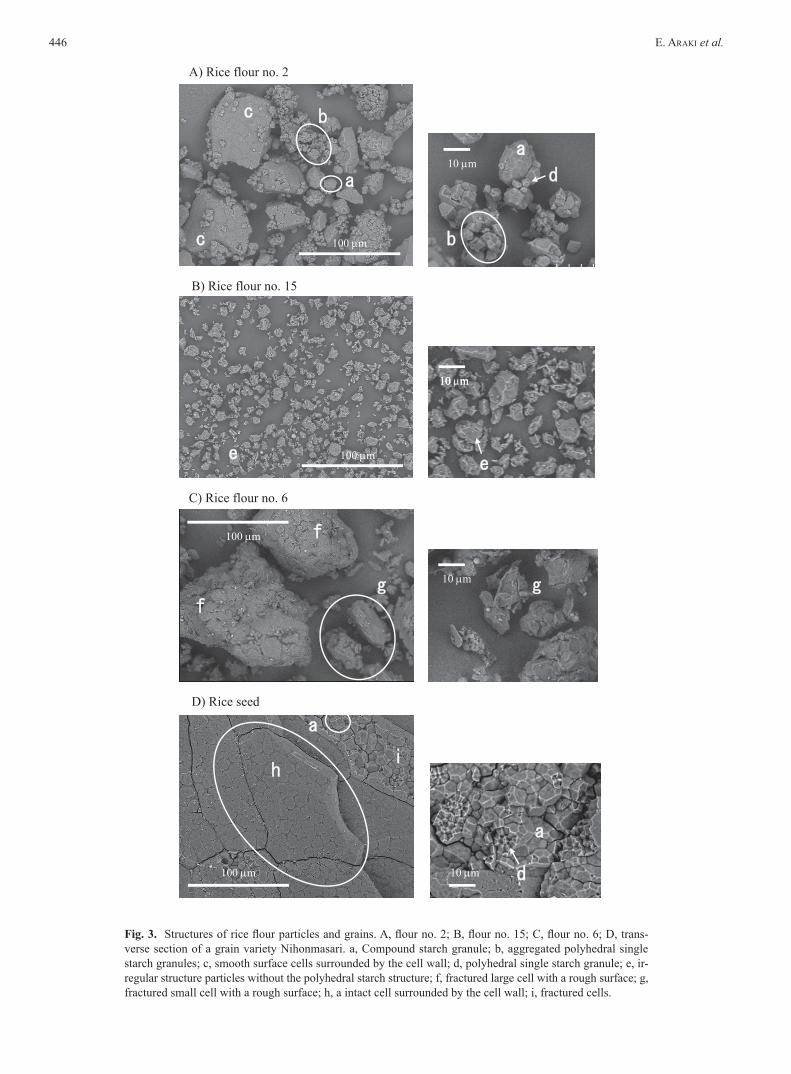
Surface structure of rice flour particle The SEM images
of flour nos. 2, 15 and 6 are shown in Fig. 3. The surface
structure of particles differed among rice flours with differ-
ent damaged starch content. In flour no. 2 with the lowest
damaged starch content, aggregated polyhedral single starch
granules, compound starch granules and smooth surface
cells surrounded by the cell wall were observed (Fig. 3A).
The single and compound starch granules were estimated to
be about 5 μm and 20 μm, respectively, while smooth sur-
face cells were estimated to be 50-100 μm. The compound
starch granules and aggregated single starch granules might
consist of a peak centered around 20 μm in the particle size
distribution profile, and smooth surface cells surrounded
by the cell wall might consist of a peak centered around 60
μm (Fig. 1E). The particles of flour no. 15, which showed
the highest damaged starch content, had a irregular particle
structure without the polyhedral starch structure (Fig. 3B),
and particle sizes were less than 10 μm, which might consist
of a peak centered around 8 μm (Fig. 1A). Flour no. 6 with
10.1% damaged starch content, which was intermediate be-
tween that of flour nos. 2 and 15, contained fractured large
and small cells with rough surfaces (Fig. 3C). The fractured
large cells more than 100 μm in diameter might consist of
a peak centered around 100 μm in the particle size distribu-
tion profile, and the fractured small cells might comprise the
shoulder peak around 20 μm (Fig. 1H). The SEM images of
the endosperm structure of a rice seed transverse section of
Nihonmasari is shown in Fig. 3D. Its surface consisted of
fractured cells showing starch granules and intact cells sur-
rounded by the cell walls. The compound starch granules
consisted of polyhedral single starch granules. The structures
of these seed components were observed in flour no. 2 with
low damaged starch content, but not in flour nos. 6 and 15
with highly damaged starch content. These results indicated
that these structures are broken during milling in flour nos.
6 and 15. Yamauchi et al. (2004) discussed that the specific
loaf volume of bread made from rice flour having smooth
Rice Flour Properties on Loaf Volume 445
e. araki et al.
10 µm
100 µm f
gf
g
C) Rice flour no. 6
A) Rice flour no. 2
a
bc
c
a
d
b
10 µm
100 µm
10 µm
a
d100 µm
h
a
i
D) Rice seed
10 m10 m10 mµ
100 µme
e
B) Rice flour no. 15
Fig. 3. Structures of rice flour particles and grains. A, flour no. 2; B, flour no. 15; C, flour no. 6; D, trans-verse section of a grain variety Nihonmasari. a, Compound starch granule; b, aggregated polyhedral single starch granules; c, smooth surface cells surrounded by the cell wall; d, polyhedral single starch granule; e, ir-regular structure particles without the polyhedral starch structure; f, fractured large cell with a rough surface; g, fractured small cell with a rough surface; h, a intact cell surrounded by the cell wall; i, fractured cells.
446
surface cells was higher than that of Joshinko due to the for-
mation of a good gluten network. Smooth surface cells were
found only in flour with less starch damage. Therefore, par-
ticles with less damage most likely do not disturb the forma-
tion of gluten network.
The pasting properties of flour also affect bread charac-
teristics including the loaf volume of rice flour breads (Nishita
et al., 1976; Nishita and Bean, 1979, 1982; Gujral et al.,
2003) and wheat flour breads (Lee et al., 2001; Morita et al.,
2002). Nishita et al. (1979) reported that soft bread crumbs
were obtained from rice flour with low gelatinization tem-
perature and low final amylograph viscosity upon cooling to
50℃. Since pasting temperature and peak viscosity of the
rice flour with high damaged starch content were lower than
those of flour with low damaged starch content (Naganuma,
2003), the pasting properties should differ among rice flours
having different damaged starch contents. Taken together,
the damaged starch content of rice flour might affect specific
loaf volume through flour pasting properties.
In the present study, it was confirmed that damaged
starch content in rice flour and the profile of particle size dis-
tribution are important factors to obtain higher specific loaf
volume of one-loaf bread in case of the no-time method with
rice flour and wheat gluten. Hence, less damage to starch and
cell structures while lowering the particle size during rice
flour milling process is critical in obtaining better flour for
one-loaf bread making. Our results indicate that measure-
ment of damaged starch content and analysis of particle size
distribution of rice flour are the criteria in improvement of
the milling method and in selection of the rice lines suitable
for rice flour of one-loaf bread making.
Acknowledgements The authors are grateful to Mr. Makoto Taka-
hashi and Dr. Noriyuki Homma (Food Research Center, Niigata
Agricultural Research Institute), and Dr. Seiichiro Isobe of National
Food Research Institute, for their guidance on rice milling, Mr. Akio
Watanabe and Mr. Akihisa Komoto (Namisato Co.) for providing
the rice flours, and Mr. Masaaki Amano (Hohden Industries Co.)
for preparing the rice flours. We are grateful to Dr. Yasuhiro Suzuki
(National Institute of Crop Science) for helpful discussion. We also
wish to thank Ms. Midori Yokoyama for her technical assistance.
This study was supported by a grant from the Japanese Ministry
of Agriculture, Forestry and Fisheries research project “Breeding
and integrated research toward enhancing consumption of domestic
farm products in food service industry: 4. rice”.
ReferencesAmerican Association of Cereal Chemists (1992). Official Methods
of the AACC 8th ed. Method 76-31, The American Association
of Cereal Chemists, St. Paul, MN.
Arisaka, M., Nakamura, K. and Yoshii, Y. (1992a). Production
method of rice flour and its utilization as food. Patent no.,
1866267. (in Japanese).
Arisaka, M., Nakamura, K. and Yoshii, Y. (1992b). Properties of
rice prepared by different milling methods. Denpun Kagaku, 39,
155-163. (in Japanese).
Atwell, W.A. (2001). Wheat and flour testing. In “Wheat Flour”,
The American Association of Cereal Chemists, St. Paul, MN,
Chapters 3 and 4, pp. 27-65.
Egawa, K., Shishido, K. and Nakamura, K. (1995). Fine rice flour,
the producing method, and the processed food using fine rice
flour. Patent no., 2077863. (in Japanese)
Gujral, H.S., Guardiola I., Carbonell J.V. and Rosell C.M. (2003).
Effect of cyclodextrin glycosyl transferase on dough rheology
and bread quality from rice flour. J. Agric. Food Chem., 51,
3814-3818.
Juliano, B.O., Prez, C.M., Blakeney, A.B., Castillo, T., Kongseree,
N., Laignelet, B., Lapis, E.T., Murty, V.V.S., Paule, C.M. and
Webb, B.D. (1981). International cooperative testing on the amy-
lose content of milled rice. Starch/Stärke, 33, 157-162.
Lee, M.-R., Swanson, B.G. and Baik, B.-K. (2001). Influence of
amylose content on properties of wheat starch and breadmaking
quality of starch and gluten blends. Cereal Chem., 78, 701-706.
Lorenz, K. and Saunders, R.M. (1978). Enzyme activities in com-
mercially milled rice. Cereal Chem., 55, 138-140.
Ministry of Agriculture, Forestry and Fisheries (2007). Improve-
ment of the food self-sufficiency ratio and stable food supply, In
“Annual Report on Food, Agriculture and Rural Areas in Japan
FY2006,” ed. Ministry of Agriculture, Forestry and Fisheries, Ja-
pan, Chapter 1, pp. 8-27.
Morita, N., Maeda, T., Miyazaki, M., Yamamori, M., Miura, H. and
Ohtsuka, I. (2002). Effect of substitution of waxy-wheat flour for
common flour on dough and baking properties. Food Sci. Tech-
nol. Res., 8, 119-124.
Naganuma, S. (2003). Effects of granular size of rice powder on
physicochemical and cooking properties. Memoirs of the Faculty
of Education and human Studies Akita University (Natural Sci-
ence), 58, 29-35. (in Japanese)
Nakagahra, M, Nagamine, T. and Okuno, K (1986). Spontaneous
occurrence of low amylose genes and geographical distribution
of amylose content in Asian rice. Rice Genet. Newsl., 3, 46-48.
Nishita, K.D., Roberts, R.L. and Bean, M.M. (1976). Develop-
ment of a yeast-leavened rice-bread formula. Cereal Chem., 53,
626-635.
Nishita, K. and Bean, M.M. (1979). Physicochemical properties of
rice in relation to rice bread. Cereal Chem., 56, 185-189.
Nishita, K. and Bean, M.M. (1982). Grinding methods: Their im-
pact on rice flour property. Cereal Chem., 59, 46-49.
Saitoh, S. (1979). Properties of rice flour and making of rice flour
noodles. Science of Cookery, 12, 74-84. (in Japanese)
Rice Flour Properties on Loaf Volume 447

Takano, H., Koyanagi, Y. and Tanaka, Y. (1980). On the fermenta-
tion properties of wheat flour - yeast dough mixed with rice flour
and its change in sugar content during fermentation. Nippon
Shokuhin Kogyo Gakkaishi, 27, 522-528. (in Japanese).
Takano, H., Toyoshima, H., Koyanagi, Y. and Tanaka, Y. (1986a).
Quality improvement of composite rice-wheat flour bread with
the increase of rice replacement level. Rept. Natl. Food Res. Inst.,
48, 52-62. (in Japanese).
Takano, H., Toyoshima, H., Koyanagi, Y., Watanabe, A. and Tana-
ka, Y. (1986b). Effect on rhelogical properties and bread making
properties of composite rice-wheat flour in relation to the differ-
ence in particle size of the rice flour. Rept. Natl. Food Res. Inst.,
48, 43-51. (in Japanese).
Yamauchi, H., Noda, T., Matsuura-Endo, C., Takigawa, S., Saito,
K., Oda, Y., Funatsuki, W., Iriki, N. and Hashimoto, N. (2004).
Bread-making quality of wheat/rice flour blends. Food Sci. Tech-
nol. Res., 10, 247-253.
e. araki et al.448