Embed Size (px)
Citation preview

FACTA UNIVERSITATIS
Series: Physical Education and Sport Vol. 15, No 3, 2017, pp. 453 - 466
https://doi.org/10.22190/FUPES1703453L
Research article
A PILOT ANALYSIS: CAN THE BULGARIAN SPLIT-SQUAT
POTENTIATE SPRINT ACCELERATION
IN STRENGTH-TRAINED MEN?
UDC 796.012.11
Robert Lockie, Ashley Orjalo, Matthew Moreno
Department of Kinesiology, California State University, Fullerton, Fullerton, USA
Abstract. This study determined whether a five repetition-maximum Bulgarian split-squat
(5RM BSS) could potentiate a 0-5, 0-10, and 0-20 m (meter) sprint performance. Seven men
were assessed in the 5RM BSS (a linear position transducer measured peak power [PP] and
force [PF] for each leg), and completed two post activation potentiation (PAP) sessions. One
session involved a control condition (CC) of 4 minutes (min) rest; the other the 5RM BSS.
Participants were assessed in baseline sprints, and sprints of 15 seconds, 2, 4, 8, 12, and 16
min post-PAP intervention. A repeated measures ANOVA (p < 0.05) calculated significant
changes in sprint times. The best potentiated time for each interval was also compared to the
baseline. Spearman’s correlations (; p < 0.05) calculated relationships between absolute
and relative strength, PP and PF, with percent potentiation in sprint times. The BSS did not
potentiate speed at any time, although there was great individual variation. The best 0-5 m
time was significantly different from the baseline (p = 0.022), with no differences between
PAP conditions. Significant correlations were found between strength and sprint potentiation
at 16 min for the 0-5 m interval, and at 8 min and the best times for the 0-20 m interval ( = -
0.786 to -0.893). There were correlations between PP and PF for each leg with sprint
potentiation from 2-12 min across all intervals ( = -0.786 to -0.964). Stronger individuals
who generate greater PP and PF in a 5RM BSS will be more likely to potentiate 20-m sprint
performance.
Key words: PAP, unilateral strength, peak power, peak force, linear position transducer
Received December 11, 2017 / Accepted January 16, 2018
Corresponding author: Robert George Lockie
California State University, Fullerton Department of Kinesiology 800 N State College Blvd Fullerton,
CA 92831 USA
Phone: +1 657-278-4971 • E-mail: [email protected]
454 R. LOCKIE, A. ORJALO, M. MORENO
INTRODUCTION
Post activation potentiation (PAP), a phenomenon where muscle performance is
augmented due to contraction history, is often a goal in strength and power training
programs (Hodgson, Docherty, & Robbins, 2005; Tillin & Bishop, 2009). Performance
improvements have been associated with an increase in the rate of force development within
the muscles (Hodgson et al., 2005), and most reviews have intimated that there are two
major mechanisms responsible for the PAP effect (Hodgson et al., 2005; Tillin & Bishop,
2009; Wilson et al., 2013). Firstly, there is the phosphorylation of myosin regulatory light
chains that results from the prior muscular contraction, which makes the actin and myosin
more sensitive to Ca2+
(Hodgson et al., 2005; Tillin & Bishop, 2009). The second factor
relates to the increased recruitment of higher order motor units, which theoretically should
result in an increase in fast-twitch muscle fiber contribution to a contraction (Tillin &
Bishop, 2009). The force a muscle can produce following prior contractile activity is a
product of the balance between fatigue and potentiation, which has important implications
for training program design.
Complex training, which involves completing a strength exercise (e.g. a resistance
exercise with a load ≥85% of an individual’s one-repetition maximum [RM]), followed by a
power-based exercise (e.g. a jump), is a method by which coaches can design programs to
encourage PAP in their athletes (Ebben, 2002). Recently, there have been investigations of
complex pairs designed to potentiate the dynamic action of sprinting. However, there have
been conflicting findings as to whether sprint performance can be potentiated by a strength
exercise. Chatzopoulos et al. (2007) reported that 10 repetitions at 90% of 1RM of the back
half-squat led to faster 0-10 m and 0-30 sprint times following 5 minutes (min) recovery in
team sport athletes. Parallel back squats performed with 85% (Rahimi, 2007) and 90-91%
(Bevan et al., 2010; McBride, Nimphius, & Erickson, 2005) of 1RM, improved the 40-m
sprint time after 4 min in soccer players (Rahimi, 2007) and Division III football players
(McBride et al., 2005), and 0-5 m and 0-10 m sprint times when recovery periods were
individualized to find the best potentiated time in professional rugby players (Bevan et al.,
2010). In contrast, Lim & Kong (2013) found that performing a 3RM back squat did not
improve 30-m sprint performance after 4 min in well-trained track and field athletes. Both
McBride et al. (2005) and Crewther et al. (2011) used a 3RM back squat for Division III
football players and rugby players, respectively. The strength exercises did not enhance 0-5
m (Crewther et al., 2011), 0-10 m (Crewther et al., 2011; McBride et al., 2005), or 0-30 m
times (McBride et al., 2005).
One of the potential limiting factors in studies investigating PAP effects upon sprinting
was that the strength exercises used were bilateral (Bevan et al., 2010; Chatzopoulos et al.,
2007; Crewther et al., 2011; Lim & Kong, 2013; McBride et al., 2005; Rahimi, 2007; Yetter
& Moir, 2008). Yetter & Moir (2008) stated that a back squat may not provide a movement-
specific stimulation to the muscles required for sprinting. Sprinting is a cyclic, unilateral
action, where the individual alternates between single-limb support and flight (Lockie et al.,
2013). To run faster, the individual must be able to transfer their general strength to the
sprint step by ensuring that the nervous system can control the augmented force output
(Tsimahidis et al., 2010). This could result in greater force and power generation within the
sprint step, and indeed strength and power training can improve speed (Lockie, Murphy,
Schultz, Knight, & Janse de Jonge, 2012; Speirs, Bennett, Finn, & Turner, 2016). To

A Pilot Analysis: Can the Bulgarian Split-Squat Potentiate Sprint… 455
increase the specificity of resistance training for speed development, it is important to
incorporate unilateral exercises (Lockie et al., 2012; Speirs et al., 2016). One example of a
unilateral strength exercise is the Bulgarian split-squat (BSS), which involves an individual
performing a single-leg squat while the non-working leg is supported on a bench (McCurdy,
Langford, Cline, Doscher, & Hoff, 2004). Due to the specificity of the movement when
compared to the sprint step (Speirs et al., 2016), the BSS could be used to potentiate sprint
performance. However, there is currently no research that has investigated whether a
unilateral strength exercise such as the BSS can potentiate sprint acceleration in trained
individuals.
Therefore, this pilot study investigated whether the BSS can invoke a PAP response
for a 20-m sprint, including the 0-5 m, 0-10 m, and 0-20 m intervals, when compared to a
control condition (CC) of rest in strength-trained men. This study had two goals. The first
goal was to ascertain whether the BSS could potentiate sprint performance from the
immediate completion of the exercise to 16 min post. Secondly, to determine relationships
between absolute and relative strength, as well as peak power (PP) and peak force (PF)
recorded during the BSS, with any PAP effects that resulted from the BSS. It was
hypothesized that the SS would potentiate 20-m sprint performance, and this would occur
within the time frame of 4-8 min for most participants. In addition to this, the relationship
analysis would illustrate that participants who were stronger, and generated greater PP
and PF within the BSS, would experience greater PAP effects when sprinting.
METHODS
Participants
Seven strength-trained males (age = 23.43 ± 1.51 years; height = 1.77 ± 0.05 m; body
mass = 77.76 ± 10.30 kilograms [kg]) were recruited for this pilot analysis. Participants
were required to: be currently involved in strength training (three hours per week); have
a strength training history (≥two times per week) extending over the previous year; be
familiar with the BSS; maintain their normal physical activity and diet for the duration of
the study; and not have any medical conditions compromising study participation. The
methodology was approved by the institutional ethics committee. Participants received an
explanation of the study, including the risks and benefits of participation, and written
informed consent was obtained prior to testing.
Procedures
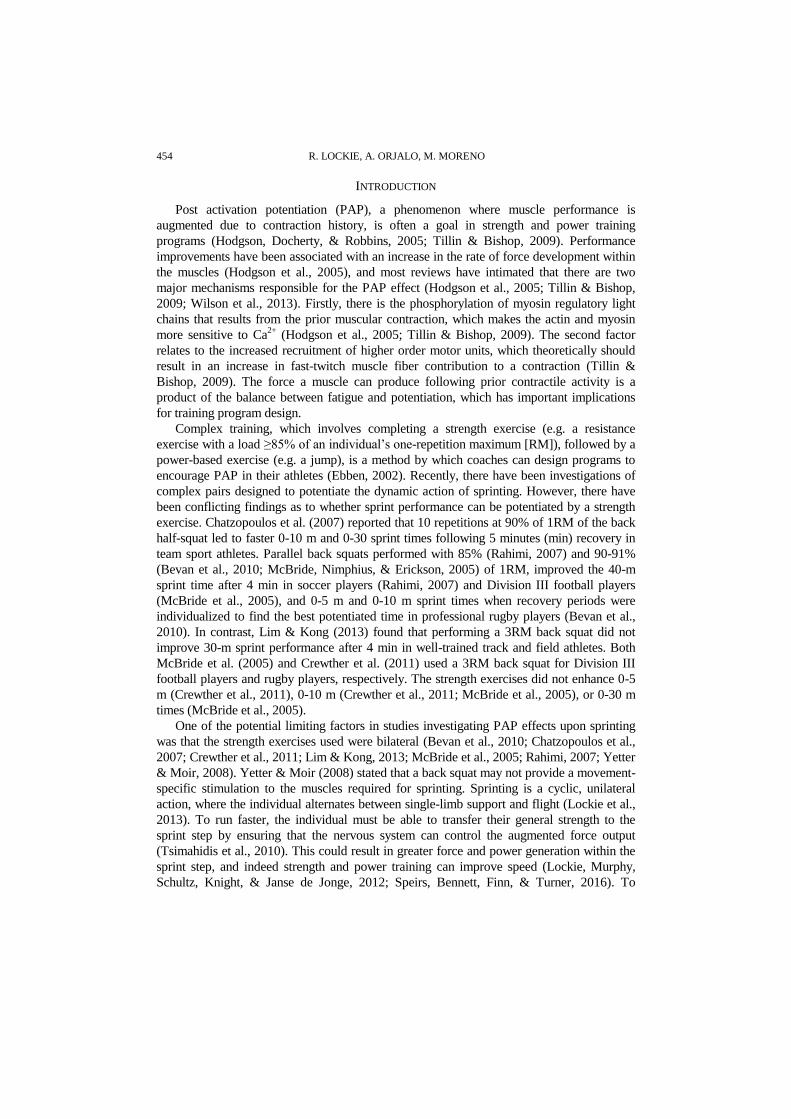
Three testing sessions were used for this study (Figure 1), and all testing was
conducted in a teaching gym at the university. At least 48-72 hours separated each testing
session (Crewther et al., 2011; Lockie et al., 2016; Turner, Bellhouse, Kilduff, & Russell,
2015), which were completed at the same time of day across the sessions for each
participant, depending on their availabilities. Session 1 involved determination of the
5RM for the BSS. The orders of the two PAP testing sessions (CC and SS) were
randomized. At the start of the first testing session, the participant’s age, height, and body
mass were recorded. Height was measured barefoot using a portable stadiometer (seca,
Hamburg, Germany), while body mass was recorded by electronic digital scales (Tanita
456 R. LOCKIE, A. ORJALO, M. MORENO
Corporation, Tokyo, Japan). Each session featured the same dynamic warm-up, which
consisted of 5 min of jogging at a self-selected pace on a treadmill, 10 min of dynamic
stretching, and progressive speed runs (~60%, 70%, 80%, and 90% of perceived maximum)
over 20 m. Next, depending on the session, participants either progressed into strength testing
(session 1), or completed the baseline 20-m sprints (sessions 2 and 3). Participants wore their
own athletic shoes for all the tests. No knee wraps, weightlifting belts, or supportive garments
were permitted during performance of the BSS. In the 24-hour period prior to any session,
participants abstained from intensive exercise.
Fig. 1 Schematic representation of the study design. 1RM: one-repetition maximum.
5RM: five-repetition maximum. PAP: post-activation potentiation
5RM Bulgarian Split-Squat (BSS) Strength Test
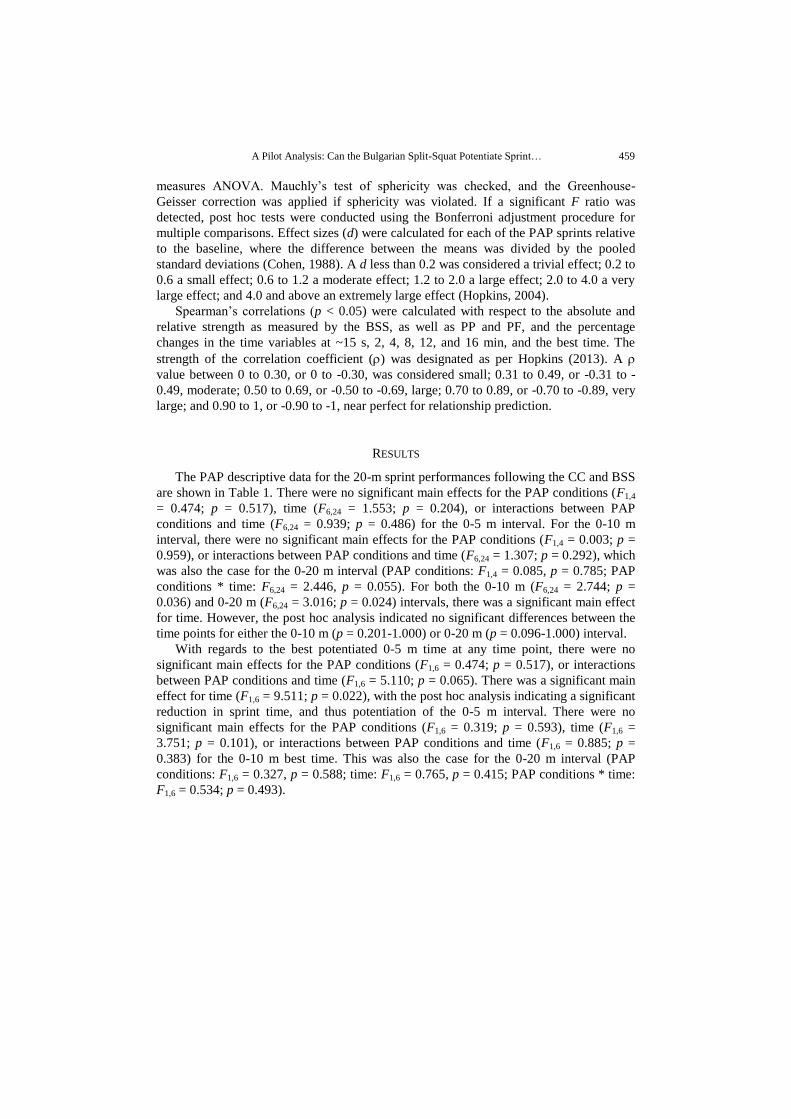
The procedures for the 5RM BSS were adapted from McCurdy et al. (2004), and
performed with an Olympic bar and plates within a power rack (American Barbell, San
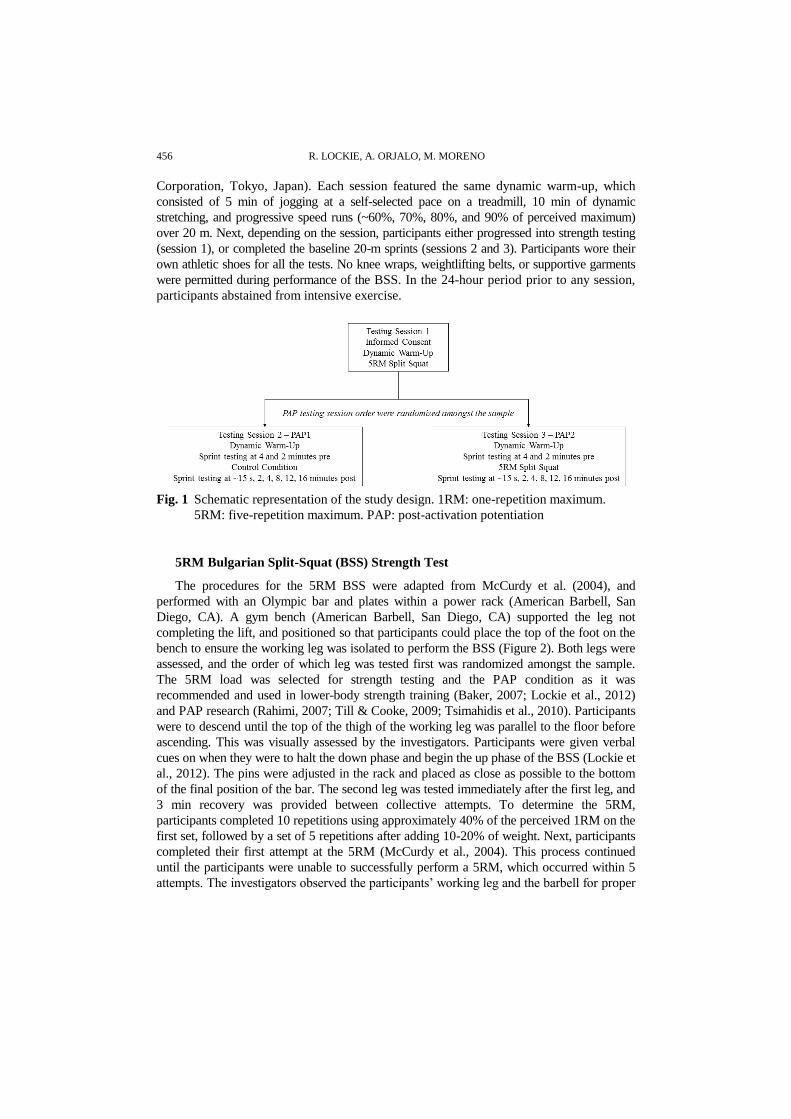
Diego, CA). A gym bench (American Barbell, San Diego, CA) supported the leg not
completing the lift, and positioned so that participants could place the top of the foot on the
bench to ensure the working leg was isolated to perform the BSS (Figure 2). Both legs were
assessed, and the order of which leg was tested first was randomized amongst the sample.
The 5RM load was selected for strength testing and the PAP condition as it was
recommended and used in lower-body strength training (Baker, 2007; Lockie et al., 2012)
and PAP research (Rahimi, 2007; Till & Cooke, 2009; Tsimahidis et al., 2010). Participants
were to descend until the top of the thigh of the working leg was parallel to the floor before
ascending. This was visually assessed by the investigators. Participants were given verbal
cues on when they were to halt the down phase and begin the up phase of the BSS (Lockie et
al., 2012). The pins were adjusted in the rack and placed as close as possible to the bottom
of the final position of the bar. The second leg was tested immediately after the first leg, and
3 min recovery was provided between collective attempts. To determine the 5RM,
participants completed 10 repetitions using approximately 40% of the perceived 1RM on the
first set, followed by a set of 5 repetitions after adding 10-20% of weight. Next, participants
completed their first attempt at the 5RM (McCurdy et al., 2004). This process continued
until the participants were unable to successfully perform a 5RM, which occurred within 5
attempts. The investigators observed the participants’ working leg and the barbell for proper

A Pilot Analysis: Can the Bulgarian Split-Squat Potentiate Sprint… 457
technique (McCurdy et al., 2004). If posterior displacement of the barbell occurred on the
descent with no anterior movement of the knee joint, the lift was determined to be
unsuccessful. Failure to descend to the appropriate position for all repetitions also terminated
the test. The same load was lifted by both legs; failure on one leg resulted in test termination.
The last successful load lifted was taken as the measure of absolute strength. The 5RM BSS
was also ratio scaled relative to body mass via the formula: relative load (kg·BM-1
) = 5RM
BSS∙body mass-1
.
Fig. 2 Start and finish (A) and bottom (B) positions in the Bulgarian split-squat when
performed by the right leg within a power rack
Power and force was measured during the BSS by a GymAware Powertool linear position
transducer (Kinetic Performance Technology, Canberra, Australia). The transducer featured a
spring-loaded retractable cable that passed around a spool integrated with an optical encoder
(Drinkwater, Moore, & Bird, 2012). The external end of the cable was attached on the inside of
the barbell, and the transducer was then placed on the floor directly underneath the bar. The
magnetic bottom was positioned on a weight plate to ensure the unit did not move during the
BSS. The cable provided no resistance to the bar, and the encoder recorded the movement
of the bar for every 3 millimeters of displacement. Barbell and participant mass was
entered into the software so that PP and PF could be calculated. Data for each repetition
was collected and stored on an iPad handheld device (Apple Inc., Cupertino, California),
before being uploaded to an online database. Data was then extracted from this database,
and the mean PP and PF from the 5 repetitions recorded for each leg was used for
analysis.
458 R. LOCKIE, A. ORJALO, M. MORENO
PAP Testing
Following the dynamic warm-up, each PAP session involved the performance of a
single 20-m sprint at 4 min before and 2 min before the strength set (Crewther et al.,
2011; Lockie et al., 2016). These two sprints were averaged and set the baseline for the
sprints following the CC or BSS. Sprint time was recorded to the nearest 0.001 s by a
timing lights system (Fusion Sports, Sumner Park, Australia). Gates were positioned at 0
m, 5 m, 10 m, and 20 m, at a height of 1.2 m and width of 2.5 m, to measure the 0-5 m, 0-
10 m, and 0-20 m intervals. Sprints over 5 m (Crewther et al., 2011; Lockie et al., 2013;
Lockie et al., 2012), 10 m (Crewther et al., 2011; Lockie et al., 2013; Lockie et al., 2012;
McBride et al., 2005), and 20 m (Till & Cooke, 2009) have been used in the assessment
of running speed in male athletes and PAP research. Participants began the sprint from a
standing start 50 centimeters behind the start line to trigger the first gate, and were
instructed to maximally sprint through all gates.
Two min after the second 20-m sprint, participants completed one of two conditions; CC
or BSS (Figure 1). The first session to be completed was randomized. The CC involved the
participant having 4 min recovery in a seated position after the warm-up (Lockie et al., 2016;
Till & Cooke, 2009). The BSS session involved the participant performing this exercise after
the dynamic warm-up. As stated, the 5RM load was selected on the basis of previous
research (Baker, 2007; Lockie et al., 2012; Rahimi, 2007; Till & Cooke, 2009; Tsimahidis et
al., 2010). Further, McBride et al. (2005) stated using intense resistance exercises to
potentiate sprint acceleration performance, while Yetter & Moir (2008) asserted that volume
was more important than the actual load for eliciting a PAP response in maximal sprinting.
Collectively, this led to the adoption of the 5RM load in this study.
After the PAP exercise, participants completed a 20-m sprint at the following time
points: ~15 s, and 2, 4, 8, 12, and 16 min post intervention (Crewther et al., 2011; Lockie
et al., 2016; Turner et al., 2015; Whelan, O'Regan, & Harrison, 2014). A single sprint was
performed at each time interval (Lim & Kong, 2013; Lockie et al., 2016; Rahimi, 2007;
Turner et al., 2015; Whelan et al., 2014). Participants were seated between each trial to
reduce any effects of fatigue (Crewther et al., 2011; Lockie et al., 2016). The participants
were also not informed as to what their preceding sprint times were to eliminate the
influence of feedback. The post-test sprints were also converted to a percentage relative to
the baseline sprints according to the following formula: % Potentiation = Potentiated
Variable (sprint performed at either ~15 s, 2, 4, 8, 12, and 16 min) Unpotentiated
Variable (average baseline sprints) x 100 (Chiu et al., 2003). A percent potentiation of
100% equaled no potentiation; greater than 100% indicated PAP; and less than 100%
showed post-activation depression (i.e. fatigue) (Chiu et al., 2003).
Statistical Analysis
Statistical analyses were processed using the Statistics Package for Social Sciences
(Version 22.0; IBM Corporation, New York, USA). Mean ± standard deviation (SD)
were calculated for each variable, and significance for all analyses was set at p < 0.05. A
repeated measures ANOVA (2 x 7; within-participants’ factors: condition [CC, SS] x time
[baseline, ~15 s, 2, 4, 8, 12, 16 min]) was conducted. Best potentiated sprint times for
each participant, regardless of the time when it was achieved (Bevan et al., 2010), were
also investigated via a 2 (condition: CC, BSS) x 2 (time: baseline, best) repeated
A Pilot Analysis: Can the Bulgarian Split-Squat Potentiate Sprint… 459
measures ANOVA. Mauchly’s test of sphericity was checked, and the Greenhouse-
Geisser correction was applied if sphericity was violated. If a significant F ratio was
detected, post hoc tests were conducted using the Bonferroni adjustment procedure for
multiple comparisons. Effect sizes (d) were calculated for each of the PAP sprints relative
to the baseline, where the difference between the means was divided by the pooled
standard deviations (Cohen, 1988). A d less than 0.2 was considered a trivial effect; 0.2 to
0.6 a small effect; 0.6 to 1.2 a moderate effect; 1.2 to 2.0 a large effect; 2.0 to 4.0 a very
large effect; and 4.0 and above an extremely large effect (Hopkins, 2004).
Spearman’s correlations (p < 0.05) were calculated with respect to the absolute and
relative strength as measured by the BSS, as well as PP and PF, and the percentage
changes in the time variables at ~15 s, 2, 4, 8, 12, and 16 min, and the best time. The
strength of the correlation coefficient () was designated as per Hopkins (2013). A
value between 0 to 0.30, or 0 to -0.30, was considered small; 0.31 to 0.49, or -0.31 to -
0.49, moderate; 0.50 to 0.69, or -0.50 to -0.69, large; 0.70 to 0.89, or -0.70 to -0.89, very
large; and 0.90 to 1, or -0.90 to -1, near perfect for relationship prediction.
RESULTS
The PAP descriptive data for the 20-m sprint performances following the CC and BSS
are shown in Table 1. There were no significant main effects for the PAP conditions (F1,4
= 0.474; p = 0.517), time (F6,24 = 1.553; p = 0.204), or interactions between PAP
conditions and time (F6,24 = 0.939; p = 0.486) for the 0-5 m interval. For the 0-10 m
interval, there were no significant main effects for the PAP conditions (F1,4 = 0.003; p =
0.959), or interactions between PAP conditions and time (F6,24 = 1.307; p = 0.292), which
was also the case for the 0-20 m interval (PAP conditions: F1,4 = 0.085, p = 0.785; PAP
conditions * time: F6,24 = 2.446, p = 0.055). For both the 0-10 m (F6,24 = 2.744; p =
0.036) and 0-20 m (F6,24 = 3.016; p = 0.024) intervals, there was a significant main effect
for time. However, the post hoc analysis indicated no significant differences between the
time points for either the 0-10 m (p = 0.201-1.000) or 0-20 m (p = 0.096-1.000) interval.
With regards to the best potentiated 0-5 m time at any time point, there were no
significant main effects for the PAP conditions (F1,6 = 0.474; p = 0.517), or interactions
between PAP conditions and time (F1,6 = 5.110; p = 0.065). There was a significant main
effect for time (F1,6 = 9.511; p = 0.022), with the post hoc analysis indicating a significant
reduction in sprint time, and thus potentiation of the 0-5 m interval. There were no
significant main effects for the PAP conditions (F1,6 = 0.319; p = 0.593), time (F1,6 =
3.751; p = 0.101), or interactions between PAP conditions and time (F1,6 = 0.885; p =
0.383) for the 0-10 m best time. This was also the case for the 0-20 m interval (PAP
conditions: F1,6 = 0.327, p = 0.588; time: F1,6 = 0.765, p = 0.415; PAP conditions * time:
F1,6 = 0.534; p = 0.493).

460 R. LOCKIE, A. ORJALO, M. MORENO
Table 1 Descriptive data (mean ± SD) and for the 0-5 m, 0-10 m, and 0-20 m intervals in
a 20-m sprint following the CC and BSS PAP conditions. Potentiated intervals
(times lower than the baseline) are highlighted. Effect sizes (d) were calculated
relative to the baseline
CC BSS
Time (s) d Time d
0-5 m
Baseline 1.063 ± 0.057 - 1.074 ± 0.040 -
~15 s 1.087 ± 0.034 -0.51 1.086 ± 0.051 -0.26
2 min 1.088 ± 0.050 -0.47 1.070 ± 0.042 0.10
4 min 1.081 ± 0.060 -0.31 1.085 ± 0.041 -0.27
8 min 1.090 ± 0.033 -0.58 1.075 ± 0.033 -0.03
12 min 1.090 ± 0.047 -0.52 1.092 ± 0.030 -0.51
16 min 1.092 ± 0.039 -0.59 1.067 ± 0.050 0.15
Best 1.060 ± 0.056 0.05 1.060 ± 0.059 0.28
0-10 m
Baseline 1.817 ± 0.068 - 1.817 ± 0.061 -
~15 s 1.845 ± 0.046 -0.48 1.872 ± 0.098 -0.67
2 min 1.841 ± 0.061 -0.37 1.830 ± 0.078 -0.19
4 min 1.830 ± 0.082 -0.17 1.837 ± 0.076 -0.29
8 min 1.834 ± 0.057 -0.27 1.829 ± 0.066 -0.19
12 min 1.846 ± 0.074 -0.41 1.842 ± 0.059 -0.42
16 min 1.845 ± 0.055 -0.45 1.821 ± 0.058 -0.07
Best 1.808 ± 0.073 0.13 1.814 ± 0.082 0.04
0-20 m
Baseline 3.108 ± 0.117 - 3.109 ± 0.101 -
~15 s 3.145 ± 0.103 -0.34 3.293 ± 0.304 -0.81
2 min 3.146 ± 0.091 -0.36 3.136 ± 0.133 -0.23
4 min 3.130 ± 0.136 -0.17 3.143 ± 0.139 -0.28
8 min 3.154 ± 0.111 -0.40 3.136 ± 0.121 -0.24
12 min 3.165 ± 0.122 -0.48 3.151 ± 0.106 -0.41
16 min 3.175 ± 0.117 -0.57 3.143 ± 0.106 -0.33
Best 3.117 ± 0.122 -0.08 3.131 ± 0.146 -0.18
The mean BSS load was 50.41 ± 18.02 kg, which resulted in a mean relative strength
measure of 0.65 ± 0.23 kg·BM-1. Table 2 displays the correlations between 5RM BSS strength
and the potentiated sprint performances. All significant correlations were negative, which
indicated that greater strength was associated with greater sprint potentiation (i.e. a lower
percentage of the baseline). There were significant correlations between absolute and relative
strength (both very large) with the potentiated 0-5 sprint time at 16 min. There were no
significant correlations between strength and 0-10 m time. With regards to the 0-20 m interval,
there was a very large correlation between relative strength and potentiated sprint time at 8 min,
and absolute and relative strength (both very large) with the best potentiated sprint.

A Pilot Analysis: Can the Bulgarian Split-Squat Potentiate Sprint… 461
Table 2 Spearman’s correlations between absolute and relative strength as measured by
the 5RM BSS with percent potentiation during the 0-5 m, 0-10 m, and 0-20 m
intervals in a 20-m sprint at ~15 s-16 min post 5RM BSS performance. A
negative correlation indicates a higher load was associated with a faster time.
Significant correlations are highlighted
Absolute Strength Relative Strength
p p
0-5 m
~15 s 0.429 0.337 0.250 0.429
2 min -0.393 0.383 -0.429 0.337
4 min -0.250 0.589 -0.357 0.432
8 min -0.750 0.052 -0.750 0.052
12 min -0.321 0.482 -0.214 0.645
16 min -0.829 0.042* -0.886 0.019*
Best -0.429 0.337 -0.393 0.383
0-10 m
~15 s -0.071 0.879 -0.214 0.645
2 min -0.679 0.094 -0.679 0.094
4 min -0.571 0.180 -0.714 0.071
8 min -0.714 0.071 -0.714 0.071
12 min -0.571 0.180 -0.500 0.253
16 min -0.257 0.623 -0.371 0.468
Best -0.571 0.180 -0.536 0.215
0-20 m
~15 s -0.179 0.702 -0.393 0.383
2 min -0.500 0.253 -0.607 0.148
4 min -0.393 0.383 -0.393 0.383
8 min -0.750 0.052 -0.786 0.036*
12 min -0.714 0.071 -0.643 0.119
16 min -0.314 0.544 -0.429 0.397
Best -0.786 0.036* -0.893 0.007*
* Significant (p < 0.05) relationship between the two variables
PP for the left and right legs was 939.58 ± 188.50 and 982.46 ± 193.72 watts,
respectively. PF for the left and right legs was 1636.59 ± 280.29 and 1651.72 ± 290.45
newtons, respectively. The correlations between these variables and potentiated sprint
performances are shown in Table 3. All significant correlations were negative, which
indicated that greater PP or PF was associated with greater sprint potentiation. There was a
very large correlation between right-leg PP and the potentiated 0-5 m at 2 min. At 8 min, the
left- (very large) and right-leg (near perfect) PF significantly related to potentiated 0-5 m
time.

462 R. LOCKIE, A. ORJALO, M. MORENO
Table 3 Spearman’s correlations between left- and right-leg mean peak power (PP) and
force (PF) as measured during the 5RM BSS with percent potentiation during the
0-5 m, 0-10 m, and 0-20 m intervals in a 20-m sprint at ~15 s-16 min post 5RM
BSS performance. A negative correlation indicates greater peak power was
associated with a faster time. Significant correlations are highlighted
Left-Leg PP Right-Leg PP Left-Leg PF Right-Leg PF
p p p p
0-5 m
~15 s 0.107 0.819 0.214 0.645 0.500 0.253 0.571 0.180
2 min -0.429 0.337 -0.857 0.014* -0.607 0.148 -0.643 0.119
4 min -0.214 0.645 -0.643 0.119 -0.536 0.215 -0.571 0.180
8 min -0.286 0.535 -0.643 0.119 -0.857 0.014* -0.929 0.003*
12 min -0.107 0.819 -0.571 0.180 -0.643 0.119 -0.679 0.094
16 min 0.086 0.872 -0.200 0.704 -0.486 0.329 -0.600 0.208
Best -0.036 0.939 -0.286 0.535 -0.214 0.645 -0.250 0.589
0-10 m
~15 s 0.000 1.000 0.071 0.879 0.143 0.760 0.179 0.702
2 min -0.786 0.036* -0.964 <0.001* -0.857 0.014* -0.821 0.023*
4 min -0.714 0.071 -0.929 0.003* -0.607 0.148 -0.643 0.119
8 min -0.500 0.253 -0.857 0.14* -0.857 0.014* -0.893 0.007*
12 min -0.071 0.879 -0.571 0.180 -0.714 0.071 -0.821 0.023*
16 min 0.714 0.111 0.371 0.468 0.029 0.957 -0.143 0.787
Best 0.107 0.819 0.000 1.000 -0.143 0.760 -0.214 0.645
0-20 m
~15 s 0.000 1.000 0.036 0.939 0.214 0.645 0.179 0.702
2 min -0.857 0.014* -0.964 <0.001* -0.643 0.119 -0.607 0.148
4 min -0.893 0.007* -0.786 0.036* -0.536 0.215 -0.464 0.294
8 min -0.643 0.119 -0.929 0.003* -0.821 0.023* -0.857 0.014*
12 min -0.107 0.819 -0.536 0.215 -0.714 0.071 -0.857 0.014*
16 min 0.771 0.072 0.314 0.554 -0.086 0.872 -0.314 0.544
Best -0.536 0.215 -0.643 0.119 -0.536 0.215 -0.571 0.180
* Significant (p < 0.05) relationship between the two variables
There were numerous significant relationships between PP and PF with 0-10 m time
(Table 3). At 2 min, PP and PF for both legs significantly correlated with potentiated 0-10
m time, with relationships ranging from very large to near perfect. There was a near
perfect relationship between right-leg PP and 0-10 m time. There were very large
relationships between right-leg PP, and left- and right-leg PF with sprint time at 8 min,
and at 12 min with right-leg PF.
Several significant relationships also existed between PP and PF and 0-20 m time
(Table 3). At 2 min, the left- (very large) and right-leg (near perfect) PP correlated with
potentiated 0-20 m time. PP for both legs had very large relationships with 0-20 m time at
4 min. At 8 min, potentiated 0-20 m sprint time had a near perfect relationship with right-
leg PP, and very large relationships with left- and right-leg PF. At 12 min, there was also
a very large correlation with right-leg PF.
A Pilot Analysis: Can the Bulgarian Split-Squat Potentiate Sprint… 463
DISCUSSION
This was the first study to investigate whether a 5RM BSS can potentiate 0-5 m, 0-10
m, or 0-20 m sprint times in strength-trained men. In contrast to the studies’ hypothesis,
the results indicated that the BSS did not significantly potentiate sprint performance at
any time point from ~15 s to 16 min after the PAP protocol. Several PAP studies have
indicated that certain strength exercises do not cause significant potentiating effects on
sprint performance (Bevan et al., 2010; Crewther et al., 2011; Lim & Kong, 2013;
McBride et al., 2005). However, previous research has also indicated that there can be
large individual variations regarding the magnitude and timing of any PAP effects (Bevan
et al., 2010; Lim & Kong, 2013; Till & Cooke, 2009). This was the case in this pilot
analysis, which likely contributed to the lack of significant differences found in sprint
performance potentiation.
As a result, it is also important to consider where performance may be potentiated for
the individual (i.e. the individual’s best potentiated time point, and thus optimal recovery
time), rather than just considering an overall mean (Nibali, Chapman, Robergs, &
Drinkwater, 2015). As an example of this, Bevan et al. (2010) found that following a
3RM back squat in male rugby players, if the best times were taken regardless of when
they occurred following the PAP protocol, the results showed that 0-5 m and 0-10 m
sprint times were potentiated. The results from the current study showed a tendency for
sprint times to be reduced (i.e. potentiated) for the 0-5 m and 0-10 m intervals; however,
the only significant result was found for the 0-5 m interval. Furthermore, there were no
significant differences between the CC and BSS. The sample size from this pilot study (n
= 7) could have influenced this lack of between-condition difference. Nevertheless, the
BSS could potentiate short sprint performance in select individuals. This potentiation may
not be significantly different to a CC such as 4 min rest, so it is essential for the coach to
monitor individual responses in their athletes. If an individual does respond positively,
then a complex set involving the BSS and a sprint could be incorporated into training.
Several studies have illustrated that stronger participants are more likely to achieve
PAP effects when compared to their weaker counterparts (Chiu et al., 2003; Seitz, de
Villarreal, & Haff, 2014; Suchomel, Sato, DeWeese, Ebben, & Stone, 2016). The results
from this study provided support to these assertions. The potentiation of 0-5 m sprint
performance at 16 min was associated with greater absolute and relative strength. The
best potentiated 0-20 m sprint was also significantly correlated with greater absolute and
relative strength, while potentiation of 0-20 m time at 8 min was correlated with greater
relative strength. However, given the potential importance of strength for the magnitude
and timing of PAP (Chiu et al., 2003; Seitz et al., 2014; Suchomel et al., 2016), it was
somewhat surprising that there were only 5 significant relationships out of 42 correlations
between sprint potentiation and strength. For the BSS, and many exercises used to
develop strength and power, it is not just the load lifted which is important, but how the
load is lifted (i.e. the power and force that is produced) (Harris, Cronin, Taylor, Boris, &
Sheppard, 2010). This was true for this study when investigating the correlations between
BSS PP and PF with the potentiated sprint times.
This is the first study that investigated the relationships between PP and PF measured via a
linear position transducer during an exercise such as the BSS with PAP sprint responses. The
use of a linear position transducer provides practical application for coaches, in that this type of
464 R. LOCKIE, A. ORJALO, M. MORENO
equipment is easy to use and popular in the field (Drinkwater, Galna, McKenna, Hunt, & Pyne,
2007; Harris et al., 2010; Lockie et al., in press). For both the PP and PF correlations, there
were 10 out of 42 significant relationships. Notably, the strength of these correlations were high
(very large to near perfect), and occurred for both legs and at time points ranging from 2-12
min post the BSS PAP intervention, which provided some support to the studies’ hypothesis.
The significant correlations found for both PP and PF at the early time points (i.e. 2-4 min for
each of the intervals) was noteworthy, as stronger individuals can experience potentiation in
power-based exercises sooner following a strength intervention (Seitz et al., 2014; Suchomel et
al., 2016). The muscle fiber characteristics of individuals could contribute to the timing of PAP
responses, and have influenced these results. Following a literature review, Seitz et al. (2014)
discussed that stronger individuals displayed elevated myosin light chain phosphorylation and
tend to have stronger and larger type II muscle fibers. Seitz et al. (2014) further stated that type
II muscle fibers exhibited greater neural excitation in response to strength training exercises (i.e.
the BSS in this study). Taken together, this indicates that those individuals who can generate
greater PP and PF in an exercise such as the 5RM BSS could both potentiate sprint
performance and potentiate sooner following a PAP intervention.
There are certain study limitations that should be noted. Each leg lifted the same load
for the BSS. Potentially, the stronger leg for each participant could have lifted a heavier
load, as the weaker leg dictated test termination. This could have influenced PAP sprint
responses. The sample size for this pilot study was small (n = 7), so future research should
feature a larger sample to confirm the results of this study. The BSS was not compared to
any other exercise. The back squat has been investigated in a range of PAP and sprint
studies (Bevan et al., 2010; Chatzopoulos et al., 2007; Crewther et al., 2011; Lim &
Kong, 2013; McBride et al., 2005; Rahimi, 2007; Yetter & Moir, 2008), thus forthcoming
research should compare the BSS to a bilateral exercise such as the back squat to see if
sprint potentiation differs between the exercises. Only the 5RM BSS load was
investigated in this research. Future studies could investigate both heavier and lighter
loads for the BSS in PAP sprint research.
CONCLUSION
In conclusion, the results indicated that the BSS did not potentiate sprint performance
from ~15 s to 16 min following the intervention when considering the overall mean of the
participants. However, when considering the best potentiated time, there was an
improvement in 0-5 m sprint performance, although this was not significantly different from
the CC. The correlation analyses indicated that stronger individuals could experience
potentiation of 20-m sprint performance. Coaches should monitor PP and PF during a PAP
exercises such as the BSS, rather than just relying on load. This is because the correlation
results indicated that individuals who generated greater PP and PF potentiated 20-m sprint
performance, and potentiated sooner following a 5RM BSS intervention. Future research
should incorporate a greater sample size to confirm some of these findings, as well as
comparing the BSS to other popular PAP strength exercises such as the back squat.
A Pilot Analysis: Can the Bulgarian Split-Squat Potentiate Sprint… 465
Acknowledgement: We would like to acknowledge our participants for their contribution to the study.
This research project received no external financial assistance. None of the authors have any conflict of
interest. Thanks to Alyssa Stage, Tricia Liu, Fabrice Risso, DeShaun Davis, Adrina Lazar, Dominic
Giuliano, Samantha Birmingham-Babauta, Ibett Torne, Megan Beiley, Jillian Hurley, and John Stokes
for assisting with data collection.
REFERENCES
Baker, D. (2007). Cycle-length variants in periodized strength/power training. Strength and Conditioning Journal,
29, 10-17.
Bevan, H. R., Cunningham, D. J., Tooley, E. P., Owen, N. J., Cook, C. J., & Kilduff, L. P. (2010). Influence of
postactivation potentiation on sprinting performance in professional rugby players. Journal of Strength and
Conditioning Research, 24, 701-705.
Chatzopoulos, D. E., Michailidis, C. J., Giannakos, A. K., Alexiou, K. C., Patikas, D. A., Antonopoulos, C. B., &
Kotzamanidis, C. M. (2007). Postactivation potentiation effects after heavy resistance exercise on running
speed. Journal of Strength and Conditioning Research, 21, 1278-1281.
Chiu, L. Z., Fry, A. C., Weiss, L. W., Schilling, B. K., Brown, L. E., & Smith, S. L. (2003). Postactivation
potentiation response in athletic and recreationally trained individuals. Journal of Strength and Conditioning
Research, 17, 671-677.
Cohen, J. (1988). Statistical power analysis for the behavioral sciences (2nd ed.). Hillsdale, New Jersey: Lawrence
Earlbaum Associates.
Crewther, B. T., Kilduff, L. P., Cook, C. J., Middleton, M. K., Bunce, P. J., & Yang, G. Z. (2011). The acute
potentiating effects of back squats on athlete performance. Journal of Strength and Conditioning Research,
25, 3319-3325.
Drinkwater, E. J., Galna, B., McKenna, M. J., Hunt, P. H., & Pyne, D. B. (2007). Validation of an optical encoder
during free weight resistance movements and analysis of bench press sticking point power during fatigue.
Journal of Strength and Conditioning Research, 21, 510-517.
Drinkwater, E. J., Moore, N. R., & Bird, S. P. (2012). Effects of changing from full range of motion to partial range
of motion on squat kinetics. Journal of Strength and Conditioning Research, 26, 890-896.
Ebben, W. P. (2002). Complex training: a brief review. Journal of Sports Science and Medicine, 1, 42-46.
Harris, N. K., Cronin, J., Taylor, K. L., Boris, J., & Sheppard, J. (2010). Understanding position transducer
technology for strength and conditioning practitioners. Strength and Conditioning Journal, 32, 66-79.
Hodgson, M., Docherty, D., & Robbins, D. (2005). Post-activation potentiation: underlying physiology and
implications for motor performance. Sports Medicine, 35, 585-595.
Hopkins, W. G. (2004). How to interpret changes in an athletic performance test. Sportscience, 8, 1-7.
Hopkins, W. G. (2013). A scale of magnitude for effect statistics. Retrieved on May 15, 2016 from the World Wide
Web: www.sportsci.org/resource/stats/index.html.
Lim, J. J., & Kong, P. W. (2013). Effects of isometric and dynamic postactivation potentiation protocols on
maximal sprint performance. Journal of Strength and Conditioning Research, 27, 2730-2736.
Lockie, R., G., Davis, D., L., Giuliano, D., V., Risso, F., G., Orjalo, A., J., Moreno, M., R., & Lazar, A. (2016). A
preliminary case analysis of the post-activation potentiation effects of plyometrics on sprint performance in
women. Sport Science Review, 25, 300-319.
Lockie, R. G., Moreno, M. R., Lazar, A., Risso, F. G., Tomita, T. M., Stage, A. A., Birmingham-Babauta, S. A.,
Torne, I. A., Stokes, J. J., Giuliano, D. V., Davis, D. L., Orjalo, A. J., & Callaghan, S. J. (in press). The one-
repetition maximum mechanics of a high-handle hexagonal bar deadlift compared to a conventional deadlift as
measured by a linear position transducer. Journal of Strength and Conditioning Research.
Lockie, R. G., Murphy, A. J., Schultz, A. B., Jeffriess, M. D., & Callaghan, S. J. (2013). Influence of sprint
acceleration stance kinetics on velocity and step kinematics in field sport athletes. Journal of Strength and
Conditioning Research, 27, 2494-2503.
Lockie, R. G., Murphy, A. J., Schultz, A. B., Knight, T. J., & Janse de Jonge, X. A. K. (2012). The effects of
different speed training protocols on sprint acceleration kinematics and muscle strength and power in field
sport athletes. Journal of Strength and Conditioning Research, 26, 1539-1500.
McBride, J. M., Nimphius, S., & Erickson, T. M. (2005). The acute effects of heavy-load squats and loaded
countermovement jumps on sprint performance. Journal of Strength and Conditioning Research, 19, 893-897.
466 R. LOCKIE, A. ORJALO, M. MORENO
McCurdy, K., Langford, G. A., Cline, A. L., Doscher, M., & Hoff, R. (2004). The reliability of 1- and 3RM tests of
unilateral strength in trained and untrained men and women. Journal of Sports Science and Medicine, 3, 190-196.
Nibali, M. L., Chapman, D. W., Robergs, R. A., & Drinkwater, E. J. (2015). Considerations for determining the
time course of post-activation potentiation. Applied Physiology, Nutrition, and Metabolism, 40, 1163-1170.
Rahimi, R. (2007). The acute effects of heavy versus light-load squats on sprint performance. Facta Universitatis
Series Physical Education and Sport, 5(2), 163-169.
Seitz, L. B., de Villarreal, E. S., & Haff, G. G. (2014). The temporal profile of postactivation potentiation is related
to strength level. Journal of Strength and Conditioning Research, 28, 706-715.
Speirs, D. E., Bennett, M. A., Finn, C. V., & Turner, A. P. (2016). Unilateral vs. bilateral squat training for strength,
sprints, and agility in academy rugby players. Journal of Strength and Conditioning Research, 30, 386-392.
Suchomel, T. J., Sato, K., DeWeese, B. H., Ebben, W. P., & Stone, M. H. (2016). Potentiation following ballistic
and non-ballistic complexes: The effect of strength level. Journal of Strength and Conditioning Research, 30,
1825-1833.
Till, K. A., & Cooke, C. (2009). The effects of postactivation potentiation on sprint and jump performance of male
academy soccer players. Journal of Strength and Conditioning Research, 23, 1960-1967.
Tillin, N. A., & Bishop, D. (2009). Factors modulating post-activation potentiation and its effect on performance of
subsequent explosive activities. Sports Medicine, 39, 147-166.
Tsimahidis, K., Galazoulas, C., Skoufas, D., Papaiakovou, G., Bassa, E., Patikas, D., & Kotzamanidis, C. (2010).
The effect of sprinting after each set of heavy resistance training on the running speed and jumping
performance of young basketball players. Journal of Strength and Conditioning Research, 24, 2102-2108.
Turner, A. P., Bellhouse, S., Kilduff, L. P., & Russell, M. (2015). Postactivation potentiation of sprint acceleration
performance using plyometric exercise. Journal of Strength and Conditioning Research, 29, 343-350.
Whelan, N., O'Regan, C., & Harrison, A. J. (2014). Resisted sprints do not acutely enhance sprinting performance.
Journal of Strength and Conditioning Research, 28, 1858-1866.
Wilson, J. M., Duncan, N. M., Marin, P. J., Brown, L. E., Loenneke, J. P., Wilson, S. M., Jo, E., Lowery, R. P., &
Ugrinowitsch, C. (2013). Meta-analysis of postactivation potentiation and power: effects of conditioning activity,
volume, gender, rest periods, and training status. Journal of Strength and Conditioning Research, 27, 854-859.
Yetter, M., & Moir, G. L. (2008). The acute effects of heavy back and front squats on speed during forty-meter
sprint trials. Journal of Strength and Conditioning Research, 22, 159-165.
PILOT ANALIZA: DA LI BUGARSKI SPLIT-ČUČANJ MOŽE DA
POBOLJŠA UBRZANJE U SPRINTU MEĐU MUŠKARCIMA KOJI
SPROVODE TRENING SNAGE?
U ovom istraživanju ispitivali smo da je da li bi pet ponavljanja bugarskih split-čučnjeva
maksimalnom snagom (5RM BSS) poboljšalo učinak na 0-5, 0-10 i 0-20 m (metar) sprintom. Sedmorica
muškaraca procenjeni su 5RM BSS (transduktor postavljen linearno merio je vrhunac snage [PP] i silu
[PF] za svaku nogu), i završili 2 treninga postaktivacionog poboljšanja (PAP). Jedan trening imao je
kontrolni uslov (CC): odmaranje 4 minuta (min); drugi 5RM BSS. Učesnici su procenjeni u sprintu sa
osnovne linije, i sprintu od 15 sekundi, 2, 4, 8, 12 i 16 min post-CALE intervencije. ANOVAom za
ponovljene mere (p < 0,05) izračunata je značajna promena u sprintu. Najbolje poboljšanje u vremenu za
svaki interval upoređivano je u odnosu na sprint sa osnovne linije. Spirmanovom korelacijom (; p <
0,05) izračunata je relacija između apsolutne i relativne snage, PP i PF, sa procentom poboljšanja u
sprintu. BSS nije doveo do poboljšanja za bilo koji interval, iako je bilo velikih individualnih varijacija.
Najbolji vreme za sprint na 0-5m znatno se razlikuje od onog sa osnovne linije (p = 0.022), ali nema
razlike između PAP uslova. Nije pronađena značajna korelacija između snage i poboljšanja u sprint na
16 min za 0-5 m interval, i za 8 min i najbolja vremena za interval 0-20 m ( =-0.786 do -0.893). Bilo je
korelacija između PP i PF za svaku nogu sa poboljšanjem u sprintu od 2-12 min u svim intervalima (
=-0.786 da-0.964). Jači pojedinci koji ostvaruju veće PP i PF u BSS 5RM će češće imati poboljšanja u
performansi sprinta na 20-m.
Ključne reči: PAP, unilateralna snaga, vrhunac snage, vrhunac sile i transduktor postavljen linearno