Embed Size (px)
Citation preview
2012
Gedeon Richterannual report

Table of Contents
I. Richter – Corporate Review 41. Fact Sheet 52. Financial Highlights 63. Chairman’s Letter to the Shareholders 94. Investor Information 10
a. Share Price and Market Capitalisation 10b. Annual General Meeting 11c. Dividend 11d. Investor Relations Activities 11e. Analysts Providing Coverage 12f. Information Regarding Richter Shares 12
5. Corporate Governance 156. Company’s Boards 177. Risk Management 208. Litigation Proceedings 21
II. Managing Director’s Review 22III. In Transition 26
1. The Pharmaceutical Industry 272. Transition from Regional Midpharma to
Pan-European Specialty Pharma 273. Strategic Focus – Innovation 28
a. Female Healthcare 28b. Original Research – Focus on CNS 31c. Biosimilars 32
IV. Business Review 341. Pharmaceuticals 35
a. Research and Development 35b. Manufacturing and Supply 39c. Products 39d. Sales by Markets 45e. Corporate Social Responsibility 55f. People 57
2. Wholesale and Retail 613. Group Figures 61
a. Business Segment Information 62b. Consolidated Turnover 62c. Key Financial Data 63d. Profit and Loss Items 63e. Balance Sheet Items 66f. Cash Flow 67g. Treasury Policy 67h. Capital Expenditure 68
V. Consolidated Financial Statements 69VI. Appendices 136
Annual Report | Gedeon Richter 2012 | 3

I. Richter – Corporate Review
1. Fact Sheet
ichter Group is active in two major busi-
ness segments, primarily Pharmaceuticals
comprising the research and development,
manufacturing, sales and marketing of
pharmaceutical products, and it is also engaged
in the Wholesale and Retail of these products. In
addition, there is a third group (’Other’) of companies
comprising those members of the Group which
provide auxiliary services to the former segments.
Research, development, manufacturing and
marketing of pharmaceutical products are the core
activities of Richter and in this endeavour the Group
is supported by a number of subsidiaries, joint
ventures and associated companies. Manufacturing
subsidiaries of the Group which operate in
traditional markets together with a broad network
of trading affiliates which ensure a strong market
presence have together created the foundation for
regional leadership and a pan-European presence in
the specialty area of Gynaecology.
Parent Company DataHeadquarters 1103 Budapest, Gyömrői út 19–21., Hungary
Mail address 1475 Budapest, Pf. 27., Hungary
Phone +36 1431 4000
Fax +36 1260 4891
E-mail [email protected]
Website www.richter.hu
Established 1901
Main activity Research, development, manufacturing and
marketing of pharmaceutical products
VAT Number 10484878-2-44
HU 10484878
Share capital HUF 18,637,486,000
Number of shares issued 18,637,486
Auditor PricewaterhouseCoopers Auditing Ltd.
Shares listed at Budapest Stock Exchange ISIN: HU0000067624
Luxembourg Stock Exchange ISIN: US3684672054
GDRs issued by BNY Mellon
GDR / Ordinary share ratio = 1:1
Investor Relations DepartmentAddress 1103 Budapest, Gyömrői út 19–21., Hungary
Mail address 1475 Budapest, Pf. 10., Hungary
Phone +36 1431 5764
Fax +36 1261 2158
E-mail [email protected]
Website www.richter.hu
R
Annual Report | Gedeon Richter 2012 | 5

2. Financial Highlights
Revenues
1,200
1,000
800
600
400
200
0
2008 2009 2010 2011 2012
EUR
m
Revenues
350,000
300,000
250,000
200,000
150,000
100,000
50,000
0
2008 2009 2010 2011 2012
HU
Fm
14
12
10
8
6
4
2
0
2008 2009 2010 2011 2012
Earnings per share*
Note: * Earnings per share calculations were based on the total number of shares issued.
EUR
4,000
3,000
2,000
1,000
0
2008 2009 2010 2011 2012
Earnings per share*
Note: * Earnings per share calculations were based on the total number of shares issued.
HU
F
1,000
800
600
400
200
0
2008 2009 2010 2011 2012
Dividends per ordinary share*
Note: * The amount of 2012 dividend per ordinar y share is HUF 660 as proposed by the Board of Directors.
HU
F
4
3
2
1
0
2008 2009 2010 2011 2012
Dividends per ordinary share
EUR
Consolidated financial highlights
2012 2011 Change 2012 2011 Change
HUFm HUFm % EURm EURm %
Total revenues 326,702 307,868 6.1 1,130.1 1,099.5 2.8
Profit from operations 48,721 60,927 -20.0 168.5 217.6 -22.6
Profit for the year 49,080 49,453 -0.8 169.8 176.6 -3.9
2012 2011 Change 2012 2011 Change
HUF HUF % EUR EUR %
Earnings per share (EPS) (1) 2,643 2,644 0.0 9.14 9.44 -3.2
Dividends per ordinar y shares (2) 660 660 0.0 2.28 2.36 -3.4
Notes: (1) Earnings per share calculations were based on the total number of shares issued. (2) The amount of 2012 dividend per ordinar y share is HUF 660 as proposed by the Board of Directors.
Annual Report | Gedeon Richter 2012 | 76 | Annual Report | Gedeon Richter 2012

3. Chairman’s Letter to the Shareholders
am pleased to present Richter’s Annual Report for 2012, an
eventful year with satisfactory financial and operational results.
The economic and debt crisis in the EU had cast a shadow over the Wes-
tern economies; despite these difficulties Richter’s achievements were
noteworthy:
I am proud to report that Cariprazine is the Company’s first registration
with the U.S. Food and Drug Administration, a discovery made by
Richter researchers. Forest Laboratories, our strategic partner in the
USA, submitted the New Drug Application in November 2012, a major
milestone in the Company’s history.
A further most encouraging development is our target to improve
women’s healthcare; the European Commission granted its marke-
ting approval for ESMYA® in February 2012, an original product for the
treatment of uterine fibroids which was also introduced in a number
of European countries. This development enhances our strategic aim
to become increasingly a specialty Pharma Company with high added
value products.
Significant advances were also recorded in the execution of our
biosimilar strategy during 2012. In April, Richter’s state-of-the-art
mammalian cell manufacturing plant in Debrecen, the second largest
city in Hungary, was officially inaugurated in the presence of Mr Viktor
Orbán, Hungary’s Prime Minister. We expect that the Company will
start to manufacture its first test batches during the second half 2013.
None of the above results would have been possible without the
leadership of Mr Erik Bogsch, the Managing Director, who has been at
the helm of the Company for twenty years, supported by the members
of his Executive team. On behalf of the Board I would like to record our
sincere appreciation for their devoted service, to our employees both
in Hungary and abroad who contributed a great deal for the long-term
success of the Company in the year under review.
I am confident that Richter will continue to strive to create increasing
value for its shareholders.
William de Gelsey KCSG
Chairman
I
William de Gelsey – Chairman
Annual Report | Gedeon Richter 2012 | 9

Richter
FTSE Eurofirst300 Pharmaceuticals& Biotech
FTSE Pharma & Biotech USD
4. Investor Information
a. Share Price and Market Capitalisation
Richter share price on 2 January 2012 was HUF 34,205.
Following local peaks slightly above HUF 39,000 in
February 2012, Richter shares weakened back by June
close to their early January levels. A period of steady
increases was suddenly broken by a fall in mid No-
vember as a result of the exclusion of Richter shares
from the MSCI index which was announced two
weeks in advance of its occurrence. Such a measure
was taken as a result of falling liquidity experienced
in the 12 months preceding the announcement, a
period when a rather stable shareholder base and a
generally decreasing level of transactions recorded at
the Budapest Stock Exchange resulted in the level of
traded Richter shares falling short of the minimum
amounts required. The exclusion from the MSCI
index with effect from 1 December 2012 led to a drop
of 12.6 percent in the share price between 14 and
30 November 2012 and a historic record number of
shares traded was set on the last trading day prior to
the exclusion - more than 1.1 million shares were trad-
ed that day representing 5.9 percent of total shares
outstanding. Richter shares traded at HUF 36,210 on
28 December 2012.
The company’s market capitalisation followed
the performance of its share price on the Budapest
Stock Exchange and by the end of 2012 at
HUF 675 billion reflected a 6.0 percent increase,
in HUF terms when compared to its value recorded
on 31 December 2011. Market capitalisation on 31
December 2012 in Euro terms was EUR 2.3 billion,
14.4 percent above the EUR 2.0 billion amount
recorded on 31 December 2011.
b. Annual General Meeting
The Annual General Meeting is the highest decision-
making body of the Company, comprising all
shareholders.
The Annual General Meeting will be held at 15.00 on
25 April 2013 at Budapest 1143, Stefánia út 34.
c. DividendIn accordance with the dividend policy practised
by the Company, the Board of Directors
recommends the payment of 25 percent of Gedeon
Richter Plc.’s net consolidated profit calculated
according to International Financial Reporting
Standards (IFRS) for 2012.
Dividends approved by the shareholders of Gedeon
Richter Plc. at the Annual General Meeting held on
26 April 2012 totalled HUF 12,211 million (EUR 41.2
million) in respect of 2011. The portion payable in
relation to ordinary shares amounted to HUF 660
per share, 66 percent of the nominal share value.
The record dates for these dividend payments were
announced on 18 May 2012 with payments having
commenced on 18 June 2012.
d. Investor Relations Activities
The Company reports formally to shareholders
four times a year, simultaneously with the an-
nouncement of its quarterly non-audited results
and publishes its Annual Report including audited
financial statements no later than the date of the
Annual General Meeting. The AGM of the Company
takes place in Budapest and formal notification is
sent to shareholders at least 30 days in advance of
the meeting.
Conferences in 2012
Concorde 'One on One Conference' Budapest 4 April, 2012
UBS 'EMEA One on One Conference' London 30 May, 2012
Erste 'Investor Conference' Stegersbach 1 October, 2012
1,000
800
600
400
200
0
2003 2004 2005 2006 2007 2008 2009 2010 2011 2012
Market Capitalisation*
Note: * All data based on year-end prices. Calculations based on the total number of shares issued.
HU
F
Market Capitalisation*
3,500
3,000
2,500
2,000
1,500
1,000
500
0
2003 2004 2005 2006 2007 2008 2009 2010 2011 2012
Note: * All data based on year-end prices. Calculations based on the total number of shares issued. Euro calculations adjusted with HUF/EUR exchange rate.
EUR
125%
120%
115%
110%
105%
100%
95%
90%
02.01.1
2
02.02.12
02.03.12
02.04.12
02.05.12
02.06.12
02.07.1
2
02.08.12
02.09.12
02.10.12
02.12.12
Gedeon Richter share price on the Budapest Stock Exchange compared to BUX and CETOP20 indices
Richter
CETOP20
BUX
125%
120%
115%
110%
105%
100%
95%
90%
04.01.1
2
04.02.12
04.03.12
04.04.12
04.05.12
04.06.12
04.07.1
2
04.08.12
04.09.12
04.10.12
04.11.12
04.12.12
Gedeon Richter share price on the Budapest Stock Exchange compared to BUX and CETOP20 indices
Richter
FTSE Eurofirst300 Pharmaceuticals& Biotech
FTSE Pharma & Biotech USD
02.11.12
Annual Report | Gedeon Richter 2012 | 1110 | Annual Report | Gedeon Richter 2012

At the Meeting a business presentation is made to
shareholders by the Managing Director, and all Direc-
tors are available during the meeting to respond to
questions.
Management, principally the Managing Director and
investor relations staff, maintain a dialogue with
institutional shareholders on Company performance
and objectives through a programme of conferences,
regular meetings, conference calls and investor
roadshows. Representatives of the IR Department of
Gedeon Richter Plc. participated at 3 international
conferences and 5 additional investor roadshows
in 2012. Gedeon Richter’s management also held 24
meetings for approximately 57 fund managers and
analysts at its headquarters where the Company’s
business progress and financial results were
presented. Regular conference calls were organised
during the year, following publication of the
quarterly reports of the Company.
The Company’s website (www.richter.hu) includes
an area which is intended to meet the specific stated
needs of investors, analysts and media concerning
information on Richter’s business operations.
The Company’s Investor Relations Department
at its office in Budapest continues to act as a focal
point for contact with institutional shareholders.
(Email: [email protected]
Phone: +36 1 431 5764)
e. Analysts Providing Coverage
Analysts providing regular coverage about the company during 2012
Bank of America Merrill Lynch Mr Jamie Clark
Concorde Mr Attila Vágó
Credit Suisse Mr Mark Wadley
Deutsche Bank* Mr Gergely Várkonyi
Erste Ms Vladimíra Urbánková
Goldman Sachs Ms Yulia Gerasimova
ING* Mr Luke Poloniecki
Jefferies Mr James Vane-Tempest
KBC Mr Gergely Pálffy
Morgan Stanley Mr Peter Verdult
Raiffeisen Mr Daniel Damaska
Renaissance Capital Ms Natasha Zagvozdina, Ms Ulyana Lenvalskaya
UBS Warburg Mr Guillaume van Renterghem
UniCredit* Ms Adriana Marin
Wood Mr Bram Buring
Note: *discontinued coverage during 2nd half 2012
f. Information Regarding Richter Shares
Shares In IssueThe total number of shares in issue as at 31 December
2012 – 18,637,486 – remained unchanged from the
levels reported as at 31 December 2011.
Treasury Shares
Shares held by the Company in Treasury
31 December, 2012
31 December, 2011
Number 45,336 124,399
Nominal value (HUF '000) 45,336 124,399
Book value (HUF '000) 1,670,893 4,468,276
The number of shares held by the Parent company in
Treasury decreased during 2012.
On 31 December 2012 the Group’s subsidiaries held a
total of 10,550 ordinary Richter shares, unchanged
from their holding on 31 December 2011.
The total number of Company shares at Group level
held in Treasury at 31 December 2012 was 55,886.
The Company purchased 10,000 treasury shares on
the Budapest Stock Exchange during 2012 in addition
to a further 45,102 shares on the OTC market.
Based on a decision of the Board of Directors of
Gedeon Richter Plc., 89,728 shares held by the
Company in Treasury were granted as bonuses
during 2012 to qualified employees participating in
the bonus share programme as well as to members
of staff rendering outstanding performance.
In accordance with a repurchase obligation
stipulated in the programme approved by the
Ministry of Finance related to employee share
bonuses, the Company repurchased 1,244 shares
from employees who resigned from the Parent
company during 2012.
In line with a programme approved by the National
Tax and Customs Authority (NAV) in respect of the
years 2012-2014 related to employee share bonuses,
on 19 December 2012 the Company granted a total
of 45,681 shares in respect of 4,750 of its employees
for 2012. The value of these shares amounted to
HUF 1,642 million. These shares will be deposited
at the employees’ individual securities accounts at
UniCredit Bank Hungary Zrt. until 2 January 2015.
On 2 January 2013, following the expiry of the
lock-up period the Company was able to remove all
restrictions on 38,629 Richter ordinary shares granted
to its employees on 20 December 2010 during the
second year of a three-year programme approved by
the Ministry of Finance in respect of years 2009-2011,
thereby enabling these shares to be traded.
Registered Shareholders Pension Reform and Debt Reduction Fund sold its
approximately 5 percent stake during 2012, while
Investor roadshows in 2012
London 7–10 February, 2012
New York, Boston 7–9 February, 2012
Frankfurt 12 April, 2012
Copenhagen, Stockholm 14–16 May, 2012
London 17–18 September, 2012
Annual Report | Gedeon Richter 2012 | 1312 | Annual Report | Gedeon Richter 2012

67%8%
25%
Detailed ownership structure of the Company as of 31 December 2012
International investors Domestic investors MNV Zrt.
the shares held by the Hungarian State Holding
Company (MNV Zrt.) remained at 25 percent,
approximately the same level as at 31 December
2011. The proportion held by domestic investors
increased slightly to about 8 percent while that of
international investors increased to about 67 percent.
The proportion of treasury shares was approximately
0.3 percent at the end of December 2012.
Data in the table below was compiled based on the
share registry adjusted for information provided by
KELER Zrt. as clearing company, global custodians
and nominees.
Detailed ownership structure as of 31 December 2012
5. Corporate Governance
orporate Governance principles and
practice implemented by the Company are
in accordance both with the guidelines set by the
Budapest Stock Exchange and the directives of the
capital market.
Gedeon Richter’s key principles of Corporate
Governance are to create and maintain satisfactory
dialogue with shareholders so as to enhance
shareholder value, to differentiate the roles and
responsibilities of the Board of Directors, the
Executive Board and the Supervisory Board, and to
operate the Group’s business in compliance with
legal and regulatory requirements and to maintain
the highest ethical standards.
The Annual General Meeting ranks as the highest
decision making body of the Company, and
comprises all shareholders. The Annual General
Meeting decides on the adoption of the annual
financial statements and the appropriation of profit,
the election or removal of members of the Board of
Directors and Supervisory Board, the appointment
of auditors, amendments to the Statutes, changes
in the Company’s share capital and other issues in
its competence. With the exception of cases where
the presence of a larger number of shareholders is
required in order to constitute a quorum, a quorum
of the General Meeting exists if shareholders,
personally or through their representatives,
representing over half of the votes embodied by
voting shares are present at the General Meeting and
have duly evidenced their shareholder representative
status. If the General Meeting has no quorum, the
General Meeting is required to be reconvened.
With the exception of cases where under given
circumstances the presence of a larger number
of shareholders is required in order to constitute
a quorum, the reconvened General Meeting shall
have a quorum for the purpose of considering items
on the agenda of the original General Meeting if
shareholders representing more than 20 percent of
the votes relating to the voting shares issued by the
Company are presented personally or via proxy at the
reconvened General Meeting and their shareholding
or representation right has been duly evidenced.
The Board of Directors is the ultimate decision-
making body of the Company except with respect to
those matters reserved for shareholders. A majority
of Directors of the Board are Non-Executive Directors.
All the non-executive directors are independent of
management and free from any business or other
relationship which could materially interfere with
the exercise of their independent judgment. The
offices of Managing Director and Chairman are
C
Ordinary shareholdings by the members of the Company’s Boards
31 December 2012 31 December 2011
Number of ordinary shares Number of ordinary shares
Board of Directors 6,153 6,660
Supervisory Committee 535 535
Executive Board 10,343 7,924
Total 17,031 15,119
Membership of the Company’s Boards is shown on pages 17-19 of the Annual Report.
Ownership Structure
Ownership Ordinary shares Voting rights Share capital
Number % %
Domestic ownership 6,160,07 7 33.15 33.05
MNV Zrt. (Hungarian State Holding Company) 4,703,921 25.31 25.24
Municipality 107 0.00 0.00
Institutional investors 691,038 3.72 3.71
Retail investors 765,011 4.12 4.10
International ownership 12,392,915 66.70 66.50
Institutional investors 12,278,251 66.08 65.88
out of which Aberdeen Asset Management Plc. 2,372,669 12.7 7 12.73
out of which Skagen Kon-Tiki Verdipapirfond 997,104 5.37 5.35
Retail investors 114,664 0.62 0.62
Treasur y shares * 55.886 0.00 0.30
Undisclosed ownership 28.608 0.15 0.15
Share capital 18,637,486 100.00 100.00
Note: * Treasur y shares include the combined ownership of the parent company and subsidiaries.
Annual Report | Gedeon Richter 2012 | 1514 | Annual Report | Gedeon Richter 2012

held separately. The latter is elected amongst the
non-executive directors. The Board meets regularly,
once a month, throughout the year. According to
the Statutes, it has a formal schedule of matters
reserved to it for decisions. The Board works to an
agreed agenda in reviewing the key activities of the
business and the Company’s long-term strategy.
The Company Secretary is responsible to the Board
and is available to individual Directors in respect of
Board procedures. Board members are elected and
re-elected at the AGM for a maximum term of 5 years.
Two subcommittees of the Board exist which prepare
and submit proposals contributing to the Board’s
decision making process. The subcommittees each
consist of at least three non-executive independent
Board directors.
The Corporate Governance and Nomination
Subcommittee is responsible for considering and
making recommendations to the Board concerning
the appropriate size, functions and needs of the
Board. This responsibility includes establishing
the criteria for Board membership; conducting
appropriate inquiries into the background and
qualifications of possible candidates; considering
matters of corporate governance and reviewing
periodically our Corporate Governance Principles.
The Compensation Subcommittee is responsible
for establishing annual and long-term perfor-
mance goals and objectives for elected officers. This
responsibility includes making recommendations to
the Board of Directors with respect to cash-based
incentive compensation plans and equity-based
compensation plans; and preparing proposals for the
compensation of the Managing Director.
The Executive Board is responsible for the executive
management of the Company’s business. The
Executive Board is chaired by the Managing Director.
In order to maintain a sharp focus on strategic ma-
nagement the board comprises only the Executive
Directors.
Overseeing the management of the Company is
the Supervisory Board. It meets every month during
the year in accordance with legal requirements
and at other times when necessary to consider
details of the Company’s operating activities. It
submits proposals to the Board of Directors and
discusses the Company’s strategy, financial results,
investment policy and systems of internal audit
and control. The Supervisory Board is provided
with regular and detailed information about the
management of the Company. The Chairman of
the Supervisory Board may attend meetings of the
Board of Directors as an advisor. The members of the
Supervisory Board are elected or re-elected at the
AGM for a maximum term of 3 years.
The Audit Board is responsible for the oversight of
the Company’s internal accounting standards. The
Board consists three independent members of the
Supervisory Board who are elected at the AGM.
6. Company’s Boards
Board of Directors
Mr William de Gelsey (1921) Senior adviser to CA IB Corporate Finance Limited,
Member of UniCredit Markets & Investment Bank-
ing Division Vienna, London and Budapest. More
than 50 years of international investment banking
experience. Has significant banking experience in
Hungary. A graduate of Trinity College, Cambridge.
Joined the Board in 1995. Chairman since 1999.
Mr Erik Bogsch (1947) Appointed Managing Director in 1992. Chemical
engineer, qualified economic engineer. With
Richter since 1970 in a number of Research and
Development management positions. Medimpex
director in Mexico from 1977 to 1983. Managing
Director of Medimpex UK from 1988 to 1992. Member
of the Board of MAGYOSZ, Chairman from 2006.
Dr Gábor Gulácsi (1958)Appointed Deputy Managing Director upon
joining the Company in 2000. Responsible for
Finance. Economist, University doctorate in
Economic Sciences. Previously General Secretary
of State, Ministry of Economic Affairs. Joined the
Board in 2010.
Mr Gergely Horváth (1961)Managing Director of Hungarian State Holding
Company between 2010 and end of 2012. Graduated
from Budapest University of Technology, then
studied for a degree in engineering economics as
well as an MBA. In a number of significant positions,
mostly in banking. CEO of KELER Zrt. for six years.
Joined the Board in 2011.
Dr Jenő Koltay (1944) PhD in Economics. Between 1991 and 2004
Director of the Institute of Economics of the
Hungarian Academy of Sciences, currently head
of the Public Economics research programme.
Visiting professor at the Sorbonne during 1994-1997,
Széchenyi professor of ELTE during 2000-2003,
currently teaching at the Pannon University.
Joined the Board in 1998.
Dr László Kovács (1944)Strategic adviser to Gedeon Richter Plc. Previously
Deputy Managing Director with responsibility
for Commerce and Marketing from 1990 to 2005.
Economist, University doctorate in Economic
Sciences. Formerly with Medimpex from 1966 to
1990, Secretary of the Commercial Section of the
Hungarian Embassy in São Paulo, Brazil, 1975 to 1978.
Joined the Board in 1992.
Mr Csaba Lantos (1962)Economist and sociologist. From 2000 to 2007
deputy CEO and member of the Board of Directors of
OTP Bank Nyrt. Chairman of the Board of Directors
of KELER Zrt since 1993, and from 2005 to May 2011
chairman of the Supervisory Committee of Budapest
Stock Exchange. From December 2009, chairman of
the Board of MOL Energy Trade Ltd. Joined the Board
of Richter in 2010.
Mr Christopher William Long (1938)Career diplomat. Experience in the full range of
dip lo matic work including management,
personnel, political and economic analysis.
British Ambassador to Hungary from 1995 to 1998.
Joined the Board in 1998.
Dr Tamás Mészáros (1946)Candidate of Economic Sciences, doctor
representative of the Hungarian Academy of
Annual Report | Gedeon Richter 2012 | 1716 | Annual Report | Gedeon Richter 2012

Dr Zsolt Szombathelyi (1957) Appointed Research Director in 2000. Physician,
graduated from the Semmelweis Medical University.
With Richter since 1981 in a number of management
positions. Director of the Representative Office of
Medimpex Japan Co. Ltd. in Tokyo from 1993 to 1998.
Dr György Thaler (1959)Appointed Development Director in 1993. Chemical
engineer, University doctorate in Chemical Sciences.
With Richter since 1983 in a number of management
positions.
Supervisory Board
Dr Attila Chikán (1944)Professor of the Corvinus University of Budapest,
Business Economics Department. Manager of the
Competitiveness Research Centre, doctor of the
Hungarian Academy of Sciences. Between 2000 and
2003 Rector of the Budapest University of Economics
and Public Administration. From 1998 to 1999
Minister of Economy. Chairman of the Supervisory
Board since 2000. Member, Chairman of Audit Board.
Dr Jonathán Róbert Bedros (1961)Physician, health economist, honorary associate pro-
fessor. Graduate of Semmelweis Medical University.
Head physician and general director of the Ministry
of Interior’s Central Hospital and Institutions
from 1999 to 2005, and of Pest County Flór Ferenc
Hospital from 2006 to 2011. Currently head physician
and general director of Szent Imre Hospital. Joined
the Board in 2012. Member of the Audit Board.
Mr Jenő Fodor (1958) Employee representative. MA in Chemical-
mechanics. With Richter since 1984, Head of
Investment at Dorog Site. Joined the Board in 2006.
Mrs Tamásné Méhész (1948)Chartered accountant, qualified tax expert. Also a
certified public accountant. Managing director and
owner of S&M Economix Ltd. Registered auditor of
various companies. Joined the Board in 2012. Member
of the Audit Board.
Mr Gábor Tóth (1955) Employee representative. Chemical engineer,
economic engineer. With Richter since 1980,
currently responsible for administration of the share
register and representing the Company at the Buda-
pest Stock Exchange (BSE). Joined the Board in 1990.
Changes to Boards during 2012
At the Annual General Meeting on 26 April 2012,
the following were appointed as members of the
Supervisory Board for a 3 year period until the 2015
AGM:
Dr Attila Chikán (reappointed)
Dr Jonathán Róbert Bedros
Mrs Tamásné Méhész
Mr Gábor Tóth (reappointed employee
representative)
Mr Jenő Fodor (reappointed employee
representative)
Dr Attila Chikán was reelected as Chairman of the
Supervisory Board.
The Annual General Meeting approved the election of
Dr Attila Chikán, Dr Jonathán Róbert Bedros and Mrs
Tamásné Méhész as members of the Audit Board for
a 3 year period until the 2015 AGM.
Sciences. Rector of the Budapest Corvinus University
between 2004 and 2011. President of the Board of
Directors of the Hungarian Privatisation and State
Holding Company between 2002 and 2006. Joined
the Board in 2006.
Dr Gábor Perjés (1941)Medical doctor, urologist, nephrologist. Assistant at
the Postgraduate Medical School between 1966–1970.
Member of Parliament from 1990 to 1994. Currently
practising as a physician, head of department with
Gyógyír XI. Public Company responsible for medical
services in district XI of Budapest. Has been a
member of the Board since 1992.
Prof Dr Szilveszter E. Vizi (1936)Medical doctor, academician. Graduated from Sem-
melweis University of Medicine. From 1989 to 2002
Director of the Institute of Experimental Medicine
(IEM) of the Hungarian Academy of Sciences.
President of the Hungarian Academy of Sciences
between 2002 and 2008. Currently a researcher at
the IEM. Joined the Board in 2008.
Executive Board
Mr Erik Bogsch (1947) Appointed Managing Director in 1992. Chemical
engineer, qualified economic engineer. With Richter
since 1970 in a number of Research and Development
management positions. Medimpex Director in
Mexico from 1977 to 1983. Managing Director of Me-
dimpex UK from 1988 to 1992. Member of the Board of
MAGYOSZ, Chairman from 2006.
Dr Gábor Gulácsi (1958) Appointed Deputy Managing Director upon joining
the Company in 2000. Responsible for Finance. Eco-
nomist, University doctorate in Economic Sciences.
Previously General Secretary of State, Ministry of
Economic Affairs.
Mr Lajos Kovács (1960) Appointed Director in 2005. Responsible for
Technical services. Chemical engineer, with
postgraduate degree in pharmaceutical research.
With Richter since 1984 in a number of different roles.
Research fellow at the University of Liverpool (UK)
between 1987 and 1989.
Mr Sándor Kováts (1960)Appointed Director in 2006. Responsible for
Commercial Operations. Chemical engineer
specialised in refined chemistry. Joined Richter in 1984
and has held a number of management positions
including Director responsible for Technical Services
at Gedeon Richter USA Inc. during 2001-2002.
Mr András Radó (1954) Appointed Director in 1995. Responsible for
Production and Logistics. Deputy Managing Director
since 2000. Chemical engineer, economic engineer.
With Richter since 1979 in a number of management
positions.
Annual Report | Gedeon Richter 2012 | 1918 | Annual Report | Gedeon Richter 2012

7. Risk Managementichter is committed to creating long-term
value for its customers, shareholders,
employees and society at large. To achieve its
corporate goals, the Company recognizes that risks
are an integral part of its business and can feature
opportunities, as well as threats and losses.
The effective management of risks plays an
important role in the continued growth and success
of Richter. The objective of risk management at
Richter is not to eliminate risks, but rather to
manage them in a way so as to provide that they
remain within the predefined limits necessary for
the Company to achieve its business objectives. Risk
management at Richter is therefore about finding
the right balance between risks and opportunities.
By understanding and managing risk we endeavour
to provide greater certainty for our shareholders, our
employees, our customers and suppliers, and the
communities in which we operate.
Richter views risk management as one of the tools
for effective Corporate Governance. Our approach is
to ensure that risks are identified in a timely manner,
adequately understood, properly assessed and
efficiently responded to by the Company.
Our risk management approach involves the
following aspects:
‒ A risk management process that provides insight
to the risks that the company faces
‒ A common risk language encompassing strategic,
operational, compliance and financial risks to
fa cilitate communications and decision-taking on
risks
‒ Respect of risk attitude
‒ Periodic management review process to update
the risk profile and monitor the effectiveness of
risk management and internal controls
‒ Accountability and governance structure in
relation to risk management.
As part of a company-level risk assessment, relevant
strategic, operational, compliance and financial risks
have been identified, and evaluated by the mana-
gement of the Company. The following risks proved
to be the most typical in each category during the
assessment.
1. Strategic risks
Description Key risk management methods
Healthcare Budget The potential impact on the Company of changes and monetary restrictions in healthcare budget and regulation
• Regular analysis of market environment, monitoring changes in the legal and pharmaceutical reimbursement system
• Communication with authorities• Adaptation in cost management
Competition and Pricing The impact on the Company’s market position and results of increasing generic competition and the decreasing prices in the competitive market
• Identifying competitive advantages• Focusing on new original and value added
products• Introducing new generic products• Competitor-, industry- and effectiveness
analyses performed regularly
Macroeconomic Factors Risk of changes in macroeconomic factors affecting the Company’s markets, and espe-cially the impacts of the financial crisis
• Monitoring changes in major macroeconomic factors, incorporating their effects into the planning
• Adaptation in cost management and customer relations
2. Operational risks
Description Key risk management methods
Original and Biosimilar R&D Risk relating to the success of original research activities and biosimilar development
• Focusing original R&D activity on CNS and Female Healthcare
• Assessment of milestones related to original and biosimilar R&D activity
• Assessment of programs and decision- making within the Research Council
Specialised Sales Force in Western Europe
Risks relating to the setup of a Western Euro-pean sales force specialised in the promotion and marketing of our gynaecological products
• Company scale projects to take over the acquired Female Healthcare portfolio and to co-ordinate the launch of ESMYA®
• Setting up a new unit to manage the promotion of Female Healthcare portfolio
Qualified Workforce Risk relating to retention of employees in key positions and ensuring a qualified workforce
• Periodic revision of the HR strategy• Training plans, carrier and succession
programs• Incentive and performance assessment
system
3. Compliance risks
Description Key risk management methods
Health Authority Regulations, Quality Requirements, Quality Assurance
Risk of compliance with Authority’s regulations
• Implementing Quality systems and Standard Operational Processes (SOP)
• Monitoring compliance with health authority regulations
Intellectual Property, Patents and Litigations
Risk relating to patents and intellectual property rights
• Continuous assessment and monitoring of intellectual property and patents
• Enforcement of intellectual property rights• Risk minimising agreements
Contracts and Liabilities Risk relating to managing contractual liabilities and enforcing contractual terms
• Centralised contracting processes• Special treatment of unique contracts
4. Financial risks
Description Key risk management methods
Credit and Collections Risk relating to cash and receivables collection procedures
• Customer rating• Establishing payment terms and credit
limits• Regular review of receivables• Insurance at MEHIB on customer credits in
the case of countries within the CIS region
Foreign Exchange Rate Unfavorable changes in the exchange rate of the Company’s key foreign currencies
• Monitoring annual open FX positions and selected exchange rates
• Natural hedging provided by FX loans
Capital Structure and Cash Management
Risk relating to the effective management of the Company’s cash demands and cash assets
• Developing and monitoring cash-flow plans• Contracting loans in order to improve
financing capabilities• Establishing common regulation for
financial investments at Group level
8. Litigation Proceedings
here were no litigation proceedings in place
which would materially impact the business
of Gedeon Richter during 2012.
R
T
Annual Report | Gedeon Richter 2012 | 2120 | Annual Report | Gedeon Richter 2012

II. Managing Director’s Review
n the face of sustained pressure on the
business, 2012 was a year in which Richter
made substantial progress in executing its strategic
initiatives.
Our Group reported HUF 326,702 million (EUR 1,130.1
million) consolidated sales in 2012, which represented
6 percent growth (3 percent in Euro terms), when
compared with 2011. Profit after taxation decreased
by 1 percent (by 4 percent in EUR terms) in 2012 to a
total of HUF 49,080 million (EUR 169.8 million). In
our core activity, the pharmaceutical business, the
following results were recorded during 2012:
A good 7 percent sales increase in EUR terms was
reported in Russia. During the year the stabilizing
rouble/euro exchange rate and the increasing
crude oil revenue created a predictable political and
economic environment. In Ukraine a substantial
22 percent increase in US$ terms in our sales was
recorded primarily related to efficient promotional
activity. Despite strong competition and sustained
pressure from governments which resulted in both
price erosion and lower reimbursement levels in al-
most all EU countries our Group reported a moderate
5 percent sales growth in EUR terms compared to
2011. In the USA, a 30 percent revenue decrease in
US$ terms was primarily due to an expected decline
in the contribution from the profit sharing agreement
related to drospirenone with Teva-Barr combined
with erosion in sales of APIs. Due to a difficult
macroeconomic environment pharmaceutical mar-
ket conditions in Hungary remained unfavourable
throughout 2012. We reported a 14 percent decline in
HUF terms on the Company’s domestic market.
Substantial healthcare budget constraints were
evident throughout the year with increasing pricing
pressure on almost all of our markets in Europe. We
continued to progress our medium to long term
strategic objectives during 2012, namely to become
a specialty pharma company and in turn to increase
the proportion of high added value products within
our Company’s portfolio.
One of our key specialty areas is Female Healthcare,
where we provide one of the widest ranges of
products available to women of all age groups.
Gynaecological products represented 33 percent of
our total consolidated turnover in 2012.
Following the receipt of the marketing authorization
to ESMYA® 5mg tablet as pre-operative treatment
of moderate to severe symptoms of uterine fibroids
which has been granted by the European Commis-
sion (EC) in February 2012 we gradually started to
launch the product across Europe depending on the
status of the reimbursement and price negotiations.
ESMYA® was subsequently launched in mid March
2012 in Germany and in the UK. In both countries
ESMYA® was included in the reimbursement lists.
Reimbursed status was granted in Austria and in
Denmark during October 2012, in Norway in Novem-
ber 2012 and also in Sweden during February 2013. In
Spain, in Italy and in France such negotiations were
commenced with the competent authorities.
ESMYA® was also introduced in Poland, in Hungary,
in the Czech Republic in the second quarter 2012 and
in the Baltic States, in Bulgaria, in Romania and in
Slovakia in the third quarter 2012. Reimbursement
status was granted in Slovakia with effect from 1
January 2013 and also in Hungary in February 2013.
ESMYA® reported total sales of EUR 3.6 million
at the end of 2012. Turnover recorded in Germany
contributed the most to the achieved sales levels.
The slower than expected pickup in sales was
mostly related to the reluctance of major
Mediterranean countries to grant to ESMYA®
a reimbursement status.
In order to expand the indication to meet the needs
of a wider range of affected women Richter initiated
Phase III clinical studies at the beginning of the third
quarter 2012 to establish the long term (on-off )
usage of ESMYA® targeting a substantial recession
of fibroid tumors consequently making surgical
interventions unnecessary. The studies are expected
to be completed by second quarter 2014.
Innovation is a key element in our strategy, as it en-
sures our Company’s future in the long run. Therefore
I personally pay particular attention to the environ-
ment in which our R&D team operates. I make every
effort possible both to create an encouraging atmos-
phere and also to maintain strict scientific criteria in
order to sustain projects with only the highest quality
of science, which together enhances our chances of
future success and productivity.
I am very pleased to report that in February 2012
jointly with our US based partner, Forest Laborato-
ries we announced positive top-line results in Phase
III clinical trials of cariprazine for both the treatment
I
Erik Bogsch – Managing Director
Annual Report | Gedeon Richter 2012 | 23

of acute exacerbation of schizophrenia and bipolar
disorder. Consequently Forest submitted a New
Drug Application (NDA) to the U.S. Food and Drug
Administration (FDA) for cariprazine for both indica-
tions in November 2012. The regulatory procedure is
expected to take approximately twelve months. It is
indeed very encouraging that we may offer promis-
ing treatment options for both conditions.
I am convinced that a pharmaceutical company,
which aims to remain competitive over the long
term, should create a portfolio containing high
added value products. Exploration into new
innovative areas, such as original research activity
or biosimilar product development, carries high risks
but provide opportunities for future relatively high
revenue.
The significance of biotechnology products contin-
ues unabated in the global pharmaceutical market.
Twenty-eight percent of the products given market-
ing authorisation between November 2010 and
October 2011 in the USA and one-third of all the new
drugs in the European Union are of biotechnological
origin. Experts unanimously agree that the market
share of biotechnology products will continue to
grow in the future. While the small-molecule drug
market is estimated to grow by 4 percent annually
between now and 2015, the market for biotechnol-
ogy products is expected to grow by more than 10
percent a year. The trend is further bolstered by the
fact that approximately one-third of the current clini-
cal development topics are of biotechnological origin.
We made further progress during the year in
establishing a strong biological product line. Our
new HUF 25 billion Biotechnology Plant built in
Debrecen has been inaugurated by Hungarian Prime
Minister, Mr Viktor Orbán on 19 April 2012, which in
turn shows the significance and the advantage of
our investments from the standpoint of the Nati-
onal Economy. It can be stated that the complete
infrastructure has been shaped, as we, jointly with
Helm AG, established the Hamburg based Richter-
Helm Biologics which carries out development and
manufacturing of microbial proteins while the new
state of art facility enables us to produce the most
complex mammalian cell products.
I am pleased to report that on 2 November 2012,
a strategic cooperation agreement between the
Hungarian Government and Gedeon Richter was
signed by the Hungarian Prime Minister Viktor Orbán
and myself. The established partnership involves
the Government using the means at its disposal to
encourage Richter’s innovation and development
activities with particular regard to the development
and manufacture of biotechnology products, while
Richter will strive to increase its manufacturing and
research and development activities in Hungary.
The general purpose of this agreement was to help
Richter retain its independence so that the strategic
decisions concerning the company’s development,
which also support the development of Hungary’s
national economy, will continue to be made in
Hungary.
We are in a transition period, changing our business
model substantially, which is to create opportunities
for us to remain competitive in the long run. But it
also triggers significant burdens and carries high
risks, that is the significant increase in the level of
operating expenses, primarily Sales and Marketing
costs and Research and Development costs. We
consider this trend as a short terms sacrifice for the
medium-long term success, whereby our strategic
projects really start to bear fruits and deliver growth
both at the top and the bottom lines. I personally
appreciate our shareholders patience and their trust
which enables us to proceed on our way of executing
our strategy.
I would like to take this opportunity to thank
all employees for their dedication and tireless
commitment, which helped us in 2012 to generate
good results and allowed us to make progress in our
key strategic initiatives, despite the unfavourable
pitfalls of the global financial and economic crisis.
We will continue to do everything we can in 2013
to consistently focus our efforts on the needs of
patients around the world, and I am confident that
this will enable us to generate strong, sustainable
results over the long term.
Erik Bogsch
Managing Director
24 | Annual Report | Gedeon Richter 2012

III. In Transition
1. The Pharmaceutical Industry
he steady growth experienced by the pharma-
ceutical industry over the past few decades
was brought to an abrupt end when the financial
crisis suddenly erupted in mid 2008. The increasing
instability of the financial institutions soon enough
infected entire economies. In addition, the well
known issue of drying out the pipelines resulted in
disturbing volatility for the pharmaceutical industry
with a sound defensive reputation among investors.
Industry related problems which accumulated
slowly during the past decades suddenly broke out.
Issues like lengthy product development, increasing
regulatory hurdles and exposure to constraints
of national healthcare budgets underlined the
vulnerability of the pharmaceutical business.
Most of the generic companies which found
themselves in the double constraints of increasing
peer competition and a restrictive (national)
budgetary environment were to select strategies to
secure their future presence on the pharmaceutical
market. They could get either global and protect
margins through improving economies of scale or
get special and protect margins by implementing a
complex business model.
Richter having preserved its original research over
the past century and having invested significant
resources in building up one of the widest female
healthcare portfolio worldwide was a natural
candidate for the latter strategy, i.e. go specialised.
2. Transition from Regional Midpharma to Pan-European Specialty Pharma
ollowing the Russian financial crisis in 1998
Richter decided to balance its geographic
exposure and the USA business was scaled up
initially by signing a strategic agreement with
Duramed, later revised and extended both in scope
and in duration with Barr, acquirer of Duramed. The
arrangements focusing on Richter’s niche specialty
area, Female Healthcare, presented a concentration
of the business from a therapeutic point of view,
with a dilution of excessive dependency from a
geographic point of view. Following recent negative
developments experienced at our USA business
Richter has repeated the same scenario, which has
proven to be successful in the past decade, having
acquired a divested OC portfolio and a novel original
drug being on the verge of European authorization
Richter has moved into Western European markets
with one, carefully selected therapeutic area -
Female Healthcare.
Thus from a regional point of view Richter is on
track to become a Pan-European pharmaceutical
company. From the point of view of therapeutic
areas represented on each of the sub-regions we can
state that Female Healthcare has a strong presence
also in Western Europe as well as in Central and
Eastern Europe and the CIS region. Gynaecological
sales are complemented with more generic sales in
the growing CIS region while more specialty sales
(cariprazine, biosimilars) are expected to add value to
Western European sales in the medium to long term.
It is our endeavour within the next five to ten years
to establish our presence in such fast growing
regions as Latin America or China. This strategy is
being carried out purposefully having announced
in February 2013 that Richter will increase its
direct Chinese presence by establishing a majority
stakeholding in a JV making the distribution of
prescription drugs on the local market besides
existing JV selling oral and emergency contraceptives.
T
F
Annual Report | Gedeon Richter 2012 | 27

3. Strategic Focus – Innovation
ll our activities are connected by one key
word: innovation. One can only successfully
adapt to the rapidly changing domestic and
international environment if innovation is placed
at the very heart of all of Group activities. All three
specialty businesses Richter is engaged to require
significant amounts.
a. Female HealthcareOne of Richter’s most important niche areas is its
gynaecological business. The Company has unique
and long-term experience in this field dating back to
when its founder, Mr. Gedeon Richter, a pharmacist
started to research steroids. This was at a time when
they had complete novelty. Since then the Company
has consistently utilised its pharmaceutical
manufacturing facilities to undertake the required
complex and lengthy development processes which
result in high quality gynaecological products.
Currently, Richter makes available one of the world’s
widest range of female healthcare products while
still continuing to broaden its product portfolio.
A key element of the Company’s strategy has been
and remains the development of its gynaecological
business.
In accordance with this strategy two acquisitions
were concluded during 2010, both of which further
strengthened the female healthcare portfolio. The
acquisition of PregLem created a platform for Richter
to develop a new class of drugs for the treatment
of benign gynaecological conditions. The most
advanced product in this portfolio is ESMYA® for
preoperative treatment of uterine fibroids, which
was launched in 2012 across Europe. The purchase
of Grünenthal’s well established oral contraceptive
franchise boosted both our existing gynaecological
sales and also expanded our female healthcare
product portfolio.
ESMYA®
Uterine fibroids are the most common benign,
solid tumours of the female genital tract,
affecting between 20 and 25 percent of women of
reproductive age. The condition is characterized by
excessive uterine bleeding, anaemia, pain, frequent
urination or incontinence, and infertility. So far,
GnRH agonists were the only approved pre-operative
treatment for uterine fibroids and their use has been
relatively limited due to side effects resulting from
the suppression of oestrogen to post-menopausal
levels (hot flashes, depression, mood swings, loss of
libido, vaginitis and loss of bone mineral density).
ESMYA® 5mg tablet containing ulipristal acetate is
a first-in-class, orally active, selective progesterone
receptor modulator. It reversibly blocks the
progesterone receptors in target tissues. The 12
weeks once-a-day oral therapy (vs. injectable GnRH
agonist) is effective to stop uterine bleeding, correct
anaemia and shrink fibroid volume. It improves
quality of life and has no castration side effects
unlike GnRH agonists.
In February 2012 the European Commission (EC)
granted marketing authorization to ESMYA® 5mg
tablet as pre-operative treatment of moderate to
severe symptoms of uterine fibroids. Following the
receipt of the marketing approval we initiated the
introduction of the product across Europe via our
sales network.
It was launched in mid March 2012 in Germany and
in the UK. In both countries ESMYA® was included
in the reimbursement lists. Reimbursement status
was granted in Austria and in Denmark in October
2012, in Norway in November 2012 and also in
Sweden during February 2013. In Spain, in Italy and in
France such negotiations have commenced with the
competent authorities.
ESMYA® was introduced in Poland, in Hungary, in
the Czech Republic in the second quarter 2012 and in
the Baltic States, in Bulgaria, Romania and Slovakia
in the third quarter 2012. Reimbursement status
was granted in Slovakia with effect from 1 January
2013 and in Hungary with effect from February 2013.
Given, however, a sensitive period of budgetary con-
straints, the likelihood of receiving reimbursement
approval is low in many of the mentioned countries.
ESMYA® reported total sales of EUR 3.6 million
at the end of 2012. Turnover recorded in Germany
contributed the most to the achieved sales levels.
In order to expand the indication to meet the needs
of a wider range of affected women Richter initiated
Phase III clinical studies at the beginning of the third
quarter to establish the long term (on-off ) usage of
ESMYA® targeting a substantial recession of fibroid
tumours with the objective of making surgical
interventions unnecessary. The studies are expected
to be completed by second quarter 2014.
Female Contraception We offer a broad range of contraceptive options to
assist women to shape their lives according to their
wishes. When it comes to the choice of contraceptive
methods, reliability, safety, ease of use and conveni-
ence all play a major role. Step by step we have built
up a product portfolio, which contains a number of
first, second, third and fourth generation oral contra-
ceptives and emergency contraceptives providing a
wide range for the female population to choose those
products which fit most with their personal needs.
Products for Menopause (Hormone Replacement Therapy, Osteoporosis Medications)The menopause is a period of natural transition
which every woman eventually experiences.
The decline in oestrogen production that charac-
terises this transition period can have short and
long term implications. It is no secret that the
menopause might have a negative influence on the
quality of life. Furthermore, oestrogen loss is closely
associated with the development of osteoporosis
and bone fractures. Our aim is to maintain women’s
health and quality of life over the long term.
Other Gynaecological Products Richter’s overall target is to offer a complete range of
female healthcare products and in accordance with
this objective we also provide treatment for gynae-
cological infections. The antifungals GYNAZOLE-1®
and GYNOFORT licensed in from KV Pharmaceuticals,
with an innovative drug delivery system are available
on most of our CEE and CIS markets.
Sales of gynaecological products
71.7
350
300
250
200
150
100
50
0
2008 2009 2010 2011 2012
EUR
m
A
Annual Report | Gedeon Richter 2012 | 2928 | Annual Report | Gedeon Richter 2012
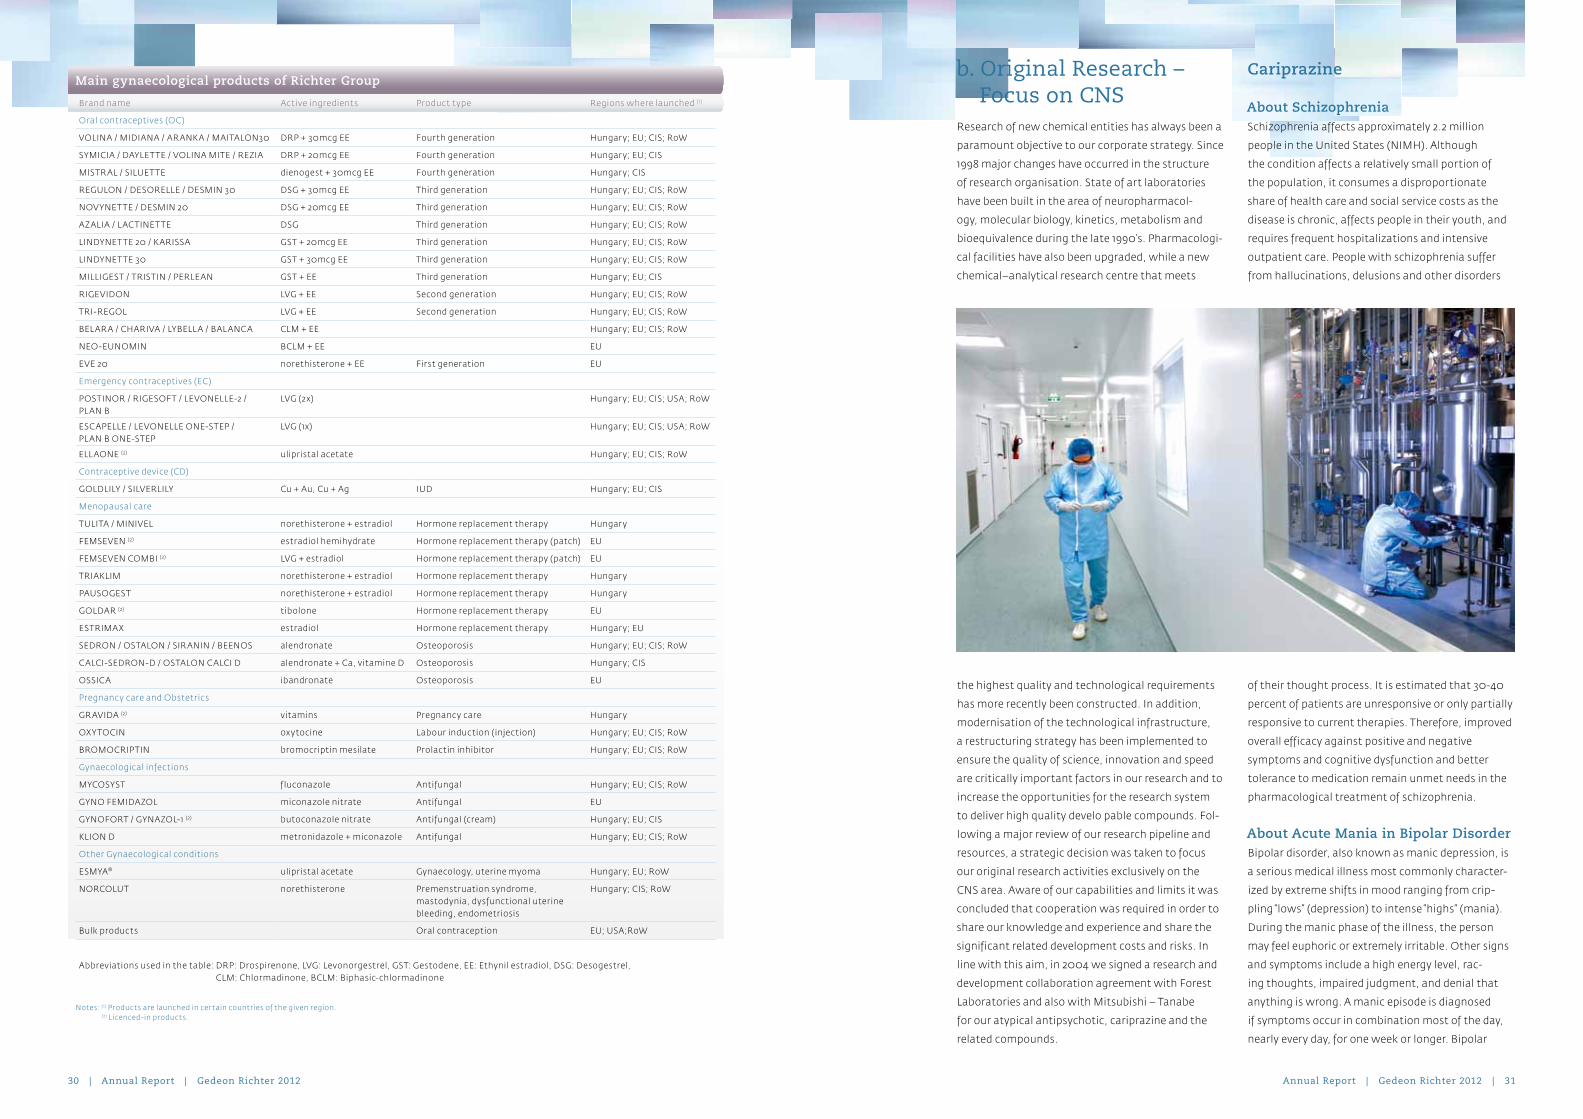
b. Original Research – Focus on CNS
Research of new chemical entities has always been a
paramount objective to our corporate strategy. Since
1998 major changes have occurred in the structure
of research organisation. State of art laboratories
have been built in the area of neuropharmacol-
ogy, molecular biology, kinetics, metabolism and
bioequivalence during the late 1990’s. Pharmacologi-
cal facilities have also been upgraded, while a new
chemical–analytical research centre that meets
the highest quality and technological requirements
has more recently been constructed. In addition,
modernisation of the technological infrastructure,
a restructuring strategy has been implemented to
ensure the quality of science, innovation and speed
are critically important factors in our research and to
increase the opportunities for the research system
to deliver high quality develo pable compounds. Fol-
lowing a major review of our research pipeline and
resources, a strategic decision was taken to focus
our original research activities exclusively on the
CNS area. Aware of our capabilities and limits it was
concluded that cooperation was required in order to
share our knowledge and experience and share the
significant related development costs and risks. In
line with this aim, in 2004 we signed a research and
development collaboration agreement with Forest
Laboratories and also with Mitsubishi – Tanabe
for our atypical antipsychotic, cariprazine and the
related compounds.
Cariprazine
About SchizophreniaSchizophrenia affects approximately 2.2 million
people in the United States (NIMH). Although
the condition affects a relatively small portion of
the population, it consumes a disproportionate
share of health care and social service costs as the
disease is chronic, affects people in their youth, and
requires frequent hospitalizations and intensive
outpatient care. People with schizophrenia suffer
from hallucinations, delusions and other disorders
of their thought process. It is estimated that 30-40
percent of patients are unresponsive or only partially
responsive to current therapies. Therefore, improved
overall efficacy against positive and negative
symptoms and cognitive dysfunction and better
tolerance to medication remain unmet needs in the
pharmacological treatment of schizophrenia.
About Acute Mania in Bipolar DisorderBipolar disorder, also known as manic depression, is
a serious medical illness most commonly character-
ized by extreme shifts in mood ranging from crip-
pling “lows” (depression) to intense “highs” (mania).
During the manic phase of the illness, the person
may feel euphoric or extremely irritable. Other signs
and symptoms include a high energy level, rac-
ing thoughts, impaired judgment, and denial that
anything is wrong. A manic episode is diagnosed
if symptoms occur in combination most of the day,
nearly every day, for one week or longer. Bipolar
Main gynaecological products of Richter Group
Brand name Active ingredients Product type Regions where launched (1)
Oral contraceptives (OC)
VOLINA / MIDIANA / ARANK A / MAITALON30 DRP + 30mcg EE Fourth generation Hungary; EU; CIS; RoW
SYMICIA / DAYLET TE / VOLINA MITE / REZIA DRP + 20mcg EE Fourth generation Hungary; EU; CIS
MISTRAL / SILUET TE dienogest + 30mcg EE Fourth generation Hungary; CIS
REGULON / DESORELLE / DESMIN 30 DSG + 30mcg EE Third generation Hungary; EU; CIS; RoW
NOV YNET TE / DESMIN 20 DSG + 20mcg EE Third generation Hungary; EU; CIS; RoW
AZALIA / L ACTINET TE DSG Third generation Hungary; EU; CIS; RoW
LINDYNET TE 20 / K ARISSA GST + 20mcg EE Third generation Hungary; EU; CIS; RoW
LINDYNET TE 30 GST + 30mcg EE Third generation Hungary; EU; CIS; RoW
MILLIGEST / TRISTIN / PERLEAN GST + EE Third generation Hungary; EU; CIS
RIGEVIDON LVG + EE Second generation Hungary; EU; CIS; RoW
TRI-REGOL LVG + EE Second generation Hungary; EU; CIS; RoW
BEL ARA / CHARIVA / LYBELL A / BAL ANCA CLM + EE Hungary; EU; CIS; RoW
NEO-EUNOMIN BCLM + EE EU
EVE 20 norethisterone + EE First generation EU
Emergency contraceptives (EC)
POSTINOR / RIGESOFT / LEVONELLE-2 / PL AN B
LVG (2x) Hungary; EU; CIS; USA; RoW
ESCAPELLE / LEVONELLE ONE-STEP / PL AN B ONE-STEP
LVG (1x) Hungary; EU; CIS; USA; RoW
ELL AONE (2) ulipristal acetate Hungary; EU; CIS; RoW
Contraceptive device (CD)
GOLDLILY / SILVERLILY Cu + Au, Cu + Ag IUD Hungary; EU; CIS
Menopausal care
TULITA / MINIVEL norethisterone + estradiol Hormone replacement therapy Hungary
FEMSEVEN (2) estradiol hemihydrate Hormone replacement therapy (patch) EU
FEMSEVEN COMBI (2) LVG + estradiol Hormone replacement therapy (patch) EU
TRIAKLIM norethisterone + estradiol Hormone replacement therapy Hungary
PAUSOGEST norethisterone + estradiol Hormone replacement therapy Hungary
GOLDAR (2) tibolone Hormone replacement therapy EU
ESTRIMA X estradiol Hormone replacement therapy Hungary; EU
SEDRON / OSTALON / SIRANIN / BEENOS alendronate Osteoporosis Hungary; EU; CIS; RoW
CALCI-SEDRON-D / OSTALON CALCI D alendronate + Ca, vitamine D Osteoporosis Hungary; CIS
OSSICA ibandronate Osteoporosis EU
Pregnancy care and Obstetrics
GRAVIDA (2) vitamins Pregnancy care Hungary
OXY TOCIN oxytocine Labour induction (injection) Hungary; EU; CIS; RoW
BROMOCRIPTIN bromocriptin mesilate Prolactin inhibitor Hungary; EU; CIS; RoW
Gynaecological infections
MYCOSYST fluconazole Antifungal Hungary; EU; CIS; RoW
GYNO FEMIDAZOL miconazole nitrate Antifungal EU
GYNOFORT / GYNAZOL-1 (2) butoconazole nitrate Antifungal (cream) Hungary; EU; CIS
KLION D metronidazole + miconazole Antifungal Hungary; EU; CIS; RoW
Other Gynaecological conditions
ESMYA® ulipristal acetate Gynaecology, uterine myoma Hungary; EU; RoW
NORCOLUT norethisterone Premenstruation syndrome, mastodynia, dysfunctional uterine bleeding, endometriosis
Hungary; CIS; RoW
Bulk products Oral contraception EU; USA;RoW
Abbreviations used in the table: DRP: Drospirenone, LVG: Levonorgestrel, GST: Gestodene, EE: Ethynil estradiol, DSG: Desogestrel, CLM: Chlormadinone, BCLM: Biphasic-chlormadinone
Notes: (1) Products are launched in certain countries of the given region. (2) Licenced-in products.
Annual Report | Gedeon Richter 2012 | 3130 | Annual Report | Gedeon Richter 2012

disorder affects approximately 2.3 million adults in
the United States.
About CariprazineCariprazine, discovered by researchers at Gedeon
Richter, is an orally active, potent D3/D2 receptor
partial antagonist that preferentially binds to D3
receptors. In addition, cariprazine has a low potency
at other receptor sites, such as 5-HT2C, histamine
H1, and adrenergic receptor sites, which have been
associated with adverse events.
Recent DevelopmentsJointly with Forest we have carried out successful
phase II and phase III trials in bipolar mania and
schizophrenia, which enabled our partner to compile
and submit a New Drug Application (NDA) to the
U.S. Food and Drug Administration (FDA) for both
indications in November 2012. We are pleased with
these results and this joint success achieved gives us
full confidence to make further advances on the way
of to targeting new chemical entities in the field of
the Central Nervous System.
c. BiosimilarsRichter acknowledged the growing importance of
biological drugs in the medium to long term and
took, a number of years ago, the strategic decision
to enter this novel, high added intellectual value
field. Richter’s management was confident that its
decade long expertise in fermentation, as being
a most sensitive procedure used both in the
manufacturing process of biological drugs and in
that of steroids, creates a competitive edge over
most of its peers which might be considering a
similar shift in strategy.
Initially Richter acquired in 2007 a family owned
manufacturing site in Germany, near Hamburg
setting up a business with Helm where Richter owns
the majority of shares. The site comprises a plant
able to perform the manufacturing of bacterial cell
based, simpler biosimilars, as well as a pilot plant
and a connecting laboratory unit.
A much larger scale investment followed with
the construction in Budapest of a pilot plant and
a laboratory unit to complement a totally new
manufacturing unit built in Eastern Hungary in
the city of Debrecen. The Hungarian complex
will manu facture biological drugs based on
mammalian cells.
When selecting the candidate products Richter
proceeded very carefully, narrowing down the
therapeutic areas to two: Oncology and
Immunology. Both areas belong to the highest
growth rate therapeutic segments. Richter expects
its first biosimilar products to be launched in 2016
and onwards.
As it usually does when it comes to risky or costly
businesses, Richter identified strategic alliances
with companies interested in biosimilars in order to
share both risks and costs. In its endeavour Richter
realised two such agreements, one with Mochida
for the Japanese market, and the other with Stada.
Further partners are sought to become involved in
the product development procedures.
32 | Annual Report | Gedeon Richter 2012

IV. Business Review
1. Pharmaceuticals
a. Research and Development
Innovation and the research of original drug
molecules have been key elements in the Company’s
strategy since its foundation in 1901. With more
than 1,000 employees in the field of research
and development, Gedeon Richter today is the
most significant pharmaceutical research base
in the Central and Eastern European region.
Pharmaceutical R&D covers three strategic areas,
notably research and development of new chemical
entities (NCEs), recombinant biotechnological
activities and the development of generic products.
Research and development of new chemical entities
focuses on the Female Healthcare and Central
Nervous System areas.
In 2012 we made significant progress in the
development process of cariprazine (RGH 188),
our antipsychotic compound. In February 2012
jointly with our partner, Forest Laboratories,
we announced positive results from two Phase
III trials with cariprazine for the treatment of
schizophrenia and another Phase III trial related
to bipolar mania. Consequently Forest submitted
New Drug Application (NDA) to the U.S. Food and
Drug Administration (FDA) for both indications
in November 2012. According to normal protocol
the registration procedure is expected to take
approximately twelve months. In addition, further
phase II clinical trials for cariprazine are being
carried out in cooperation with Forest Laboratories
in bipolar depression and also in adjunctive therapy
to major depression indications, results of which
are expected to be presented in the fourth quarter
of 2013 and second quarter of 2014 respectively.
Further clinical trials for cariprazine were initiated
during 2012 in order to meet the regulatory criteria
established in the European Union. Our partner in
Japan, Mitsubishi-Tanabe, is also conducting phase
III clinical trials to facilitate the product introduction
on the Japanese market.
Besides cariprazine, the Company has a research
portfolio of 14 ongoing projects, of which one is
in clinical Phase I trials. The remainder are in the
preclinical phase of development.
Our research programmes in Female Healthcare are
conducted by our Swiss based subsidiary, PregLem.
Following receipt of the marketing authorization
to ESMYA® 5mg tablet as pre-operative treatment
of moderate to severe symptoms of uterine fibroids
February 2012, we initiated Phase III clinical studies
at the beginning of the third quarter 2012 to establish
the long term (on-off ) usage of ESMYA® targeting a
substantial recession of fibroid tumors consequently
making surgical interventions unnecessary. The
studies are expected to be completed by the second
quarter 2014.
At the end of 2012 the clinical portfolio consisted of
the following:
Based on our long term almost 50 years experience
in the area of classical fermentation, combined
with molecular biological knowledge, a strategic
decision was made by management in 2006 to
start recombinant biotechnological activities at
the Company. The Hamburg based Richter-Helm
biologics, established jointly with Helm AG, carries
out development and manufacturing of microbial
proteins. In addition, a biotechnology laboratory
and pilot plant in Budapest became operational
in 2009. Meanwhile a greenfield investment which
was commenced in Debrecen in 2008 targeting
the production of the most complex mammalian
cell products, was inaugurated and became
operational in 2012.
Dr. Zsolt Szombathelyi – Research Director Dr. György Thaler – Development DirectorClinical portfolio
Name of compound Clinical phase Primary indications Partner
ESMYA® Phase III United States Uterine myoma Watson Laboratories (Actavis)
Cariprazine (RGH-188)
Under registration
United States
Schizophrenia, bipolar mania
Forest LaboratoriesPhase III Major depression
Phase II Bipolar depression
Phase III Japan Schizophrenia Mitsubishi-Tanabe
Annual Report | Gedeon Richter 2012 | 35

The Company considers it essential to establish part-
nerships to facilitate the development and marketing
of new molecules. We join forces with academic and
university institutions in the early phase of our re-
search activities, while we make efforts to establish
cooperation with other pharmaceutical companies
when it comes to the development of molecules in
clinical phases. In this regard partnerships with the
US-based Forest Laboratories and with the Japanese
company Mitsubishi-Tanabe Pharmaceuticals have
contributed substantially to the Company’s research
activity. In particular Richter’s experience in preclini-
cal trials is complementary with Forest’s experience
in clinical trials. In addition to the comprehensive
and long term license and collaboration agreement
signed in late 2010 with Mochida Pharmaceutical
Co. Ltd. in respect of the development and market-
ing of Richter’s biosimilar product portfolio we have
announced two separate license and collaboration
agreements in respect of the development and mar-
keting of two biosimilar products, two monoclonal
antibodies, with STADA Arzneimittel AG.
Generic development work in several therapeutic
areas continued in 2012 at the Parent company
and at its two subsidiaries in Poland and Romania.
The Group’s target is to launch at least 5-7 new
generic and branded generic products per year
on its traditional markets, i.e. Hungary, CEE
and CIS. Licensing-in activity also contributes
to the continuous development of the Group’s
product portfolio. Process development activities
and bioequivalence studies on several active
pharmaceutical ingredients and finished products
continued during the year.
Following the receipt of the marketing authorization
to ESMYA®, the product has been launched in 17 EU
countries. Several products developed in-house were
also introduced during 2012, namely the amlodipine
and perindopril containing antihypertensive
combination product VIDONORM in Hungary, the
levocetirizine containing antiallergic ZILOLA also in
Hungary and in Ukraine and the dienogest + 30mcg
ethynil estradiol containing third generation oral
contraceptive in Hungary, in Russia, in the Czech
Republic and in Germany under different brand
names. Additionally the licensed - in telmisartan
containing antihypertensive TANYDON was
launched in Hungary and certain EU9 countries
during the year. New formulations of our existing
products were also launched in number of our
traditional markets.
The Group reported in 2012 a 35.3 percent increase
in its spending on research and development which
totalled HUF 38,847 million (EUR 134.4 million),
representing 11.9 percent of consolidated sales.
36 | Annual Report | Gedeon Richter 2012

b. Manufacturing and Supply
Richter has always paid special attention to being
in a position to offer reliable and modern products
at affordable prices. Our key objective is to satisfy
market demand by providing sufficient quantities
of quality products in a timely and a cost efficient
manner. We manage that by continually optimizing
cost efficiency of products and technologies and
by operating an integrated supply process system
including all subsidiaries.
Despite the negative impact of the economic turmoil
we have continued in 2012 to drive operational
excellence and make adjustments to our operational
base so as to maximize the efficiency of our supply
chain whilst maintaining the highest standards
of quality and security of supply. During the year
we maintained our focus on driving continuous
improvement in our supply systems as part of a wide
ranging cost and efficiency programme.
Volumes shipped of finished products moderately
in creased in 2012 when compared to the levels
reported in 2011, outperforming the overall
pharmaceutical sales growth repor ted by the Group
reflecting price pressure prevailing in most of our CEE
and CIS regions.
At all of our manufacturing units in the CIS and CEE
region manufacturing of new products commenced
during 2012.
Overall volumes of API manufacturing increased
in line with the volume growth of finished dosage
form products in 2012 when compared to the levels
recorded in 2011. Both steroids and generic API’s
volumes showed increase year on year.
A number of investment programmes were initiat-
ed during 2012 in the area of packaging of finished
dosage form products - two new steroid packag-
ing lines were put in operation to respond to the in-
creasing capacity needs resulting from the manufac-
turing relocation of the OC portfolio acquired from
Grünenthal. Modernization of the injectable plant,
initiated during 2011, continued in 2012.
From among the various small-scale capital
expenditure programs carried out at subsidiaries of
the Group it should be highlighted that in line with
the announced expansion of our Russian operations
the warehousing capacity expansion project was
carried out having completed a temporary area to
receive incoming materials.
Throughout the year, several audits were conducted
both on a regulatory and business partnership level,
encompassing not only our facilities but also the
production processes of finished form products and
APIs. We are pleased to report that all audits resulted
in positive and satisfactory feedback.
c. ProductsRichter recognises that currently it is considered
primarily to be a branded generic pharmaceutical
manufacturer. Whilst the dominant part of its
turnover originates from generic drugs the Gro-
up also manufactures and markets steroid based
pharmaceuticals which represent a specialised,
higher margin group of products. Over the last
decade this niche portfolio has contributed
substantially to both the increase in sales and to
the relatively high margins achieved by the Group.
It has been a priority for Richter management to
further strengthen this therapeutic area where we
traditionally have possessed special knowledge.
The acquired ex-Grünenthal oral contraceptive
portfolio represents a strategic fit for Richter to
both strengthen its presence in Western Euro-
pean markets and expand its oral contraceptive
portfolio. Additionally the acquisition of PregLem
András Radó – Director, Production and Logistics
Annual Report | Gedeon Richter 2012 | 39
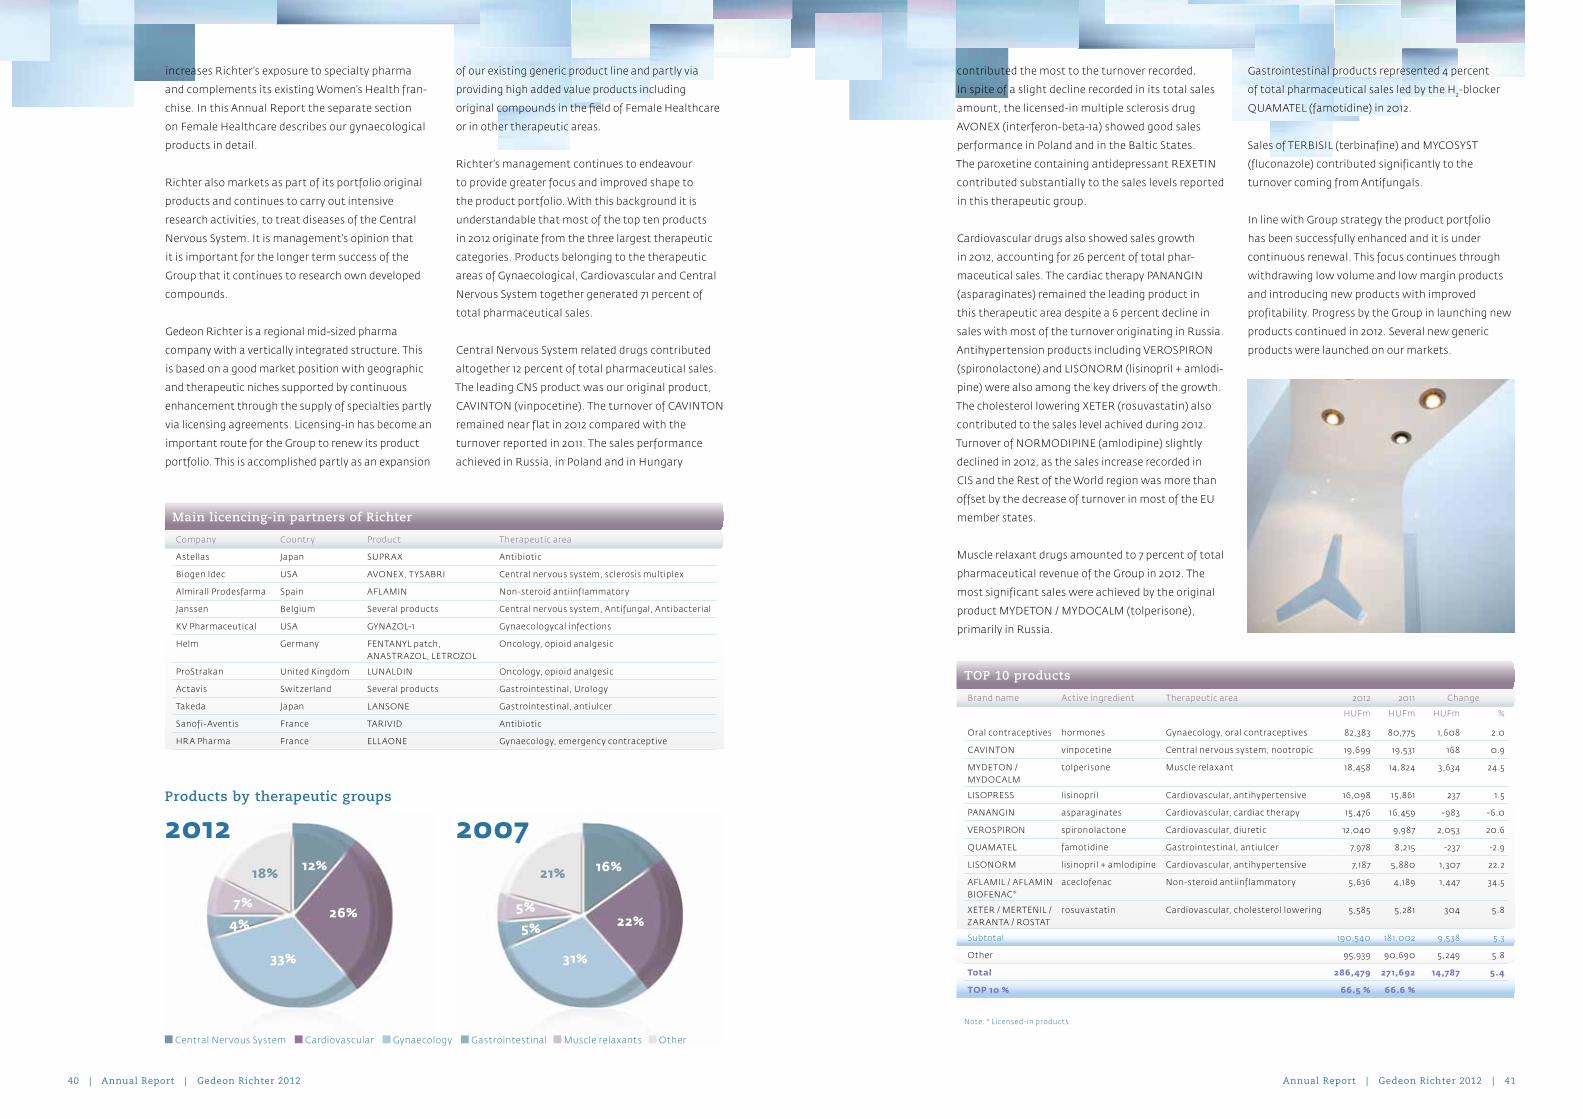
increases Richter’s exposure to specialty pharma
and complements its existing Women’s Health fran-
chise. In this Annual Report the separate section
on Female Healthcare describes our gynaecological
products in detail.
Richter also markets as part of its portfolio original
products and continues to carry out intensive
research activities, to treat diseases of the Central
Nervous System. It is management’s opinion that
it is important for the longer term success of the
Group that it continues to research own developed
compounds.
Gedeon Richter is a regional mid-sized pharma
company with a vertically integrated structure. This
is based on a good market position with geographic
and therapeutic niches supported by continuous
enhancement through the supply of specialties partly
via licensing agreements. Licensing-in has become an
important route for the Group to renew its product
portfolio. This is accomplished partly as an expansion
of our existing generic product line and partly via
providing high added value products including
original compounds in the field of Female Healthcare
or in other therapeutic areas.
Richter’s management continues to endeavour
to provide greater focus and improved shape to
the product portfolio. With this background it is
understandable that most of the top ten products
in 2012 originate from the three largest therapeutic
categories. Products belonging to the therapeutic
areas of Gynaecological, Cardiovascular and Central
Nervous System together generated 71 percent of
total pharmaceutical sales.
Central Nervous System related drugs contributed
altogether 12 percent of total pharmaceutical sales.
The leading CNS product was our original product,
CAVINTON (vinpocetine). The turnover of CAVINTON
remained near flat in 2012 compared with the
turnover reported in 2011. The sales performance
achieved in Russia, in Poland and in Hungary
contributed the most to the turnover recorded.
In spite of a slight decline recorded in its total sales
amount, the licensed-in multiple sclerosis drug
AVONEX (interferon-beta-1a) showed good sales
performance in Poland and in the Baltic States.
The paroxetine containing antidepressant REXETIN
contributed substantially to the sales levels reported
in this therapeutic group.
Cardiovascular drugs also showed sales growth
in 2012, accounting for 26 percent of total phar-
maceutical sales. The cardiac therapy PANANGIN
(asparaginates) remained the leading product in
this therapeutic area despite a 6 percent decline in
sales with most of the turnover originating in Russia.
Antihypertension products including VEROSPIRON
(spironolactone) and LISONORM (lisinopril + amlodi-
pine) were also among the key drivers of the growth.
The cholesterol lowering XETER (rosuvastatin) also
contributed to the sales level achived during 2012.
Turnover of NORMODIPINE (amlodipine) slightly
declined in 2012, as the sales increase recorded in
CIS and the Rest of the World region was more than
offset by the decrease of turnover in most of the EU
member states.
Muscle relaxant drugs amounted to 7 percent of total
pharmaceutical revenue of the Group in 2012. The
most significant sales were achieved by the original
product MYDETON / MYDOCALM (tolperisone),
primarily in Russia.
Gastrointestinal products represented 4 percent
of total pharmaceutical sales led by the H2-blocker
QUAMATEL (famotidine) in 2012.
Sales of TERBISIL (terbinafine) and MYCOSYST
(fluconazole) contributed significantly to the
turnover coming from Antifungals.
In line with Group strategy the product portfolio
has been successfully enhanced and it is under
continuous renewal. This focus continues through
withdrawing low volume and low margin products
and introducing new products with improved
profitability. Progress by the Group in launching new
products continued in 2012. Several new generic
products were launched on our markets.
Main licencing-in partners of Richter
Company Country Product Therapeutic area
Astellas Japan SUPRA X Antibiotic
Biogen Idec USA AVONEX, T YSABRI Central nervous system, sclerosis multiplex
Almirall Prodesfarma Spain AFL AMIN Non-steroid antiinflammatory
Janssen Belgium Several products Central nervous system, Antifungal, Antibacterial
KV Pharmaceutical USA GYNAZOL-1 Gynaecologycal infections
Helm Germany FENTANYL patch, ANASTRAZOL, LETROZOL
Oncology, opioid analgesic
ProStrakan United Kingdom LUNALDIN Oncology, opioid analgesic
Actavis Switzerland Several products Gastrointestinal, Urology
Takeda Japan L ANSONE Gastrointestinal, antiulcer
Sanofi-Aventis France TARIVID Antibiotic
HRA Pharma France ELL AONE Gynaecology, emergency contraceptive
TOP 10 products
Brand name Active ingredient Therapeutic area 2012 2011 Change
HUFm HUFm HUFm %
Oral contraceptives hormones Gynaecology, oral contraceptives 82,383 80,7 75 1,608 2.0
CAVINTON vinpocetine Central ner vous system, nootropic 19,699 19,531 168 0.9
MYDETON / MYDOCALM
tolperisone Muscle relaxant 18,458 14,824 3,634 24.5
LISOPRESS lisinopril Cardiovascular, antihypertensive 16,098 15,861 237 1.5
PANANGIN asparaginates Cardiovascular, cardiac therapy 15,476 16,459 -983 -6.0
VEROSPIRON spironolactone Cardiovascular, diuretic 12,040 9,987 2,053 20.6
QUAMATEL famotidine Gastrointestinal, antiulcer 7,978 8,215 -237 -2.9
LISONORM lisinopril + amlodipine Cardiovascular, antihypertensive 7,187 5,880 1,307 22.2
AFL AMIL / AFL AMIN BIOFENAC*
aceclofenac Non-steroid antiinflammatory 5,636 4,189 1,447 34.5
XETER / MERTENIL / ZARANTA / ROSTAT
rosuvastatin Cardiovascular, cholesterol lowering 5,585 5,281 304 5.8
Subtotal 190,540 181,002 9,538 5.3
Other 95,939 90,690 5,249 5.8
Total 286,479 271,692 14,787 5.4
TOP 10 % 66.5 % 66.6 %
Note: * Licensed-in products
Products by therapeutic groups
31%33%
5%7%
5%4%
16%12% 21%18%
22%26%
Central Nervous System Cardiovascular Gynaecology Gastrointestinal Muscle relaxants Other
20072012
Annual Report | Gedeon Richter 2012 | 4140 | Annual Report | Gedeon Richter 2012

New Product Launches
Brand name Active ingredients Therapeutic area HUN POL ROM EU9 EU15 RUS UKR RoCIS RoW
Gynaecological products
ARANK A drospirenone + 30mcg EE*
Gynaecology, oral contraceptive
12Q1
ARANKELLE drospirenone + 20mcg EE*
Gynaecology, oral contraceptive
12Q4
BEL ARA chlormadinone + 30mcg EE*
Gynaecology, oral contraceptive
12Q1 12Q1 12Q4
BEL ARINA chlormadinone + 20mcg EE*
Gynaecology, oral contraceptive
12Q2
DARYLIA drospirenone + 20mcg EE*
Gynaecology, oral contraceptive
12Q2
DAYLET TE/LIL ADROS drospirenone + 20mcg EE*
Gynaecology, oral contraceptive
12Q1 12Q1
DIMIA drospirenone + 20mcg EE*
Gynaecology, oral contraceptive
12Q3
ESMYA® ulipristal acetate Gynaecology, uterine myoma
12Q2 12Q2 12Q3 12Q2 12Q2
GOLDLILY Cu + Au Gynaecology, IUD
12Q2
MAITALON 20 drospirenone + 20mcg EE*
Gynaecology, oral contraceptive
12Q2
MAITALON 30 drospirenone + 30mcg EE*
Gynaecology, oral contraceptive
12Q2
MIDIANA drospirenone + 30mcg EE*
Gynaecology, oral contraceptive
12Q3
MISTRAL dienogest + 30 mcg EE*
Gynaecology, oral contraceptive
12Q4
OSSICA ibandronate Gynaecology, osteoporosis/ Oncology
12Q3 12Q3
REZIA drospirenone + 20mcg EE*
Gynaecology, oral contraceptive
12Q2
SILUET TE dienogest + 30 mcg EE*
Gynaecology, oral contraceptive
12Q3
VOLINA drospirenone + 30mcg EE*
Gynaecology, oral contraceptive
12Q1
VOLINA MITE drospirenone + 20mcg EE*
Gynaecology, oral contraceptive
12Q1
Note: * ethynil estradiol
New Product Launches
Brand name Active ingredients Therapeutic area HUN POL ROM EU9 EU15 RUS UKR RoCIS RoW
Licensed-in products
AFL AMIL / AFL AMIN/ BIOFENAC
aceclofenac Non-steroid antiinflammatory
12Q2
DOLFORIN / LUNALDIN fentanyl Oncology, opioid analgesics
12Q2
SUPRA X cefixime Antibiotic 12Q2
New Product Launches
Brand name Active ingredients Therapeutic area HUN POL ROM EU9 EU15 RUS UKR RoCIS RoW
Own developed compounds
AML ATOR amlodipine + atorvastatin
Cardiovascular, antihypertensive + cholesterol lowering
12Q1 12Q1 12Q1
BIDOP bisoprolol Cardiovascular, antihypertensive, cardiac therapy
12Q3
DANURIT perindopril + indapamide Cardiovascular, antihypertensive
12Q1
DIRONORM lisinopril + amlodipine Cardiovascular, antihypertensive
12Q3 12Q3
DIRONORM FORTE lisinopril + amlodipine Cardiovascular, antihypertensive
12Q1
DUPLECOR amlodipine + atorvastatin
Cardiovascular, antihypertensive + cholesterol lowering
12Q3
LENUXIN escitalopram Central nervous system, antidepressant
12Q3
LISONORM lisinopril + amlodipine Cardiovascular, antihypertensive
12Q1
LORDESTIN desloratadin Respiratory, antiallergic 12Q2 12Q2
MERTENIL rosuvastatin Cardiovascular, cholesterol lowering
12Q3
MODUXIN trimetazidine Cardiovascular, cardiac therapy
12Q2
MOILEC meloxicam Non-steroid antiinflammatory
12Q3
PARNASSAN olanzapine Central nervous system, antipsychotic
12Q1 12Q1
PERINDOPRIL-INDAPAMIDE RICHTER
perindopril + indapamid Cardiovascular, antihypertensive
12Q3
PROTEVASC trimetazidine Cardiovascular, cardiac therapy
12Q1
SINGLON montelucast Respiratory, antiasthmatic
12Q3
SONIRID DUO finasteride + tamsulosine
Urology, benign prostate hypertrophy
12Q4
TANYDON telmisartan Cardiovascular, antihypertensive
12Q1 12Q1 12Q1
VIDONORM amlodipine + perindopril Cardiovascular, antihypertensive
12Q3
VIDOTIN perindopril Cardiovascular, antihypertensive
12Q2
ZILOL A levocetirizin Respiratory, antiallergic 12Q2 12Q4
Annual Report | Gedeon Richter 2012 | 4342 | Annual Report | Gedeon Richter 2012
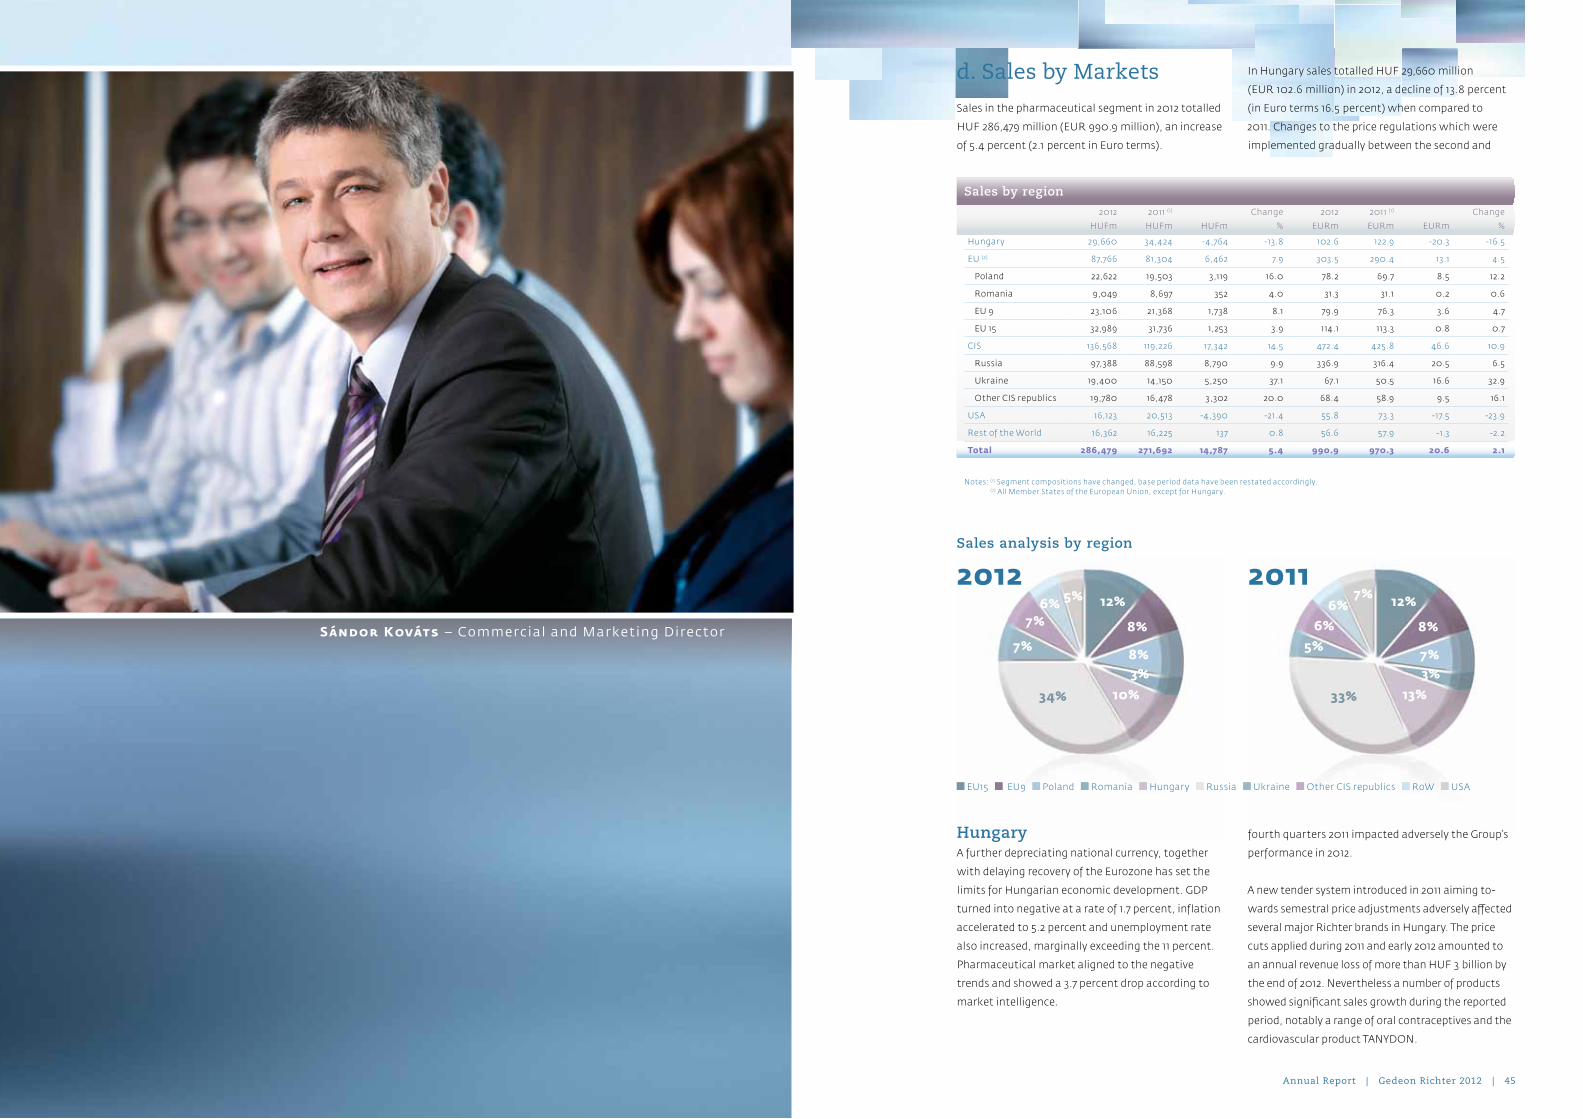
33%
5%6%
6%7% 12%
8%
7%3%
13%
2011
34%
7%
7%6% 5% 12%
8%
8%3%
10%
2012
Sales by region
2012 2011 (1) Change 2012 2011 (1) Change
HUFm HUFm HUFm % EURm EURm EURm %
Hungar y 29,660 34,424 -4,764 -13.8 102.6 122.9 -20.3 -16.5
EU (2) 87,766 81,304 6,462 7.9 303.5 290.4 13.1 4.5
Poland 22,622 19,503 3,119 16.0 78.2 69.7 8.5 12.2
Romania 9,049 8,697 352 4.0 31.3 31.1 0.2 0.6
EU 9 23,106 21,368 1,738 8.1 79.9 76.3 3.6 4.7
EU 15 32,989 31,736 1,253 3.9 114.1 113.3 0.8 0.7
CIS 136,568 119,226 17,342 14.5 472.4 425.8 46.6 10.9
Russia 97,388 88,598 8,790 9.9 336.9 316.4 20.5 6.5
Ukraine 19,400 14,150 5,250 37.1 67.1 50.5 16.6 32.9
Other CIS republics 19,780 16,478 3,302 20.0 68.4 58.9 9.5 16.1
USA 16,123 20,513 -4,390 -21.4 55.8 73.3 -17.5 -23.9
Rest of the World 16,362 16,225 137 0.8 56.6 57.9 -1.3 -2.2
Total 286,479 271,692 14,787 5.4 990.9 970.3 20.6 2.1
Notes: (1) Segment compositions have changed, base period data have been restated accordingly. (2) All Member States of the European Union, except for Hungar y.
Sales analysis by region
EU15 EU9 Poland Romania Hungary Russia Ukraine Other CIS republics RoW USA
d. Sales by Markets
Sales in the pharmaceutical segment in 2012 totalled
HUF 286,479 million (EUR 990.9 million), an increase
of 5.4 percent (2.1 percent in Euro terms).
HungaryA further depreciating national currency, together
with delaying recovery of the Eurozone has set the
limits for Hungarian economic development. GDP
turned into negative at a rate of 1.7 percent, inflation
accelerated to 5.2 percent and unemployment rate
also increased, marginally exceeding the 11 percent.
Pharmaceutical market aligned to the negative
trends and showed a 3.7 percent drop according to
market intelligence.
In Hungary sales totalled HUF 29,660 million
(EUR 102.6 million) in 2012, a decline of 13.8 percent
(in Euro terms 16.5 percent) when compared to
2011. Changes to the price regulations which were
implemented gradually between the second and
fourth quarters 2011 impacted adversely the Group’s
performance in 2012.
A new tender system introduced in 2011 aiming to-
wards semestral price adjustments adversely affected
several major Richter brands in Hungary. The price
cuts applied during 2011 and early 2012 amounted to
an annual revenue loss of more than HUF 3 billion by
the end of 2012. Nevertheless a number of products
showed significant sales growth during the reported
period, notably a range of oral contraceptives and the
cardiovascular product TANYDON.
Sándor Kováts – Commercial and Marketing Director
Annual Report | Gedeon Richter 2012 | 45

TOP 10 products in Hungary
Brand name Active ingredient Therapeutic area 2012 2011 Change
HUFm HUFm HUFm %
Oral contraceptives hormones Gynaecology 3,332 3,010 322 10.7
CAVINTON vinpocetine Central ner vous system, nootropic 2,033 2,029 4 0.2
XETER rosuvastatin Cardiovascular, cholesterol-lowering 1,742 2,860 -1,118 -39.1
QUAMATEL famotidine Gastrointestinal, antiulcer 1,336 1,688 -352 -20.9
LISONORM lisinopril + amlodipine Cardiovascular, antihypertensive 1,030 1,127 -97 -8.6
MODUXIN trimetazidine Cardiovascular, cardiac therapy 969 1,178 -209 -17.8
L AMOLEP lamotrigine Central nervous system, epilepsy treatment 824 7 78 46 5.8
PANANGIN asparaginates Cardiovascular, cardiac therapy 739 556 183 33.0
AFL AMIN* aceclofenac Non-steroid antiinflammatory 708 699 9 1.3
PORTIRON / PORTIRON HCT
losartan / losartan + hydrochlorothiazide
Cardiovascular, antihypertensive 691 1,009 -318 -31.5
Subtotal 13,404 14,934 -1,530 -10.3
Other 16,256 19,490 -3,234 -16.6
Total 29,660 34,424 -4,764 -13.8
TOP 10 % 45.2 43.4
Note: * Licensed-in products
New products launched in Hungary during 2012
Brand name Active ingredient Therapeutic area Launch date
AML ATOR amlodipine + atorvastatin Cardiovascular, antihypertensive, cholesterol lowering Q1, 2012
BEL ARA chlormadinone + EE* Gynaecology, oral contraceptive Q1, 2012
TANYDON telmisartan Cardiovascular, antihypertensive Q1, 2012
ESMYA® ulipristal acetate Gynaecology, uterine myoma Q2, 2012
REZIA drospirenone + 20 mcg EE* Gynaecology, oral contraceptive Q2, 2012
LORDESTIN desloratadine Respirator y, antiallergic Q2, 2012
ZILOL A levocetirizine Respirator y, antiallergic Q2, 2012
VIDONORM amlodipine + perindopril Cardiovascular, antihypertensive Q3, 2012
MISTRAL dienogest + 30mcg EE* Gynaecology, oral contraceptive Q4, 2012
Note: * ethynil estradiol
Sales performance in Hungary was also negatively
impacted by the termination of the licensing-in
contract for AVONEX and TYSABRI with effect from
31 December 2011.
In 2012 the pharmaceutical market decreased
slightly year-on-year, with sales of Richter products
also falling behind the levels achieved in 2011 by
12.7 percent. Richter is now the fourth player on the
Hungarian pharmaceutical market with a 5.3 percent
share based on the latest available market audit
(IMS) data for the full year 2012. When considering
only the market for retail prescription drugs, Richter
qualified for third place with a market share of
7.1 percent.
Hungarian Regulatory Environment
Extraordinary TaxesThe 2007 drug economic act established that
pharmaceutical companies were required to pay as
a contribution to the nation’s health care budget an
amount equal to 12 percent of the reimbursement
based on manufacturer price levels to the Tax
Authority. A medical representative fee was also
reintroduced from 15 February 2009 in the amount
of HUF 0.4 million per month per representative.
Amendments to the law with effect from 1 July 2011
increased the 12 percent tax to 20 percent while
the medical representative fee was doubled to
HUF 0.8 million per month per representative.
Price RegulationsRecent amendments to the law include:
‒ Implementation of a preferred reference pricing
range of 10 percent above the reference price
for both active substance reimbursement and
therapeutic reimbursement groups, with any
failure to keep the price within the preferred
range resulting in a 15 percent reduction in the
reimbursement amount: manufacturers’ price
proposals are submitted via a “blind” auction system.
‒ Introduction of an international reference pricing
system with a 20 percent ceiling above the
average of the three cheapest prices of a given
manufacturer applied in any of the EU countries to
retain reimbursement status. This measure has yet
to be put into practice as at the publication date of
this annual report.
‒ On 18 June 2012 the Hungarian Parliament
approved a new measure referred to as the Spanish
model. Drug manufacturers are required to pay
a 10 percent rebate based on the retail price of
the product (excluding reimbursement), with
effect from 1 August 2012 in the case of such
reimbursed products which have been marketed
for a period of at least 6 years with a retail price
exceeding HUF 1000 and which face no current
generic competition. An estimated 1600 drugs are
impacted by this measure. It is estimated that this
measure implies an annual payment liability of
approximately HUF 100 million for Richter.
‒ With effect from 1 August 2012 the wholesale markup
for reimbursed drugs was reduced by regulation, the
resulting difference being allocated to retailers.
R&D Based Tax AllowancesParliament passed an Act on 21 December 2011 which
provides for a 20 percent–60 percent–90 percent
extraordinary tax deduction for those companies
whose R&D reaches or exceeds 15 percent–20 per-
cent–25 percent of the reimbursement based on
manufacturer price levels during 2011. An additional
criterion for this allowance is a minimum level
of personnel related expenditure established at
3 percent for staff involved in R&D. Considering the
above conditions Richter qualifies for the maximum
available allowance i.e. 90 percent of the tax liability
incurred in respect of 2011; the scope of which having
been extended in order to include rebates arising
from the introduction of the so called “Spanish model”
and also the financing of a potential overspending of
the pharma budget.
Strategic Agreement Between Richter and the Hungarian GovernmentOn 2 November 2012 Richter signed a strategic
agreement with the Hungarian Government which
among other benefits established a transparent and
sustainable system for the R&D based tax allowances
including the carry of such allowances beyond the
end of the financial year. The agreement is expected
to contribute to the settlement in the medium and
long term of the turmoil in the pharmaceutical
market in Hungary. Details of the R&D based tax
allowances were subsequently enacted by the
Parliament and entered into force with immediate
effect as of 28 December 2012.
International SalesInternational sales amounted to EUR 888.3 million in
2012, an increase of EUR 40.9 million or 4.8 percent
over 2011. Sales in the CIS totalled EUR 472.4 million
(US$ 606.9 million), 10.9 percent higher (in US$
terms 2.3 percent) when compared to 2011. In Russia
a steady growth of 6.5 percent in EUR terms was
reported in 2012. A significant 22.4 percent growth in
US$ terms (32.9 percent in EUR terms) was reported
in Ukraine, while a 7.2 percent increase in turnover in
US$ terms (16.1 percent in EUR terms) was reported
in the Other CIS republics. The increase in turnover
reported for the EU region (4.5 percent in Euro terms)
was primarily driven by higher sales levels recorded
in Poland, but the EU 9 countries also significantly
contributed to the higher sales levels achieved. Sales
recorded in the USA declined by 29.7 percent in US$
terms. Turnover reported in the Rest of the World
region decreased by 2.2 percent in EUR terms in 2012
when compared to 2011.
Annual Report | Gedeon Richter 2012 | 4746 | Annual Report | Gedeon Richter 2012

37%
6%
7%
7%9% 13%
9%
8%4%
2011
38%
8%
8%
6% 13%6%
9%
9%
3%
2012International sales analysis by region
EU15 EU9 Poland Romania Russia Ukraine Other CIS republics RoW USA
26%
26%
10%
38%
2012
26%
24%
11%
39%
2011Sales to the EU in 2012
EU15 EU9 Poland Romania
European UnionSales in the European Union, excluding Hungary,
amounted to EUR 303.5 million in 2012, representing
an increase of 4.5 percent when compared to 2011.
Mid single digit sales growth was reported in the EU
mostly due to good growth recorded in Poland and
in the EU9 region, despite the fact that the Group
continued to face strong competition and sustained
pressure from governments which together resulted
year on year in both lower prices and reimbursement
levels. Novel Female Healthcare generics launched
by Richter in key Western European countries have
strongly contributed to the turnover growth.
Macroeconomic developments in Poland were
mixed as decreasing inflation rate was contrasted
by a falling GDP and a pharmaceutical mar-
ket shrinking by 4.5 percent. In spite of difficult
macro environment the Group recorded sales of
PLN 327.4 million (EUR 78.2 million) in 2012, an
increase of 13.8 percent in PLN terms (12.2 percent
in EUR terms) over the levels achieved in 2011 in
Poland, its largest market in the region. The reported
good sales levels were primarily due to Richter’s
efficient promotional activities. The range of oral
contraceptives, BIOFENAC, AVONEX, and SPIRONOL
contributed the most to the recorded good growth
when compared to the sales levels achieved in the
base period.
A new drug economic act came into effect on
1 January 2012 in Poland, resulting in a further
tightening of the measures regulating the activity
of pharmaceutical companies. The most important
provisions of the act include a freeze of the national
pharma budget at its 2011 level for three subsequent
years. Should expenditures exceed this amount,
Sales to TOP 10 international markets
2012 2011 Change
EURm EURm EURm %
Russia 336.9 316.4 20.5 6.5
Poland 78.2 69.7 8.5 12.2
Ukraine 67.1 50.5 16.6 32.9
Germany 55.9 47.6 8.3 17.4
USA 55.8 73.3 -17.5 -23.9
Romania 31.3 31.1 0.2 0.6
Czech Republic 29.1 25.4 3.7 17.6
Slovakia 21.1 22.2 -1.1 -5.0
Kazakhstan 17.8 17.8 0.0 0.0
France 15.0 13.0 2.0 15.4
Subtotal 708.1 666.9 41.2 6.2
Total international sales 888.3 847.4 40.9 4.8
Share of the TOP 10 international markets 79.7% 78.7%manufacturers are required to pay in total half of the
excess spending. The first generic product on the
market cannot exceed 75 percent of the price of the
original drug and all subsequent competitors have
to sell their products at lower prices. The deadline
for a decision with respect to the inclusion of new
products into the reimbursement list increased to
180 days, although manufacturers may ask for such
inclusion at any time. Promotion activity (including
such items as discounts and charity donations) for
reimbursed products has been completely ruled out.
Difficult market environment characterised
Romania also in 2012 with political instability and
shrinking GDP. Sales to this country amounted to
RON 139.4 million in 2012, a 5.8 percent year-on-year
increase compared with the performance in 2011. In
EUR terms turnover slightly increased by 0.6 per-
cent and amounted to EUR 31.3 million. Increasing
competition and excessive payment delays (up to
360 days or more) have characterized the Romanian
pharma market together with sales held back as a
consequence of bad debts as well as the distributors’
high inventory levels.
Turnover of the range of oral contraceptives, of
CAVINTON (including CAVINTON FORTE), of
MYDOCALM and MODUXIN contributed most to
sales levels achieved in 2012.
From 1 October 2009 the Government approved
a claw-back regime in the range of 5-12 percent
(aimed at financing the overspending of the national
pharmaceutical budget) to be paid to the National
Health Insurance House by the manufacturers from
sales of reimbursed drugs. On 1 October 2011 a new
version of Romania’s pharmaceutical claw-back
mechanism came into force. The new measures
apply to the suppliers of medicines that are partly
or fully reimbursed and the overspending of the
national pharmaceutical budget has to be paid for by
these manufacturers based on their market shares.
In line with the governmental decree published on
8 August 2012 further amendments were made to
the claw-back mechanism. In the fourth quarter
of 2012 in respect of the last two quarters Richter
booked the claw-back tax imposed.
Despite strong competition and the various austerity
measures introduced by local governments Richter
recorded steady growth in the EU 9 region in 2012.
Sales totalled EUR 79.9 million in the year, 4.7 per-
cent higher than in 2011. This area represented
26 percent of the total EU region sales of the Group’s
pharmaceutical segment.
The crisis left its fingerprints on the Czech economy
too: rising inflation, GDP falling near to recession
levels and steady (7.2 percent) unemployed rate have
set an unfavourable macroeconomic environment.
Our turnover on this market amounted to
EUR 29.1 million in 2012, representing growth of
14.4 percent over the sales levels achieved in the base
period. The sales increase was mainly attributable
to the range of oral contraceptives, AMLATOR,
LUNALDIN, GORDIUS and KYLOTAN (including
KYLOTAN PLUS). In Slovakia, an Eurozone economy
shaked to a lesser extent than its Central-European
Annual Report | Gedeon Richter 2012 | 4948 | Annual Report | Gedeon Richter 2012

peers, with a slight deflation, and a rather steady
unemployement rate, our turnover amounted to
EUR 21.1 million in 2012 which was 4.9 percent lower
compared to 2011. Notwithstanding the overall
decline a positive sales performance of PROTEVASC,
LUNALDIN and TANYDON was recorded in the
reported period. In the Baltic States sales amounted
to EUR 16.7 million in 2012, EUR 0.4 million higher
when compared to 2011. In Bulgaria sales totalled
EUR 12.9 million in the reported period, representing
growth of EUR 0.8 million when compared with
turnover achieved in 2011.
In the ‘traditional’ 15 EU Member States sales
amounted to EUR 114.1 million in 2012, which
represented virtually flat (0.7 percent higher) sales
levels compared to the previous year’s performance.
This region contributed 38 percent of total EU
pharmaceutical sales.
In Germany Richter Group reported sales of
EUR 55.9 million in 2012, 17.3 percent higher than
in the base period. In France the Group’s turnover
amounted to EUR 15.0 million in 2012. Sales in Italy
reached EUR 10.8 million while sales in Belgium
totalled EUR 8.6 million in the reported period.
Turnover in Spain reached EUR 5.6 million while it
amounted to EUR 5.3 million in the United Kingdom.
CISSales to the CIS in 2012 totalled EUR 472.4 million,
representing good growth of 10.9 percent compared
with sales levels achieved in 2011. Significant sales
growth was achieved throughout the region in the
reported period.
The relatively stable Rouble/Euro exchange rate
and the increasing crude oil revenues created a
predictable and stable economic environment
New products launched in Central and Eastern Europe during 2012
Brand name Active ingredient Therapeutic area Launch date
AML ATOR amlodipine + atorvastatin Cardiovascular, antihypertensive, cholesterol lowering Q1, 2012
DANURIT perindopril + indapamide Cardiovascular, antihypertensive Q1, 2012
TANYDON telmisartan Cardiovascular, antihypertensive Q1, 2012
BEL ARA chlormadinone + EE(1) Gynaecology, oral contraception Q1, 2012
DIRONORM FORTE lisinopril + amlodipine Cardiovascular, antihypertensive Q1, 2012
PARNASSAN olanzapine Central nervous system, antipsychotic Q1, 2012
DAYLET TE drospirenone + 20mcg EE(1) Gynaecology, oral contraception Q1, 2012
PROTEVASC trimetazidine Cardiovascular, cardiac therapy Q1, 2012
LORDESTIN desloratadine Respiratory, antiallergic Q2, 2012
ESMYA® ulipristal acetate Gynaecology, uterine myoma Q2, 2012
MODUXIN trimetazidine Cardiovascular, cardiac therapy Q2, 2012
AFL AMIL (2) aceclofenac Non-steroid antiinflammatory Q2, 2012
OSSICA ibandronate Oncology / Gynaecology, anti osteoporosis Q3, 2012
DIRONORM lisinopril + amlodipine Cardiovascular, antihypertensive Q3, 2012
MOILEC meloxicam Non-steroid antiinflammatory Q3, 2012
Notes: (1) EE: ethynil estradiol (2) Licensed-in products
500
400
300
200
100
0
2008 2009 2010 2011 2012
Sales to the CIS
Russia Ukraine Other CIS Republics
EUR
m
resulting in sharply declining inflation rate and
a mildly improving unemployment in Russia
which altogether impacted positively the
purchasing power. Sales totalled RUB 13.5 billion
(EUR 336.9 million) in 2012, 3.8 percent (in EUR
terms 6.5 percent) higher than in the base period. In
spite of increasing generic competition the higher
sales level was reached as a consequence of Richter’s
efficient promotional and commercial activities.
Growth was realised primarily due to a good perfor-
mance achieved by MYDOCALM, the range of oral
contraceptives and MERTENIL.
A licensing agreement for SUPRAX was terminated
during 2012. The consequences thereof impacted the
second half of the reporting year.
In line with the Pharma 2020 strategy announced by
the Russian Government which has as its objective
the manufacturing of most essential medicines in
Russia by 2016 Richter has been carrying out a multi-
phase project which will further increase its Russian
manufacturing and warehousing capacities.
Sales to Ukraine amounted to US$ 86.2 million
(EUR 67.1 million) in 2012. The substantial growth of
22.4 percent (32.9 percent in EUR terms) reported
over 2011 was due to both Richter’s efficient
promotional activities and also some registration
related one-off shipments. Political stabilisation in
the country had a beneficial effect on the economic
climate. Turnover of the range of oral contraceptives,
PANANGIN, MYDOCALM and CAVINTON contributed
most to the sales levels recorded.
Sales in Other CIS republics totalled US$ 87.9 million
(EUR 68.4 million) in 2012, good growth of 7.2 per-
cent (16.1 percent in Euro terms) compared to
2011. Sales to this region increased in almost all
countries and more than offset declines recorded in
Kazakhstan, Azerbaijan and Belorussia.
New products launched in the CIS republics during 2012
Brand name Active ingredient Therapeutic area Launch date
PARNASSAN olanzapine Central ner vous system, antipsychotic Q1, 2012
DARILYA drospirenone + 20mcg EE(1) Gynaecology, oral contraceptive Q2, 2012
DOLFORIN (2) fentanyl Central ner vous system / Oncology, opioid analgesic Q2, 2012
GOLDLILY Cu + Au Gynaecology, IUD Q2, 2012
SUPRA X (2) cefixime Antibiotic Q2, 2012
VIDOTIN perindopril Cardiovascular, antihypertensive Q2, 2012
DUPLECOR amlodipine + atorvastatin Cardiovascular, antihypertensive + cholesterol lowering Q3, 2012
PERINDOPRIL- INDAPAMIDE RICHTER
perindopril + indapamide Cardiovascular, antihypertensive Q3, 2012
LENUXIN escitalopram Central ner vous system, antidepressant Q3, 2012
DIMIA drospirenone + 20mcg EE (1) Gynaecology, oral contraceptive Q3, 2012
SILUET TE dienogest + 30mcg EE (1) Gynaecology, oral contraceptive Q3, 2012
BIDOP bisoprolol Cardiovascular, antihypertensive, cardiac therapy Q3, 2012
SINGLON montelucast Respirator y, antiasthmatic Q3, 2012
MERTENIL rosuvastatin Cardiovascular, cholesterol lowering Q3, 2012
DOLFORIN (2) fentanyl Central ner vous system / Oncology, opioid analgesic Q3, 2012
BEL ARA chlormadinone + EE (1) Gynaecology, oral contraceptive Q4, 2012
SONIRID DUO finasteride + tamsulosine Urology, benign prostate hypertrophy Q4, 2012
ZILOL A (2) levocetirizine Respirator y, antiallergic Q4, 2012
Notes: (1) EE: ethynil estradiol (2) Licensed-in products
Annual Report | Gedeon Richter 2012 | 5150 | Annual Report | Gedeon Richter 2012

Sales to the USA
125.8
17 7.4
139.9
102.0
71.7
180
160
140
120
100
80
60
40
20
0
2008 2009 2010 2011 2012
US$
m
USASales in the USA totalled US$ 71.7 million
(EUR 55.8 million) in 2012, a decline of 29.7 per-
cent in US$ terms (23.9 percent in EUR terms). As
indicated in previous reports revenues in connection
with the drospirenone related profit sharing
agreements declined further due to increased generic
competition. Turnover of matured gynaecological
products also showed a decline year on year.
However significant sales growth of the finished
form emergency contraceptive PLAN B ONE STEP
was recorded during the reported period.
Rest of the WorldSales in these countries amounted to EUR 56.6 million
(US$ 72.7 million) in 2012, a decline of 2.2 percent (9.9
percent in US$ terms) when compared to 2011.
Notable sales levels in 2012 were achieved in Vietnam
(EUR 6.8 million), in China (EUR 6.1 million), in Serbia
(EUR 4.1 million) and in Brazil (EUR 3.4 million).
Female HealthcareIn recognition of the strategic importance to
the Company of this therapeutic area a brief
presentation of the Female Healthcare (FH) franchise
is presented below. This therapeutic area includes
the following product groups and therapeutic
indications: oral contraceptives (OC), emergency
contraceptives (EC), contraceptive devices (CD);
menopausal care, pregnancy care and obstetrics,
gynaecological infections, and other gynaecological
conditions.
HungaryIn Hungary FH sales totalled HUF 4,486 million (EUR
15.5 million) in 2012, representing flat sales (in Euro
terms a 3.1 percent decrease) compared to the levels
reported in 2011.
European UnionFH sales in the European Union, excluding Hungary,
amounted to EUR 128.7 million in 2012, representing
an increase of EUR 9.7 million (8.2 percent) when
compared to 2011.
In the reported period sales of FH products
represented 42 percent of the turnover in this region.
FH sales in Romania increased by RON 0.6 million
and amounted to RON 32.5 million (EUR 7.3 million)
in 2012, while in Poland turnover increased by
PLN 10.4 million totaling PLN 58.9 million (EUR 14.1
million) during the same period. In the EU 9 region
FH sales totalled EUR 24.9 million in 2012, 10.2
percent higher compared to the previous year. With
respect to FH sales the EU9 countries altogether
represented 19 percent of the Group’s EU sales. In
2012 OCs belonging to the acquired portfolio from
Grünenthal also contributed EUR 2.3 million to FH
sales achieved in the EU9 region.
Following the reclassification with effect from 1
January 2012 of the trading companies from the
Other segment to Pharmaceutical segment, sales of
the acquired OC portfolio are entirely reported now
as belonging to the core Pharmaceutical segment.
Base period data has been restated for comparison
purposes.
In the ‘traditional’ 15 EU Member States FH sales
amounted to EUR 82.4 million in 2012, showing a
EUR 5.3 million growth over the levels recorded in
the previous year. This region contributed 64 percent
of total EU FH sales. Turnover of the acquired OC
portfolio amounted to EUR 42.2 million in 2012
compared to EUR 52.5 million recorded in 2011. The
year on year decline was primarily due to higher
stock levels built towards the end of 2011. When
sales of the acquired OC portfolio is deducted from
the above figure FH sales revenue from this region
amounted to EUR 40.2 million, 63.4 percent higher
than in 2011. The year-on-year increase is primarily
due to recent OC launches in Western Europe.
In Germany Richter Group reported gynaecological
sales of EUR 44.6 million, representing a EUR 6.9
million increase compared to 2011.
Sales of the acquired OC portfolio accounted in the
2012 for EUR 29.1 million in Germany, EUR 5.9 million
in Italy, EUR 3.0 million in Spain, EUR 1.8 million in
Portugal and EUR 1.5 million in Austria.
In France the Group’s turnover arising from FH
products amounted to EUR 12.0 million in 2012.
The good performance is mostly related to the
turnover of our generic drospirenone containing
fourth generation OC together with desogestrel
based AZALIA on the French market.
CISFH sales to the CIS in 2012 totalled EUR 102.7 million
representing an increase of EUR 14.5 million over the
sales levels achieved in the prior year.
Turnover of gynaecological products represented
22 percent of total CIS sales in 2012.
USAFH sales in the USA totalled US$ 68.7 million
(EUR 53.5 million) in 2012, a 29.5 percent decline
in US$ terms (23.5 percent in EUR terms) when
compared to the previous year.
Sales of FH products, including the profit sharing
related to drospirenone, represented 96 percent of
US sales.
Growth in sales of the finished form emergency
contraceptive PLAN B ONESTEP was recorded during
the reported period.
Rest of the WorldFH sales in these countries amounted to
EUR 26.8 million (US$ 34.6 million) in 2012,
a decline of 10.1 percent (16.6 percent in US$ terms)
compared to 2011.
Female Healthcare sales by region
2012 2011 (1) Change 2012 2011 (1) Change
HUFm HUFm HUFm % EURm EURm EURm %
Hungar y 4,486 4,486 0 0.0 15.5 16.0 -0.5 -3.1
EU (2) 37,194 33,311 3,883 11.7 128.7 119.0 9.7 8.2
Poland 4,073 3,289 784 23.8 14.1 11.8 2.3 19.5
Romania 2,110 2,109 1 0.0 7.3 7.5 -0.2 -2.7
EU 9 7,192 6,327 865 13.7 24.9 22.6 2.3 10.2
EU 15 23,819 21,586 2,233 10.3 82.4 7 7.1 5.3 6.9
CIS 29,695 24,708 4,987 20.2 102.7 88.2 14.5 16.4
Russia 22,840 20,084 2,756 13.7 79.0 71.7 7.3 10.2
Ukraine 3,207 2,121 1,086 51.2 11.1 7.6 3.5 46.1
Other CIS republics 3,648 2,503 1,145 45.7 12.6 8.9 3.7 41.6
USA 15,459 19,585 -4,126 -21.1 53.5 69.9 -16.4 -23.5
Rest of the World 7,7 73 8,332 -559 -6.7 26.8 29.8 -3.0 -10.1
Total 94,607 90,422 4,185 4.6 327.2 322.9 4.3 1.3
Notes: (1) Segment compositions have changed, base period data have been restated accordingly. (2) All Member States of the European Union, except for Hungar y.
Annual Report | Gedeon Richter 2012 | 5352 | Annual Report | Gedeon Richter 2012

e. Corporate Social Responsibility
Aware of the Company’s responsibility to society in
general Richter’s management pays high attention
towards Corporate Social Responsibility (CSR). The
Company embraces responsibility for its actions,
minimises negative impact and enhances positive
impact through its activities on the environment,
consumers, employees, communities, stakeholders
and all other members of the public while exploring
opportunities for developing innovative products,
services and business models that contribute to
social wellbeing and lead to higher quality and more
productive employment.
Richter’s management has always believed that it is
pivotal for the company to comply with all relevant
national and international legislation, including the
rules and guidelines issued by public institutions such
as the European Medicines Agency (EMA) and the U.S.
Food and Drug Administration (FDA). Gedeon Richter
has established policies and procedures to ensure
responsible business ethics and in specific areas it rec-
ognises that is important to maintain higher ethical
standards than those required by local legislation.
Environmental PolicyAt Richter environmental considerations are an
integral part of decision-making processes and
the focus is always on prevention. Our more than
110 year history together with pharmaceutical
manufacturing experience and wide-ranging
scientific expertise is combined with modern
technical, health and safety requirements and with
the exacting quality standards of today.
Pharmaceutical manufacturing carries a number of
risks. In the course of pursuing our investments and
development projects, we pay particular attention
to ensuring that the environmental protection tasks
related to our operations are carried out responsibly
by using modern technology and continuously
minimising the environmental footprint of our
activities. All three of our main manufacturing
sites in Hungary possess IPPC (Integrated Pollution
Prevention and Control) permits.
Environmental Management Systems at the
Company meet all requirements of ISO 14001:2004
standards. The most recent re-certification au-
dit, which is valid for three years, was successfully
completed in 2010. The accredited status of the
Environmental Laboratory was also renewed by the
relevant authority.
Based on the approval of the relevant authority
soil and groundwater decontamination works
were initiated in Dorog during 2012. Following
receipt of the necessary establishment permission
construction of the cut-off wall and the adjoining
transfer pump system has been completed in 2012.
Soil water production wells are expected to be
established during 2013.
Lajos Kovács – Technical Director
Annual Report | Gedeon Richter 2012 | 55

The Municipality of Dorog recently approved
modifications to the development plan for the city,
which resulted in revised noise limits. A required
noise reduction program and related investments
will be carried out in line with the new noise limits.
Health and Safety at WorkMuch of the work performed at the company
involves the use of hazardous chemicals. These
circumstances demand a highly responsible attitude
towards safety at work in order to minimise the risks
arising from these potential hazards.
Work Health and Safety Management System Work safety is dependent on the technical state
of working tools and equipment, and the conduct
displayed by employees at work. The latter includes
management’s awareness of safety issues, and
naturally the professional skills of the workers
themselves.
Our Health and Safety Management System (HSMS)
in compliance with OHSAS 18001:1999 standard, was
officially certified at the beginning of 2006, making
Gedeon Richter the first Hungarian pharmaceutical
company to obtain this type of assurance. As a result
of the latest audit with the more stringent criteria of
OHSAS 18001:2007 the Company was successfully
re-certified in 2009 for a further three years. The
system is structured similarly to the related quality
assurance (GMP) and environmental (ISO 14001)
systems, but operates independently of them.
The accreditation of the Safety Laboratory in
Bu dapest was renewed by the authorities. In
addition, the accreditation documentation of the
similar Laboratory in Dorog was also approved.
Modernisation of the equipments of these la bo-
ratories is expected to get effectuated during 2013.
The management of Richter is committed to the
perpetual improvement of the organization’s health
and safety performance, to compliance with current
legislation and other requirements and to the
prevention of occupational injuries and illnesses. It is
the responsibility of work supervisors to familiarise
themselves with the risks of a given job and to
manage and oversee work processes accordingly. It is
both the right and obligation of workers to demand
safe working conditions and to comply with the
health and safety at work regulations.
The representation of employees’ interests with
respect to occupational health and safety is
performed by elected safety officers who are also
members of the Safety Committee.
Practical ImplementationRichter pays particular attention to creating a safe
workplace environment. Continuous improvement
to technological standards in all of our plants,
ongoing training in the field of safety and regular
reviews of safety procedures are all factors taken into
account in this initiative.
Special precautions are taken in the case of tasks
that involve the use of potentially hazardous
materials. We make every effort to minimise the
exposure of our employees to risks, and accordingly
we are doing all we can to replace dangerous
materials with less hazardous equivalents. We are
committed to ensuring the safety of our employees
through the use of closed technology wherever
possible. If this is not feasible, then we implement
the appropriate special protective measures. To
ensure the early detection of any signs of possible
damage to health, our employees undergo regular
medical checkups, and, as a preventive action,
occupational risks are revealed through the on-site
measurements carried out by the Safety Laboratory.
We apply a multi-tiered risk management process,
with the most important prevention and action
plans managed at project level, within a framework
of a system of targets and programs. We also met
during 2012 the requirements established by the
European Union legislation (REACH and CLP) related
to the registration and labelling of chemicals used in
production processes.
Our fire protection policy places particular emphasis
on prevention. This includes a network of sensors
covering the entire premises ensuring the early
detection of any possible causes of fire that may
nonetheless break out.
An engineering team at the Company are responsible
for ensuring that potentially dangerous machines
and appliances comply with authority regulations,
and that they are safe to use.
According to the resolution of the relevant Authority
the site in Vecsés has been rated as ‘Lower Tier’ under
the SEVESO II Directive. To remedy this, a disaster
prevention documentation was prepared in 2012 and
is expected to be submitted for approval in 2013.
No fatal accidents or other serious work related
injuries occurred at any of our facilities during 2012.
Community InvolvementThe management of Gedeon Richter have always
been aware of the importance of community
involvement. We recognise that as a leading
pharmaceutical manufacturer and employer in Hun-
gary it is our responsibility to maintain dialogue with
society at large and with those who have an interest
in the Company’s activities. In this respect Gedeon
Richter supports projects in the areas of healthcare,
science, education and environmental protection
in line with its mission of improving health and the
quality of life. The Company provides substantial
support to healthcare institutions and organizations
established with the aim of taking care of patients.
To encourage young people’s interests we sponsor
a wide range of science-based school programmes,
including chemistry education in secondary schools
and university programmes both in Hungary and
abroad. Special agreements have been concluded
with universities of natural sciences in order to
support specific education and research activities.
For talented and ambitious PhD students, we
provide scholarships via the so called ‘Talentum
Foundation’, which was established by the Company.
The scope of the Foundation has been widened in
order to include secondary school students, thereby
providing future career opportunities for them.
On the occasion of its centenary in 2001 the
Company created a foundation which has as its aim
the support of scientific research and university
education in the field of pharmaceutical research not
only in Hungary but also for Hungarian talent living
abroad.
f. PeopleChanges in the pharmaceutical sector over the past
decade have made inevitable the transformation of
our business model to one that is more innovative. In
order to be effective within an external environment
of growing complexity and change with exponential
speed we need highly skilled, passionate and
motivated people.
We work to achieve this by:
• developing our people at all levels to realise their
full potential
• offering an inclusive culture that draws on the
diverse skills, background and knowledge of every
employee
• identifying our internal and external talent – those
who have the right skill sets for current and future
business requirements
Together our activities improve our ability to
solve problems, discover innovative solutions and
enhance effectiveness and performance of our
teams and leaders. Inclusion supports engagement,
which in turn fosters productivity and creativity.
Our experience and numerous studies show that
employee engagement is a key driver of employee
wellbeing, as well as better individual and business
performance. For these reasons we constantly seek
new opportunities to engage our employees and
drive innovation.
With more than 11,000 employees, we value the
diverse skills and capabilities that a workforce with
different cultural backgrounds brings to our busi-
ness. We work continuously to align these skills and
capabilities with strategic and operational needs.
EmployeesThe total headcount for the Group was 11,103 at
the end of 2012, a 3 percent (330) increase when
compared with 2011. The growth was primarily due
to the expanding biosimilar business both in Debre-
cen and in Budapest.
Annual Report | Gedeon Richter 2012 | 5756 | Annual Report | Gedeon Richter 2012

The proportion of skilled employees at the Group
increased to 6,217 at the end of 2012, from
5,981 reported in 2011. The graduate educated
personnel represented 84 percent of white
collar staff and 56 percent of the total number
of employees at the Group.
Recruitment and Individual Development Recruiting, retaining and developing our employees
were also critical activities in 2012, in order to
enhance and sustain our performance. Proactive
talent acquisition initiatives underpin our ability to
attract specialist and leadership talent externally.
In the recruiting process we pay high attention to
the selection of those candidates whose professional
skills and experiences are expected to contribute the
most to Richter’s success and whose career plans
and attitudes are expected to fit with the Company’s
corporate culture.
Most available positions are posted on our careers
website. We are convinced that using the web enables
us to reach far more people than through any other
media for recruitment. This facility is also available to
existing employees via our careers intranet site. We
encourage employees to develop their careers within
Richter rather than looking outside the Company. We
want all our employees to achieve their full potential
and at the same time strengthen our business.
A Welcome Programme for young Employees aims at
giving an insight into the organisation of Richter, its
activities, company culture and values.
Employees receive regular feedback on their per-
formance and meet with their managers to discuss
development opportunities and their career goals.
This annual performance and development planning
process ensures that employees set business aligned
objectives and behavioural goals and helps them
identify the training they need to develop their
careers.
We encourage and support all our people in fully
developing their capabilities with a range of high
quality learning and development opportunities.
We offer training programmes, including coaching,
languages and other courses to ensure employees
have the skills needed in our business. The Company
makes special efforts to assist scientific and
professional education and postgraduate training.
To encourage personal development the Company
82%
84% 84%
83% 83%
Graduates
85%
84%
83%
82%
81%
Proportion of graduates*
Note: * Within the white collar staff at the Group.
2008 2009 2010 2011 2012
Graduates
continued during 2012 to support employees to
participate in university education, including PhD
courses.
To support innovation and knowledge sharing
within our Group in 2012 we organised again the
competition called RITA (Richter Innovation and
Knowledge Base Archive) which encourages and
remunerate innovative ideas. RITA has clearly
demonstrated how efficiently innovation and
teamwork can encourage and motivate people at
our Company.
Developing Leaders Since we need good succession planning not just
for senior roles but for all critical positions across
the organisation we maintain a well established
leadership strategy to identify and develop our
highly skilled candidates and use a systematic and
disciplined approach to leadership development.
Currently we have three leadership programs
running and one in pilot phase:
Well established management training programmes
involving all managers of the Company both at
middle and senior levels were ongoing in 2012.
Based on the results of the Leadership Competence
Assessment programme, all managers designed their
personal coaching programme and identified the key
areas for further improvement. For those managers
appointed within the last three years a special
manager training programme was implemented so
as to identify and develop management skills and
self-knowledge.
Our career development program, started in 2006,
which focuses on further development of high po-
tential management talent continued in 2012. A com-
prehensive competence assessment was provided for
those colleagues who participated in this programme
as a potential option to develop their self-knowledge.
It is pleasing to report that approximately 20 percent
of the participants were promoted to new manage-
ment positions during the development programme.
New candidates have been admitted to this pro-
gramme in each year since its inception.
In 2011 we enhanced a system which presents
professional development opportunities within
the Company offering future career opportunities
for new entrants and existing employees alike. As a
pilot project we introduced this system for graduate
educated personnel in four departments in 2012.
Based on the experience gained we expect to expand
the system across the whole Company during 2013.
Remuneration and Other Employee ProgrammesCompensation philosophy at Gedeon Richter is
based on the Company’s commitment to a perfor-
mance culture. Performance based salary, share
awards, other forms of allowances as well as career
development planning, various training activities
and continuing education all contribute to the
retention of key talent, superior performance and
the accomplishment of business targets.
We focus on the health factors that enable
employees to perform at the highest level by
sustaining energy and engagement. A new two-year
employee health programme wholly financed by the
Company was initiated in 2012. All employees can
participate in this wide-ranging medical programme
which aimed to minimise illness by early diagnosis.
Providing a safe workplace and promoting the health
and well-being of all our people has always been a
core priority for Richter. Well-being programmes
including sport and recreational opportunities at
the Company are planned to promote physical and
psychological welfare and to help employees cope
with demanding roles.
With the aim of improving the efficiency of Hu-
man Resources activities within the Group, special
meetings were organized by the Human Resources
Department at individual subsidiaries. The main
topics of these meetings included the review of the
current HR policies of the Group and identification
of those areas which may be subjects for further
development. Additionally, in order to optimise
the cooperation of different departments at the
Company and increase their efficiency we initiated
organisational development projects.
Richter celebrated the 110th anniversary of its
founding in 2011. On this occasion we conducted
a survey on the Company’s corporate and
organizational structure within the framework of
a project called RGH-110. In 2012 we evaluated the
results of this project and determined the necessary
steps we need to take to maintain and enhance busi-
ness performance.
Number of staff
Total headcount
White collar staff
12,000
10,000
8,000
6,000
4,000
2008 2009 2010 2011 2012
Total headcount GraduatesWhite collar staff
Annual Report | Gedeon Richter 2012 | 5958 | Annual Report | Gedeon Richter 2012

2. Wholesale and Retail
ichter Group is active in two major business
segments, primarily Pharmaceuticals
comprising the research and development,
manufacturing and marketing of pharmaceutical
products and also engaged in the Wholesale and
Retail of these products. These latter activities are
mainly focused in Romania although the Group has
also built up retail businesses in certain CIS republics.
Pharmafarm is the only wholesaler belonging to
Richter Group following the merger of Dita Import
Export and Pharmafarm in 2010. Gedeon Richter
Farmacia is our major retail operation. Altogether
120 pharmacy units support the promotion and sale
of Richter products in Romania.
SalesWith effect from 1 January 2012, our Jamaican
subsidiaries which carry out distribution, previously
classified as belonging to Other segment, were
reclassified to the Wholesale and Retail segment.
For comparison purposes restated data for the base
period has been provided in this report.
Sales amounted to EUR 159.7 million in 2012, an
increase of 10.7 percent compared to the previous year.
Our Romanian subsidiaries realized 70 percent of
the turnover in the Wholesale and Retail segment
(RON 500.0 million), with the remainder primarily
being invoiced by our subsidiaries in the CIS region.
The sales growth in Romania was 7.3 percent in
RON terms (2.2 percent in EUR terms) in 2012.
The Romanian pharma market continues to be
characterised by excessive payment delays (up to 360
days or more) to pharmaceutical companies due to
continuing delays in payments to pharmacists from
the National Health Insurance House.
3. Group Figures
he activities of Richter are presented in
this Annual Report along three operating
segments. Those subsidiaries of the Group that
are engaged in the core activities of research and
development together with manufacturing and
marketing and sale of pharmaceutical products have
been classified as the Pharmaceutical segment. With
effect from 1 January 2012 management reclassified
to the Pharmaceutical segment those trading and
marketing companies, previously classified as
belonging to Other segment, which undertake direct
sales and promotion of Richter products. The per-
formance of those distributor and retail subsidiaries
that represent the distribution chain in some of
our markets and facilitate our products reaching
final buyers are presented under the Wholesale and
Retail segment. With effect from 1 January 2012 our
Jamaican subsidiaries (realizing a turnover of EUR
11.1 million in the reported year) which carry out
distribution, previously classified as belonging to the
Other segment, were reclassified to the Wholesale
and Retail segment. Finally, the Other segment
relates to the business of those group members
that do not belong to any of the above segments.
These companies provide services to group members
belonging to the Pharmaceutical segment. Note that
for comparison purposes restated data for the base
period have been provided in this report.
Wholesale and retail sales
2012 2011 Change 2012 2011 Change
HUFm HUFm % EURm EURm %
Hungar y 407 553 -26.4 1.4 2.0 -30.0
Romania 32,448 30,760 5.5 112.2 109.8 2.2
CIS 10,097 6,359 58.8 35.0 22.7 54.2
RoW 3,214 2,706 18.8 11.1 9.7 14.4
Total 46,166 40,378 14.3 159.7 144.2 10.7
R
Dr. Gábor Gulácsi – Chief Financial Off icer
T
Annual Report | Gedeon Richter 2012 | 61

a. Business Segment Information
In the following section we present key data by business segments.
b. Consolidated Turnover
c. Key Financial Data
d. Profit and Loss ItemsSales amounted to HUF 326,702 million (EUR 1,130.1
million) in 2012, a 6.1 percent increase (2.8 percent in
Euro terms) when compared with previous year.
The Hungarian Forint weakened when compared to
the base period impacting positively the top line and
gross profit.
Cost of sales amounted to HUF 124,999 million (EUR
432.4 million) in 2012, an increase of HUF 10,470
million (EUR 23.4 million) when compared to 2011.
Sales of ESMYA® for the indication of preoperative
uterine fibrosis commenced in certain EU countries
and thus the amortization of the amount relevant to
European markets of the acquired intangible asset
also commenced with effect from the second quarter.
This amounted to HUF 1,791 million in 2012.
Gross profit totalled HUF 201,703 million (EUR 697.7
million) in 2012, an increase of HUF 8,364 million
(EUR 7.2 million) over the levels reported for 2011.
Gross margin in 2012 at 61.7 percent decreased
from the 62.8 percent level achieved in the previous
year. The increase in the share of sales arising from
the Wholesale and Retail segment within total
sales together with a further decline in the high
margin US business and the ESMYA®-related
amortization moved the total gross margin
downwards. Positive developments including a
weaker HUF/EUR exchange rate together with a
higher than average increase of turnover in the CIS
countries could not offset the negative drivers of the
gross margin.
Sales and marketing expenses amounted to HUF
92,794 million (EUR 321.0 million) in 2012, a 17.3 per-
cent (13.6 percent in Euro terms) increase compared
with 2011. The proportion to sales of S&M expenses
was 28.4 percent in the reported year. Sales and
marketing costs were significantly higher when
compared to the base period primarily due to the
costs of our female healthcare sales network in
Western Europe which was further expanded during
the reported period together with marketing and
promotion costs related to the launch of ESMYA®.
Amortisation of the marketing and intellectual
property rights of the OC portfolio acquired from
Grünenthal in the amount of HUF 4,355 million
represented approximately 1.3 percent of sales
achieved in the reported year.
The annual registration fee payable in respect of
medical representatives in Hungary amounted to HUF
431 million in 2012. In accordance with the most recent
Business Segment Information
Pharmaceuticals Wholesale and retail Other Eliminations Group total
HUFm HUFm HUFm HUFm HUFm2012
Audited 2011
Restated*2012
Audited 2011
Restated*2012
Audited 2011
Restated*2012
Audited 2011
Restated*2012
Audited 2011
Restated*
Total revenues 286,479 271,692 46,166 40,378 3,888 3,713 (9,831) (7,915) 326,702 307,868
Gross profit 195,096 186,655 5,480 5,605 1,431 1,447 (304) (368) 201,703 193,339
Profit from operations 50,426 63,160 (1,334) (2,300) (116) 275 (255) (208) 48,721 60,927
Share of profit / loss of associates
- - 342 (4,234) - - - - 342 (4,234)
Number of employees at period end
9,294 8,997 1,451 1,421 358 355 - - 11,103 10,7 73
Note: *Segment composition have changed, base period data have been restated accordingly.
Sales by region
2012 2011 Change 2012 2011 Change
HUFm HUFm HUFm % EURm EURm EURm %
Hungar y 30,932 35,683 -4,751 -13.3 107.0 127.4 -20.4 -16.0
EU * 116,721 108,916 7,805 7.2 403.7 389.0 14.7 3.8
Poland 22,622 19,503 3,119 16.0 78.2 69.7 8.5 12.2
Romania 37,984 36,287 1,697 4.7 131.4 129.6 1.8 1.4
EU 9 23,106 21,369 1,737 8.1 79.9 76.3 3.6 4.7
EU 15 33,009 31,757 1,252 3.9 114.2 113.4 0.8 0.7
CIS 143,975 124,410 19,565 15.7 498.0 444.3 53.7 12.1
Russia 97,397 88,598 8,799 9.9 336.9 316.4 20.5 6.5
Ukraine 19,731 14,698 5,033 34.2 68.2 52.5 15.7 29.9
Other CIS republics 26,847 21,114 5,733 27.2 92.9 75.4 17.5 23.2
USA 16,123 20,513 -4,390 -21.4 55.8 73.3 -17.5 -23.9
Rest of the World 18,951 18,346 605 3.3 65.6 65.5 0.1 0.2
Total 326,702 307,868 18,834 6.1 1,130.1 1,099.5 30.6 2.8
Note: * All Member States of the European Union, except for Hungar y.
Key Financial Data
2012 2011 Change 2012 2011 Change
HUFm HUFm % EURm EURm %
Total revenues 326,702 307,868 6.1 1,130.1 1,099.5 2.8
Gross profit 201,703 193,339 4.3 697.7 690.5 1.0
Gross margin % 61.7 62.8 61.7 62.8
Profit from operations 48,721 60,927 -20.0 168.5 217.6 -22.6
Operating margin % 14.9 19.8 14.9 19.8
Profit before income tax 49,921 49,671 0.5 172.7 17 7.4 -2.7
Profit for the year 49,080 49,453 -0.8 169.8 176.6 -3.9
Net margin % 15.0 16.1 15.0 16.1
EPS (HUF, EUR)(1) 2,643 2,644 0.0 9.14 9.44 -3.2
Total assets and total equity and liabilities 672,237 681,970 -1.4 2,307.7 2,192.1 5.3
Capital and reser ves(2) 520,074 489,856 6.2 1,785.3 1,574.6 13.4
Capital expenditure 29,67 7 32,285 -8.1 102.7 115.3 -10.9
Number of employees at year-end 11,103 10,7 73 3.1
Notes: (1) EPS calculations were based on the total number of shares issued. (2) Includes minority interest.
Annual Report | Gedeon Richter 2012 | 6362 | Annual Report | Gedeon Richter 2012

changes to the regulations we were able to offset the
tax payable in 2012 on this ground by 90 percent of tax
liability of same kind incurred during 2011.
Administrative and general expenses totalled HUF
20,179 million (EUR 69.8 million) in 2012, representing
a 17.3 percent decrease (20.0 percent in Euro terms)
when compared with the levels recorded in the
previous year. Expenses reported in 2011 included
a one-off amount of time proportional liabilities
associated with medium term PregLem mana-
gement incentive schemes which created a high
base while in 2012 costs decreased as a result of
the implementation of a cost-cutting programme
throughout the Group.
Research and development costs represented 11.9
percent of sales and increased by 35.3 percent to
HUF 38,847 million (EUR 134.4 million) during the
reported year. These costs include the ongoing
clinical trials being carried out in co-operation with
Forest Laboratories while R&D expenses of the
Group also now include such costs of PregLem and
biotechnological expenditures incurred both in Hun-
gary and in Germany.
Other income and other expenses represented an
expense of HUF 1,162 million (EUR 4.0 million) in
2012, when compared to an expense of HUF 172 mil-
lion (EUR 0.6 million) in the previous year. One-off
milestone payments received during 2012 positively
impacted the balance of this item although the
break-up fee of HUF 8.1 billion paid by Genefar signifi-
cantly improved the balance during the base period.
Changes in the likelihood of payments in respect of
deferred liabilities to previous owners of PregLem im-
pacted negatively both 2011 and 2012. We accounted
for an expense of HUF 5,041 million in 2011 while only
HUF 654 million were expensed on this expenditure
category in 2012.
The 20 percent tax obligation payable in respect of
turnover related to reimbursed sales in Hungary
amounted to HUF 487 million in 2012. In accordance
with the most recent changes to the regulations we
were able to offset the tax payable in 2012 on this
ground by 90 percent of tax liability of same kind
incurred during 2011.
In accordance with the claw-back regime announced
in Romania the authority establishes the amount of
extraordinary tax to be p aid based on the compari-
son of the subsidies allocated for reimbursed drugs
and manufacturers’ sales thereof. Such taxes were
accounted for in the amount of RON 12.8 million
during the reported year at those companies which
belong to the Pharmaceutical segment of the Group.
Profit from operations decreased by 20.0 percent
and amounted to HUF 48,721 million. In EUR terms
it decreased by 22.6 percent to EUR 168.5 million in
2012. The positive effects of the favourable trends
in exchange rates experienced in the first half of
2012 together with milestone payments received
during the reported period were offset by the
increase in sales and marketing expenses and higher
R&D spending. Additionally, extraordinary one-
off incomes which were received during the base
period were not repeated in 2012. The consolidated
operating margin decreased to 14.9 percent during
the reported year from the 19.8 percent reported in
2011. Following the acquisitions made in 2010 the
amortization of both ESMYA® and the acquired OC
portfolio were incurred as new cost items in the
reported period and amounted to HUF 6,146 million.
Net financial income for the Group is analysed in
detail in the following table:
The net financial income in 2012 totalled HUF 858
million (EUR 3.0 million), reflecting an increase of
HUF 7,880 million (EUR 28.1 million) when compared
to a net financial loss of HUF 7,022 million (EUR 25.1
million) reported in 2011.
At the end of each reporting period foreign currency
related assets and liabilites are routinely reassessed
with the change in value being reflected as
unrealised financial items. The total impact of such
reassessments amounted to a gain of HUF 9,004
million (EUR 31.2 million) at the end of December
2012, an increase of HUF 12,665 million (EUR 44.3
million) when compared with the HUF 3,661 million
(EUR 13.1 million) loss reported in 2011. An unwinding
of discounted value related to a liability in respect of
PregLem at a loss of HUF 3,004 million was partly
offset by a gain accounted for as the revaluation of
exchange rates applied to this liability included in the
reassessment of other currency related items.
On 14 June 2011 Gedeon Richter Plc. and the European
Investment Bank signed a EUR 150 million credit line
contract aimed at the financing of Richter’s original
research activities targeting compounds, which are
active in diseases of the Central Nervous System,
together with the development of biosimilar prod-
ucts. A second tranche amounting to EUR 50 million
was called on 30 January 2012.
Losses incurred on the realized financial items in 2012
reflect a significant strengthening of the HUF during
the reported year when compared to 2011 year-end
exchange rates. Exchange losses realized on trade
receivables and trade payables amounted to HUF
3,905 million, while conversion of FOREX related
items resulted in a loss of HUF 3,379 million.
In the second quarter 2012 following the Euro-
pean marketing authorization related to the
first indication of ESMYA® a milestone payment
became liable and was paid to the previous owners
of PregLem while in the third quarter a further
milestone payment was paid in respect of a Phase III
clinical trial of a long term on-off indication.
Net financial income
2012 2011 Change 2012 2011 Change
HUFm HUFm HUFm EURm EURm EURm
Unrealised financial items 5,745 -13,025 18,7 70 19.9 -46.5 66.4
Reassessment of currency related trade receivables and trade payables 3,912 2,248 1,664 13.5 8.0 5.5
Reassessment of currency loans -81 132 -213 -0.3 0.5 -0.8
Reassessment of credit 4,191 -5,504 9,695 14.5 -19.7 34.2
Reassessment of other currency related items 982 -537 1,519 3.5 -1.9 5.4
Unwinding of discounted value related to liability in respect of PregLem -3,004 -4,493 1,489 -10.4 -16.1 5.7
Reversal of assessment of for ward exchange contracts as of 1 Januar y 249 -64 313 0.9 -0.2 1.1
Result of unrealised for ward exchange and swap contracts -504 -249 -255 -1.8 -0.9 -0.9
Impairment losses at investments - -4,558 4,558 - -16.2 16.2
Realised financial items -4,887 6,003 -10,890 16.9 21.4 -38.3
Result of realised for ward exchange contracts -138 189 -327 -0.5 0.7 -1.2
Exchange (loss) / gains realised on trade receivables and trade payables -3,905 2,089 -5,994 -13.5 7.5 -21
Exchange (loss) /gains on conversion -3,379 1,744 -5,123 -11.7 6.2 -17.9
Dividends 308 59 249 1.0 0.2 0.8
Interest income 4,652 3,415 1,237 16.1 12.2 3.9
Interest expense -1,805 -1,266 -539 -6.2 -4.6 -1.6
Other -620 -227 -393 -2.1 -0.8 -1.3
Net financial income/(loss) 858 -7,022 7,880 3.0 -25.1 28.1
Annual Report | Gedeon Richter 2012 | 6564 | Annual Report | Gedeon Richter 2012

Share of profit of associates amounted to a HUF 342
million (EUR 1.2 million) in 2012.
Profit before income tax amounted to HUF 49,921
million (EUR 172.7 million) an increase of HUF 250
million (a decrease of EUR 4.7 million) compared with
2011.
With effect from 1 January 2012 the period of 100
percent Income tax allowance ended for Gedeon
Richter Plc leaving the Parent company subject
to statutory income taxation in Hungary after
providing for the deduction of expensed R&D
costs from the tax base. In addition, in 2012 and
2013 the parent company is entitled for a futher
tax allowance related to the development of the
biosimilar manufacturing unit in Debrecen. All other
companies of the Group are subject to the statutory
tax regulations in effect in their respective countries
of incorporation. The balance of deferred tax was
significantly improved both in the base period and
in the reported period by the recalculation of such
taxes in respect of PregLem.
Profit for the year was HUF 49,080 million (EUR 169.8
million), HUF 373 million (EUR 6.8 million) below the
profit after taxation realised in 2011.
The above Profit after taxation includes income from
Non-controlling interests, the balance of which
amounted to a HUF 185 million (EUR 0.6 million) loss
during 2012.
Profit attributable to owners of the parent decreased
by HUF 16 million (by EUR 5.6 million) during
the reported year to HUF 49,265 million (EUR
170.4 million). It represented 15.1 percent of sales
compared with the 16.0 percent reported for the
previous year.
e. Balance Sheet ItemsDifferent levels of corporate taxation were applied
to the ESMYA® intangible asset valuation and to
the calculation of relevant deferred tax when
PregLem was first introduced to the consolidated
accounts of the Group. These have now been
reassessed and unified. As a result certain
audited figures for the years 2010 and 2011 have
been restated. The value at which ESMYA® as an
intangible asset was included in the accounts at
the time of its purchase has decreased by HUF
5,577 million, while the relevant deferred tax has
diminished by HUF 5,527 million. Goodwill, as a
result of the two changes in opposite directions has
not been impacted materially it grew by HUF 50
million. While the profit and loss statement for 2010
did not change, both the P&L and Equity statements
for 2011 were impacted to a small degree. Net pro-
fit decreased by HUF 99 million as a result of a
change in the balance of the deferred tax in addition
to a further HUF 13 million decrease in revaluation
reserves. These changes have been reflected in the
restated Balance sheet for the year 2011.
Total assets and total shareholders’ equity and
liabilities of the Group amounted to HUF 672,237
million on 31 December 2012, HUF 9,733 million,
or 1.4 percent lower than the restated figure for
31 December 2011.
Non-current assets amounted to HUF 376,442
million on 31 December 2012, 0.9 percent above
the restated amount as of 31 December 2011. The
amount of Other financial assets increased due
to higher levels of long term bonds together with
a change in the fair value of Richter’s share in the
Russian wholesaler and retail Group, Protek. In
accordance with IFRS 3 standards, the value of
ESMYA® has been accounted for as an intangible
asset and has been reassessed according to IAS 21
standards with the amortization thereof having
commenced as a result of the market launch of the
product. These two items resulted in a HUF 6,176
million or 3.9 percent reduction when compared to
their 31 December 2011 restated value.
Current assets amounted to HUF 295,795 million and
decreased by HUF 12,906 million (4.2 percent) when
compared to the level reported on 31 December 2011.
The change was due mainly to the Cash and cash
equivalents balance item, as Richter paid the tranches
due in respect of the PregLem acquisition together
with dividends as approved by the Annual General
Meeting. At the same time, cash increased as a result
of drawing down the second EIB credit tranche to the
value of EUR 50 million in January 2012.
Capital and reserves of the Group increased by 6.2
percent and amounted to HUF 520,074 million when
compared to the restated balance as at 31 December
2011. Retained earnings increased by HUF 37,985
million and amounted to HUF 469,498 million partly
offset by a HUF 12,509 million decrease reported in
Foreign currency translation reserves.
Non-current liabilities of the Group on 31 December
2012 at HUF 94,365 million were HUF 8,277 million
higher than the levels restated as of the end of the
previous year. A second credit tranche of EUR 50
million drawn down in January 2012 in accordance
with a credit line contract signed with the European
Investment Bank and the reassessment of existing
credits as at the year’s closing date were the main
reasons for this increase. Deferred tax liability
decreased by HUF 4,520 million when compared to
the restated amount as of 31 December 2011.
Current liabilities of the Group at HUF 57,798 million
on 31 December 2012 were 45.5 percent lower than
on 31 December 2011 mainly as a result of a payment
made in respect of the acquisition of PregLem
together with lower Trade payables.
f. Cash Flow
Cash flow
Net cash flow2012 2011
HUF m HUF m
From operating activities 57,002 82,973
From investing activities -74,635 -39,462
From financing activities 5,720 -5,251
Effect of foreign exchange rate changes -5,233 4,791
(Decrease)/Increase in cash and cash equivalents
-17,146 43,051
As indicated by the cash flow statement, during 2012
the Group generated net cash flow from operating
activities of HUF 57,002 million (EUR 197.2 million).
Lower levels of net cash from operating activities
arose mainly as a result of adverse movements
in the working capital, notably a change in the
expenditures related to the PregLem acquisition,
which did not imply cash movements as well as an
decreasing level of Payables at the end of 2012 as
opposed to an increasing level of the same recorded
on 31 December 2011.
Net cash flow directed towards investment activities
increased by HUF 35 billion (EUR 117.3 million)
primarily as a result of a deferred payment milestone
due having been realised to the previous owners of
PregLem.
Net cash flow originating from financing activities as
proceeds from treasury shares had a positive impact
on the level of cash and cash equivalents. Important
amounts of cash were directed towards capital
expenditure and payment of dividends.
Overall, cash decreased by HUF 17,146 million in 2012
in spite of including a second credit tranche in the
value of EUR 50 million having been drawn down
from the EIB credit facility during the reported year.
g. Treasury PolicyThe treasury activities of Richter are co-ordinated
and managed in accordance with procedures
approved by the Board of Directors. The treasury
function of the Parent Company maintains
responsibility for the financing of its activities
both on the domestic market and abroad
and the administration of trade receivables
and trade payables. It also manages exchange
rate risks relating to the group operations
and ensures appropriate financial income via
investing temporarily free cash through
bank deposits and open-ended funds and
government securities.
Considering that approximately 90 percent of
the Parent Company turnover is realised in various
international currencies, while its costs are
incurred mostly in Hungarian forints, operating
profit is exposed to numerous currency fluctuations.
To manage this exposure, the Board of Directors
has approved a strategy of foreign exchange rate
exposure risk reduction, in which forward contracts
used for hedging purposes are employed. Such
contracts have been concluded exclusively by the
Parent Company.
Annual Report | Gedeon Richter 2012 | 6766 | Annual Report | Gedeon Richter 2012

Since January 2000 until 2010, Richter has concluded
forward exchange contracts to manage its exposure
to fluctuations in exchange rates with expiry in first
half of 2011. No further forward exchange positions
have been opened since 2011 as the FOREX exposure
of the Group materially changed with effect from
1 January 2011 when RUB substituted EUR as its
invoicing currency in Russia.
Exchange rate movements are closely monitored
by the Company and the conclusion of any forward
exchange contracts will be subject to Management’s
review and approval.
Trading in a number of countries served by the
Group may give rise to sovereign risk and economic
uncertainty. Trade credit risks and related
impairment losses are closely monitored and subject
to the supervision of Richter’s deputy managing
director, the CFO of the Company.
h. Capital ExpenditureCapital expenditure including payments for intangi-
ble assets for the Group totalled HUF 29,677 million
in 2012 compared to HUF 32,285 million reported for
2011. Capital expenditure linked to the development
of biotechnology R&D facilities and manufacturing
capacity in Hungary was HUF 4,518 million in 2012.
Development and testing of the software which
controls and monitors the entire manufacturing
process at our biotechnological plant in Debrecen
began during 2012 including its customization
to individual equipment which had obtained
the required qualifications. Completion and
final authorization of the fully automatised
manufacturing unit is expected to take place in the
second half of 2013. A new sterile unit capable of
executing the filling of syringes and cartridges linked
to our biosimilar production facilities was completed
in Debrecen. A tabletting machine at our pilot plant
in Budapest was also installed during the year.
Within the scope of maintenance capital expenditure
a number of small-scale replacements were carried
out during 2012 at both important Hungarian
locations of the Group, Budapest and Dorog.
Furthermore, two new hormone containing
tablet packaging lines were put in to operation
responding to increasing capacity needs related to
the manufacturing relocation of the OC portfolio
acquired from Grünenthal in 2010.
Among the various small-scale capital expenditure
programs carried out at subsidiaries of the Group
it should be highlighted that in line with the
announced expansion of Russian operations and
having completed a temporary area to receive
incoming materials a warehousing capacity
expansion project was out in 2012. All other capacity
expansion related projects are ongoing according the
well established schedule.
Capital expenditure analysed by function in 2012
17%
14%
15%
31%17%
6%
CAPEX at manufacturing subsidiaries R&D (excluding biotechnology) Biotechnology Support for manufacturing License Other
DisclosuresI, the undersigned declare, that Gedeon Richter
Plc. takes full responsibility, that the management
report, which contains the Group’s 2012 full year
results is prepared in accordance with the applicable
accounting standards and according to the best of
our knowledge. The report above provides a true and
fair view of the financial position of Gedeon
Richter Plc., comprises the subsidiaries included
in the consolidation, contains an explanation of
material events and transactions that have taken
place during 2012 and their impact on the financial
position of Gedeon Richter Plc. and its subsidiaries
included in the consolidation.
Erik Bogsch
Managing Director
68 | Annual Report | Gedeon Richter 2012
V. Consolidated Financial Statements

70 | Annual Report | Gedeon Richter 2012 Annual Report | Gedeon Richter 2012 | 71

72 | Annual Report | Gedeon Richter 2012 Annual Report | Gedeon Richter 2012 | 73
Consolidated Income Statement
for the year ended 31 December 2012 Notes 2012 2011
HUF m HUF m
Restated*
Total revenues 5 326,702 307,868
Cost of sales (124,999) (114,529)
Gross profit 201,703 193,339
Sales and marketing expenses (92,794) (79,120)
Administration and general expenses (20,179) (24,407)
Research and development expenses (38,847) (28,713)
Other income and other expenses (net) (1,162) (172)
Profit from operations 5 48,721 60,927
Finance income 24,050 28,853
Finance costs (23,192) (35,875)
Net financial income/(loss) 7 858 (7,022)
Share of profit/(loss) of associates 15 342 (4,234)
Profit before income tax 49,921 49,671
Income tax 8 (841) (218)
Profit for the year 49,080 49,453
Profit attributable to
Owners of the parent 49,265 49,281
Non-controlling interest (185) 172
Earnings per share (HUF) 9
Basic 2,660 2,649
Diluted 2,643 2,644
*Restatement in connection with intangible assets (ESMYA), (Note 41).
Consolidated Statement of Comprehensive Income
for the year ended 31 December 2012 Notes 2012 2011
HUF m HUF m
Restated*
Profit for the year 49,080 49,453
Exchange differences arising on translation of foreign operations (12,874) 21,263
Revaluation reser ve for available for sale investments 25 2,495 (3,388)
Other comprehensive income for the year (10,379) 17,875
Total comprehensive income for the year 38,701 67,328
Attributable to:
Owners of the parent 39,251 66,905
Non-controlling interest (550) 423
*Restatement in connection with intangible assets (ESMYA), (Note 41).
Consolidated Balance Sheet
at 31 December 2012 Notes 2012 31 December 2011 1 January 2011
HUF m HUF m HUF m
Restated* Restated*
ASSETS
Non-current assets
Property, plant and equipment 11 158,508 155,630 144,674
Investment property 12 1,090 1,379 1,006
Goodwill 19 31,602 33,743 29,983
Other intangible assets 11 149,308 158,748 149,606
Investments in associates 15 2,115 1,754 6,093
Other financial assets 16 25,426 14,338 18,278
Deferred tax assets 17 3,342 3,605 1,624
Loans receivable 18 5,051 4,072 2,693
376,442 373,269 353,957
Current assets
Inventories 20 64,149 63,437 51,657
Trade receivables 21 102,476 103,487 85,602
Other current assets 22 16,582 10,873 10,485
Investments in securities 23 9,966 11,752 20,285
Current tax asset 17 1,117 501 164
Cash and cash equivalents 24 101,505 118,651 75,600
295,795 308,701 243,793
Total assets 672,237 681,970 597,750
EQUITY AND LIABILITIES
Capital and reser ves
Equity attributable to owners of the parent
Share capital 25 18,638 18,638 18,638
Treasur y shares 26 (1,716) (4,513) (539)
Share premium 15,214 15,214 15,214
Capital reser ves 3,475 3,475 3,475
Foreign currency translation reser ves 25 9,189 21,698 686
Revaluation reser ve for available for sale investments 25 2,463 (32) 3,356
Retained earnings 469,498 431,513 398,154
516,761 485,993 438,984
Non-controlling interest 3,313 3,863 3,131
520,074 489,856 442,115
Non-current liabilities
Borrowings 30 73,163 62,226 41,694
Deferred tax liability 17 9,634 14,154 14,153
Other non-current liability 31 11,568 9,708 37,730
94,365 86,088 93,57 7
Current liabilities
Borrowings 30 148 164 21
Trade payables 27 40,033 41,016 32,370
Current tax liabilities 17 123 34 192
Other payables and accruals 28 15,015 62,289 27,298
Provisions 29 2,479 2,523 2,17 7
57,798 106,026 62,058
Total equity and liabilities 672,237 681,970 597,750
*Restatement in connection with intangible assets (ESMYA), (Note 41).
The notes on pages 79 to 135 form an integral part of the consolidated financial statements
The notes on pages 79 to 135 form an integral part of the consolidated financial statements
The notes on pages 79 to 135 form an integral part of the consolidated financial statements
Konszolidált átfogó eredménykimutatás
a december 31-ével végződő évről Melléklet 2012 2011
HUF m HUF m
Restated*
Tárgyévi eredmény 49.080 49.453
Külföldi leányvállalatok beszámolóinak forintosításából adódó árfoly-amkülönbözet
(12.874) 21.263
Értékesíthető pénzügyi eszközök értékelési tartaléka 25 2.495 (3.388)
Egyéb átfogó eredmény (10.379) 17.875
Átfogó eredmény 38.701 67.328
bből:
Anyavállalat tulajdonosaira jutó (átfogó eredmény) 39.251 66.905
Non-controlling interest (550) 423

74 | Annual Report | Gedeon Richter 2012 Annual Report | Gedeon Richter 2012 | 75
Co
nso
lid
ated
Sta
tem
ent
of
Ch
an
ges
in
Eq
uit
y
for
the
year
en
ded
31 D
ecem
ber
20
11N
ote
sSh
are
cap
ital
Shar
e p
rem
ium
Cap
ital
re
serv
esTr
easu
ry s
har
esR
eval
uat
ion
res
erve
fo
r av
aila
ble
for
sale
in
vest
men
ts
Fore
ign
cu
r-re
ncy
tra
nsl
a-ti
on
res
erve
s
Ret
ain
ed
earn
ings
Att
rib
uta
ble
to
ow
ner
s o
f th
e p
aren
t
No
n-
con
tro
llin
g in
tere
st
Tota
l
HU
F m
HU
F m
HU
F m
HU
F m
HU
F m
HU
F m
HU
F m
HU
F m
HU
F m
HU
F m
Bal
ance
at
1 Jan
uar
y 20
1118
,638
15,2
143,
475
(539
)3,
356
686
398,
154
438,
984
3,13
14
42,
115
Net
pro
fit
--
--
--
49,3
8049
,380
172
49,5
52
Exc
han
ge
diff
eren
ces
aris
ing
on
tra
nsl
atio
n o
f fo
reig
n
op
erat
ion
s-
--
--
21,0
25-
21,0
2525
121
,276
Rev
alu
atio
n r
eser
ve fo
r av
aila
ble
for
sale
inve
stm
ents
--
--
(3,3
88)
--
(3,3
88)
-(3
,388
)
Co
mp
reh
ensi
ve in
com
e at
31 D
ecem
ber
20
11-
--
-(3
,388
)21
,025
49,3
8067
,017
423
67,4
40
Imp
act
of r
esta
tem
ent*
41-
--
--
(13)
(99)
(112
)-
(112
)
Co
mp
reh
ensi
ve in
com
e at
31 D
ecem
ber
20
11 (a
s re
stat
ed)
--
--
(3,3
88)
21,0
1249
,281
66,9
05
423
67,3
28
Net
tre
asu
ry s
har
es t
ran
sfer
red
to e
mp
loye
es26
--
-(3
,974
)-
--
(3,9
74)
-(3
,974
)
Ord
inar
y sh
are
divi
den
d fo
r 20
1032
--
--
--
(16,
00
9)(1
6,0
09)
-(1
6,0
09)
Rec
ogn
itio
n o
f sh
are-
bas
ed p
aym
ents
25-
--
--
-87
87-
87
No
n-c
on
tro
llin
g in
tere
st o
n n
ew a
cqu
isit
ion
37.1
--
--
--
--
309
309
Ba
lan
ce a
t 31
De
cem
be
r 20
11 (
as
rest
ate
d)
18,6
3815
,214
3,4
75(4
,513
)(3
2)21
,69
84
31,5
134
85
,99
33,
86
34
89
,85
6
*Res
tate
men
t in
co
nn
ecti
on
wit
h in
tan
gib
le a
sset
s (E
SMYA
), (N
ote
41)
. Th
is a
dju
stm
ent
has
no
imp
act
on
yea
rs p
rio
r to
20
11 in
rel
atio
n t
o C
on
solid
ated
Sta
tem
ent
of C
han
ges
in E
qu
ity
Co
nso
lid
ated
Sta
tem
ent
of
Ch
an
ges
in
Eq
uit
y
for
the
year
en
ded
31 D
ecem
ber
20
12N
ote
sSh
are
cap
ital
Shar
e p
rem
ium
Cap
ital
re
serv
esTr
easu
ry s
har
esR
eval
uat
ion
res
erve
fo
r av
aila
ble
for
sale
in
vest
men
ts
Fore
ign
cu
r-re
ncy
tra
nsl
a-ti
on
res
erve
s
Ret
ain
ed
earn
ings
Att
rib
uta
ble
to
ow
ner
s o
f th
e p
aren
t
No
n-
con
tro
llin
g in
tere
st
Tota
l
HU
F m
HU
F m
HU
F m
HU
F m
HU
F m
HU
F m
HU
F m
HU
F m
HU
F m
HU
F m
Bal
ance
at
1 Jan
uar
y 20
12 (a
s re
stat
ed)
18,6
3815
,214
3,47
5(4
,513
)(3
2)21
,698
431,
513
485,
993
3,86
348
9,85
6
Net
pro
fit
--
--
--
49,2
6549
,265
(185
)49
,080
Exc
han
ge
diff
eren
ces
aris
ing
on
tra
nsl
atio
n o
f fo
reig
n
op
erat
ion
s-
--
--
(12,
509)
-(1
2,50
9)(3
65)
(12,
874)
Rev
alu
atio
n r
eser
ve fo
r av
aila
ble
for
sale
inve
stm
ents
--
--
2,49
5-
-2,
495
-2,
495
Co
mp
reh
ensi
ve in
com
e at
31 D
ecem
ber
20
12-
--
-2,
495
(12,
509)
49,2
6539
,251
(550
)38
,70
1
Net
tre
asu
ry s
har
es t
ran
sfer
red
to e
mp
loye
es26
--
-2,
797
--
-2,
797
-2,
797
Ord
inar
y sh
are
divi
den
d fo
r 20
1132
--
--
--
(12,
211)
(12,
211)
-(1
2,21
1)
Rec
ogn
itio
n o
f sh
are-
bas
ed p
aym
ents
25-
--
--
-93
193
1-
931
Ba
lan
ce a
t 31
De
cem
be
r 20
1218
,638
15,2
143,
475
(1,7
16)
2,4
63
9,1
89
46
9,4
98
516
,76
13,
313
520
,074
The
not
es o
n p
ages
79
to 13
5 fo
rm a
n in
tegr
al p
art
of t
he
con
solid
ated
fin
anci
al s
tate
men
ts
The
not
es o
n p
ages
79
to 13
5 fo
rm a
n in
tegr
al p
art
of t
he
con
solid
ated
fin
anci
al s
tate
men
ts
76 | Annual Report | Gedeon Richter 2012
Consolidated Cash Flow Statement
for the year ended 31 December 2012 Note 2012 2011
HUF m HUF m
Restated*
Operating activities
Net income attributable to owners of parent company 49,265 49,281
Depreciation and amortisation 5 26,883 24,459
Non cash items accounted through Total Comprehensive Income
15, 31 3,781 20,389
Year end foreign exchange translation difference of borrowing 7 (4,191) 5,504
Net interest and dividend income 7 (3,155) (2,208)
Income tax recognised through Consolidated Income Statement 841 218
Changes in provision for defined benefit plans 29 97 13
Loss on disposal of property, plant and equipment and intangible assets
1,251 899
Impairment loss recognised on intangible assets 375 198
Impairment losses on investments - 4,558
Movements in working capital
Increase in trade and other receivables (4,698) (17,561)
Increase in inventories (712) (10,271)
(Decrease)/increase in payables and other liabilities (6,118) 12,326
Interest paid (1,805) (1,266)
Income tax paid 17 (4,812) (3,566)
Net cash flow from operating activities 57,002 82,973
Cash flow from investing activities
Payments for property, plant and equipment** (23,803) (26,617)
Payments for intangible assets** (5,874) (5,668)
Proceeds from disposal of property, plant and equipment 531 494
Payments to acquire financial assets (7,167) (3,535)
Proceeds on sale of financial assets 25 8,321
Payments of loans (979) (1,376)
Interest and similar income 7 4,652 3,415
Dividend income 308 59
Net cash outflow on acquisition of subsidiaries 28 (42,328) (14,555)
Net cash flow from investing activities (74,635) (39,462)
Cash flow from financing activities
Proceeds from disposal of/ (purchase of ) / treasury shares 26 2,797 (3,974)
Dividends paid (12,206) (15,994)
Other payments of financing activities - (371)
Proceeds from borrowings 15,129 15,088
Net cash flow to/from financing activities 5,720 (5,251)
Net (decrease)/increase in cash and cash equivalents (11,913) 38,260
Cash and cash equivalents at beginning of year 118,651 75,600
Effect of foreign exchange rate changes on the balances held in foreign (5,233) 4,791
Cash and cash equivalents at end of year 101,505 118,651
* Restatement in connection with intangible assets (ESMYA), (Note 41). ** The Payments for property plant and equipment and the Payments for intangible assets can not be directly reconciled to the Note 11 Transfers
and capital expenditure row, because the later one contains also non-cash addition of the assets, including transfers.
The notes on pages 79 to 135 form an integral part of the consolidated financial statements

Annual Report | Gedeon Richter 2012 | 79
Notes to the ConsolidatedFinancial Statements
1. General background
I) Legal status and nature of operations
Gedeon Richter Plc. (“the Company”), the
immediate parent of the Group, a manufacturer of
pharmaceutical products based in Budapest, was
established first as a Public Limited Company in 1923.
The predecessor of the Parent Company was founded
in 1901 by Mr Gedeon Richter, when he acquired a
pharmacy. The Company is a public limited company,
which is listed on Budapest Stock Exchange. The
Company is headquartered in Hungary and its
registered office is at Gyömrői út 19–21, 1103 Budapest.
II) Basis of preparationThe consolidated financial statements of Richter
Group have been prepared in accordance with
International Financial Reporting Standards (IFRS)
as endorsed by the European Union (EU). All stand-
ards and interpretations issued by the International
Accounting Standards Board (IASB) effective at the
time of preparing the consolidated financial state-
ments and applicable to Richter Group have been
endorsed by the EU. Therefore the consolidated
financial statements currently also comply with
IFRS as issued by the IASB and also comply with
the Hungarian Accounting Law on consolidated
financial statements, which refers to the IFRS as
endorsed by the EU.
The consolidated financial statements have been
prepared on the historical cost basis of accounting,
except for the revaluation of certain financial
instruments and the investment property, which are
valued at fair value. The amounts in the Consolidated
Financial Statements are stated in millions of
Hungarian Forints (HUFm). The members of the
Group maintain accounting, financial and other
records in accordance with relevant local laws and
accounting requirements. In order to present
financial statements which comply with IFRS, appro-
priate adjustments have been made by the members
of the Group to the local statutory accounts.
The preparation of financial statements in
conformity with IFRS requires the use of certain
critical accounting estimates. It also requires
management to exercise its judgment in the
process of applying the Group’s accounting policies.
The areas involving a higher degree of judgment
or complexity, or areas where assumptions and
estimates are significant to the consolidated
financial statements, are disclosed in Note 3.
These financial statements present the consolidated
financial position of the Group, the result of its
activity and cash flows, as well as the changes
in shareholder’s equity. The Group’s consolidated
companies are shown in Notes 13, 14.
III) Adoption of new and revised Standards
A) Standards, amendments and interpretations effective in 2012 but not relevant for the Group
IFRS 7 (amended). The IASB published an
amendment to IFRS 7 – Amendments to IFRS 7
Financial Instruments: Disclosures in October
2010. The amendment requires quantitative
and qualitative disclosures regarding transfers
of financial assets that do not result in entire
derecognition or that result in continuing
involvement. This is intended to allow users of
financial statements to improve their understanding
of such transactions (for example, securitizations),
including understanding the possible effects of
any risks that may remain with the entity that
transferred the assets. The amendments also
require additional disclosures if a disproportionate
amount of such transactions are undertaken around
the end of a reporting period. The Group adopted
the amended standard as of 1 January, 2012. The
amended standard did not have any impact on the
disclosures in the Group’s financial statements.
IAS 12 (amended). In December 2010, the IASB
issued the pronouncement ”Deferred Tax: Recovery
of Underlying Assets – Amendments to IAS 12”. The
new pronouncement ”Deferred Tax: Recovery of
Underlying Assets – Amendments to IAS 12“ sets
presumptions for the recovery (e.g. use or sale) of
certain assets. This is relevant in cases where the

80 | Annual Report | Gedeon Richter 2012 Annual Report | Gedeon Richter 2012 | 81
type of recovery has different tax consequences.
The pronouncement sets the rebuttable presumption
that the carrying amount of investment property
that is measured using the fair value model in
IAS 40 will be recovered through sale. Moreover,
the carrying amount of a non-depreciable asset
measured using the revaluation model in IAS 16 is
always deemed to be recovered through sale. The
amendment superseded SIC 21. As the Group has
investment properties only in Hungary, where
the income tax treatment of these assets does
not depend on whether the asset value has been
recovered through use or sale and the group does
not have non-depreciable asset measured using the
revaluation model in IAS 16, the amendment of the
standard did not have any impact on the Group’s
financial statements.
B) Standards, amendments and interpretations that are not yet effective and have not been early adopted by the Group
IAS 1 (amended). The IASB published
amendments to IAS 1 Presentation of Financial
Statements in June 2011. The amendments to IAS 1
retain the ‚one or two statement’ approach at the
option of the entity and only revise the way other
comprehensive income is presented: requiring
separate subtotals for those elements which may
be reclassified to the profit or loss section of the
income statement (recycled) and those elements
that will not. The application of the amendment is
required for annual periods beginning on or after
July 1, 2012. We do not expect that the adoption of
the amended standard would result in significant
changes in the financial statements of the Group.
The European Union has endorsed the amendments
of the standard.
IAS 19 (amended). The IASB published amend-
ments to IAS 19 – Employee Benefits in June 2011. The
amendments focus on the following key areas:
• Recognition (only defined benefit plans) –
elimination of the “corridor approach”
• Presentation (only defined benefit plans) – gains
and losses that arises from remeasurements should
be presented (only) in other comprehensive income
(elimination of the remaining options)
• Disclosures – enhancing of disclosure
requirements, e.g.
o the characteristics of a company’s defined
benefit plans,
o amounts recognized in the financial
statements,
o risks arising from defined benefit plans and
o participation in multi-employer plans
• Improved / clarified guidance relating to several
areas of the standard, e.g.
o classification of benefits,
o recognition of termination benefits and
o interest rate relating to the expected
return on the plan assets.
The application of the amendment is required for
annual periods beginning on or after 1 January,
2013. The group is currently recognizing the gains
and losses that arises from remeasurements in the
consolidated income statement. Since this amount
is not significant, we do not expect that the adoption
of the amended standard would result in significant
changes in the financial statements of the Group.
The European Union has endorsed the amendments
of the standard.
IAS 32 (amended). The IASB published amend-
ments to IAS 32 – Financial Instruments: Presenta-
tion in December 2011. The amendments to IAS 32
clarify the IASB’s requirements for offsetting financial
instruments. The amendments address inconsisten-
cies in current practice when applying the offsetting
criteria in IAS 32. The pronouncement clarifies:
• the meaning of „currently has a legally enforceable
right of set off the recognized amounts”; and
• that some gross settlement systems may be
considered equivalent to net settlement
The application of the amendment is required for
annual periods beginning on or after 1 January, 2014.
A reporting entity must apply the amended standard
retrospectively. We do not expect that the adoption
of the amended standard would result in significant
changes in the financial statements of the Group.
The European Union has endorsed the amendment of
the standard.
IFRS 7 (amended). The IASB published amend-
ments to IFRS 7 – Amendments to IFRS 7 Financial
Instruments: Disclosures in December 2011. The
IASB and the Financial Accounting Standards Board
(FASB) issued common disclosure requirements
that are intended to help assessing better the effect
or potential effect of offsetting arrangements on a
company’s financial position. The common disclo-
sure requirements also improve transparency in the
reporting of how companies mitigate credit risk,
including disclosure of collateral pledged or received.
The application of the amendment is required for
annual periods beginning on or after 1 January, 2013.
A reporting entity must apply the amended standard
retrospectively. We do not expect that the adoption
of the amended standard would result in significant
changes in the financial statements disclosures of
the Group. The European Union has not yet endorsed
the amended standard.
IFRS 9 Financial Instruments - The standard forms
the first part of a three-phase project to replace
IAS 39 (Financial Instruments: Recognition and
Measurement) with a new standard, to be known as
IFRS 9 – Financial Instruments. IFRS 9 prescribes the
classification and measurement of financial assets
and liabilities. The remaining phases of this project,
dealing with the impairment of financial instruments
and hedge accounting, as well as a further project
regarding derecognition,are in progress.
Financial assets – At initial recognition, IFRS 9
requires financial assets to be measured at fair value.
After initial recognition, financial assets continue to
be measured in accordance with their classification
under IFRS 9. Where a financial asset is classified
and measured at amortized cost, it is required to
be tested for impairment in accordance with the
impairment requirements in IAS 39. IFRS 9 defines
the below rules for classification.
• IFRS 9 requires that financial assets are classified
as subsequently measured at either amortized cost
or fair value. There are two conditions needed to
be satisfied to classify financial assets at amortized
cost: (1) The objective of an entity’s business model
for managing financial assets has to be to hold
assets in order to collect contractual cash flows;
and (2) The contractual terms of the financial asset
give rise on specified dates to cash flows that are
solely payments of principal and interest on the
principal amount outstanding. Where either of
these conditions is not satisfied, financial assets
are classified at fair value.
• Fair Value Option: IFRS 9 permits an entity to
designate an instrument, that would otherwise
have been classified in the amortized cost category,
to be at fair value through profit or loss if that
designation eliminates or significantly reduces
a measurement or recognition inconsistency
(‘accounting mismatch’).
• Equity instruments: The default category for
equity instruments is at fair value through profit
or loss. However, the standard states that an
entity can make an irrevocable election at initial
recognition to present all fair value changes for
equity investments not held for trading in other
comprehensive income. These fair value gains
or losses are not reported as part of a reporting
entity’s profit or loss, even when a gain or loss
is realized. Only dividends received from these
investments are reported in profit or loss.
• Embedded derivatives: The requirements in IAS 39
for embedded derivatives have been changed by
no longer requiring that embedded derivatives be
separated from financial asset host contracts.
• Reclassification: IFRS 9 requires reclassification
between fair value and amortized cost when,
and only when there is a change in the entity’s
business model. The ‚tainting rules’ in IAS 39 have
been eliminated
Financial liabilities – IFRS 9 “Financial Instruments”
sets the requirements on the accounting for
financial liabilities and replaces the respective rules
in IAS 39 “Financial Instruments: Recognition and
Measurement”. The new pronouncement:
• Carries forward the IAS 39 rules for the recognition
and derecognition unchanged.
• Carries forward most of the requirements in IAS 39
for classification and measurement.
• Eliminates the exception from fair value
measurement for derivative liabilities that are
linked to and must be settled by delivery of an
unquoted equity instrument.
• Changes the requirements related to the fair
value option for financial liabilities to address own
credit risk
The IASB issued amendments to IFRS 9 in December
2011 and deferred the mandatory effective date of
IFRS 9 from 1 January, 2013 to 1 January, 2015. The
deferral will make it possible for all phases of the
IFRS 9 project to have the same mandatory effective
date. The amendments also provide relief from
the requirement to restate comparative financial
statements for the effect of applying IFRS 9. This
relief was originally only available to companies
that chose to apply IFRS 9 prior to 2012. Instead,
additional transition disclosures will be required to
help investors understand the effect that the initial
application of IFRS 9 has on the classification and
measurement of financial instruments. The adoption
of the new standard will likely result in changes in

82 | Annual Report | Gedeon Richter 2012 Annual Report | Gedeon Richter 2012 | 83
the financial statements of the Group, the exact
extent of which we are currently analyzing. The Euro-
pean Union has not yet endorsed either the standard
or its amendment.
IFRS 10, IFRS 11, IFRS 12, IAS 27 (amended) and IAS 28 (amended) – The
IASB published IFRS 10 – Consolidated Financial
Statements, IFRS 11 – Joint Arrangements,
IFRS 12 – Disclosures of Interests in Other Entities
and amendments to IAS 27 – Separate Financial
Statements and IAS 28 – Investments in Associates
and Joint Ventures in May 2011.
IFRS 10 replaces the consolidation guidance in IAS
27 Consolidated and Separate Financial Statements
and SIC-12 Consolidation – Special Purpose Entities
by introducing a single consolidation model for all
entities based on control, irrespective of the nature
of the investee (i.e., whether an entity is controlled
through voting rights of investors or through other
contractual arrangements as is common in special
purpose entities). Under IFRS 10, control is based on
whether an investor has:
• power over the investee;
• exposure, or rights, to variable returns from its
involvement with the investee; and
• the ability to use its power over the investee to
affect the amount of the returns.
IFRS 11 introduces new accounting requirements for
joint arrangements, replacing IAS 31 – Interests in
Joint Ventures. The option to apply the proportional
consolidation method when accounting for jointly
controlled entities is removed. Additionally, IFRS 11
eliminates jointly controlled assets to now only differ-
entiate between joint operations and joint ventures.
A joint operation is a joint arrangement whereby the
parties that have joint control have rights to the as-
sets and obligations for the liabilities. A joint venture
is a joint arrangement, whereby the parties that have
joint control have rights to the net assets.
IFRS 12 will require enhanced disclosures about
both consolidated entities and unconsolidated
entities in which an entity has involvement. The
objective of IFRS 12 is to require information so that
financial statement users may evaluate the basis of
control, any restrictions on consolidated assets and
liabilities, risk exposures arising from involvements
with unconsolidated structured entities and non-
controlling interest holders’ involvement in the
activities of consolidated entities.
The requirements relating to separate financial
statements are unchanged and are included in the
amended IAS 27 – Separate Financial Statements.
The other portions of IAS 27 are replaced by IFRS 10.
IAS 28 – Investments in Associates and Joint Ventures
is amended for conforming changes based on the
issuance of IFRS 10, IFRS 11 and IFRS 12.
The IASB issued amendments to IFRS 10, IFRS 11 and
IFRS 12 in June 2012. The amendments clarify the
transition guidance in IFRS 10 Consolidated Financial
Statements and provide additional transition relief
in IFRS 10, IFRS 11 Joint Arrangements and IFRS 12
Disclosure of Interests in Other Entities, limiting
the requirement to provide adjusted comparative
information to only the preceding comparative
period. Furthermore, for disclosures related to
unconsolidated structured entities, the amendments
remove the requirement to present comparative
information for periods before IFRS 12 is first applied.
An entity shall apply this package of five new and
revised standards for annual periods beginning
on or after 1 January, 2014. The Group has joint
arrangements, based on their significance, we do not
expect that the adoption would result in significant
changes in the financial statements of the Group,
the exact extent of which we are currently analyzing.
The European Union has endorsed the new standards.
IFRS 13 The IASB published IFRS 13 – Fair Value
Measurement in May 2011in order to replace the
guidance on fair value measurement in existing IFRS
accounting literature with a single standard. The
IFRS is the result of joint efforts by the IASB and FASB
to develop a converged fair value framework. IFRS
13 defines fair value, provides guidance on how to
determine fair value and requires disclosures about
fair value measurements. However, IFRS 13 does not
change the requirements regarding which items
should be measured or disclosed at fair value. IFRS
13 seeks to increase consistency and comparability
in fair value measurements and related disclosures
through a ‚fair value hierarchy’. The hierarchy
categorizes the inputs used in valuation techniques
into three levels. The hierarchy gives the highest
priority to (unadjusted) quoted prices in active
markets for identical assets or liabilities and the
lowest priority to unobservable inputs. If the inputs
used to measure fair value are categorized into
different levels of the fair value hierarchy, the fair
value measurement is categorized in its entirety in
the level of the lowest level input that is significant to
the entire measurement (based on the application of
judgment). The new standard should be applied for
annual periods beginning on or after 1 January, 2013.
Earlier application is permitted. We do not expect
that the adoption of the new standard would result
in significant changes in the financial statements of
the Group, the exact extent of which we are currently
analyzing. The European Union has endorsed the new
standard from 1 January 2014.
C) Standards, amendments and interpretations that are not yet effective and not relevant for the Group’s operations
IFRS 1 In 2012, the IASB published amendments
to IFRS 1. As the group has already adopted IFRS, the
amendments will not have any impact on the Group’s
financial statements.
IFRS 10, IFRS 12, IAS 27 (amended) – The
IASB published „Investment Entities” (Amendments
to IFRS 10, IFRS 12 and IAS 27) in October 2012. The
amendments apply to a particular class of business
that qualify as investment entities. As the Group
does not have investment entities, the amended
standards will not have any impact on the Group’s
financial statements. The European Union has not
yet endorsed the amended standards.
IFRIC 20 In October 2011, the IASB published IFRIC
20 – Stripping Costs in the Production Phase of a
Surface Mine. As the Group does not have mining
activity, the interpretation will not have any impact
on the Group’s financial statements.
D) Improvements to Interna-tional Financial Reporting Standards (issued in May 2012 and effective for annual periods beginning 1 January 2013)
The improvements consist of changes to five
standards.
IFRS 1 was amended to (i) clarify that an entity
that resumes preparing its IFRS financial statements
may either repeatedly apply IFRS 1 or apply all IFRSs
retrospectively as if it had never stopped applying
them, and (ii) to add an exemption from applying
IAS 23, Borrowing costs, retrospectively by first-time
adopters.
IAS 1 was amended to clarify that explanatory
notes are not required to support the third balance
sheet presented at the beginning of the preceding
period when it is provided because it was materially
impacted by a retrospective restatement, changes
in accounting policies or reclassifications for
presentation purposes, while explanatory notes will
be required when an entity voluntarily decides to
provide additional comparative statements.
IAS 16 was amended to clarify that servicing
equipment that is used for more than one period is
classified as property, plant and equipment rather
than inventory.
IAS 32 was amended to clarify that certain tax
consequences of distributions to owners should
be accounted for in the income statement as was
always required by IAS 12.
IAS 34 was amended to bring its requirements
in line with IFRS 8. IAS 34 will require disclosure
of a measure of total assets and liabilities for an
operating segment only if such information is
regularly provided to chief operating decision maker
and there has been a material change in those
measures since the last annual financial statements.
The European Union has not yet endorsed these
improvements.

84 | Annual Report | Gedeon Richter 2012 Annual Report | Gedeon Richter 2012 | 85
2. Summary of significant accounting policies
The principal accounting policies adopted in the
preparation of these financial statements are set out
below:
I) Basis of ConsolidationThe consolidated financial statements incorporate
the financial statements of the Parent Company and
entities directly or indirectly controlled by the Parent
Company (its subsidiaries), the jointly controlled
entities ( joint ventures) and those companies where
the Parent Company has significant influence
(associated companies). Control of an entity is
achieved where the Parent Company has the power
to govern financial and operating policies so as to
obtain benefits from its activities.
The Group uses the acquisition method of accounting
to account for business combinations. The considera-
tion transferred for the acquisition of a subsidiary is
the fair values of the assets transferred, the liabilities
incurred and the equity interests issued by the Group.
The consideration transferred includes the fair value
of any asset or liability resulting from a contingent
consideration arrangement. Acquisition-related costs
are expensed as incurred. Identifiable assets acquired
and liabilities and contingent liabilities assumed in a
business combination are measured initially at their
fair values at the acquisition date. On an acquisition-
by-acquisition basis, the Group recognises any non-
controlling interest in the acquiree either at fair value
or at the non-controlling interest’s proportionate
share of the acquiree’s net assets.
Inter-company transactions, balances and unrealised
gains on transactions between Group companies are
eliminated. Unrealised losses are also eliminated.
Accounting policies of subsidiaries have been
changed where necessary to ensure consistency with
the policies adopted by the Group.
The Group treats transactions with non-controlling
interests as transactions with equity owners of the
Group. For purchases from non-controlling interests,
the difference between any consideration paid and
the relevant share acquired of the carrying value
of net assets of the subsidiary is recorded in equity.
Gains or losses on disposals to non-controlling
interests are also recorded in equity.
When the Group ceases to have control or significant
influence, any retained interest in the entity is
remeasured to its fair value, with the change in
carrying amount recognised in profit or loss. The fair
value is the initial carrying amount for the purposes
of subsequently accounting for the retained interest
as an associate, joint venture or financial asset. In
addition, any amounts previously recognised in
other comprehensive income in respect of that
entity are accounted for as if the Group had directly
disposed of the related assets or liabilities. This may
mean that amounts previously recognised in other
comprehensive income are reclassified to profit or
loss. If the ownership interest in an associate is
reduced but significant influence is retained, only
a proportionate share of the amounts previously
recognised in other comprehensive income are
reclassified to profit or loss where appropriate
II) Investments in joint ventures and associated companies
A joint venture is a contractual arrangement
whereby the Group and the parties undertake an
economic activity that is subject to joint control.
Joint venture arrangements involving the establish-
ment of a separate entity with controlling powers for
each shareholder are referred to as jointly controlled
entities. The Group reports its participation in jointly
controlled entities using proportionate consolidation
– the Group’s share of the assets, liabilities, income
and expenses of jointly controlled entities are com-
bined with the equivalent items in the consolidated
financial statements on a line-by-line basis.
Associates are all entities over which the Group
has significant influence but not control, generally
accompanying a shareholding of between 20% and
50% of the voting rights. Investments in associates
are accounted for using the equity method of ac-
counting and are initially recognised at cost.
The Group’s investment in associates includes
goodwill identified on acquisition, net of any
accumulated impairment loss.
The Group’s share of its associates’ post-acquisition
profits or losses is recognised in the income state-
ment, and its share of post-acquisition movements
in other comprehensive income is recognised in
other comprehensive income. The cumulative post-
acquisition movements are adjusted against the car-
rying amount of the investment. When the Group’s
share of losses in an associate equals or exceeds
its interest in the associate, including any other
unsecured receivables, the Group does not recognise
further losses, unless it has incurred obligations or
made payments on behalf of the associate.
Unrealised gains on transactions between the Group
and its associates are eliminated to the extent of the
Group’s interest in the associates. Unrealised losses
are also eliminated unless the transaction provides
evidence of an impairment of the asset transferred.
Accounting policies of associates have been changed
where necessary to ensure consistency with the
policies adopted by the Group. Dilution gains and
losses arising in investments in associates are
recognised in the income statement.
III) Transactions and balances
The individual financial statements of each Group
entity are presented in the currency of the primary
economic environment in which the entity operates
(its functional currency). For the purpose of the
consolidated financial statements, the results and
financial position of each Group entity are expressed
in Hungarian Forints million (HUF m), which is the
functional currency of the Parent Company and the
presentation currency for the consolidated financial
statements.
Foreign currency transactions are translated
into the functional currency using the exchange
rates prevailing at the dates of the transactions
or valuation where items are remeasured. Foreign
exchange gains and losses resulting from the
settlement of such transactions and from the
translation at year-end exchange rates of monetary
assets and liabilities denominated in foreign
currencies are recognised in the income statement.
Foreign exchange gains and losses are presented
in the income statement within finance income or
finance expense.
On consolidation, the assets and liabilities of the
Group’s foreign operations are translated at the
exchange rate of the Hungarian National Bank rates
prevailing on the balance sheet date except for share
capital, which is translated at historic value. Income
and expense items are translated at the average
exchange rates weighted with monthly turnover.
Exchange differences arising, if any, are recognised in
other comprehensive income.
Such translation differences are recognised as
income or as expenses in the period in which the
Group disposes of an operation.
Goodwill and fair value adjustments arising on the
acquisition of a foreign entity are treated as assets
and liabilities of the foreign entity and translated at
the closing rate.
IV) Revenue recognitionRevenue is measured at the fair value of the
consideration received or receivable. Revenue is
shown net of value-added tax, returns, rebates and
discounts and after eliminating sales within the Gro-
up. Revenue on sales transactions is recognised upon
fulfilment the terms of sales contracts.
A) Sales of goods The Group manufactures and sells wide range of
pharmaceuticals in the wholesale and retail market.
The Richter Group operates a chain of pharmacies -
mainly located in Romania – and several distribution
companies to convey products to consumers. Most
of their turnover is generated by products other than
those manufactured by the Group.
Revenue from the sale of goods is recognised when
all the following conditions are satisfied:
• the Group has transferred to the buyer the
significant risks and rewards of ownership of the
goods;
• the Group retains neither continuing managerial
involvement to the degree usually associated
with ownership nor effective control over the
goods sold;

86 | Annual Report | Gedeon Richter 2012 Annual Report | Gedeon Richter 2012 | 87
• the amount of revenue can be measured reliably;
• it is probable that the economic benefits associated
with the transaction will flow to the entity; and
• the costs incurred or to be incurred in respect of the
transaction can be measured reliably.
In the Pharmaceuticals segment of the Group domi-
nant part of the revenue from sale of goods origi-
nates from sale of finished form pharmaceuticals and
active pharmaceutical ingredients. From therapeutic
point of view the female healthcare, cardiovascular
and central nervous system related drugs are the
most significant products.
B) Sales of services Revenue, on rendering services, such as
pharmaceutical and biotech products trading,
marketing services, transportation, is recognised at
entities operating in Other segment of the Group.
For sales of services, revenue is recognised in the
accounting period in which the services are rendered,
by reference to stage of completion of the specific
transaction and assessed on the basis of the actual
service provided as a proportion of the total services
to be provided.
C) Profit sharingSales revenue includes also Profit sharing income,
paid by the partners according to agreed terms.
These partners are providing information on regular
basis to the group on their turnover and assess the
Group’s share of the profit of these transactions.
Revenue from profit sharing agreements are
accounted in the accounting period when the
underlying sales is performed.
D) RoyaltiesRoyalty revenue is recognised on an accrual basis
in accordance with the substance of the relevant
agreement. Royalties determined on a time basis are
recognised on a straight-line basis over the period
of the agreement. Royalty arrangements that are
based on production, sales and other measures
are recognised by reference to the underlying
arrangement. In case the Company is achieving a
one off royalty revenue by selling a license to the
customer, the revenue is recognised in the perod
when the risk and rewards are transferred to the
other party. In case the Company is obtaining regular
revenue based on the sales or other activity of the
other party, revenue is recognised in the period when
the underlying activity is performed by the customer.
E) Interest incomeInterest revenue is recognised when it is probable
that the economic benefits will flow to the Group
and the amount of revenue can be measured
reliably. Interest revenue is accrued on a time basis,
by reference to the principal outstanding and at
the effective interest rate applicable, which is the
rate that exactly discounts estimated future cash
receipts through the expected life of the financial
asset to that asset’s net carrying amount on initial
recognition.
F) Dividend incomeDividend is recognised when the right to receive
payment is established.
V) Property, plant and equipment
Property, plant and equipment are tangible items
that are held for use in the production or supply
of goods or services, for rental to others, or for
administrative purposes and are expected to be used
during more than one period.
Property, plant and equipment are stated at
historical cost less accumulated depreciation, and
accumulated impairment loss.
Depreciation is charged so as to write the cost of
assets (less residual value) off from Balance Sheet on
a straight-line basis over their estimated useful lives.
The Group uses the following depreciation rates:
The depreciation amount for a period of a plant,
property and equipment shall be determined based
on its expected usage, useful life, and physical wear
and tear and estimated residual value. Depreciation
is calculated monthly, and recognised as cost of sales,
sales and marketing expenses or administration
and general expenses, depending on the purpose
of usage of underlying assets, in the Consolidated
Income Statement or recognised as inventories in
the Consolidated Balance Sheet.
Assets in the course of construction are not
depreciated. Subsequent costs are included in the
asset’s carrying amount or recognised as a separate
asset, as appropriate, only when it is probable
that future economic benefits associated with the
item will flow to the group and the cost of the item
can be measured reliably. The carrying amount
of the replaced part is derecognised. Repair and
maintenance costs are not capitalised.
Gains and losses on disposal of property, plant and
equipment are determined by reference to their
carrying amount and are taken into account in
determining operating profit.
Initial cost of construction in progress shall contain
all cost elements that are directly attributable to
its production or installation during the reporting
period.
The residual value of plant, property and equipment
with the exception of cars is zero, because of the
nature of the activity of the Group. Residual value of
cars is 20% of their initial cost.
The depreciation period and the depreciation method
for property, plant and equipment shall be reviewed
at least at each financial year-end. If the expected
useful life of the asset is different from previous
estimates, then depreciation calculated for current
and future periods shall be adjusted accordingly.
VI) GoodwillGoodwill arising on consolidation represents the
excess of the cost of combination over the Group’s
interest in the fair value of the identifiable assets and
liabilities of a subsidiary, or jointly controlled entity
at the date of acquisition. Goodwill is recognised
separately in the Consolidated Balance Sheet and
is not amortised but is reviewed for impairment
annually in line with IAS 36. In each reporting period
the Parent Company reviews its goodwill for possible
impairment. For impairment testing goodwill is
allocated to Group’s individual or group of cash
generating units. The recoverable amount of the
cash generating unit is the higher of fair value less
cost to sell or its value in use, which is determined by
Discounted Cash Flow method.
If the recoverable amount of the cash-generating
unit is less than its carrying amount, the impairment
loss is allocated first to reduce the carrying amount
of any goodwill allocated to the unit and then to
the other assets of the unit pro-rata on the basis of
the carrying amount of each asset in the unit. The
impairment loss is recognised in the ‘other income
and other expenses (net)’ line in the Consolidated
Income Statement. The impairment losses on good-
will is not reversed. Gains and losses on the disposal
of an entity include the carrying amount of goodwill
relating to the entity sold.
When in the case of a bargain purchase, the
consideration transferred is less than the fair value
of the net assets of the subsidiary acquired, the
difference is recognised directly in the Consolidated
Income Statement within Other income and other
expenses (net).
Goodwill arising on acquisitions are recorded in
the functional currency of the acquired entity and
translated at year end closing rate.
VII) Intangible assetsPurchase of trademarks, licences, patents and soft-
ware from third parties are capitalised and amortised
if it is likely that the expected future benefits that are
attributable to such an asset will flow to the entity,
and costs of these assets can be reliably measured.
The Group is using the straight line method over their
estimated useful lives as follows:
Individually significant intangible assets are
presented in Note 11.
Amortization is recognised as cost of sales in the
Consolidated Income Statement.
Name Amortization
Property rights (connected with properties)
5%
Other rights (licences) 20-50%
Intellectual property, software 20-50%
Name Depreciation
Land 0
Buildings 1-4.5%
Plant and equipments 5-33.33%
Vehicles 10-20%
Office equipments 8-33.33%

88 | Annual Report | Gedeon Richter 2012 Annual Report | Gedeon Richter 2012 | 89
The amortization period and the amortization
method for an intangible asset shall be reviewed
at least at each financial year-end. If the expected
useful life of the asset is different from previous esti-
mates, then amortization calculated for current and
future periods shall be adjusted accordingly. Because
of the nature of the business and intangible assets,
the residual value has been determined to be nil.
Intangible assets acquired in a business combination
and recognised separately from goodwill are initially
recognised at their fair value at the acquisition date.
Subsequent to initial recognition, intangible
assets acquired in a business combination are
reported at cost less accumulated amortisation and
accumulated impairment losses, on the same basis
as intangible assets that are acquired separately.
In the Annual Report the term of ESMYA® is used
for indication of the brand name of the product
containing ulipristal acetate on Gyneacology
therapeutic area in uterine myoma indication, while
the terminology of ESMYA refers to the intangible
asset acquired by Richter and presented in the
Consolidated Balance Sheet.
VIII) Investment propertyInvestment properties, which are held to earn
rentals are measured initially at cost. Subsequent
to initial recognition, investment properties are
measured at fair value determined by independent
appraiser. Gains and losses arising from changes in
the fair value of investment properties are included
in profit or loss in the period in which they arise and
presented as Other income and other expenses (net).
An investment property is derecognised upon
disposal or when the investment property is
permanently withdrawn from use and no future
economic benefits are expected from the disposal.
Any gain or loss arising on derecognition of the
property (calculated as the difference between the
net disposal proceeds and the carrying amount of
the asset) is included in profit or loss in the period in
which the property is derecognised.
IX) Impairment of tangible and intangible assets excluding goodwill
At each balance sheet date, the members of the
Group review the carrying amount of tangible
and intangible assets to determine whether there
is any indication that those assets have suffered
an impairment loss. If such indications exist, the
recoverable amount of the asset is estimated in order
to determine the amount of such an impairment
loss. If the recoverable amount of an asset (or
cash-generating unit) is estimated to be less than its
carrying amount, the carrying amount of the asset
is reduced to its recoverable amount. An impairment
loss is recognised immediately in profit or loss as
“Other income and other expenses (net)”.
The Group shall assess at each balance sheet date
whether there is any indication that an impairment
loss recognized in prior periods for an asset may
no longer exist or may have decreased. If any such
indication exists, the entity shall estimate the
recoverable amount of that asset, and the carrying
value of the asset shall be increased to this value. The
increased carrying amount of an asset attributable
to a reversal of an impairment loss shall not
exceed the carrying amount that would have been
determined (net of amortization or depreciation)
if no impairment loss had been recognized for the
asset in prior years. A reversal of an impairment loss
for an asset shall be recognized immediately in profit
or loss and presented as Other income and other
expenses (net).
X) Research and development
Cost incurred on development projects are
recognised as intangible assets when they meet the
recognition criteria of IAS 38 “Intangible Assets”.
To-date, no R&D costs have met these recognition
criteria. Accordingly, all of the Company’s R&D costs
to-date have been expensed when incurred.
XI) Financial assets
Financial assets are classified into the following
categories: financial assets ‘at fair value through
profit or loss’ (FVTPL), ‘held-to-maturity’ investments,
‘available-for-sale’ (AFS) financial assets and ‘loans
and receivables’. The classification depends on the
nature and purpose of the financial assets and is
determined at the time of initial recognition.
A) Financial assets are classified as at FVTPL where
the financial asset is either held for trading or it is
designated as at FVTPL. Financial assets at FVTPL
are stated at fair value, with any resulting gain or
loss recognised in profit or loss. The net gain or loss
recognised in profit or loss incorporates any dividend
or interest earned on the financial asset.
B) Bills of exchange and debentures with fixed or
determinable payments and fixed maturity dates
that the Group has the positive intent and ability to
hold to maturity are classified as held-to-maturity
investments. Held-to-maturity investments are
recorded at amortised cost using the effective
interest method less any impairment, with revenue
recognised on an effective yield basis.
C) Available-for-sale financial assets are non-
derivatives that are either designated in this category
or not classified in any of the other categories.
They are included in non-current assets unless the
investment matures or management intends to
dispose of it within 12 months of the end of the
reporting period.
Gains and losses arising from changes in fair value
of available-for-sale financial assets are recognised
in other comprehensive income. When securities
classified as available for sale are sold or impaired,
the accumulated fair value adjustments recognised
in equity are included in the consolidated income
statement as ’financial income’ or ’financial expense’.
Dividends on available-for-sale equity instruments
and interest on available-for-sale securities calculated
using the effective interest method is recognised in
the income statement as financial income.
In case of purchase or sale of financial assets the
transactions are accounted at the settlement date.
D) Financial assets constituting loans receivables are
presented separately in XIV) Loans receivable, while
Trade receivables are described in XVI) Trade receivables.
For assets carried at amortised cost the Group
assesses at the end of each reporting period whether
there is objective evidence that a financial asset
or group of financial assets is impaired. A financial
asset or a group of financial assets is impaired
and impairment losses are incurred only if there
is objective evidence of impairment as a result of
one or more events that occurred after the initial
recognition of the asset (a ‘loss event’) and that loss
event (or events) has an impact on the estimated
future cash flows of the financial asset or group of
financial assets that can be reliably estimated.
For assets classified as available for sale the Group
assesses at the end of each reporting period whether
there is objective evidence that a financial asset
or a Group of financial assets is impaired. For debt
securities, the group uses the criteria described
above. In the case of equity investments classified as
available for sale, a significant or prolonged decline
in the fair value of the security below its cost is also
evidence that the assets are impaired. This impair-
ment accounted in Consolidated Income Statement
as Financial costs. Impairment losses recognised in
the consolidated income statement on equity instru-
ments are not reversed through the consolidated
income statement. If, in a subsequent period, the fair
value of a debt instrument classified as available for
sale increases and the increase can be objectively re-
lated to an event occurring after the impairment loss
was recognised in profit or loss, the impairment loss is
reversed through the consolidated income statement.
XII) Financial liabilitiesFinancial liabilities are classified as either financial
liabilities ‘at FVTPL’ or ‘other financial liabilities’.
Financial liabilities are classified as at FVTPL where
the financial liability is either held for trading or it
is designated as at FVTPL. Financial liabilities at
FVTPL are stated at fair value, with any gain or loss
recognised in profit or loss. The net gain or loss
recognised in profit or loss incorporates any interest
paid on the financial liability.
Other financial liabilities, including borrowings, are
initially measured at fair value, net of transaction
costs. Other financial liabilities are subsequently
measured at amortised cost using the effective inte-
rest method, with interest expense recognised on an
effective yield basis.

90 | Annual Report | Gedeon Richter 2012 Annual Report | Gedeon Richter 2012 | 91
The Group derecognises financial liabilities
when, and only when, the Group’s obligations are
discharged, cancelled or they expire.
Financial liabilities constituting trade payables are
described separately in XVII) Trade payables.
XIII) Other financial assets
Investments comprise long term bonds and
unconsolidated investments in other companies.
These investments are ‘held-to-maturity’ investments
and ‘available-for-sale’ financial assets as described
in Note 16.
Unconsolidated investments are those investments
where the Parent Company does not hold controlling
powers, joint control or does not have an ability to
exercise significant influence.
XIV) Loans receivableLoans receivables are non-derivative financial assets
with fixed or determinable payments that are
not quoted in an active market. Loans receivables
include given loans measured at amortised cost. It
also contains interest free loans given to employees
with maximum of 8 years maturity presented at
discounted value as of the balance sheet date.
XV) InventoriesInventories are stated at the lower of cost and net
realisable value. Goods purchased shall be measured
by using the FIFO (first in first out) method. Goods
produced shall be measured at actual (post
calculated) production cost.
Net costs of own produced inventories include the
direct cost of raw materials, the actual cost of direct
production labour, the related maintenance and
depreciation of production machinery and related
overhead costs.
XVI) Trade receivablesTrade receivables are recognised initially at fair value
and subsequently measured at amortised cost using
the effective interest method, less provision for
impairment.
XVII) Trade payablesTrade payables are recognised initially at fair value
and subsequently measured at amortised cost using
the effective interest method.
XVIII) Derivative financial instruments
Derivatives are initially recognised at fair value on
the date a derivative contract is entered into and are
subsequently re-measured at their fair value.
Changes in the fair value of derivative financial
instruments that do not qualify for hedge account-
ing are recognised as they arise in the income
statement. The derivative transactions of the Group
do not qualify to be hedging transactions therefore
no hedge accounting is applied.
XIX) Cash and cash equivalents
In the consolidated statement of cash flows Cash
and cash equivalents comprise: cash in hand,
bank deposits, and investments in money market
instruments with a maturity date within three
months accounted from the date of acquisition, net
of bank overdrafts. In the consolidated balance sheet,
bank overdrafts are shown within borrowings in
current liabilities. The Group does not have any bank
overdraft as of the year end of 2012 and 2011.
XX) BorrowingsBorrowings are recognised initially at fair value,
net of transaction costs incurred. Borrowings
are subsequently carried at amortised cost; any
difference between the proceeds (net of transaction
costs) and the redemption value is recognised in the
income statement over the period of the borrowings
using the effective interest method.
Fees paid on the establishment of loan facilities
are recognised as transaction costs of the loan to
the extent that it is probable that some or all of the
facility will be drawn down. In this case, the fee is
deferred until the draw-down occurs. To the extent
there is no evidence that it is probable that some
or all of the facility will be drawn down, the fee is
capitalised as a pre-payment for liquidity services
and amortised over the period of the facility to which
it relates.
XXI) ProvisionsProvisions are recognised when the Group has a
current legal or constructive obligation arising as
a result of past events, and when it is likely that an
outflow of resources will be required to settle such
an obligation, and if a reliable estimate for such
amounts can be made.
Provision for Environmental ExpendituresThe Group is exposed to environmental liabilities
relating to its past operations and purchases of
property, mainly in respect of soil and groundwater
remediation costs. Provisions for these costs are
made when the Group has constructive or legal
obligation to perform these remedial works and
when expenditure on such remedial work is probable
and its costs can be estimated within a reasonable
range. Provisions are measured at the present value
of the expenditures expected to be required to settle
the obligation using a pre-tax rate that reflects
current market assessments of the time value of
money and the risks specific to the obligation. The
Group does not have legal or constructive obligation
in relation to environmental expenditures as of 31
December 2012 and as of 31 December 2011.
Provision for Retirement BenefitsThe Group operates long term defined employee
benefit program, which is described in XXVI)
Employee Benefits.
XXII) Income taxesThe tax expense for the period comprises current
and deferred tax. Tax is recognised in the income
statement, except to the extent that it relates to
items recognised in other comprehensive income
or directly in equity. In this case, the tax is also
recognised in other comprehensive income or
directly in equity, respectively.
The current income tax charge is calculated on
the basis of the tax laws enacted or substantively
enacted at the balance sheet date in the countries
where the company and its subsidiaries operate and
generate taxable income.
Deferred income tax is provided, using the liability
method, in respect of temporary differences arising
between the tax bases of assets and liabilities and
their carrying values for financial reporting purposes.
However, deferred tax liabilities are not recognised
if they arise from the initial recognition of goodwill;
deferred income tax is not accounted for if it arises
from initial recognition of an asset or liability in a
transaction other than a business combination that
at the time of the transaction affects neither ac-
counting nor taxable profit or loss. Deferred income
tax is determined using tax rates (and laws) that
have been enacted or substantially enacted by the
balance sheet date and are expected to apply when
the related deferred income tax asset is realised or
the deferred income tax liability is settled.
Deferred income tax assets are recognised only to
the extent that it is probable that future taxable
profit will be available against which the temporary
differences can be utilised.
Deferred income tax assets and liabilities are offset
when there is a legally enforceable right to offset
current tax assets against current tax liabilities and
when the deferred income taxes assets and liabilities
relate to income taxes levied by the same taxation
authority on either the same taxable entity or
different taxable entities where there is an intention
to settle the balances on a net basis.
In case the Group is eligible for investment tax credit,
the initial recognition exception is applied, therefore
no deferred tax is recognised in connection with this
investment (see Note 3.2).
XXIII) Segment information
Operating segments are reported in a manner
consistent with the internal reporting provided
to the chief operating decision-maker. The chief
operating decision-maker, who is responsible
for allocating resources and assessing perfor -
mance of the operating segments, has been
identified as the Board of Directors that makes
strategic decisions.

92 | Annual Report | Gedeon Richter 2012 Annual Report | Gedeon Richter 2012 | 93
XXIV) Borrowing costs
Borrowing costs directly attributable to the
acquisition, construction or production of qualifying
assets, which are assets that necessarily take a
substantial period of time to get ready for their
intended use or sale, are added to the cost of those
assets, until such time as the assets are substantially
ready for their intended use or sale. All other
borrowing costs are recognised in profit or loss in the
period in which they are incurred.
XXV) LeasingLeases are classified as finance leases whenever the
terms of the lease transfer substantially all the risks
and rewards of ownership to the lessee. All other
leases are classified as operating leases.
Assets held under finance leases are initially
recognised as assets of the Group at their fair value
at commencement of the lease or, if lower, at the
present value of the minimum lease payments. The
corresponding liability to the lessor is included in the
Balance Sheet as a finance lease obligation.
Lease payments are apportioned between finance
charges and reduction of the lease obligation so as to
achieve a constant rate of interest on the remaining
balance of the liability. Finance charges are charged
directly to profit or loss, unless they are directly
attributable to qualifying assets, in which case
they are capitalised in accordance with the Group’s
policy on borrowing costs. Contingent rentals are
recognised as expenses in the periods in which they
are incurred.
Operating lease payments are recognised as an
expense on a straight-line basis over the lease
term (Note 34). Contingent rentals arising under
operating leases are recognised as an expense in the
period in which they are incurred.
XXVI) Employee benefits
Pension obligations The Group operates long term defined employee
benefit program, which is presented as Provision
in the Consolidated Balance Sheet. In line with IAS
19, for defined retirement benefit plans, the cost of
providing benefits is determined using the Projected
Unit Credit Method, with actuarial valuations being
carried out at the end of each reporting period.
The estimated amount of the benefit is accounted
in equal amounts each period until maturity date
(straight line method), and valued at present value
by using actuarial discount rate.
Actuarial gains and losses arising from experience
adjustments and changes in actuarial assumptions
are charged to the Consolidated Income Statement
in the period in which they arise.
Defined contribution plansFor defined contribution plans, the Group pays
contributions to publicly or privately administered
pension insurance plans on a mandatory,
contractual or voluntary basis. The Group has no
further payment obligations once the contributions
have been paid. The contributions are recognised as
employee benefit expense when they are due.
Termination benefitTermination benefits are payable when employment
is terminated by the Group before the normal
retirement date, or whenever an employee accepts
voluntary redundancy in exchange for these benefits.
The Group recognises termination benefits when it
is demonstrably committed to a termination, that
is the entity has a detailed formal plan to terminate
the employment of current employees without
possibility of withdrawal.
XXVII) Share based payment
The Group is granting treasury shares to certain
employees in its employee share bonus programs.
Details of these bonus programs are set out in Note
26. These bonus programs are accounted for as
equity-settled share-based payments.
Equity-settled share-based payments to employees
and others providing similar services are measured
at the fair value of the equity instruments at the
grant date. The fair value determined at the grant
date of the equity-settled share-based payments is
expensed on a straight-line basis (adjusted with the
change in estimate) over the vesting period, based
on the Group’s estimate of equity instruments that
will eventually vest. At the end of each reporting
period, the entity revises its estimates of the number
of shares granted that are expected to vest based
on the non-market vesting conditions. It recognises
the impact of the revision to original estimates, if
any, in the income statement, with a corresponding
adjustment to equity.
XXVIII) Government grants
Grants from the government are recognised at their
fair value where there is a reasonable assurance
that the grant will be received and the Group will
comply with all attached conditions. Government
grants relating to costs are deferred and recognised
in the income statement over the period necessary
to match them with the costs that they are intended
to compensate. Government grants relating to
property, plant and equipment are included in non-
current liabilities as deferred government grants
and are credited to the income statement as Other
income and other expenses (net) on a straight-line
basis over the expected lives of the related assets.
The Group benefits from other government
assistance, that are not treated as government
grants in line with IAS 20. On 2 November 2012
Richter signed a strategic agreement with the
Government of Hungary. The general purpose of the
agreement is to support the continued independence
of Gedeon Richter Plc. so that strategic decisions
determining the future development of the company
and supporting the development of the Hungarian
national economy continue to be taken in Hungary
and with a view to the interests of the Hungarian
economy. In the context of the partnership the
Government promotes Richter’s innovation and
R&D efforts by the means available to it; Richter,
on the other hand, will strive to expand its domestic
pharmaceutical manufacturing, research and
development activities. The parties also agreed to
develop a transparent and sustainable R&D-based
tax incentive system, which includes eligibility
to tax credits beyond the year of reporting. Those
companies whose R&D reaches or exceeds 15%–
20% – 25% of the reimbursement based on manu-
facturer price levels during the previous year are
entitled to a 20%–60%–90% extraordinary tax
deduction.
An additional criterion for this allowance is a
minimum level of personnel related expenditure
established at 3% for staff involved in R&D Details
of the system were adopted by Parliament in the
form of an act, which entered into effect on
28 December 2012.
XXIX) Share CapitalOrdinary shares are classified as equity. Where any
Group company purchases the company’s equity
share capital (treasury shares), the consideration
paid, including any directly attributable incremental
costs (net of income taxes) is deducted from equity
attributable to the company’s equity holders until
the shares are cancelled or reissued.
Where such ordinary shares are subsequently
reissued, any consideration received, net of any
directly attributable incremental transaction costs
and the related income tax effects, is included in
equity attributable to the company’s equity holders.
XXX) Dividend distribution
Dividend distribution to the company’s shareholders
is recognised as a liability and debited against
equity (retained earnings) in the Group’s financial
statements in the period in which the dividends are
approved by the company’s shareholders.
XXXI) Comparative financial information
Different levels of corporate taxation applied at
the valuation of intangible asset ESMYA and at the
calculation of relevant deferred tax effectuated at
the first inclusion of PregLem in the consolidated
accounts of the Group have been reassessed and
unificated. As a result related figures for the years
2010 and 2011 were restated. Please see more
detailed in Note 41.

94 | Annual Report | Gedeon Richter 2012 Annual Report | Gedeon Richter 2012 | 95
3. Critical accounting judgements and key sources of estimation uncertainty
In the application of the Group’s accounting
policies, which are described in Note 2 manage-
ment is required to make judgements, estimates
and assumptions about the carrying amounts of
assets and liabilities that are not readily apparent
from other sources. The estimates and associated
assumptions are based on historical experience and
other factors that are considered to be relevant.
Actual results may differ from these estimates.
The estimates and underlying assumptions are
reviewed on an ongoing basis. Revisions to account-
ing estimates are recognised in the period in which
the estimate is revised if the revision affects only that
period, or in the period of revision and future periods
if the revision affects both current and future periods.
Significant areas of estimation uncertainty and
critical judgements in applying accounting policies
that have the most significant effect on the amounts
recognised in the consolidated financial statements
are the following:
3.1. Key sources of estimation uncertainty
Impairment of goodwillThe Group tests annually whether goodwill has
suffered any impairment, in accordance with the
accounting policy stated in point VI). The impairment
assessment performed by the Group contains
significant estimates that depend on future events.
The assumptions used and the sensitivity of the
estimation is presented in details in Note 19.
Allowance for bad and doubtful accounts receivableThe Group calculates an allowance for bad and
doubtful accounts receivable to cover the incurred
losses resulting from the inability of its customers
to make required payments according to original
contractual terms. Allowance for bad and doubtful
accounts receivable recognized in the Consolidated
Balance Sheet amounted to HUF 1,192 million and
HUF 2,499 million at 31 December 2012 and 2011,
respectively. The estimates used in evaluating the
adequacy of the allowance for bad and doubtful
accounts receivable are based on the aging of the
accounts receivable balances, customer credit-
worthiness and changes in customer payment
pattern.
DepreciationProperty, plant and equipment and intangible
assets are recorded at cost and are depreciated
or amortised on a straight-line basis over their
estimated useful lives. The estimation of the useful
lives of assets is a matter of judgment based on the
experience with similar assets. The future economic
benefits embodied in the assets are consumed
principally through use.
However, other factors, such as technical or
commercial obsolescence and wear and tear, often
result in the diminution of the economic benefits
embodied in the assets. Management assesses the
remaining useful lives in accordance with the current
technical conditions of the assets and estimated
period during which the assets are expected to earn
benefits for the Group. The following primary factors
are considered: (a) expected usage of the assets; (b)
expected physical wear and tear, which depends on
operational factors and maintenance programme;
and (c) technical or commercial obsolescence arising
from changes in market conditions.
The appropriateness of the estimated useful lives
is reviewed annually. If the estimated useful lives
would decrease by 10% in compare to management’s
estimates, depreciation for the year ended 31 Decem-
ber 2012 would be greater by HUF 2,688 million (2011:
increase by HUF 2,446 million).
The Group recorded depreciation and amortisation
expense in the amount of HUF 26,883 million and
HUF 24,459 million for the years ended 31 December
2012 and 2011, respectively.
Uncertain tax position in RomaniaFrom 1 October 2009 the Government approved
a debated claw back regime (aimed at financing
the overspending of the national pharmaceutical
budget) to be paid to the CNAS (Casa Nationala de
Asigurari Sanatate) by the domestic manufacturers
and wholesalers in the range of 5-12 % from sales of
reimbursed drugs. The related uncertain tax position
is disclosed in more details in Note 38.
From 1 October 2011, a new version of Romania’s
pharmaceutical claw back mechanism came into
force levying direct liabilities for the domestic and
foreign manufacturers, which does not constitutes
to be an uncertain tax position, the related expenses
has been disclosed in Note 5.
PregLem deferred purchase price paymentsAs announced at 6 October 2010, Gedeon
Richter Plc. acquired a 100% ownership in PregLem.
A purchase price up to CHF 445 million is payable,
provided that certain milestone are achieved. The
amount of deferred purchase price due to previous
owners of PregLem is presented in our accounts at
probability weighted discounted value reflecting the
likelihood of future payment and it is remeasured in
every period. The effect of change in the probability
of the payment in respect of the outstanding price
in comparison with previous year is presented as
Other expense in Note 5. The effect of unwinding of
discounted value is described in Note 7 (as financial
expense), while the related liability as of 31 December
2012 as other non-current liabilities (Note 31). The
maximum amount of exposure of the Group relating
to the deferred purchase price amounts to be CHF 60
million as of 31 December 2012 is disclosed.
3.2. Critical judgements in applying entities accounting policies
Investment tax creditThe Parent Company has been eligible to tax credit
as a result of the investment performed by the
Company. The criteria that are needed to be fulfilled
in order to qualify for this tax credit is described
in Note 8. The Group assesses that the amount
of investment is the only substantial criteria in
relation to the tax credit because the operation of
the assets purchased requires clearly more human
resource than prescribed by the relevant regulation.
The Group assessed this relief to be an investment
tax credit. Based on the accounting policy of the
Group, investment tax credit is treated as increase
of the related asset’s tax base. Since the asset was
not acquired in a business combination and neither
accounting profit nor taxable profit is affected on
the related asset’s initial recognition, the deductible
temporary difference that arises will be exempt due
to the initial recognition exception in paragraph
24 of IAS 12 and therefore no deferred tax asset is
recognised.

96 | Annual Report | Gedeon Richter 2012 Annual Report | Gedeon Richter 2012 | 97
4. Segment Information
Management has determined the operating
segments based on the reports reviewed by the
Board of Directors (Chief Operating Decision Makers)
that are used to make strategic decisions. The three
main segments for management purposes:
• Pharmaceuticals: includes the companies that are
involved in the Group’s core business, i.e. research,
development and production of pharmaceutical
products
• Wholesale and retail: distribution companies and
pharmacies that are part of the sales network in
various regional markets and, as such, convey our
products to consumers
• Other: presents all the other consolidated com-
panies that provide marketing and sales support
services mainly to the members of the Group
II) Entity wide disclosures
The external customers of the Group are domiciled in
the following regions:
1. Hungary
2. CIS (Commonwealth of Independent States)
3. EU
4. USA
5. Other countries.
Revenues from external customers are derived from
the sales of goods, revenue from services and royalty
incomes as described below.
Revenues of approximately HUF 35,705 million (2011:
HUF 31,913 million) are derived from a single external
customer. These revenues are attributable to the
Pharmaceuticals segment and located in the CIS
region.
There is no other customer exceeding 10% of net
sales, therefore the Group assesses the risk of
customer concentration as not significant.
2012 Hungar y CIS EU USA Other countries Total
HUF m HUF m HUF m HUF m HUF m HUF m
Total revenues 30,932 143,975 116,721 16,123 18,951 326,702
Total assets 516,709 36,430 71,258 2,480 45,360 672,237
Capital expenditure 24,427 2,727 1,529 - 994 29,67 7
2011 Hungar y* CIS EU USA Other countries Total
HUF m HUF m HUF m HUF m HUF m HUF m
Total revenues 35,683 124,410 108,916 20,513 18,346 307,868
Total assets* 508,447 41,626 78,826 2,713 50,358 681,970
Capital expenditure 25,130 1,863 1,731 13 3,548 32,285
* Restatement in connection with intangible assets (ESMYA), (Note 41).
Business segments
Pharmaceuticals Wholesale and retail Other Eliminations Total
HUF m HUF m HUF m HUF m HUF m2012 2011
Restated*2012 2011
Restated*2012 2011
Restated*2012 2011
Restated*2012 2011
3rd party revenues
279,460 266,591 46,162 40,374 1,080 903 - - 326,702 307,868
Inter segment revenues
7,019 5,101 4 4 2,808 2,810 (9,831) (7,915) - -
Total revenues 286,479 271,692 46,166 40,378 3,888 3,713 (9,831) (7,915) 326,702 307,868
Profit from operations
50,426 63,160 (1,334) (2,300) (116) 275 (255) (208) 48,721 60,927
Total assets** 731,128 732,828 44,034 49,854 5,188 9,497 (108,113) (110,209) 672,237 681,970
Liabilities** 132,531 171,217 44,066 49,639 7 78 2,595 (25,212) (31,337) 152,163 192,114
Capital expenditure
28,734 31,388 555 537 388 366 - (6) 29,67 7 32,285
Depreciation 26,006 23,526 679 735 198 198 - - 26,883 24,459
Share of profit of associates
- - 342 (4,234) - - - - 342 (4,234)
Investments in associates
- - 2,115 1,754 - - - - 2,115 1,754
* Base period figures restated to reflect the segment reclassification of certain member companies of the Group. **Restatement in the Pharmaceuticals segment in connection with intangible assets (ESMYA ), (Note 41).
Analyses of revenue by categor y 2012 2011
HUF m HUF m
Sales of goods 320,7 78 302,679
Revenue from ser vices 5,639 4,959
Royalty income 285 230
Total revenues 326,702 307,868
I) Business segments
98 | Annual Report | Gedeon Richter 2012 Annual Report | Gedeon Richter 2012 | 99
7. Net financial incomeThe Group is translating its foreign currency
monetary assets and liabilities to the year end fx
rate on individual item level, which is presented in
the Consolidated Income Statement separately as
Finance income or Finance costs. Since the manage-
ment of the company is analysing these translation
differences on net basis, we are describing these
balance also on net basis as follows:
Unrealised financial income/(expense) was heavily
affected by the 220.93 US$/HUF and 291.29 EUR/HUF
exchange rates in effect on 31 December 2012 (on
31 December 2011 240.68 US$/HUF and 311.13 EUR/
HUF respectively) which impacted the revaluation
of currency related Balance Sheet items. These
translation differences together resulted an increase
of HUF 9.0 billion in the net financial income for 2012.
Derivative transactions are only made by the Parent
Company. At the end of the financial period
Richter had only a single open transaction, an
interest rate swap transaction, that was measured
at fair value.The fair value of this transaction is
HUF 504 million loss.
Exchange rate movements are closely monitored by
the Company and the conclusion of further forward
contracts will be subject to Management’s review
and approval.
The Company has no forward transactions
accountable for hedge according to IAS 39.
The forward transactions are presented at fair
value, based on forward rates provided by the
commercial banks.
In the Consolidated Financial Statements of financial
year 2010, the Group recognised the deferred
contingent purchase price of PregLem depending on
achievement of certain milestones, on a discounted
probability weighted amount.
Contingent consideration arising from the
acquisition of PregLem have been recalculated as
of 31 December 2012 at their present value resulting
in a loss of HUF 3,004 million as a result of the
unwinding of the discounted value, in 2011 it was
HUF 4,493 million financial loss.
In November 2010 Gedeon Richter Plc. signed an
agreement for 5 year period, EUR 150 million club
credit facility, which has been called and presented
as borrowings in the financial statements. In
June 2011 Gedeon Richter Plc. and the European
2012 2011
HUF m HUF m
Unrealised financial items 5,745 (13,025)
Unrealised exchange gains on trade receivables and trade payables 3,912 2,248
(Loss)/Gain on foreign currency loans receivable (81) 132
Year end foreign exchange translation difference of borrowing 4,191 (5,504)
Unrealised exchange gains/(losses) on other currency related items 982 (537)
Unwinding of discounted value related to liability in respect of PregLem (3,004) (4,493)
Reversal of assessment of for ward exchange contracts as of 1 Jan. 249 (64)
Result of unrealised for ward exchange and swap contracts (504) (249)
Impairment loss on investments - (4,558)
Realised financial items (4,887) 6,003
Realised (loss)/gains on for ward exchange contracts (138) 189
Exchange (loss)/gains realised on trade receivables and trade payables (3,905) 2,089
Exchange (losses)/gains on conversion (3,379) 1,744
Dividend income 308 59
Interest income 4,652 3,415
Interest paid (1,805) (1,266)
Other financial items (620) (227)
Total 858 (7,022)
5. Profit from operations – expenses by nature
The three most significant items presented within
Other income and other expenses (net):
One-off milestone payments received during 2012
positively impacted the other income, while in the
base period the break-up fee of HUF 8.1 billion paid by
Genefar was recognised. Changes in the likelihood of
payments in respect of deferred liabilities to previous
owners of PregLem impacted negatively both 2011
and 2012. We accounted for an expense of HUF 5,041
million in 2011 while only HUF 654 million were
expensed on this ground in the reporting year.
In accordance with the claw back regime announced
in Romania the authority establishes the amount of
extraordinary tax to be paid based on the compari-
son of the subsidies allocated for reimbursed drugs
and manufacturers’ sales thereof. Such taxes were
accounted for in the amount of RON 12.8 million
during the reported year at those companies which
belong to the Pharmaceutical segment of the Group.
The 20 % tax obligation payable in respect of turnover
related to reimbursed sales in Hungary amounted to
HUF 487 million in 2012. In accordance with the most
recent changes to the regulations we were able to
offset the tax payable in 2012 on this ground by 90 %
of tax liability of same kind incurred during 2011.
2012 2011
HUF m HUF m
Total revenues 326,702 307,868
From this: royalty and other similar income 285 230
Changes in inventories of finished goods and work in progress, cost of goods sold (26,142) (23,909)
Material type expenses (135,721) (116,703)
Personnel expenses (88,073) (81,698)
Depreciation and amortisation (26,883) (24,459)
Other income and other expenses (net) (1,162) (172)
Profit from operations 48,721 60,927
6. Employee information
The newly established companies resulted in an
increase of 10 in the average number of employees
during 2012.
2012 2011
Average number of people employed during the year
10,982 10,752
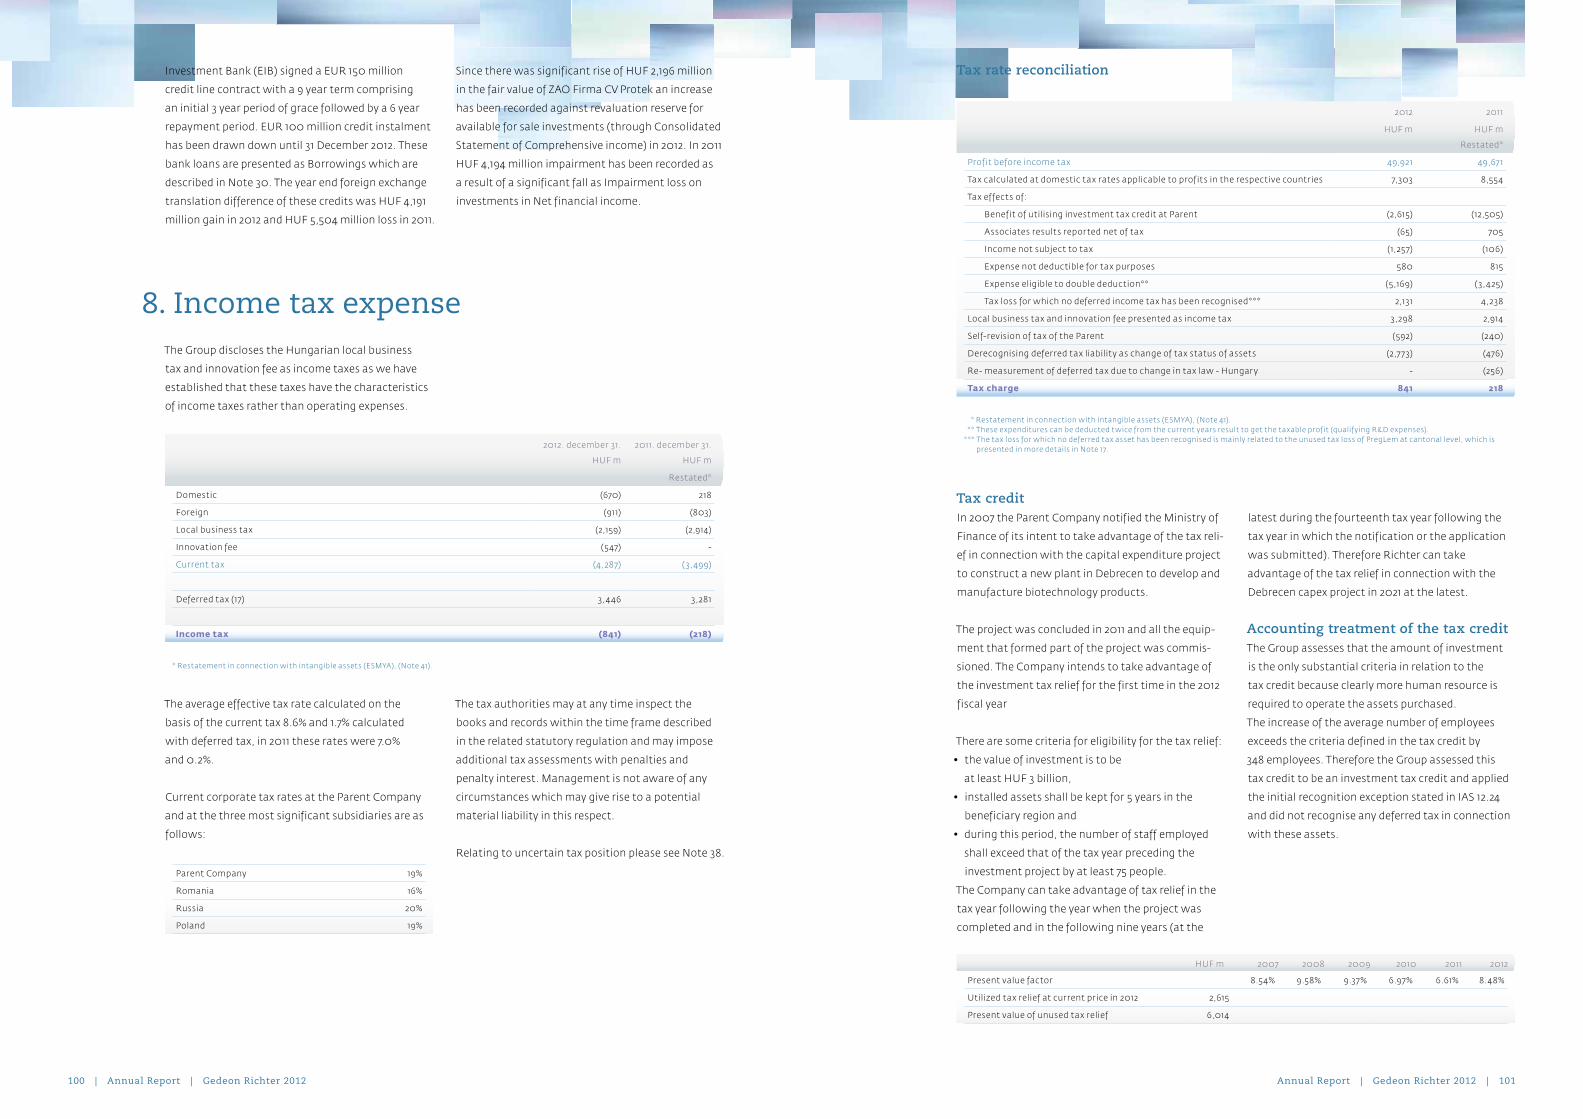
100 | Annual Report | Gedeon Richter 2012 Annual Report | Gedeon Richter 2012 | 101
8. Income tax expenseThe Group discloses the Hungarian local business
tax and innovation fee as income taxes as we have
established that these taxes have the characteristics
of income taxes rather than operating expenses.
The average effective tax rate calculated on the
basis of the current tax 8.6% and 1.7% calculated
with deferred tax, in 2011 these rates were 7.0%
and 0.2%.
Current corporate tax rates at the Parent Company
and at the three most significant subsidiaries are as
follows:
The tax authorities may at any time inspect the
books and records within the time frame described
in the related statutory regulation and may impose
additional tax assessments with penalties and
penalty interest. Management is not aware of any
circumstances which may give rise to a potential
material liability in this respect.
Relating to uncertain tax position please see Note 38.
2012. december 31. 2011. december 31.
HUF m HUF m
Restated*
Domestic (670) 218
Foreign (911) (803)
Local business tax (2,159) (2,914)
Innovation fee (547) -
Current tax (4,287) (3,499)
Deferred tax (17) 3,446 3,281
Income tax (841) (218)
* Restatement in connection with intangible assets (ESMYA), (Note 41).
Parent Company 19%
Romania 16%
Russia 20%
Poland 19%
Investment Bank (EIB) signed a EUR 150 million
credit line contract with a 9 year term comprising
an initial 3 year period of grace followed by a 6 year
repayment period. EUR 100 million credit instalment
has been drawn down until 31 December 2012. These
bank loans are presented as Borrowings which are
described in Note 30. The year end foreign exchange
translation difference of these credits was HUF 4,191
million gain in 2012 and HUF 5,504 million loss in 2011.
Since there was significant rise of HUF 2,196 million
in the fair value of ZAO Firma CV Protek an increase
has been recorded against revaluation reserve for
available for sale investments (through Consolidated
Statement of Comprehensive income) in 2012. In 2011
HUF 4,194 million impairment has been recorded as
a result of a significant fall as Impairment loss on
investments in Net financial income.
Tax rate reconciliation
Tax creditIn 2007 the Parent Company notified the Ministry of
Finance of its intent to take advantage of the tax reli-
ef in connection with the capital expenditure project
to construct a new plant in Debrecen to develop and
manufacture biotechnology products.
The project was concluded in 2011 and all the equip-
ment that formed part of the project was commis-
sioned. The Company intends to take advantage of
the investment tax relief for the first time in the 2012
fiscal year
There are some criteria for eligibility for the tax relief:
• the value of investment is to be
at least HUF 3 billion,
• installed assets shall be kept for 5 years in the
beneficiary region and
• during this period, the number of staff employed
shall exceed that of the tax year preceding the
investment project by at least 75 people.
The Company can take advantage of tax relief in the
tax year following the year when the project was
completed and in the following nine years (at the
latest during the fourteenth tax year following the
tax year in which the notification or the application
was submitted). Therefore Richter can take
advantage of the tax relief in connection with the
Debrecen capex project in 2021 at the latest.
Accounting treatment of the tax creditThe Group assesses that the amount of investment
is the only substantial criteria in relation to the
tax credit because clearly more human resource is
required to operate the assets purchased.
The increase of the average number of employees
exceeds the criteria defined in the tax credit by
348 employees. Therefore the Group assessed this
tax credit to be an investment tax credit and applied
the initial recognition exception stated in IAS 12.24
and did not recognise any deferred tax in connection
with these assets.
2012 2011
HUF m HUF m
Restated*
Profit before income tax 49,921 49,671
Tax calculated at domestic tax rates applicable to profits in the respective countries 7,303 8,554
Tax effects of:
Benefit of utilising investment tax credit at Parent (2,615) (12,505)
Associates results reported net of tax (65) 705
Income not subject to tax (1,257) (106)
Expense not deductible for tax purposes 580 815
Expense eligible to double deduction** (5,169) (3,425)
Tax loss for which no deferred income tax has been recognised*** 2,131 4,238
Local business tax and innovation fee presented as income tax 3,298 2,914
Self-revision of tax of the Parent (592) (240)
Derecognising deferred tax liability as change of tax status of assets (2,7 73) (476)
Re- measurement of deferred tax due to change in tax law - Hungar y - (256)
Tax charge 841 218
* Restatement in connection with intangible assets (ESMYA), (Note 41). ** These expenditures can be deducted twice from the current years result to get the taxable profit (qualifying R&D expenses). *** The tax loss for which no deferred tax asset has been recognised is mainly related to the unused tax loss of PregLem at cantonal level, which is
presented in more details in Note 17.
HUF m 2007 2008 2009 2010 2011 2012
Present value factor 8.54% 9.58% 9.37% 6.97% 6.61% 8.48%
Utilized tax relief at current price in 2012 2,615
Present value of unused tax relief 6,014

102 | Annual Report | Gedeon Richter 2012 Annual Report | Gedeon Richter 2012 | 103
9. Consolidated earnings per share
Basic earnings per share is calculated by reference
to the net profit attributable to shareholders and
the weighted average number of ordinary shares
outstanding during the year. These exclude the
average number of ordinary shares purchased by the
Company and held as Treasury shares.
For diluted earnings per share, the weighted average
number of ordinary shares outstanding is adjusted to
assume conversion of all dilutive potential ordinary
shares. Dilutive potential ordinary shares are the
ordinary shares of Gedeon Richter Plc. which will be
transferred to Management and to Employees as
part of its remuneration policy.
EPS (basic)
2012 2011
Restated*
Net consolidated profit attributable to owners of the parent (HUF m)
49,265 49,281
Weighted average number of ordinar y shares outstanding (thousands)
18,522 18,601
Basic earnings per share (HUF) 2,660 2,649
EPS (diluted)
2012 2011
Restated*
Net consolidated profit attributable to owners of the parent (HUF m)
49,265 49,281
Weighted average number of total shares issued (thousands)
18,637 18,637
Diluted earnings per share (HUF) 2,643 2,644
* Restatement in connection with intangible assets (ESMYA), (Note 41).
10. Financial instrumentsFinancial instruments in the Balance Sheet include
loans receivable, investments, trade receivables,
other current assets, cash and cash equivalents,
short-term and long-term borrowings, trade and
other payables.
Notes Carr ying value Fair value
31 December 2012 31 December 2011 31 December 2012 31 December 2011
HUF m HUF m HUF m HUF m
Financial assets*
Available for sale investments carried at fair value
Investments*** 16 6,714 4,232 6,714 4,232
Investments in securities** 23 9,966 11,752 9,966 11,752
Held to maturity investments carried at amortised cost
Investments 16 18,712 10,106 18,985 8,899
Loans and receivables carried at amortised cost
Loans receivable 18, 22 5,440 4,811 5,440 4,811
Trade receivables 21 102,476 103,487 102,476 103,487
Other current assets 22 4,181 1,567 4,181 1,567
Cash and cash equivalents 24 101,505 118,651 101,505 118,651
Financial assets carried at fair value through profit or loss
Current 218,517 236,196 218,517 236,196
Non-current 30,47 7 18,410 30,750 17,203
Financial liabilities
Liabilities carried at amortised cost
Borrowings 30 148 164 148 164
Trade payables 27 40,033 41,016 40,033 41,016
Other payables and accruals 28 9,186 57,488 9,186 57,488
Financial liabilities carried at fair value through profit or loss
Foreign exchange for ward contracts****
28 504 249 504 249
Current 49,871 98,917 49,871 98,917
Borrowing 30 73,163 62,226 73,163 62,226
Other non-current liability**** 31 11,568 9,708 11,568 9,708
Non-current 84,731 71,934 84,731 71,934
* All f inancial assets are free from liens and charges. ** The fair valuation of securities was based on bank data supply. Level 1: in 2012 HUF 7,7 19 million (in 2011 HUF 9,572 million) Level 2: in 2012 HUF 2,247 million (in 2011 HUF 2,180 million) *** Level 1: in 2012 HUF 6,7 14 million (in 2011 HUF 4,232 million) **** Level 3: in 2012 HUF 12,072 million ( in 2011 HUF 9,957 million)

104 | Annual Report | Gedeon Richter 2012 Annual Report | Gedeon Richter 2012 | 105
Above mentioned different levels have been defined
as follows:
Level 1: Quoted prices (unadjusted) in active markets
for identical assets or liabilities.
Level 2: Inputs other than quoted prices included
within level 1 that are observable for the asset
or liability, either directly (that is, as prices) or
indirectly (that is, derived from prices)
Level 3: Inputs for the asset or liability that are not
based on observable market data (that is,
unobservable inputs)
.
Financial risk managementDuring the year Gedeon Richter Plc. has identified its
relevant financial risks that is continously monitored
and evaluated by the management of the Company.
The Group focuses on capital structure, foreign
currency related-, credit and collection related- and
liquidity risk.
I.) Capital managementThe capital structure of the Group consists of net
debt (borrowings as detailed in Notes 30 and 24
offset by cash and bank balances) and equity of the
Group (comprising issued capital, reserves, retained
earnings and non-controlling interests).
The Group’s objectives when managing capital are to
safeguard the Group’s ability to continue as a going
concern in order to provide returns for shareholders
and benefits to other stakeholders and to maintain
an optimal capital structure to reduce the cost of
capital. The Group is also monitoring the individual
entities to meet their statutory capital requirements.
The Parent company has been pursuing constant
dividend policy, provided dividend from the profit to
the owners every year.
The capital risk of the Group was still limited in 2012,
since the Net cash shows surplus in the balance
sheet. In November 2010 Gedeon Richter Plc. signed
an agreement for 5 year period, EUR 150 million club
credit facility, which has been called and presented
as borrowings in the financial statements. Within
the range of that, Richter adopted the monitoring
some capital risk ratios.
In June 2011 Gedeon Richter Plc. and the European
Investment Bank (EIB) signed a EUR 150 million
credit line contract with a 9 year term comprising
an initial 3 year period of grace followed by a 6 year
repayment period. This agreement has as its aim the
financing during the period of 2011-2014 of Richter’s
original research activities targeting compounds,
which are active in diseases of the Central Nervous
System, combined with the development of bio
similar products. The total amount of the credit
facility is to be utilised in several tranches within 18
months from the signing of the agreement. EUR 100
million credit instalment has been drawn down by
the balance sheet date, until December 2012.
The gearing at end of the reporting period was as
follows:
The Group is in compliance with the ratios stated as
covenants both in the club credit facility agreement
and the EIB credit line agreement.
2012 2011
HUF m HUF m
Profit from operations 48,721 60,927
Depreciation 26,883 24,459
Dividend income 308 59
EBITDA 75,912 85,445
II.) Foreign currency risk The Group performs significant transactions in
currencies other than the functional and the
presentation currency, therefore faces the risk of
currency rate fluctuation. The Group continuously
calculates open FX positions and monitors key
foreign exchange rates. In order to mitigate the
foreign exchange risk the Group is aiming to achieve
natural hedging through loans taken in foreign
currency. There is no formal threshold stated in
the policies of the Group on the exposure level that
would automatically require conclusion of derivative
instruments to mitigate the foreign currency risk.
Foreign exchange sensitivity of actual costsThe Group does business in a number of regions, and
countries with different currencies. The most typical
foreign currencies are the EUR, PLN, RON, RUB
and the CHF. The calculation of exposure to foreign
currencies is based on these six currencies.
The foreign currency risk management calculation
is based on the balances exposed to exchanges of
foreign currencies of the Parent Company and the
four principal subsidiaries (GR Polska, GR Romania,
GR RUS, PregLem), which perform pharmaceutical
activity. The items of the other consolidated
companies have minimal foreign currency exposure
as they are performing mainly wholesale and retail
activity. The effect of the risk arising from currency
fluctuation is measured by different change in the
exchange rates.
The table below presents the effect of the change in
the average foreign currency rate on the operating
profit and on the profit for the year.
2012 Exchange rates Effect on operating profit
Effect on profit for the year
EUR/HUF US$/HUF EUR/US$ PLN/HUF RON/HUF RUB/HUF CHF/HUF HUF m HUF m
103.5% 299.1
235.0 1.27 71.5 67.2 7.5 248.4 4,768 4,509
225.0 1.33 69.1 65.0 7.2 240.0 685 528
215.0 1.39 66.7 62.7 7.0 231.7 (3,397) (3,453)
100.0% 289.1
235.0 1.23 71.5 67.2 7.5 248.4 4,083 3,981
225.0 1.28 69.1 65.0 7.2 240.0 0 0
215.0 1.34 66.7 62.7 7.0 231.7 (4,083) (3,981)
96.5% 279.1
235.0 1.19 71.5 67.2 7.5 248.4 3,397 3,453
225.0 1.24 69.1 65.0 7.2 240.0 (685) (528)
215.0 1.30 66.7 62.7 7.0 231.7 (4,768) (4,509)
2011 Exchange rates Effect on operating profit
Effect on profit for the year
EUR/HUF US$/HUF EUR/US$ PLN/HUF RON/HUF RUB/HUF CHF/HUF HUF m HUF m
103.6% 290.0
210.0 1.38 70.0 68.0 7.0 235.0 4,234 4,162
201.0 1.44 67.8 65.9 6.8 226.9 1,014 1,076
190.0 1.53 65.5 63.5 6.6 220.0 (3,185) (3,055)
100.0% 280.0
210.0 1.33 70.0 68.0 7.0 235.0 3,220 3,087
201.0 1.39 67.8 65.9 6.8 226.9 0 0
190.0 1.47 65.5 63.5 6.6 220.0 (4,198) (4,131)
96.4% 270.0
210.0 1.29 70.0 68.0 7.0 235.0 2,207 2,011
201.0 1.34 67.8 65.9 6.8 226.9 (1,014) (1,076)
190.0 1.42 65.5 63.5 6.6 220.0 (5,212) (5,207)
31 December 2012
31 December 2011
HUF m HUF m
Restated*
Borrowings (Note 30) 73,311 62,390
Less: cash and cash equivalents (Note 24)
(101,505) (118,651)
Net debt (28,194) (56,261)
Total equity* 520,074 489,856
Total capital 491,880 433,595
EBITDA** 75,912 85,445
Net debt to EBITDA ratio (0.37) (0.66)
Net debt to equity ratio (0.05) (0.11)
* Restatement in connection with intangible assets (ESMYA), (Note 41). ** EBITDA has been determined in line with the credit agreement as
operating profit increased by dividend income and depreciation and amortization expense.
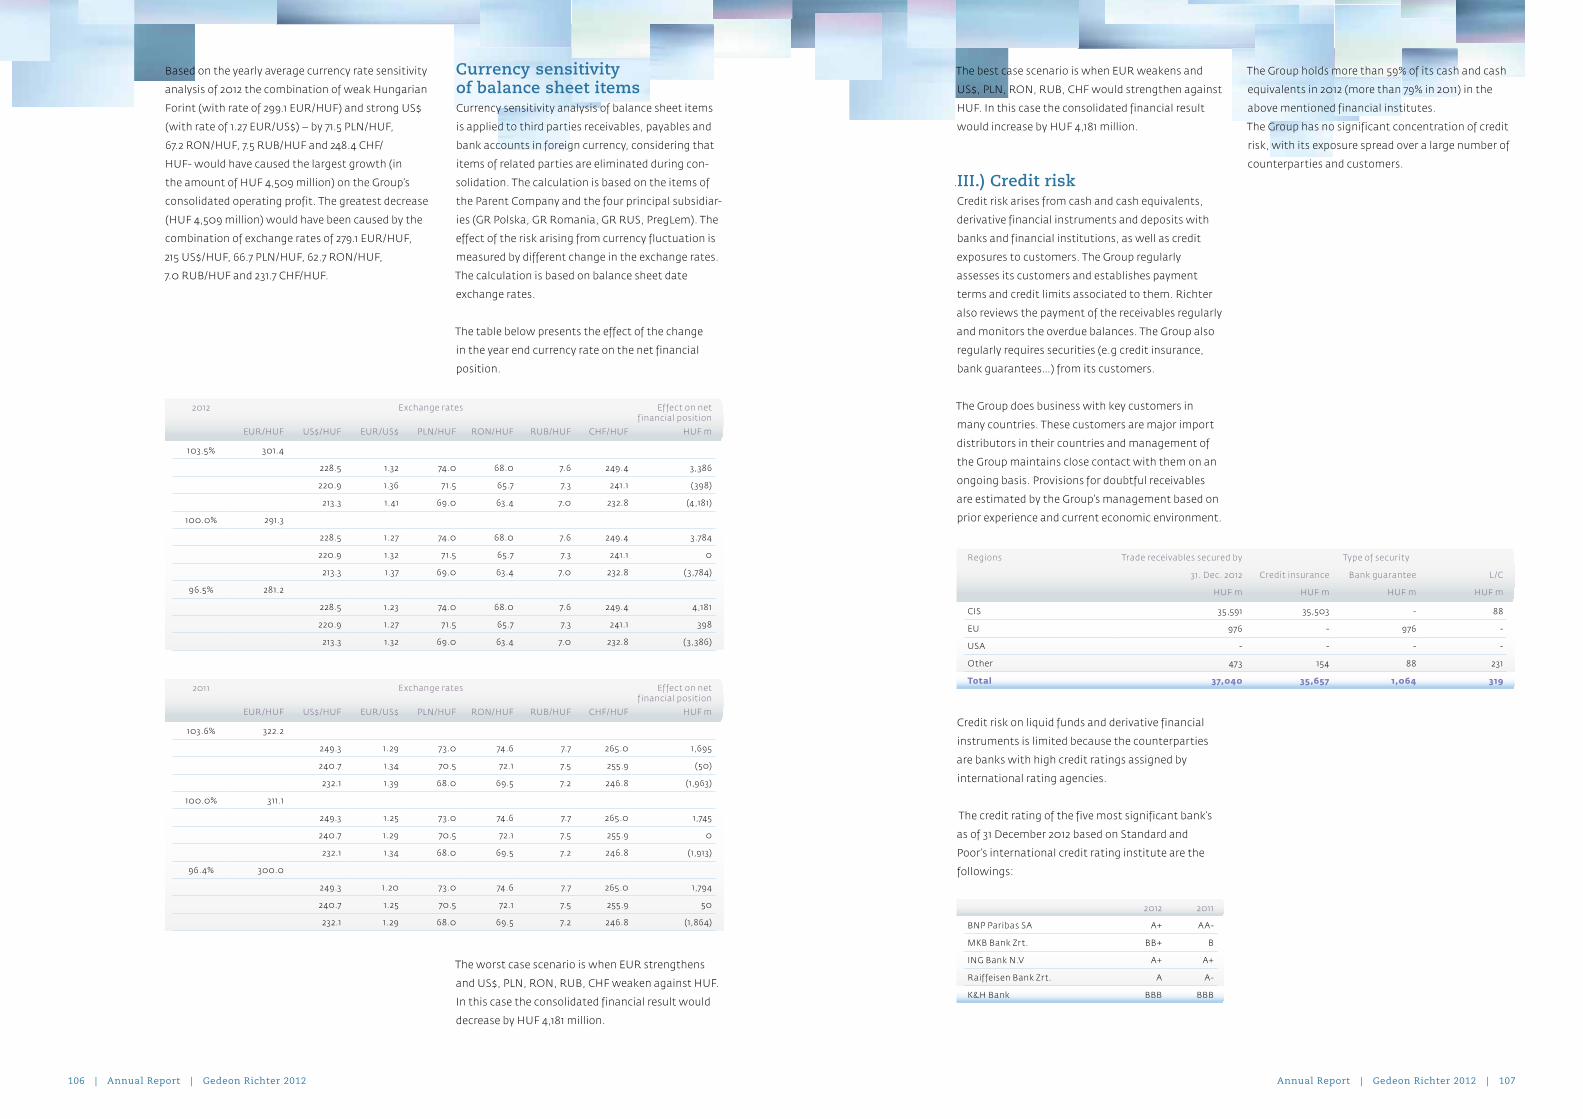
106 | Annual Report | Gedeon Richter 2012 Annual Report | Gedeon Richter 2012 | 107
Based on the yearly average currency rate sensitivity
analysis of 2012 the combination of weak Hungarian
Forint (with rate of 299.1 EUR/HUF) and strong US$
(with rate of 1.27 EUR/US$) – by 71.5 PLN/HUF,
67.2 RON/HUF, 7.5 RUB/HUF and 248.4 CHF/
HUF- would have caused the largest growth (in
the amount of HUF 4,509 million) on the Group’s
consolidated operating profit. The greatest decrease
(HUF 4,509 million) would have been caused by the
combination of exchange rates of 279.1 EUR/HUF,
215 US$/HUF, 66.7 PLN/HUF, 62.7 RON/HUF,
7.0 RUB/HUF and 231.7 CHF/HUF.
Currency sensitivity of balance sheet itemsCurrency sensitivity analysis of balance sheet items
is applied to third parties receivables, payables and
bank accounts in foreign currency, considering that
items of related parties are eliminated during con-
solidation. The calculation is based on the items of
the Parent Company and the four principal subsidiar-
ies (GR Polska, GR Romania, GR RUS, PregLem). The
effect of the risk arising from currency fluctuation is
measured by different change in the exchange rates.
The calculation is based on balance sheet date
exchange rates.
The table below presents the effect of the change
in the year end currency rate on the net financial
position.
The worst case scenario is when EUR strengthens
and US$, PLN, RON, RUB, CHF weaken against HUF.
In this case the consolidated financial result would
decrease by HUF 4,181 million.
2012 Exchange rates Effect on net financial position
EUR/HUF US$/HUF EUR/US$ PLN/HUF RON/HUF RUB/HUF CHF/HUF HUF m
103.5% 301.4
228.5 1.32 74.0 68.0 7.6 249.4 3,386
220.9 1.36 71.5 65.7 7.3 241.1 (398)
213.3 1.41 69.0 63.4 7.0 232.8 (4,181)
100.0% 291.3
228.5 1.27 74.0 68.0 7.6 249.4 3.784
220.9 1.32 71.5 65.7 7.3 241.1 0
213.3 1.37 69.0 63.4 7.0 232.8 (3,784)
96.5% 281.2
228.5 1.23 74.0 68.0 7.6 249.4 4,181
220.9 1.27 71.5 65.7 7.3 241.1 398
213.3 1.32 69.0 63.4 7.0 232.8 (3,386)
2011 Exchange rates Effect on net financial position
EUR/HUF US$/HUF EUR/US$ PLN/HUF RON/HUF RUB/HUF CHF/HUF HUF m
103.6% 322.2
249.3 1.29 73.0 74.6 7.7 265.0 1,695
240.7 1.34 70.5 72.1 7.5 255.9 (50)
232.1 1.39 68.0 69.5 7.2 246.8 (1,963)
100.0% 311.1
249.3 1.25 73.0 74.6 7.7 265.0 1,745
240.7 1.29 70.5 72.1 7.5 255.9 0
232.1 1.34 68.0 69.5 7.2 246.8 (1,913)
96.4% 300.0
249.3 1.20 73.0 74.6 7.7 265.0 1,794
240.7 1.25 70.5 72.1 7.5 255.9 50
232.1 1.29 68.0 69.5 7.2 246.8 (1,864)
The best case scenario is when EUR weakens and
US$, PLN, RON, RUB, CHF would strengthen against
HUF. In this case the consolidated financial result
would increase by HUF 4,181 million.
.III.) Credit risk Credit risk arises from cash and cash equivalents,
derivative financial instruments and deposits with
banks and financial institutions, as well as credit
exposures to customers. The Group regularly
assesses its customers and establishes payment
terms and credit limits associated to them. Richter
also reviews the payment of the receivables regularly
and monitors the overdue balances. The Group also
regularly requires securities (e.g credit insurance,
bank guarantees…) from its customers.
The Group does business with key customers in
many countries. These customers are major import
distributors in their countries and management of
the Group maintains close contact with them on an
ongoing basis. Provisions for doubtful receivables
are estimated by the Group’s management based on
prior experience and current economic environment.
Credit risk on liquid funds and derivative financial
instruments is limited because the counterparties
are banks with high credit ratings assigned by
international rating agencies.
The credit rating of the five most significant bank’s
as of 31 December 2012 based on Standard and
Poor’s international credit rating institute are the
followings:
The Group holds more than 59% of its cash and cash
equivalents in 2012 (more than 79% in 2011) in the
above mentioned financial institutes.
The Group has no significant concentration of credit
risk, with its exposure spread over a large number of
counterparties and customers.
2012 2011
BNP Paribas SA A+ AA-
MKB Bank Zrt. BB+ B
ING Bank N.V A+ A+
Raiffeisen Bank Zrt. A A-
K&H Bank BBB BBB
Regions Trade receivables secured by Type of security
31. Dec. 2012 Credit insurance Bank guarantee L/C
HUF m HUF m HUF m HUF m
CIS 35,591 35,503 - 88
EU 976 - 976 -
USA - - - -
Other 473 154 88 231
Total 37,040 35,657 1,064 319

108 | Annual Report | Gedeon Richter 2012 Annual Report | Gedeon Richter 2012 | 109
IV.) Liquidity risk Cash flow forecasting is performed in the operating
entities of the Group. These forecasts are updated on
a monthly basis based on actual data. All amounts
presented in cash-flow statement are in line with
actual numbers of general ledgers. Group finance
monitors rolling forecasts of the Group’s liquidity
requirements to ensure it has sufficient cash to meet
operational needs at all times so that the Group does
not breach covenants. Such forecasting takes into
consideration the Group’s debt financing plans, cove-
nant compliance. Group treasury invests surplus cash
in interest bearing current accounts, time deposits,
money market deposits and marketable securities.
We have classified the investments without maturity
to the „over 5 years” category, since the management
of the Group is not planning to sell these assets
within 5 years.
The cash flows of the Investments in securities
contain the expected interest and the principal
amount as well.
The Cash and cash equivalents has been classified to
the „less than 3 months” category.
The Other non-current liabilities and Other liabilities
contain the purchase price of PregLem, which are
related to the achievements of specific milestones.
These payments have been categorized based on the
expected date of the payments.
At 31 December 2012 Notes Less than 3 months
Between 3 months and 1 year
Between 1 and 2 years
Between 2 and 5 years
Over 5 years
HUF m HUF m HUF m HUF m HUF m
Other financial asset 18 892 16,910 3,751 6,469
Loans receivable 188 208 1,990 3,542 289
Investments in securities 4,216 5,433 37 537 8
Cash and cash equivalents 24 101,505 - - - -
Borrowings 551 1,208 16,786 45,105 17,305
Trade payables 27 37,555 2,104 180 194 -
Other non-current liabilities 31 - - 16 11,552 -
Other liabilities 14,872 101 - 33 9
Net balance 52,949 3,120 1,955 (49,054) (10,548)
At 31 December 2011 Notes Less than 3 months
Between 3 months and 1 year
Between 1 and 2 years
Between 2 and 5 years
Over 5 years
HUF m HUF m HUF m HUF m HUF m
Other financial asset - 465 486 11,050 4,269
Loans receivable 135 640 419 4,275 266
Investments in securities 2,336 7,769 2,420 - -
Cash and cash equivalents 24 118,651 - - - -
Borrowings 531 1,511 1,896 55,274 11,213
Trade payables 27 39,200 1,601 215 - -
Other non-current liabilities 31 - - 60 9,648 -
Other liabilities 60,717 - - - -
Net balance 20,674 5,762 1,154 (49,597) (6,678)
11. Property, plant and equipment, and other intangible assets
All items of property, plant and equipment are free from liens and charges. The amount of Land and buildings
does not contain the value of Investment property.
Land and buildings
Plant and equipment
Construction in progress
Total
HUF m HUF m HUF m HUF m
Gross value
at 31 December 2010 108,019 171,012 20,197 299,228
Translation differences 2,248 1,878 112 4,238
Effect of newly acquired companies 1,243 225 6 1,474
Capitalization 17,611 19,533 (37,144) -
Transfers and capital expenditure - 239 26,624 26,863
Transfer to Investment property - - (345) (345)
Disposals (1,357) (3,511) (21) (4,889)
at 31 December 2011 127,764 189,376 9,429 326,569
Accumulated depreciation
at 31 December 2010 24,386 130,168 - 154,554
Translation differences 379 1,149 - 1,528
Effect of newly acquired companies 147 155 - 302
Current year depreciation 3,065 14,329 - 17,394
Net foreign currency exchange differences 82 235 - 317
Disposals (282) (2,874) - (3,156)
at 31 December 2011 27,777 143,162 - 170,939
Net book value
at 31 December 2010 83,633 40,844 20,197 144,674
at 31 December 2011 99,987 46,214 9,429 155,630
Land and buildings
Plant and equipment
Construction in progress
Total
HUF m HUF m HUF m HUF m
Gross value
at 31 December 2011 127,764 189,376 9,429 326,569
Translation differences (1,629) (1,603) (105) (3,337)
Capitalization 4,471 18,102 (22,573) -
Transfers and capital expenditure 267 324 24,043 24,634
Transfer to Investment property - - (10) (10)
Disposals (1,532) (3,57 7) (19) (5,128)
at 31 December 2012 129,341 202,622 10,765 342,728
Accumulated depreciation
at 31 December 2011 27,7 7 7 143,162 - 170,939
Translation differences (293) (973) - (1,266)
Current year depreciation 3,626 14,243 - 17,869
Net foreign currency exchange differences 10 31 - 41
Disposals (394) (2,969) - (3,363)
at 31 December 2012 30,726 153,494 - 184,220
Net book value
at 31 December 2011 99,987 46,214 9,429 155,630
at 31 December 2012 98,615 49,128 10,765 158,508
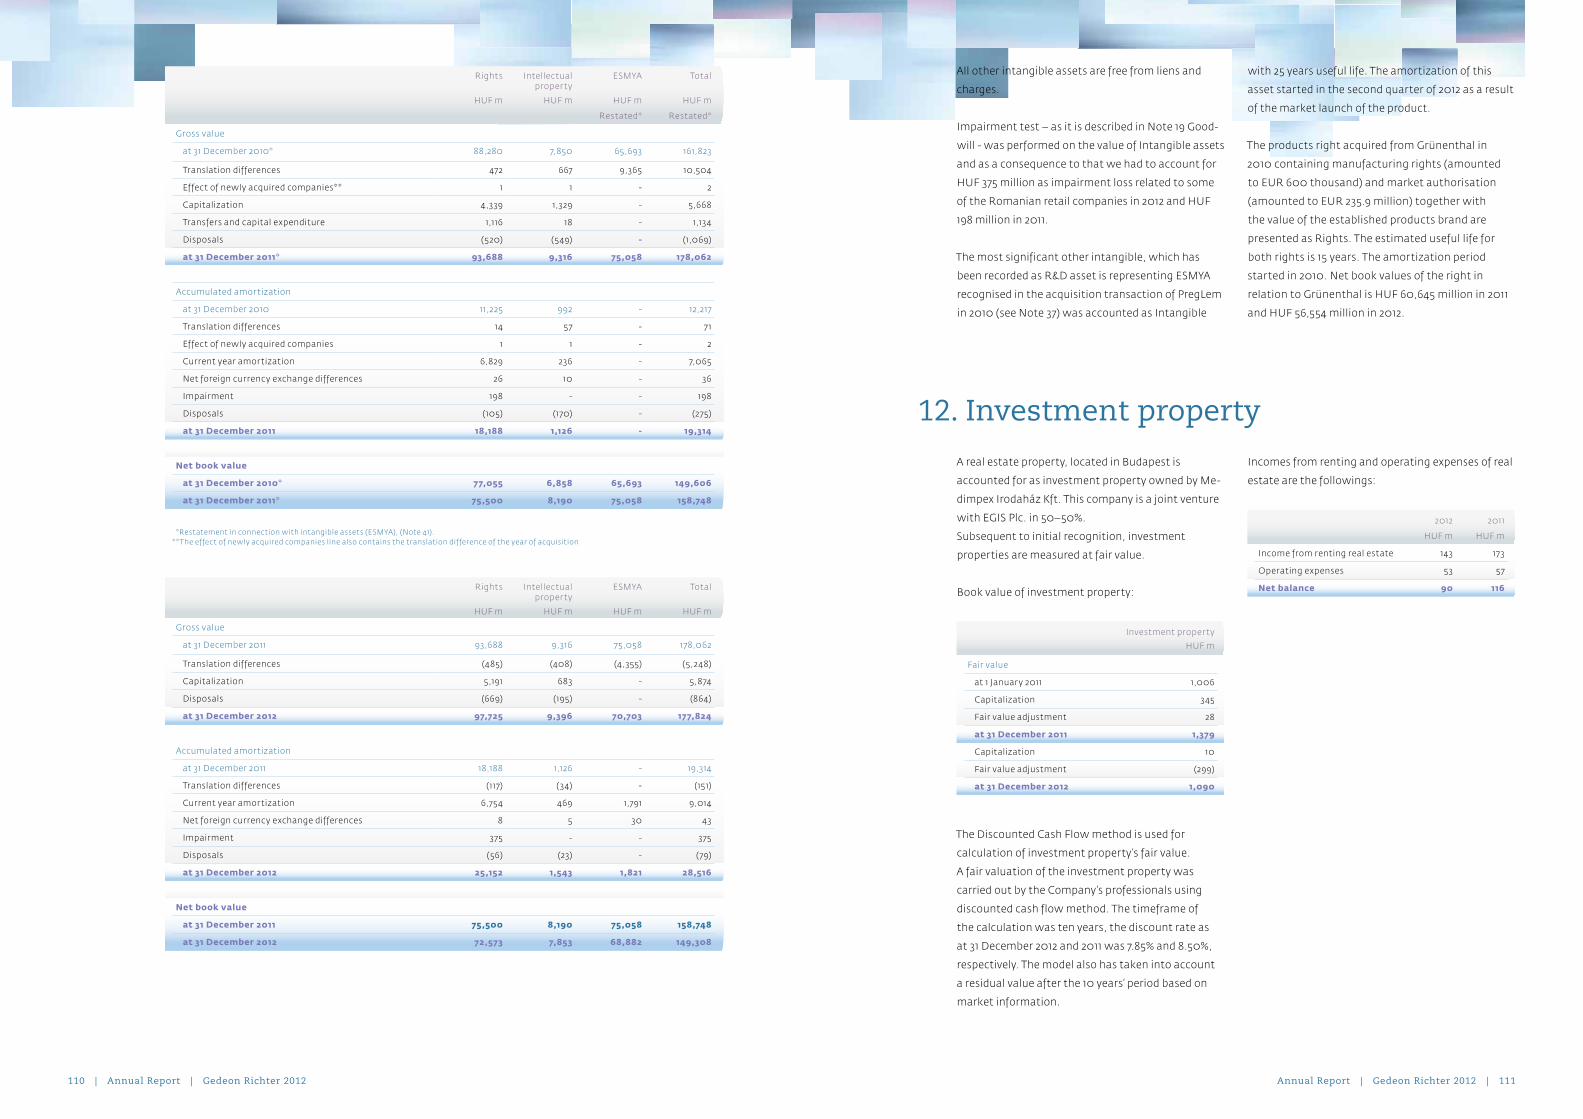
110 | Annual Report | Gedeon Richter 2012 Annual Report | Gedeon Richter 2012 | 111
Rights Intellectual property
ESMYA Total
HUF m HUF m HUF m HUF m
Restated* Restated*
Gross value
at 31 December 2010* 88,280 7,850 65,693 161,823
Translation differences 472 667 9,365 10,504
Effect of newly acquired companies** 1 1 - 2
Capitalization 4,339 1,329 - 5,668
Transfers and capital expenditure 1,116 18 - 1,134
Disposals (520) (549) - (1,069)
at 31 December 2011* 93,688 9,316 75,058 178,062
Accumulated amortization
at 31 December 2010 11,225 992 - 12,217
Translation differences 14 57 - 71
Effect of newly acquired companies 1 1 - 2
Current year amortization 6,829 236 - 7,065
Net foreign currency exchange differences 26 10 - 36
Impairment 198 - - 198
Disposals (105) (170) - (275)
at 31 December 2011 18,188 1,126 - 19,314
Net book value
at 31 December 2010* 77,055 6,858 65,693 149,606
at 31 December 2011* 75,500 8,190 75,058 158,748
* Restatement in connection with intangible assets (ESMYA), (Note 41). **The effect of newly acquired companies line also contains the translation difference of the year of acquisition
Rights Intellectual property
ESMYA Total
HUF m HUF m HUF m HUF m
Gross value
at 31 December 2011 93,688 9,316 75,058 178,062
Translation differences (485) (408) (4,355) (5,248)
Capitalization 5,191 683 - 5,874
Disposals (669) (195) - (864)
at 31 December 2012 97,725 9,396 70,703 177,824
Accumulated amortization
at 31 December 2011 18,188 1,126 - 19,314
Translation differences (117) (34) - (151)
Current year amortization 6,754 469 1,791 9,014
Net foreign currency exchange differences 8 5 30 43
Impairment 375 - - 375
Disposals (56) (23) - (79)
at 31 December 2012 25,152 1,543 1,821 28,516
Net book value
at 31 December 2011 75,500 8,190 75,058 158,748
at 31 December 2012 72,573 7,853 68,882 149,308
All other intangible assets are free from liens and
charges.
Impairment test – as it is described in Note 19 Good-
will - was performed on the value of Intangible assets
and as a consequence to that we had to account for
HUF 375 million as impairment loss related to some
of the Romanian retail companies in 2012 and HUF
198 million in 2011.
The most significant other intangible, which has
been recorded as R&D asset is representing ESMYA
recognised in the acquisition transaction of PregLem
in 2010 (see Note 37) was accounted as Intangible
with 25 years useful life. The amortization of this
asset started in the second quarter of 2012 as a result
of the market launch of the product.
The products right acquired from Grünenthal in
2010 containing manufacturing rights (amounted
to EUR 600 thousand) and market authorisation
(amounted to EUR 235.9 million) together with
the value of the established products brand are
presented as Rights. The estimated useful life for
both rights is 15 years. The amortization period
started in 2010. Net book values of the right in
relation to Grünenthal is HUF 60,645 million in 2011
and HUF 56,554 million in 2012.
12. Investment property
A real estate property, located in Budapest is
accounted for as investment property owned by Me-
dimpex Irodaház Kft. This company is a joint venture
with EGIS Plc. in 50–50%.
Subsequent to initial recognition, investment
properties are measured at fair value.
Book value of investment property:
The Discounted Cash Flow method is used for
calculation of investment property’s fair value.
A fair valuation of the investment property was
carried out by the Company’s professionals using
discounted cash flow method. The timeframe of
the calculation was ten years, the discount rate as
at 31 December 2012 and 2011 was 7.85% and 8.50%,
respectively. The model also has taken into account
a residual value after the 10 years’ period based on
market information.
Incomes from renting and operating expenses of real
estate are the followings:
Investment property
HUF m
Fair value
at 1 Januar y 2011 1,006
Capitalization 345
Fair value adjustment 28
at 31 December 2011 1,379
Capitalization 10
Fair value adjustment (299)
at 31 December 2012 1,090
2012 2011
HUF m HUF m
Income from renting real estate 143 173
Operating expenses 53 57
Net balance 90 116

112 | Annual Report | Gedeon Richter 2012 Annual Report | Gedeon Richter 2012 | 113
13. Consolidated companiesDetails of the Group’s subsidiaries at 31 December are
as follows:
Name Place of incorporation
(or registration) and operation
Proportion of ownership
%
Proportion of voting rights
held%
Principal activity
2012 2011 2012 2011
ZAO Gedeon Richter - RUS Russia 100.00 100.00 100.00 100.00 Pharmaceutical manufacturing
Gedeon Richter Romania S.A. Romania 99.88 99.87 99.88 99.87 Pharmaceutical manufacturing
Gedeon Richter Polska Sp. z o.o. Poland 99.88 99.88 99.88 99.88 Pharmaceutical manufacturing
Richter Themis Ltd. India 51.00 51.00 51.00 51.00 Pharmaceutical manufacturing
Gedeon Richter Pharma GmbH Germany 100.00 100.00 100.00 100.00 Pharmaceutical trading
Gedeon Richter USA Inc. USA 100.00 100.00 100.00 100.00 Pharmaceutical trading
RG Befektetéskezelő Kft. Hungary 100.00 100.00 100.00 100.00 Financial-accounting and controlling activities
Gedeon Richter UA V.A.T. Ukraine 98.16 98.16 98.16 98.16 Pharmaceutical manufacturing
Gedeon Richter UK Ltd. UK 100.00 100.00 100.00 100.00 Pharmaceutical trading
Gedeon Richter Iberica S.A. Spain 100.00 100.00 100.00 100.00 Pharmaceutical trading
Nedermed B.V. The Netherlands 100.00 100.00 100.00 100.00 Pharmaceutical trading
Medimpex Japan Co. Ltd. Japan 90.90 90.90 90.90 90.90 Pharmaceutical trading
Medimpex Jamaica Ltd. Jamaica 60.00 60.00 60.00 60.00 Pharmaceutical trading
Medimpex West Indies Ltd. Jamaica 60.00 60.00 60.00 60.00 Pharmaceutical trading
Humanco Kft. Hungary 100.00 100.00 100.00 100.00 Social, welfare ser vices
Pesti Sas Holding Kft. Hungary 100.00 100.00 100.00 100.00 Portfolio management
Richter Szolgáltató Kft. Hungary 100.00 100.00 100.00 100.00 Catering services
Reflex Kft. Hungary 100.00 100.00 100.00 100.00 Transportation, carriage
Cito-Trans Kft. Hungary 100.00 100.00 100.00 100.00 Car rental
Chemitechnik Pharma Kft. Hungary 66.67 66.67 66.67 66.67 Engineering services
GYEL Kft. Hungary 66.00 66.00 66.00 66.00 Quality control ser vices
Armedica Trading S.R.L. Romania 99.88 99.87 99.88 99.87 Asset management
Gedeon Richter Farmacia S.A. Romania 99.88 99.87 99.88 99.87 Pharmaceutical retail
Pharmanet S.R.L. Romania 99.88 99.87 99.88 99.87 Pharmaceutical retail
Gedeon Richter France S.A.R.L.* France 99.99 99.99 99.99 99.99 Pharmaceutical retail
Gedeon Richter-Retea Farmaceutica S.R.L. Moldavia 51.00 51.00 51.00 51.00 Pharmaceutical retail
Richter-Helm BioLogics GmbH & Co. KG Germany 70.00 70.00 70.00 70.00 Biotechnological manufacturing and research
Richter-Helm BioLogics Management GmbH
Germany 70.00 70.00 70.00 70.00 Asset management
Medimpex UK Ltd. UK 100.00 100.00 100.00 100.00 Pharmaceutical trading
Farnham Laboratories Ltd. UK 100.00 100.00 100.00 100.00 Pharmaceutical trading
Gedeon Richter Aptyeka sp.O.O.O. Armenia 51.00 51.00 51.00 51.00 Pharmaceutical retail
Pharmafarm S.A. Romania 99.88 99.87 99.88 99.87 Pharmaceutical wholesale
Gedeon Richter Ukrfarm O.O.O. Ukraine 100.00 100.00 100.00 100.00 Pharmaceutical retail
Name Place of incorporation
(or registration) and operation
Proportion of ownership
%
Proportion of voting rights
held%
Principal activity
2012 2011 2012 2011
Gedeon Richter Marketing Polska Sp. z o.o. Poland 99.98 99.98 99.98 99.98 Marketing ser vices
Gedeon Richter Italia S.R.L. Italy 100.00 100.00 100.00 100.00 Pharmaceutical retail
PregLem S.A. Switzerland 100.00 100.00 100.00 100.00 Manufacturing and research
Gedeon Richter Marketing ČR s.r.o. Czech Republic 100.00 100.00 100.00 100.00 Marketing ser vices
Gedeon Richter Slovakia s.r.o. Slovak Republic 100.00 100.00 100.00 100.00 Marketing ser vices
Richter-Lambron O.O.O. Armenia 51.00 51.00 51.00 51.00 Pharmaceutical trading
Gedeon Richter Austria GmbH Austria 100.00 100.00 100.00 100.00 Marketing ser vices
Gedeon Richter (Schweiz) AG Switzerland 100.00 100.00 100.00 100.00 Marketing ser vices
Pharmarichter O.O.O. Russia 100.00 100.00 100.00 100.00 Pharmaceutical sales promotion
Richpangalpharma O.O.O. Moldavia 65.00 65.00 65.00 65.00 Pharmaceutical trading
Gedeon Richter Portugal, Unipessoal Lda. Portugal 100.00 100.00 100.00 100.00 Marketing ser vices
PregLem France SAS France 100.00 100.00 100.00 100.00 Marketing ser vices
Pesti Sas Patika Bt. Hungar y 74.00 74.00 50.00 50.00 Pharmaceutical retail
Gedeon Richter Slovenija, trženje, d.o.o. Slovenia 100.00 100.00 100.00 100.00 Marketing ser vices
* Gedeon Richter France S.A.R.L. merged into Medimpex France S.A.R.L. in Januar y 2012 and continues to operate as Gedeon Richter France S.A.R.L.
Subsidiaries newly included in the consolidation
Name Date of establish-
ment/ acquisition
Place of incorpora-tion (or registra-
tion) and operation
Proportion of ownership
%
Proportion of voting rights
held%
Principal activity
2012 2011 2012 2011
Gedeon Richter Benelux SPRL* 02.2012 Belgium 100.00 - 100.00 - Marketing ser vices
Gedeon Richter Nordics AB* 04.2012 Sweden 100.00 - 100.00 - Marketing ser vices
* Newly established by the Group.

114 | Annual Report | Gedeon Richter 2012 Annual Report | Gedeon Richter 2012 | 115
14. Joint venturesThe Group had the following interests in joint ventures:
The following amounts are included in the Group’s
financial statements as a result of the proportional
consolidation of the above joint ventures:
Joint ventures companies have no significant
financial and other cost.
15. Investments in associated companies
At 31 December the following associated companies
have been accounted for by the equity method:
The balances of Hungaropharma Zrt, the most
significant associate of the Group is not yet audited.
Amounts of assets, liabilities, revenues and profit/
loss are presented at 100%.
Name Place of incor-poration (or registration)
and operation
Proportion of ownership
%
Proportion of vot-ing rights held
%
Principal activity
2012 2011 2012 2011
Medimpex Irodaház Kft. Hungary 50.00 50.00 50.00 50.00 Renting real estate
Richter-Helm BioTec Management GmbH Germany 50.00 50.00 50.00 50.00 Assets management
Richter-Helm BioTec GmbH & Co. KG Germany 50.00 50.00 50.00 50.00 Trading of biotech products
Gedeon Richter Rxmidas Ltd. Hong-Kong 50.00 50.00 50.00 50.00 Marketing services
Grmidas Medical Ser vice (China) Co.Ltd. China 50.00 50.00 50.00 50.00 Marketing services
31 December 2012 31 December 2011
HUF m HUF m
Current assets 357 225
Non-current assets 1,273 1,393
Short-term liabilities 212 132
Long-term liabilities 3,614 2,47 7
Revenues 254 291
Cost of sales 164 144
R&D cost 1,116 1,121
2012 2011
HUF m HUF m
At 1 Januar y 1,754 6,093
Step up to subsidiar y - (403)
Sale of investment (12) (1)
Merge - (4)
Increase of share capital - 283
Additional payment 30 17
Share of profit/(loss)* 342 (4,234)
Exchange difference 1 3
At 31 December 2,115 1,754
* Hungaropharma Zrt. is the most significant associated company of the Group, caused HUF 4,294 million loss from associates in 2011, this amount presented in Consolidated Cash Flow Statement within Non cash items accounted through Comprehensive and Consolidated Income Statement.
Name Place of incor-poration
Principal activity Assets Liabilities Revenues Profit/(loss)
Interest held
HUF m HUF m HUF m HUF m %
2012
Hungaropharma Zrt. Hungar y Pharmaceutical wholesale
51,796 46,646 232,790 928 30.68
Salvia-Med Bt. Hungar y Pharmaceutical retail 52 33 468 13 32.79
Szondi Bt. Hungar y Pharmaceutical retail 162 28 439 25 33.00
Top Medicina Bt. Hungar y Pharmaceutical retail 54 52 295 (7) 20.00
Medservice Richter O.O.O.
Kazakhstan Pharmaceutical trading
48 8 - - 49.00
Vita-Richter O.O.O. Azerbaijan Pharmaceutical trading
509 438 - - 49.00
Pharmapolis Kft. Hungar y Building project management
6,904 7,021 155 (120) 24.00
Cerorin Kft. Hungar y Biotechnological research, development
1 0 - (0.6) 24.00
Pharmatom Kft. Hungar y Biotechnological research, development
366 385 - (61) 24.00
Name Place of incorporation
Principal activity Assets Liabilities Revenues Profit/(loss)
Interest held
HUF m HUF m HUF m HUF m %
2011
Hungaropharma Zrt. Hungar y Pharmaceutical wholesale
56,116 52,254 254,828 (8,220) 30.68
Salvia-Med Bt. Hungar y Pharmaceutical retail 56 27 499 15 32.79
Szondi Bt. Hungar y Pharmaceutical retail 157 24 464 23 33.00
Gyulai Fodormenta Bt. Hungar y Pharmaceutical retail 85 24 449 23 20.00
Top Medicina Bt. Hungar y Pharmaceutical retail 56 47 314 (1) 20.00
Medservice Richter O.O.O.
Kazakhstan Pharmaceutical trading
53 9 - - 49.00
Vita-Richter O.O.O. Azerbaijan Pharmaceutical trading
554 476 - - 49.00
Pharmapolis Kft. Hungar y Building project management
5,549 5,576 - (29) 24.00
Cerorin Kft. Hungar y Biotechnological research, development
1 0 - (0.6) 24.00
Pharmatom Kft. Hungar y Biotechnological research, development
276 261 - 13 24.00

116 | Annual Report | Gedeon Richter 2012 Annual Report | Gedeon Richter 2012 | 117
16. Other financial assets
The held to maturity investment contains “Exchange-
able Bonds” issued by the Hungarian State Holding
Company (MNV Zrt.) that has maturity date of 2014.
At maturity these bonds might be transferred to
Richter shares already in the ownership of MNV Zrt.
The Group owns “Exchangeable Bonds” in the nomi-
nal value of EUR 52 million as of 31 December 2012.
(EUR 34 million as of 31 December 2011).
Available-for-sale investments presented among
Other financial assets have not been sold in current
year and therefore no amount has been recycled to
the Consolidated Income Statement.
Available-for-sale investment contains 5% owner-
ship in Zao Firma CV Protek valued at fair value
based on the closing stock exchange price (7.26 RUB/
share). Since there was significant rise in the fair
value of investment an increase of HUF 2,196 million
has been recorded against revaluation reserve for
available for sale investments (through Consolidated
Statement of Comprehensive Income) in 2012.
17. Current income tax and deferred taxCurrent tax assets and liabilities
Deferred tax is calculated by the liability method
based on the temporary differences. Deferred tax
assets and liabilities and the deferred tax (charge)/
credit in the Consolidated Balance Sheet are included
to the following items:
The movement in deferred income tax assets and
liabilities during the year is presented on page 117.
In the deferred tax balance, HUF 591 million is
expected to reverse after 12 months.
At 31 December 2012 Richter Group has HUF 38,904
million unused tax loss (that would result in HUF
6,386 million deferred tax asset) for which no
deferred tax asset has been recognised since the
recovery is not probable, while in 2011 the Group had
HUF 28,071 million unused tax loss (that would have
resulted in HUF 4,588 million deferred tax asset after
the restatement).
In 2012 most of the unused tax loss for which no
deferred tax asset has been recognised is in relation
to PregLem’s unused tax loss at cantonal level. The
unused tax loss for which no deferred tax asset has
been recognised is expected to expire or be utilised
during the period of tax holiday of PregLem.
Temporary differences arising in connection
with interest in associates and joint ventures are
insignificant.
As a result of the decision of Richter’s and PregLem’s
Boards Preglem’s activities will be restructured from
2013 onwards and ESMYA® will be manufactured and
sold by the Parent Company. While after this restruc-
turing most of ESMYA® revenues will be taxed by the
effective tax rates of the Parent Company therefore
Deferred tax liabilities related to ESMYA® intangible
assets were re-estimated and recalculated.
This change in management estimations resulted in
HUF 2,820 million decrease in Deferred tax liabilities
with a corresponding charge to income tax in the
Consolidated Income Statement in 2012.
31 December 2012 31 December 2011
HUF m HUF m
Held to maturity investments carried at amortised cost 18,712 10,106
Available-for-sale investments carried at fair value 6,714 4,232
Total 25,426 14,338
31 December 2012 31 December 2011
HUF m HUF m
Restated*
Deferred tax assets
3,342 3,605
Deferred tax liabilities
(9,634) (14,154)
Net position at 31 December
(6,292) (10,549)
* Restatement in connection with intangible assets (ESMYA), (Note 41).
31 December 2012 31 December 2011
HUF m HUF m
Current tax assets 1,117 501
Current tax liabilities
123 34
Deferred tax liabilities Local GAAPs –IFRS differences
Fixed and intangible assets
Other temporary differences*
Total
HUF m HUF m HUF m HUF m
Restated** Restated**
31 December 2010** 533 268 13,352 14,153
Charged/(credited) to the income statement** (47 7) (120) (1,885) (2,482)
Charged/(credited) to other comprehensive income (51) - 32 (19)
Exchange differences 8 (14) 2,522 2,516
Transfer - - (14) (14)
31 December 2011 13 134 14,007 14,154
Charged/(credited) to the income statement - 12 (3,668) (3,656)
Charged/(credited) to other comprehensive income - - 12 12
Exchange differences - (15) (861) (876)
Transfer - 5 (5) -
31 December 2012 13 136 9,485 9,634
* The most significant deferred tax liability balance presented is in relation to the acquisition of PregLem, where the deferred tax liability that arose as a result of recognition of ESMYA was partially off set by the unused tax loss of the company available at federal level. As a result of this transaction net deferred tax liability has been presented in the value of HUF 9,325 million in 2012 and HUF 13,707 million in 2011 after the restatement.
** Restatement in connection with intangible assets (ESMYA), (Note 41).
Deferred tax assets Local GAAPs –IFRS differences
Fixed and intangible assets
Provision Impairment Other tempo-rar y differences
Consolidation adjustments
Total
HUF m HUF m HUF m HUF m HUF m HUF m HUF m
31 December 2010 452 503 131 293 (232) 47 7 1,624
Charged/(credited) to the income statement
(448) 240 200 45 320 1,217 1,574
Charged/(credited) to other comprehensive income
- - - - 374 - 374
Exchange differences - 13 5 - 29 - 47
Transfer - - - - (14) - (14)
31 December 2011 4 756 336 338 47 7 1,694 3,605
Charged/(credited) to the income statement
18 (58) 29 (25) (266) 92 (210)
Charged/(credited) to other comprehensive income
- - - - (42) - (42)
Exchange differences (2) (9) 3 - (3) - (11)
Transfer - 38 13 11 (62) - -
31 December 2012 20 727 381 324 104 1,786 3,342

118 | Annual Report | Gedeon Richter 2012 Annual Report | Gedeon Richter 2012 | 119
Goodwill
HUF m
Restated*
Cost
At 1 Januar y 2011 33,170
Decrease from sale of subsidiaries (23)
Exchange differences 4,054
At 31 December 2011 37,201
At 1 Januar y 2012 37,201
Exchange differences (1,940)
At 31 December 2012 35,261
Impairment
At 1 Januar y 2011 (3,187)
Impairment charged for the year (271)
At 31 December 2011 (3,458)
At 1 Januar y 2012 (3,458)
Impairment charged for the year (201)
At 31 December 2012 (3,659)
Net book value
At 1 January 2011 29,983
At 31 December 2011 33,743
At 31 December 2012 31,602
* Restatement in connection with intangible assets (ESMYA), (Note 41).
18. Loans receivable
19. Goodwill
Impairment test was performed on the value of the
goodwill.
Gedeon Richter Polska Sp. z o.o.Gedeon Richter Polska Sp. z o.o. achieved significant
profit in 2012, and according to its midterm financial
plans further growth is expected of the company.
As a result of this no impairment was required at
the end of financial year of 2012 similar to 2011. Any
reasonable change in the key assumptions are still
not expected to result in an impairment of Goodwill.
Armedica Trading GroupThe Group has allocated the goodwill to pharmacies
and performs the impairment review on group of
cash generating units (CGU) level similarly to prior
years. Two groups of CGUs have been set up and
the pharmacies were categorized into these groups
based on their EBITDA performance.
Each year the performance of the pharmacies is
assessed whether they are grouped into the correct
category of pharmacies. A classification criteria
has been defined as -0.75% EBITDA/sales level. The
Group determined this level by analysing, that there
have been more developing pharmacies reaching
this limit in 2012 and forecasting their further
growth strengthening the future return of the
group. At the same time above the indicated level
the Group has observed a well-performing pharmacy
subgroup where in certain cases slight fluctuation
has appeared in the individual EBITDA levels which is
only temporary phenomenon.
We have assessed the recoverable amount with
“value in use” method considering the economic
environment, which did not change significantly
in compare to the prior year. In the “value in use”
model we have made estimation on future perfor-
mance based on historical data and realistic market
assumptions on mid and long term timeframe.
The Group performed the present value calculation
using estimation of 5 years cash flows and applying
a perpetuity cash flow afterwards for the residual
periods.
In case of the underperforming group where the
recoverable amount of the group is less than
its carrying amount, the Group has recorded
impairment on the goodwill balance.
Since as a result of prior year impairment tests,
the entire goodwill balance have been impaired
for the group which contains the pharmacies
that achieve the lowest EBITDA, we have focused
our impairment review on the developing and
well-performing group.
We also performed sensitivity test including the
following parameters: Volume of sales, Weighted
Average Cost of Capital (WACC) and mark-up.
By changing ceteris paribus these factors 10%
declining for the volume of sales and 10% increase
of WACC and 5% declining for mark-up the following
additional impairment would be required.
Closing goodwill on Cash Generating Units (Companies)
31 December 2012 31 December 2011
HUF m HUF m
Restated*
Pharmaceuticals segment
GR Polska Sp. z o.o. 1,069 1,055
Richter-Helm Biologics Co & KG 93 99
PregLem S.A.* 28,789 30,562
Wholesale and retail segment
Armedica Trading Group 1,590 1,966
Other segment
Pesti Sas Holding Kft. 61 61
Total 31,602 33,743
* Restatement in connection with intangible assets (ESMYA), (Note 41).
HUF m
WACC 0
Net-sales 357
Mark-up 357
31 December 2012 31 December 2011
HUF m HUF m
Loans given to related parties 4,584 3,627
Loans given to employees 462 440
Other loans given 5 5
Total 5,051 4,072

120 | Annual Report | Gedeon Richter 2012 Annual Report | Gedeon Richter 2012 | 121
PregLem S.A.PregLem was acquired on 6 October 2010. This
acquisition supports and provides a gynaecological
portfolio and development of the Group’s presence
in Western Europe. On the acquisition the intangible
asset ESMYA and goodwill has also been recognized.
At the date of the acquisition ESMYA®, the most
important product in this portfolio, a novel treatment
for uterine fibroids, was close to the registration.
In February 2012 the European Commission (EC)
has granted marketing authorization to ESMYA® as
pre-operative treatment of uterine fibroids. After the
approval during 2012 ESMYA® was launched gradually
in 17 EU member countries, ESMYA® reported total
sales of EUR 3.6 million at the end of 2012. Turnover
recorded in Germany contributed the most to the
achieved sales levels.
In order to expand the indication to meet the needs
of a wider range of affected women Richter initiated
Phase III clinical studies at the beginning of the
third quarter to establish the long term (on-off )
usage of ESMYA® targeting a substantial recession
of fibroid tumours consequently making surgical
interventions unnecessary. The studies are expected
to be completed by second quarter 2014.
The ESMYA intangible asset and the connected
goodwill of Preglem have been tested together.
Considering that the future cash flows from
continuing use of the assets are considerable,
the recoverable amount has been determined for
a cash generating unit connected with the ESMYA
intangibles and Preglem goodwill (ESMYA GW CGU).
On the basis of the impairment test performed
the management assessed that no impairment
should be charged on the goodwill of Preglem as
of 31 December 2012.
Key facts and assumptions around the management
estimation on the future performance of ESMYA® are
as follows:
Cash flow projections have been prepared separately
for EU and US ESMYA® sales.
Key facts and assumptions for the EU ESMYA®
sales: for the product launched in 2012 in Europe for
preoperative treatment, an authorization is expected
to be obtained in 2014 for extended use. For long
term treatment the product shall be available from
2016. The group has data exclusivity till 2020, so
generic competition and market share loss/price
decrease expected from only 2020 as a consequence.
Key facts and assumptions for the US ESMYA® sales:
ESMYA® expected to be launched in 2016 by the US
partner. As a conservative scenario, sales decrease
has been considered from 2020 because of the
expiration of exclusivity.
The income approach has been used to determine
the recoverable amount of the CGU, in a fair value
aspect. These calculations use cash flow projections
based on financial budgets approved by manage-
ment for the period 2013-2016. Cash flows beyond
2016 are based on management estimations taking
into account the original long term ESMYA® revenue
model.
When management assesses the estimated future
performance, cash flows have been projected over
the estimated useful life of the asset. The growth
in future cash flows is strictly determined by an
expected uptake and the period of data exclusivity.
Free cash flow is expected to peak in 2019. The
Compound Annual Growth Rate (CAGR) for the
period 2013-2019 is 40%. After termination of data
exclusivity the free cash flow is expected to decline
to the 23% of the peak, over 4 year with a CAGR -26%.
After reaching this level the free cash flow is expected
to remain stable till the end of the forecast period.
The discount rate (post tax: 8.63%; equivalent to a
pre-tax rate of 11.35 %) applied reflects current market
assessments of the time value of money and the
risks specific to the CGU for which future cash flow
estimates have not been adjusted.
The present value of the above mentioned cash
flows does not differ significantly from the present
value of the cash flows calculated for 7 years until
2019 and applying a perpetuity cash flow estimation
afterwards.
The recoverable amount of ESMYA GW CGU
calculated based on fair value approach exceeded
carrying value of the sum of ESMYA intangible asset
and the related GW. A rise in post tax discount rate to
9.13 % would remove the remaining headroom.
20. Inventories
Inventories include impairment in value of HUF 1,902
million and reversal of impairment in value of HUF
236 million in 2012 (HUF 1,733 million impairment and
HUF 804 million reversal was made in 2011).
The reversal of impairment is due to the change of
market conditions.
As of 31 December 2012 the total carrying amount of
inventories that are valued at the net realisable value
amounts to be HUF 270 million.
All items of Inventories are free from liens and
charges.
21. Trade receivables
Trade receivables include HUF 1,192 million
impairment and HUF 1,659 million reversal of
impairment in 2012 (in 2011 the net impairment was
HUF 1,283 million).
The reversal of impairment is explained with the
decrease of overdue receivables.
31 December 2012 31 December 2011
HUF m HUF m
Raw materials, packaging and consumables 23,745 23,821
Production in progress 1,396 1,048
Semi-finished and finished goods 39,008 38,568
Total 64,149 63,437
31 December 2012 31 December 2011
HUF m HUF m
Trade receivables 81,442 84,973
Amounts due from related companies 21,034 18,514
Total 102,476 103,487
Ageing of Trade receivables
31 December 2012 31 December 2011
HUF m HUF m
Trade receivables not expired 87,325 89,138
Trade receivables overdue, not impaired 13,342 11,443
1–90 days 11,761 10,341
91–180 days 1,068 809
181–360 days 461 237
>360 days 52 56
Trade receivables overdue, impaired 6,948 9,194
1–90 days 1,218 2,005
91–180 days 461 516
181–360 days 563 1,629
>360 days 4,706 5,044
Impairment on trade receivables (5,139) (6,288)
1–90 days (122) (200)
91–180 days (80) (26)
181–360 days (250) (1,056)
>360 days (4,687) (5,006)
Total 102,476 103,487
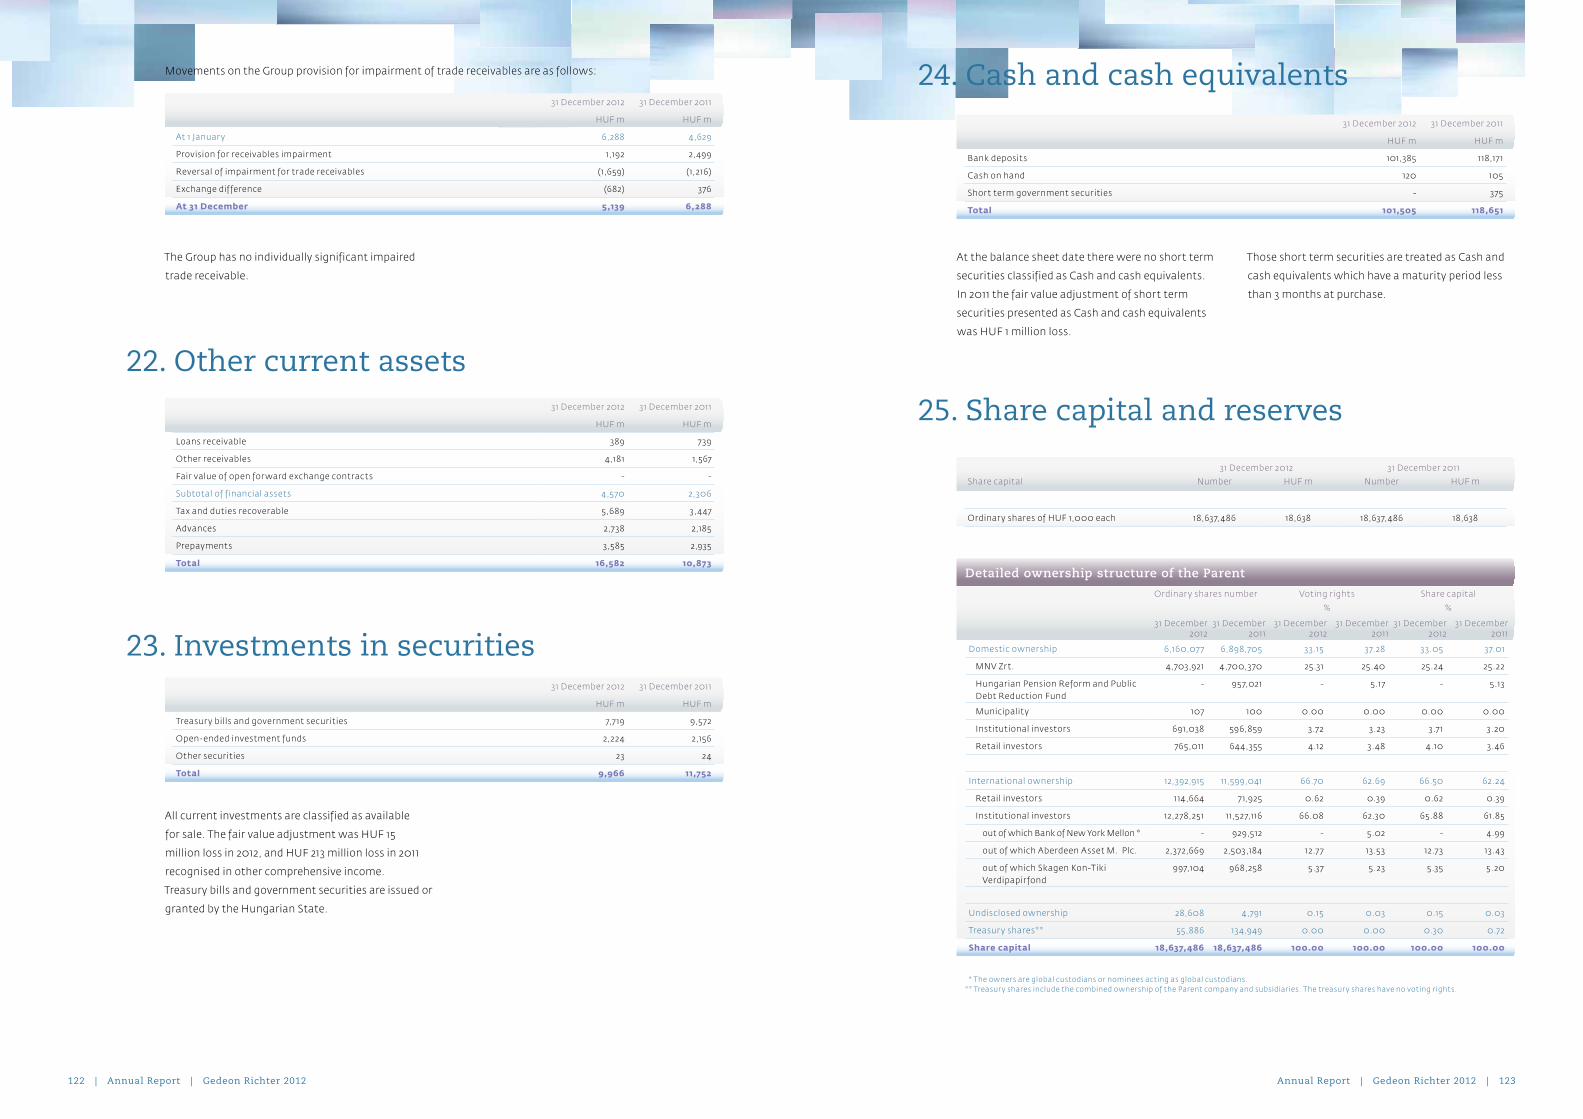
122 | Annual Report | Gedeon Richter 2012 Annual Report | Gedeon Richter 2012 | 123
22. Other current assets
23. Investments in securities
All current investments are classified as available
for sale. The fair value adjustment was HUF 15
million loss in 2012, and HUF 213 million loss in 2011
recognised in other comprehensive income.
Treasury bills and government securities are issued or
granted by the Hungarian State.
Movements on the Group provision for impairment of trade receivables are as follows:
The Group has no individually significant impaired
trade receivable.
24. Cash and cash equivalents
At the balance sheet date there were no short term
securities classified as Cash and cash equivalents.
In 2011 the fair value adjustment of short term
securities presented as Cash and cash equivalents
was HUF 1 million loss.
Those short term securities are treated as Cash and
cash equivalents which have a maturity period less
than 3 months at purchase.
25. Share capital and reserves
31 December 2012 31 December 2011
HUF m HUF m
At 1 Januar y 6,288 4,629
Provision for receivables impairment 1,192 2,499
Reversal of impairment for trade receivables (1,659) (1,216)
Exchange difference (682) 376
At 31 December 5,139 6,288
31 December 2012 31 December 2011
HUF m HUF m
Treasur y bills and government securities 7,719 9,572
Open-ended investment funds 2,224 2,156
Other securities 23 24
Total 9,966 11,752
31 December 2012 31 December 2011
HUF m HUF m
Loans receivable 389 739
Other receivables 4,181 1,567
Fair value of open for ward exchange contracts - -
Subtotal of financial assets 4,570 2,306
Tax and duties recoverable 5,689 3,447
Advances 2,738 2,185
Prepayments 3,585 2,935
Total 16,582 10,873
31 December 2012 31 December 2011
HUF m HUF m
Bank deposits 101,385 118,171
Cash on hand 120 105
Short term government securities - 375
Total 101,505 118,651
Detailed ownership structure of the Parent
Ordinar y shares number Voting rights Share capital
% %
31 December 2012
31 December 2011
31 December 2012
31 December 2011
31 December 2012
31 December 2011
Domestic ownership 6,160,07 7 6,898,705 33.15 37.28 33.05 37.01
MNV Zrt. 4,703,921 4,700,370 25.31 25.40 25.24 25.22
Hungarian Pension Reform and Public Debt Reduction Fund
- 957,021 - 5.17 - 5.13
Municipality 107 100 0.00 0.00 0.00 0.00
Institutional investors 691,038 596,859 3.72 3.23 3.71 3.20
Retail investors 765,011 644,355 4.12 3.48 4.10 3.46
International ownership 12,392,915 11,599,041 66.70 62.69 66.50 62.24
Retail investors 114,664 71,925 0.62 0.39 0.62 0.39
Institutional investors 12,278,251 11,527,116 66.08 62.30 65.88 61.85
out of which Bank of New York Mellon * - 929,512 - 5.02 - 4.99
out of which Aberdeen Asset M. Plc. 2,372,669 2,503,184 12.7 7 13.53 12.73 13.43
out of which Skagen Kon-Tiki Verdipapirfond
997,104 968,258 5.37 5.23 5.35 5.20
Undisclosed ownership 28,608 4,791 0.15 0.03 0.15 0.03
Treasur y shares** 55,886 134,949 0.00 0.00 0.30 0.72
Share capital 18,637,486 18,637,486 100.00 100.00 100.00 100.00
* The owners are global custodians or nominees acting as global custodians. ** Treasur y shares include the combined ownership of the Parent company and subsidiaries. The treasur y shares have no voting rights.
31 December 2012 31 December 2011
Share capital Number HUF m Number HUF m
Ordinar y shares of HUF 1,000 each 18,637,486 18,638 18,637,486 18,638

124 | Annual Report | Gedeon Richter 2012 Annual Report | Gedeon Richter 2012 | 125
Data in the above table were compiled based on the
share registry amended with information provided
by KELER Zrt. as clearing company, global custodians
and nominees.
The Group does not have any ultimate controlling
parent. The Hungarian State is having significant
influence through the ownership of MNV Zrt.
Foreign currency translation reservesExchange differences relating to the translation
of the net assets of the Group’s foreign operations
from their functional currencies to the Group’s
presentation currency are recognised directly in
other comprehensive income and accumulated in
the foreign currency translation reserve. Exchange
differences previously accumulated in the foreign
currency translation reserve are reclassified to profit
or loss on the disposal or partial disposal of the
foreign operation.
Revaluation reserve for available for sale investmentsWhen measuring financial assets available for
sale at their fair values the difference shall be
recognized in as Revaluation reserve for available
for sale investments. It shall be recycled to income
statement at the time of disposal or impairment.
Equity-settled share based payment presented within retained earningsEquity-settled employee benefits reserve is presented
within Retained earnings, therefore current year’s
effect is shown in the Consolidated Statement of
Changes in Equity.
The reserve contains equity-settled share-based
payments to employees measured at the fair value of
the equity instruments at the grant date. Please see
more detailed in Note 26 Treasury shares.
26. Treasury sharesIt is the intention of the Company to grant Treasury
shares to management and employees as part of its
remuneration policy. The Company is operating three
share based payment programs, described below in
more details. From these programs, the individual
bonuses and the bonus program vest immediately,
while the shares granted under the Finance Ministry
program have a vesting condition of employment at
the end of the deposit period also described below.
Bonus programRichter operates a bonus share programme
since 1996 to further incentive managers and key
employees of the Company. In 2012 38,948 shares
were granted to 464 employees of the Company
while in 2011 39,358 shares were granted to 449
employees.
Individual bonuses50,780 ordinary shares were granted to qualified
employees as bonuses during the year while 51,508
ordinary shares were granted in 2011.
Recognised Staff Stock Bonus PlanPursuant to a programme approved by the Ministry
of Finance related to employee share bonuses
(Recognised Staff Stock Bonus Plan 2012-2014), the
Company granted 45,681 treasury shares to 4,750
employees. The shares will be deposited on the
employees’ security accounts with UniCredit Bank
Hungary Ltd. until 2 January 2015. In 2011 48,973
shares were granted to 4,760 employees deposited
on their accounts until 2 January 2014.
The AGM held on 26 April 2012 approved that the
Company may purchase its own shares for the
treasury, the aggregated nominal value of which
shall not exceed 10 percent of the registered capital
of the Company. Based on this approval, the
Company purchased 10,000 treasury shares at the
Budapest Stock Exchange during the year, and a
further 45,102 shares on the OTC market.
Revaluation reser ve for available for sale investments
HUF m
At 1 January 2011 3,356
Recycled through income statement (71)
Revaluation gross (3,710)
Deferred tax effect 393
At 31 December 2011 (32)
Recycled through income statement 221
Revaluation gross 2,328
Deferred tax effect (54)
At 31 December 2012 2,463
2012 2011
HUF m HUF m
Expense recognized in current year 5,763 5,186
Treasury share given 4,832 5,099
Total changes in reserve presented in the Consolidated Statement of Changes in Equity
931 87
Ordinary shares
Number of shares
at 31 December 2011 134,949
Out of these, number of shares owned by subsidiaries 10,550
Share purchase 55,102
Issued as part of bonus program (38,948)
Individual bonuses (50,780)
Granted pursuant to the Finance Ministr y – approved plan (45,681)
Granted pursuant to the Finance Ministr y – repurchased 1,244
at 31 December 2012 55,886
Out of these, number of shares owned by subsidiaries 10,550
Book value HUF m
at 31 December 2011 4,513
Share purchase 2,035
Issued as part of bonus program (1,405)
Individual bonuses (1,832)
Granted pursuant to the Finance Ministr y – approved plan (1,642)
Granted pursuant to the Finance Ministr y – repurchased 47
at 31 December 2012 1,716

126 | Annual Report | Gedeon Richter 2012 Annual Report | Gedeon Richter 2012 | 127
27. Trade payables
28. Other payables and accruals
As announced at 6 October 2010, Gedeon Richter Plc.
acquired a 100% ownership in PregLem. A purchase
price up to CHF 445 million is payable, provided
that certain milestone are achieved. PregLem
shareholders received CHF 150 million in cash
upfront and further milestone payments of up to
CHF 295 million will be paid assuming achievement
of all milestone targets, in 2011 CHF 65 million,
while in 2012 CHF 170 million was settled as mile-
stone payments.
A part of this deferred purchase price – two
instalments of PregLem’s purchase price which
amounted to HUF 42,328 million – was presented
as Other payables and accruals in the Consolidated
Balance Sheet in 2011. No similar item is presented in
the Balance Sheet in 2012 because last instalment is
expected to be paid in 2015.
29. Provisions31 December 2012 31 December 2011
HUF m HUF m
Other provisions 871 1,020
Provision for retirement liabilities 1,608 1,503
from this retirement defined benefit plans at the Parent (Note 29.1)
880 804
from this retirement defined benefit plans at GR Polska (Note 29.2)
172 167
Total 2,479 2,523
29.1. Retirement defined benefit plans at the Parent
Actuarial valuation related to retirement benefit plansAccording to the Union Agreement of Gedeon
Richter Plc. the retiring employees are entitled to the
following additional benefit in case the employment
contract ends with mutual agreement or regular
dismissal:
• 1 month average wage in case of min. 15 years
consecutive employment
• 2 month average wage in case of min. 30 years
consecutive employment
• 3 month average wage in case of min. 40 years
consecutive employment
• 4 month average wage in case of min. 45 years
consecutive employment.
The valuation methodIn line with IAS 19, defined benefit obligation was
calculated by using Projected Unit Credit Method.
The estimated amount of the benefit shall be
accounted in equal amounts for each period until the
maturity date (straight line method), and valued at
present value by using actuarial discount rate.
The calculation is applied for all employees employed
at the balance sheet date.
Results
The principal actuarial assumptions were as follows:
The estimation was perfomed based on the
assumption that the employees will have a yearly
increase in their wages 1% exceeding the inflation
until their retirement similar to 2011.
Discount rateThe estimation is based on auction gain of Hungarian
government securities (source Bloomberg).
For the years where auction gain data is provided
this data was the base of the calculation. For the
remaining (interim) period the discount rate has
been determined with linear interpolation using
4% for 30 years and 3.0% for 40 years maturity for
periods exceeding 15 years..
Assumptions regarding the benefit plansAccording the statistics the following probabilities
were used:
Probability of resigning from the Company before
retirement
2012 2011
HUF m HUF m
Opening value of retirement benefit 804 1,045
Interest costs and current service costs 98 92
Actuarial gains and benefits payments (22) (333)
Retirement benefit 880 804
Amortisation of non-recognised past service costs - 85
Interest cost 47 51
Current service costs 51 41
Pension costs 98 17 7
Opening value of provision 804 960
Benefits paid (release of provision) and actuarial gains (22) (333)
Current year provision 98 17 7
Closing value of provision 880 804
Non-recognised past service cost - -
31 December 2012 31 December 2011
HUF m HUF m
Trade payables 39,986 40,893
Amount due to related companies 47 123
Total 40,033 41,016
31 December 2012 31 December 2011
HUF m HUF m
Accruals 6,940 6,522
Other liabilities 2,246 50,966
Fair value of open for ward exchange contracts 504 249
Subtotal of financial liabilities 9,690 57,737
Wages and payroll taxes payable 3,964 3,343
Dividend payable 128 123
Deposits from customers 753 819
Accrual for costs of share options and other bonuses 480 267
Total 15,015 62,289
Term of employment 2012 Ages 2012
<30 30-45 45<
between 0 – 1 year 59.0% 51.0% 31.0%
between 1 – 5 years 58.0% 45.0% 22.0%
between 6 – 14 years 33.0% 29.0% 16.0%
between 15 – 29 years 8.0% 20.0% 13.0%
between 30 – 44 years 0.0% 2.0% 14.0%
over 45 years 0.0% 0.0% 6.0%
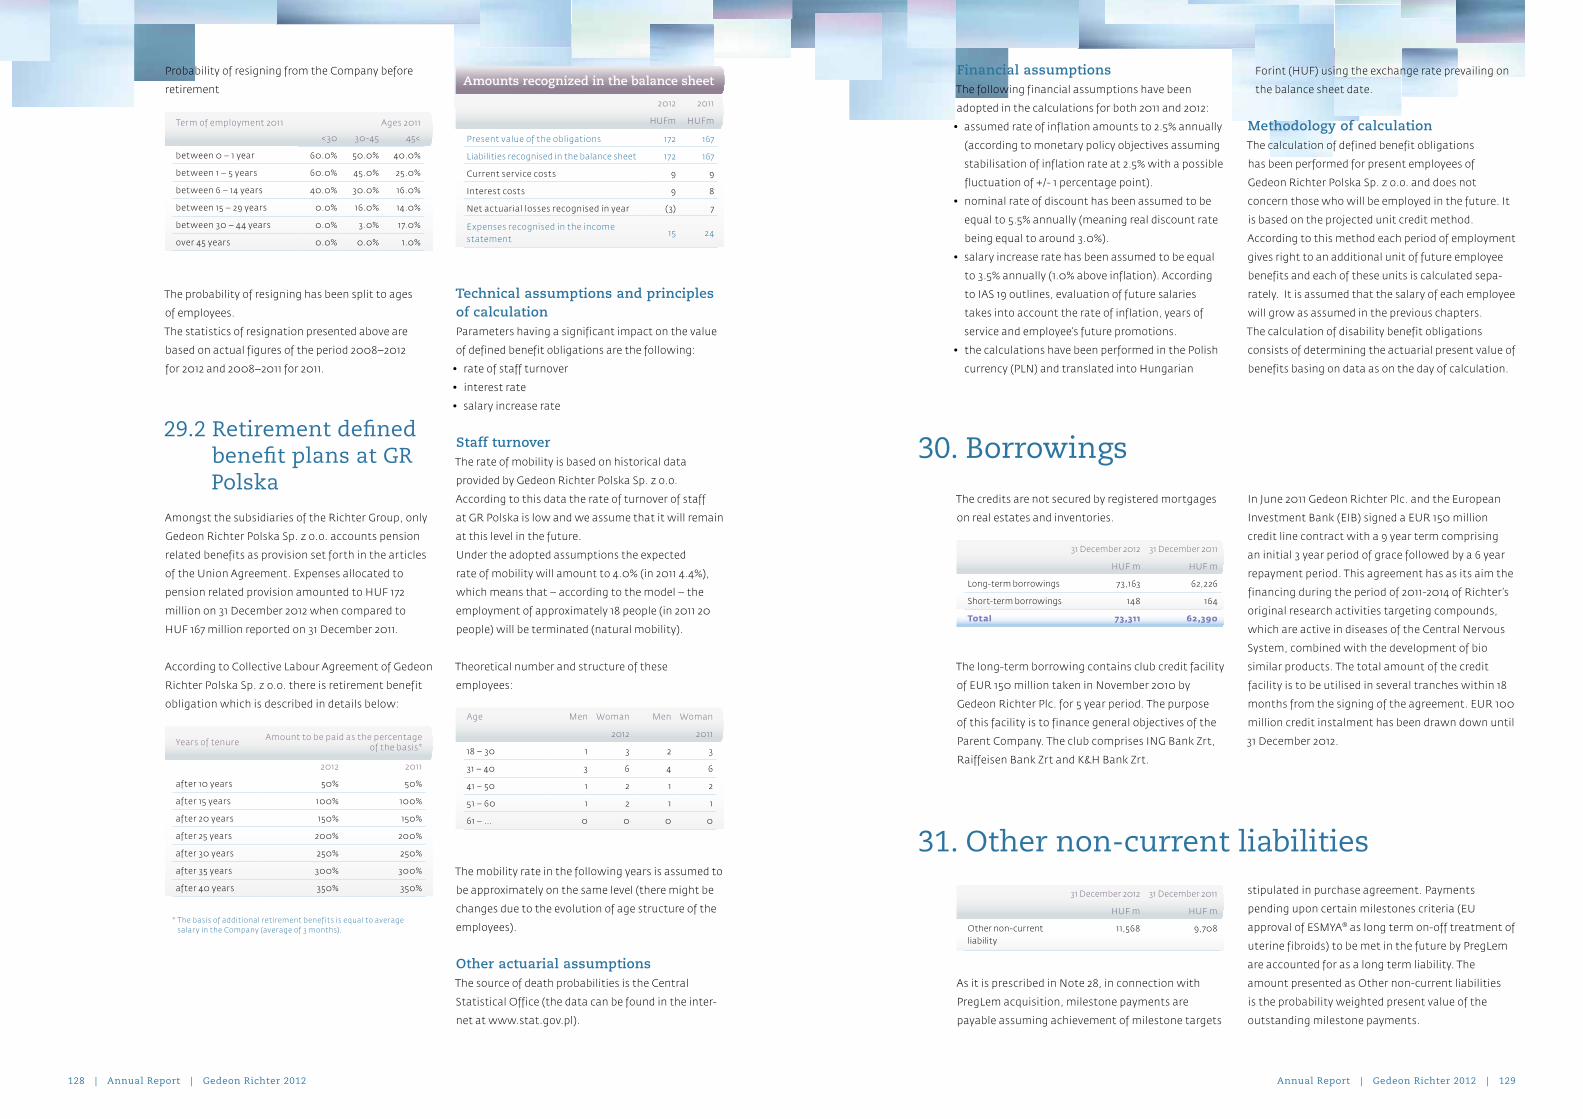
128 | Annual Report | Gedeon Richter 2012 Annual Report | Gedeon Richter 2012 | 129
Probability of resigning from the Company before
retirement
The probability of resigning has been split to ages
of employees.
The statistics of resignation presented above are
based on actual figures of the period 2008–2012
for 2012 and 2008–2011 for 2011.
29.2 Retirement defined benefit plans at GR Polska
Amongst the subsidiaries of the Richter Group, only
Gedeon Richter Polska Sp. z o.o. accounts pension
related benefits as provision set forth in the articles
of the Union Agreement. Expenses allocated to
pension related provision amounted to HUF 172
million on 31 December 2012 when compared to
HUF 167 million reported on 31 December 2011.
According to Collective Labour Agreement of Gedeon
Richter Polska Sp. z o.o. there is retirement benefit
obligation which is described in details below:
Technical assumptions and principles of calculationParameters having a significant impact on the value
of defined benefit obligations are the following:
• rate of staff turnover
• interest rate
• salary increase rate
Staff turnoverThe rate of mobility is based on historical data
provided by Gedeon Richter Polska Sp. z o.o.
According to this data the rate of turnover of staff
at GR Polska is low and we assume that it will remain
at this level in the future.
Under the adopted assumptions the expected
rate of mobility will amount to 4.0% (in 2011 4.4%),
which means that – according to the model – the
employment of approximately 18 people (in 2011 20
people) will be terminated (natural mobility).
Theoretical number and structure of these
employees:
The mobility rate in the following years is assumed to
be approximately on the same level (there might be
changes due to the evolution of age structure of the
employees).
Other actuarial assumptionsThe source of death probabilities is the Central
Statistical Office (the data can be found in the inter-
net at www.stat.gov.pl).
Term of employment 2011 Ages 2011
<30 30-45 45<
between 0 – 1 year 60.0% 50.0% 40.0%
between 1 – 5 years 60.0% 45.0% 25.0%
between 6 – 14 years 40.0% 30.0% 16.0%
between 15 – 29 years 0.0% 16.0% 14.0%
between 30 – 44 years 0.0% 3.0% 17.0%
over 45 years 0.0% 0.0% 1.0%
Financial assumptionsThe following financial assumptions have been
adopted in the calculations for both 2011 and 2012:
• assumed rate of inflation amounts to 2.5% annually
(according to monetary policy objectives assuming
stabilisation of inflation rate at 2.5% with a possible
fluctuation of +/- 1 percentage point).
• nominal rate of discount has been assumed to be
equal to 5.5% annually (meaning real discount rate
being equal to around 3.0%).
• salary increase rate has been assumed to be equal
to 3.5% annually (1.0% above inflation). According
to IAS 19 outlines, evaluation of future salaries
takes into account the rate of inflation, years of
service and employee’s future promotions.
• the calculations have been performed in the Polish
currency (PLN) and translated into Hungarian
Forint (HUF) using the exchange rate prevailing on
the balance sheet date.
Methodology of calculationThe calculation of defined benefit obligations
has been performed for present employees of
Gedeon Richter Polska Sp. z o.o. and does not
concern those who will be employed in the future. It
is based on the projected unit credit method.
According to this method each period of employment
gives right to an additional unit of future employee
benefits and each of these units is calculated sepa-
rately. It is assumed that the salary of each employee
will grow as assumed in the previous chapters.
The calculation of disability benefit obligations
consists of determining the actuarial present value of
benefits basing on data as on the day of calculation.
30. Borrowings
The credits are not secured by registered mortgages
on real estates and inventories.
The long-term borrowing contains club credit facility
of EUR 150 million taken in November 2010 by
Gedeon Richter Plc. for 5 year period. The purpose
of this facility is to finance general objectives of the
Parent Company. The club comprises ING Bank Zrt,
Raiffeisen Bank Zrt and K&H Bank Zrt.
In June 2011 Gedeon Richter Plc. and the European
Investment Bank (EIB) signed a EUR 150 million
credit line contract with a 9 year term comprising
an initial 3 year period of grace followed by a 6 year
repayment period. This agreement has as its aim the
financing during the period of 2011-2014 of Richter’s
original research activities targeting compounds,
which are active in diseases of the Central Nervous
System, combined with the development of bio
similar products. The total amount of the credit
facility is to be utilised in several tranches within 18
months from the signing of the agreement. EUR 100
million credit instalment has been drawn down until
31 December 2012.
31. Other non-current liabilities
As it is prescribed in Note 28, in connection with
PregLem acquisition, milestone payments are
payable assuming achievement of milestone targets
stipulated in purchase agreement. Payments
pending upon certain milestones criteria (EU
approval of ESMYA® as long term on-off treatment of
uterine fibroids) to be met in the future by PregLem
are accounted for as a long term liability. The
amount presented as Other non-current liabilities
is the probability weighted present value of the
outstanding milestone payments.
31 December 2012 31 December 2011
HUF m HUF m
Other non-current liability
11,568 9,708
31 December 2012 31 December 2011
HUF m HUF m
Long-term borrowings 73,163 62,226
Short-term borrowings 148 164
Total 73,311 62,390
Amounts recognized in the balance sheet
2012 2011
HUFm HUFm
Present value of the obligations 172 167
Liabilities recognised in the balance sheet 172 167
Current service costs 9 9
Interest costs 9 8
Net actuarial losses recognised in year (3) 7
Expenses recognised in the income statement
15 24
Years of tenure Amount to be paid as the percentage of the basis*
2012 2011
after 10 years 50% 50%
after 15 years 100% 100%
after 20 years 150% 150%
after 25 years 200% 200%
after 30 years 250% 250%
after 35 years 300% 300%
after 40 years 350% 350%
* The basis of additional retirement benefits is equal to average salar y in the Company (average of 3 months).
Age Men Woman Men Woman
2012 2011
18 – 30 1 3 2 3
31 – 40 3 6 4 6
41 – 50 1 2 1 2
51 – 60 1 2 1 1
61 – ... 0 0 0 0

130 | Annual Report | Gedeon Richter 2012 Annual Report | Gedeon Richter 2012 | 131
32. Dividend on ordinary shares
A dividend of HUF 660 per share (HUF 12,211 million)
was declared in respect of the 2011 results, approved
at the Company’s Annual General Meeting on 26 April
2012 and paid during the year.
33. Agreed capital commitments and expenses related to investments
The capital expenditure programme of the Parent
Company approved by the Board of Directors
totalling HUF 24,789 million comprises all costs
associated with capital expenditure planned for 2013.
The above commitments were not recorded either in
the Income Statement or in the Balance sheet.
2012 2011
HUF m HUF m
Capital expenditure that has been contracted forbut not included in the financial statements
1,376 2,889
Capital expenditure that has been authorised by the directorsbut has not yet been contracted for
23,413 18,093
34. Operating lease – Group as lessee
In 2012 HUF 6,442 million has been recorded as operating lease cost.
35. Guarantees given in respect of Group companies and third parties
Maximum amount of exposure as the result of guarantees:
2012 2011
HUF m HUF m
Bank guarantee given by Parent relating to Pharmapolis Gyógyszeripari Tudományos Park Kft.
- 3,000
Bank guarantee given by Medimpex Jamaica Ltd. (US$ 0.3 million) 66 72
Cash surety given by Gedeon Richter Romania S.A. for Pharmafarm S.A. (EUR 1.3 million) 379 405
Bank guarantee given by Gedeon Richter Polska Sp. z o.o. 12 11
Bank guarantee given by Richter Themis Ltd. 15 16
Bank guarantee given by Gedeon Richter Pharma GmbH 17 -
Bank guarantee given by PregLem S.A. 29 43
36. Social security and pension schemesAt the Parent Company social contribution tax
amounting to 27 percent and vocational training
contribution amounting to 1.5 percent of gross
salaries were paid during 2012 to the National Tax
and Customs Administration of Hungary. The Parent
Company has no further obligations beyond the
statutory rates in force during the year.
The Parent Company contributes 6 percent of the
monthly gross wages for those employees who
decided to participate in the scheme. In addition, a
one-off contribution is made in respect of employees
who are within five years of the statutory retirement
age. The total cost of the contributions made by the
Parent Company was HUF 904 million in 2012 (in
2011: HUF 850 million). The pension fund had a total
of 6,360 members (in 2011: 6,345 members) in 2012,
4,340 of whom were members entitled to receive the
Company contributions (in 2011: 4,313 members).
The Parent Company has contributed to a private
health insurance fund for the benefit of its employees
since 1 September 2003. Amounts paid were HUF
4,000/person/month in 2012 and in 2011. 4,785
employees are members of Patika Health Insurance
Fund and the total amount paid on their behalf to
the fund was HUF 230 million during 2012 (in 2011 it
was HUF 250 million for 4,766 employees).
Pension contribution paid by Hungary based
subsidiaries in respect of their employees amounted
to HUF 31 million in 2012 and HUF 28 million in 2011.
Foreign subsidiaries pay contributions to various
pension funds in respect of their employees which
amounted to HUF 130 million and HUF 134 million in
2012 and 2011, respectively.
The social securities paid by the company and
described above are Defined Contribution Plan.
None of the subsidiaries of the Group operate any
similar pension schemes, but all Hungary base
subsidiaries pay a contribution to pension fund and
Patika Health Insurance Fund.
37. Business CombinationThe Group has no new acquisition in 2012.
37.1. Business Combination in 2011
In 2011 the Group via purchases of additional
equity has increased the rate of its ownership in
Richpangalpharma O.O.O. (Moldavia) and became
fully consolidated company, while in the prior years
it was consolidated at equity method. The Group
recognised in the Consolidated Income Statement
loss of HUF 385 million as a result of remeasuring to
fair value its previously held 49% equity interest in
Richpangalpharma O.O.O.
Carrying value Fair value
HUF m HUF m
Paid consideration satisfied by cash (39)
Property, plant and equipments 1,041 1,041
Other intangible asset 0 0
Other financial assets 0 0
Loans receivable 3 3
Inventories 1,509 1,509
Receivables 712 712
Cash and cash equivalents 43 43
Long term liabilities (750) (750)
Trade and other payables (1,675) (1,675)
Non controlling interest (309) (309)
Negative Goodwill (535)
2012 2011
HUF m HUF m
Dividend paid on ordi-nary shares
12,211 16,009
Step acquisition

132 | Annual Report | Gedeon Richter 2012 Annual Report | Gedeon Richter 2012 | 133
Carrying value Fair value
HUF m HUF m
Restated*
Paid consideration satisfied by cash (31,496) -
Contingent liability (non-current) (32,987) -
Contingent liability (current) (13,648) -
Total consideration (78,131) -
Property, plant and equipments 48 48
Intangible assets 2,891 2,891
Receivables 207 207
Cash and cash equivalents 3,070 3,070
Trade and other payables (2,430) (2,430)
Other intangible asset (ESMYA) - 61,585
Deferred tax liability - (13,138)
Goodwill 25,898
* Restatement in connection with intangible assets (ESMYA), (Note 41).
37.2. Business Combination in 2010 that are affected by the restatement
On 6 October 2010, the Group acquired 100% of the
share capital of PregLem Holding S.A., a Swiss based,
specialty biopharmaceutical company focused on
the development and commercialisation of women’s
reproductive medicine.
The Acquisition of PregLem:
• Increases Richter’s exposure to specialty pharma
• Develops Richter Group’s presence in main Europe-
an markets
• Complements Richter’s existing Women’s Health
Franchise.
PregLem was acquired 6 October 2010. This
acquisition supports and provides a gynaecological
portfolio and development of the Group’s presence in
Western Europe. The management expects to realise
significant synergies on income and expenditures as
a result of launching the products of PregLem.
All costs incurred in connection with PregLem
acquisition were accounted in income statement as
Administration and general expense.
38. Contingent liabilitiesUncertain tax position in RomaniaFrom 1 October 2009 the Government approved
a debated claw back regime in the range of 5-12 %
(aimed at financing the overspending of the national
pharmaceutical budget) to be paid to the CNAS by
the domestic manufacturers and wholesalers from
sales of reimbursed drugs. The Group has similar
taxes in other countries which are treated as other
expense in the consolidated financial statements.
On 1 October 2011, a new version of Romania’s
pharmaceutical claw back mechanism came into
force levying direct liabilities for the domestic and
foreign manufacturers. No provision has been
recorded related to the contingent liabilities for the
periods preceding 1 October 2011. The uncertain tax
position has not been quantified in the Financial
Statements because there is an ongoing debate on
the taxable person and the calculation of the tax,
therefore reliable estimate can not be made on the
exposure.
The new measures will apply to suppliers of
medicines that are partly or fully reimbursed and
the overspending of the national pharmaceutical
budget has to be paid by the manufacturers based
on their market shares. Negotiations between the
pharmaceutical companies and the Government on
an amendment and revision to the new claw back
system are currently ongoing.
39. Disposal of subsidiaryThe Group disposed of one of its joint-ventures
Westpharma S.R.L. in year 2011 which did not
materially impact the consolidated figures. No
similar transaction occurred in 2012.
40. Related party transactions
Balances and transactions between the Company
and its subsidiaries, which are related parties of the
Company, have been eliminated on consolidation
and are not disclosed in this note. Details of
transactions between the Group and other related
parties are disclosed below.
The State Holding Company (MNV Zrt.), as a business
organisation is having a significant interest over
Richter, nevertheless the Parent Company has no
other transactions with the State Holding Company,
than the regular dividend payments.
The Group does not perform significant transactions
with other entities controlled or significantly
influenced by the Hungarian State. The cumulative
effect of these transactions is also not significant,
therefore it is not presented separately in the
financial statements.
40.1. Related partiesThe Group has not provided any long or short-term
loans to its key management personnel. Loans given
to associated companies are both long and short
term loans.
The loans are nominated in Hungarian Forint,
and have maturity date of 2014 and 2016 in the
amounts of HUF 1,500 million and HUF 2,300 million
respectively.
All related-party transactions were made on an arm’s
length basis.
2012 2011
HUF m HUF m
Dividend paid to MNV Zrt.
3,102 4,030
Short-term benefits - Allowance
2012 2011
HUF m HUF m
Board of Directors 76 73
Supervisory Board 28 36
Total 104 109
31 December 2012
31 December 2011
HUF m HUF m
Loans to associated companies 3,800 2,869
Related receivables ( joint ventures)
135 90
Related receivables (associates)
3,391 2,877
Related payables (associates) 47 106
Revenue from joint ventures 782 705
Revenue from associates 12,079 12,950
40.2. Remuneration of the Board of Directors and the Supervisory Board
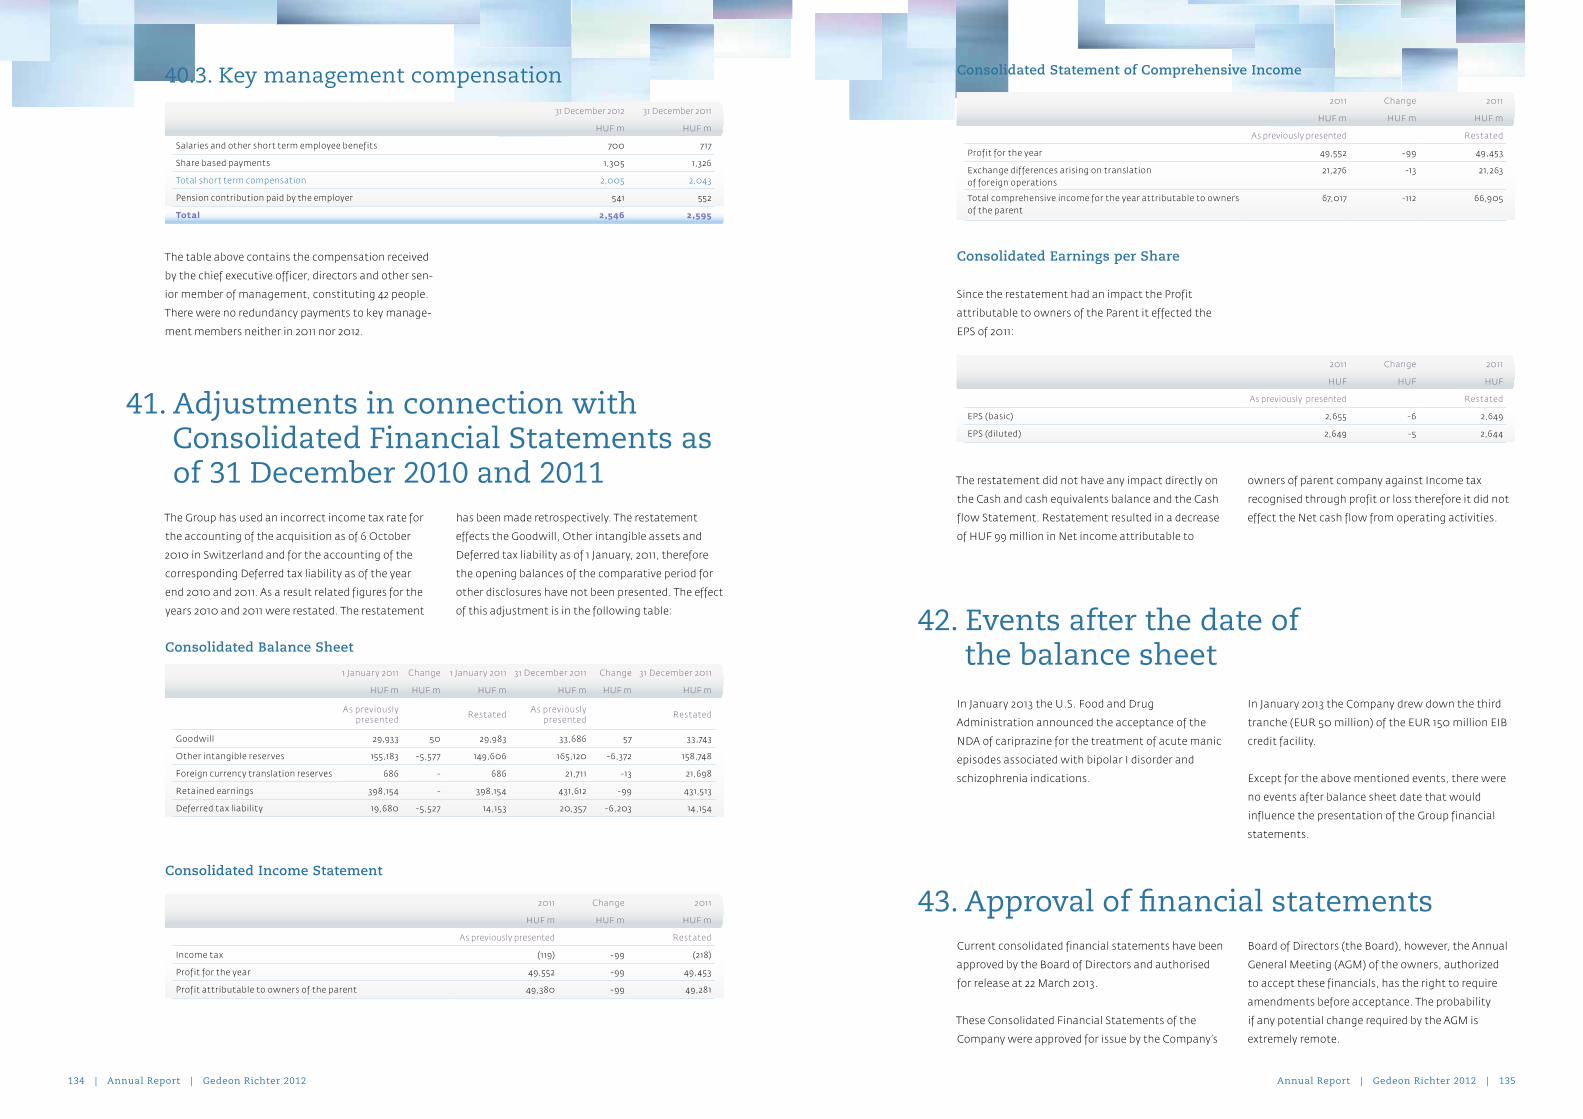
134 | Annual Report | Gedeon Richter 2012 Annual Report | Gedeon Richter 2012 | 135
41. Adjustments in connection with Consolidated Financial Statements as of 31 December 2010 and 2011
The Group has used an incorrect income tax rate for
the accounting of the acquisition as of 6 October
2010 in Switzerland and for the accounting of the
corresponding Deferred tax liability as of the year
end 2010 and 2011. As a result related figures for the
years 2010 and 2011 were restated. The restatement
has been made retrospectively. The restatement
effects the Goodwill, Other intangible assets and
Deferred tax liability as of 1 January, 2011, therefore
the opening balances of the comparative period for
other disclosures have not been presented. The effect
of this adjustment is in the following table:
31 December 2012 31 December 2011
HUF m HUF m
Salaries and other short term employee benefits 700 717
Share based payments 1,305 1,326
Total short term compensation 2,005 2,043
Pension contribution paid by the employer 541 552
Total 2,546 2,595
Consolidated Balance Sheet
Consolidated Income Statement
42. Events after the date of the balance sheet
In January 2013 the U.S. Food and Drug
Administration announced the acceptance of the
NDA of cariprazine for the treatment of acute manic
episodes associated with bipolar I disorder and
schizophrenia indications.
In January 2013 the Company drew down the third
tranche (EUR 50 million) of the EUR 150 million EIB
credit facility.
Except for the above mentioned events, there were
no events after balance sheet date that would
influence the presentation of the Group financial
statements.
43. Approval of financial statementsCurrent consolidated financial statements have been
approved by the Board of Directors and authorised
for release at 22 March 2013.
These Consolidated Financial Statements of the
Company were approved for issue by the Company’s
Board of Directors (the Board), however, the Annual
General Meeting (AGM) of the owners, authorized
to accept these financials, has the right to require
amendments before acceptance. The probability
if any potential change required by the AGM is
extremely remote.
Consolidated Statement of Comprehensive Income
Consolidated Earnings per Share
Since the restatement had an impact the Profit
attributable to owners of the Parent it effected the
EPS of 2011:
The restatement did not have any impact directly on
the Cash and cash equivalents balance and the Cash
flow Statement. Restatement resulted in a decrease
of HUF 99 million in Net income attributable to
owners of parent company against Income tax
recognised through profit or loss therefore it did not
effect the Net cash flow from operating activities.
2011 Change 2011
HUF m HUF m HUF m
As previously presented Restated
Profit for the year 49,552 -99 49,453
Exchange differences arising on translation of foreign operations
21,276 -13 21,263
Total comprehensive income for the year attributable to owners of the parent
67,017 -112 66,905
40.3. Key management compensation
The table above contains the compensation received
by the chief executive officer, directors and other sen-
ior member of management, constituting 42 people.
There were no redundancy payments to key manage-
ment members neither in 2011 nor 2012.
1 January 2011 Change 1 January 2011 31 December 2011 Change 31 December 2011
HUF m HUF m HUF m HUF m HUF m HUF m
As previously presented Restated As previously
presented Restated
Goodwill 29,933 50 29,983 33,686 57 33,743
Other intangible reserves 155,183 -5,57 7 149,606 165,120 -6,372 158,748
Foreign currency translation reserves 686 - 686 21,711 -13 21,698
Retained earnings 398,154 - 398,154 431,612 -99 431,513
Deferred tax liability 19,680 -5,527 14,153 20,357 -6,203 14,154
2011 Change 2011
HUF m HUF m HUF m
As previously presented Restated
Income tax (119) -99 (218)
Profit for the year 49,552 -99 49,453
Profit attributable to owners of the parent 49,380 -99 49,281
2011 Change 2011
HUF HUF HUF
As previously presented Restated
EPS (basic) 2,655 -6 2,649
EPS (diluted) 2,649 -5 2,644

Annual Report | Gedeon Richter 2012 | 137
VI. Appendices
Consolidated Income Statement
Statements of income (HUFm) 2008 2009 2010 2011(4) 2012
for the years ended 31 December
Total revenues 236,518 267,344 275,312 307,868 326,702
Cost of sales (108,421) (116,443) (107,137) (114,529) (124,999)
Gross profit 128,097 150,901 168,175 193,339 201,703
Operating expenses and other income and expenses (net) (93,941) (98,432) (105,522) (132,412) (152,982)
Profit from operations 34,156 52,469 62,653 60,927 48,721
Share of profit/(loss) of associates 903 52 50 (4,234) 342
Net financial income/(loss) 8,394 4,379 5,073 (7,022) 858
Profit before Income tax 43,453 56,900 67,7 76 49,671 49,921
Income tax (498) (1,032) 12 2,696 1,865
Solidarity tax (1,378) (1,897) – – –
Local business tax and innovation fee – (3,018) (3,148) (2,914) (2,706)
Profit for the year 41,57 7 50,953 64,640 49,453 49,080
Profit attributable to non-controlling interest (167) 33 (161) 172 (185)
Profit attributable to owners of Parent 41,410 50,986 64,479 49,281 49,265
Share Statistics (HUF)
Earnings per share (2) 2,222 2,736 3,460 2,644 2,643
Dividends per ordinar y share (3) 590 7 70 860 660 660
Statements of income (EURm) 2008 2009 2010 2011(4) 2012
for the years ended 31 December
Total revenues 941.6 952.4 998.2 1,099.5 1,130.1
Cost of sales (431.7) (414.8) (388.4) (409.0) (432.4)
Gross profit 509.9 537.6 609.8 690.5 697.7
Operating expenses and other income and expenses (net) (373.9) (350.6) (382.6) (472.9) (529.2)
Profit from operations 136.0 187.0 227.2 217.6 168.5
Share of profit/(loss) of associates 3.6 0.2 0.2 (15.1) 1.2
Net financial income/(loss) 33.4 15.6 18.4 (25.1) 3.0
Profit before Income tax 173.0 202.8 245.8 17 7.4 172.7
Income tax (2.0) (3.7) 0.0 9.6 6.5
Solidarity tax (5.5) (6.8) - - -
Local business tax and innovation fee - (10.8) (11.4) (10.4) (9.4)
Profit for the year 165.5 181.5 234.4 176.6 169.8
Profit attributable to non-controlling interest (0.7) 0.1 (0.6) 0.6 (0.6)
Profit attributable to owners of Parent 164.8 181.6 233.8 176.0 170.4
Share Statistics (EUR)
Earnings per share (2) 8.85 9.74 12.54 9.44 9.14
Dividends per ordinar y share (3) 2.35 2.74 3.12 2.36 2.28
Note: (1) This Financial Record is not a part of the audited Consolidated Financial Statements prepared in accordance with IFRS. (2) EPS calculations based on the total number of shares issued, diluted excluding exceptional and non-recurring items. (3) 2012 dividends per ordinar y share of HUF 660 are as recommended by the board of directors. (4) Restated (for the details see pages 134–135).
Consolidated financial record 2008–2012 (1)
Throughout this Annual Report, certain Hungarian
forint amounts have been converted into EUR
for indicative purposes only. Expenditure and
income amounts incurred during a period have
been converted at an average rate calculated by
the Company. Balance sheet figures for the end of
the period have been translated at the year-end
exchange rates.

138 | Annual Report | Gedeon Richter 2012 Annual Report | Gedeon Richter 2012 | 139
Consolidated Balance Sheet
Balance Sheet (HUFm) 2008 2009 2010(4) 2011(4) 2012
as at 31 December
Non-current assets 171,057 175,168 353,957 373,269 376,442
Net other assets and liabilities 169,328 205,107 181,735 202,675 237,997
Non-current liabilities (1,099) (1,520) (93,57 7) (86,088) (94,365)
Non-controlling interest (2,787) (2,613) (3,131) (3,863) (3,313)
Total net assets (5) 336,499 376,142 438,984 485,993 516,761
Share capital 18,638 18,638 18,638 18,638 18,638
Reser ves 318,465 358,329 420,885 471,868 499,839
Treasury shares (604) (825) (539) (4,513) (1,716)
Capital and reser ves (5) 336,499 376,142 438,984 485,993 516,761
Total assets and total equity and liabilities 384,133 429,970 597,750 681,970 672,237
Capital Expenditure (HUFm) 22,010 24,211 88,704 32,285 29,67 7
Balance Sheet (EURm) 2008 2009 2010(4) 2011(4) 2012
as at 31 December
Non-current assets 646.7 647.6 1,274.6 1,199.8 1,292.3
Net other assets and liabilities 640.2 758.2 654.4 651.5 817.0
Non-current liabilities (4.2) (5.6) (337.0) (276.7) (324.0)
Non-controlling interest (10.5) (9.7) (11.3) (12.4) (11.4)
Total net assets (5) 1,272.2 1,390.5 1,580.7 1,562.2 1,7 73.9
Share capital 70.5 68.9 67.1 59.9 64.0
Reser ves 1,204.0 1,324.6 1,515.5 1,516.8 1,715.8
Treasury shares (2.3) (3.0) (1.9) (14.5) (5.9)
Capital and reser ves (5) 1,272.2 1,390.5 1,580.7 1,562.2 1,7 73.9
Total assets and total equity and liabilities 1,452.3 1,589.5 2,172.4 2,192.1 2,307.7
Capital Expenditure (EURm) 87.6 86.3 321.6 115.3 102.6
Notes (1) This Financial Record is not a part of the audited Consolidated Financial Statements prepared in accordance with IFRS. (4) Restated (For details see pages 134–135). (5) Excluding non-controlling interest
Throughout this Annual Report, certain Hungarian
forint amounts have been converted into EUR
for indicative purposes only. Expenditure and
income amounts incurred during a period have
been converted at an average rate calculated by
the Company. Balance sheet figures for the end of
the period have been translated at the year-end
exchange rates.
Exchange rates (EUR/HUF)
2008 2009 2010 2011 2012
Average 251.2 280.7 275.8 280.0 289.1
End of year 264.5 270.5 27 7.7 311.1 291.3
Number of employees
2008 2009 2010 2011 2012
End of year 10,527 10,090 10,259 10,7 73 11,103
Notes

140 | Annual Report | Gedeon Richter 2012 Annual Report | Gedeon Richter 2012 | 141

142 | Annual Report | Gedeon Richter 2012
Contact of Gedeon Richter Plc. AddressesRegistered Office
Gedeon Richter Plc.
1103 Budapest, Gyömrői út 19–21.
Hungary
Addresses for correspondenceGedeon Richter Plc.
Budapest 10
P.O.Box 27
1475 Hungary
Investor relationsInvestor Relations Department
Gedeon Richter Plc.
Budapest 10
P.O.Box 27
1475 Hungary
Phone: (36)-1-431-5764
Fax: (36)-1-261-2158
E-mail: [email protected]
www.richter.hu