Embed Size (px)
Citation preview

Richter GroupM12 2013
Richter Group
Interim Report, M12 2013 5 February 2014

Summary – M12 2013M12 2013
Summary M12 2013
Consolidated sales: + 4.8% (EUR), + 7.6% (HUF)+ good growth in China in EU15 countries and in other CIS region+ good growth in China, in EU15 countries and in other CIS region− price erosion
Profit for the period*: -11,7% (EUR), -9,4% (HUF)+ sales increase+ increasing gross profitg g p− higher level of S&M expenses− other expenses – one-off items
*Net income attributable to owners of the parent
22

Key events in Q4 2013M12 2013
Key events in Q4 2013
6-29 November – Exchangeable bond issued by MNV Zrt.
21 November – Cariprazine – FDA „Complete ResponseLetter”
26 November – Esmya® two courses – CHMP – positiveopinionopinion
16-19 December – Establishment of joint venture in Brasil andMexico
33

Consolidated financial highlightsM12 2013
Consolidated financial highlights
HUF Change EUR Changeg g
Total revenues 351.4 bn 7.6% 1,184.0 m 4.8%
P fit fProfit from operations 48.6 bn -0.2% 163.9 m -2.7%
Profit for the period* 44 6 bn -9 4% 150 4 m -11 7%Profit for the period 44.6 bn -9.4% 150.4 m -11.7%
EPS (diluted) 240 -9.4% 0.81 -11.7%
*Net income attributable to owners of the parent
4

Geographical composition of Group salesM12 2013
Geographical composition of Group sales
9%
7%
9%6%
Hungary
Russia Poland
Hungary
Russia Poland7%
12%
30%
M12 2012
M12 2013
6%28%
13%RomaniaRomania
8 %
6%
10%
7%
2012 2013
6% 7%
3%9% 10%1%
EU10Ukraine EU10
Oth CIS
Ukraine
5% 5% 3% 5%4%1%
EU15USA
Other CIS
RoWChina EU15
USA
Other CIS
RoWChina
Total: HUF 326.7 bn
EUR 1,130.1 m
Total: HUF 351.4 bn
EUR 1,184.0 m7.6% in HUF4.8% in EUR+
55

P&LM12 2013
P&L
HUFmM12 2013
Change %
EURmM12 2013
Change %
as % of total revenues
Total revenues 351,424 7.6 1,184.0 4.8
Gross profit 220,713 9.4 743.6 6.6 62.8
S&M expenses (106,842) 15.1 (360.0) 12.1 30.4
A&G expenses (19,330) -4.2 (65.1) -6.7 5.5
R&D expenses (41,570) 7.0 (140.0) 4.2 11.8
Other income and other expenses (4,333) 272.9 (14.6) 265.0 1.2
Profit from operations 48,638 -0.2 163.9 -2.7 13.8
Net financial income (1,466) n.a. (4.9) n.a. 0.4
Profit for the period* 44,646 -9.4 150.4 -11.7 12.7
*Profit attributable to owners of the parent
6

Increasing gross profit and gross marginM12 2013
Increasing gross profit and gross margin
+ Higher than average increase of turnover in China, in EU15 countries and in other CIS HUFm 62 8%
50%
60%
200 000
250 000countries and in other CIS region
+ Increasing share of
HUFm 62.8%61.7%
20%
30%
40%
50 000
100 000
150 000own-developed products
- Weakening RUB/EUR0%
10%
0
50 000
2006 2007 2008 2009 2010 2011 2012 2013
Gross profit Gross margin
- Weakening RUB/EUR exchange rate in H2 2013
- Decline in the high margin US b i Gross profit Gross marginUS business
- Increasing proportion of wholesale and retail segment
7
g

Decreasing operating marginM12 2013
Decreasing operating margin
Sales and marketing expenses
25 0%70000
Sales and marketing expenses− expanding sales network in
Western EuropeEsmya® launches
HUFm
15,0%
20,0%
25,0%
40000
50000
60000
70000− Esmya® launches− S&M activities in China
R h d d l t
13.8%14.9%
5,0%
10,0%
15,0%
10000
20000
30000
40000Research and development expenses− Forest, PregLem, biosimilar
h0,0%0
10000
2006 2007 2008 2009 2010 2011 2012 2013
Profit from operation Operating margin
research
Other expenses – one-off items
Amortisation− Esmya® + Grünenthal OCs
8
Esmya Grünenthal OCs

Other expenses – one-off itemsM12 2013
Other expenses one off items
Other expenes – HUF 4.3 bn
Significantly less milestone income in 2013Significantly less milestone income in 2013− More than USD 10 m− Impact: approx. -0.6 percentage pointp pp p g p
Increase of claw-back related liabilities: HUF 1.2 bn(Hungary, Romania, Germany)
Impairment losses on intangible assets and licenses: HUF 1.7 bn− termination of PregLem PGL2 research project carried out for
endometriosis indication in Q4 2013endometriosis indication in Q4 2013
Overall impact: approx. HUF 5 bn
99

Pharmaceutical sales*M12 2013
Pharmaceutical sales
Key drivers of growth:
China, EU15 countries and Ukraine
Female healthcare
Successful product launches
*90% of turnover originates from outside of Hungary
10
g g y
10

HungaryM12 2013
Hungary
Turnover *Stabilising pharmaceutical market HUFbn
40
Sales increase: 2.3% in HUF30
Successful product launches
202007 2008 2009 2010 2011 2012 2013
*Turnover of the pharmaceutical segment
11

EU – composition of sales*M12 2013
EU composition of sales
Traditional EU member states 40%
− strengthening our position in key Western-European markets
− own gynaecological sales and marketing network
60%
Poland, Romania, EU10**
− well established in the region for decades
− own specialized sales network*Turnover of the pharmaceutical segment p** Including Croatia
12

EU15M12 2013
EU15
140
Turnover*8.5% sales increase in EUR
EURm
80
100
120
140
Recently established S&M network
20
40
60
80
Female healthcare products: Richter OC portfolio, acquired
0
20
2007 2008 2009 2010 2011 2012 2013
p , qOCs, Esmya®
*Turnover of the pharmaceutical segment
13
Poland, Romania, EU10M12 2013
Poland, Romania, EU10
Increasing generic competition
Turnover*
Increasing generic competition
Price erosionEURm
100
150
200
Poland: – 5.1% decrease in PLN
0
50
100− expiry of Avonex licensing
agreement− adjusted sales with Avonex: 0
2007 2008 2009 2010 2011 2012 2013
Poland Romania EU10**
j+5.7% in PLN
Romania:Romania:– increasing sales levels
(+2.6% in RON) *Turnover of the pharmaceutical segment**Data of 2012 adjusted with Croatia
– significant delays in payment14

CISM12 2013
CIS
Turnover*
Slight sales increase (+1.6% in EUR) EURm
300
400
500( )
Ukraine: healthy sales growth
100
200
Russia: expiry of Supraxlicencing agreement in 2012 0
2007 2008 2009 2010 2011 2012 2013
Russia Ukraine Other CIS
licencing agreement in 2012
*Turnover of the pharmaceutical segment
15

RussiaM12 2013
Russia
Sales increase (+5.5% in RUB;
Turnover*
Sales increase ( 5.5% in RUB; -0.1% in EUR)
Expiry of Suprax licensing EURm
300
400p y p g
agreement(revenue loss: RUB 0.5 bn/ EUR 11 7 m)
100
200EUR 11.7 m)
Adjusted sales with Suprax(+9 3% in RUB; +3 5% in EUR)
02007 2008 2009 2010 2011 2012 2013
(+9.3% in RUB; +3.5% in EUR)
Significant weakening of RUB/EUR exchange rate in H2RUB/EUR exchange rate in H2 2013
Increase of manufacturing and
*Turnover of the pharmaceutical segment
Increase of manufacturing and warehousing capacities
16

Ukraine, Other republicsM12 2013
Ukraine, Other republics
Turnover*
Ukraine− 10.1% increase (USD) USDm
150
200− efficient marketing activity
Other republics
0
50
100p
− 8.9% increase (USD)
02007 2008 2009 2010 2011 2012 2013
Ukraine Other CIS
*Turnover of the pharmaceutical segment
17

USAM12 2013
USA
Turnover*
Slow down of sales decline(-10.7% in USD) USDm
160
200
( )
Significant proportion of l 92%
40
80
120gynaecology – 92%
Plan B increase0
40
2007 2008 2009 2010 2011 2012 2013
Plan B increase
Finasteride shipments
*Turnover of the pharmaceutical segment
18

ChinaM12 2013
China
Dynamically expanding pharmaceutical market
From 2013 JV operates with Richter majority stake
Sales network: 204 medical representatives
Sales in 2013: EUR 34 9 mSales in 2013: EUR 34.9 m
Preshipments (in H1 2013): EUR 9.5 mp ( )
19

Pharmaceutical sales by therapeutic areasM12 2013
Pharmaceutical sales by therapeutic areas
13%17%
OtherCentral nervous system
13%
6%
17%
Muscle relaxants
M1226%4%Gastrointestinal CardiovascularM12
2013
34%
Gynaecology
Total: EUR 1,026.4 m
20
Female healthcare sales by regionM12 2013
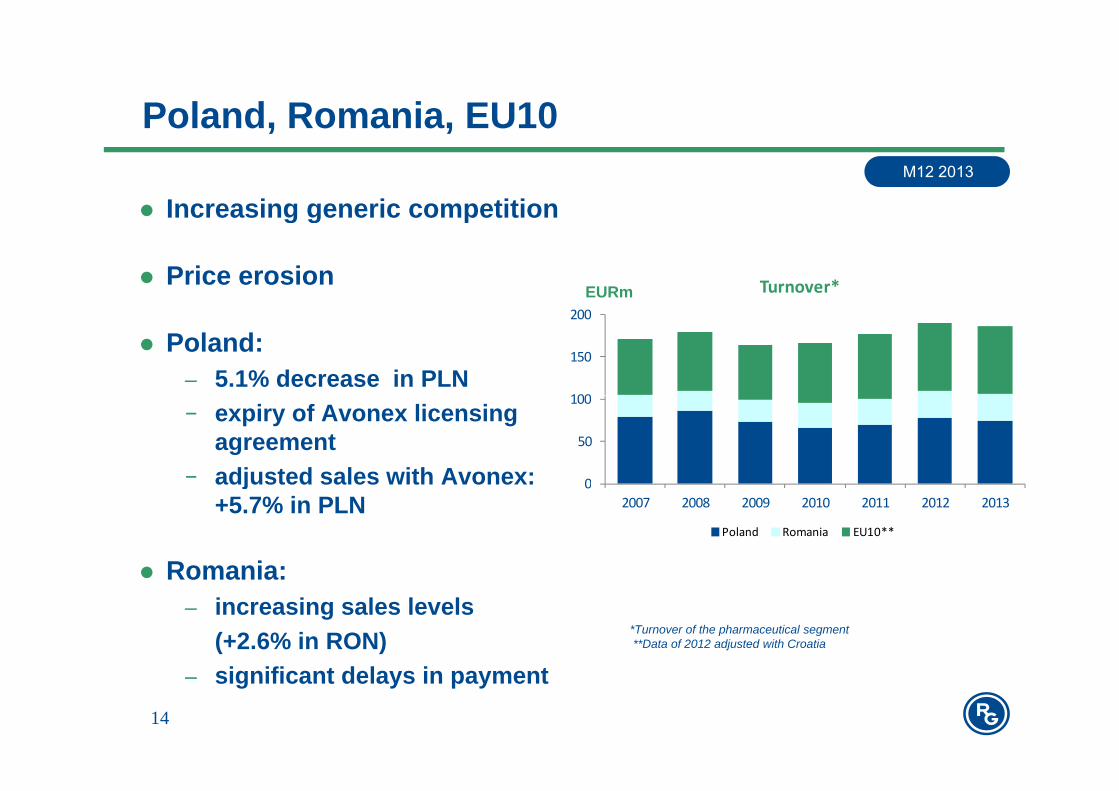
Female healthcare sales by region
CEE
Hungary
CISEURm
5%14%
30%
300
400
500CIS
27%
8%12%
4%
0
100
200
EU15
Ex-Grünenthalportfolio
China
8%
Gynaecologicalsales Non gynaecologicalsales
USARoW
Gynaecological sales Non‐gynaecological salesTotal:
HUF 104.2 bnEUR 351.0 m
2121

Female Healthcare: Esmya® - gradual launches IM12 2013
Female Healthcare: Esmya gradual launches I.
Reimbursement grantedReimbursement granted
Country Launch Reimbursed Country Launch ReimbursedGermany 12Q1 12Q1
United Kingdom 12Q2 12Q2
Austria 12Q2 12Q4
Netherland 12Q3 13Q2
Czech Republic 12Q2 13Q3
Belgium 13Q3 13Q3
Denmark 12Q4 12Q4
Norway 12Q4 12Q4
Hungary 12Q2 13Q1
France 13Q3 13Q3
Spain 13Q4 13Q3
Canada 13Q3 13Q3Hungary 12Q2 13Q1
Sweden 13Q1 13Q1
Slovakia 12Q3 13Q1
Canada 13Q3 13Q3
Finland 13Q4 13Q4
Luxemburg 13Q3 13Q4
Slovenia 12Q4 13Q2 Switzerland 13Q4 13Q4
22
Female Healthcare: Esmya® - gradual launches IIM12 2013
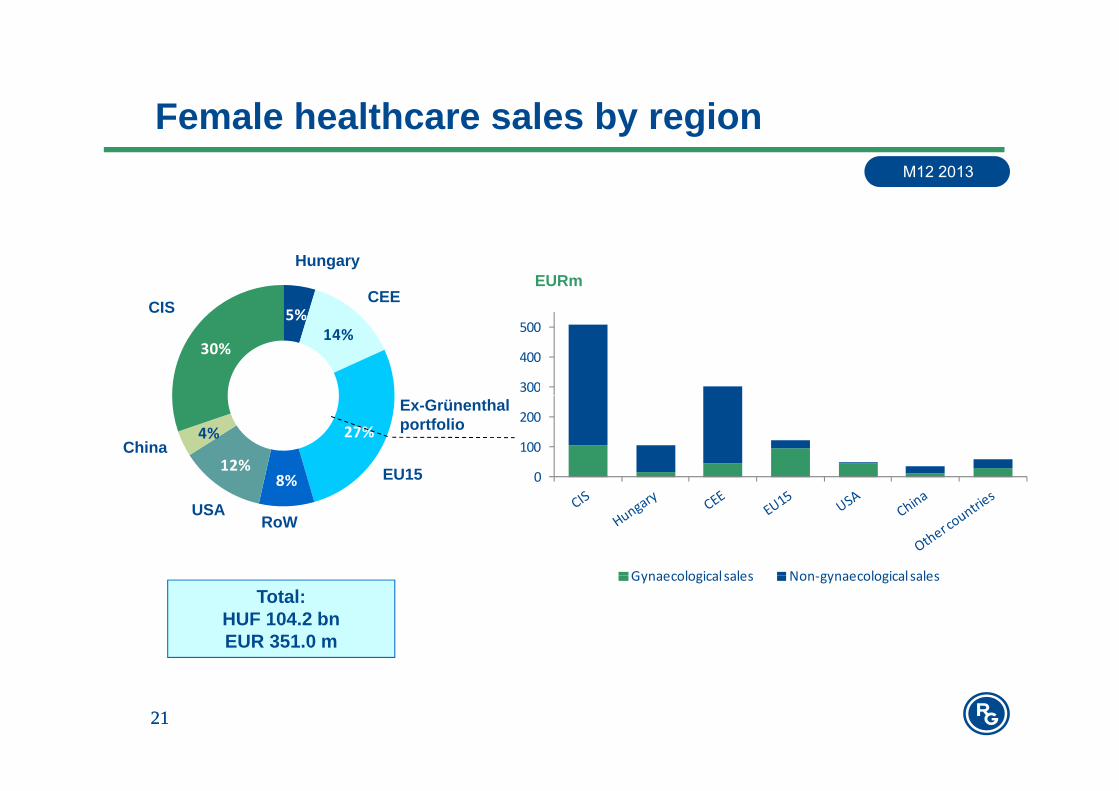
Launch without reimbursement
Female Healthcare: Esmya gradual launches II.
Launch without reimbursement
Country LaunchPoland 12Q2
Baltic States 12Q3
Romania 12Q3
Portugal 12Q3
Bulgaria 12Q4
Russia 13Q2Russia 13Q2
Belorussia 13Q4
Georgia 13Q4
Kazahstan 13Q4
Turkmenistan 13Q4
Ukraine 13Q4Ukraine 13Q4
23

Sales networkM12 2013
Sales network
1800staff
1200
1400
1600
1800
600
800
1000
1200
0
200
400
600
02005 2006 2007 2008 2009 2010 2011 2012 2013
CIS CEE Hungary EU15 China
24

Wholesale and retailM12 2013
Wholesale and retail
W&R sales contributions is 15% of total sales
72% of the W&R turnover originates in Romania
2525

Exchangeable bonds: 2014-2019M12 2013
Exchangeable bonds: 2014 2019
6 Nov 2013 MNV Zrt. Announcement on Public offering:b d ti t EUR 900 ith i th f 3 375% 3 875%− new bonds amounting to EUR 900 m, with a coupon in the range of 3.375%-3.875% p.a.
− proceeds from offering intended to be used to finance the repurchase of exchangeablebonds amounting to EUR 833 m with a 4.4% coupon, due in 2014
26 Nov 2013 MNV Zrt Announcement – Final metrics of the New bonds:26 Nov 2013 MNV Zrt. Announcement Final metrics of the New bonds:− coupon: 3,375% − due date: 2 April 2019− issue size: EUR 903,8 missue size: EUR 903,8 m− exchange premium: 35% compared to the share price as of the bond issue date− Richter:
− tendered EUR 52 m principal aggregate amount Existing bonds for repurchase,p p gg g g p ,− subscribed for EUR 52 m principal aggregate amount New bonds
29 Nov 2013 MNV Zrt. Announecement – Exchange metrics of the Existing bonds− bonds validly tendered: 94,86%− rate of repurchase: 103,5%− accrued interest: 0,86795%
6 Dec 2013 MNV Zrt. Announcement – Settlement of the transaction
26
− Ownership ratio of MNV Zrt.: 25.25%

Ownership structureM12 2013
Ownership structure
31 December 2013
Domestic investors
5.98%International
investors68.77%
Hungarian State Holding Company
25.25%
2727

M12 2013
Thank you for your attention!y y
28

AppendixM12 2013
Appendix
Exchange rates
29

Evolution of currency exchange ratesM12 2013
Evolution of currency exchange rates
320
340
HUF
280
300
240
260EUR/HUF
USD/HUF
180
200
220
180
30

Evolution of currency exchange ratesM12 2013
Evolution of currency exchange rates
45
46
EUR
43
44
41
42
RUB/EUR
39
40
38
31

Exchange ratesM12 2013
Exchange rates
At i d dAt period end31.12.2013 30.09.2013 30.06.2013 31.03.2013 31.12.2012
EUR/HUF 296.91 298.48 295.16 304.30 291.29
USD/HUF 215.67 221.06 226.18 237.36 220.93
RUB/HUF 6 55 6 80 6 91 7 65 7 26
Average
RUB/HUF 6.55 6.80 6.91 7.65 7.26
2013 M12 2013 M9 2013 H1 2013 Q1 2012 M12
EUR/HUF 296.8 296.5 295.9 296.1 289.1
USD/HUF 223.4 225.1 225.1 224.0 225.0
RUB/HUF 7.0 7.1 7.3 7.4 7.2
32