Embed Size (px)
Citation preview

Proceedings of ICOE 2009 Title of the paper
1
WAVE TRANSMISSION PREDICTION OF MULTILAYER FLOATING
BREAKWATER USING NEURAL NETWORK
S. Mandal1, S.G. Patil
2 and A V Hegde
3
Abstract: In the present study, an artificial neural network method has been applied
for wave transmission prediction of multilayer floating breakwater. Two neural
network models are constructed based on the parameters which influence the wave
transmission of floating breakwater. Training and testing of the network models are
carried out for different hidden nodes and epochs. The results of network models are
compared with the measured values. It is observed that the correlation (above 90%)
between predicted wave transmission values by the network models and measured
values are in good agreement.
Keywords: Artificial neural networks; wave transmission; multilayer floating
breakwater; transfer function.
INTRODUCTION
The environmental stress on the coastal zone is rapidly growing and there is a need to protect the
coastal environment. The development of structures to provide protection against the destructive
forces of the sea waves and to withstand the action of waves has been the constant challenge to
the coastal engineers. The coastal defense works such as seawalls, groins, offshore breakwaters,
artificial nourishments have been tried to overcome the problem of erosion. Some of them have
been successful while some others have failed to perform the job assigned to them. In the last two
decades, floating breakwaters (McCartney, 1985; Mani, 1991; Murali and Mani, 1997; Sannasiraj
et al, 1998; Sundar et al, 2003) have generated a great interest in the field of coastal engineering,
as floating breakwaters are less expensive compared to conventional type breakwaters. In
addition, they have several desirable characteristics such as, comparatively small capital cost,
adoption to varying harbour shapes and sizes, short construction time and freedom from silting
and scouring. Floating breakwaters could also be utilized to meet location changes, extent of
protection required or seasonal demand. They can be used as a temporary protection for offshore
activities in hostile environment during construction, drilling works, salvage operation etc. In
order to design a floating breakwater, it is necessary to study the motion characteristics of the
structure. Hence, a study on wave transmission of the floating breakwater would provide a proper
_________________________________________________________________________ 1Sr. Scientist, Ocean Engineering Division, National Institute of Oceanography, Goa. 403 004, India,
[email protected] 2PhD Scholar, Dept. of Applied Mechanics & Hydraulics, National Institute of Technology, Surathkal - 575025,
India, sanjupat007@ rediffmail.com 3Professor, Dept. of Applied Mechanics & Hydraulics, National Institute of Technology, Surathkal,- 575025,
India, [email protected]
Proceedings of International Conference in Ocean Engineering, ICOE 2009
IIT Madras, Chennai, India. 1-5 Feb. 2009

Proceedings of ICOE 2009 Title of the paper
2
configuration of the structure.
There is a great volume of published work dealing with floating breakwaters (Harris and Webber,
1968; Homma et al, 1964; Kennedy and Marsalek, 1968; Harms, 1979; Bishop, 1982; Leach,
McDougal and Solitt, 1985), but it is noticed that there is a lack of a simple mathematical model
for these structures for predicting breakwater characteristics on its performance and upon the
transmission coefficient. Number of studies have been carried out considering a floating
breakwater with a simple form and adopted some assumptions common in hydrodynamics which
shows less improvement. The stability and reliability analyses of coastal structures such as rubble
mound breakwaters using neural networks have been carried out (Mase et al, 1995; Kim and
Park, 2005). Similarly in this paper we have applied neural network to predict the wave
transmission of the floating breakwater.
WAVE TRANSMISSION OF FLOATING BREAKWATER
Floating breakwaters are based on the concept of either reflecting the wave energy or dissipating
wave energy by induced turbulent motion. In recent times, many types of floating breakwater
models have been tested and some have been constructed and their prototype performances have
been assessed. Floating breakwaters can be subdivided into four general categories: Box,
Pontoon, Mat and Tethered float. The prime factor in the construction of the floating breakwaters
is to make the width of the breakwater (in the direction of wave propagation) greater than one
half the wavelengths and preferably as wide as the incident wavelength; else, the breakwater rides
over the top of the wave without attenuating it. Also to be effective, the floating breakwater must
be moored in place with both leeward and windward ties; otherwise it would sag off and ride
over the incident wave. Pontoon and Box type of floating breakwaters belong to the first category
in which the wave attenuation is achieved by reflecting the wave energy. Mat and Tethered
belong to the second category in which wave energy dissipation is mainly due to drag from the
resultant float in motion.
The development of floating breakwaters by various investigations has been influenced by certain
important features; large masses, large moment of inertia, and the combinations of two or more
of the concept of large effective mass or moment of inertia. Most of the literature indicates that
the parameter “relative width” influences greatly the wave attenuation characteristics of the
breakwater.
Experimental Floating Breakwater
The details of the floating pipe breakwater used by the Department of Applied Mechanics, NITK
Surathkal, India are shown in Fig-1 (Deepak, 2006; Hegde et al, 2007; Jagadisha, 2007). The
breakwater comprises of the rigid PVC pipes. The pipes are placed parallel to each other with
certain spacing between them in each layer and the adjacent layers are oriented at right angles to
each other so as to form a interlacing. Hence, longitudinal pipes are placed along the direction of
propagation of waves. Transverse pipes are placed and tied perpendicular to longitudinal pipes.
The length of the longitudinal pipes defines the width of the breakwater. It is felt that with proper
number of layers, spacing of pipes and relative breakwater width, it is possible to achieve a

Proceedings of ICOE 2009 Title of the paper
3
considerable and effective attenuation of waves. Fig-1 shows a pictorial representation of model
in plan and section.
Fig-1 Floating breakwater model setup
The experimental wave transmission data on multilayer floating breakwater was generated using
wave flume at National Institute of Technology Karnataka, Surathkal, India (Deepak, 2006;
Jagadisha, 2007; Hegde et al, 2007). The wave transmission of floating breakwater was estimated
for 5 layer PVC pipes with S/D (spacing to diameter ratio) of 2, 3, 4 and 5; pipe diameter of 3.2
cm; incident wave height (Hi) of 3, 6, 9, 12, 15 and 18 cm; wave period of 1.2, 1.4, 1.6, 1.8, 2.0
and 2.2 s; water depth (d) of 50, 45 and 40 cm, relative breakwater width (W/L) from 0.40 to
2.65. These experimental data are divided into two sets for training and testing the network
models as shown in Table-1.
Table-1 Data used for training and testing the network models
S/D ratio Data for training Data for testing Total data
2 609 203 812
3 576 233 809
4 366 143 509
5 581 234 815
Combined total 2132 813 2945
NEURAL NETWORK
Artificial neural network (ANN) is an information-processing paradigm that is inspired by the
way of biological nervous system, such as brain process information. ANN is composed of large
number of highly connected processing element (neurons) working in unison to solve a specific

Proceedings of ICOE 2009 Title of the paper
4
problem. The network learns through examples, so it requires good examples to train properly
and further a trained network model can be used for prediction purpose.
In order to allow the network to learn both non-linear and linear relationships between input
nodes and output nodes, multiple-layer neural networks are often used. Among many neural
network architectures, the three layers feed forward error backpropagation neural network (BNN)
is the most commonly used representing the input nodes as first layer, hidden nodes as second
layer and output nodes as third layer.
The back-propagation is a supervised learning technique used for training the neural network. It
is most useful for feed forward networks. The back propagation needs to know the correct output
for any input parameters. The number of input nodes depends upon the complexity of the
problem and the parameters which influence the output parameters.
The input parameters that influence the wave transmission (Kt) of floating breakwater such as
spacing of pipes relative to pipe diameter (S/D), breakwater width relative to wave length (W/L),
incident wave relative to water depth (Hi/d), incident wave relative to wave length (Hi/L) are
considered. Based on above input parameters, two ANN models are constructed to predict the
transmission coefficient of floating breakwater as shown in Table-2.
Table-2 ANN models with input parameters
The main objective of BNN technique is to train the model such that the result outputs are nearer
to the desired values. Therefore, the error between network output and desired value is minimum.
Mathematically, the feed forward artificial neural network is expressed as
Zk(x) = kor
m
ij
kj byTW
)(* (1)
jY = jii
n
i
ji bxW
*1
(2)
Where x is input values from 1 to n , Wji are the weights between input layer and hidden layer
nodes and Wkj are the weights between hidden layer and output layer nodes. jib and kob are bias
values at hidden and output layer respectively. m is the number of hidden layer nodes and )(yTr
is transfer function. This transfer function allows a non-linear conversion of summed inputs.
A non-linear transfer function is applied between input nodes and hidden nodes. In the present
Model Input Parameters
ANN1 W/L, Hi/d, Hi/L
ANN2 S/D, W/L, Hi/d, Hi/L

Proceedings of ICOE 2009 Title of the paper
5
study Tansig is used as transfer function, which is expressed as
1
)2exp(1
2)(
yyTr (3)
y is the summation of input values with weights and biases. The transfer function improves the
network generalisation capabilities and speeds up the convergence of the learning process. The
bias values for both hidden layer and output layer get adjusted for each time of iterations. The
weights between hidden and output layers are calculated using updated Levenberg-Marquardt
algorithm.
The linear transfer function purelin is applied between hidden layer and output layer. And the
transfer function expressed as
Purelin (n) = n (4)
The overall objective of training algorithm is to reduce the global error, E is defined as,
P
p
K
k
2
kpkp od1 1
1
pE (5)
Where; p is the total number of training patterns, dkp is the desired value of the kth
output and
the pth
pattern, okp is the actual value of the kth
output and pth
pattern. Here, Levenberg-Marquardt
updated algorithm (Wilamoski et al, 2001) is used to train the network.
Kt CALCULATION BY ANN
The ANN structure is constructed for estimating wave transmission (Kt) of floating breakwater as
shown in Fig-2. After training the network model, weights and biases of the network are fixed.
These fixed weight and bias values are shown in Fig-2. The each input value gets multiplied with
the weight and adds with bias value. The total sum is the input at each hidden node and pass
through a transfer function as defined in Equation 3, and further the output from hidden node get
multiplied with the weight and adds with the bias value and total sum pass through purelin as
shown in Equation 4.
The wave transmission (Kt) is estimated using following formulations:
Transfer function Fi =
1
)2exp(1
2
Ni …i = 1 to 5 (6)
Where, Ni are values of hidden nodes and Fi are the transfer functions of hidden node i.

Proceedings of ICOE 2009 Title of the paper
6
Fig-2 The ANN2 structure with weights and biases for N-4-5-1.
For ANN2 model, the trained hidden nodes and its transfer functions are
N1 = S/D(0.3327) + W/L(0.7084) + Hi/d(-5.1591) + Hi/L(32.1431) – 1.2331
N2 = S/D(1.2989) + W/L(-0.510) + Hi/d(9.2627) + Hi/L(-70.7095) – 5.3324
N3 = S/D(0.0706) + W/L(-0.0095) + Hi/d(6.0589) + Hi/L(-39.7376) – 1.7253
N4 = S/D(-4.8623) + W/L(1.9678) + Hi/d(-6.7914) + Hi/L(59.9845) + 8.8343
N5 = S/D(0.1481) + W/L(1.0021) + Hi/d(21.503) + Hi/L(-31.9026) – 3.9707
F1 = (2 /(1+exp (-2xN1))) -1
F2 = (2 /(1+exp (-2xN2))) -1
F3 = (2 /(1+exp (-2xN3))) -1
F4 = (2 /(1+exp (-2xN4))) -1
F5 = (2 /(1+exp (-2xN5))) -1
N1 to N5 and F1 to F5 represent summation function and transfer function at each hidden node
respectively.

Proceedings of ICOE 2009 Title of the paper
7
The Kt is computed as:
Kt = F1 (-0.4035) + F2 (2.2573) + F3 (-1.330) + F4 (-0.090) + F5 (-0.075) - 0.3007 (7)
Equation 7 provides trained ANN2 model for estimating wave transmission (Kt) of floating
breakwaters.
The correlation coefficient is calculated to know the how best the network predicted Kt values are
matches with the measured Kt values. The straight line is drawn at an angle of 45o between the
two axes to fit the data points. A high correlation is obtained when all the points lies exactly on
this straight line.
The network predicted wave transmission (Kt) is calculated using Equation 7. At end of each
training process Correlation Coefficient (CC) is calculated between measured (desired) Kt and
predicted Kt using following equation
22 yx
xyCC (8)
Where, x = X-X/
X= network predicted Kt values
X/ = mean of X
y = Y-Y/
Y= measured Kt values.
Y/ = mean of Y.
RESULTS AND DISCUSSION
In neural network technique training of the network plays a very important role and it mainly
depends upon updated algorithms to be chosen to train the network.
The ANN modeling of wave transmission of floating breakwater is carried out for 5 layer pipes
with S/D (spacing to diameter ratio) of 2, 3, 4 and 5. The input parameters of ANN1 model are
W/L, Hi/d and Hi/L. An optimal S/D can be chosen from ANN1 modeling. To study over a range
of spacing of pipes (S/D) on Kt, an input parameter, S/D is added to form ANN2 model.
After training and testing of both network models, CCs are calculated between desired output and
network output using Equation 8.
In the present study, updated algorithms such as Levenberg-Marquardt algorithm (LM) is used to
train the two network models with 100 and 200 epochs (Wilamoski, et al, 2001). The trained and
tested ANN1 model’s correlation coefficients (CC) and mean square error (MSE) of Kt for
different S/D values are shown in Tables 3 to 6. This shows that the CC increases with S/D. The
trained and tested ANN2 model’s correlation coefficients of Kt are shown in Tables-7. The final
trained and tested results (CCs) of two network models are shown in Table-8 and Figures 3 to 6.

Proceedings of ICOE 2009 Title of the paper
8
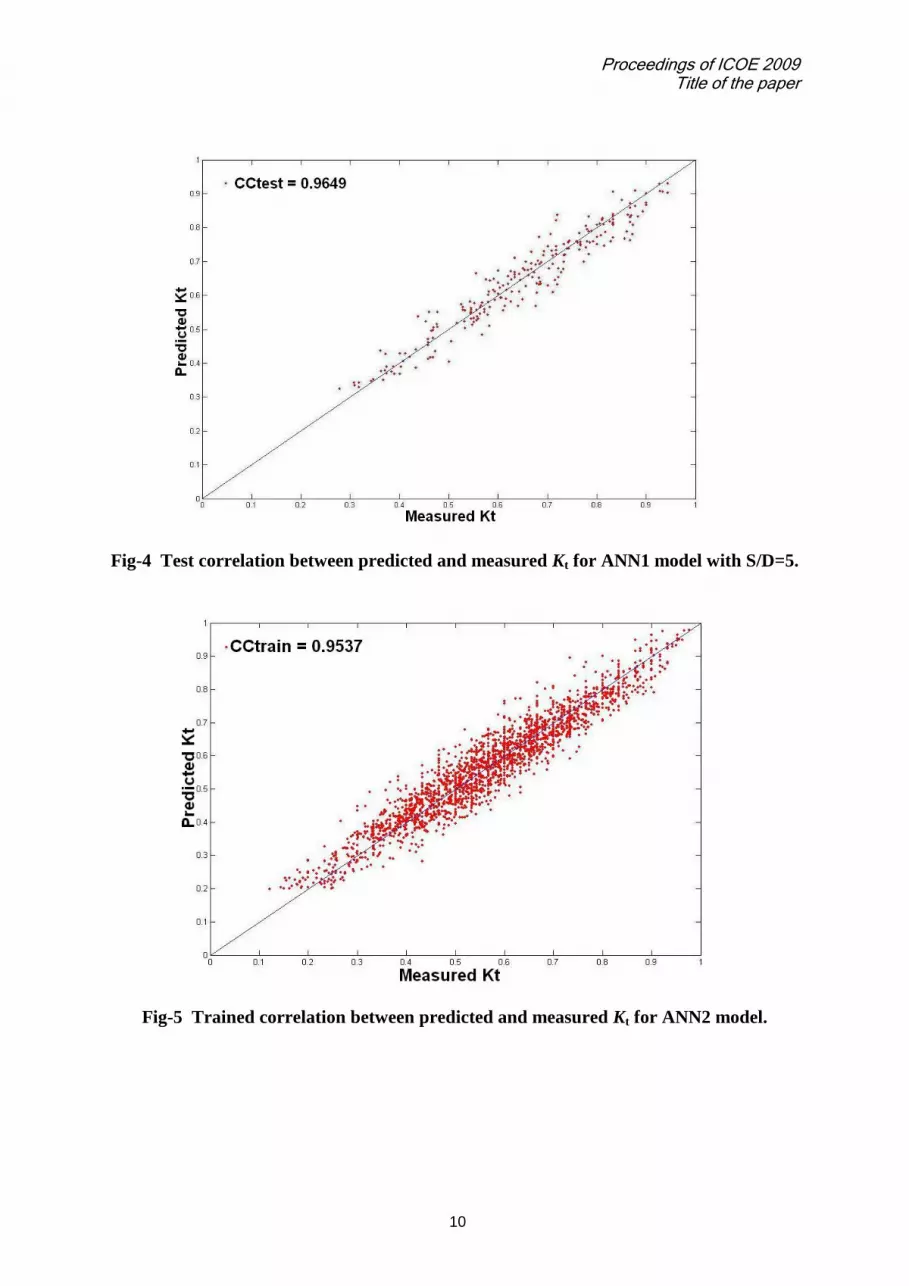
It is observed that the correlation coefficients obtained are above 0.90. A high correlation
coefficient is obtained at epoch equal to 200 with hidden nodes equal to 4 for ANN1 model
(CCtrain=0.9672, CCtest=0.9649) and hidden nodes equal to 5 for ANN2 model
(CCtrain=0.9537, CCtest=0.9488). Since all S/D values are considered in ANN2 model, CCs are
in general less than that for ANN1 model with spacing ratio (S/D) of 5. The highest CC is
obtained for ANN1 model (N-3-4-200) with spacing ratio of 5.
Table-3 Correlation coefficient of Kt for ANN1 model with S/D=2
Hidden Nodes CCtrain CCtest MSEtrain Epochs
2 0.9377 0.9312 0.00342 100
3 0.9449 0.9400 0.00303 100
4 0.9495 0.9426 0.00279 100
2 0.9376 0.9302 0.00342 200
3 0.9488 0.9430 0.00282 200
4 0.9552 0.9504 0.00248 200
Table-4 Correlation coefficient of Kt for ANN1 model with S/D=3
Hidden Nodes CCtrain CCtest MSEtrain Epochs
2 0.9310 0.9205 0.00230703 100
3 0.9382 0.9260 0.00207239 100
4 0.9419 0.9328 0.0019508 100
2 0.9263 0.9126 0.0024562 200
3 0.9469 0.9368 0.00178878 200
4 0.9506 0.9404 0.00166577 200
Table-5 Correlation coefficient of Kt for ANN1 model with S/D=4
Hidden Nodes CCtrain CCtest MSEtrain Epochs
2 0.9490 0.9447 0.00164663 100
3 0.9620 0.9562 0.00122984 100
4 0.9647 0.9563 0.00114397 100
2 0.9551 0.9534 0.00144801 200
3 0.9619 0.9569 0.00123356 200
4 0.9642 0.9601 0.0011579 200
Table-6 Correlation coefficient of Kt for ANN1 model with S/D=5
Hidden Nodes CCtrain CCtest MSEtrain Epochs
2 0.939 0.937 0.00286544 100
3 0.9508 0.9488 0.00232692 100
4 0.9654 0.9642 0.00164658 100
2 0.9401 0.9369 0.00281679 200
3 0.9586 0.9567 0.00196222 200
4 0.9672 0.9649 0.00156346 200

Proceedings of ICOE 2009 Title of the paper
9
Table-7 Correlation coefficient of Kt for ANN2 model
Hidden Nodes CCtrain CCtest MSEtrain Epochs
2 0.9102 0.9003 0.00444906 100
3 0.9353 0.9286 0.00325118 100
4 0.9467 0.9414 0.00269082 100
5 0.9508 0.9473 0.00248828 100
2 0.9294 0.9237 0.00353477 200
3 0.9372 0.9345 0.00315484 200
4 0.9453 0.9421 0.00276019 200
5 0.9537 0.9488 0.00234973 200
Table-8 Correlation Coefficients of Kt for two network models
Model
Network
(Input nodes - Hidden
nodes - Epochs)
CCtrain CCtest
ANN1 3-4-200 0.9672 0.9649
ANN2 4-5-200 0.9537 0.9488
Fig-3 Trained correlation between predicted and measured Kt for ANN1 model with
S/D=5.
Proceedings of ICOE 2009 Title of the paper
10
Fig-4 Test correlation between predicted and measured Kt for ANN1 model with S/D=5.
Fig-5 Trained correlation between predicted and measured Kt for ANN2 model.

Proceedings of ICOE 2009 Title of the paper
11
FIG-6 Test correlation between predicted and measured Kt for ANN2 model.
CONCLUSIONS
Based on the present study the following conclusions are drawn:
In neural network technique, selecting a proper network algorithm plays very important role. In
this study, the artificial neural network model with Levenberg-Marquardt updated algorithm is
used to predict the wave transmission of floating breakwater. The ANN models are trained upto
200 epochs. This study shows that the correlation coefficient of wave transmission coefficient
increases with pipe spacing ratio. The highest train and test CCs of Kt for ANN1 model with
S/D=5 are 0.9672 and 0.9649 respectively. This shows an improvement of predicted Kt for higher
pipe spacing ratio.
ACKNOWLEDGEMENTS
The authors are thankful to the Director, NIO, Goa for providing facilities to carry out this work.
The authors are grateful to the Head, Dept. of Applied Mechanics and Hydraulics, NITK,
Surathkal for providing the data related to laboratory investigations on horizontal interlaced
multi-layer moored floating pipe breakwater.
REFERENCES
Bishop, T C. 1982. Floating tire breakwater design comparison. J. Waterway, Port, Coastal and
Ocean Eng., ASCE, 108(3), 421-426

Proceedings of ICOE 2009 Title of the paper
12
Deepak, J C. 2006. Laboratory Investigations on Horizontal Interlaced Multi-layer Moored
Floating Pipe Breakwater. M.Tech thesis, Department of Applied Mechanics and Hydraulics,
N.I.T.K., Surathkal, Karnataka, India, July, 1-113.
Harms, V W. 1979. Design criteria for floating tire breakwater. J. Waterway., Port, Coastal and
Ocean Eng., ASCE, 106(2), 149-170.
Harris, A J, and Webber, N B 1968. A floating breakwater. Proc., 11th
Coastal Eng. Conf.,
London, England, 1049-1054.
Hegde, A V; Kamath, K and Magadum, A S. 2007. Performance Characteristics of Horizontal
Interlaced Multilayer Moored Floating Pipe Breakwater. J. Waterway, Port, Coastal and Ocean
Eng., ASCE, 133(4), 275-285.
Homma, M; Horikawa, K and Mochizuki, H. 1964. An experimental study of floating
breakwaters. International conference on Coastal Eng., Japan, Vol. 7, 85-94.
Jagadisha, Y S. 2007. Laboratory investigations on horizontal interlaced multi-layer moored
floating pipe breakwater model. M.Tech thesis, Dept. of Applied Mechanics and Hydraulics,
NITK Surathkal, Karnataka.
Kennedy, R J and Marsalek, J. 1968. Flexible porous floating breakwater. Proc., 11th
Coastal
Eng. Conf., London, England, 1095-1103.
Kim, D H and Park, W S. 2005. Neural network for design and reliability of analysis of rubble
mound breakwaters. Ocean Engineering- Elsevier Journal. 32, 1332-1349.
Leach, A P; McDougal, G W and Solitt, K C. 1985. Hinged floating breakwater. J. Waterway.,
Port, Coastal and Ocean Eng., ASCE, 111(5), 895-920
Mani, J S. 1991. Design of Y – frame Floating Breakwater. J. Waterways, Ports, Coastal and
Ocean Eng, ASCE, 117(2), 105 – 118.
Mase H, Masanobu S and Tetsuo S. 1995. Neural network for stability analysis of rubble mound
breakwater. J. Waterway, Port, Coastal and Ocean Eng, 121(6), 294-299.
McCartney, L B. 1985. Floating Breakwater Design. J. Waterway, Port, Coastal and Ocean
Eng, ASCE, 111(2), 304-318.
Murali, K and Mani, J S. 1997. Performance of Cage Floating Breakwater. J. Waterway, Port,
Coastal and Ocean Eng, ASCE, 123(4), 172-179.
Sannasiraj, S A; Sundar, V and Sundaravadivelu, R. 1998. Mooring forces and motion response
of pontoon-type floating breakwaters. Ocean Engineering- Elsevier Journal, 25(1), 27-48.
Sundar, V; Sundaravadivelu. R and Purushotham, S. 2003. Hydrodynamic characteristics of
moored floating pipe breakwater in random waves. Proc. Institution of Mechanical Engineers,
Journal of Engineering Maritime Environment, 217(M), 95-108.
Wilamoski, B M; Iplikci S; Kaynak O and Efe, O M. 2001. An algorithm for fast convergence in
training neural networks. IEEE on Neural Network, 778-1782.


